• FluTrackers.com Inc. does not provide medical advice. Information on this web site is collected from various internet resources, and the FluTrackers board of directors makes no warranty to the safety, efficacy, correctness or completeness of the information posted on this site by any author or poster. The information collated here is for instructional and/or discussion purposes only and is NOT intended to diagnose or treat any disease, illness, or other medical condition. Every individual reader or poster should seek advice from their personal physician/healthcare practitioner before considering or using any interventions that are discussed on this website. By continuing to access this website you agree to consult your personal physican before using any interventions posted on this website, and you agree to hold harmless FluTrackers.com Inc., the board of directors, the members, and all authors and posters for any effects from use of any medication, supplement, vitamin or other substance, device, intervention, etc. mentioned in posts on this website, or other internet venues referenced in posts on this website.
  • We are not asking for any donations. Do not donate to any entity who says they are raising funds for us.

Weekly MMWR: Week 30 (2009) - Week 39 (2010)

Re: Weekly MMWR - Updated through Week 50

Re: Weekly MMWR - Updated through Week 50

update

http://wonder.cdc.gov/mmwr/mmwr_rep...r_year=2009&mmwr_location=TOTAL&mmwr_table=4A


Code:
35  9,880  6,484  2,289  651  234  217  519  
36  9,099  5,874  2,221  585  226  191  541  
37 11,250  7,275  2,749  718  270  236  683  
38 10,762  6,996  2,585  677  259  238  661  
39  9,589  6,309  2,250  588  226  213  620  
40 10,612  6,890  2,585  672  258  207  715  
41  9,964  6,643  2,289  604  232  194  684  
42 10,903  7,110  2,610  712  237  228  775  
43 11,136  7,330  2,546  782  248  224  828  
44 10,564  7,008  2,500  615  239  201  821  
45 10,366  6,858  2,430  653  224  192  773  
46 10,929  7,200  2,626  652  253  196  895  
47  8,351  5,505  2,056  470  171  148  600  
48 11,866  7,992  2,721  684  249  215  923  
49 11,738  7,655  2,897  707  249  228  886  
50 11,052  7,422  2,537  672  224  193  796    7.20
51  8,544  5,740  1,983  477  180  163  658    7.70
52  9,131  6,342  1,983  502  171  133  673   7.37

12667 8626 2849 687 267 211 919   7.26


http://wonder.cdc.gov/mmwr/mmwr_rep...r_year=2010&mmwr_location=TOTAL&mmwr_table=4A


http://wonder.cdc.gov/mmwr/mmwr_rep...r_year=2010&mmwr_location=TOTAL&mmwr_table=4A
 
Re: Weekly MMWR - Updated through Week 50

Re: Weekly MMWR - Updated through Week 50

http://wonder.cdc.gov/mmwr/mmwr_rep...r_year=2010&mmwr_location=TOTAL&mmwr_table=4A

Code:
Week All Causes, by Age (Years) Pneumonia and
Influenza 
All Ages** >=65 45-64 25-44 1-24 Less than 1 
---------------------------------------------
01 12667  8626  2849  687  267  211  919    7.26
02 12170  8344  2787  591  233  214  967    7.95
03 11158  7673  2453  611  194  225  920    8.25  
04 11853  8141  2609  653  222  227  959    8.09

P+I deaths are increasing. It can't be flu ?!?
 
Re: Weekly MMWR - Updated through Week 50

Re: Weekly MMWR - Updated through Week 50

All age groups are increasing. Perhaps it's a combination of Pandemic H1N1 and the beginning of seasonal flu.
 
Re: Weekly MMWR - Updated through Week 50

Re: Weekly MMWR - Updated through Week 50

no seasonal flu around
 
Re: Weekly MMWR - Updated through Week 50

Re: Weekly MMWR - Updated through Week 50

When comparing age-group deaths/total deaths, the two age group percentages that are going up are 45-64 and 65 and over. Then, when comparing those same percentages to last season, age-group 45-64 is at a similar percentage for weeks 49-2. The only age-group that is appearing with a higher percentage than last season is 65 and over. Perhaps they should be receiving H1N1 vax and should there be a concern in long-term health facilities? Additionally, they may have been exposed during holiday visits and are now presenting with P&I. Would nursing home deaths be automatically checked for H1N1?
 
Re: Weekly MMWR - Updated through Week 2

Re: Weekly MMWR - Updated through Week 2

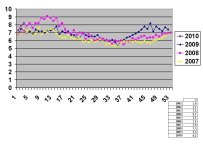
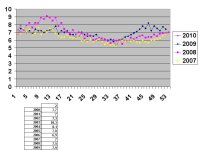
P&I 4 yr.JPG
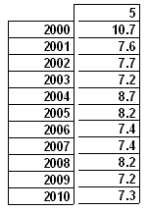
P&I comparison
 
Re: Weekly MMWR - Updated through Week 4

Re: Weekly MMWR - Updated through Week 4

http://wonder.cdc.gov/mmwr/mmwrmort.asp

New York:http://wonder.cdc.gov/mmwr/mmwr_rep...wr_location=New+York+City,+N.Y.&mmwr_table=4A
Boston:http://wonder.cdc.gov/mmwr/mmwr_rep...010&mmwr_location=Boston,+Mass.&mmwr_table=4A
Atlanta: http://wonder.cdc.gov/mmwr/mmwr_rep...2010&mmwr_location=Atlanta,+Ga.&mmwr_table=4A

USA:http://wonder.cdc.gov/mmwr/mmwr_rep...r_year=2010&mmwr_location=TOTAL&mmwr_table=4A
New England: http://wonder.cdc.gov/mmwr/mmwr_rep...=2010&mmwr_location=New+England&mmwr_table=4A
Mid-Atlantic:http://wonder.cdc.gov/mmwr/mmwr_rep...010&mmwr_location=MID.+ATLANTIC&mmwr_table=4A
S.Atlantic: http://wonder.cdc.gov/mmwr/mmwr_rep...=2010&mmwr_location=S.+ATLANTIC&mmwr_table=4A
W.N.Central: http://wonder.cdc.gov/mmwr/mmwr_rep...2010&mmwr_location=W.N.+CENTRAL&mmwr_table=4A
W.S.Central: http://wonder.cdc.gov/mmwr/mmwr_rep...2010&mmwr_location=W.S.+CENTRAL&mmwr_table=4A
E.N.Central: http://wonder.cdc.gov/mmwr/mmwr_rep...2010&mmwr_location=E.N.+CENTRAL&mmwr_table=4A
E.S.Central: http://wonder.cdc.gov/mmwr/mmwr_rep...2010&mmwr_location=E.S.+CENTRAL&mmwr_table=4A
Mountain: http://wonder.cdc.gov/mmwr/mmwr_rep...ear=2010&mmwr_location=Mountain&mmwr_table=4A
Pacific: http://wonder.cdc.gov/mmwr/mmwr_rep...year=2010&mmwr_location=Pacific&mmwr_table=4A


Code:
35  9,880  6,484  2,289  651  234  217  519     5.25
36  9,099  5,874  2,221  585  226  191  541     5.95
37 11,250  7,275  2,749  718  270  236  683     6.07
38 10,762  6,996  2,585  677  259  238  661     6.14
39  9,589  6,309  2,250  588  226  213  620     6.47
40 10,612  6,890  2,585  672  258  207  715     6.74
41  9,964  6,643  2,289  604  232  194  684     6.86
42 10,903  7,110  2,610  712  237  228  775     7.11
43 11,136  7,330  2,546  782  248  224  828     7.44
44 10,564  7,008  2,500  615  239  201  821     7.77
45 10,366  6,858  2,430  653  224  192  773     7.46
46 10,929  7,200  2,626  652  253  196  895     8.19
47  8,351  5,505  2,056  470  171  148  600     7.18
48 11,866  7,992  2,721  684  249  215  923     7.78
49 11,738  7,655  2,897  707  249  228  886     7.55
50 11,052  7,422  2,537  672  224  193  796     7.20
51  8,544  5,740  1,983  477  180  163  658     7.70
52  9,131  6,342  1,983  502  171  133  673     7.37
01 12,667  8,626  2,849  687  267  211  919     7.26
02 12,170  8,344  2,787  591  233  214  967     7.95
03 11,158  7,673  2,453  611  194  225  920     8.25
04 11,853  8,141  2,609  653  222  227  959     8.09
05 11,583  7,850  2,638  664  230  198  844     7.29
06 11,154  7,462  2,529  611  215  202  863     7.74
07 11,219  7,572  2,644  596  205  200  825     7.35
08 11,642  7,893  2,685  608  231  221  910     7.82


Code:
P+I-ratio for the 9 regions:

week=1    2    3    4    5    6    7    8
--------------------------------------------
1: 1111  915 1074 1267 1023 1215  945 1024
2:  619  664  591  539  480  536  580  574
3:  492  703  683  807  649  607  622  692
4:  832  829 1214  884  717  579  527  663
5:  656  761  731  742  709  856  638  829
6:  674  721  705  685  700  806  662  727
7:  963  909  858  916  880  959 1003  930
8:  597  666  835  825  673  708  808  684
9:  914 1057 1097 1060  965  945  947 1024

1028,574,692,663,829,727,930,684,1024
 
Re: Weekly MMWR - Updated through Week 4

Re: Weekly MMWR - Updated through Week 4

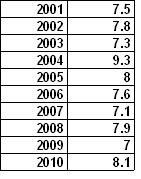
week 4.JPG

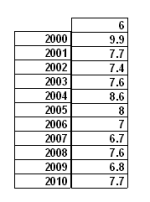
%P&I comparison for week 4 2001-2010.
 
Re: Weekly MMWR - Updated through Week 4

Re: Weekly MMWR - Updated through Week 4

Pittsburg,Wilmington,Colorado Springs were removed after week 41/2009

OK, I updated my tables with 2009 data.
Eliminated the U's with estimated numbers.
It doesn't look so "smooth", so there could still be errors.

http://magictour.free.fr/panflu/MMWR.GZ
 

Attachments

  • mmwrg1.gif
    mmwrg1.gif
    14.2 KB · Views: 0
Re: Weekly MMWR - Updated through Week 4

Re: Weekly MMWR - Updated through Week 4

attachment.php


attachment.php


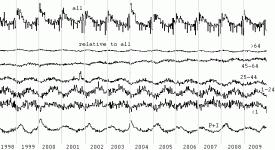
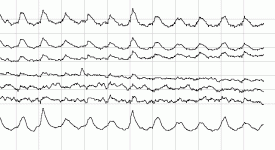
deaths of people aged 25-44 is contantly going down in USA over the years
at the cost of those aged 45-64, and P+I is not the cause
 

Attachments

  • mmwrg3.gif
    mmwrg3.gif
    11.1 KB · Views: 0
Re: Weekly MMWR - Week 30 2009 - Updated through Week 5 2010

Re: Weekly MMWR - Week 30 2009 - Updated through Week 5 2010

P&I week5 comparison.
Week 5 comp..PNG
 
Back
Top