• FluTrackers.com Inc. does not provide medical advice. Information on this web site is collected from various internet resources, and the FluTrackers board of directors makes no warranty to the safety, efficacy, correctness or completeness of the information posted on this site by any author or poster. The information collated here is for instructional and/or discussion purposes only and is NOT intended to diagnose or treat any disease, illness, or other medical condition. Every individual reader or poster should seek advice from their personal physician/healthcare practitioner before considering or using any interventions that are discussed on this website. By continuing to access this website you agree to consult your personal physican before using any interventions posted on this website, and you agree to hold harmless FluTrackers.com Inc., the board of directors, the members, and all authors and posters for any effects from use of any medication, supplement, vitamin or other substance, device, intervention, etc. mentioned in posts on this website, or other internet venues referenced in posts on this website.
  • We are not asking for any donations. Do not donate to any entity who says they are raising funds for us.

Weekly MMWR: Week 30 (2009) - Week 39 (2010)

Re: Weekly MMWR - Updated through Week 39

Re: Weekly MMWR - Updated through Week 39

If those are deaths from all causes, then 2009 is less than many previous years and does not stand out. For P&I deaths, it's in the middle of the range, but still does not stand out. However, the real indicator of this pandemic's impact for me is the number of pediatric deaths. In the U.S., for the 2008-09 season there were on the order of 170 pediatric deaths, over half of which occurred after the flu season traditionally ends. I would imagine that if we compared pediatric deaths due to influenza for Weeks 33-41, we'd see a striking increase this year compared with previous years. Based on the numbers we've been tracking, it's probably at least 10x higher than the average.
 
Re: Weekly MMWR - Updated through Week 39

Re: Weekly MMWR - Updated through Week 39

what do you mean with pediatric deaths ?

only 1924 were dying at age <1year , clearly below the average
(all causes)
 
Re: Weekly MMWR - Updated through Week 39

Re: Weekly MMWR - Updated through Week 39

what do you mean with pediatric deaths ?

only 1924 were dying at age <1year , clearly below the average
(all causes)
Pediatric deaths (children <18 yrs) by influenza is a nationally reportable death. One of the tables in the MMWR lists the number to date (by calendar year) and lists the number from each state from the reporting week.
 
Re: Weekly MMWR - Updated through Week 39

Re: Weekly MMWR - Updated through Week 39

maybe more died from influenza than in other years, I don't know.
But if, then it saved the lifes of more others !

Coincidence ?
 
Re: Weekly MMWR - Updated through Week 39

Re: Weekly MMWR - Updated through Week 39

Week 41 comparison with previous years;

Age---<1 --- 1-24---25-44---45-64----65+----Total-----P&I
2009:194----232----604-----2289----6643-----9964----684
%:--1.95%--2.33%-6.06%---23.0%---66.7%------------6.86%

2008:257----257----737-----2539----7362-----11158---680
%:--2.30%--2.30%-6.61%---22.8%---66.0%------------6.09%

2007:203----257----735-----2309----6801-----10307---614
%:--1.97%--2.49%-7.13%---22.4%---66.0%------------5.96%

Just like last week, P&I is marginally higher in number, and significantly higher as a percentage of overall deaths. Again a thousand less deaths in total than last year.
 
Re: Weekly MMWR - Updated through Week 41

Re: Weekly MMWR - Updated through Week 41

Chicago has not reported on the 122 cities list since week 32. Lacking the deaths reportable from Chicago, the totals are 4 or 5% lower than they would be. This makes trying to find trends in year-to-year data more problematic.
 
Re: Weekly MMWR - Updated through Week 41

Re: Weekly MMWR - Updated through Week 41

Given the lag time, I expect that we'll see 2009 start to diverge from past years.

The total number of confirmed H1N1 deaths in the U.S. has increased by almost 120 since last Friday. This is based on the count we are keeping independent of the CDC numbers and does not include non-influenza respiratory deaths. I'll post the numbers tomorrow, but this is probably more than double any prior weeks.
 
Re: Weekly MMWR - Updated through Week 41

Re: Weekly MMWR - Updated through Week 41

Chicago has not reported on the 122 cities list since week 32. Lacking the deaths reportable from Chicago, the totals are 4 or 5% lower than they would be. This makes trying to find trends in year-to-year data more problematic.

Cities not reporting Week 41;

2009: Hartford CT, New Haven CT, Jersey City NJ, Chicago IL, El Paso TX, Fort Worth TX, New Orleans LA, Long Beach CA.

2008: New Haven CT, Jersey City NJ, Baton Rouge LA, New orleans LA, Albuquerque, NM

2007: Los Angeles CA, Glendale CA, New Orleans LA.
 
Re: Weekly MMWR - Updated through Week 41

Re: Weekly MMWR - Updated through Week 41

yes, there is a delay for deaths.
Also some cities are not reporting - I'll make a new table
to account for that...
You can of course compare the 122-cities with the national total,
the data should be available - but some years delayed.
I haven't yet done this, but it should be interesting.

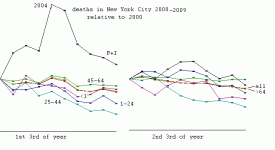
But we had the full wave in New York already earlier -
there was no effect seen in the deaths-statistics, see below.


Code:
deaths in New York City  weeks 1-16 and 17-32
year      >65y      45-64y      25-44y    1-25y    0-1y      P+I
-------------------------------------------------------------------
1996: 14227 12538 ,4331 3927 ,2629 2204 ,376 387 ,355 299 , 959 632
1997: 14491 12552 ,4038 3675 ,1869 1689 ,351 348 ,313 276 ,1020 699
1998: 14031 12118 ,3886 3572 ,1537 1418 ,281 309 ,282 243 , 954 658
1999: 15146 12343 ,4130 3676 ,1402 1441 ,315 357 ,289 261 , 395 388
2000: 14491 12043 ,4094 3571 ,1483 1317 ,340 284 ,269 250 , 676 645
2001: 13636 12384 ,3994 3699 ,1285 1300 ,298 310 ,221 225 , 884 701
2002: 13838 11945 ,4089 3649 ,1419 1344 ,297 308 ,280 204 , 941 646
2003: 13692 11687 ,3912 3648 ,1192 1190 ,309 289 ,253 231 , 901 720
2004: 14787 11494 ,4266 3550 ,1270 1059 ,321 314 ,247 248 ,1270 775
2005: 14352 11398 ,4159 3631 ,1143  990 ,292 309 ,241 239 ,1220 777
2006: 12700 11518 ,3737 3557 ,1045  965 ,252 294 ,213 245 , 950 708
2007: 12406 11124 ,3824 3482 , 921  986 ,245 260 ,220 192 , 872 647
2008: 12884 10957 ,3806 3550 , 947  956 ,273 263 ,242 197 , 847 673
2009: 12397 10674 ,3773 3546 , 872  888 ,242 239 ,237 192 , 792 600
---------------------------------------------------------------------
mean: 13791 11769 ,4002 3623 ,1358 1267 ,299 305 ,261 235 , 905 662


deaths in USA weeks 1-16 and 17-32
year:     >65y     ,   45-64y  ,  25-44y   ,  1-25y  ,  0-1y   ,   P+I
---------------------------------------------------------------------------
1996: 144949 127931,39817 37190,19178 17941,5278 5327,4482 4472,15008 11161    
1997: 147306 126094,38614 36012,16184 15174,4993 5171,4335 4065,16296 11268    
1998: 151052 128947,39603 37112,15116 14930,4843 5069,4454 4248,17134 11225    
1999: 154896 126014,40402 36741,14889 14159,4823 4750,4226 4079,17128 10927    
2000: 154656 129074,42116 37738,15183 14540,4804 4964,4433 4149,19934 12725    
2001: 147559 131109,41507 38605,14671 14492,4708 5139,4158 4070,16463 12868    
2002: 145151 125257,41529 39081,14334 14329,4918 5067,4237 4126,16901 12132    
2003: 139910 122303,41780 39136,14102 13614,5281 5019,4372 4003,15547 11969    
2004: 151276 120159,45366 39664,14105 12729,4851 4788,4301 3928,18120 11450    
2005: 143124 120179,43803 40700,12925 12572,4429 4875,4005 4039,17289 11593    
2006: 135635 119621,43768 41687,12821 12530,4559 4883,4100 3983,14870 11098    
2007: 135825 118603,44993 41182,12578 12690,4572 4803,4267 4171,14405 11094    
2008: 139225 117484,45294 41812,12004 11976,4378 4538,4341 4047,16635 11798    
2009: 134837 115775,45873 42351,12202 11552,4272 4371,4141 3876,14476 11539    
---------------------------------------------------------------------------     
mean: 144671 123467,42461 39215,14306 13802,4764 4911,4275 4089,16443 11631


calculated excess deaths in New York City as compared to the national average
in the 2nd third of 2009 relative to the first third in the 6 groups are:
-30,+63,+62,-09,-30,-31

or as compared to the NY-average:
+95,+130,+74,-8,-21,+21

so the effect is negative, but not big. Fewer people than normal
died from P+I, fewer young people than normal died while more people
aged 25-64 died.


Code:
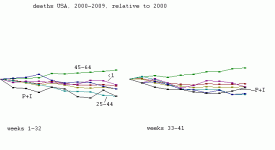
deaths in 122 US-cities  weeks 1-32 and 33-41 (adjusted for nonreports)
year      >64     ,   45-64   ,   25-44  ,   1-24   ,  0-1    ,  P+I
-------------------------------------------------------------------------
1996: 272880 68081,77007 20053,37119 9404,10605 2918,8954 2320,26169 5721      
1997: 273400 69367,74626 20111,31358 8755,10164 2950,8400 2379,27564 5688      
1998: 279999 69090,76715 19997,30046 8179, 9912 2711,8702 2407,28359 6076       
1999: 280910 68590,77143 20313,29048 7936, 9573 2656,8305 2304,28055 5944       
2000: 283730 70503,79854 20789,29723 7955, 9768 2964,8582 2349,32659 6738       
2001: 278668 70431,80112 21284,29163 8179, 9847 2825,8228 2248,29331 6429       
2002: 270408 67293,80610 21657,28663 7935, 9985 2873,8363 2358,29033 6078       
2003: 262213 65312,80916 21252,27716 7507,10300 2768,8375 2248,27516 5925      
2004: 271435 64856,85030 21695,26834 6994, 9639 2625,8229 2099,29570 5941       
2005: 263303 63380,84503 21923,25497 6970, 9304 2591,8044 2168,28882 5729       
2006: 255256 64277,85455 22539,25351 6985, 9442 2485,8083 2297,25968 5615       
2007: 254428 63692,86175 22584,25268 6961, 9375 2579,8438 2289,25499 5636       
2008: 256709 63826,87106 23292,23980 6506, 8916 2431,8388 2243,28433 5794       
2009: 250612 64258,88224 23516,23754 6512, 8643 2451,8017 2139,26015 6067       
-------------------------------------------------------------------------
mean: 268139 66639,81676 21500,28108 7627, 9676 2701,8364 2274,28075 5955

excess deaths in the 7 groups: +1975,+292,+66,+38,-41,+549


so, just comparing with the first 32 weeks in 2009,
during the 2nd wave 2009 in USA we have :

549 more deaths from pneumonia+influenza than expected
3 fewer deaths in the young (<25y) than expected
2333 more adult(>24y) deaths than expected

but it seems that this is mainly due to fewer deaths in the
first 32 weeks in 2009 than normal
 

Attachments

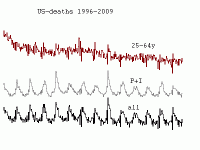
  • us14.gif
    us14.gif
    5.8 KB · Views: 0
  • mmwrny2.gif
    mmwrny2.gif
    5.9 KB · Views: 0
  • mmwrsum3.gif
    mmwrsum3.gif
    4.2 KB · Views: 0
Re: Weekly MMWR - Updated through Week 42

Re: Weekly MMWR - Updated through Week 42

<table class="data-table"><tbody><tr><td scope="row" class="table-1-end-table-data">Influenza-associated pediatric mortality§,¶¶
</td> <td class="table-1-end-table-data" align="right"> 22
</td> <td class="table-1-end-table-data" align="right">
</td><td class="table-1-end-table-data" align="right">
</td><td class="table-1-end-table-data">
</td></tr></tbody></table>


more...


http://www.cdc.gov/mmwr/preview/mmwrhtml/mm5842md.htm
 
Re: Weekly MMWR - Updated through Week 42

Re: Weekly MMWR - Updated through Week 42

> Updated weekly from reports to the Influenza Division, National Center
> for Immunization and Respiratory Diseases. Seventy four influenza-
> associated pediatric deaths occurring during the 2009--10 influenza
> season beginning August 30, 2009 have been reported. One hundred
> and seventeen influenza-associated pediatric death occurring during
> the 2008-09 influenza season have been reported.

when they write out the numbers with letters, then they are trying
to hide something... (why else ?)
or they are being paid by the number of words
 
Re: Weekly MMWR - Updated through Week 42

Re: Weekly MMWR - Updated through Week 42

deaths in 5 pre-(flu-)peak weeks in
2009: 10366,6790,2524,522,216,691 - 655,243,050,021,667
2003: 11709,7950,2432,765,234,818 - 679,208,065,020,699

so it's the 45-64y old people who are dying in 2009 and not in 2003


Code:
2009:
33  9666 6336 2280 633 225 190 588 
34 10489 6780 2532 684 245 238 607 
35  9880 6484 2289 651 234 217 519 
36  9099 5874 2221 585 226 191 541 
37 11250 7275 2749 718 270 236 683 
38 10762 6996 2585 677 259 238 661 
39  9589 6309 2550 588 226 213 620 
40 10612 6890 2585 672 258 207 715 
41  9964 6643 2289 604 232 194 684 
42 10903 7110 2610 712 237 228 775 
week 38-42: 10366,6790,2524,522,216,691

2003/4: (last season when it also started early)
45  9279  6423  1859  608  218  170   573  
46 10521  6971  2193  712  225  260   647  
47 12031  8124  2518  788  265  231   773  
48  9720  6575  1970  686  252  192   631  
49 12731  8490  2670  890  287  275   886   * first peak
50 12874  8772  2740  805  293  255   931   * first peak
51 11191  7787  2260  658  263  216   870  
52  9245  6479  1825  592  209  135   832  
53  9825  6877  1969  611  199  157   920  
01 14590 10204  2818  931  344  283  1482 ... Christmas-holidays ?  
02 14419 10283  2778  824  265  257  1485  
03 13367  9371  2704  792  278  213  1291  
04 13535  9412  2765  802  299  255  1252  
05 13769  9475  2822  883  306  280  1194  
06 13831  9509  2857  862  310  276  1198  
07 13481  9313  2735  858  305  262  1075  
08 13807  9524  2816  897  272  266  1063  
09 13165  9004  2741  841  289  285   947  
10 13701  9343  2853  905  301  284  1010  
week 47-51:  11709,7950,2432,765,234,818
 
Re: Weekly MMWR - Updated through Week 42

Re: Weekly MMWR - Updated through Week 42

deaths are up a bit (i.e. in the West)
but (still) less than in a seasonal wave


Code:
34 10,489  6,780  2,532  684  245  238  607  
35  9,880  6,484  2,289  651  234  217  519  
36  9,099  5,874  2,221  585  226  191  541  
37 11,250  7,275  2,749  718  270  236  683  
38 10,762  6,996  2,585  677  259  238  661  
39  9,589  6,309  2,250  588  226  213  620  
40 10,612  6,890  2,585  672  258  207  715  
41  9,964  6,643  2,289  604  232  194  684  
42 10,903  7,110  2,610  712  237  228  775  
43 11,136  7,330  2,546  782  248  224  828  
44 10,564  7,008  2,500  615  239  201  821  
45 10,366  6,858  2,430  653  224  192  773  
46 10,929  7,200  2,626  652  253  196  895  
47  8,351  5,505  2,056  470  171  148  600
 
Re: Weekly MMWR - Updated through Week 42

Re: Weekly MMWR - Updated through Week 42

gs, lots of cities did not report including Chicago, Fort Worth, Long Beach. I'm away from home right now, but I bet you that those missing cities would increase the overall mortality by over a thousand.
 
Re: Weekly MMWR - Updated through Week 46

Re: Weekly MMWR - Updated through Week 46

Chicago isn't reporting since week 32, ~350 total deaths per week
Fort Worth isn't reporting since week 5 , ~150 total deaths per week
Long Beach isn't reporting since week 46, ~70 total deaths per week

Springfield,MA isn't reporting since week 46, ~40 total deaths per week
Baton Rouge,LA isn't reporting since week 42, ~50 total deaths per week
Houston,TX isn't reporting since week 46, ~400 total deaths per week
New Orleans,LA isn't reporting since week 34,2005, ~50 total deaths per week
Boise,ID isn't reporting since week 46,~60 deaths per week
Portland,OR isn't reporting since week 46,~120 deaths per week

~1300 deaths for USA in total


same week last year:
New Haven,CT : ~40
New Orleans,LA : ~50

more than 10% of deaths are missing in the USA 122-cities statistics
maybe they are filed in later

12200 deaths per week would be ~1400 more than last year per week

or ~6000 excess deaths from all causes for USA in week 46,2009
~1300 of these due to P+I

assuming that was a peak-week and ~15% of the total wave, that's an estimated
8700 deaths for the wave.
But numbers in the previous weeks were lower
 
Re: Weekly MMWR - Updated through Week 46

Re: Weekly MMWR - Updated through Week 46

135543 reported deaths for week 34-46 , 9122 of which are due to P+I
139854 deaths reported for the same period in 2008, 8560 of which were due to P+I

I calculate ~826 excess deaths from P+I for this period for the 122 cities
or ~3500 estimated excess deaths for USA from P+I for this wave so far
or ~7000 for the total wave, that's ~23 deaths per M population,
almost 3 times the reported 8 per M in Australia (direct deaths)

So I assume that also in Australia less than half of ****** deaths
from P+I were recognized and reported.

This is for P+I deaths only, but there is reason to assume that deaths
attributed to other causes but initiated by P+I are much less than in
other seasons (given as ~40000) due to the age-structure.

USA official deaths from ****** are at 2300, up from 600 in week 34,
so official deaths for this wave are ~3400 or 11 per M population

(assuming that #deaths peak this week and thus we have seen
~half of deaths for this wave so far)
 
Back
Top