• FluTrackers.com Inc. does not provide medical advice. Information on this web site is collected from various internet resources, and the FluTrackers board of directors makes no warranty to the safety, efficacy, correctness or completeness of the information posted on this site by any author or poster. The information collated here is for instructional and/or discussion purposes only and is NOT intended to diagnose or treat any disease, illness, or other medical condition. Every individual reader or poster should seek advice from their personal physician/healthcare practitioner before considering or using any interventions that are discussed on this website. By continuing to access this website you agree to consult your personal physican before using any interventions posted on this website, and you agree to hold harmless FluTrackers.com Inc., the board of directors, the members, and all authors and posters for any effects from use of any medication, supplement, vitamin or other substance, device, intervention, etc. mentioned in posts on this website, or other internet venues referenced in posts on this website.
  • We are not asking for any donations. Do not donate to any entity who says they are raising funds for us.

Weekly MMWR: Week 30 (2009) - Week 39 (2010)

Re: Weekly MMWR - Updated through Week 46

Re: Weekly MMWR - Updated through Week 46

they should publish weekly, how much % (population)
of the cities are reporting.

Or someone else should publish those numbers weekly

... probably does, considering how big the internet is
and how important this is.


So, where is it ?
 
Re: Weekly MMWR - Updated through Week 46

Re: Weekly MMWR - Updated through Week 46

Cities not reporting or only partially for weeks 34-46

34,11
Erie
Pittsburg
Scranton
Syracuse
Chicago
Detroit
Peoria
Des Moines
Baton Rouge
Ft.Worth
New Orleans
35,11
Erie
Newark
Scranton
Chicago
Detroit
Peoria
Omaha
Baton Rouge
Corpus Christi
Ft.Worth
New Orleans
36,9
Erie *
Pittsburg *
Scranton *
Chicago
Corpus Christi
Ft.Worth
Little Rock
New Orleans
Fresno
37,4
Chicago
Ft.Worth
New Orleans
Long Beach
38,7
Springfield
Paterson
Chicago
Ft.Worth
New Orleans
Fresno
Honolulu
39,6
Chicago
Detroit
Corpus Christi
Ft.Worth
New Orleans
San Antonio
40,5
New Haven
Chicago
Ft.Worth
New Orleans
Albuquerque
41,8
Hartford
New Haven
Jersey City
Chicago
El Paso
Ft.Worth
New Orleans
Long Beach
42,6
Chicago
Atlanta
Baton Rouge
Ft.Worth
Corpus Christi
New Orleans
43,4
Chicago
Baton Rouge
Ft.Worth
New Orleans
44,6
Chicago
Baton Rouge
Ft.Worth
New Orleans
Phoenix
Pasadena
45,7
Hartford
Chicago
Cincinnati
Fort Worth
New Orleans
Fresno
Pasadena
46,8
Waterbury
Chicago
Baton Rouge
Ft.Worth
New Orleans
Boise
Long Beach
Portland


they should report estimates instead of non-reporting or partial reporting
and mark them as "e" . If the city gives no estimate, then CDC should

they should be able to correct numbers and estimates later for a second
list of tables


shall we publish our estimates in a fixed weekly wiki-like thread ?
who will help with updates ?
 
Re: Weekly MMWR - Updated through Week 46

Re: Weekly MMWR - Updated through Week 46

let's solve the problem by publishing adjusted, estimated numbers !

(CDC should do it, but well...)


you can very well filter out those cities, the adjusted chart
should then be very similar to the real one, I think.

It is needed for a better estimate of the total number of deaths
due to this wave of ******

current estimate : ~10000
which is less than for seasonal. But the average age of deaths is lower,
so the number of lost years could be similar.
And then we have awfully many diseases, pain, absenteism.

Lets make a total estimate of the burdon and what we can expect the next
years,decades if this replaces oldflu
(I read seasonal flu costs ~$12B per year in USA)
 
Re: Weekly MMWR - Updated through Week 46

Re: Weekly MMWR - Updated through Week 46

RoRo may have figured this already and writes:

"The problem I have with the MMWR, is the inconsistancy of cities reporting. Between week 38 and week 43 in 2008, Chicago reported 1,916 fatalities. This year - none. If you add 1,916 to this years total we have 64,863 which would put it 5th on the list and still with more cities not reporting than 2008, 2006 and 2004. Factoring in each missing city is more time than I have right now, but I did week 44 2009 and 2008 for comparison.

Assumption: the 122 cities represent about 80 million people.

=======Total=====65+===45-64===25-44===1-24===<1===P&I
2008:==11,186===7360====2602====700=====254===270= =743
2009:==10,564===7008====2500====615=====239===201= =821

So on the face of it, P&I is up, but total deaths are down right?
Not if you correct for the missing cities:
2009: Des Moines, Chicago, Baton Rouge, Fort Worth, New Orleans, Phoenix and Pasadena represent 6 million people.
2008: New Haven, New Orleans represent around 0.6 million people.
Correction factors: 2009: *80/74
2008: *80/79.4

To get a comparison of apples with apples:
=======Total====65+===45-64===25-44===1-24===<1===P&I
2008(c)=11,270==7416===2622====705=====256===272== 749
2009(c)=11,420==7576===2703====665=====258===217== 888

P&I is up even more, and the total fatalities are also higher.
Any math errors are my own!"

http://www.flutrackers.com/forum/showthread.php?t=132099&page=2
 
Re: Weekly MMWR - Updated through Week 46

Re: Weekly MMWR - Updated through Week 46

it can be corrected automatically, when you have all the data in the computer.
But it's too much work to download and update my databas each week.

Someone should do it weekly and provide the database in
computer-readable form to others.


This is really a task which should be done by computers and not
only printed in weekly .pdf files.
 
Re: Weekly MMWR - Updated through Week 46

Re: Weekly MMWR - Updated through Week 46

Let's assume for a moment that the CDC would do this. What would be different. Sure, we would have a more accurate view of the situation, but what then? Schools would remain open, vaccines would still be in short supply (saying more want them), etc. etc. I'm not sure much would change having more accurate info, except, maybe more people worrying...or not.
 
Re: Weekly MMWR - Updated through Week 46

Re: Weekly MMWR - Updated through Week 46

it's important for budget-planning, insurances,
what drugs to develope, how much money to spend for
what research etc.

are you saying this is all useless anyway , so why improve ?
 
Re: Weekly MMWR - Updated through Week 46

Re: Weekly MMWR - Updated through Week 46

I'm one for solving problems. Yet, solving a problem doesn't necessarily translate into change. I agree budgeting issues might be improved for the following year (saying there is money in the budget)--and in a year things may look different for another problem. What drugs would be developed that aren't being looked at currently with the situation? The charts and graphs might look different, but not that different.

I think if one can say they would do "something" different if "something" changed in the stats, then one should probably be doing that "something" now. Why wait. Life's too short.

And I guess this should be moved to the discussion board...if I could figure out how to do it.:D
 
Re: Weekly MMWR - Updated through Week 46

Re: Weekly MMWR - Updated through Week 46

up again

Code:
35  9,880  6,484  2,289  651  234  217  519  
36  9,099  5,874  2,221  585  226  191  541  
37 11,250  7,275  2,749  718  270  236  683  
38 10,762  6,996  2,585  677  259  238  661  
39  9,589  6,309  2,250  588  226  213  620  
40 10,612  6,890  2,585  672  258  207  715  
41  9,964  6,643  2,289  604  232  194  684  
42 10,903  7,110  2,610  712  237  228  775  
43 11,136  7,330  2,546  782  248  224  828  
44 10,564  7,008  2,500  615  239  201  821  
45 10,366  6,858  2,430  653  224  192  773  
46 10,929  7,200  2,626  652  253  196  895  
47  8,351  5,505  2,056  470  171  148  600  
48 11,866  7,992  2,721  684  249  215  923

biweekly,2009:
18979,1060,559
22012,1344,611
20201,1335,661
20867,1459,699
21700,1649,760
21295,1668,783
20217,1523,753

biweekly 2008:
20086,1192
21550,1226
21832,1317
22056,1368
22379,1474
21217,1339
19814,1286


USA:http://wonder.cdc.gov/mmwr/mmwr_rep...r_year=2009&mmwr_location=TOTAL&mmwr_table=4A
other direct links here: http://www.flutrackers.com/forum/showpost.php?p=311413
 
Re: Weekly MMWR - Updated through Week 46

Re: Weekly MMWR - Updated through Week 46

Considering last week's numbers were from Thanksgiving week (shortened week with less days reported), this week would pick up the numbers not reported in the previous abbreviated week and would appear higher. Also, all but three cities reported.
 
Last edited:
Re: Weekly MMWR - Updated through Week 48

Re: Weekly MMWR - Updated through Week 48

the under-reporting would apply to total deaths and P+I-deaths
equally, so not to the ratio.


weeks 35-48,2008:148934(all),9202(P+I)=6.18%
weeks 35-48,2009:145271(all),10038(P+I)=6.91%

0.73% more deaths from P+I this year than last year in weeks 35-48
~650000 total deaths in that period, so 4750 excess deaths from P+I
in USA from wave 2 so far. (as compared with last year)

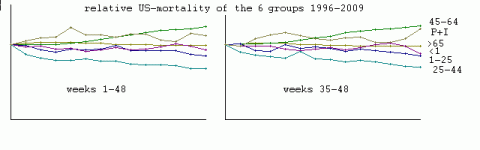
when you compare the age-groups, then you get
0.21% more deaths in the >65
1.14% more deaths in the 45-64
1.57% fewer deaths in the 25-44
3.71% fewer deaths in the 1-24
9.91% fewer deaths in the <1

percentage taken from all deaths, which are dominated by the >65

So, while children were most affected by ******, there actually were fewer
deaths in children. So ****** "saved" ~2000 US-lifes in the <25y group
despite making many of those sick and killing some of them directly.
Maybe these fewer deaths are coincidence, maybe it's because of better
surveillance in general during this period, maybe it's because young people were
more healthy and more careful because of ******. Maybe it's because
there were fewer accidents due to young people staying at home.

Part of this is because fewer (~330) younger people die each year because of
advances in medicine and health care.
 
Re: Weekly MMWR - Updated through Week 48

Re: Weekly MMWR - Updated through Week 48

So, while children were most affected by ******, there actually were fewer
(indirect) deaths in children. So ****** "saved" also ~2000 US-lifes in the <25y group.
(substract these from the estimated direct deaths in that group)

"By Nov 14, many times more children and younger adults, unfortunately, have been hospitalized or killed by H1N1 influenza than happens in a usual flu season," CDC Director Dr. Thomas Frieden said..."

So, children and young adults must not be dying from "something" they would have been otherwise listed, because totals in those groups would have risen when they are falling. More P&I are therefore from this group.

Wouldn't that also mean that more "65 and over" are dying not of flu, but now of "something" else (or listed as something other than P&I)? "Frieden said, "We know that it's much milder for older people. It's much less likely to result in death because older people are much less likely to get infected. But it has been a much worse flu season for people under the age of 65, particularly younger adults and children."
http://www.cidrap.umn.edu/cidrap/content/influenza/swineflu/news/dec1009estimates-jw.html
 
Re: Weekly MMWR - Updated through Week 48

Re: Weekly MMWR - Updated through Week 48

total deaths (relative to previous years) were actually lower
in young people in weeks 35-48 (unless I made a mistake somewhere).
Frieden probably meant deaths in young people from P+I only.

Deaths in the <1 was even "dramatically" lower, more than
in any of the last 14 years (weeks 35-48)

despite ******. (note my edit, you quoted an earlier version
of my post)
Maybe a new drug, a new invention or a change
in surveillance practice - or ****** - or coincidence.


those numbers of young deaths (all cause) are very low as compared to deaths
in older people, so not relevant for the total statistics
 

Attachments

  • usm09.gif
    usm09.gif
    4.3 KB · Views: 0
Re: Weekly MMWR - Updated through Week 48

Re: Weekly MMWR - Updated through Week 48

I'm just using relative deaths, so under-reporting cancels out.
(assuming the percentage of under-reporting is similar in the 6 groups)

And yes, I think replacing "U"s by the average over previous years
would be a good approximation.
But for that I'd have to update my big database of all 122 cities,
which is tedious.
Here I'm just using the US-total 1996-2009
year 2000 was especially mortal
 
Re: Weekly MMWR - Updated through Week 48

Re: Weekly MMWR - Updated through Week 48

total deaths (relative to previous years) were actually lower
in young people in weeks 35-48 (unless I made a mistake somewhere).
Frieden probably meant deaths in young people from P+I only.

Deaths in the <1 was even "dramatically" lower, more than
in any of the last 14 years (weeks 35-48)

despite ******. (note my edit, you quoted an earlier version
of my post)
Maybe a new drug, a new invention or a change
in surveillance practice - or ****** - or coincidence

I agree that most numbers appear to remain the same, or even be lowered. Consequently, many are dying of H1N1 instead of "something underlying". Yet, the P&I are higher than in previous years for ages 45-64 (where most H1N1 deaths are occurring according to CDC) and fewer 65 and over are dying of H1N1 (P&I). If deaths are higher in 65 and over, and CDC states there are fewer deaths by H1N1 in this age-group, then what are they now listed as dying from?
 
Re: Weekly MMWR - Updated through Week 48

Re: Weekly MMWR - Updated through Week 48

there are so many total deaths in that group that you can hardly
see any effect.
These are normal fluctuations.

In the <1y however the effect is big, although the numbers
are maybe not large enough to be significant.

Any idea what may have caused the decrease in mortality this year
in that group ?


-----------------------------------

Oct.2009:
The infant mortality in North Rhine-Westphalia decreased/went back to a new low,
as the statistic office of a federal state communicated North-Rhine/Westphalia recently.
In the comparison of the years 2007 and 2008 the number of the boys and girls,
who die before completion of their first year of life, decreased/went back
by 11.5 per cent ...

no ****** until Oct. in Northrhine Westfalia
 
Re: Weekly MMWR - Updated through Week 48

Re: Weekly MMWR - Updated through Week 48

Infant Mortality preliminary 2007: (top ten causes)
Congenital malformations, deformations and chromosomal abnormalities
Disorders related to short gestation and low birth weight, not elsewhere
Sudden infant death syndrome
Newborn affected by maternal complications of pregnancy
Accidents (unintentional injuries)
Newborn affected by complications of placenta, cord and membranes
Bacterial sepsis of newborn
Respiratory distress of newborn
Neonatal hemorrhage
Diseases of the circulatory system http://www.cdc.gov/nchs/data/nvsr/nvsr58/nvsr58_01.pdf

I think the main reason we are seeing fewer deaths in under age 1 (and perhaps in ages 1-4) is because there are fewer births.

??with 80 percent saying they feel stress about their personal finances, according to an annual survey released recently by the American Psychological Association. With rising job cuts and home foreclosures, many financially crunched families have decided the time isn't right to have a child, or another child.? http://www.msnbc.msn.com/id/28624299/

?Birth rates do tend to drop in times of economic uncertainty. There was a dramatic decline in fertility rates following the Great Depression in the 1930s, when, for the first time in U.S. history, women went from having an average of three children the previous decade to two.? http://www.nowpublic.com/health/pregnancy-and-birth-rate-declines-weak-economy

?Those figures from the National Center for Health Statistics, indicate that births declined in all but 10 states in 2008 (most of them in a Northern belt where the recession was generally less severe) compared with the year before. Over all, 4,247,000 births were recorded in 2008, 68,000 fewer than the year before.

California logged 14,500 fewer births than in 2007, a 2.6 percent decline and the first since 2001, when the state struggled with job losses in Silicon Valley that led to layoffs in distribution, construction and other sectors...Early figures for 2009 appear to confirm the correlation with the recession. As more families were feeling the effects of layoffs and economic uncertainty, births decreased even faster.

In Arizona, births declined about 3 percent in 2008, the first annual decrease since an economic downturn in 1991. In the first six months of 2009, 7 percent fewer babies were born compared with the year before. The state?s population bubble burst and the jobless rate rose from 5.5 percent to 8.7 percent in the 12 months ending in June.

In the first three months of 2009, births also declined 7 percent in Florida, another state where the economy took a tumble.?
http://www.nytimes.com/2009/08/07/us/07births.html
 
Back
Top