• FluTrackers.com Inc. does not provide medical advice. Information on this web site is collected from various internet resources, and the FluTrackers board of directors makes no warranty to the safety, efficacy, correctness or completeness of the information posted on this site by any author or poster. The information collated here is for instructional and/or discussion purposes only and is NOT intended to diagnose or treat any disease, illness, or other medical condition. Every individual reader or poster should seek advice from their personal physician/healthcare practitioner before considering or using any interventions that are discussed on this website. By continuing to access this website you agree to consult your personal physican before using any interventions posted on this website, and you agree to hold harmless FluTrackers.com Inc., the board of directors, the members, and all authors and posters for any effects from use of any medication, supplement, vitamin or other substance, device, intervention, etc. mentioned in posts on this website, or other internet venues referenced in posts on this website.
  • We are not asking for any donations. Do not donate to any entity who says they are raising funds for us.

Weekly MMWR: Week 30 (2009) - Week 39 (2010)

Re: Weekly MMWR - Updated through Week 2

Re: Weekly MMWR - Updated through Week 2

?Newly released Census Bureau data show that even before the current economic recession began in September 2008, population growth among children younger than age one began to decline, the AP/Kansas City Star reports. Between July 2007 and July 2008, the number of children younger than age one in the U.S. increased 0.9%, compared with a record 2.7% increase the previous year.? http://www.medicalnewstoday.com/articles/150897.php

?The 4,317,000 births in 2007 just edged out the figure for 1957, at the height of the baby boom?Today, the average woman has 2.1 children." http://www.nytimes.com/2009/08/07/us/07births.html
 
Re: Weekly MMWR - Updated through Week 48

Re: Weekly MMWR - Updated through Week 48

declined or increased ? I'm confused.
But it's hardly 10% less than 2008 which would be needed
to explain the drop in infant deaths even without ******.
 
Re: Weekly MMWR - Updated through Week 48

Re: Weekly MMWR - Updated through Week 48

gsgs - I still think you can't talk about a 10% reduction in fatalities with the absence of Chicago in this year's statistics. It is one of the largest of the 122 cities and could account for 5% of your apparant reduction all by itself.
 
Re: Weekly MMWR - Updated through Week 48

Re: Weekly MMWR - Updated through Week 48

I corrected for that already
 
Re: Weekly MMWR - Updated through Week 48

Re: Weekly MMWR - Updated through Week 48

Birth rate: 14.0 (2005) http://www.infoplease.com/ipa/A0005067.html
Birth rate: 14.2 live births per 1,000 persons in 2006, up slightly from 2005
Birth rate: 14.3 per 1,000 population 2007

Births 2005: 4,138,349
Births 2006: 4,265,555 (increase of 3% from 2005)
Births 2007: 4,317,000 (increase of 2.7% from 2006)
Births 2007-2008 ending Feb: 4,327,000 Birth Rate: 14.3 Death rate 6.6 per 1,000
Births 2008-2009 ending Feb: 4,215,000 Birth Rate: 13.8
Death rate 6.5 per 1000

http://www.cdc.gov/nchs/data/nvsr/nvsr58/nvsr58_06.htm
 
Last edited:
Re: Weekly MMWR - Updated through Week 48

Re: Weekly MMWR - Updated through Week 48

I found a newer site and updated info in bold in above post.
 
Last edited:
Re: Weekly MMWR - Updated through Week 48

Re: Weekly MMWR - Updated through Week 48

http://wonder.cdc.gov/mmwr/mmwrmort.asp

New York:http://wonder.cdc.gov/mmwr/mmwr_rep...wr_location=New+York+City,+N.Y.&mmwr_table=4A
Boston:http://wonder.cdc.gov/mmwr/mmwr_rep...009&mmwr_location=Boston,+Mass.&mmwr_table=4A
Atlanta: http://wonder.cdc.gov/mmwr/mmwr_rep...2009&mmwr_location=Atlanta,+Ga.&mmwr_table=4A

USA:http://wonder.cdc.gov/mmwr/mmwr_rep...r_year=2009&mmwr_location=TOTAL&mmwr_table=4A
New England: http://wonder.cdc.gov/mmwr/mmwr_rep...=2009&mmwr_location=New+England&mmwr_table=4A
Mid-Atlantic:http://wonder.cdc.gov/mmwr/mmwr_rep...009&mmwr_location=MID.+ATLANTIC&mmwr_table=4A
S.Atlantic: http://wonder.cdc.gov/mmwr/mmwr_rep...=2009&mmwr_location=S.+ATLANTIC&mmwr_table=4A
W.N.Central: http://wonder.cdc.gov/mmwr/mmwr_rep...2009&mmwr_location=W.N.+CENTRAL&mmwr_table=4A
W.S.Central: http://wonder.cdc.gov/mmwr/mmwr_rep...2009&mmwr_location=W.S.+CENTRAL&mmwr_table=4A
E.N.Central: http://wonder.cdc.gov/mmwr/mmwr_rep...2009&mmwr_location=E.N.+CENTRAL&mmwr_table=4A
E.S.Central: http://wonder.cdc.gov/mmwr/mmwr_rep...2009&mmwr_location=E.S.+CENTRAL&mmwr_table=4A
Mountain: http://wonder.cdc.gov/mmwr/mmwr_rep...ear=2009&mmwr_location=Mountain&mmwr_table=4A
Pacific: http://wonder.cdc.gov/mmwr/mmwr_rep...year=2009&mmwr_location=Pacific&mmwr_table=4A


Code:
35  9,880  6,484  2,289  651  234  217  519  
36  9,099  5,874  2,221  585  226  191  541  
37 11,250  7,275  2,749  718  270  236  683  
38 10,762  6,996  2,585  677  259  238  661  
39  9,589  6,309  2,250  588  226  213  620  
40 10,612  6,890  2,585  672  258  207  715  
41  9,964  6,643  2,289  604  232  194  684  
42 10,903  7,110  2,610  712  237  228  775  
43 11,136  7,330  2,546  782  248  224  828  
44 10,564  7,008  2,500  615  239  201  821  
45 10,366  6,858  2,430  653  224  192  773  
46 10,929  7,200  2,626  652  253  196  895  
47  8,351  5,505  2,056  470  171  148  600  
48 11,866  7,992  2,721  684  249  215  923  
49 11,738  7,655  2,897  707  249  228  886  
50 11,052  7,422  2,537  672  224  193  796  
51  8,544  5,740  1,983  477  180  163  658  
52  9,131  6,342  1,983  502  171  133  673
 
Re: Weekly MMWR - Updated through Week 49

Re: Weekly MMWR - Updated through Week 49

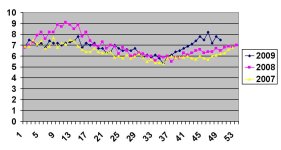
pediatric mortality.JPG
http://www.cdc.gov/mmwr/PDF/wk/mm5849.pdf
 
Re: Weekly MMWR - Updated through Week 49

Re: Weekly MMWR - Updated through Week 49

more than 2007,2009 but less than 2008.

And hopefully the induced deaths from other causes are lacking
since mainly the younger are infected
 
Re: Weekly MMWR - Updated through Week 49

Re: Weekly MMWR - Updated through Week 49

When looking at preliminary and actual data on actual deaths and P&I in 2006, 2007 and 2008 from CDC, then roughly adding totals from MMWR's in those years: (gsgs, please verify MMWR numbers against mine; I just used a hand calculator to round and total)

...Actual Deaths...MMWR Deaths(close, but not exact)
2006: 2,426,264 586,540 (multiplied by 4.1) equals approx. actual deaths
2007: 2,424,059 567,500 (multiplied by 4.3) equals approx. actual deaths

...Actual P&I....MMWR P&I
2006: 56,326 12,890 (multiplied by 4.4) equals approx. actual P&I
2007: 52,847 12,810 (multiplied by 4.1) equals approx. actual P&I

If all calculates correctly, then cities on MMWR, missing or not, generally represent close to one-fourth of the actual US total deaths and P&I by year's end.
 
Re: Weekly MMWR - Updated through Week 49

Re: Weekly MMWR - Updated through Week 49

cities not reporting in week 49:

Camden
Jersey City
Chicago
Ft.Worth
New Orleans

same week 2003:

33+35+401+121+41 deaths for those 5 out of 12731 = 5.0%


5200 estimated excess deaths from P+I in weeks 35-49
 
Re: Weekly MMWR - Updated through Week 50

Re: Weekly MMWR - Updated through Week 50

Looking at MMWR week 50:

Missing cities: 9
P&I deaths: 796
Total deaths: 11,052
pct P%I/total: .072

Yet, when looking at individual cities' reports, these cities were well over current pct: (numerous other cities were over as well)
MA: Lowell (.17), Lynn (.33), Somerville (.5), Worcester (.24), Fall River (.14), Boston (.11)
NY: Buffalo (.15), Utica (.3)
CT: New Haven (.17), Hartford (.11), Waterbury (.13)
PA: Reading (.12)
OH: Toledo (.16), Akron (.13), Dayton (.11)
MN: Minneapolis (.11)
AL: Montgomery (.16), Birmingham (.14)
IN: Evansville (.13)
CA: SF (.12), LA (.13), Long Beach (.14)
UT: Ogden (.14)
http://www.cdc.gov/mmwr/preview/mmwrhtml/mm5850md.htm?s_cid=mm5850md_e
 
Re: Weekly MMWR - Updated through Week 50

Re: Weekly MMWR - Updated through Week 50

%P&I by region:

New England: 12%
ES Central: 9.0%
Pacific: 8.9%
WN Central: 7.6%
Mountain: 7.6%
EN Central: 7.5%

This weeks National Average: 7.2%

WS Central: 6.2%
S Atlantic: 5.6%
Mid Atlantic: 4.6%
 
Re: Weekly MMWR - Updated through Week 50

Re: Weekly MMWR - Updated through Week 50

Regional baselines for the 2009-10 influenza season are:

Region 1 ? 1.2%
Connecticut, Maine, Massachusetts, New Hampshire, Rhode Island, and Vermont

Region 2 ? 2.3%
New Jersey, New York, Puerto Rico, and the U.S. Virgin Islands

Region 3 ? 3.0%
Delaware, District of Columbia, Maryland, Pennsylvania, Virginia, and West Virginia

Region 4 ? 2.0%
Alabama, Florida, Georgia, Kentucky, Mississippi, North Carolina, South Carolina, and Tennessee

Region 5 ? 1.7%
Illinois, Indiana, Michigan, Minnesota, Ohio, and Wisconsin

Region 6 ? 4.6%
Arkansas, Louisiana, New Mexico, Oklahoma, and Texas

Region 7 ? 1.8%
Iowa, Kansas, Missouri, and Nebraska

Region 8 ? 1.3%
Colorado, Montana, North Dakota, South Dakota, Utah, and Wyoming

Region 9 ? 2.8%
Arizona, California, Guam, Hawaii, and Nevada

Region 10? 3.3%
Alaska, Idaho, Oregon, and Washington
http://www.cdc.gov/flu/weekly/fluactivity.htm
 
Re: Weekly MMWR - Updated through Week 50

Re: Weekly MMWR - Updated through Week 50

Taking P&I % and dividing by the nation's influenza baseline of 2.47% for week 50 it is approximately 3. (This number is just a number for comparative purposes) Applying each state's baseline to P&I %, one can arrive at comparative numbers. Anything above 3 would be over the national avg. Some cities in MA are reporting numbers as high as 14 (The baseline for NE Region is 1.2%, therefore it doesn't take as many P&I deaths to exceed). Using same formula, TX has numbers around 1. Their baseline is 4.6% and would take many more P&I deaths to equate to the NE Region.

Just a thought.
 
Back
Top