• FluTrackers.com Inc. does not provide medical advice. Information on this web site is collected from various internet resources, and the FluTrackers board of directors makes no warranty to the safety, efficacy, correctness or completeness of the information posted on this site by any author or poster. The information collated here is for instructional and/or discussion purposes only and is NOT intended to diagnose or treat any disease, illness, or other medical condition. Every individual reader or poster should seek advice from their personal physician/healthcare practitioner before considering or using any interventions that are discussed on this website. By continuing to access this website you agree to consult your personal physican before using any interventions posted on this website, and you agree to hold harmless FluTrackers.com Inc., the board of directors, the members, and all authors and posters for any effects from use of any medication, supplement, vitamin or other substance, device, intervention, etc. mentioned in posts on this website, or other internet venues referenced in posts on this website.
  • We are not asking for any donations. Do not donate to any entity who says they are raising funds for us.

Weekly MMWR: Week 30 (2009) - Week 39 (2010)

Re: Week 30 MMWR

Re: Week 30 MMWR

OK, this is a little scary.

The Pneumonia & Influenza numbers are unusually high (Table III). This survey has 651 P&I deaths from a total of 11,012. CDC estimates 2.5 million deaths by all causes per year so that?s 48,000 per week on average. So proportionately, that?s around 2,800 P&I deaths nationally.
There are an estimated 82,000 P&I deaths in an average year http://www.cdc.gov/flu/about/disease/us_flu-related_deaths.htm , that?s 1,600 per week on average, and one would expect it to be even lower in the summertime. So in MMWR of week 30, there appears to be at least 1,200 excess P&I fatalities.

Please someone check to see if I?m making any silly mistakes or assumptions.

RoRo
 
Re: Week 30 MMWR

Re: Week 30 MMWR

OK, this is a little scary.

The Pneumonia & Influenza numbers are unusually high (Table III). This survey has 651 P&I deaths from a total of 11,012. CDC estimates 2.5 million deaths by all causes per year so that?s 48,000 per week on average. So proportionately, that?s around 2,800 P&I deaths nationally.
There are an estimated 82,000 P&I deaths in an average year http://www.cdc.gov/flu/about/disease/us_flu-related_deaths.htm , that?s 1,600 per week on average, and one would expect it to be even lower in the summertime. So in MMWR of week 30, there appears to be at least 1,200 excess P&I fatalities.

Please someone check to see if I?m making any silly mistakes or assumptions.

RoRo

You'd think that was all correct :) but, no, go back and check previous years MMWR week 30 reports. Last year's was actually about 20 higher on the P&I deaths. The CDC changed the way they come up with the P&I number effective 2008-2009, but so far I haven't found out what they did.
 
Re: Week 30 MMWR

Re: Week 30 MMWR

Phew, I was a little worried there!

Aug 2007 633P&I from 10,771 total is 5.8%
Aug 2008 677P&I from 10,989 total is 6.2%
Aug 2009 651P&I from 11,012 total is 5.9%

Good Catch!
 
Re: Week 30 MMWR

Re: Week 30 MMWR

deaths for agegroup 1-24 is up


mmwr2 , deaths in USA week 15,2009 - 26,2009


http://www.cdc.gov/mmwr/PDF/wk/mm5824.pdf
issue,all_ages,>=65,45-64,25-44,1-24,<1,P+I

122_5815,12034,7897,2800,794,270,267,820
122_5816,11470,7647,2664,685,236,232,821
122_5817,11453,7593,2649,677,275,250,799
122_5818,11303,7444,2620,710,263,255,810
122_5819,11277,7432,2685,682,253,219,751
122_5820,11268,7319,2713,687,272,268,751
122_5821,9797,6507,2268,606,217,195,619
122_5822,10821,7053,2601,699,244,223,697
122_5823,11126,7274,2636,719,245,246,773
122_5824,10987,7119,2582,737,288,255,732
122_5825,10163,6645,2393,665,237,220,663
122_5826,8692,5587,2146,532,240,183,571
122_5827,10961,7169,2560,733,264,226,710
122_5828,10824,7015,2651,671,265,218,726
122_5829,10493,6758,2554,696,260,222,657
122_5830,11012,6985,2735,725,298,266,651


NYC_5815,1032,710,237,51,13,19,33
NYC_5816,959,683,197,53,17,9,34
NYC_5817,1124,792,243,59,19,11,32
NYC_5818,1018,698,234,62,11,11,44
NYC_5819,822,577,189,39,6,11,23
NYC_5820,1128,790,258,49,14,16,51
NYC_5821,914,627,204,57,16,10,30
NYC_5822,970,652,242,51,16,9,42
NYC_5823,818,576,170,53,14,5,29
NYC_5824,1142,771,264,78,15,13,46
NYC_5825,805,565,168,48,12,12,31
NYC_5826,753,501,191,43,7,11,34
NYC_5827,1068,731,236,66,18,16,36
NYC_5828,1073,741,248,52,17,15,42
NYC_5829,1005,692,231,55,15,12,45
NYC_5830,1025,679,249,55,24,18,37

 
Re: Week 30 MMWR

Re: Week 30 MMWR

When you express the numbers as percentages, there doesn't seem to be any disproportionate younger deaths. On the other hand, 45-64 looks higher than normal, and has been above 24% for the past 5 weeks.

MMWR Week 30 /Total Fatalities /> 65 /45-64 /25-44 /1-24 /<1 /P&I
2009 /11,012 /63.40 /24.84 /6.58 /2.71 /2.42 /5.91
2008 /10,989 /64.93 /23.33 /6.68 /2.65 /2.39 /6.16
2007 /10,771 /64.40 /23.00 /6.98 /2.88 /2.39 /5.88
2006 /11,150 /63.90 /23.46 /7.35 /2.97 /2.22 /5.16

Comparison of % of fatalities in each age group, and Pneumonia and Influenza
Does not always equal 100% as some ages are unknown.

Nicer format in the attachment.
 

Attachments

Re: Week 30 MMWR

Re: Week 30 MMWR

Code:
average number of deaths per week in New York City
in the years 1996-2007:


 1  1190 
 2  1369 
 3  1239 
 4  1170 
 5  1330 
 6  1370 
 7  1291 
 8  1227 
 9  1269 
 10  1241 
 11  1304 
 12  1239 
 13  1182 
 14  1114 
 15  1145 
 16  1146 
 17  1111 
 18  1124 
 19  1113 
 20  1102 
 21  1019 
 22  1070 
 23  1126 
 24  1078 
 25  1062 
 26  990 
 27  1012 
 28  1160 
 29  1119 
 30  1055 
 31  1077 
 32  1066 
 33  1072 
 34  1053 
 35  1049 
 36  975 
 37  978 
 38  978 
 39  966 
 40  975 
 41  1113 
 42  1138 
 43  1138 
 44  1125 
 45  1064 
 46  1228 
 47  1162 
 48  1186 
 49  1252 
 50  1207 
 51  1198 
 52  1086 


3885 seasonal excess deaths in NYC per year
(from the CDC-36000-figure you would
expect 1000 flu-deaths in NYC per season)


http://wonder.cdc.gov/mmwr/mmwrmort.asp

118 US-cities + 9 regions  1996-2007


week
deaths all ages
>=65
45-64
25-44
1-24
<1
P+I


weekly deaths in NYC:

         1996-2007           2009        
  weeks: 43-16 17-42 15-29   15-29
----------------------------------
all ages: 1211  1061  1092    975
>=65    :  840   724   748    673
45-64   :  246   221   226    220
25-44   :   89    82    82     54
1-24    :   19    19    19     14
<1      :   16    15    15     12
P+I     :   54    40    43     36
 
Re: Week 30 MMWR

Re: Week 30 MMWR

USA 2009 Deaths from All Causes by Age Groups

week,All Ages,>=65,45-64,25-44,1-24,Less than 1,Pneumonia and Influenza
01 14333 9684 3235 863 297 251 987
02 12154 8153 2790 699 260 247 915
03 11769 7959 2676 648 228 256 853
04 12706 8465 2965 744 261 265 894
05 12280 8266 2769 736 245 258 881
06 12386 8312 2838 722 236 275 840
07 11269 7575 2620 647 218 207 836
08 12077 7917 2826 799 277 255 864
09 11876 7939 2699 719 274 243 858
10 11986 8087 2670 717 254 256 841
11 11706 7880 2708 647 239 224 838
12 12216 8178 2821 729 250 235 888
13 11400 7638 2562 725 233 238 847
14 11021 7448 2452 649 242 226 856
15 12034 7897 2800 794 270 267 820
16 11470 7647 2664 685 236 232 821
17 11453 7593 2649 677 275 250 799
18 11303 7444 2620 710 263 255 810
19 11277 7432 2685 682 253 219 751
20 11268 7319 2713 687 272 268 751
21 09797 6507 2268 606 217 195 619
22 10821 7053 2601 699 244 223 697
23 11126 7274 2636 719 245 246 773
24 10987 7119 2582 737 288 255 732
25 10163 6645 2393 665 237 220 663
26 08692 5587 2146 532 240 183 571
27 10961 7169 2560 733 264 226 710
28 10824 7015 2651 671 265 218 726
29 10493 6758 2554 696 260 222 657
30 11012 6985 2735 725 298 266 651
31 09982 6441 2383 679 250 224 610
32 10282 6670 2474 691 240 203 607
33 09666 6336 2280 633 225 190 588
34 10489 6780 2532 684 245 238 607
35 09880 6484 2289 651 234 217 519


total deaths this year in 122 US-cities from all causes in 5-week-intervals:
63242,59594,58377,56771,52894,51982,50299

total deaths this year in New York City from all causes in 5-week-intervals:
6013,5450,5107,5051,4649,4924,4812

237984,155175(.869)
21621,14385(.887)

259 excess deaths in week 21-35 in NYC this year as compared with the
national average
 
Re: Week 30 MMWR

Re: Week 30 MMWR

Code:
                  week 36                          week 37
region         all  >64 >44 >24 >1 <1 P+I     all  >64 >44 >24 >1 <1 P+I
--------------------------------------------------------------------------
New England :  458  304  94  33 15 12  44 ,   507  352 109  27 13  6  36 
Mid Atlantic: 1678 1156 363  94 38 27  73 ,  2119 1456 481 106 38 37  92  
S.Atlantic  : 1077  656 295  72 25 29  38 ,  1289  783 341  95 38 32  72  
W.N.Central :  541  330 132  48  9 21  39 ,   623  387 159  45 14 17  35  
W.S.Central :  968  579 260  74 30 25  53 ,  1434  865 383 109 50 27  66  
E.N.Central : 1387  901 347  81 33 25  76 ,  1727 1126 405  97 36 63  99  
E.S.Central :  756  486 183  44 28 15  54 ,   802  507 202  65 21  7  69  
Mountain    :  991  642 255  59 15 19  47 ,  1122  706 284  84 22 26  58  
Pacific     : 1243  820 292  80 33 18 117 ,  1627 1093 385  90 38 21 156


total       :  9880 6484 2289  651  234  217  519
               9099 5874 2221  585  226  191  541
              11250 7275 2749  718  270  236  683
             ------------------------------------
              +23.6 23.9 23.8 22.7 19.5 23.6 26.2


10.7 -18.2
26.3  26.0
19.7  89.5
15.2 -10.3
48.1  24.5
24.5  30.3
 6.1  27.8
13.2  23.4
30.9  33.3
-----------
23.6  26.2


was there a holiday in week 36, which they only reported on in week 37 ?
 
Re: Week 30 MMWR

Re: Week 30 MMWR

deaths down in week 39
see links above

I can hardly see any effect of ****** on deathrates
 
Re: Week 30 MMWR

Re: Week 30 MMWR

Week 39 MMWR comparison;


Age---<1 --- 1-24---25-44---45-64----65+----Total-----P&I
2009:213----226----588-----2250----6309-----9589----620
%:--2.22%--2.36%-6.13%---23.5%---65.8%------------6.47%

2008:246----294----737-----2469----6928-----10679---617
%:--2.30%--2.75%-6.90%---23.1%---64.9%------------5.78%

2007:229----220----692-----2391----6652-----10189---606
%:--2.25%--2.16%-6.79%---23.5%---65.3%------------5.95%

P&I fatalities for week 39 are elevated as a percentage of total deaths, but overall a thousand less deaths than the same week last year. The number of P&I deaths is virtually unchanged.
 
Last edited:
Re: Weekly MMWR - Updated through Week 39

Re: Weekly MMWR - Updated through Week 39

It would be intersting to see deaths by age. We might be seeing a major shift to the left with this new flu.
 
Re: Weekly MMWR - Updated through Week 39

Re: Weekly MMWR - Updated through Week 39

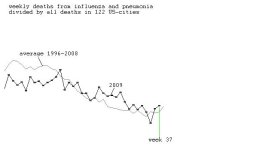
I think, there is a problem with some cities not updating in some weeks and holidays
which make some weeks shorter and the next one longer.
So when looking at P+I, I divided by all deaths to cancel out this effect.
However, all deaths in week 23-29 this year were ~4% less than the
average 1996-2008 in the MMWR database, while P+I increased in that period.


attachment.php


the ratio of P+I deaths in USA in weeks 23-29 this year was 8% higher than the average
in 1996-2009 for that period. That would give 1500 excess deaths in USA from P+I
in these 7 weeks.
This is assuming that the reason for total deaths going down this year in that
period was missing reports from some cities or population movements.


all deaths in weeks 23-29
deaths from P+I in weeks 23-29
----------------------------
1996: 80693,4418
1997: 78023,4565
1998: 82392,4580
1999: 72259,3992
2000: 78054,5098
2001: 79704,5194
2002: 71705,4421
2003: 73577,4653
2004: 77263,4885
2005: 76892,4686
2006: 76883,4549
2007: 72779,4350
2008: 77355,4958
2009: 73246,4832


and the same for New York City:
1996:8343,291
1997:8083,310
1998:7788,276
1999:7968,169
2000:7696,286
2001:7903,312
2002:7547,274
2003:7589,307
2004:7306,337
2005:7242,326
2006:7217,341
2007:5876,248
2008:7037,265
2009:6664,263


only 169 in 1999 ?
see yourself:
http://wonder.cdc.gov/mmwr/mmwr_rep...wr_location=New+York+City,+N.Y.&mmwr_table=4A

something is wrong here
 

Attachments

  • mmwr96.jpg
    mmwr96.jpg
    15.9 KB · Views: 1
Re: Weekly MMWR - Updated through Week 39

Re: Weekly MMWR - Updated through Week 39

I think, there is a problem with some cities not updating in some weeks and holidays
which make some weeks shorter and the next one longer. . .
something is wrong here

Unless there is a math or calculation error the deviation is puzzling. Regardless of holidays or not, the number of people that died in a seven day period should be easily countable. Unless, of course, the data tabulators are so overworked now that they can not keep up with the reporting requirements.
 
Re: Weekly MMWR - Updated through Week 39

Re: Weekly MMWR - Updated through Week 39

USA:
Code:
32 10282  6670  2474  691  240  203  607  
33  9666  6336  2280  633  225  190  588  
34 10489  6780  2532  684  245  238  607  
35  9880  6484  2289  651  234  217  519  
36  9099  5874  2221  585  226  191  541  
37 11250  7275  2749  718  270  236  683  
38 10762  6996  2585  677  259  238  661  
39  9589  6309  2250  588  226  213  620  
40 10612  6890  2585  672  258  207  715

ratio in %:

5.90,6.08,5.79,5.25,5.96,6.07,6.14,6.47,6.74 USA
4.05,3.24,4.48,3.38,4.35,4.34,4.29,5.63,4.81 Mid-Atlantic
8.70,9.78,8.05,7.52,9.41,9.59,8.58,8.38,8.02 Pacific
5.85,6.13,5.70,5.53,5.18,5.87,6.11,5.69,6.97 South
 
Re: Weekly MMWR - Updated through Week 39

Re: Weekly MMWR - Updated through Week 39

Code:
2008:
33:10731 7008 2548 705 236 233 606 
34:10734 6942 2536 751 258 243 644 
35:10694 6917 2580 656 266 269 631 
36: 9392 6034 2279 636 233 205 561 
37:11049 7173 2640 727 285 223 611 
38:10501 6807 2517 665 269 237 615 
39:10679 6928 2469 737 294 246 617 
40:11153 7239 2704 693 242 274 700 
41:11158 7362 2539 737 257 257 680 
-------------------------------------------------------

2009:
33: 9666  6336  2280  633  225  190  588  
34:10489  6780  2532  684  245  238  607  
35: 9880  6484  2289  651  234  217  519  
36: 9099  5874  2221  585  226  191  541  
37:11250  7275  2749  718  270  236  683  
38:10762  6996  2585  677  259  238  661  
39: 9589  6309  2250  588  226  213  620  
40:10612  6890  2585  672  258  207  715  
41: 9964  6643  2289  604  232  194  684  
------------------------------------------------------------

semaine
morts total
mourit a ans >64
mourit a ans 25-64
mourit a ans 1-24
mourit a ans 0-1
mourit en pneumonie ou grippe


deaths in weeks 33-41

Code:
 year    all   >65   45-64 25-44  1-24   <1   P+I
----------------------------------------------------
 1996  99372  65650  19326  9165  2830  2243  5477                      
 1997 101513  67891  19627  8593  2894  2334  5528                     
 1998  99204  67010  19231  7895  2612  2330  5859                      
 1999  91649  62216  17932  7027  2353  2061  5357                      
 2000 100245  67727  19785  7558  2828  2242  6493                     
 2001  91262  61645  18202  6984  2425  1943  5667                      
 2002  90598  60178  19003  6860  2470  2040  5330                      
 2003  93517  61386  19905  7018  2581  2096  5507                      
 2004  95798  63157  21171  6805  2557  2045  5763                      
 2005  91397  59588  20775  6533  2416  2043  5366                      
 2006  96772  63086  22152  6817  2405  2253  5524                      
 2007  92517  60007  21421  6472  2388  2165  5315                      
 2008  96091  62410  22812  6307  2340  2187  5665                      
 2009  91311  59587  21780  5812  2175  1924  5618                      
----------------------------------------------------


the pandemic 2nd wave in USA significantly reduced
deaths in the young (<45 years)

(if I made no mistake...)
 
Back
Top