• FluTrackers.com Inc. does not provide medical advice. Information on this web site is collected from various internet resources, and the FluTrackers board of directors makes no warranty to the safety, efficacy, correctness or completeness of the information posted on this site by any author or poster. The information collated here is for instructional and/or discussion purposes only and is NOT intended to diagnose or treat any disease, illness, or other medical condition. Every individual reader or poster should seek advice from their personal physician/healthcare practitioner before considering or using any interventions that are discussed on this website. By continuing to access this website you agree to consult your personal physican before using any interventions posted on this website, and you agree to hold harmless FluTrackers.com Inc., the board of directors, the members, and all authors and posters for any effects from use of any medication, supplement, vitamin or other substance, device, intervention, etc. mentioned in posts on this website, or other internet venues referenced in posts on this website.
  • We are not asking for any donations. Do not donate to any entity who says they are raising funds for us.

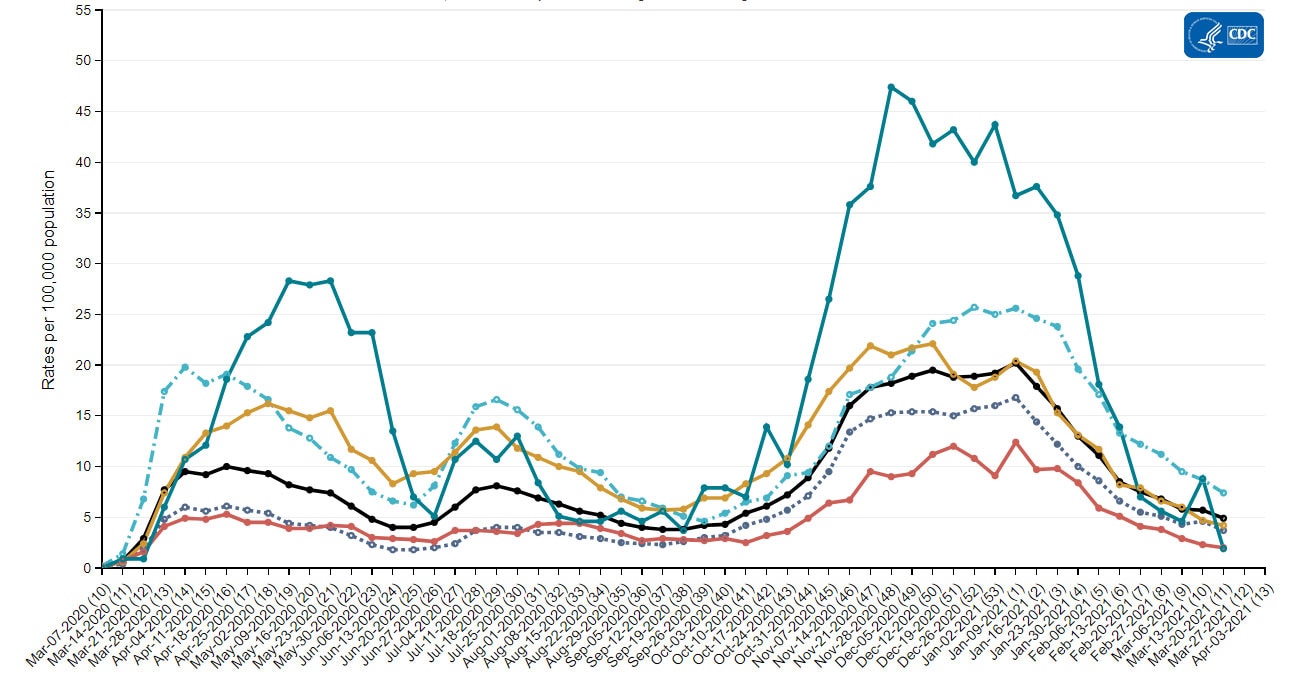
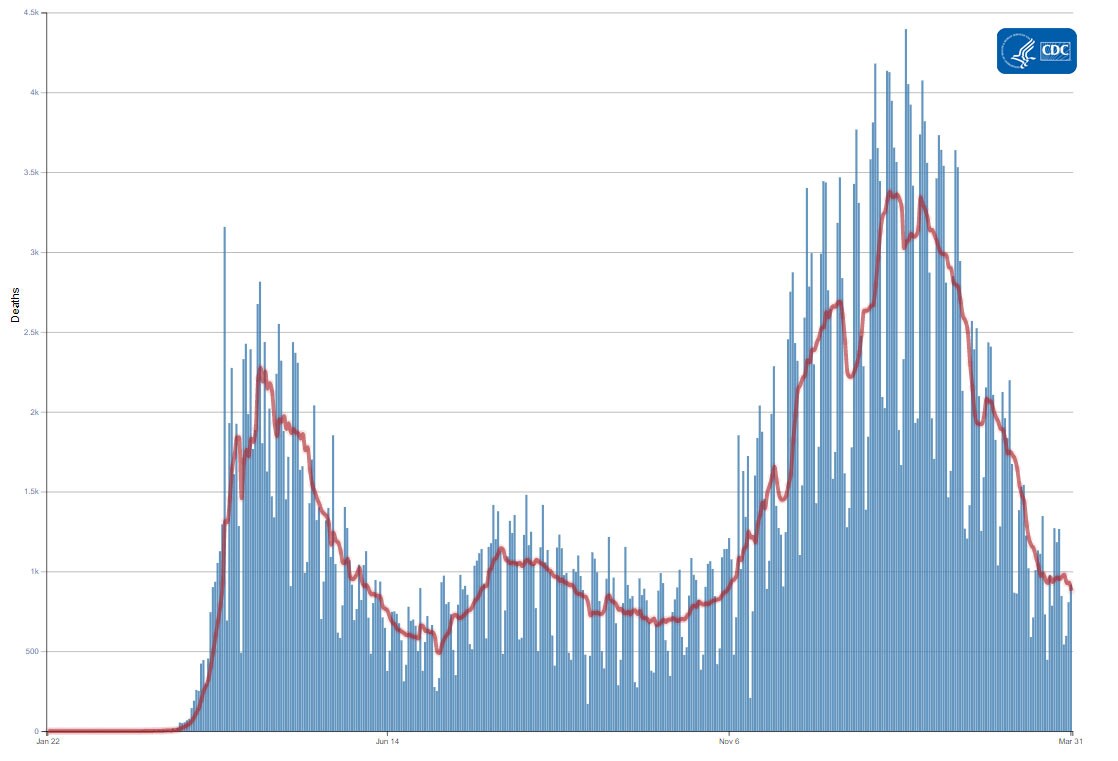
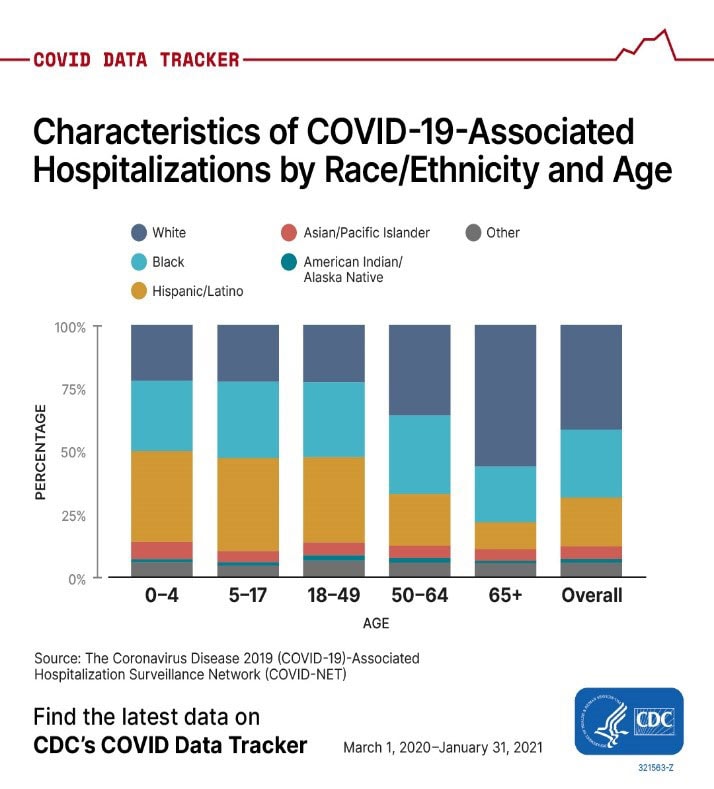
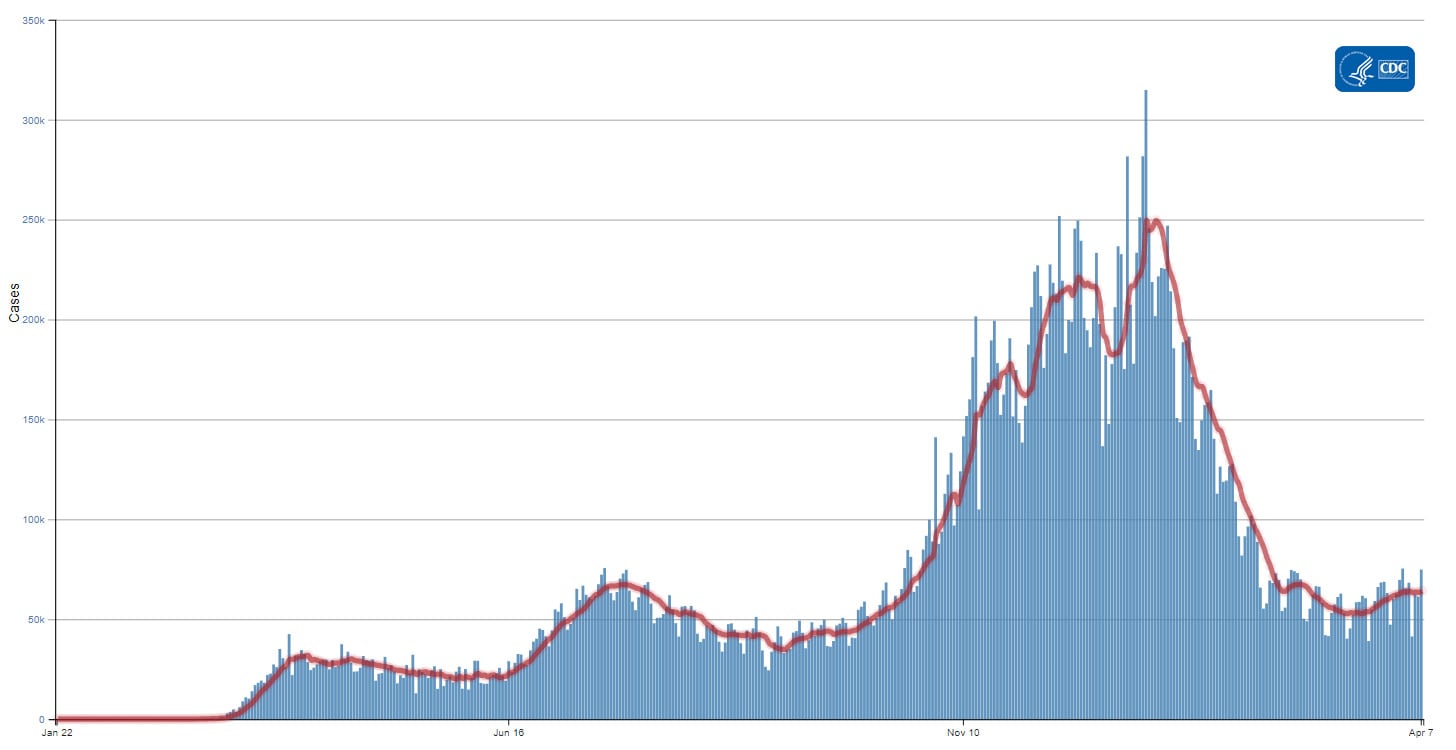
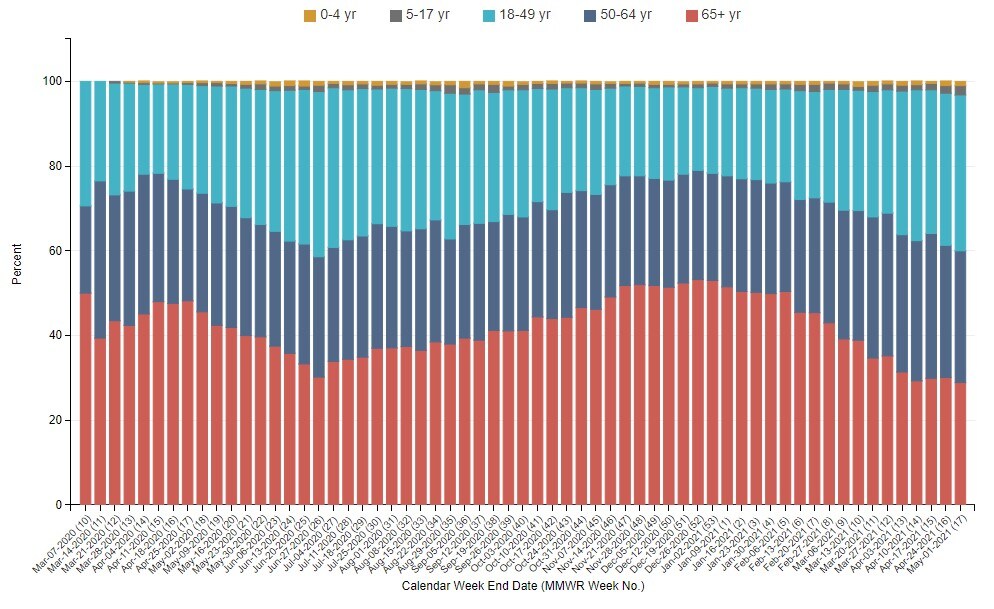
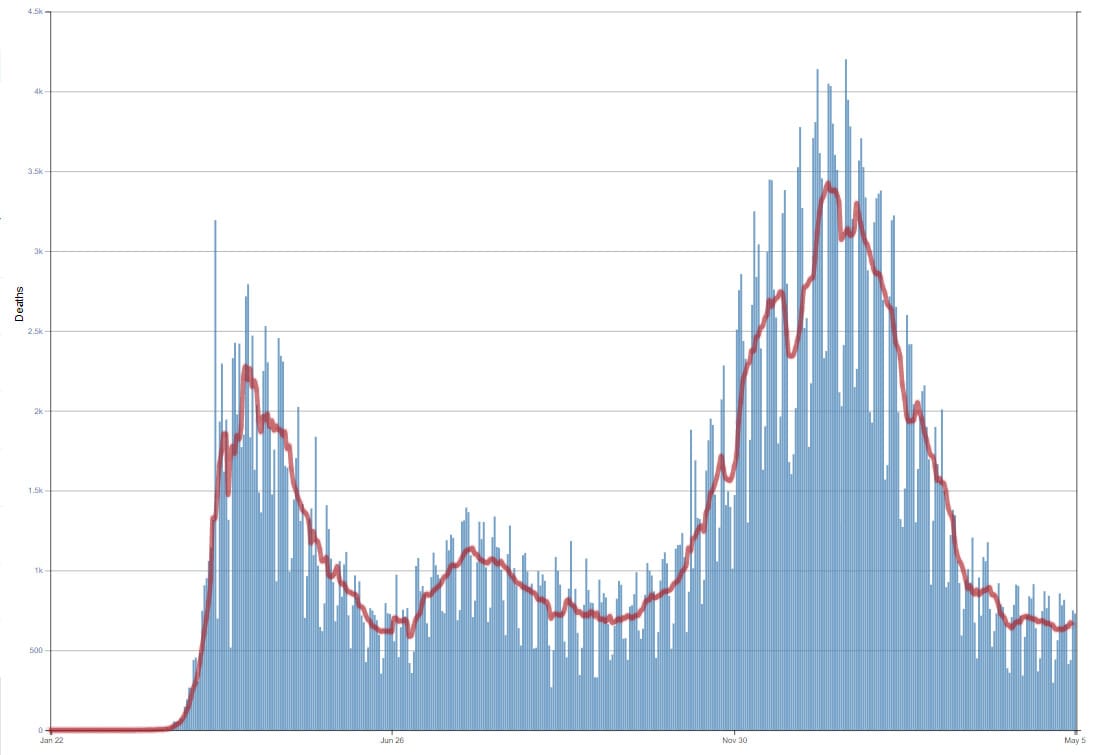
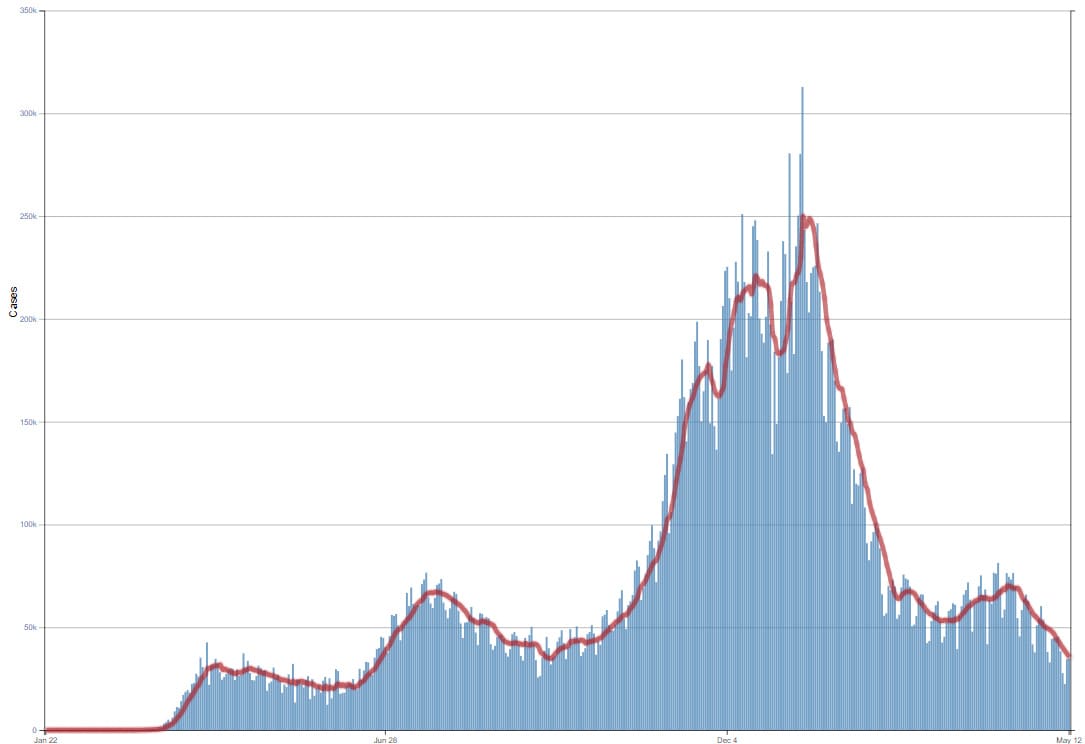
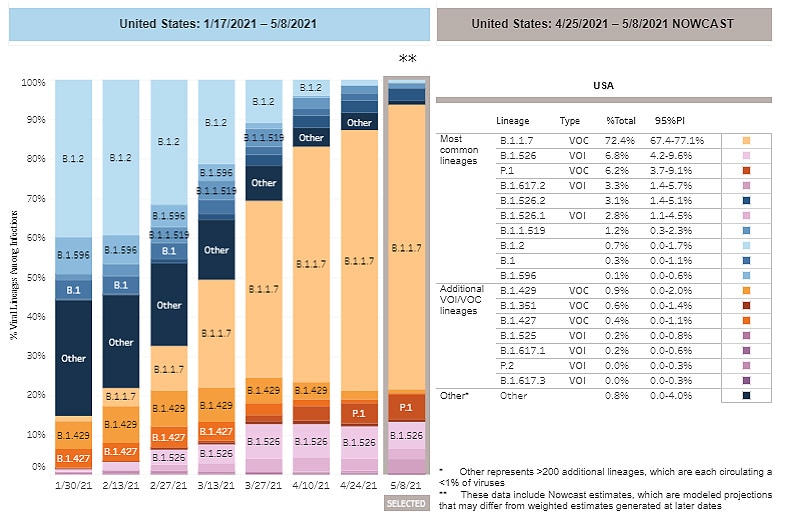
US - CDC: COVIDView 2020/2021 - Not offered for exactness - Offered for trend analysis only

COVIDView.jpg
  1. CASES, DATA & SURVEILLANCE
COVIDView Summary ending on December 19, 2020


Updated Dec. 28, 2020
Print
Due to New Year’s holiday, the week 52 COVIDView report will be released on Monday, January 4.

Download Weekly Summary pdf icon[844 KB, 11 pages]
Key Updates for Week 51, ending December 19, 2020


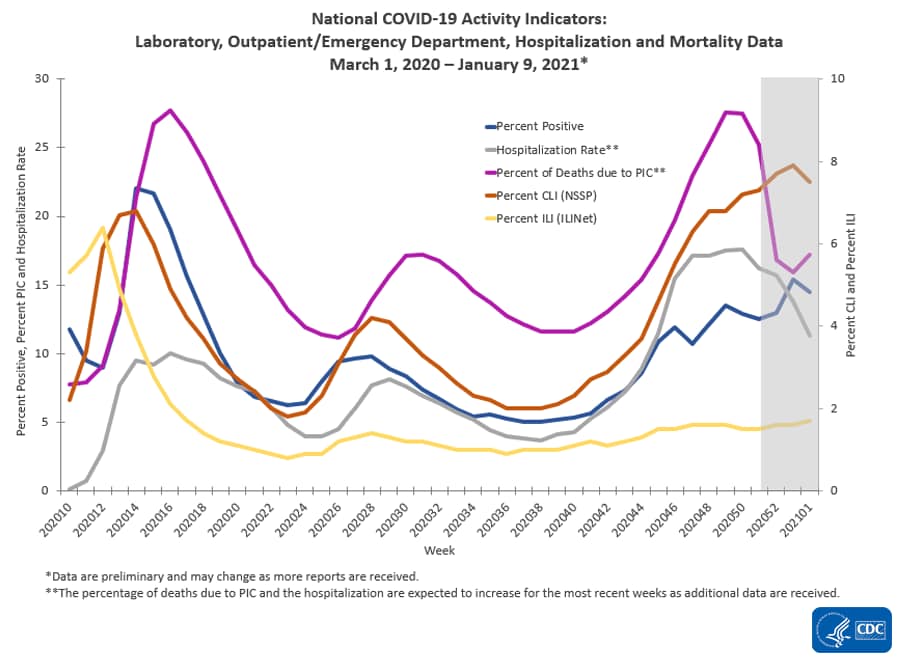
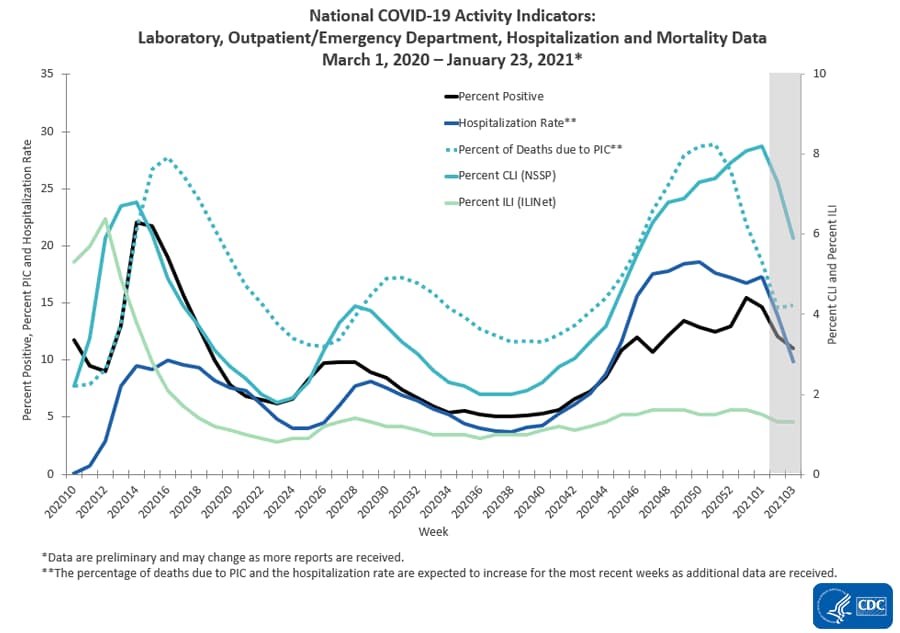
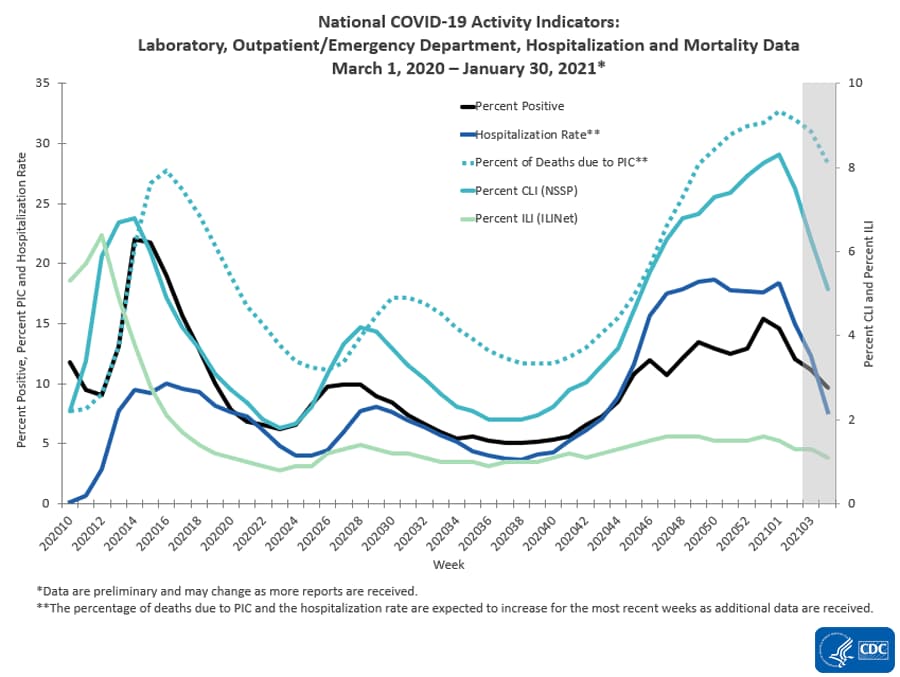
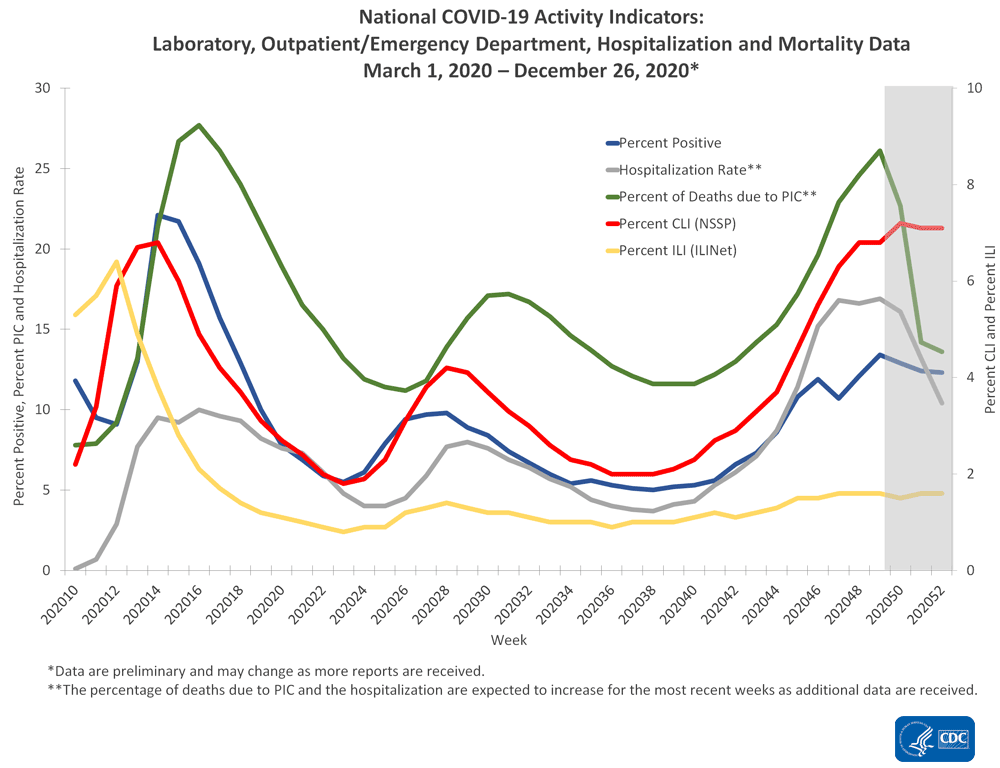
Nationally, surveillance indicators tracking levels of SARS-CoV-2 circulation and associated illnesses declined or remained stable during the week ending December 19, 2020. The percentage of deaths due to pneumonia, influenza and COVID-19 (PIC) has been increasing since early October. Both COVID-19-associated hospitalizations and PIC mortality for the most recent weeks are expected to increase as more data are received.
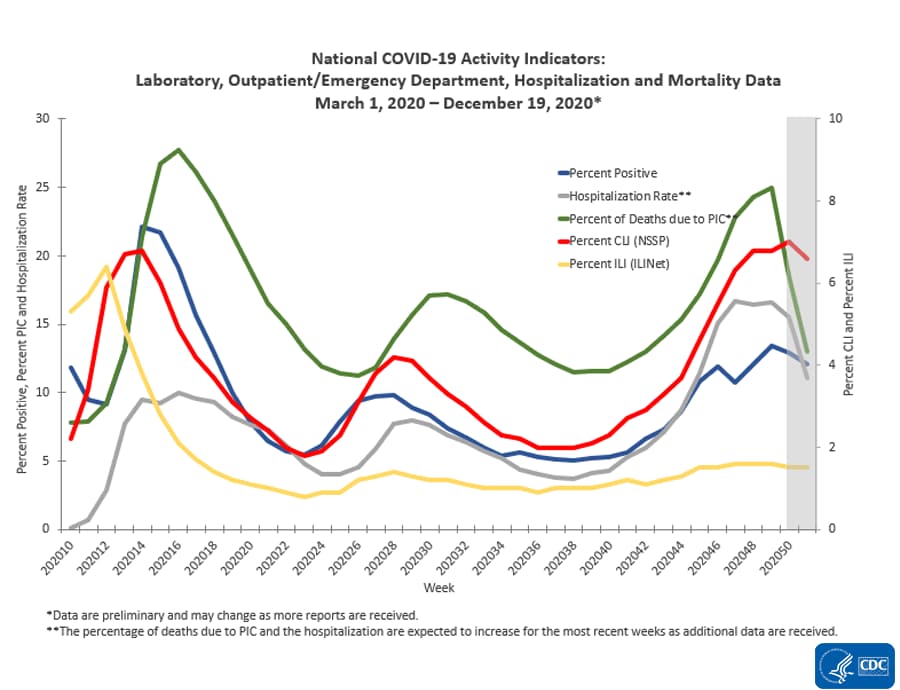
national-activity-indicators.gif

Download Chart Data excel icon[XLS – 2 KB]
Virus: Public Health, Commercial and Clinical Laboratories


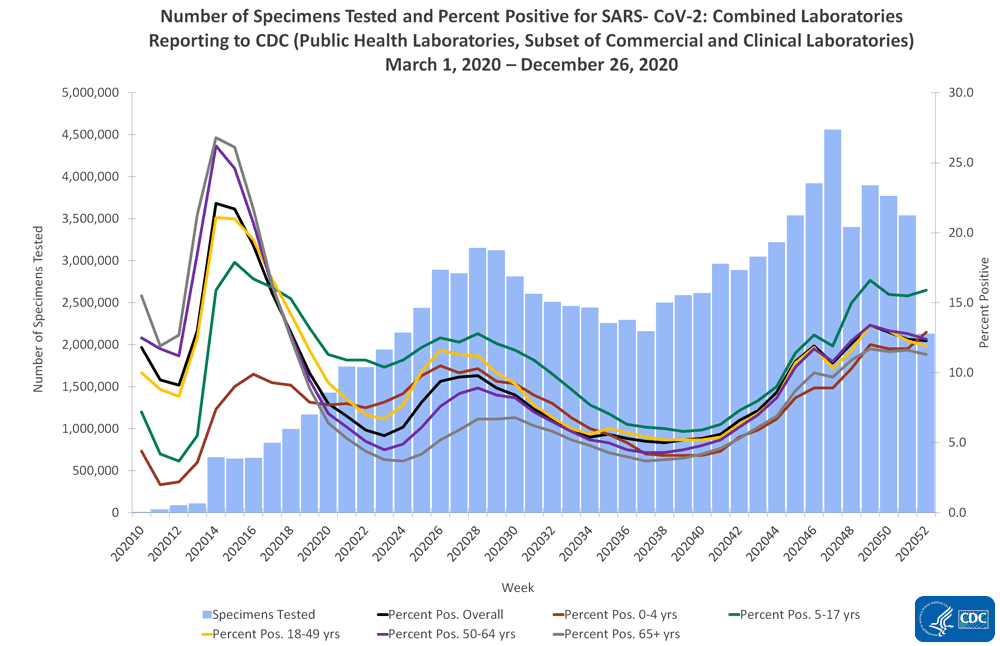
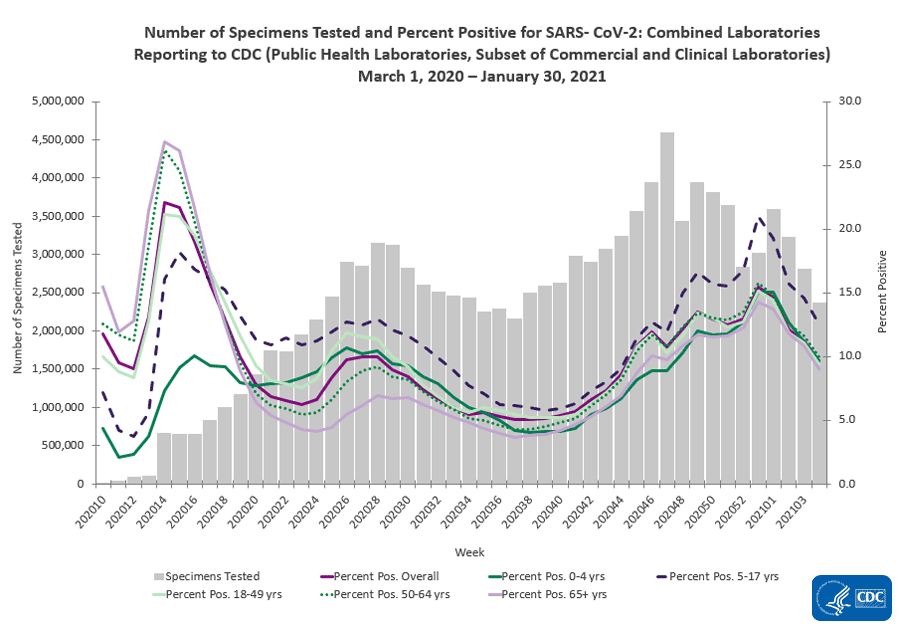
Nationally, the overall percentage of respiratory specimens testing positive for SARS-CoV-2, the virus causing COVID-19, decreased from 12.9% during week 50 to 12.1% during week 51. Percent positivity decreased among all age groups. Regionally, the percentage of respiratory specimens testing positive for SARS-CoV-2 increased in two of the ten Health and Human Services (HHS) regionsexternal icon.
Mild/Moderate Illness: Outpatient and Emergency Department Visits


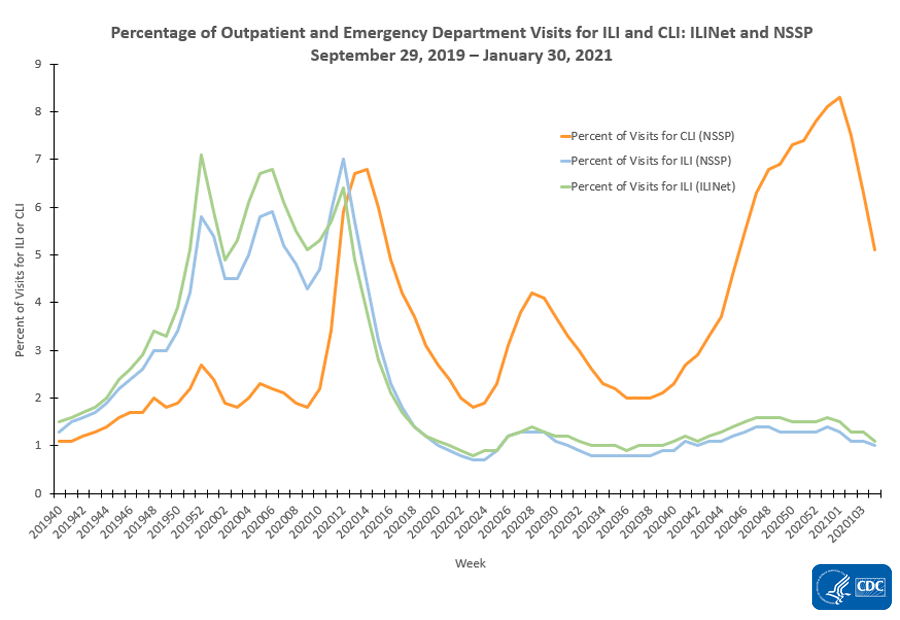
Nationally, the percentage of visits to outpatient providers or emergency departments (EDs) for COVID-like illness (CLI) and influenza-like illness declined or remained stable (change of ≤0.1%), respectively, during week 51 compared with week 50. One of ten surveillance regions reported an increase in at least one indicator of mild/moderate illness this week; the remaining nine regions reported a stable (change of ≤0.1%) or decreasing percentage of visits for ILI and CLI.
Severe Disease: Hospitalizations and Deaths


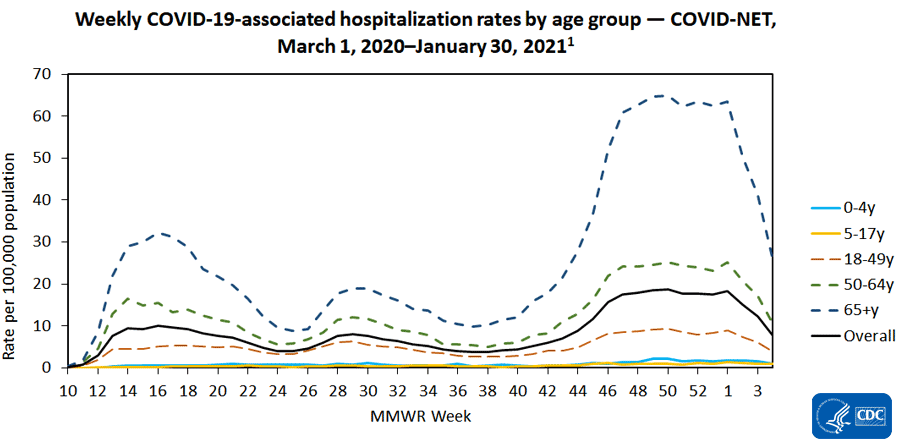
In recent weeks, overall weekly hospitalization rates have remained stable but elevated, after reaching their highest point since the beginning of the pandemic in late November. Rates for recent weeks are likely to change as additional data are reported. Based on death certificate data, the percentage of deaths attributed to PIC for week 51 was 13.0% and remains above the epidemic threshold. The weekly percentage of deaths due to PIC increased during October through early December and is expected to increase for the most recent weeks as additional data are reported.

All data are preliminary and may change as more reports are received. A description of the surveillance systems summarized in COVIDView, including methodology and detailed descriptions of each data component, is available on the surveillance methods page.
Key Points
  • Nationally, surveillance indicators tracking levels of SARS-CoV-2 circulation and associated illnesses declined or remained stable during week 51 compared with week 50.
    • At least one indicator used to monitor COVID-19 activity increased in three regions (Regions 2 [New Jersey/New York/Puerto Rico], 6 [South Central], and 9 [South/West Central]) during week 51 compared with week 50. The remaining seven regions reported a decreasing or stable level of SARS-CoV-2 virus circulation and mild/moderate illness during week 51.
  • The overall cumulative COVID-19-associated hospitalization rate through the week ending December 19, 2020, was 313.3 hospitalizations per 100,000 population.
    • Overall weekly hospitalization rates reached their highest point at 16.7 per 100,000 during the week ending November 21, 2020 (MMWR Week 47) and have remained elevated but stable since that time. Hospitalization rates for the most recent weeks are likely to change as additional data are reported for those weeks.
    • The cumulative age-adjusted hospitalization rates for Hispanic or Latino persons, non-Hispanic American Indian or Alaska Native persons, and non-Hispanic Black persons were approximately 3.6, 3.5, and 3.1 times those of non-Hispanic White persons, respectively.
  • The percentage of deaths due to PIC has been increasing since the beginning of October and has exceeded the percentage of deaths due to PIC observed during the summer peak. Data for the most recent two weeks currently show a decline, but that is likely to change as additional death certificates are processed.
  • Estimates from previous weeks are subject to change as data are updated with the most complete data available.
U.S. Virologic Surveillance


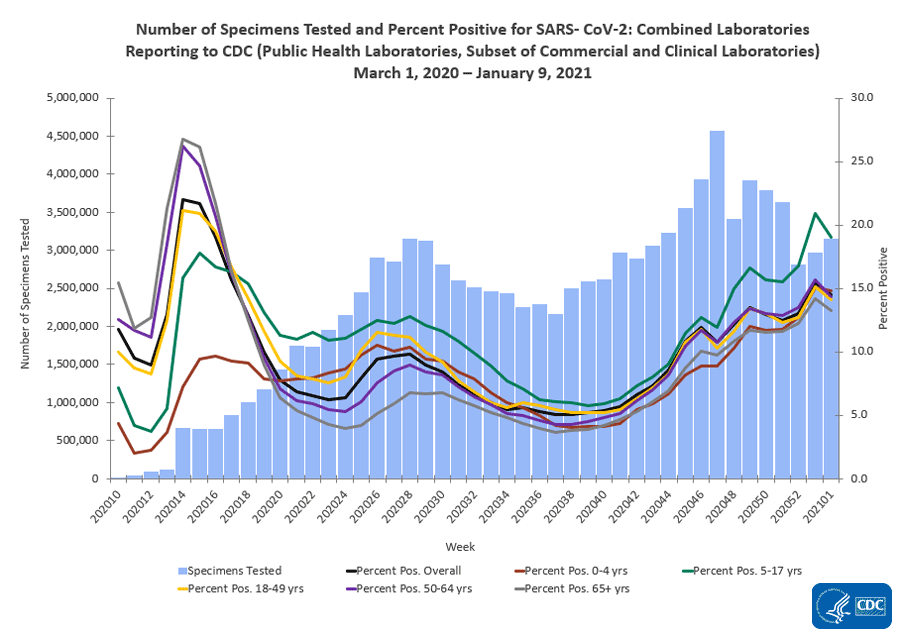
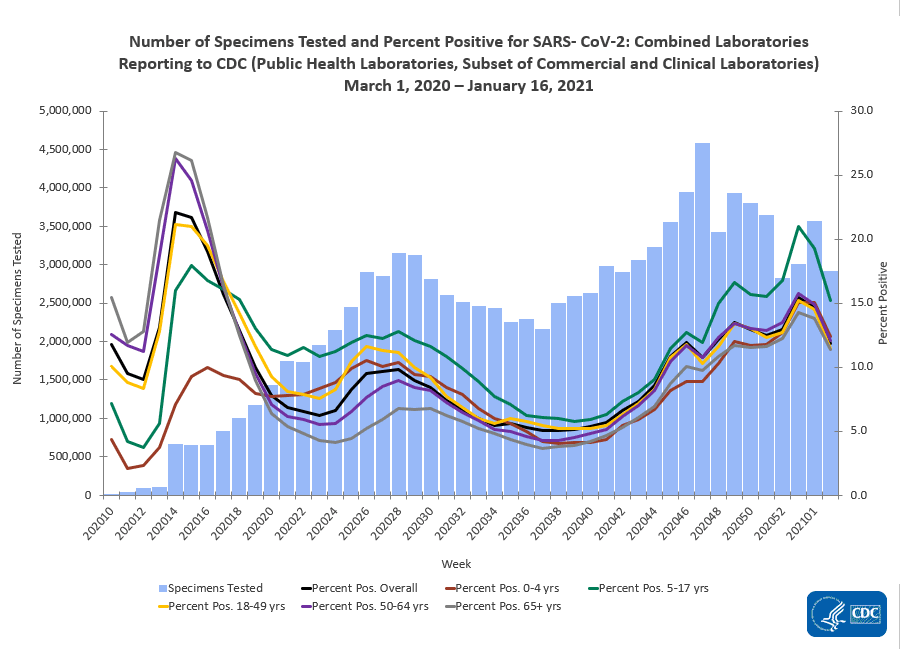
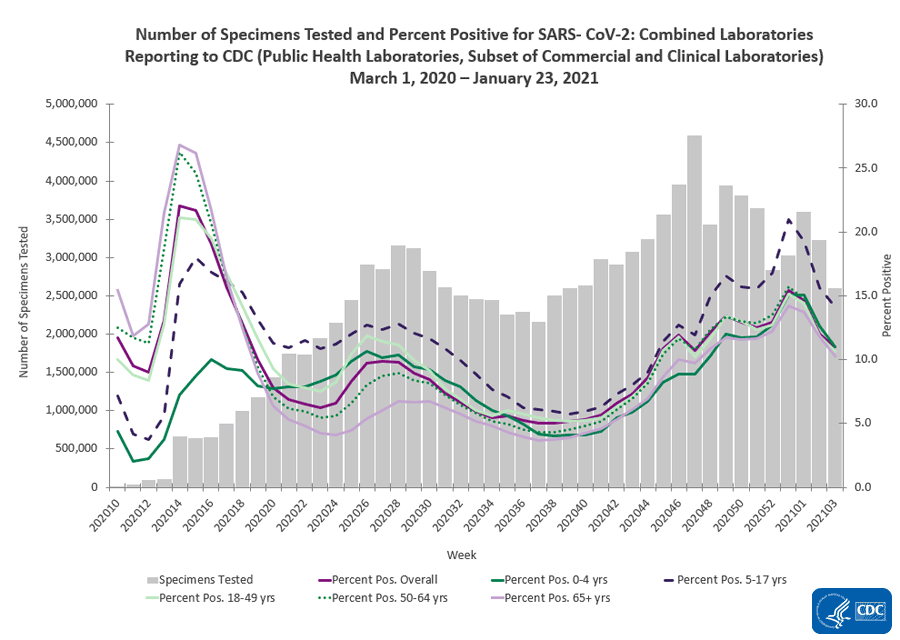
Based on data reported to CDC by public health laboratories and a subset of clinical and commercial laboratories in the United States, 94,163,675 specimens were tested for SARS-CoV-2 using a molecular assay since March 1, 2020. The percentage of specimens testing positive for SARS-CoV-2 each week, based on week of specimen collection, are summarized below.

Nationally, during week 51, of 3,098,030 specimens tested for SARS-CoV-2 for diagnostic purposes, 376,034 (12.1%) were positive. This is a decrease compared with week 50, during which 12.9% of specimens tested were positive. The percentage of specimens testing positive decreased among all age groups.
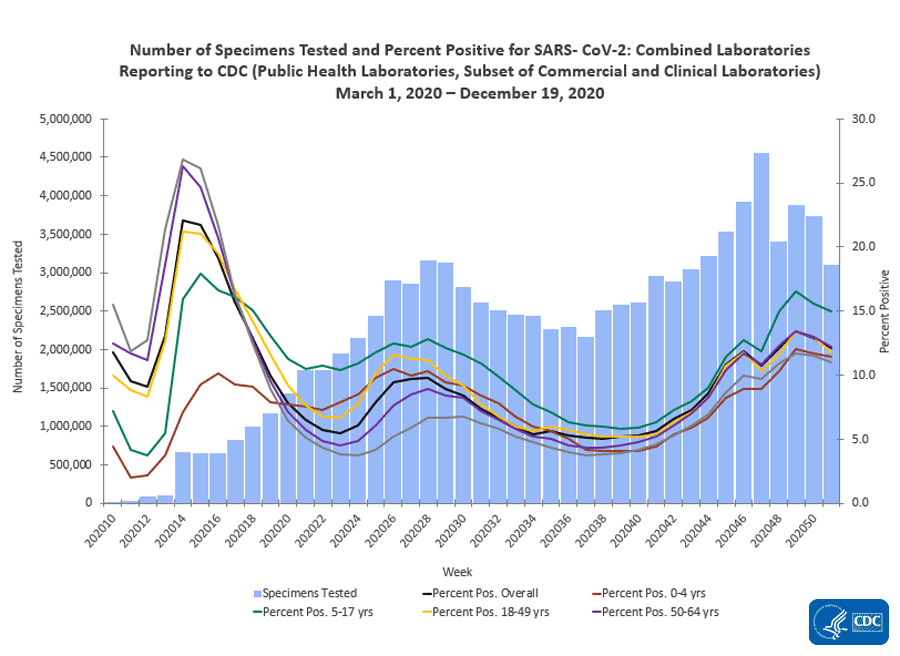
specimens-tested.gif


*Note: Different laboratory types came on board with testing during different weeks. This graph includes public health laboratory data beginning in week 10, clinical laboratory data beginning in week 11, and commercial laboratory data beginning in week 14.
View Data Table


The percentage of specimens testing positive for SARS-CoV-2 increased in two regions (Regions 6 [South Central] and 9 [South West/Coast]) during week 51 compared with week 50; the remaining eight regions reported a decrease in percentage of specimens testing positive.

Additional virologic surveillance information: Surveillance Methods


Outpatient/Emergency Department Illness


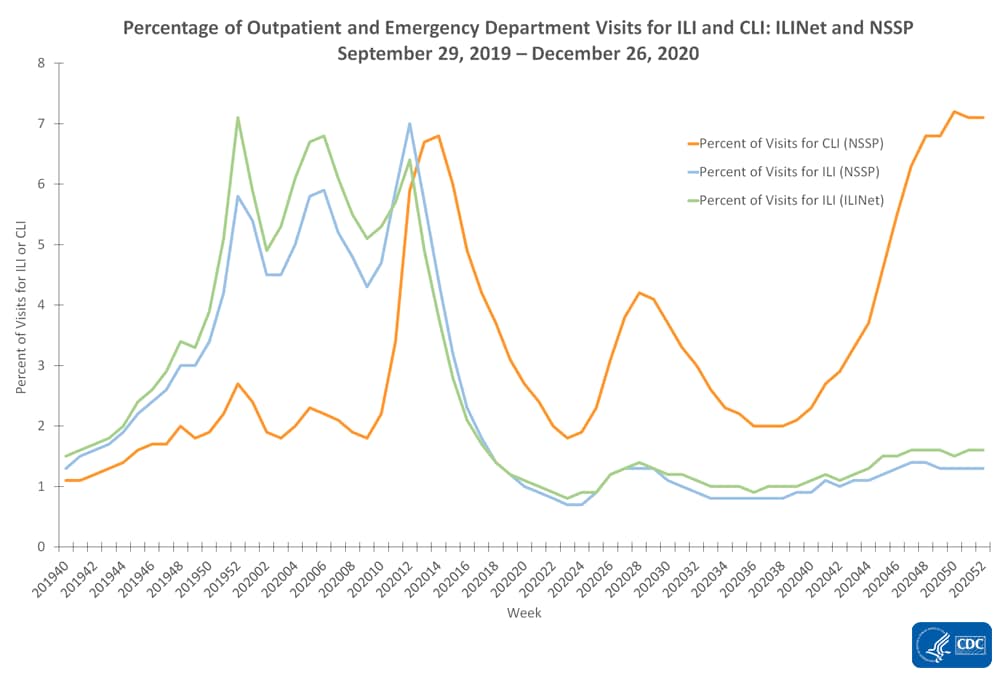
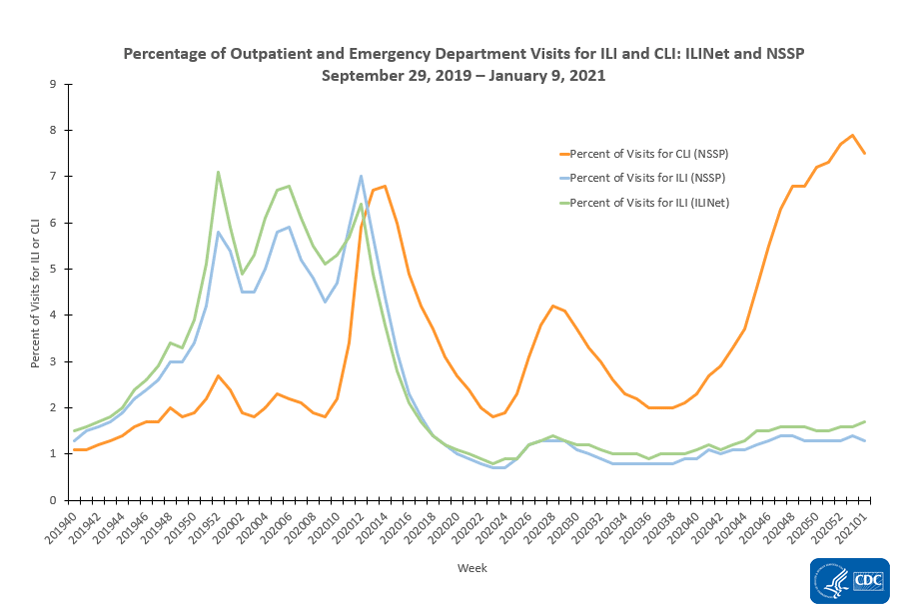
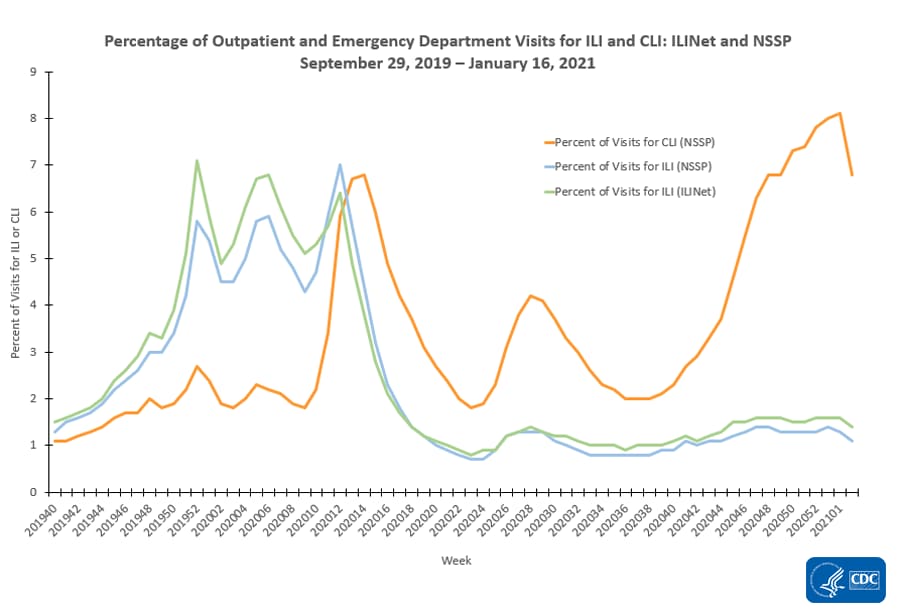
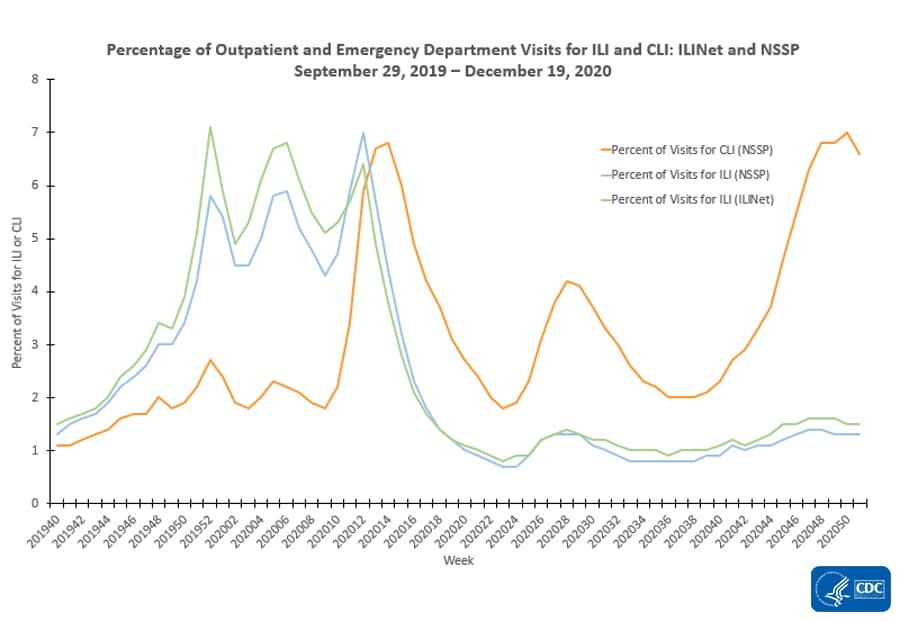
Two syndromic surveillance systems, the U.S. Outpatient Influenza-like Illness Surveillance Network (ILINet) and the National Syndromic Surveillance Project (NSSP), are being used to monitor trends in outpatient and emergency department (ED) visits that may be associated with COVID-19 illness. Each system monitors activity in a slightly different set of providers/facilities and uses a slightly different set of symptoms that may be associated with SARS-CoV-2 virus infection. ILINet provides information about visits to outpatient providers or emergency departments for influenza-like illness (ILI; fever plus cough and/or sore throat) and NSSP provides information about visits to EDs for ILI and COVID-like illness (CLI; fever plus cough and/or shortness of breath or difficulty breathing). Some EDs contribute ILI data to both ILINet and NSSP. Both systems are currently being affected by changes in health care seeking behavior, including increased use of telemedicine and increased social distancing. These changes affect the numbers of people seeking care in the outpatient and ED settings and their reasons for doing so. Syndromic data, including CLI and ILI, should be interpreted with caution and should be evaluated in combination with other sources of surveillance data, especially laboratory testing results, to obtain a complete and accurate picture of respiratory illness.

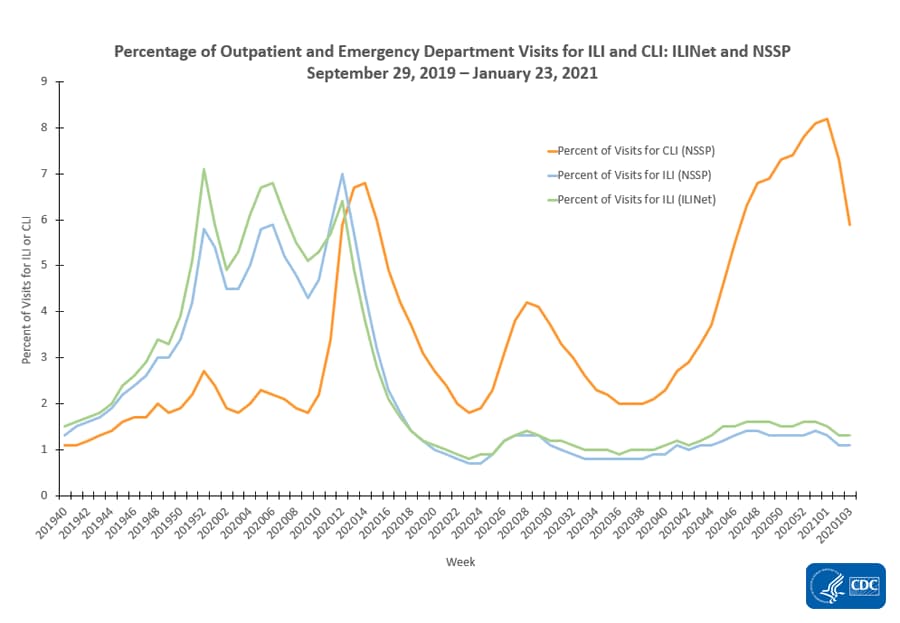
Nationally, the overall percentages of visits to outpatient providers or EDs for ILI and CLI remained stable (change of ≤0.1%) or declined slightly during week 51 compared with week 50. During week 51, the percentages of ED visits captured in NSSP for CLI and ILI were 6.6% and 1.3%, respectively. This represents a decrease in CLI and a stable (change of ≤0.1%) level of ILI compared with week 50. In ILINet, 1.5% of visits reported during week 51 were for ILI, also remaining stable (change of ≤0.1%) compared with week 50 and below the national baseline (2.4% for October 2019 through September 2020; 2.6% since October 2020) for the 36[SUP]th[/SUP] consecutive week. This level of ILI is lower than is typical for ILINet during this time of year.
outpatient-emergency-visits.gif

resize iconView LargerView Data Table


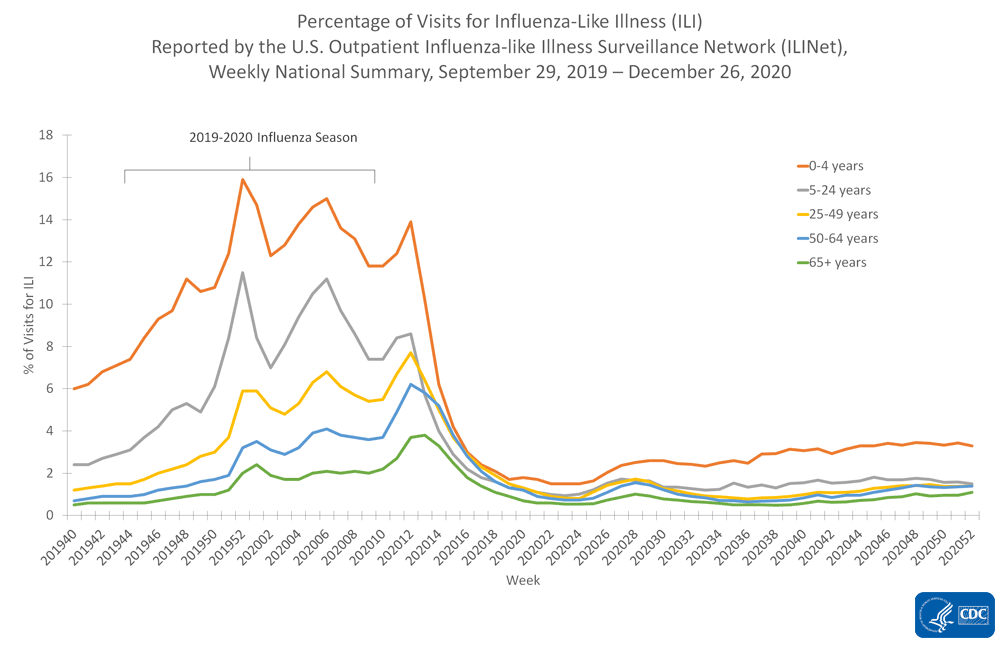
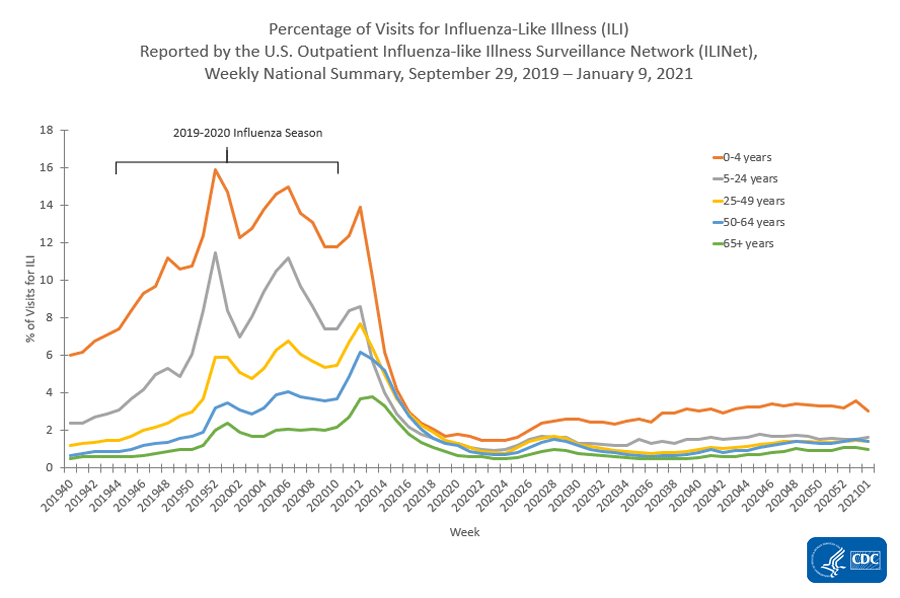
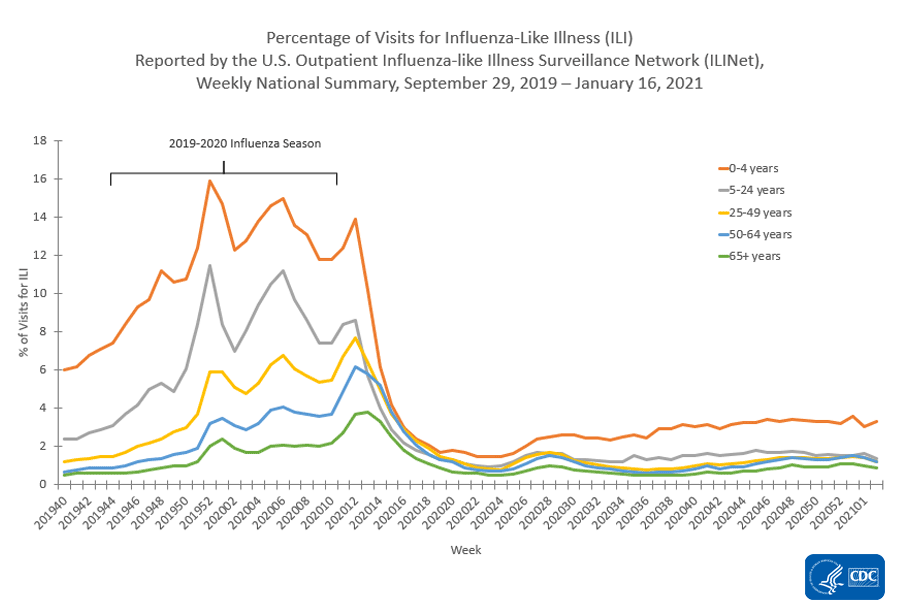
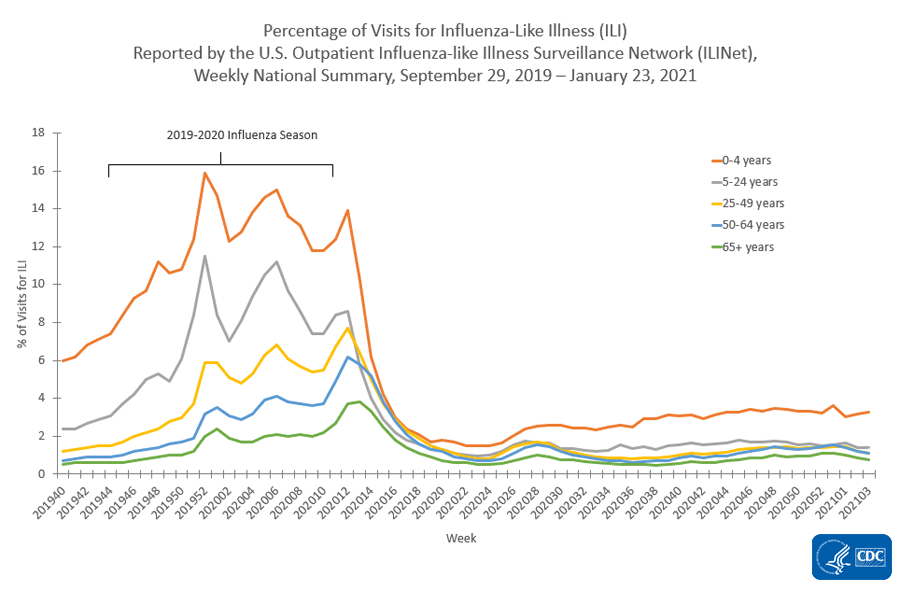
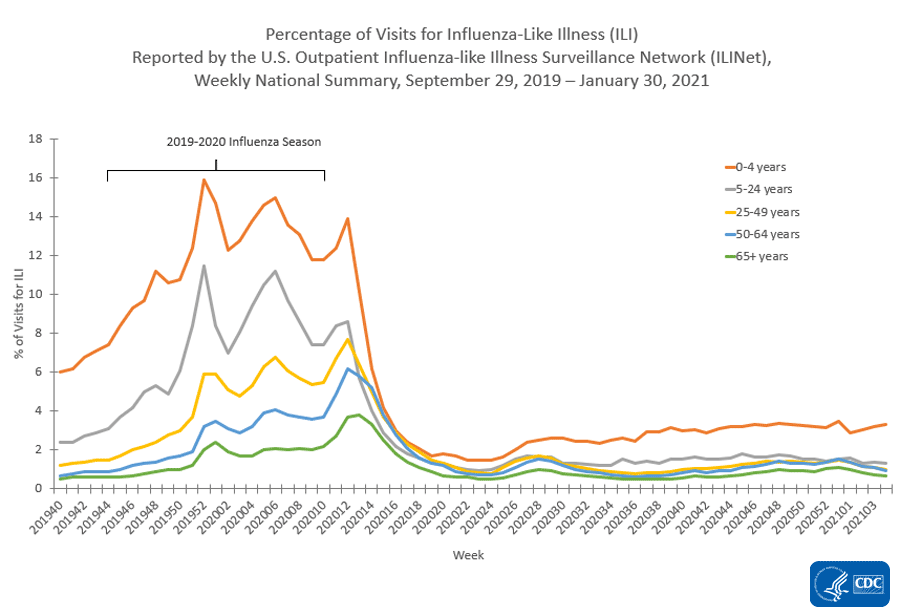
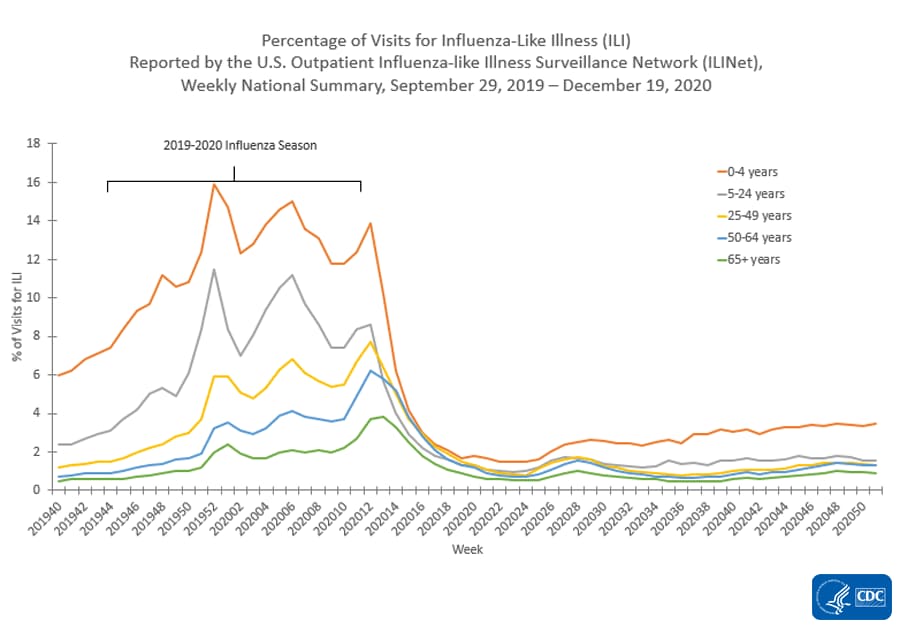
The percentages of visits for ILI reported in ILINet increased slightly in week 51 compared with week 50 for those aged 0–4 years and remained stable (change of ≤0.1%) for the remaining age groups (5–24 years, 25–49 years, 50–64 years, 65 years and older.
resize iconView LargerView Data Table


On a regional levelexternal icon, Region 2 (New Jersey/New York/Puerto Rico) reported an increase in at least one indicator of mild to moderate illness (CLI and/or ILI) during week 51 compared with week 50. The remaining nine regions reported a decreasing or stable (change of ≤0.1%) level of mild to moderate illness. The percentage of visits for ILI to ILINet providers remained below the region-specific baseline in all regions.

ILI Activity Levels

Data collected in ILINet are used to produce a measure of ILI activity for all 50 states, Puerto Rico, the U.S. Virgin Islands, the District of Columbia, New York City and for each core-based statistical area (CBSA) where at least one provider is located. The mean reported percentage of visits due to ILI for the current week is compared with the mean reported during non-influenza weeks, and the activity levels correspond to the number of standard deviations below, at, or above the mean.

The number of jurisdictions at each activity level during week 51 and the previous week are summarized in the table below.
Activity Level
Week 51 (Week ending Dec. 19, 2020)Week 50 (Week ending Dec. 12, 2020)Week 51 (Week ending Dec. 19, 2020)Week 50 (Week ending Dec. 12, 2020)
Very High0000
High0063
Moderate01610
Low005144
Minimal5453531578
Insufficient Data11335294

[TD="colspan: 2"] Number of Jurisdictions [/TD]
[TD="colspan: 2"] Number of CBSAs [/TD]

*Note: Data collected in ILINet may disproportionally represent certain populations within a state and may not accurately depict the full picture of respiratory disease activity for the whole state. Differences in the data presented here by CDC and independently by some state health departments likely represent differing levels of data completeness with data presented by the state likely being the more complete.

Additional information about medically attended outpatient and emergency department visits for ILI and CLI: Surveillance Methods

Hospitalizations


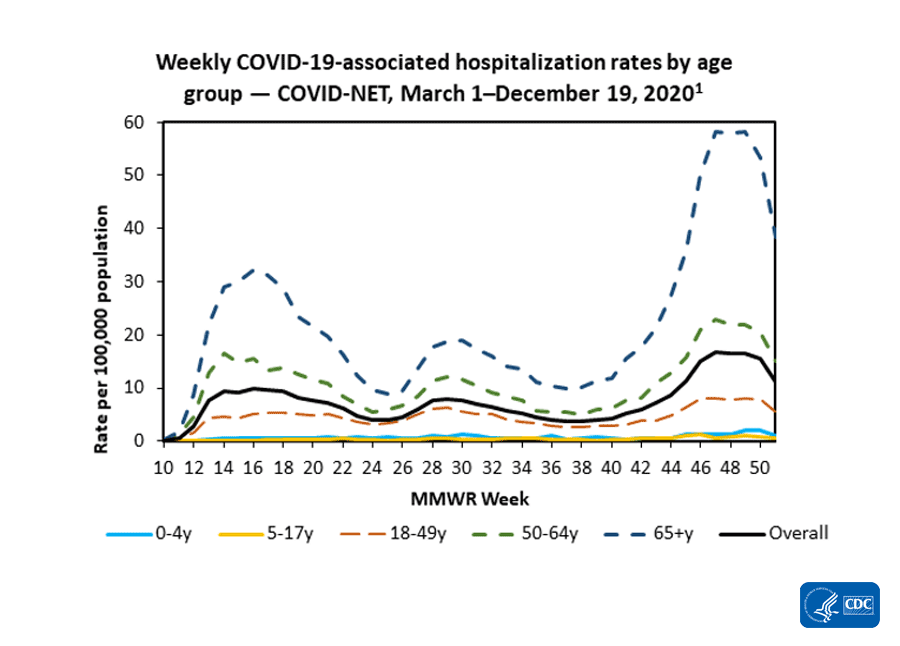
The COVID-19-Associated Hospitalization Surveillance Network (COVID-NET) conducts population-based surveillance for laboratory-confirmed COVID-19-associated hospitalizations in select counties participating in the Emerging Infections Program (EIP) and the Influenza Hospitalization Surveillance Project (IHSP).

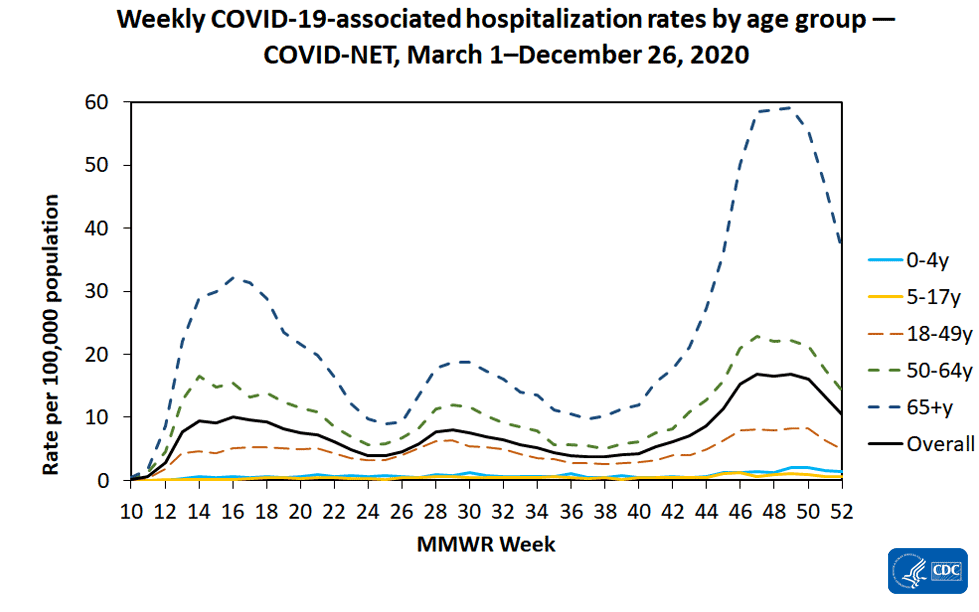
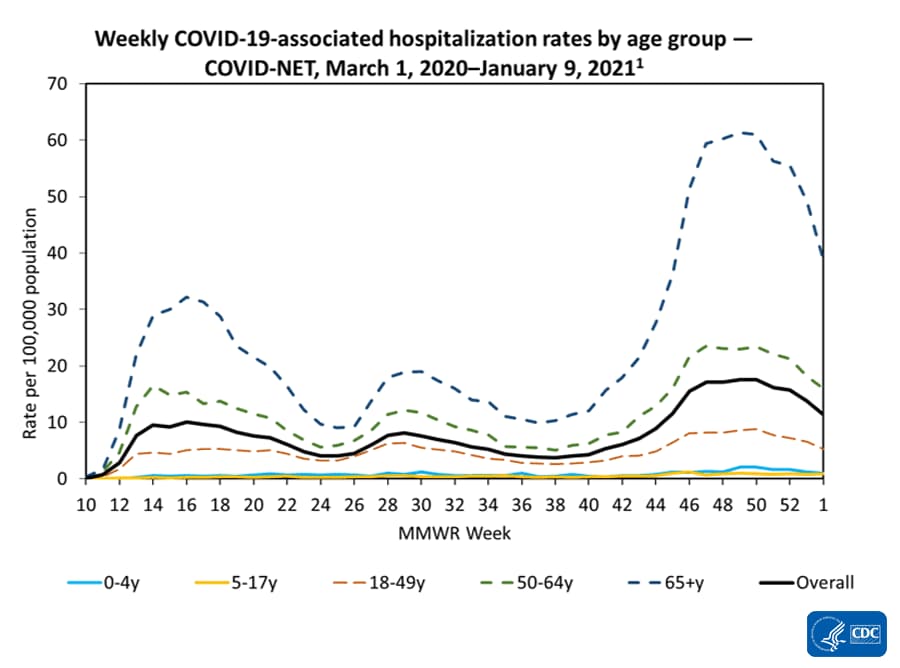
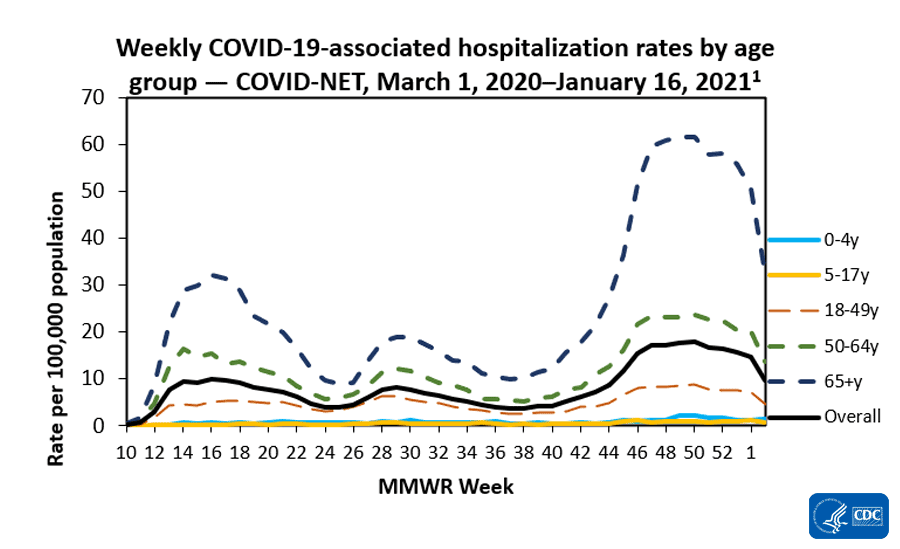
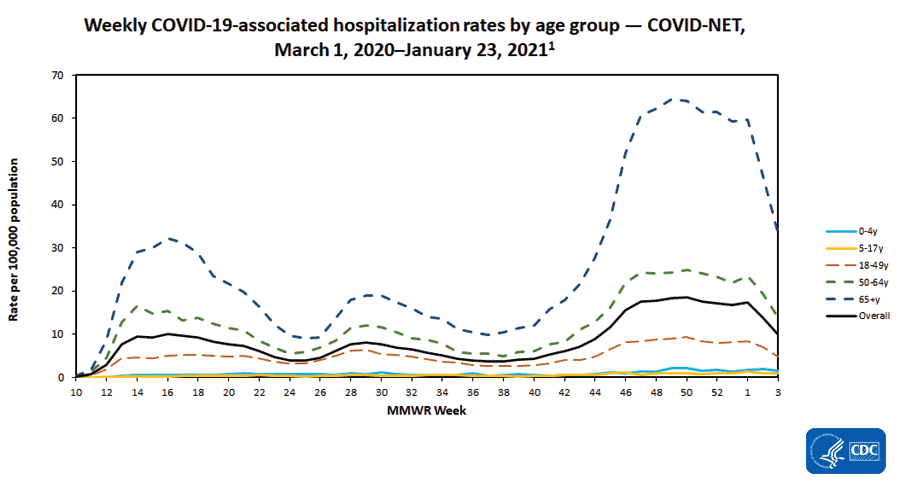
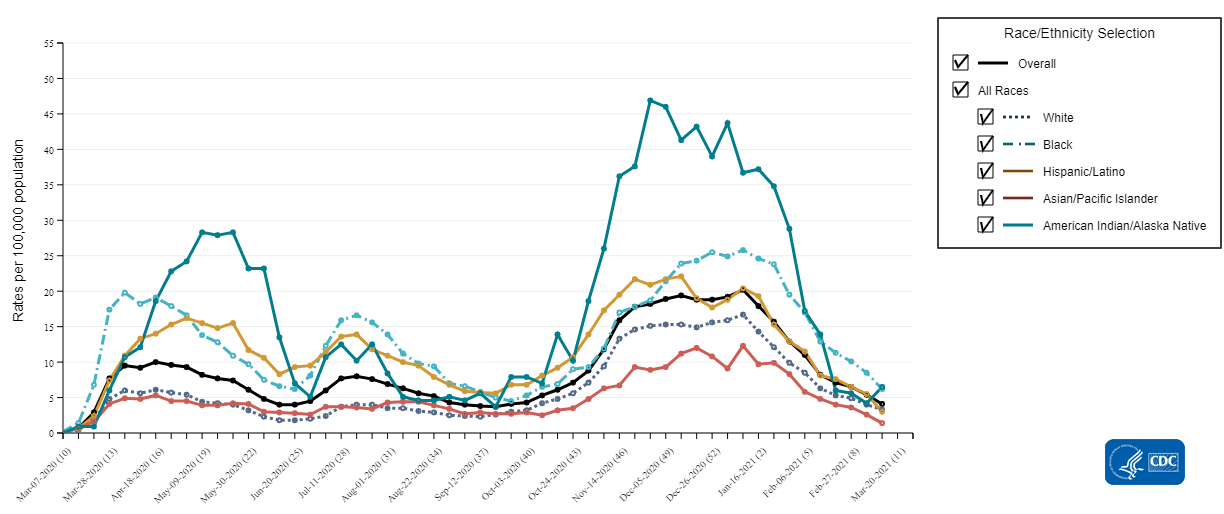
A total of 102,132 laboratory-confirmed COVID-19-associated hospitalizations were reported by sites between March 1, 2020, and December 19, 2020. The overall cumulative hospitalization rate was 313.3 per 100,000 population. Overall weekly hospitalization rates reached their highest point at 16.7 per 100,000 during the week ending November 21, 2020 (MMWR Week 47) and have remained elevated but stable since that time. Hospitalization rates for the most recent weeks are likely to change as additional data are reported for those weeks.
lab-confirmed-hospitalizations-weekly.gif

resize iconView Larger


[SUP]1[/SUP]Additional hospitalization rate data by age group are available.

Among the 102,132 laboratory-confirmed COVID-19-associated hospitalizations, 99,797 (97.7%) had information on race and ethnicity, while collection of race and ethnicity was still pending for 2,335 (2.3%) cases. When examining overall cumulative age-adjusted rates by race and ethnicity, the rate for Hispanic or Latino persons, non-Hispanic American Indian or Alaska Native persons, and non-Hispanic Black persons were approximately 3.6, 3.5, and 3.1 times the rate among non-Hispanic White persons, respectively.


When examining age-stratified crude cumulative hospitalization rates by race and ethnicity, compared with non-Hispanic White persons in the same age group, hospitalization rates were 4.8 times higher among Hispanic or Latino persons aged 0–17 years; 6.3 times higher among non-Hispanic American Indian or Alaska Native persons aged 18–49 years; 4.4 times higher among both non-Hispanic American Indian or Alaska Native and Hispanic or Latino persons aged 50–64 years; and 2.5 times higher among non-Hispanic Black persons aged ≥ 65 years.

29.23.231.53.542.94.713.41.59.11.0
463.46.2304.44.1442.15.9102.31.475.11.0
1042.24.4864.73.61035.54.3305.41.3238.71.0
1497.22.11700.22.41630.52.3652.90.9705.01.0
636.13.5563.73.1644.23.5202.51.1183.61.0
[SUP]1[/SUP]COVID-19-associated hospitalization rates by race and ethnicity are calculated using COVID-NET hospitalizations with known race and ethnicity for the numerator and NCHS bridged-race population estimates for the denominator.
[SUP]2[/SUP] For each age category, rate ratios are the ratios between crude hospitalization rates within each racial and ethnic group and the crude hospitalization rate among non-Hispanic White persons in the same age category.
[SUP]3[/SUP] The highest rate ratio in each age category is presented in bold.
[SUP]4[/SUP] Overall rates are adjusted to account for differences in age distributions within race and ethnicity strata in the COVID-NET catchment area; the age strata used for the adjustment include 0–17, 18–49, 50–64, 65-74, 75-84 and 85+ years.

Non-Hispanic White persons and non-Hispanic Black persons represented the highest proportions of hospitalizations reported to COVID-NET, followed by Hispanic or Latino, non-Hispanic Asian or Pacific Islander, and non-Hispanic American Indian or Alaska Native persons. However, some racial and ethnic groups are disproportionately represented among hospitalizations compared with the overall population of the catchment area. Prevalence ratios were highest among non-Hispanic American Indian or Alaska Native persons, followed by non-Hispanic Black persons and Hispanic or Latino persons.
1.2%27.7%21.1%5.1%39.2%
0.7%17.9%14.1%8.9%58.5%
1.71.51.50.60.7
[SUP]1[/SUP]Persons of multiple races (0.3%) or unknown race and ethnicity (5.5%) are not represented in the table but are included as part of the denominator.
[SUP]2[/SUP] Prevalence ratio is calculated as the ratio of the proportion of COVID-NET hospitalizations over the proportion of population in COVID-NET catchment area.

For underlying medical conditions, data were restricted to cases reported during March 1–September 30, 2020, due to delays in reporting. During this time frame, sampling was conducted among hospitalized adults; therefore, weighted percentages are reported. No sampling was conducted among hospitalized children. Among 15,128 sampled adults hospitalized during March 1–September 30 with information on underlying medical conditions, 90.0% had at least one reported underlying medical condition. The most reported underlying medical conditions were hypertension (56.5%), obesity (48.2%), metabolic disease (42.3%), and cardiovascular disease (32.7%). Among 787 children hospitalized during March 1–September 30 with information on underlying medical conditions, 50.8% had at least one reported underlying medical condition. The most reported underlying medical conditions were obesity (37.8%), neurologic disease (12.9%), and asthma (10.7%).

Additional data on demographics, signs and symptoms at admission, underlying medical conditions, interventions, outcomes, and discharge diagnoses, stratified by age, sex, and race and ethnicity, are available.

Additional hospitalization surveillance information:
Surveillance Methods | Additional rate data | Additional demographic and clinical data


Mortality Surveillance


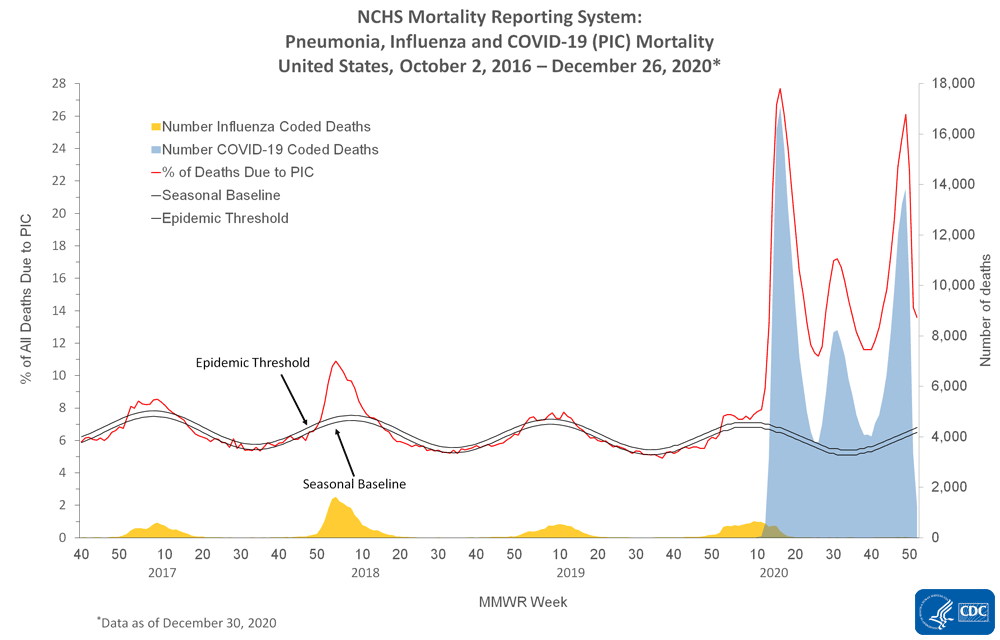
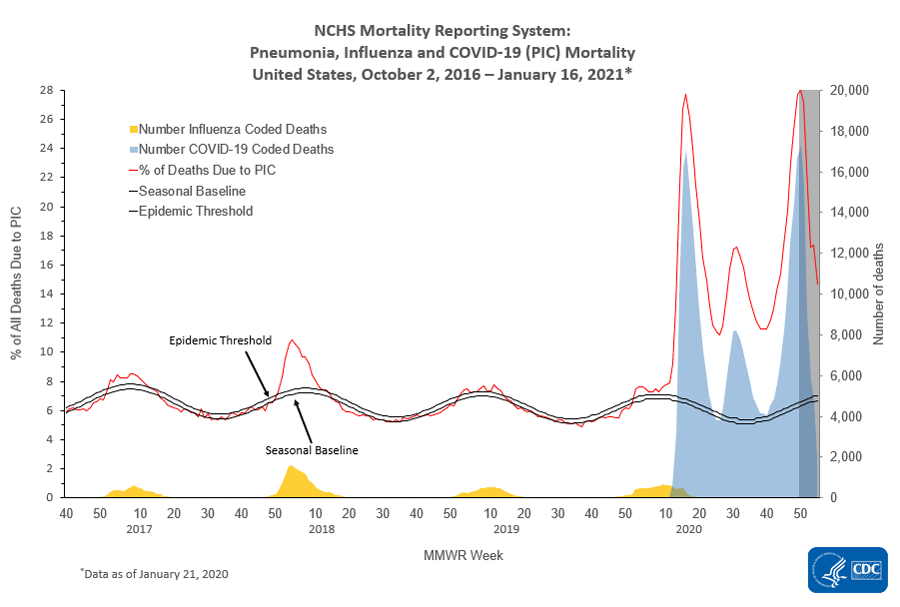
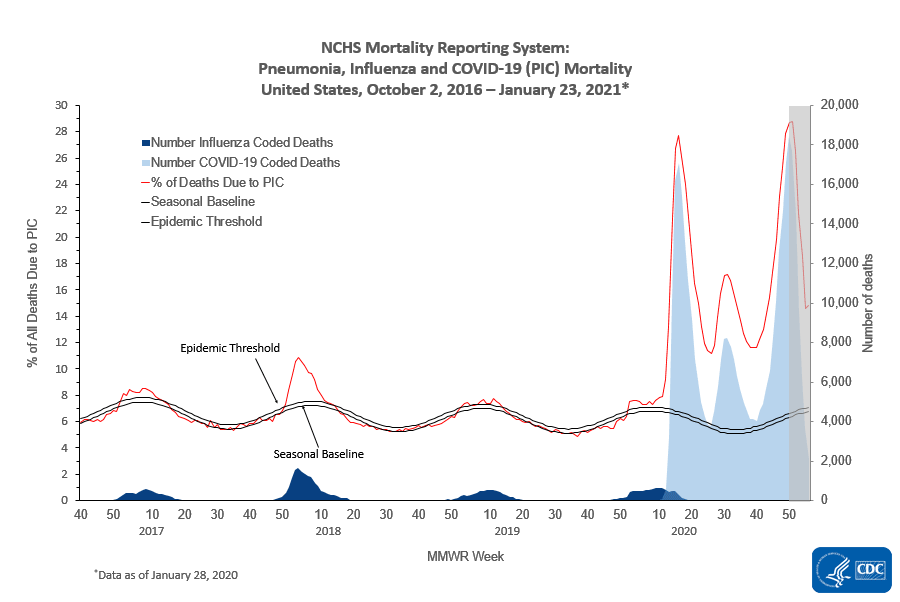
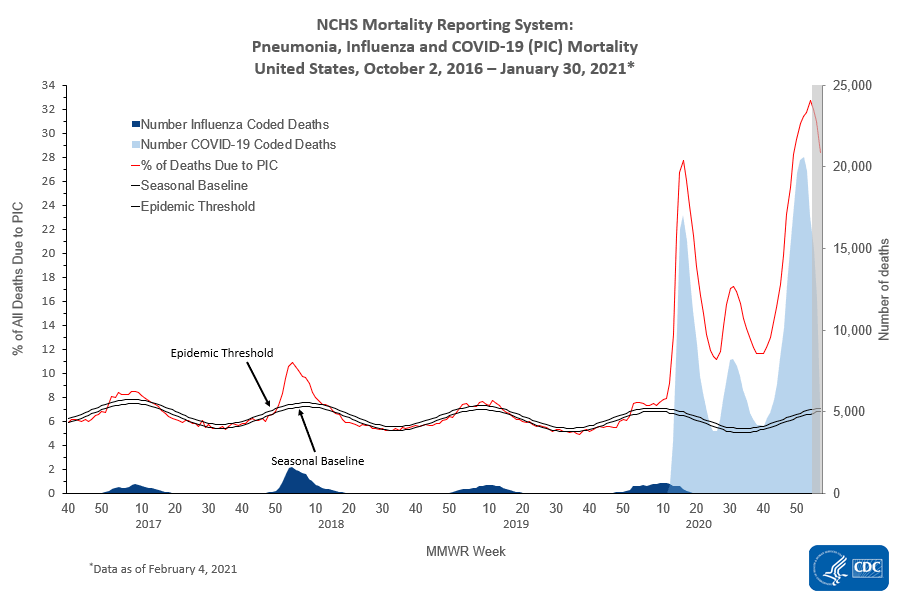
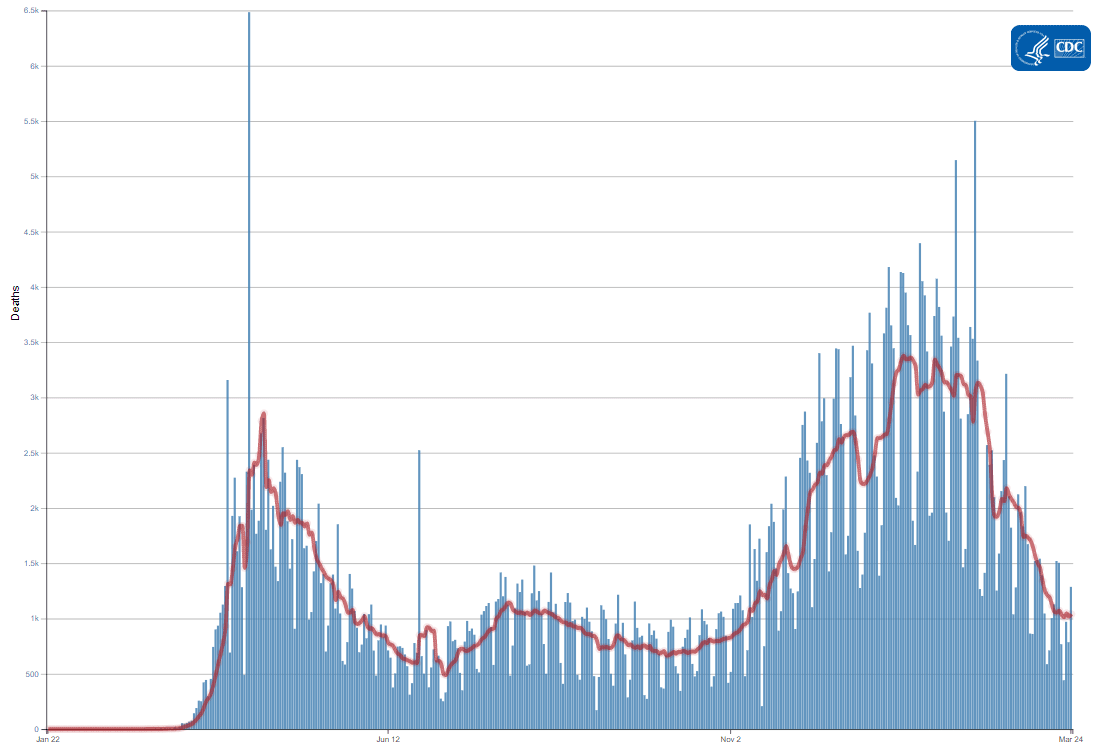
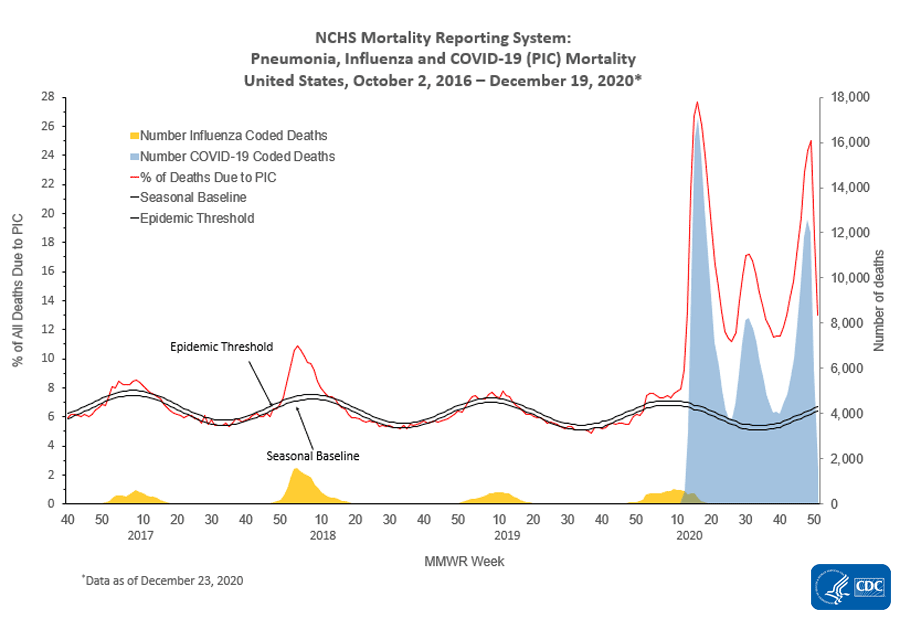
The National Center for Health Statistics (NCHS) collects death certificate data from vital statistics offices for all deaths occurring in the United States. Based on death certificate data available on December 23, 2020, the percentage of deaths attributed to pneumonia, influenza, or COVID-19 (PIC) for week 51 was 13.0% and, while it declined compared with the percentage during week 50 (18.5%), it remains above the epidemic threshold of 6.7% and is expected to increase as more death certificates are processed. Among the 2,308 PIC deaths reported for week 51, 1,524 had COVID-19 listed as an underlying or contributing cause of death on the death certificate and four listed influenza, indicating that the current increase in PIC mortality is due primarily to COVID-19 and not influenza.

The weekly percentage of deaths due to PIC increased for nine weeks from early October through the beginning of December to a level that is higher than the July peak. Data for the most recent two weeks currently show a decline, but percentages for recent weeks will likely increase as more death certificates are processed. Weekly mortality surveillance data include a combination of machine-coded and manually coded causes of death collected from death certificates. The percentage of deaths due to PIC is higher among manually coded records than more rapidly available machine-coded records. Due to the additional time needed for manual coding, the initially reported PIC percentages may be lower than percentages calculated from final data.
nchs-mortality-report.gif

resize iconView Larger


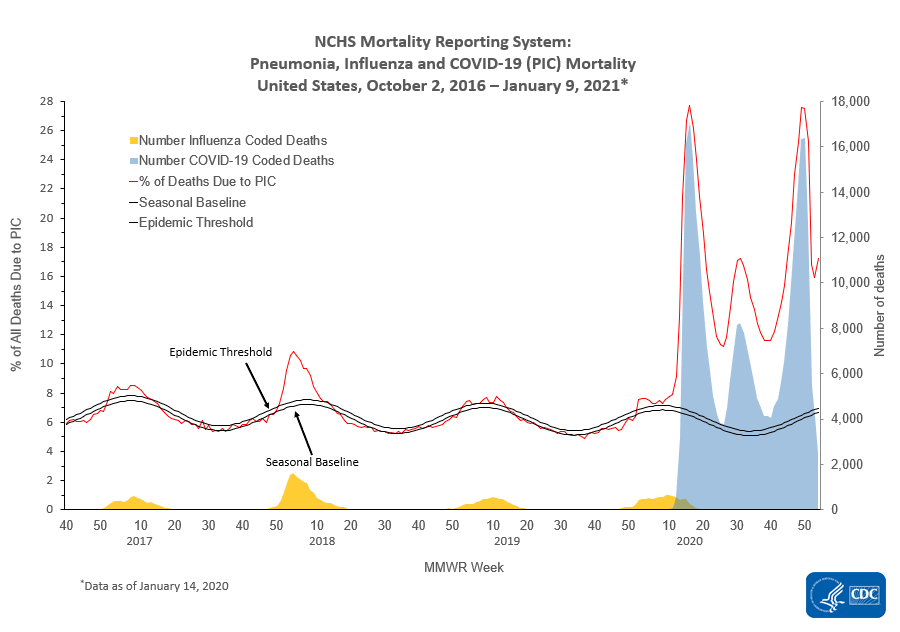
*Data during recent weeks are incomplete because of the lag in time between when the death occurred and when the death certificate is completed, submitted to NCHS and processed for reporting purposes. It is possible that a death certificate includes both influenza and COVID as a cause of death; therefore, the number of influenza and COVID coded deaths may not be mutually exclusive.
View Data Table


Additional NCHS mortality surveillance information: Surveillance Methods | Provisional Death Counts for COVID-19
More Information
View Page In:pdf icon 878 KB, 11 pages
Last Updated Dec. 28, 2020
 
COVIDView.jpg
  1. CASES, DATA & SURVEILLANCE
COVIDView Summary ending December 26, 2020


Updated Jan. 4, 2021
Print
Download Weekly Summary pdf icon[918 KB, 10 pages]
Key Updates for Week 52, ending December 26, 2020

Nationally, surveillance indicators tracking levels of SARS-CoV-2 circulation and associated illnesses declined or remained stable during the week ending December 26, 2020; however, there were regional differences. The percentage of deaths due to pneumonia, influenza and COVID-19 (PIC) has been increasing since early October. Both COVID-19-associated hospitalizations and PIC mortality for the most recent weeks are expected to increase as more data are received.

national-activity-indicators.gif

Download Chart Data excel icon[XLS – 2 KB]
Virus: Public Health, Commercial and Clinical Laboratories


Nationally, the overall percentage of respiratory specimens testing positive for SARS-CoV-2, the virus causing COVID-19, decreased slightly from 12.4% during week 51 to 12.3% during week 52. Percent positivity increased among two age groups (0–4 years and 5–17 years). Regionally, the percentage of respiratory specimens testing positive for SARS-CoV-2 increased in five of the ten Health and Human Services (HHS) regionsexternal icon.
Mild/Moderate Illness: Outpatient and Emergency Department Visits


Nationally, the percentage of visits to outpatient providers or emergency departments (EDs) for COVID-like illness (CLI) and influenza-like illness (ILI) remained stable (change of ≤0.1%) during week 52 compared with week 51. Three of ten surveillance regions reported an increase in at least one indicator of mild/moderate illness (CLI and ILI) this week while the remaining regions reported a stable or declining level of mild/moderate illness.
Severe Disease: Hospitalizations and Deaths


In early December, the overall weekly hospitalization rate reached its highest point since the beginning of the pandemic and remains elevated. Rates in recent weeks have declined but these rates are likely to change as additional data are reported. Based on death certificate data, the percentage of deaths attributed to PIC for week 52 was 13.6% and remains above the epidemic threshold. The percentage of deaths due to PIC increased during October through early December and is expected to increase for the most recent weeks as additional data are reported.

All data are preliminary and may change as more reports are received. A description of the surveillance systems summarized in COVIDView, including methodology and detailed descriptions of each data component, is available on the surveillance methods page.
Key Points
  • Nationally, surveillance indicators tracking levels of SARS-CoV-2 circulation and associated illnesses declined or remained stable during week 52 compared with week 51; however, there were regional differences.
    • Five regions (Regions 2 [New Jersey/New York/Puerto Rico], 3 [Mid-Atlantic], 4 [Southeast], 6 [South Central] and 7 [Central]) reported an increase in percentage of specimens testing positive for SARS-CoV-2 duriong week 52 compared with week 51.
    • Three regions (Regions 2 [New Jersey/New York/Puerto Rico], 4 [Southeast] and 6 [South Central]) reported an increase in at least one indicator of mild/moderate respiratory illness during week 52 compared with week 51. These three regions and Region 9 [South/West Central] have also reported an increasing trend in the percentage of visits for CLI and/or ILI since October. The remaining six regions have reported a stable or declining trend in the percentage of visits for CLI and ILI.
  • The overall cumulative COVID-19-associated hospitalization rate through the week ending December 26, 2020, was 326.7 hospitalizations per 100,000 population.
    • Overall weekly hospitalization rates reached their highest point at 16.9 per 100,000 during week ending December 5, 2020 (MMWR Week 49) and remain elevated. Rates in recent weeks have declined but these rates are likely to change as additional data are reported.
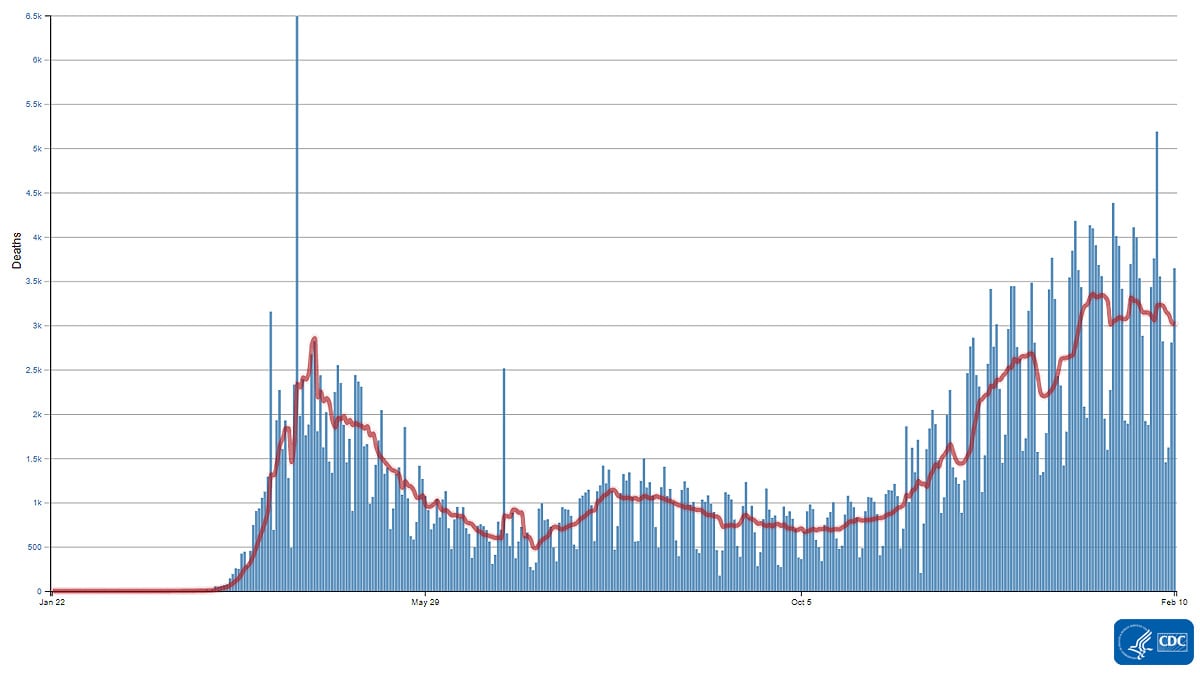
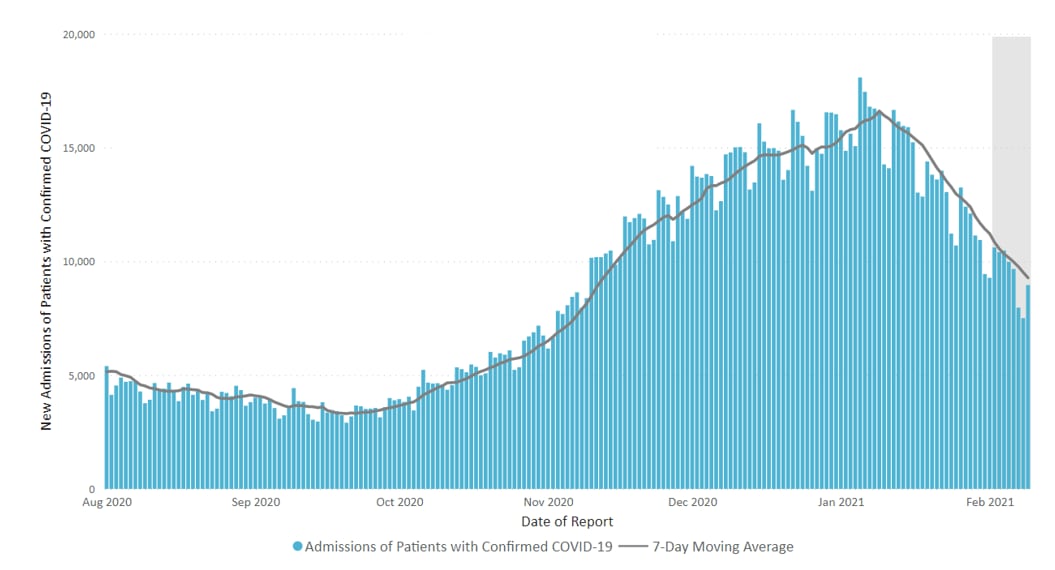
    • The cumulative age-adjusted hospitalization rate for both Hispanic or Latino persons and non-Hispanic American Indian or Alaska Native persons was 3.5 times that of non-Hispanic White persons, and the rate for non-Hispanic Black persons was approximately 3.1 times that of non-Hispanic White persons.
  • The percentage of deaths due to PIC has been increasing since the beginning of October and has exceeded the percentage of deaths due to PIC observed during the summer peak.
    • Data for the most recent three weeks currently show a decline, but that is likely to change as additional death certificates are processed. Due to the large number of deaths reported in recent weeks and the holidays, the change in recent weeks may be larger than usual.
  • Estimates from previous weeks are subject to change as data are updated with the most complete data available.
U.S. Virologic Surveillance


Based on data reported to CDC by public health laboratories and a subset of clinical and commercial laboratories in the United States, 97,827,956 specimens were tested for SARS-CoV-2 using a molecular assay since March 1, 2020. The percentage of specimens testing positive for SARS-CoV-2 each week, based on week of specimen collection, are summarized below.

Nationally, during week 52, of 2,133,153 specimens tested for SARS-CoV-2 for diagnostic purposes, 263,316 (12.3%) were positive. This is a decrease compared with week 51, during which 12.4% of specimens tested were positive. The percentage of specimens testing positive increased among persons 0–4 years and 5–17 years but decreased among all other age groups (18-49 years, 50-64 years, and 65+ years).

specimens-tested.gif


*Note: Different laboratory types came on board with testing during different weeks. This graph includes public health laboratory data beginning in week 10, clinical laboratory data beginning in week 11, and commercial laboratory data beginning in week 14.
View Data Table


The percentage of specimens testing positive for SARS-CoV-2 increased in five regions (Region 2 [New Jersey/New York/Puerto Rico], Region 3 [Mid-Atlantic], Region 4 [Southeast], Region 6 [South Central] and Region 7 [Central]) during week 52 compared with week 51. The remaining five regions reported a decrease in the percentage of specimens testing positive.

Additional virologic surveillance information: Surveillance Methods


Outpatient/Emergency Department Illness


Two syndromic surveillance systems, the U.S. Outpatient Influenza-like Illness Surveillance Network (ILINet) and the National Syndromic Surveillance Project (NSSP), are being used to monitor trends in outpatient and emergency department (ED) visits that may be associated with COVID-19 illness. Each system monitors activity in a slightly different set of providers/facilities and uses a slightly different set of symptoms that may be associated with SARS-CoV-2 virus infection. ILINet provides information about visits to outpatient providers or emergency departments for influenza-like illness (ILI; fever plus cough and/or sore throat) and NSSP provides information about visits to EDs for ILI and COVID-like illness (CLI; fever plus cough and/or shortness of breath or difficulty breathing). Some EDs contribute ILI data to both ILINet and NSSP. Both systems are currently being affected by changes in health care seeking behavior, including increased use of telemedicine and increased social distancing. These changes affect the numbers of people seeking care in the outpatient and ED settings and their reasons for doing so. Syndromic data, including CLI and ILI, should be interpreted with caution and should be evaluated in combination with other sources of surveillance data, especially laboratory testing results, to obtain a complete and accurate picture of respiratory illness.

Nationally, the overall percentages of visits to outpatient providers or EDs for ILI and CLI remained stable (change of ≤0.1%) during week 52 compared with week 51. During week 52, the percentages of ED visits captured in NSSP for CLI and ILI were 7.1% and 1.3%, respectively. In ILINet, 1.6% of visits reported during week 52 were for ILI, also remaining stable (change of ≤0.1%) compared with week 51 and below the national baseline (2.4% for October 2019 through September 2020; 2.6% since October 2020) for the 37[SUP]th[/SUP] consecutive week. This level of ILI is lower than is typical for ILINet during this time of year.
outpatient-emergency-visits.gif

resize iconView LargerView Data Table


The percentages of visits for ILI reported in ILINet in week 52 remained stable (change of ≤0.1%) compared with week 51 for all age groups (0–4 years, 5–24 years, 25–49 years, 50–64 years, 65 years and older). During the past four weeks, the percentage of visits for ILI decreased slightly among those 5–24 years and increased slightly among those 65 years and older.
percent-ili-visits-by-age.gif

resize iconView LargerView Data Table


On a regional levelexternal icon, three regions (Region 2 [New Jersey/New York/Puerto Rico], Region 4 [Southeast], Region 6 [South Central]) reported an increase in at least one indicator of mild to moderate illness (CLI and/or ILI) during week 52 compared with week 51; the remaining seven regions reported a stable (change of ≤0.1%) or decreasing level of mild to moderate illness. The percentage of visits for ILI to ILINet providers remained below the region-specific baseline in all regions.

ILI Activity Levels

Data collected in ILINet are used to produce a measure of ILI activity for all 50 states, Puerto Rico, the U.S. Virgin Islands, the District of Columbia, New York City and for each core-based statistical area (CBSA) where at least one provider is located. The mean reported percentage of visits due to ILI for the current week is compared with the mean reported during non-influenza weeks, and the activity levels correspond to the number of standard deviations below, at, or above the mean.

The number of jurisdictions at each activity level during week 52 and the previous week are summarized in the table below.
Activity Level
Week 52 (Week ending Dec. 26, 2020)Week 51 (Week ending Dec. 19, 2020)Week 52 (Week ending Dec. 26, 2020)Week 51 (Week ending Dec. 19, 2020)
Very High0001
High0035
Moderate1198
Low204950
Minimal4954531554
Insufficient Data30337311

[TD="colspan: 2"] Number of Jurisdictions [/TD]
[TD="colspan: 2"] Number of CBSAs [/TD]

*Note: Data collected in ILINet may disproportionally represent certain populations within a state and may not accurately depict the full picture of respiratory disease activity for the whole state. Differences in the data presented here by CDC and independently by some state health departments likely represent differing levels of data completeness with data presented by the state likely being the more complete.

Additional information about medically attended outpatient and emergency department visits for ILI and CLI: Surveillance Methods

Hospitalizations


The COVID-19-Associated Hospitalization Surveillance Network (COVID-NET) conducts population-based surveillance for laboratory-confirmed COVID-19-associated hospitalizations in select counties participating in the Emerging Infections Program (EIP) and the Influenza Hospitalization Surveillance Project (IHSP).

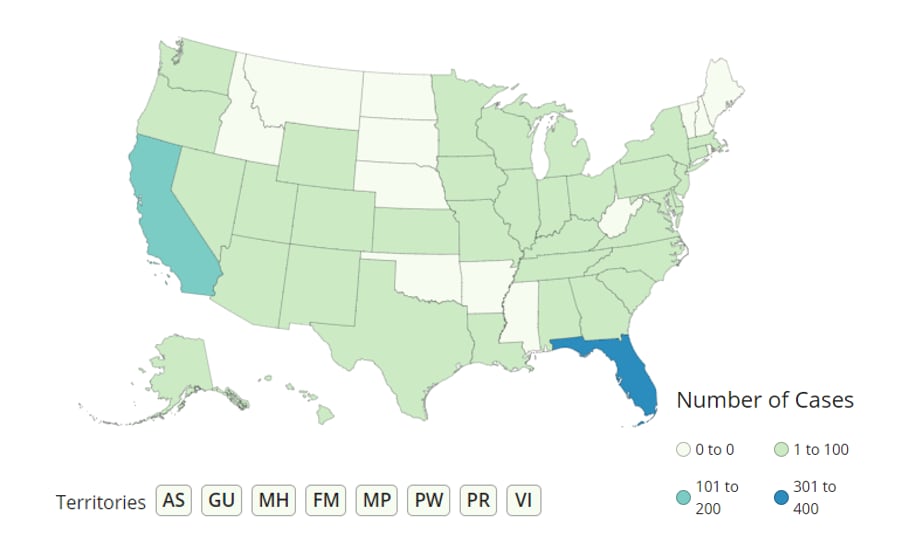
A total of 106,532 laboratory-confirmed COVID-19-associated hospitalizations were reported by sites between March 1, 2020 and December 26, 2020. The overall cumulative hospitalization rate was 326.7 per 100,000 population. The overall weekly hospitalization rate reached its highest point at 16.9 per 100,000 during the week ending December 5, 2020 (Week 49) and remains elevated. Rates in recent weeks have declined but these rates are likely to change as additional data are reported for those weeks.
lab-confirmed-hospitalizations-weekly.gif

resize iconView Larger


[SUP]1[/SUP]Additional hospitalization rate data by age group are available.

Among the 106,532 laboratory-confirmed COVID-19-associated hospitalizations, 103,104 (96.8%) had information on race and ethnicity, while collection of race and ethnicity was still pending for 3,428 (3.2%) cases. When examining overall cumulative age-adjusted rates by race and ethnicity, the rate for both Hispanic or Latino persons and non-Hispanic American Indian or Alaska Native persons was 3.5 times that of non-Hispanic White persons, and the rate for non-Hispanic Black persons was approximately 3.1 times that of non-Hispanic White persons.


When examining age-stratified crude hospitalization rates by race and ethnicity, compared with non-Hispanic White persons in the same age group, crude hospitalization rates were 4.7 times higher among Hispanic or Latino persons aged 0–17 years; 6.2 times higher among non-Hispanic American Indian or Alaska Native or Latino persons aged 18–49 years; 4.4 times higher among non-Hispanic American Indian or Alaska Native persons aged 50–64 years; and 2.4 times higher among non-Hispanic Black persons aged ≥ 65 years.

29.23.033.33.544.24.614.11.59.61.0
484.86.0321.44.0455.05.7106.51.380.41.0
1063.44.1916.13.61077.64.2320.51.2257.21.0
1564.52.11813.12.41715.42.3695.50.9760.71.0
660.13.3598.43.0670.83.4213.71.1197.71.0
[SUP]1[/SUP]COVID-19-associated hospitalization rates by race and ethnicity are calculated using COVID-NET hospitalizations with known race and ethnicity for the numerator and NCHS bridged-race population estimates for the denominator.
[SUP]2[/SUP] For each age category, rate ratios are the ratios between crude hospitalization rates within each racial and ethnic group and the crude hospitalization rate among non-Hispanic White persons in the same age category.
[SUP]3[/SUP] The highest rate ratio in each age category is presented in bold.
[SUP]4[/SUP] Overall rates are adjusted to account for differences in age distributions within race and ethnicity strata in the COVID-NET catchment area; the age strata used for the adjustment include 0–17, 18–49, 50–64, 65-74, 75-84 and 85+ years.

Non-Hispanic White persons and non-Hispanic Black persons represented the highest proportions of hospitalizations reported to COVID-NET, followed by Hispanic or Latino, non-Hispanic Asian or Pacific Islander, and non-Hispanic American Indian or Alaska Native persons. However, some racial and ethnic groups are disproportionately represented among hospitalizations compared with the overall population of the catchment area. Prevalence ratios were highest among non-Hispanic American Indian or Alaska Native persons, followed by non-Hispanic Black persons and Hispanic or Latino persons.
1.2%27.3%20.9%5.2%39.5%
0.7%17.9%14.1%8.9%58.5%
1.71.51.50.60.7
[SUP]1[/SUP]Persons of multiple races (0.3%) or unknown race and ethnicity (5.6%) are not represented in the table but are included as part of the denominator.
[SUP]2[/SUP] Prevalence ratio is calculated as the ratio of the proportion of COVID-NET hospitalizations over the proportion of population in COVID-NET catchment area.

For underlying medical conditions, data were restricted to cases reported during March 1–September 30, 2020, due to delays in reporting. During this time frame, sampling was conducted among hospitalized adults; therefore, weighted percentages are reported. No sampling was conducted among hospitalized children. Among 15,401 sampled adults hospitalized during March 1–September 30 with information on underlying medical conditions, 90.0% had at least one reported underlying medical condition. The most reported underlying medical conditions were hypertension (56.3%), obesity (48.2%), metabolic disease (42.0%), and cardiovascular disease (32.7%). Among 808 children hospitalized during March 1–September 30 with information on underlying medical conditions, 51.5% had at least one reported underlying medical condition. The most reported underlying medical conditions were obesity (38.4%), neurologic disease (12.9%), and asthma (10.9%).

Additional data on demographics, signs and symptoms at admission, underlying medical conditions, interventions, outcomes, and discharge diagnoses, stratified by age, sex, and race and ethnicity, are available.

Additional hospitalization surveillance information:
Surveillance Methods | Additional rate data | Additional demographic and clinical data


Mortality Surveillance


The National Center for Health Statistics (NCHS) collects death certificate data from vital statistics offices for all deaths occurring in the United States. Based on death certificate data available on December 30, 2020, the percentage of deaths attributed to pneumonia, influenza, or COVID-19 (PIC) for week 52 was 13.6% and, while it declined compared with the percentage during week 51 (14.2%), it remains above the epidemic threshold of 6.8% and is expected to increase as more death certificates are processed. Among the 1,848 PIC deaths reported for week 52, 1,215 had COVID-19 listed as an underlying or contributing cause of death on the death certificate and three listed influenza, indicating that the current increase in PIC mortality is due primarily to COVID-19 and not influenza.

The weekly percentage of deaths due to PIC increased for nine weeks from early October through the beginning of December to a level that is higher than the July peak. Data for the most recent three weeks currently show a decline, but percentages for recent weeks will likely increase as more death certificates are processed. Weekly mortality surveillance data include a combination of machine-coded and manually coded causes of death collected from death certificates. The percentage of deaths due to PIC is higher among manually coded records than more rapidly available machine-coded records. Due to the additional time needed for manual coding, the initially reported PIC percentages may be lower than percentages calculated from final data. Because of the large number of deaths reported in recent weeks and the holidays, the delay in availability of manually coded records may be longer than usual.
nchs-mortality-report.gif

resize iconView Larger


*Data during recent weeks are incomplete because of the lag in time between when the death occurred and when the death certificate is completed, submitted to NCHS and processed for reporting purposes. It is possible that a death certificate includes both influenza and COVID as a cause of death; therefore, the number of influenza and COVID coded deaths may not be mutually exclusive.
View Data Table


Additional NCHS mortality surveillance information: Surveillance Methods | Provisional Death Counts for COVID-19
More Information
View Page In:pdf icon 918 KB, 10 pages
Last Updated Jan. 4, 2021
 
COVIDView.jpg
  1. CASES, DATA & SURVEILLANCE
COVIDView: A Weekly Surveillance Summary of U.S. COVID-19 Activity


Updated Jan. 15, 2021
Print
Download Weekly Summary pdf icon[962 KB, 10 Pages]
Key Updates for Week 1, ending January 9, 2021


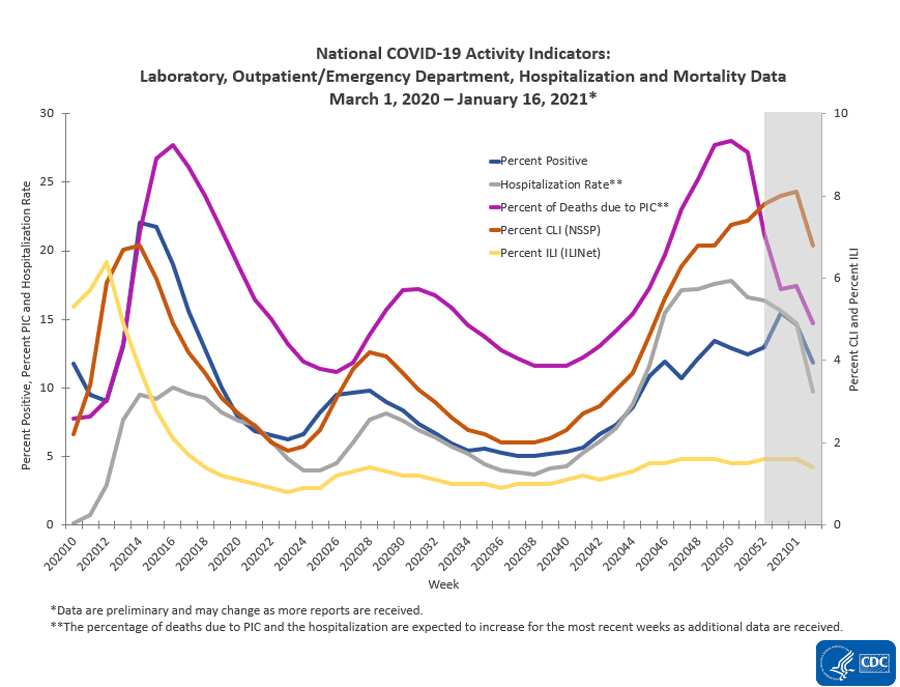
Nationally, surveillance indicators tracking levels of SARS-CoV-2 circulation, associated illnesses, and hospitalizations decreased or remained stable but elevated during the week ending January 9, 2021. The percentage of deaths due to pneumonia, influenza and COVID-19 (PIC) increased during the most recent week after declining for three weeks. Recent declines in hospitalization rates and PIC mortality should be interpreted with caution as reporting delays increased during the holidays and the downward trends may change as more data are received.

national-activity-indicators.gif

Download Chart Data excel icon[CSV – 2 KB]
Virus: Public Health, Commercial and Clinical Laboratories


Nationally, the overall percentage of respiratory specimens testing positive for SARS-CoV-2, the virus causing COVID-19, decreased from 15.4% during week 53 to 14.5% during week 1. Percent positivity decreased among all age groups and in nine of ten Health and Human Services (HHS) regionsexternal icon.
Mild/Moderate Illness: Outpatient and Emergency Department Visits


Nationally, the percentage of visits to outpatient providers or emergency departments (EDs) decreased for COVID-like illness (CLI) or remained stable (change of ≤0.1%) for influenza-like illness (ILI) during week 1 compared with week 53. Two of ten surveillance regions reported an increase in at least one indicator of mild/moderate illness (CLI/ILI) this week while eight regions reported a stable (change of ≤0.1%) or decreasing level of mild/moderate illness.
Severe Disease: Hospitalizations and Deaths


In December, the overall weekly hospitalization rate reached its highest point since the beginning of the pandemic and remains elevated. Although reported rates in recent weeks have declined, these rates are likely to increase as additional data are reported. Based on death certificate data, the percentage of deaths attributed to pneumonia, influenza or COVID-19 (PIC) for week 1 was 17.2% and it remains above the epidemic threshold. Longer delays in reporting of hospitalization and mortality data may occur due to the holidays.

All data are preliminary and may change as more reports are received. A description of the surveillance systems summarized in COVIDView, including methodology and detailed descriptions of each data component, is available on the surveillance methods page.
Key Points
  • Holidays during weeks 52 and 53 and increases in the number of COVID-19 illnesses have affected data reporting and health care seeking behavior in multiple ways; therefore, data from recent weeks should be interpreted with caution because they may change more than usual as additional data for those weeks are received.
  • Nationally, the overall percentage of respiratory specimens testing positive for SARS-CoV-2 decreased during week 1 (14.5%) compared with week 53 (15.4%). Percent positivity decreased in nine of ten HHS surveillance regions.
    • For Region 1 (New England), percent positivity has increased for the most recent two weeks.
    • Eight regions (Region 2 [New Jersey/New York/Puerto Rico], Region 3 [Mid-Atlantic], Region 4 [Southeast], Region 6 [South Central], Region 7 [Central], Region 8 [Midwest], Region 9 [South/West Coast], and Region 10 [Pacific Northwest]) had shown increasing trends in percent positivity for two or more weeks until seeing a decline during week 1 compared with week 53.
    • Region 5 (Midwest) had a decreasing trend in percent positivity from mid-November through late December and has reported fluctuations in percent positivity during the past two weeks.
  • Surveillance indicators of mild to moderate illness at the national level declined for CLI and remained stable (change of ≤ 0.1%) for ILI during week 1 compared to week 53 but had shown increasing trends from late September 2020 through early January 2021.
  • The overall cumulative COVID-19-associated hospitalization rate through the week ending January 9, 2021 was 364.3 hospitalizations per 100,000 population.
    • The overall weekly hospitalization rate reached its highest point at 17.6 per 100,000 during the week ending December 12, 2020 (Week 50), and it remains elevated. Although reported rates in recent weeks have declined, these rates are likely to increase as additional data are reported. Longer delays in data reporting may occur due to the holidays.
    • When examining age-adjusted hospitalization rates by race and ethnicity, compared with non-Hispanic White persons, hospitalization rates were 3.3 times higher among Hispanic or Latino persons and Non-Hispanic American Indian or Alaska Native persons and 3.0 times higher among non-Hispanic Black persons.
  • The percentage of deaths due to PIC increased from the beginning of October through early December (27.6%), when it exceeded the percentage of deaths due to PIC observed during the summer peak (17.2%) and approached the peak seen in April (27.7%).
    • Nationally, the percentage of deaths due to PIC increased from week 53 (15.9%) to week 1 (17.2%), after a declining trend in the percentage of deaths due to PIC for the previous four weeks. The percentage of deaths due to PIC for these weeks are likely to increase as additional death certificates are processed.
    • Due to the large number of deaths reported in recent weeks and the holidays, the change may be larger than usual.
U.S. Virologic Surveillance


Based on data reported to CDC by public health laboratories and a subset of clinical and commercial laboratories in the United States, 105,021,534 specimens were tested for SARS-CoV-2 using a molecular assay since March 1, 2020. The percentage of specimens testing positive for SARS-CoV-2 each week, based on week of specimen collection, are summarized below.

Nationally, 455,437 (14.5%) of 3,148,737 specimens tested for SARS-CoV-2 for diagnostic purposes were positive during week 1. This is a decrease compared with week 53, during which 15.4% of specimens tested were positive. The percentage of specimens testing positive decreased among all age groups.

specimens-tested.gif


*Note: Different laboratory types came on board with testing during different weeks. This graph includes public health laboratory data beginning in week 10, clinical laboratory data beginning in week 11, and commercial laboratory data beginning in week 14.
View Data Table


During week 1 compared with week 53, the percentage of specimens testing positive for SARS-CoV-2 increased in Region 1 [New England], but decreased in the other nine HHS regions.

Additional virologic surveillance information: Surveillance Methods


Outpatient/Emergency Department Illness


Two syndromic surveillance systems, the U.S. Outpatient Influenza-like Illness Surveillance Network (ILINet) and the National Syndromic Surveillance Project (NSSP), are being used to monitor trends in outpatient and emergency department (ED) visits that may be associated with COVID-19 illness. Each system monitors activity in a slightly different set of providers/facilities and uses a slightly different set of symptoms that may be associated with SARS-CoV-2 virus infection. ILINet provides information about visits to outpatient providers or emergency departments for influenza-like illness (ILI: fever plus cough and/or sore throat) and NSSP provides information about visits to EDs for ILI and COVID-like illness (CLI: fever plus cough and/or shortness of breath or difficulty breathing). Some EDs contribute ILI data to both ILINet and NSSP. Both systems are currently being affected by changes in health care seeking behavior, including increased use of telemedicine and increased social distancing. These changes affect the numbers of people seeking care in the outpatient and ED settings. Syndromic data, including CLI and ILI, should be interpreted with caution and should be evaluated in combination with other sources of surveillance data, especially laboratory testing results, to obtain a complete and accurate picture of respiratory illness.

Nationally, the overall percentages of visits to outpatient providers or EDs remained stable (change of ≤0.1%) for ILI and decreased for CLI during week 1 compared with week 53. During week 1, the percentages of ED visits captured in NSSP for CLI and ILI were 7.5% and 1.3%, respectively. In ILINet, 1.7% of visits reported during week 1 were for ILI, which has remained stable (change of ≤0.1%) compared with week 53 and below the national baseline (2.4% for October 2019 through September 2020; 2.6% since October 2020) for the 39[SUP]th[/SUP] consecutive week. This level of ILI is lower than is typical for ILINet during this time of year.
outpatient-emergency-visits.gif

resize iconView LargerView Data Table


The percentages of visits for ILI reported in ILINet in week 1 decreased for two age groups (0–4 years and 50–64 years) compared with week 53. In the remaining age groups (5–24 years, 25–49 years, and 65 years and older), these percentages remained stable (change of ≤0.1%).
percent-ili-visits-by-age.gif

resize iconView LargerView Data Table


On a regional levelexternal icon, two regions (Region 5 [Midwest]and 9 [South/West Coast]) reported an increase in at least one indicator of mild to moderate illness (CLI and/or ILI) during week 1 compared with week 53. The remaining eight regions reported a stable (change of ≤0.1%) or decreasing level of mild to moderate illness during week 1 compared with week 53; however, three of these regions (Regions 2 (New Jersey/New York/Puerto Rico), 4 (Southeast) and 6 (South Central) have reported an increasing trend in at least one of these indicators during recent weeks. The percentage of visits for ILI to ILINet providers during week 1 was above the the region-specific baseline in one region (Region 9 [South/West Coast]).

ILI Activity Levels

Data collected in ILINet are used to produce a measure of ILI activity for all 50 states, Puerto Rico, the U.S. Virgin Islands, the District of Columbia, New York City and for each core-based statistical area (CBSA) where at least one provider is located. The mean reported percentage of visits due to ILI for the current week is compared with the mean reported during non-influenza weeks, and the activity levels correspond to the number of standard deviations below, at, or above the mean.

The number of jurisdictions at each activity level during week 53 and the previous week are summarized in the table below.
Activity Level
Week 1 (Week ending Jan. 9, 2021)Week 53 (Week ending Jan. 2, 2021)Week 1 (Week ending Jan. 9, 2021)Week 53 (Week ending Jan. 2, 2021)
Very High0020
High0034
Moderate001215
Low544750
Minimal4950544547
Insufficient Data11321313

[TD="colspan: 2"] Number of Jurisdictions [/TD]
[TD="colspan: 2"] Number of CBSAs [/TD]

*Note: Data collected in ILINet may disproportionally represent certain populations within a state and may not accurately depict the full picture of respiratory disease activity for the whole state. Differences in the data presented here by CDC and independently by some state health departments likely represent differing levels of data completeness with data presented by the state likely being the more complete.

Additional information about medically attended outpatient and emergency department visits for ILI and CLI: Surveillance Methods

Hospitalizations


The COVID-19-Associated Hospitalization Surveillance Network (COVID-NET) conducts population-based surveillance for laboratory-confirmed COVID-19-associated hospitalizations in select counties participating in the Emerging Infections Program (EIP) and the Influenza Hospitalization Surveillance Project (IHSP).

A total of 118,760 laboratory-confirmed COVID-19-associated hospitalizations were reported by sites between March 1, 2020, and January 9, 2021. The overall cumulative hospitalization rate was 364.3 per 100,000 population. The overall weekly hospitalization rate reached its highest point at 17.6 per 100,000 during the week ending December 12, 2020 (Week 50) and remains elevated. Although reported rates in recent weeks have declined, these rates are likely to increase as additional data are reported. Recent data reporting delays might be increased due to the holidays.
lab-confirmed-hospitalizations-weekly.gif

resize iconView Larger


[SUP]1[/SUP]Additional hospitalization rate data by age group are available.

Among the 118,760 laboratory-confirmed COVID-19-associated hospitalizations, 115,196 (97.0%) had information on race and ethnicity, while collection of race and ethnicity was still pending for 3,564 (3.0%) cases. When examining age-adjusted hospitalization rates by race and ethnicity, compared with non-Hispanic White persons, hospitalization rates were 3.3 times higher among Hispanic or Latino persons and Non-Hispanic American Indian or Alaska Native persons, and 3.0 times higher among non-Hispanic Black persons.


When examining age-stratified crude hospitalization rates by race and ethnicity, compared with non-Hispanic White persons in the same age group, crude hospitalization rates were 4.5 times higher among Hispanic or Latino persons aged 0–17 years, 5.9 times higher among non-Hispanic American Indian or Alaska Native persons aged 18–49 years 4.1 times higher among non-Hispanic American Indian or Alaska Native persons and Hispanic or Latino persons aged 50–64 years, and 2.3 times higher among non-Hispanic Black persons aged ≥ 65 years.

31.23.134.83.445.54.515.41.510.21.0
501.45.9332.83.9468.45.5111.61.384.91.0
1129.94.1955.43.51116.84.1337.01.2272.81.0
1665.52.01894.82.31806.32.2731.20.9812.61.0
696.33.3623.63.0698.13.3224.61.1210.31.0
[SUP]1 [/SUP]COVID-19-associated hospitalization rates by race and ethnicity are calculated using COVID-NET hospitalizations with known race and ethnicity for the numerator and NCHS bridged-race population estimates for the denominator.
[SUP]2[/SUP] For each age category, rate ratios are the ratios between crude hospitalization rates within each racial and ethnic group and the crude hospitalization rate among non-Hispanic White persons in the same age category.
[SUP]3[/SUP] The highest rate ratio in each age category is presented in bold.
[SUP]4[/SUP] Overall rates are adjusted to account for differences in age distributions within race and ethnicity strata in the COVID-NET catchment area; the age strata used for the adjustment include 0–17, 18–49, 50–64, 65-74, 75-84 and 85+ years.


Non-Hispanic White persons and non-Hispanic Black persons represented the highest proportions of hospitalizations reported to COVID-NET, followed by Hispanic or Latino, non-Hispanic Asian or Pacific Islander, and non-Hispanic American Indian or Alaska Native persons. However, some racial and ethnic groups are disproportionately represented among hospitalizations compared with the overall population of the catchment area. Prevalence ratios were highest among non-Hispanic American Indian or Alaska Native persons, followed by non-Hispanic Black persons and Hispanic or Latino persons.
1.2%27.0%20.1%5.1%40.6%
0.7%17.9%14.1%8.9%58.5%
1.71.51.40.60.7
[SUP]1[/SUP]Persons of multiple races (0.3%) or unknown race and ethnicity (5.7%) are not represented in the table but are included as part of the denominator.
[SUP]2[/SUP] Prevalence ratio is calculated as the ratio of the proportion of COVID-NET hospitalizations over the proportion of population in COVID-NET catchment area.

For underlying medical conditions, data were restricted to cases reported during March 1–September 30, 2020, due to delays in reporting. During this time frame, sampling was conducted among hospitalized adults; therefore, weighted percentages are reported. No sampling was conducted among hospitalized children. Among 16,658 sampled adults hospitalized during March 1–October 31 with information on underlying medical conditions, 90.0% had at least one reported underlying medical condition. The most reported underlying medical conditions were hypertension (56.4%), obesity (48.6%), metabolic disease (41.6%), and cardiovascular disease (32.6%). Among 971 children hospitalized during March 1–October 31 with information on underlying conditions, 52.0% had at least one reported underlying medical condition. The most reported underlying medical conditions were obesity (37.7%), neurologic disease (13.4%), and asthma (11.4%).

Additional data on demographics, signs and symptoms at admission, underlying medical conditions, interventions, outcomes, and discharge diagnoses, stratified by age, sex, and race and ethnicity, are available.

Additional hospitalization surveillance information:
Surveillance Methods | Additional rate data | Additional demographic and clinical data


Mortality Surveillance


The National Center for Health Statistics (NCHS) collects death certificate data from vital statistics offices for all deaths occurring in the United States. Based on death certificate data available on January 14, 2021, the percentage of deaths attributed to pneumonia, influenza, or COVID-19 (PIC) increased during week 1 (17.2%) as compared with the percentage during week 53 (15.9%), remains above the epidemic threshold of 7.0% and is expected to increase as more death certificates are processed. Among the 3,337 PIC deaths reported for week 1, 2,486 had COVID-19 listed as an underlying or contributing cause of death on the death certificate and two listed influenza, indicating that the recent increase in PIC mortality is due primarily to COVID-19 and not influenza.

The weekly percentage of deaths due to PIC has been increasing since early October to a level that is higher than the July peak and is approaching the April peak. Data for the past four weeks show a declining trend in the percentage of deaths due to PIC compared to the December peak, but that is likely to change as additional death certificates are processed. Weekly mortality surveillance data include a combination of machine coded and manually coded causes of death collected from death certificates. The percentage of deaths due to PIC is higher among manually coded records than more rapidly available machine coded records. Because of additional time needed for manual coding, the initially reported PIC percentages may be lower than percentages calculated from final data. Additionally, due to the large number of deaths reported in recent weeks and the holidays, the delay in availability of manually coded records may be longer than usual and the change in data during recent weeks may be larger than usual.
nchs-mortality-report.gif

resize iconView Larger


*Data during recent weeks are incomplete because of the lag in time between when the death occurred and when the death certificate is completed, submitted to NCHS and processed for reporting purposes. It is possible that a death certificate includes both influenza and COVID as a cause of death; therefore, the number of influenza and COVID coded deaths may not be mutually exclusive.
View Data Table


Additional NCHS mortality surveillance information: Surveillance Methods | Provisional Death Counts for COVID-19
More Information
View Page In:pdf icon 962 KB, 10 pages
Last Updated Jan. 15, 2021
Content source: National Center for Immunization and Respiratory Diseases (NCIRD), Division of Viral Diseases
 
COVIDView.jpg
COVIDView: A Weekly Surveillance Summary of U.S. COVID-19 Activity


Updated Jan. 22, 2021
Print
Download Weekly Summary pdf icon[962 KB, 10 Pages]
Key Updates for Week 2, ending January 16, 2021


Nationally, surveillance indicators tracking levels of SARS-CoV-2 circulation, associated illnesses, hospitalizations, and deaths remain elevated but decreased during the week ending January 16, 2021. Recent declines in all indicators should be interpreted with caution as reporting delays increased due to the holidays and a rise in the number of COVID-19 illnesses. Downward trends may change as more data are received. Both COVID-19-associated hospitalizations and pneumonia, influenza and COVID-19 (PIC) mortality for the most recent weeks are expected to increase as more data are received.

national-activity-indicators.gif

Download Chart Data excel icon[CSV – 2 KB]
Virus: Public Health, Commercial and Clinical Laboratories


Nationally, the overall percentage of respiratory specimens testing positive for SARS-CoV-2, the virus causing COVID-19, decreased from 14.7% during week 1 to 11.9% during week 2. Percent positivity decreased among all age groups and in all ten Health and Human Services (HHS) regionsexternal icon.
Mild/Moderate Illness: Outpatient and Emergency Department Visits


Nationally, the percentage of visits to outpatient providers or emergency departments (EDs) decreased for COVID-like illness (CLI) and influenza-like illness (ILI) during week 2 compared with week 1. Nine of ten surveillance regions reported a decrease in at least one indicator of mild/moderate illness (CLI/ILI) this week, while one region reported a stable (change of ≤0.1%) level of mild/moderate illness.
Severe Disease: Hospitalizations and Deaths


The overall weekly hospitalization rate remains elevated. While the rate reached its highest point during the week ending December 12, 2020 (Week 50) at 17.8 per 100,000, rates in recent weeks are likely to increase as additional data are reported. Based on death certificate data, the percentage of deaths attributed to pneumonia, influenza or COVID-19 (PIC) for week 2 was 14.7%, and it remains above the epidemic threshold. Longer delays in reporting of hospitalization and mortality data may occur due to the holidays and the large number of COVID-19 illnesses occurring in recent weeks.

All data are preliminary and may change as more reports are received. A description of the surveillance systems summarized in COVIDView, including methodology and detailed descriptions of each data component, is available on the surveillance methods page.
Key Points
  • The holidays during weeks 52, 53, and 2 and increases in the number of COVID-19 illnesses have affected data reporting and health care seeking behavior in multiple ways; therefore, data from recent weeks should be interpreted with caution because they may change more than usual as additional data for those weeks are received.
  • Nationally, the overall percentage of respiratory specimens testing positive for SARS-CoV-2 decreased during week 2 (11.9%) compared with week 1 (14.7%). Percent positivity decreased in all ten HHS surveillance regions and among all age groups.
    • For nine of ten HHS regions (Region 2 [New Jersey/New York/Puerto Rico], 3 [Mid-Atlantic], 4 [Southeast], 5 [Midwest], 6 [South Central], 7 [Central], 8 [Mountain], 9 [South/West Central] and 10 [Pacific Northwest]), percent positivity decreased over the past two weeks.
    • Percent positivity in Region 1 [New England] is showing a one week decline.
  • Surveillance indicators of mild to moderate illness at the national level declined for both CLI and ILI during week 2 compared to week 1 but had shown increasing trends from late September 2020 through early January 2021.
    • All ten HHS regions reported a decrease in at least one indicator of mild to moderate illness (CLI and/or ILI) during week 2 compared with week 1, and six HHS regions (Regions 1 [New England], 5 [Midwest], 6 [South Central], 7 [Central], 8 [Mountain] and 10 [Pacific Northwest]) have reported a decreasing trend in all three indicators for at least two weeks.
  • The overall cumulative COVID-19-associated hospitalization rate through the week ending January 16, 2021, was 380.3 hospitalizations per 100,000 population.
    • The overall weekly hospitalization rate remains elevated and above earlier peaks in the pandemic. While the rate reached its highest point during the week ending December 12, 2020 (Week 50) at 17.8 per 100,000, rates in recent weeks are likely to increase as additional data are reported.
    • When examining age-adjusted hospitalization rates by race and ethnicity, compared with non-Hispanic White persons, hospitalization rates were 3.2 times higher among Hispanic or Latino persons and Non-Hispanic American Indian or Alaska Native persons, and 2.9 times higher among non-Hispanic Black persons.
  • The percentage of deaths due to PIC increased from the beginning of October through early December (28.0%), exceeding the percentage of deaths due to PIC observed during both April and August peaks, when percentage of deaths due to PIC reached 27.7% and 17.2%, respectively.
    • Nationally, the trend in the weekly percentage of deaths due to PIC has decreased since mid-December and is expected to increase for these weeks as additional death certificates are processed.
    • Due to the large number of deaths reported in recent weeks and during the holidays, the change may be larger than usual.
U.S. Virologic Surveillance


Based on data reported to CDC by public health laboratories and a subset of clinical and commercial laboratories in the United States, 108,634,448 specimens were tested for SARS-CoV-2 using a molecular assay since March 1, 2020. The percentage of specimens testing positive for SARS-CoV-2 each week, based on week of specimen collection, are summarized below.

Nationally, 346,341 (11.9%) of 2,922,707 specimens tested for SARS-CoV-2 for diagnostic purposes were positive during week 2. This is a decrease compared with week 1, during which 14.7% of specimens tested were positive. The percentage of specimens testing positive decreased among all age groups.

specimens-tested.gif


*Note: Different laboratory types came on board with testing during different weeks. This graph includes public health laboratory data beginning in week 10, clinical laboratory data beginning in week 11, and commercial laboratory data beginning in week 14.
View Data Table


During week 2 compared with week 1, the percentage of specimens testing positive for SARS-CoV-2 decreased in all HHS regions.

Additional virologic surveillance information: Surveillance Methods


Outpatient/Emergency Department Illness


Two syndromic surveillance systems, the U.S. Outpatient Influenza-like Illness Surveillance Network (ILINet) and the National Syndromic Surveillance Program (NSSP), are being used to monitor trends in outpatient and emergency department (ED) visits that may be associated with COVID-19 illness. Each system monitors activity in a slightly different set of providers/facilities and uses a slightly different set of symptoms that may be associated with SARS-CoV-2 virus infection. ILINet provides information about visits to outpatient providers or emergency departments for influenza-like illness (ILI: fever plus cough and/or sore throat) and NSSP provides information about visits to EDs for ILI and COVID-like illness (CLI: fever plus cough and/or shortness of breath or difficulty breathing). Some EDs contribute ILI data to both ILINet and NSSP. Both systems are currently being affected by changes in health care seeking behavior, including increased use of telemedicine and increased social distancing. These changes affect the numbers of people seeking care in the outpatient and ED settings. Syndromic data, including CLI and ILI, should be interpreted with caution and should be evaluated in combination with other sources of surveillance data, especially laboratory testing results, to obtain a complete and accurate picture of respiratory illness.

Nationally, the overall percentages of visits to outpatient providers or EDs decreased for ILI and CLI during week 2 compared with week 1. During week 2, the percentages of ED visits captured in NSSP for CLI and ILI were 6.8% and 1.1%, respectively. In ILINet, 1.4% of visits reported during week 2 were for ILI, which is also a decrease compared with week 1 and below the national baseline for the 40[SUP]th[/SUP] consecutive week. This level of ILI is lower than is typical for ILINet during this time of year.
outpatient-emergency-visits.gif

resize iconView LargerView Data Table


The percentages of visits for ILI reported in ILINet in week 2 increased for one age group (0–4 years) and decreased or remained stable (change of ≤0.1%) for the remaining age groups (5–24 years, 25–49 years, 50–64 years, and 65 years and older) compared with week 1.
percent-ili-visits-by-age.gif

resize iconView LargerView Data Table


On a regional levelexternal icon, nine regions (Regions 1 [New England], 3 [Mid-Atlantic], 4 [Southeast], 5 [Midwest], 6 [South Central], 7 [Central], 8 [Mountain], 9 [South/West Coast], and 10 [Pacific Northwest]) reported a decrease in at least one indicator of mild to moderate illness (CLI and/or ILI) during week 2 compared with week 1. The remaining region (Region 2 [New Jersey/New York/Puerto Rico]) reported a stable (change of ≤0.1%) level of mild to moderate illness during week 2 compared with week 1; however, five of these regions (Regions 1 [New England], 2 [New Jersey/New York/Puerto Rico], 3 [Mid-Atlantic], 4 [Southeast] and 9 [South/West Coast]) have reported an increasing trend in at least one of these indicators during recent weeks.
ILI Activity Levels

Data collected in ILINet are used to produce a measure of ILI activity for all 50 states, Puerto Rico, the U.S. Virgin Islands, the District of Columbia, New York City and for each core-based statistical area (CBSA) where at least one provider is located. The mean reported percentage of visits due to ILI for the current week is compared with the mean reported during non-influenza weeks, and the activity levels correspond to the number of standard deviations below, at, or above the mean.

The number of jurisdictions at each activity level during week 2 and the previous week are summarized in the table below.
Activity Level
Week 2 (Week ending Jan. 16, 2021)Week 1 (Week ending Jan. 9, 2021)Week 2 (Week ending Jan. 16, 2021)Week 1 (Week ending Jan. 9, 2021)
Very High0012
High0022
Moderate00512
Low133050
Minimal5351565560
Insufficient Data11326303

[TD="colspan: 2"] Number of Jurisdictions [/TD]
[TD="colspan: 2"] Number of CBSAs [/TD]

*Note: Data collected in ILINet may disproportionally represent certain populations within a state and may not accurately depict the full picture of respiratory disease activity for the whole state. Differences in the data presented here by CDC and independently by some state health departments likely represent differing levels of data completeness with data presented by the state likely being the more complete.

Additional information about medically attended outpatient and emergency department visits for ILI and CLI: Surveillance Methods

Hospitalizations


The COVID-19-Associated Hospitalization Surveillance Network (COVID-NET) conducts population-based surveillance for laboratory-confirmed COVID-19-associated hospitalizations in select counties participating in the Emerging Infections Program (EIP) and the Influenza Hospitalization Surveillance Project (IHSP).

A total of 124,006 laboratory-confirmed COVID-19-associated hospitalizations were reported by sites between March 1, 2020, and January 16, 2021. The overall cumulative hospitalization rate was 380.3 per 100,000 population. The overall weekly hospitalization rate remains elevated and higher than earlier peaks in the pandemic. While the rate reached its highest point during the week ending December 12, 2020 (Week 50) at 17.8 per 100,000, rates in recent weeks are likely to increase as additional data are reported.
lab-confirmed-hospitalizations-weekly.gif

resize iconView Larger


[SUP]1[/SUP]Additional hospitalization rate data by age group are available.

Among the 124,006 laboratory-confirmed COVID-19-associated hospitalizations, 121,689 (98.1%) had information on race and ethnicity, while collection of race and ethnicity was still pending for 2,317 (1.9%) cases. When examining age-adjusted hospitalization rates by race and ethnicity, compared with non-Hispanic White persons, hospitalization rates were 3.2 times higher among Hispanic or Latino persons and Non-Hispanic American Indian or Alaska Native persons, and 2.9 times higher among non-Hispanic Black persons.


When examining age-stratified crude hospitalization rates by race and ethnicity, compared with non-Hispanic White persons in the same age group, crude hospitalization rates were 4.2 times higher among Hispanic or Latino persons aged 0–17 years; 5.7 times higher among non-Hispanic American Indian or Alaska Native persons aged 18–49 years; 4.0 times higher among non-Hispanic American Indian or Alaska Native persons and Hispanic or Latino persons aged 50–64 years; and 2.3 times higher among non-Hispanic Black persons aged ≥ 65 years.

29.22.636.83.346.84.215.91.411.11.0
516.05.7348.53.9485.85.4116.71.389.81.0
1164.54.01007.83.51161.24.0360.01.2289.91.0
1715.92.02009.12.31889.22.2777.80.9870.91.0
716.43.2658.32.9726.93.2238.21.1224.41.0
[SUP]1 [/SUP]COVID-19-associated hospitalization rates by race and ethnicity are calculated using COVID-NET hospitalizations with known race and ethnicity for the numerator and NCHS bridged-race population estimates for the denominator.
[SUP]2[/SUP] For each age category, rate ratios are the ratios between crude hospitalization rates within each racial and ethnic group and the crude hospitalization rate among non-Hispanic White persons in the same age category.
[SUP]3[/SUP] The highest rate ratio in each age category is presented in bold.
[SUP]4[/SUP] Overall rates are adjusted to account for differences in age distributions within race and ethnicity strata in the COVID-NET catchment area; the age strata used for the adjustment include 0–17, 18–49, 50–64, 65-74, 75-84 and 85+ years.


Non-Hispanic White persons and non-Hispanic Black persons represented the highest proportions of hospitalizations reported to COVID-NET, followed by Hispanic or Latino, non-Hispanic Asian or Pacific Islander, and non-Hispanic American Indian or Alaska Native persons. However, some racial and ethnic groups are disproportionately represented among hospitalizations compared with the overall population of the catchment area. Prevalence ratios were highest among non-Hispanic American Indian or Alaska Native persons, followed by non-Hispanic Black persons and Hispanic or Latino persons.
1.1%27.0%19.8%5.1%41.0%
0.7%17.9%14.1%8.9%58.5%
1.61.51.40.60.7
[SUP]1[/SUP]Persons of multiple races (0.3%) or unknown race and ethnicity (5.6%) are not represented in the table but are included as part of the denominator.
[SUP]2[/SUP] Prevalence ratio is calculated as the ratio of the proportion of COVID-NET hospitalizations over the proportion of population in COVID-NET catchment area.

For underlying medical conditions, data were restricted to cases reported during March 1–October 31, 2020, due to delays in reporting. During this time frame, sampling was conducted among hospitalized adults; therefore, weighted percentages are reported. No sampling was conducted among hospitalized children. Among 15,979 sampled adults hospitalized during March 1–October 31 with information on underlying medical conditions, 90.6% had at least one reported underlying medical condition. The most reported underlying medical conditions were hypertension (55.8%), obesity (48.5%), metabolic disease (41.2%), and cardiovascular disease (32.5%). Among 985 children hospitalized during March 1–October 31 with information on underlying conditions, 52.0% had at least one reported underlying medical condition. The most reported underlying medical conditions were obesity (37.5%), neurologic disease (13.3%), and asthma (11.3%).

Additional data on demographics, signs and symptoms at admission, underlying medical conditions, interventions, outcomes, and discharge diagnoses, stratified by age, sex, and race and ethnicity, are available.

Additional hospitalization surveillance information:
Surveillance Methods | Additional rate data | Additional demographic and clinical data


Mortality Surveillance


The National Center for Health Statistics (NCHS) collects death certificate data from vital statistics offices for all deaths occurring in the United States. Based on death certificate data available on January 21, 2021, the percentage of deaths attributed to pneumonia, influenza, or COVID-19 (PIC) during week 2 was 14.7%, remains above the epidemic threshold of 7.0% and is expected to increase as more death certificates are processed. Among the 2,799 PIC deaths reported for week 2, 1,988 had COVID-19 listed as an underlying or contributing cause of death on the death certificate and four listed influenza, indicating that the recent increase in PIC mortality is due primarily to COVID-19 and not influenza.

The weekly percentage of deaths due to PIC reached the highest point in the pandemic during the week ending December 12 (28.0%). Data for the past five weeks show a declining trend in the percentage of deaths due to PIC compared to the December peak, but that is expected to change as additional death certificates are processed. Weekly mortality surveillance data include a combination of machine coded and manually coded causes of death collected from death certificates. The percentage of deaths due to PIC is higher among manually coded records than more rapidly available machine coded records. Because of additional time needed for manual coding, the initially reported PIC percentages are likely to increase as more data are received and processed. The lag in availability of manually coded data increased during the holiday weeks at the end of 2020, and because of the large numbers of deaths reported during recent weeks, the delay in availability of manually coded data continues to increase. Weeks for which the largest changes in the percentage of deaths due to PIC are expected are highlighted in gray in the figure below and should be interpreted with caution.
nchs-mortality-report.gif

resize iconView Larger


*Data during recent weeks are incomplete because of the lag in time between when the death occurred and when the death certificate is completed, submitted to NCHS and processed for reporting purposes. It is possible that a death certificate includes both influenza and COVID as a cause of death; therefore, the number of influenza and COVID coded deaths may not be mutually exclusive.
View Data Table


Additional NCHS mortality surveillance information: Surveillance Methods | Provisional Death Counts for COVID-19
More Information
View Page In:pdf icon 962 KB, 10 pages
 
COVIDView.jpg
COVIDView Summary ending January 23, 2021


Updated Jan. 29, 2021
Print
Starting Friday, February 12, 2021, COVIDView will be replaced with the COVID Data Tracker Weekly Review. This new webpage and newsletter will highlight key data from CDC’s COVID Data Tracker, narrative interpretations of the data, and visualizations from the week. The new Weekly Review will also summarize important trends in the pandemic and bring together CDC data and reporting in a centralized location. It represents the extensive data that CDC uses to track the pandemic on a daily basis and will incorporate additional data sources in the future. Sign up to have the COVID Data Tracker Weekly Review delivered to your inbox every week.

Download Weekly Summary pdf icon[897 KB, 11 Pages]
Key Updates for Week 3, ending January 23, 2021


Nationally, surveillance indicators tracking levels of SARS-CoV-2 circulation, associated illnesses, and hospitalizations remain elevated but show decreasing trends in recent weeks. However, recent declines in these indicators should be interpreted with caution as reporting delays increased due to the holidays and a rise in the number of COVID-19 illnesses. Both COVID-19-associated hospitalizations and pneumonia, influenza and COVID-19 (PIC) mortality for the most recent weeks are expected to increase as more data are received.

national-activity-indicators.gif

Download Chart Data excel icon[CSV – 2 KB]
Virus: Public Health, Commercial and Clinical Laboratories


Nationally, the overall percentage of respiratory specimens testing positive for SARS-CoV-2, the virus causing COVID-19, decreased from 12.0% during week 2 to 11.0% during week 3. Percent positivity decreased in all ten Health and Human Services (HHS) regionsexternal icon and decreased among all age groups.
Mild/Moderate Illness: Outpatient and Emergency Department Visits


Nationally, the percentage of visits to outpatient providers or emergency departments (EDs) decreased for COVID-like illness (CLI) and remained stable (change ≤0.1%) for influenza-like illness (ILI) during week 3 compared with week 2. All ten HHS regions reported a decreasing level of CLI and a low level of ILI.
Severe Disease: Hospitalizations and Deaths


For the past two months, the overall weekly hospitalization rate has remained in an elevated plateau above earlier peaks in the pandemic. Rates in recent weeks are likely to increase as additional data are reported. Based on death certificate data, the percentage of deaths attributed to pneumonia, influenza or COVID-19 (PIC) for week 3 was 14.8%, and it remains above the epidemic threshold. Longer delays in reporting of hospitalization and mortality data may occur due to the holidays and the large number of COVID-19 illnesses occurring in recent weeks.

All data are preliminary and may change as more reports are received. A description of the surveillance systems summarized in COVIDView, including methodology and detailed descriptions of each data component, is available on the surveillance methods page.
Key Points
  • The holidays at the end of 2020 coupled with the large number of COVID-19 illnesses during that time likely affected data reporting and health care seeking behavior with continued effects on data reporting and processing during recent weeks. Data from recent weeks should be interpreted with caution because they may change more than usual as additional data are received.
  • Nationally, the overall percentage of respiratory specimens testing positive for SARS-CoV-2 decreased during week 3 (11.0%) compared with week 2 (12.0 %). Percent positivity decreased in all ten HHS regions.
    • Percent positivity decreased among all age groups in nine of ten HHS regions; for Region 2 (New Jersey/New York/Puerto Rico) the percent positivity increased slightly for one age group (5-17 years).
    • For nine of ten HHS regions, (Regions 2 [New Jersey/New York/Puerto Rico], 3 [Mid-Atlantic], 4 [Southeast], 5 [Midwest], 6 [South Central], 7 [Central], 8 [Mountain], 9 [South/West Central] and 10 [Pacific Northwest]), percent positivity decreased over the past three weeks.
    • Percent positivity in Region 1 [New England] is showing a 2 week decline.
  • Surveillance indicators of mild to moderate illness at the national level declined or remained stable (<0.1% change) during recent weeks. CLI decreased during the past two weeks after increasing from late September 2020 through early January 2021. ILI increased from late September through November 2020, remained stable through December, and has shown a decreasing trend during January.
    • All ten HHS regions reported a decrease in at least one indicator of mild to moderate illness (CLI and/or ILI) during week 3 compared with week 2 and six HHS regions (Regions 1 [New England], 3 [Mid-Atlantic], 4 [Southeast], 5 [Midwest], 9 [South/West Coast], and 10 [Pacific Northwest]) have reported a decreasing trend in all three indicators for at least two weeks.
  • The overall cumulative COVID-19-associated hospitalization rate through the week ending January 23, 2020, was 403.0 hospitalizations per 100,000 population.
    • For the past two months, the overall weekly hospitalization rate has remained in an elevated plateau above earlier peaks in the pandemic. Rates in recent weeks are likely to increase as additional data are reported.
    • When examining age-adjusted hospitalization rates by race and ethnicity, compared with non-Hispanic White persons, cumulative hospitalization rates were 3.6 times higher among non-Hispanic American Indian or Alaska Native persons; 3.2 times higher among Hispanic or Latino persons; and 2.9 times higher among non-Hispanic Black persons.
  • The percentage of deaths due to PIC increased from the beginning of October through the week ending December 19, 2020 (28.8%). Mortality attributed to PIC exceeded the percentage of deaths due to PIC observed at any other point during the pandemic for three consecutive weeks in December.
    • Nationally, the trend in the weekly percentage of deaths due to PIC increased from week 2 (14.6%) to week 3 (14.8%) after decreasing since mid-December. Data for these weeks are expected to increase as additional death certificates are processed. Due to the large number of deaths reported in recent weeks and during the holidays, the change may be larger than usual.
U.S. Virologic Surveillance


Based on data reported to CDC by public health laboratories and a subset of clinical and commercial laboratories in the United States, 111,632,386 specimens were tested for SARS-CoV-2 using a molecular assay since March 1, 2020. The percentage of specimens testing positive for SARS-CoV-2 each week, based on week of specimen collection, are summarized below.

Nationally, 285,251 (11.0%) of 2,595,553 specimens tested for SARS-CoV-2 for diagnostic purposes were positive during week 3. This is a decrease compared with week 2, during which 12.0% of specimens tested were positive. The percentage of specimens testing positive decreased among all age groups

specimens-tested.gif


*Note: Different laboratory types came on board with testing during different weeks. This graph includes public health laboratory data beginning in week 10, clinical laboratory data beginning in week 11, and commercial laboratory data beginning in week 14.
View Data Table


During week 3 compared with week 2, the percentage of specimens testing positive for SARS-CoV-2 decreased in all HHS regions.

Additional virologic surveillance information: Surveillance Methods


Outpatient/Emergency Department Illness


Two syndromic surveillance systems, the U.S. Outpatient Influenza-like Illness Surveillance Network (ILINet) and the National Syndromic Surveillance Program (NSSP), are being used to monitor trends in outpatient and emergency department (ED) visits that may be associated with COVID-19 illness. Each system monitors activity in a slightly different set of providers/facilities and uses a slightly different set of symptoms that may be associated with SARS-CoV-2 virus infection. ILINet provides information about visits to outpatient providers or emergency departments for influenza-like illness (ILI: fever plus cough and/or sore throat) and NSSP provides information about visits to EDs for ILI and COVID-like illness (CLI: fever plus cough and/or shortness of breath or difficulty breathing). Some EDs contribute ILI data to both ILINet and NSSP. Both systems currently are being affected by changes in health care seeking behavior, including increased use of telemedicine and increased social distancing. These changes affect the numbers of people seeking care in the outpatient and ED settings. Syndromic data, including CLI and ILI, should be interpreted with caution and should be evaluated in combination with other sources of surveillance data, especially laboratory testing results, to obtain a complete and accurate picture of respiratory illness.

Nationally, the overall percentages of visits to outpatient providers or EDs decreased for CLI and remained stable (change ≤0.1%) for ILI during week 3 compared with week 2. During week 3, the percentages of ED visits captured in NSSP for CLI and ILI were 5.9% and 1.1%, respectively. In ILINet, 1.3% of visits reported during week 3 were for ILI, remaining stable compared with week 2 and below the national baseline for the 41[SUP]st[/SUP] consecutive week. This level of ILI is lower than is typical for ILINet during this time of year.
outpatient-emergency-visits.gif

resize iconView LargerView Data Table


The percentages of visits for ILI reported in ILINet in week 3 remained stable (change of ≤0.1%) for all age groups (0–4 years, 5–24 years, 25–49 years, 50–64 years, and 65 years and older) compared with week 2.
percent-ili-visits-by-age.gif

resize iconView LargerView Data Table


On a regional levelexternal icon, during week 3 compared with week 2, all ten regions reported a decreasing level of CLI and eight regions (Regions 1 [New England], 3 [Mid-Atlantic], 4 [Southeast], 5 [Midwest], 7 [Central], 8 [Mountain], 9 [South/West Coast], and 10 [Pacific Northwest]) reported a stable (change of ≤0.1%) or decreasing level or ILI.

ILI Activity Levels

Data collected in ILINet are used to produce a measure of ILI activity for all 50 states, Puerto Rico, the U.S. Virgin Islands, the District of Columbia, New York City and for each core-based statistical area (CBSA) where at least one provider is located. The mean reported percentage of visits due to ILI for the current week is compared with the mean reported during non-influenza weeks, and the activity levels correspond to the number of standard deviations below, at, or above the mean.

The number of jurisdictions at each activity level during week 3 and the previous week are summarized in the table below.
Activity Level
Week 3 (Week ending Jan. 23, 2021)Week 2 (Week ending Jan. 16, 2021)Week 3 (Week ending Jan. 23, 2021)Week 2 (Week ending Jan. 16, 2021)
Very High0000
High0032
Moderate0045
Low102631
Minimal5354584588
Insufficient Data11312303

[TD="colspan: 2"] Number of Jurisdictions [/TD]
[TD="colspan: 2"] Number of CBSAs [/TD]

*Note: Data collected in ILINet may disproportionally represent certain populations within a state and may not accurately depict the full picture of respiratory disease activity for the whole state. Differences in the data presented here by CDC and independently by some state health departments likely represent differing levels of data completeness with data presented by the state likely being the more complete.

Additional information about medically attended outpatient and emergency department visits for ILI and CLI: Surveillance Methods

Hospitalizations


The COVID-19-Associated Hospitalization Surveillance Network (COVID-NET) conducts population-based surveillance for laboratory-confirmed COVID-19-associated hospitalizations in select counties participating in the Emerging Infections Program (EIP) and the Influenza Hospitalization Surveillance Project (IHSP).

A total of 131,384 laboratory-confirmed COVID-19-associated hospitalizations were reported by sites between March 1, 2020, and January 23, 2021. The overall cumulative hospitalization rate was 403.0 per 100,000 population. For the past two months, since the week ending November 7, 2020 (MMWR Week 45), the overall weekly hospitalization rate has remained in an elevated plateau above earlier peaks in the pandemic. The hospitalization rates for the most recent weeks are expected to be higher as additional data are reported.
lab-confirmed-hospitalizations-weekly.gif

resize iconView Larger


[SUP]1[/SUP]Additional hospitalization rate data by age group are available.

Among the 131,384 laboratory-confirmed COVID-19-associated hospitalizations, 129,041 (98.2%) had information on race and ethnicity, while collection of race and ethnicity was still pending for 2,343 (1.8%) cases. When examining age-adjusted hospitalization rates by race and ethnicity, compared with non-Hispanic White persons, cumulative hospitalization rates were 3.6 times higher among non-Hispanic American Indian or Alaska Native persons; 3.2 times higher among Hispanic or Latino persons; and 2.9 times higher among non-Hispanic Black persons.


When examining age-stratified crude hospitalization rates by race and ethnicity, compared with non-Hispanic White persons in the same age group, crude hospitalization rates were 4.1 times higher among Hispanic or Latino persons aged 0–17 years; 6.4 times higher among non-Hispanic American Indian or Alaska Native persons aged 18–49 years; 4.5 times higher among non-Hispanic American Indian or Alaska Native persons aged 50–64 years; and 2.3 times higher among non-Hispanic American Indian or Alaska Native persons and non-Hispanic Black persons aged >65 years.

35.12.938.73.150.24.117.61.412.31.0
613.66.4363.63.8509.85.4120.61.395.21.0
1398.44.51051.03.41230.64.0378.41.2308.71.0
2123.92.32111.32.32048.32.2833.70.9927.81.0
866.93.6689.12.9775.23.2252.11.1239.01.0
[SUP]1 [/SUP]COVID-19-associated hospitalization rates by race and ethnicity are calculated using COVID-NET hospitalizations with known race and ethnicity for the numerator and NCHS bridged-race population estimates for the denominator.
[SUP]2[/SUP] For each age category, rate ratios are the ratios between crude hospitalization rates within each racial and ethnic group and the crude hospitalization rate among non-Hispanic White persons in the same age category.
[SUP]3[/SUP] The highest rate ratio in each age category is presented in bold.
[SUP]4[/SUP] Overall rates are adjusted to account for differences in age distributions within race and ethnicity strata in the COVID-NET catchment area; the age strata used for the adjustment include 0–17, 18–49, 50–64, 65-74, 75-84 and 85+ years.

Non-Hispanic White persons and non-Hispanic Black persons represented the highest proportions of hospitalizations reported to COVID-NET, followed by Hispanic or Latino, non-Hispanic Asian or Pacific Islander, and non-Hispanic American Indian or Alaska Native persons. However, some racial and ethnic groups are disproportionately represented among hospitalizations compared with the overall population of the catchment area. Prevalence ratios were highest among non-Hispanic American Indian or Alaska Native persons, followed by non-Hispanic Black persons and Hispanic or Latino persons.
1.3%26.6%19.8%5.1%41.2%
0.7%17.9%14.1%8.9%58.5%
1.91.51.40.60.7
[SUP]1[/SUP]Persons of multiple races (0.3%) or unknown race and ethnicity (5.6%) are not represented in the table but are included as part of the denominator.
[SUP]2[/SUP] Prevalence ratio is calculated as the ratio of the proportion of COVID-NET hospitalizations over the proportion of population in COVID-NET catchment area.

For underlying medical conditions, data were restricted to cases reported during March 1–October 31, 2020, due to delays in reporting. During this time frame, sampling was conducted among hospitalized adults; therefore, weighted percentages are reported. No sampling was conducted among hospitalized children. Among 16,006 sampled adults hospitalized during March 1–October 31 with information on underlying medical conditions, 90.5% had at least one reported underlying medical condition. The most reported underlying medical conditions were hypertension (55.8%), obesity (48.5%), metabolic disease (41.3%), which includes diabetes, and cardiovascular disease (32.5%). Among 996 children hospitalized during March 1–October 31, 2020 with information on underlying conditions, 52.0% had at least one reported underlying medical condition. The most reported underlying medical conditions were obesity (37.6%), neurologic disease (13.3%), and asthma (11.1%).

Additional data on demographics, signs and symptoms at admission, underlying medical conditions, interventions, outcomes, and discharge diagnoses, stratified by age, sex, and race and ethnicity, are available.

Additional hospitalization surveillance information:
Surveillance Methods | Additional rate data | Additional demographic and clinical data


Mortality Surveillance


The National Center for Health Statistics (NCHS) collects death certificate data from vital statistics offices for all deaths occurring in the United States. Based on death certificate data available on January 28, 2021, the percentage of deaths attributed to pneumonia, influenza, or COVID-19 (PIC) during week 3 was 14.8%; it remains above the epidemic threshold of 7.1%, and this percentage is expected to increase as more death certificates are processed. Among the 3,043 PIC deaths reported for week 3, 2,102 had COVID-19 listed as an underlying or contributing cause of death on the death certificate and seven listed influenza, indicating that the recent increase in PIC mortality is due primarily to COVID-19 and not influenza.

The weekly percentage of deaths due to PIC reached the highest point in the pandemic during the week ending December 19, 2020 (28.8%) and exceeded both previous peaks observed during April and August for three consecutive weeks. Data for the past five weeks show a declining trend in the percentage of deaths due to PIC compared to the December peak, but this percentage is expected to change as additional death certificates are processed. Weekly mortality surveillance data include a combination of machine coded and manually coded causes of death collected from death certificates. The percentage of deaths due to PIC is higher among manually coded records than more rapidly available machine coded records. Because of additional time needed for manual coding, the initially reported PIC percentages are likely to increase as more data are received and processed. The lag in availability of manually coded data increased during the holiday weeks at the end of 2020, and because of the large numbers of deaths reported during recent weeks, delays in availability of manually coded data is expected to increase. Weeks for which this lag is expected to cause the largest changes in the percentage of deaths due to PIC are highlighted in gray in the figure below and should be interpreted with caution.
nchs-mortality-report.gif

resize iconView Larger


*Data during recent weeks are incomplete because of the lag in time between when the death occurred and when the death certificate is completed, submitted to NCHS and processed for reporting purposes. It is possible that a death certificate includes both influenza and COVID as a cause of death; therefore, the number of influenza and COVID coded deaths may not be mutually exclusive.
View Data Table


Additional NCHS mortality surveillance information: Surveillance Methods | Provisional Death Counts for COVID-19
More Information
View Page In:pdf icon 897 KB, 11 Pages
 
COVIDView.jpg
COVIDView: A Weekly Surveillance Summary of U.S. COVID-19 Activity


Updated Feb. 5, 2021
Print
Starting Friday, February 12, 2021, COVIDView will be replaced with the COVID Data Tracker Weekly Review. This new webpage and newsletter will highlight key data from CDC’s COVID Data Tracker, narrative interpretations of the data, and visualizations from the week. The new Weekly Review will also summarize important trends in the pandemic and bring together CDC data and reporting in a centralized location. It represents the extensive data that CDC uses to track the pandemic on a daily basis and will incorporate additional data sources in the future. Sign up to have the COVID Data Tracker Weekly Review delivered to your inbox every week.

Download Weekly Summary pdf icon[981 KB, 11 Pages]
Key Updates for Week 4, ending January 30, 2021


Nationally, surveillance indicators tracking levels of SARS-CoV-2 circulation, associated illnesses, hospitalizations, and deaths remain elevated but show decreasing trends in recent weeks. Both COVID-19-associated hospitalizations and pneumonia, influenza, and COVID-19 (PIC) mortality for the most recent weeks may increase as more data are received.

national-activity-indicators.gif

Download Chart Data excel icon[CSV – 2 KB]
Virus: Public Health, Commercial and Clinical Laboratories


Nationally, the overall percentage of respiratory specimens testing positive for SARS-CoV-2, the virus causing COVID-19, decreased from 11.2% during week 3 to 9.7% during week 4. Percent positivity decreased in all ten Health and Human Services (HHS) regionsexternal icon and decreased among all age groups.
Mild/Moderate Illness: Outpatient and Emergency Department Visits


Nationally, the percentage of visits to outpatient providers or emergency departments (EDs) for COVID-like illness (CLI) and influenza-like illness (ILI) decreased during week 4 compared with week 3. All ten HHS regions reported a decrease in at least one indicator of mild/moderate illness.
Severe Disease: Hospitalizations and Deaths


For the past three months, the overall weekly hospitalization rate has remained in an elevated plateau above earlier peaks in the pandemic. Rates in recent weeks are likely to increase as additional data are reported. Based on death certificate data, the percentage of deaths attributed to pneumonia, influenza, or COVID-19 (PIC) for week 4 was 28.4%, and it remains above the epidemic threshold.

All data are preliminary and may change as more reports are received. A description of the surveillance systems summarized in COVIDView, including methodology and detailed descriptions of each data component, is available on the surveillance methods page.
Key Points
  • Nationally, the overall percentage of respiratory specimens testing positive for SARS-CoV-2 decreased during week 4 (9.7%) compared with week 3 (11.2 %). The percent positivity has declined nationally over the past four weeks since the week ending January 2, 2021 (15.4%).
    • Percent positivity decreased among all age groups in all ten HHS regions.
    • For nine of ten HHS regions, (Regions 2 [New Jersey/New York/Puerto Rico], 3 [Mid-Atlantic], 4 [Southeast], 5 [Midwest], 6 [South Central], 7 [Central], 8 [Mountain], 9 [South/West Central], and 10 [Pacific Northwest]), percent positivity decreased over the past four weeks.
    • Percent positivity in Region 1 [New England] is showing a 3 week decline.
  • Surveillance indicators of mild to moderate illness at the national level declined or remained stable (<0.1% change) during recent weeks. CLI decreased during the past three weeks after increasing from late September 2020 through early January 2021. ILI increased from October through December, and has shown a decreasing trend during January.
    • All ten HHS regions reported a decrease in at least one indicator of mild to moderate illness (CLI and/or ILI) during week 4 compared with week 3 and have a reported an overall decreasing trend in all three indicators of mild to moderate illness during the past several weeks.
  • The overall cumulative COVID-19-associated hospitalization rate through the week ending January 30, 2021 was 417.2 hospitalizations per 100,000 population.
    • For the past three months, the overall weekly hospitalization rate has remained in an elevated plateau above earlier peaks in the pandemic. Rates in recent weeks are likely to increase as additional data are reported.
    • When examining age-adjusted hospitalization rates by race and ethnicity, compared with non-Hispanic White persons, cumulative hospitalization rates were 3.6 times higher among non-Hispanic American Indian or Alaska Native persons, 3.2 times higher among Hispanic or Latino persons, and 2.9 times higher among non-Hispanic Black persons.
  • The percentage of deaths due to PIC increased from the beginning of October through the week ending January 9, 2021 (32.7%). Mortality attributed to PIC exceeded the percentage of deaths due to PIC observed at any other point during the pandemic for nine consecutive weeks from early December through the week ending January 30, 2021.
    • Nationally, the weekly percentage of deaths due to PIC decreased from week 3 (31.0%) to week 4 (28.4%) and has been decreasing since the first week of January. Data from recent weeks may change as additional data are received.
U.S. Virologic Surveillance


Based on data reported to CDC by public health laboratories and a subset of clinical and commercial laboratories in the United States, 114,175,816 specimens were tested for SARS-CoV-2 using a molecular assay since March 1, 2020. The percentage of specimens testing positive for SARS-CoV-2 each week, based on week of specimen collection, are summarized below.

Nationally, 230,277 (9.7%) of 2,375,248 specimens tested for SARS-CoV-2 for diagnostic purposes were positive during week 4. This is a decrease compared with week 3, during which 11.2% of specimens tested were positive. The percentage of specimens testing positive decreased among all age groups.

specimens-tested.gif


*Note: Different laboratory types came on board with testing during different weeks. This graph includes public health laboratory data beginning in week 10, clinical laboratory data beginning in week 11, and commercial laboratory data beginning in week 14.
View Data Table


During week 4 compared with week 3, the percentage of specimens testing positive for SARS-CoV-2 decreased in all HHS regions.

Additional virologic surveillance information: Surveillance Methods


Outpatient/Emergency Department Illness


Two syndromic surveillance systems, the U.S. Outpatient Influenza-like Illness Surveillance Network (ILINet) and the National Syndromic Surveillance Program (NSSP), are being used to monitor trends in outpatient and emergency department (ED) visits that may be associated with COVID-19 illness. Each system monitors activity in a slightly different set of providers/facilities and uses a slightly different set of symptoms that may be associated with SARS-CoV-2 virus infection. ILINet provides information about visits to outpatient providers or emergency departments for influenza-like illness (ILI: fever plus cough and/or sore throat) and NSSP provides information about visits to EDs for ILI and COVID-like illness (CLI: fever plus cough and/or shortness of breath or difficulty breathing). Some EDs contribute ILI data to both ILINet and NSSP. Both systems currently are being affected by changes in health care seeking behavior, including increased use of telemedicine and increased social distancing. These changes affect the numbers of people seeking care in the outpatient and ED settings. Syndromic data, including CLI and ILI, should be interpreted with caution and should be evaluated in combination with other sources of surveillance data, especially laboratory testing results, to obtain a complete and accurate picture of respiratory illness.

Nationally, the overall percentages of visits to EDs decreased for CLI and remained stable (change ≤0.1%) for ILI during week 4 compared with week 3. During week 4, the percentages of ED visits captured in NSSP for CLI and ILI were 5.1% and 1.0%, respectively. In ILINet, 1.1% of visits to outpatient providers or EDs reported during week 4 were for ILI, decreasing compared with week 3 and below the national baseline for the 42[SUP]nd[/SUP] consecutive week. This level of ILI is lower than is typical for ILINet during this time of year.
outpatient-emergency-visits.gif

resize iconView LargerView Data Table


The percentages of visits for ILI reported in ILINet in week 4 remained stable (change of ≤0.1%) for all age groups (0–4 years, 5–24 years, 25–49 years, 50–64 years, and 65 years and older) compared with week 3. However, during the past three weeks there has been a slightly increasing trend among those 0–4 years and a slightly decreasing trend among the remaining age groups.
percent-ili-visits-by-age.gif

resize iconView LargerView Data Table


On a regional levelexternal icon, during week 4 compared with week 3, all ten regions reported a decreasing level of CLI and a stable (change of ≤0.1%) or decreasing level of ILI.

ILI Activity Levels

Data collected in ILINet are used to produce a measure of ILI activity for all 50 states, Puerto Rico, the U.S. Virgin Islands, the District of Columbia, New York City, and for each core-based statistical area (CBSA) where at least one provider is located. The mean reported percentage of visits due to ILI for the current week is compared with the mean reported during non-influenza weeks, and the activity levels correspond to the number of standard deviations below, at, or above the mean.

The number of jurisdictions at each activity level during week 4 and the previous week are summarized in the table below.
Activity Level
Week 4 (Week ending Jan. 30, 2021)Week 3 (Week ending Jan. 23, 2021)Week 4 (Week ending Jan. 30, 2021)Week 3 (Week ending Jan. 23, 2021)
Very High0000
High0023
Moderate0054
Low011922
Minimal5453587602
Insufficient Data11316298

[TD="colspan: 2"] Number of Jurisdictions [/TD]
[TD="colspan: 2"] Number of CBSAs [/TD]

*Note: Data collected in ILINet may disproportionally represent certain populations within a state and may not accurately depict the full picture of respiratory disease activity for the whole state. Differences in the data presented here by CDC and independently by some state health departments likely represent differing levels of data completeness with data presented by the state likely being the more complete.

Additional information about medically attended outpatient and emergency department visits for ILI and CLI: Surveillance Methods

Hospitalizations


The COVID-19-Associated Hospitalization Surveillance Network (COVID-NET) conducts population-based surveillance for laboratory-confirmed COVID-19-associated hospitalizations in select counties participating in the Emerging Infections Program (EIP) and the Influenza Hospitalization Surveillance Project (IHSP).

A total of 136,007 laboratory-confirmed COVID-19-associated hospitalizations were reported by sites between March 1, 2020, and January 30, 2021. The overall cumulative hospitalization rate was 417.2 per 100,000 population. For the past three months, since the week ending November 7, 2020 (MMWR Week 45), the overall weekly hospitalization rate has remained in an elevated plateau above earlier peaks in the pandemic. The hospitalization rates for the most recent week are expected to be higher as additional data are reported in future weeks.
lab-confirmed-hospitalizations-weekly.gif

resize iconView Larger


[SUP]1[/SUP]Additional hospitalization rate data by age group are available.

Among the 136,007 laboratory-confirmed COVID-19-associated hospitalizations, 132,932 (97.7%) had information on race and ethnicity, while collection of race and ethnicity was still pending for 3,075 (2.3%) cases. When examining age-adjusted hospitalization rates by race and ethnicity, compared with non-Hispanic White persons, hospitalization rates were 3.6 times higher among non-Hispanic American Indian or Alaska Native persons, 3.2 times higher among Hispanic or Latino persons, and 2.9 times higher among non-Hispanic Black persons.


When examining age-stratified crude hospitalization rates by race and ethnicity, compared with non-Hispanic White persons in the same age group, crude hospitalization rates were 4.0 times higher among Hispanic or Latino persons aged 0–17 years,6.5 times higher among Non-Hispanic American Indian or Alaska Native persons aged 18–49 years,4.6 times higher among non-Hispanic American Indian or Alaska Native persons aged 50–64 years, and 2.3 times higher among non-Hispanic American Indian or Alaska Native and non-Hispanic Black persons aged >65 years.

37.02.839.93.151.74.017.61.413.01.0
638.06.5372.73.8518.75.3123.31.398.51.0
1454.24.61080.33.41255.53.9390.61.2318.51.0
2208.02.32173.72.32114.22.2864.70.9960.91.0
901.73.6708.42.9794.03.2260.21.1247.31.0
[SUP]1 [/SUP]COVID-19-associated hospitalization rates by race and ethnicity are calculated using COVID-NET hospitalizations with known race and ethnicity for the numerator and NCHS bridged-race population estimates for the denominator.
[SUP]2[/SUP] For each age category, rate ratios are the ratios between crude hospitalization rates within each racial and ethnic group and the crude hospitalization rate among non-Hispanic White persons in the same age category.
[SUP]3[/SUP] The highest rate ratio in each age category is presented in bold.
[SUP]4[/SUP] Overall rates are adjusted to account for differences in age distributions within race and ethnicity strata in the COVID-NET catchment area; the age strata used for the adjustment include 0–17, 18–49, 50–64, 65-74, 75-84 and 85+ years.

Non-Hispanic White persons and non-Hispanic Black persons represented the highest proportions of hospitalizations reported to COVID-NET, followed by Hispanic or Latino, non-Hispanic Asian or Pacific Islander, and non-Hispanic American Indian or Alaska Native persons. However, some racial and ethnic groups are disproportionately represented among hospitalizations compared with the overall population of the catchment area. Prevalence ratios were highest among non-Hispanic American Indian or Alaska Native persons, followed by non-Hispanic Black persons and Hispanic or Latino persons.
1.3%26.6%19.6%5.1%41.4%
0.7%17.9%14.1%8.9%58.5%
1.91.51.40.60.7
[SUP]1[/SUP]Persons of multiple races (0.3%) or unknown race and ethnicity (5.6%) are not represented in the table but are included as part of the denominator.
[SUP]2[/SUP] Prevalence ratio is calculated as the ratio of the proportion of COVID-NET hospitalizations over the proportion of population in COVID-NET catchment area.

For underlying medical conditions, data were restricted to cases reported during March 1–November 30, 2020, due to delays in reporting. During this time frame, sampling was conducted among hospitalized adults; therefore, weighted percentages are reported. No sampling was conducted among hospitalized children. Among 17,452 sampled adults hospitalized during March 1–November 30 with information on underlying medical conditions, 90.9% had at least one reported underlying medical condition. The most reported underlying medical conditions were hypertension (56.1%), obesity (49.1%), metabolic disease (42.1%), which includes diabetes, and cardiovascular disease (33.2%). Among 1,369 children hospitalized during March 1–November 30, 2020 with information on underlying conditions, 52.7% had at least one reported underlying medical condition. The most reported underlying medical conditions were obesity (37.4%), neurologic disease (12.9%), and asthma (11.7%).

Additional data on demographics, signs and symptoms at admission, underlying medical conditions, interventions, outcomes, and discharge diagnoses, stratified by age, sex, and race and ethnicity, are available.

Additional hospitalization surveillance information:
Surveillance Methods | Additional rate data | Additional demographic and clinical data


Mortality Surveillance


The National Center for Health Statistics (NCHS) collects death certificate data from vital statistics offices for all deaths occurring in the United States. Based on death certificate data available on February 4, 2021, the percentage of deaths attributed to pneumonia, influenza, or COVID-19 (PIC) during week 4 was 28.4%; it remains above the epidemic threshold of 7.1%. This percentage is expected to increase as more death certificates are processed. Among the 6,424 PIC deaths reported for week 4, 5,648 had COVID-19 listed as an underlying or contributing cause of death on the death certificate and four listed influenza, indicating that the recent increase in PIC mortality is due primarily to COVID-19 and not influenza.

The weekly percentage of deaths due to PIC reached the highest point in the pandemic during the week ending January 9, 2021 (32.7%), and exceeded the previous peak (27.7% in April 2020) for nine consecutive weeks through the current week. Data for the past three weeks show a declining trend in the percentage of deaths due to PIC compared to the December peak, but this percentage is expected to change as additional death certificates are processed. Weekly mortality surveillance data include a combination of machine coded and manually coded causes of death collected from death certificates. Prior to week 4 (the week ending January 30, 2021), the percentages of deaths due to (PIC) were higher among manually coded records than more rapidly available machine coded records. Improvements have been made to the machine coding process that allow for more COVID-19 related deaths to be machine coded, and going forward, the percentage of PIC deaths among machine coded and manually coded data are expected to be more similar. The data presented are preliminary and expected to change as more data are received and processed but the amount of change in the percentage of deaths due to PIC should be lower going forward. Weeks for which the largest changes in the percentage of deaths due to PIC may occur are highlighted in gray in the figure below and should be interpreted with caution.
nchs-mortality-report.gif

resize iconView Larger


*Data during recent weeks are incomplete because of the lag in time between when the death occurred and when the death certificate is completed, submitted to NCHS and processed for reporting purposes. It is possible that a death certificate includes both influenza and COVID as a cause of death; therefore, the number of influenza and COVID coded deaths may not be mutually exclusive.
View Data Table


Additional NCHS mortality surveillance information: Surveillance Methods | Provisional Death Counts for COVID-19
More Information
View Page In:pdf icon 981 KB, 11 Pages
 
New format....

covid-tracker-header-lrg.jpg
COVID Data Tracker Weekly Review


Updated Feb. 12, 2021
Print
Subscribe to the Weekly Review
Interpretative Summary for February 12, 2021
“Better, but not good enough”


Don’t let your guard (or mask) down. COVID-19 cases, hospitalizations, and deaths continue to trend downward. But even with that progress, the daily numbers of new cases and deaths remain much higher than the first two peaks of the pandemic in the spring and summer of 2020.

The COVID-19 pandemic has crossed the one-year mark. About 27 million cases and about 470,000 deaths have been reported to CDC since the first case was identified in the United States on January 20, 2020. The numbers of COVID-19 cases, hospitalizations, and deaths vary substantially below the national level, and to help explain these differences future versions of COVID Data Tracker Weekly Review will present surveillance trends at the regional, state, or county levels. A national milestone in vaccinations was reached this week on February 11 with about 34.7 million people receiving at least one dose of vaccine, which is 10.5% of the U.S. population. This is terrific progress.

CDC’s goal is to get the pandemic under control as quickly as possible, both to save lives and to help people get back to the many important things they need and want to do. The emergence of variants, such as B.1.1.7, reminds us that we all need to re-double our efforts to prevent the spread of COVID-19. It is more important than ever that we all wear well-fitting masks, stay at least 6 feet apart from people we don’t live with, avoid crowds and poorly ventilated spaces, and wash our hands often. These practices done well by all of us, together with the continued effort to vaccinate more people, can help end this pandemic.


Reported Cases


Compared with a national peak of 314,093 cases reported to CDC on January 8, 2021, the daily number of cases has declined by 69%. The current 23% decrease in the 7-day average number of daily cases reported also provides an encouraging sign of recent progress. Even with these declines, however, the 97,309 cases reported on February 11 remains higher than what was seen during either of the first two peaks in the pandemic.

97,309
New Cases Reported

104,217
Current 7-Day Average

27,127,858
Total Cases Reported

134,524
Prior 7-Day Average

314,093
High

-22.5%
Change in 7-Day Average

Daily Trends in COVID-19 Cases in the United States Reported to CDC
red-line.jpg

7-Day moving average


More data.
resize iconView Larger
More Case Data

Vaccinations


The U.S. COVID-19 Vaccination Program began December 14. As of February 11, 2021, 46.4 million vaccine doses have been administered. Overall, about 34.7 million people have received at least one dose of vaccine, which is 10.5% of the U.S. population, and about 11.2 million people have received two doses of vaccine, which is 3.4% of the U.S. population. As of February 11, the 7-day average number of administered vaccine doses reported to CDC per day was 1.6 million, which was a 24% acceleration from the previous week.

46,390,270
Vaccines Administered

34,732,964
People who received 1 or more doses

11,188,782
People who received 2 doses

Daily Change in Number of COVID-19 Vaccinations in the United States Reported to CDC

red-line.jpg

7-Day moving average


More data.
resize iconView Larger
More Vaccination Data

New Hospital Admissions


The numbers of new hospital admissions of patients with confirmed COVID-19 have decreased from the national peak of 18,081 admissions on January 5, 2021 to 8,957 admissions on February 9 (a 50% decrease). The average number of daily admissions fell by 14% over the past week.

8,957
New Admissions

9,279
Current 7-Day Average

1,690,996
Total New Admissions

10,845
Prior 7-Day Average

18,081
High

-14.4%
Change in 7-Day Average

Daily Trends in Number of New COVID-19 Hospital Admissions in the United States Reported to CDC


More data.external icon Data for most recent week are affected by incomplete reporting (grey shaded area).
resize iconView Larger
More Hospital Dataexternal icon

Deaths


Nationally, the number of COVID-19 deaths peaked on February 4, 2021 at 5,189 deaths reported. Though the 3,645 deaths reported on February 11 is substantially lower (30% decrease), the current change in the 7-day average number of deaths was negligible (1.4% decrease). Daily mortality remains higher than in previous waves of the pandemic.

3,645
New Deaths Reported

3,013
Current 7-Day Average

470,110
Total Deaths Reported

3,056
Prior 7-Day Average

5,189
High

-1.4%
Change in 7-Day Average

Daily Trends in Number of COVID-19 Deaths in the United States Reported to CDC
red-line.jpg

7-Day moving average


More data.
resize iconView Larger
More Death Data

SARS-CoV-2 Variants


Three SARS-CoV-2 (the virus that causes COVID-19) variants of concern have been detected in the United States: B.1.1.7, B.1.351, and P.1. A total of 981 B.1.1.7 variant cases have been detected in 37 states, which is a 61% increase in the number of B.1.1.7 cases reported by CDC compared with the previous week (611 cases). Thirteen cases with B.1.351 in five states and three cases with P.1 in two other states have also been detected in the United States. CDC and partners are increasing the numbers of specimens sequenced in laboratories around the country. Studies to determine whether variants cause more severe illness or are likely to evade immunity are underway. For technical description, see https://www.cdc.gov/coronavirus/2019...nts/index.html.

Variant

Reported Cases in US

Number of States with ≥1 Case Reported

B.1.1.7

981

37

B.1.351

13

5

P.1

3

2

Emerging Variant Cases of B.1.1.7 in the United States


More data.
resize iconView Larger
More Variants Data
Note on new format: Effective Friday, February 12, 2021, COVIDView has been replaced with this new COVID Data Tracker Weekly Review. This new webpage and newsletter include key visuals from the week and narrative interpretations using data from CDC’s COVID Data Tracker. Additional priority data will be added in future weeks, including race and ethnicity.

The Coronavirus Disease 2019 (COVID-19)-Associated Hospitalization Surveillance Network (COVID-NET) is an additional source for hospitalization data collected through a network of over 250 acute-care hospitals in 14 states (~10% of the U.S. population). Detailed data on patient demographics, including race/ethnicity, underlying medical conditions, medical interventions, and clinical outcomes, are collected using a standardized case reporting form.

Other new data views on CDC’s website include county-specific summaries (under “Your Community” in Data Tracker), vaccination trends (under “Your Community” in Data Tracker), and information on SARS-CoV-2 variants.


https://www.cdc.gov/coronavirus/201...ronavirus/2019-ncov/covid-data/covidview.html
 
covid-tracker-header-lrg.jpg
COVID Data Tracker Weekly Review for February 19, 2021


Updated Feb. 19, 2021
Print
Subscribe to the Weekly Review


Interpretative Summary for February 19, 2021
Stop variants by stopping the spread


Viruses change (or mutate) all the time. While most changes do not affect how the virus behaves, every time a virus makes a copy of itself (or replicates) it has the potential to produce a variant virus that can spread more easily, cause more severe disease, or resist the body’s ability to fight them naturally or with vaccination. The best way to stop new variants from emerging is to stop the virus from spreading within our communities.

Just as we are working to fight the COVID-19 pandemic, emerging variants are threatening progress. If one of the variants is able to evade the vaccine, our progress will be slowed or potentially reversed. Our window of opportunity to halt the pandemic is now.

Three SARS-CoV-2 variants in particular have concerned global public health and healthcare leaders to date. This week, CDC published three reports on two of the variants. [SUP]1,2,3[/SUP] Data from two new MMWR reports highlight how these variants present challenges both in the United States and internationally. One report showed that people in Minnesota with no recent travel to the United Kingdom (U.K.) were infected with the B.1.1.7 variant, first detected in the U.K. late last year. Another report found sharp increases in COVID-19 cases in Zambia that corresponded with an increase in infections caused by the variant that recently emerged in South Africa (the B.1.351 variant).

By the time a variant is detected in a community, it may already be spreading. Proven strategies to prevent spread can limit the impact of these variants. We can stop variants by decreasing cases. Everyone should wear a well-fitting mask and follow CDC’s prevention recommendations.


SARS-CoV-2 Variants


Three SARS-CoV-2 (the virus that causes COVID-19) variants of concern have been detected in the United States: B.1.1.7, B.1.351, and P.1.

The B.1.1.7 variant was first detected in the United Kingdom in December 2020 and likely first emerged there in September 2020. Colorado reported the first U.S. case of the B.1.1.7 variant in late December 2020. Since then, B.1.1.7 has been detected in at least 42 jurisdictions. Preliminary data from the United Kingdom suggest that the B.1.1.7 variant spreads more easily and may cause more severe disease than previous variants of SARS-CoV-2.[SUP]4[/SUP]

The B.1.351 variant was first detected in the Republic of South Africa in December 2020, and likely first emerged there in October 2020. At least 35 countries, including the United States, have detected COVID-19 cases of infection with the B.1.351 variant. The first detected U.S. cases of infection with the B.1.351 variant occurred in South Carolina and Maryland in late January 2021 and have now been documented in at least 10 jurisdictions. Some data suggest that people previously infected with SARS-CoV-2 may have less immune protection if they are re-infected with the B.1.351 variant.

The P.1 variant was first detected in Japan in travelers from Brazil in January 2021. Minnesota reported the first U.S. case of infection with the P.1 variant in January 2021 and P.1 has now been identified in Oklahoma, Maryland, and Florida.

Modeling data have shown that a more contagious variant could lead to more cases, which would worsen the U.S. pandemic and reverse the recent decreases in numbers of new COVID-19 cases reported.[SUP]5[/SUP]

A total of 1,523 B.1.1.7 variant cases have been reported in 42 jurisdictions. Twenty-one cases with B.1.351 in 10 jurisdictions and five cases with P.1 in four other states have also been detected in the United States. CDC and partners are increasing the numbers of specimens sequenced in laboratories around the country. The number of variants reported will likely increase as more specimens are sequenced and if the frequency of variants increases. Studies to determine whether variants cause more severe illness or are likely to evade immunity are underway.

Emerging Variant Cases of B.1.1.7 in the United States


More data.
resize iconView Larger
More Variants Data
Variant

Reported Cases in US

Number of States with ≥1 Case Reported

B.1.1.7

1,523

42

B.1.351

21

10

P.1

5

4


Reported Cases


There has been a five-week downward trend in cases. The highest 7-day moving average occurred on January 11, 2021 and was 249,048. The current 7-day average is 77,385 cases, which is a 68.9% decline. The 24.5% decrease in the 7-day average number of daily cases reported compared with the prior week also provides an encouraging sign of recent progress. Even with these declines, however, the 69,165 cases reported on February 17 remains higher than what was seen during either of the first two peaks in the pandemic.

69,165
New Cases Reported

77,385
Current 7-Day Average

27,669,556
Total Cases Reported

102,531
Prior 7-Day Average

314,972
Peak*

-24.5%
Change in 7-Day Average

*Highest peak for new cases in a single day (Jan. 8, 2021).

Daily Trends in COVID-19 Cases in the United States Reported to CDC
red-line.jpg

7-Day moving average


More data.
resize iconView Larger
More Case Data


Testing


Percent positivity continues to decline. The 7-day average of percent positivity from RT-PCR tests is now 5.9%. Six states or territories remain over 10% positivity. The 7-day average test volume for February 5–11, 2021 was 1,221,104, down 16% from 1,452,976 the prior 7 days.

317,819,568
Total Tests Reported

1,221,104
7-Day Average Test

5.9%
7-Day Average % Positivity

-15.6%
Change in 7-Day % Positivity

COVID-19 Viral (RT-PCR) Laboratory Test 7-day Percent Positivity by State/Territory


More data.
resize iconView Larger
More Testing Dataexternal icon


Vaccinations


The U.S. COVID-19 Vaccination Program began December 14. As of February 18, 2021, 57.7 million vaccine doses have been administered. Overall, about 41.0 million people have received at least one dose of vaccine, which is 12.4% of the U.S. population, and about 16.2 million people have received two doses of vaccine, which is 4.9% of the U.S. population. As of February 18, the 7-day average number of administered vaccine doses reported to CDC per day was 1.6 million, which was a 1.4% acceleration from the previous week.

57,737,767
Vaccines Administered

41,021,049
People who received 1 or more doses

16,162,358
People who received 2 doses

Daily Change in Number of COVID-19 Vaccinations in the United States Reported to CDC

red-line.jpg

7-Day moving average


More data.
resize iconView Larger
More Vaccination Data


New Hospital Admissions


The numbers of new hospital admissions of patients with confirmed COVID-19 have decreased from the national peak of 18,006 admissions on January 5, 2021 to 6,841 admissions on February 16 (a 62% decrease). The average number of daily admissions fell by 21.8% compared to the previous week.

6,841
New Admissions

7,229
Current 7-Day Average

1,730,332
Total New Admissions

9,244
Prior 7-Day Average

18,006
Peak

-21.8%
Change in 7-Day Average

Daily Trends in Number of New COVID-19 Hospital Admissions in the United States Reported to CDC


More data.external icon Data for most recent week are affected by incomplete reporting (grey shaded area).
resize iconView Larger
More Hospital Dataexternal icon


Deaths


Nationally, the number of COVID-19 deaths continue to fluctuate. There were 489,067 total COVID-19 deaths reported with 2,601 new deaths reported as of February 17, 2021. The 7-day average number of new deaths decreased by 9% to 2,708** new deaths per day compared to the previous 7-day period.

2,601
New Deaths Reported

2,708
Current 7-Day Average**

489,067
Total Deaths Reported

2,975
Prior 7-Day Average

5,520
Peak*

-9.0%
Change in 7-Day Average


* Highest peak for new deaths in a single day (Feb. 12, 2021). Please reference notes below for more detail.

** The 7-day average number of new deaths is impacted by a historical correction of 1,507 deaths on February 4, 2021 by Indiana, and 3,763 new deaths reported February 12-13, 2021 by Ohio. These reported deaths in Ohio include historical deaths reconciled from November and December. Without these historical corrections, the current 7-day average of new deaths is 2,171.

Daily Trends in Number of COVID-19 Deaths in the United States Reported to CDC
red-line.jpg

7-Day moving average


More data.
resize iconView Larger
More Death Data


Recent Publications
  1. Notes from the Field: First identified cases of SARS-CoV-2 variant B.1.1.7 in Minnesota — December 2020–January 2021
  2. Detection of B.1.351 SARS-CoV-2 Variant Strain — Zambia, December 2020
  3. SARS-CoV-2 Variants of Concern in the United States: Challenges and Opportunitiesexternal icon
  4. Horby P, Huntley C, Davies N, et al. NERVTAG note on B.1.1.7 severity. SAGE meeting report. January 21, 2021 pdf icon[81 KB, 9 Pages]external icon.
  5. Emergence of SARS-CoV-2 B.1.1.7 Lineage — United States, December 29, 2020–January 12, 2021
Notes

Note on new format: Effective Friday, February 12, 2021, COVIDView has been replaced with this new COVID Data Tracker Weekly Review. This new webpage and newsletter include visuals from the week and narrative interpretations using data from CDC’s COVID Data Tracker. Additional priority data will be added in future weeks, including race and ethnicity.

The Coronavirus Disease 2019 (COVID-19)-Associated Hospitalization Surveillance Network (COVID-NET) is an additional source for hospitalization data collected through a network of over 250 acute-care hospitals in 14 states (~10% of the U.S. population). Detailed data on patient demographics, including race/ethnicity, underlying medical conditions, medical interventions, and clinical outcomes, are collected using a standardized case reporting form.

Other new data views on CDC’s website include county-specific summaries (under “Your Community” in Data Tracker), vaccination trends (under “Your Community” in Data Tracker), and information on SARS-CoV-2 variants.
Last Updated Feb. 19, 2021

https://www.cdc.gov/coronavirus/2019-ncov/covid-data/covidview/past-reports/02192021.html
 
covid-tracker-header-lrg.jpg
COVID Data Tracker Weekly Review


Updated Feb. 26, 2021
Print
Subscribe to the Weekly Review


Interpretative Summary for February 26, 2021
Safer Communities Mean Safer Schools


Almost a year ago, as the COVID-19 pandemic started affecting our communities, schools throughout the country turned to virtual learning to help protect students, teachers, school staff, and their families. Today, schools use different strategies to prevent spread. Some teach class online, while others have opened safely and conduct in-person learning using multiple prevention strategies, even in areas with relatively high levels of community spread. Recent studies in schools that strictly followed multiple prevention strategies found that most cases in schools came from community spread of disease, not from spread within the school itself.[SUP]1[/SUP][SUP],2,3[/SUP] This means that each community has an opportunity to help schools return to in-person learning and make them safer by making their own community safer. How do we do that?

There are three important areas where we need to focus our attention to make communities safer.

1) Prevent spread to make your community safer
CDC recently published guidance for schools that highlights the critical need for communities to reduce spread to ensure a safe return to school and other activities. Communities that reduce the level of COVID-19 spread will foster greater opportunities for schools to safely return to in-person learning. Here are 6 steps to a safer community that each of us can do:
  1. Wear a well-fitting mask
  2. Stay 6 feet apart
  3. Avoid gatherings
  4. Wash hands often
  5. Stay home when you are sick
  6. Get vaccinated when vaccine is available to you
To see data from your community, visit CDC’s COVID Data Tracker.

2) Increase testing
The number of COVID-19 tests people are getting continues to decline nationally. The average volume of tests over a seven-day period is down 20.2% from last week. Anyone who has symptoms of COVID-19 should be tested. Anyone who has been around someone with COVID-19 should also be tested. Additionally, last week the U.S. Department of Health and Human Services announcedexternal icon efforts to expand COVID-19 testing for schools and people living and gathering in group settings, such as homeless shelters. By increasing testing, we can quickly identify people who have COVID-19 and isolate them from others, take steps to prevent further spread, and better address the threat of variants.

3) Continue rapid vaccination scale-up
Vaccination rates continue to increase and as of February 25, 2021, 13.9% of the U.S. population has received one or more doses of the vaccine. Additional data were released this week to visually show how many people in each state and nationally have been vaccinated. Vaccinating more adults, including essential workers such as teachers and educational staff, is critical to curbing the pandemic.


Reported Cases


There has been a six-week downward trend in cases. The highest 7-day average of 249,303 occurred on January 11, 2021. The current 7-day average is 66,348 cases, a 73.4% decline. The 13.5% decrease in the 7-day average number of daily cases reported compared with the prior week provides an encouraging sign of recent progress. Even with these declines, the 74,806 cases reported on February 24 remains much higher than what was seen during the first peak in the pandemic.

74,806
New Cases Reported

66,348
Current 7-Day Average

28,138,938
Total Cases Reported

76,741
Prior 7-Day Average

249,303
Peak*

-13.5%
Change in 7-Day Average since Prior Week

*Highest peak for 7-day average (January 11, 2021).

Daily Trends in COVID-19 Cases in the United States Reported to CDC
red-line.jpg

7-Day moving average


More data.
resize iconView Larger
More Case Data


SARS-CoV-2 Variants


CDC is closely tracking variants of SARS-CoV-2, the virus that causes COVID-19. Three variants of concern have been detected in the United States: B.1.1.7, B.1.351, and P.1. A total of 2,102 B.1.1.7 variant cases have been reported in 45 jurisdictions. Forty-nine cases with B.1.351 in 15 jurisdictions and six cases with P.1 in five states have also been detected in the United States. CDC and partners are increasing the numbers of specimens sequenced in laboratories around the country. The number of variants reported will likely increase as more specimens are sequenced and if the frequency of variants increases. Studies are underway to determine whether variants cause more severe illness or are likely to evade immunity brought on by prior illness or vaccination.

Variant

Reported Cases in US

Number of Jurisdictions with ≥1 Case Reported

B.1.1.7

2,102

45

B.1.351

49

15

P.1

6

5


Emerging Variant Cases of B.1.1.7 in the United States


More data.
resize iconView Larger
More Variants Data


Testing


The number of COVID-19 tests that come back positive (percent positivity) continues to decline. The 7-day average of percent positivity from RT-PCR tests is now 5.2%. Four states or territories remain at 10% positivity or higher. The 7-day average test volume for February 12-18, 2021 was 1,066,213, down 20.2% from 1,335,763 the prior 7 days.

327,903,802
Total Tests Reported

1,066,213
7-Day Average Test

5.2%
7-Day Average
% Positivity


-14.5%
Change in 7-Day
% Positivity

COVID-19 Viral (RT-PCR) Laboratory Test 7-day Percent Positivity by State/Territory


More data.
resize iconView Larger
More Testing Dataexternal icon


Vaccinations


The U.S. COVID-19 Vaccination Program began December 14. As of February 25, 2021, 68.3 million vaccine doses have been administered. Overall, about 46.1 million people, or 13.9% of the U.S. population, have received at least one dose of vaccine. About 21.6 million people, or 6.5% of the U.S. population, have received two doses of vaccine. As of February 25, the 7-day average number of administered vaccine doses reported to CDC per day was 1.5 million, a 7.1% decrease from the previous week likely due to weather events.

68,274,117
Vaccines Administered

46,074,392
People who received 1 or more doses

21,555,117
People who received 2 doses

Daily Change in Number of COVID-19 Vaccinations in the United States Reported to CDC

red-line.jpg

7-Day moving average


More data.
resize iconView Larger
More Vaccination Data


New Hospital Admissions


Hospital admissions of patients with confirmed COVID-19 decreased 61% from the national 7-day average peak of 16,536 admissions on January 9, 2021, to 6,431 admissions on February 23, 2021. The average number of daily admissions fell by 11.3%, compared to the previous week.

6,562
New Admissions

6,431
Current 7-Day Average

1,775,508
Total New Admissions

7,250
Prior 7-Day Average

16,536
Peak 7-Day Average

-11.3%
Change in 7-Day Average

Daily Trends in Number of New COVID-19 Hospital Admissions in the United States


More data.external icon The most recent data in the vertical gray bar are provisional and should be interpreted with caution.
resize iconView Larger
More Hospital Dataexternal icon


Deaths


Tragically, this week the United States passed a total of 500,000 deaths since the start of the pandemic. Nationally, the number of COVID-19 deaths continue to fluctuate. As of February 24, 2021, a total of 503,587 COVID-19 deaths were reported. The current 7-day average of deaths is 2,047 deaths, a 23.8% decrease from the previous 7-day average of 2,687 daily deaths.

2,407
New Deaths Reported

2,047
Current 7-Day Average**

503,587
Total Deaths Reported

2,687
Prior 7-Day Average**

3,373
Peak of 7-day Average*

-23.8%
Change in 7-Day Average Since Prior Week


*The most recent (highest) peak in the 7-day average of new cases (Jan 11, 2021).

** The seven-day average number of new deaths (excluding historical deaths reported in the past two weeks) decreased by 4.8% to 2,047 new deaths per day compared to the previous seven-day average of 2,150. In the current week, there were 0 historical deaths reported, and in the prior week, there were 3,763 historical deaths reported by the state of Ohio.

Daily Trends in Number of COVID-19 Deaths in the United States Reported to CDC
red-line.jpg

7-Day moving average


More data.
resize iconView Larger
More Death Data


Recent Publications
  1. Science Brief: Transmission of SARS-CoV-2 in K-12 schools
  2. Zimmerman KO, Akinboyo IC, Brookhart MA, et al. Incidence and secondary transmission of SARS-CoV-2 infections in schools.external icon Pediatrics 2021;e2020048090.
  3. Falk A, Benda A, Falk P, Steffen S, Wallace Z, H?eg TB. COVID-19 cases and transmission in 17 K–12 schools—Wood County, Wisconsin, August 31–November 29, 2020. MMWR Morb Mortal Wkly Rep 2021;70:136–40.
Notes

The Coronavirus Disease 2019 (COVID-19)-Associated Hospitalization Surveillance Network (COVID-NET) is an additional source for hospitalization data collected through a network of more than 250 acute-care hospitals in 14 states (representing ~10% of the U.S. population). Detailed data on patient demographics, including race/ethnicity, underlying medical conditions, medical interventions, and clinical outcomes, are collected using a standardized case reporting form.

CDC’s website also provides new data views such as county-specific summaries (under “Your Community” in Data Tracker), vaccination trends (under “Your Community” in Data Tracker), and information on SARS-CoV-2 variants.
homeCases, Data & Surveillance
https://www.cdc.gov/coronavirus/2019-ncov/covid-data/covidview/index.html
 
These reports are missing the California variant even though that variant is reportedly responsible for 50% of the COVID cases now. ???
 
covid-tracker-header-lrg.jpg
COVID Data Tracker Weekly Review


Updated Mar. 5, 2021
Print
Subscribe to the Weekly Review


Interpretative Summary for March 5, 2021
An Effective New Tool in the Toolbox


Vaccines are critical tools for ending the COVID-19 pandemic, and we just got a new one. On February 28, CDC released an official recommendation to use Johnson & Johnson?s Janssen (J&J/Janssen) vaccine, which is safe and effective in preventing severe COVID-19 illness, hospitalization, and death. This vaccine is being distributed now. The J&J/Janssen vaccine protects against COVID-19 in one dose, not two, and can be stored at a standard refrigerator temperature instead of needing colder storage. These advantages can help the vaccine reach most communities and mobile sites, as the supply of vaccines increases.

Vaccinations, wearing a well-fitted mask, and taking other precautions to prevent the spread of COVID-19 can help end the pandemic. We need to use all tools in the toolbox, accelerate vaccination and ensure vaccines are distributed equitably, and learn from our initial successes.

Use all tools in the toolbox. On February 27, 2021, the Food and Drug Administration (FDA) issued an Emergency Use Authorization (EUA) for the J&J/Janssen vaccine. On February 28, 2021, CDC?s Advisory Committee on Immunization Practices (ACIP) issued an interim recommendation for use of the J&J/Janssen COVID-19 vaccine in people 18 years of age and older for the prevention of COVID-19.[SUP]1[/SUP] This vaccine is the third COVID-19 vaccine authorized under an EUA for the prevention of COVID-19 in the United States. CDC?s COVID Data Tracker has begun providing data by type of vaccine, which will soon include the J&J/Janssen vaccine.

Accelerate vaccination and ensure equity. Vaccination has continued to increase this week with 16.3% of the total population vaccinated with at least one dose (including 21.2% 18 years of age and older) as of March 4, 2021. CDC provides vaccination data by race and ethnicity, age, and sex. Continued efforts are needed at the national, state and local levels to monitor for and ensure equity in vaccine distribution and administration.

Learn from our initial success. Cases in skilled nursing facilities, for example, have declined up to 80% from the peak in late December. As we enter spring, we need to stay focused on reducing spread in our communities. This means we need to continue to practice proven prevention strategies including wearing a well-fitted mask, staying six feet apart from people we don?t live with, avoiding gatherings, washing hands often, staying home when sick, and getting vaccinated when the vaccine is available to you.


Reported Cases


Beginning on January 11, the 7-day average of newly reported cases declined for 43 consecutive days. There was a brief increase between February 27 and March 1, 2021; and as of March 2, the 7-day average of new cases began to decline again. There has been an overall decline of 74.9% of the 7-day moving average since the highest 7-day average of 249,360 on January 11, 2021. On March 3, there was a 5.7% decrease in the 7-day average number of daily cases reported compared with the prior week, which provides an encouraging sign of continued progress. Even with these declines, the 65,424 cases reported on March 3 remains much higher than what was seen during the first peak in the pandemic on April 6, 2020 of 42,597 cases.

65,424
New Cases Reported

62,555
Current 7-Day Average**

28,580,198
Total Cases Reported

66,306
Prior 7-Day Average

249,360
Peak of 7-Day Average*

-5.7%
Change in 7-Day Average since Prior Week

*Highest peak for 7-day average (January 11, 2021).

** The current 7-day average of new cases is impacted by a historical correction of 8,585 cases; 2,990, 1,840, and 1,641 historical cases were reported by Texas on February 27, March 1 and March 3, 2021, respectively; and Alabama reported a historical correction of 2,114 cases on March 3, 2021. The 7-day average number of new cases (excluding historical cases reported in the past two weeks) decreased by 7.5% to 61,329 new cases per day compared to the previous 7-day average of 66,306.

Daily Trends in COVID-19 Cases in the United States Reported to CDC
red-line.jpg

7-Day moving average

resize iconView Larger
More Case Data


SARS-CoV-2 Variants


CDC is closely tracking variants of SARS-CoV-2, the virus that causes COVID-19. Three variants of concern have been detected in the United States: B.1.1.7, B.1.351, and P.1. A total of 2,672 B.1.1.7 variant cases have been reported in 48 jurisdictions. Sixty-eight cases attributed to B.1.351 in 17 jurisdictions and 13 cases attributed to P.1 in seven states have also been detected in the United States. CDC and partners are increasing the numbers of specimens sequenced in laboratories around the country. The number of variants reported will likely increase as more specimens are sequenced and if the frequency of variants increases. Studies are underway to determine whether variants cause more severe illness or are likely to evade immunity brought on by prior illness or vaccination. CDC published two reports this week on variants. [SUP]2,[/SUP][SUP]3[/SUP]

Variant

Reported Cases in US

Number of Jurisdictions with ?1 Case Reported

B.1.1.7

2,672

48

B.1.351

68

17

P.1

13

7


Emerging Variant Cases of B.1.1.7 in the United States

resize iconView Larger
More Variants Data and Maps


Testing


The percent of COVID-19 RT-PCR tests that are positive (percent positivity) continues to decline. The 7-day average of percent positivity from tests is now 4.5%. The 7-day average test volume for February 19-25, 2021 was 1,212,844, up 10.5% from 1,097,940 the prior 7 days.

337,114,841
Total Tests Reported

1,212,844
7-Day Average Test Volume

4.5%
7-Day Average
% Positivity


-13.4%
Change in 7-Day
% Positivity

COVID-19 Viral (RT-PCR) Laboratory Test 7-day Percent Positivity by State/Territory

resize iconView Larger
More Testing Dataexternal icon


Vaccinations


The U.S. COVID-19 Vaccination Program began December 14. As of March 4, 2021, 82.6 million vaccine doses have been administered. Overall, about 54.0 million people, or 16.3% of the U.S. population, have received at least one dose of vaccine. About 27.8 million people, or 8.4% of the U.S. population, have received two doses of vaccine. As of March 4, the 7-day average number of administered vaccine doses reported to CDC per day was 2.0 million, a 36% increase from the previous week. Data by type of vaccine, which will soon include the J&J/Janssen vaccine, is available on CDC?s COVID Data Tracker.

82,572,848
Vaccines Administered

54,035,670
People who received 1 or more doses

27,795,980
People who received 2 doses

Daily Change in Number of COVID-19 Vaccinations in the United States Reported to CDC

red-line.jpg

7-Day moving average

resize iconView Larger
More Vaccination Data


New Hospital Admissions


Hospital admissions of patients with confirmed COVID-19 decreased 67% from the national 7-day average peak of 16,540 admissions on January 9, 2021 to a 7-day average of 5,490 admissions on March 2, 2021. The average number of daily admissions fell by 14.8%, compared to the previous week.

5,390
New Admissions

5,490
Current 7-Day Average

1,814,606
Total New Admissions

6,446
Prior 7-Day Average

16,540
Peak 7-Day Average

-14.8%
Change in 7-Day Average

Daily Trends in Number of New COVID-19 Hospital Admissions in the United States


The most recent data in the vertical gray bar are provisional and should be interpreted with caution.
resize iconView Larger
More Hospital Data


Deaths


In recent weeks, the number of COVID-19 deaths has fluctuated. However, there has been an overall decline of 43.1% of the 7-day moving average since January 13, 2021. As of March 3, 2021, a total of 517,224 COVID-19 deaths were reported. The current 7-day average of deaths is 1,921 deaths, a 6.7% decrease from the previous 7-day average of 2,060 daily deaths.

1,947
New Deaths Reported

1,921
Current 7-Day Average**

517,224
Total Deaths Reported

2,060
Prior 7-Day Average

3,378
Peak of 7-day Average*

-6.7%
change in the 7-Day Average Since the Prior Week


*The most recent (highest) peak in the 7-day average of new deaths (Jan 11, 2021).

**The current 7-day average of new deaths is impacted by a historical correction of 806 deaths reported by California on February 25, 2021. The 7-day average number of new deaths (excluding historical deaths reported in the past two weeks) decreased by 9.8% to 1,877 new deaths per day compared to the previous 7-day average of 2,060.

Daily Trends in Number of COVID-19 Deaths in the United States Reported to CDC
red-line.jpg

7-Day moving average

resize iconView Larger
More Death Data


Recent Publications
  1. The Advisory Committee on Immunization Practices? Interim Recommendation for Use of Janssen COVID-19 Vaccine ? United States, February 2021Transmission of SARS-CoV-2 in K-12 schools
  2. First Identified Cases of SARS-CoV-2 Variant P.1 in the United States ? Minnesota, January 2021
  3. Travel from the United Kingdom to the United States by a Symptomatic Patient Infected with the SARS-CoV-2 B.1.1.7 Variant ? Texas, January 2021
Notes

The Coronavirus Disease 2019 (COVID-19)-Associated Hospitalization Surveillance Network (COVID-NET) is an additional source for hospitalization data collected through a network of more than 250 acute-care hospitals in 14 states (representing ~10% of the U.S. population). Detailed data on patient demographics, including race/ethnicity, underlying medical conditions, medical interventions, and clinical outcomes, are collected using a standardized case reporting form.

CDC?s website also provides new data views such as county-specific summaries (under ?Your Community? in Data Tracker), vaccination trends (under ?Your Community? in Data Tracker), and information on SARS-CoV-2 variants.

https://www.cdc.gov/coronavirus/2019-ncov/covid-data/covidview/index.html
 
covid-tracker-header-lrg.jpg
COVID Data Tracker Weekly Review for March 12, 2021


Updated Mar. 12, 2021
Print
Subscribe to the Weekly Review


Interpretive Summary for March 12, 2021
The Unequal Toll of the COVID-19 Pandemic


The COVID-19 pandemic continues to deepen health disparities in our country. Long-standing inequalities have increased the risk for severe COVID-19 illnesses and death for many people. This both causes and continues disparities between racial and ethnic minority groups and non-Hispanic white people. Unequal health risks are the result of different conditions where people live, work, learn, play, and age?what we call social determinants of health.

By improving race and ethnicity data collection and reporting, we continue to increase our understanding of health disparities related to COVID-19. This knowledge helps us create more equitable public health policies and prevention strategies. Using multiple sources, CDC data show that the risks for COVID-19 illness, hospitalization, and death differ by race and ethnicity.
  • American Indian and Alaska Native people were 3.7 times more likely than non-Hispanic white people to be hospitalized and 2.4 times more likely to die from COVID-19 infection.
  • Black or African American people were 2.9 times more likely than non-Hispanic white people to be hospitalized and 1.9 times more likely to die from COVID-19 infection.
  • Hispanic and Latino people were 3.1 times more likely than non-Hispanic white people to be hospitalized and 2.3 times more likely to die from COVID-19 infection.
Among people under the age of 25, a study released this week found that COVID-19 case incidence disparities were higher among most racial and ethnic minority groups, particularly earlier in 2020. To track disparities, CDC provides race and ethnicity data for cases and deaths, and vaccinations. New dashboards on COVID Data Tracker display changes in the impact of the pandemic over time by race and ethnicity.

Social determinants of health contribute to racial and ethnic minority groups being disproportionately affected by COVID-19. Discrimination, which includes racism and associated chronic stress, influences each of these social determinants as well. We all have a role to play and must work together to ensure that people have resources to maintain and manage their physical and mental health, including easy access to information, affordable testing, vaccinations, and medical care.


Reported Cases


From January 11 through February 26, the 7-day average of newly reported cases declined daily. From February 27 through March 1, 2021, the 7-day average increased daily; however, as of March 2, the 7-day average of new cases began to decline again. Since the highest 7-day average of 249,378 on January 11, 2021, the 7-day moving average decreased 78.1%. On March 10, there was a 11.2% decrease in the 7-day average number of daily cases reported compared with the prior week, which provides an encouraging sign of continued progress. Even with these declines, the 56,586 cases reported on March 10, 2021, is higher than the 42,597 cases reported during the first peak in the pandemic on April 6, 2020.

Jurisdictions have submitted historical corrections in the past 2 weeks, which influence the 7-day moving averages and percent change of the 7-day moving averages. Thus, the table below represents the new cases (not historical), the current and previous 7-day averages, and the percent change in the 7-day average with these historical data excluded. These historical corrections are included in the total cases below.

56,586
New Cases Reported*

54,639
Current 7-Day Average**

29,052,862
Total Cases Reported

61,538
Prior 7-Day Average

249,378
Peak of 7-Day Average***

-11.2%
Change in 7-Day Average since Prior Week

* New cases reported here may differ slightly from those on the COVID Data Tracker as new methods are being used to account for historical corrections.

** In the current week, 87,670 historical cases were excluded, and in the prior week, 8,585 historical cases were excluded.

***Highest peak for 7-day average (January 11, 2021).

Daily Trends in COVID-19 Cases in the United States Reported to CDC
red-line.jpg

7-Day moving average

resize iconView Larger
More Case Data


SARS-CoV-2 Variants


CDC is closely tracking variants of SARS-CoV-2, the virus that causes COVID-19. Three variants of concern have been detected in the United States: B.1.1.7, B.1.351, and P.1. A total of 3,701 B.1.1.7 variant cases have been reported in 50 jurisdictions. One hundred eight cases attributed to B.1.351 in 23 jurisdictions and 17 cases attributed to P.1 in 10 jurisdictions have also been detected in the United States. CDC and partners are increasing the numbers of specimens sequenced in laboratories around the country. The number of variants reported will likely increase as more specimens are sequenced and if the frequency of variants increases. Studies are underway to determine whether variants are more transmissible, cause more severe illness, or are likely to evade immunity brought on by prior illness or vaccination.

Variant

Reported Cases in US

Number of Jurisdictions with ?1 Case Reported

B.1.1.7

3,701

50

B.1.351

108

23

P.1

17

10


Emerging Variant Cases of B.1.1.7 in the United States

resize iconView Larger
More Variants Data and Maps


Testing


The percent of COVID-19 RT-PCR tests that are positive (percent positivity) continues to decline. The 7-day average of percent positivity from tests is now 4.1%. The 7-day average test volume for March 5-March 11, 2021, was 1,201,691, down 2.7% from 1,235,406 for the prior 7 days.

345,686,141
Total Tests Reported

1,201,691
7-Day Average Test Volume

4.1%
7-Day Average
% Positivity


-11.1%
Change in 7-Day
% Positivity

COVID-19 Viral (RT-PCR) Laboratory Test 7-day Percent Positivity by State/Territory

resize iconView Larger
More Testing Dataexternal icon


Vaccinations


The U.S. COVID-19 Vaccination Program began December 14. As of March 10, 2021, 95.7 million vaccine doses have been administered. Overall, about 62.5 million people, or 18.8% of the U.S. population, have received at least one dose of vaccine. About 32.9 million people, or 9.9% of the U.S. population have been fully vaccinated.* As of March 10, the 7-day average number of administered vaccine doses reported to CDC per day was 2.2 million, an 8% increase from the previous week. Data by type of vaccine, which now includes the J&J/Janssen vaccine, are available on CDC?s COVID Data Tracker.

95,721,290
Vaccines Administered

62,451,150
People who received at least one dose

32,904,161
People who are fully vaccinated*

*People who are fully vaccinated (formerly ?receiving 2 doses?) represents the number of people who have received the second dose in a two-dose COVID-19 vaccine series or one dose of the single-shot J&J/Janssen COVID-19 vaccine.

Daily Change in Number of COVID-19 Vaccinations in the United States Reported to CDC

red-line.jpg

7-Day moving average

resize iconView Larger
More Vaccination Data


New Hospital Admissions


Hospital admissions of patients with confirmed COVID-19 decreased 70.4% from the national 7-day average peak of 16,540 admissions on January 9, 2021, to 4,889 admissions over the week ending March 9, 2021. The average number of daily admissions fell by 11%, compared to the previous week.

5,035
New Admissions

4,889
Current 7-Day Average

1,848,853
Total New Admissions

5,494
Prior 7-Day Average

16,540
Peak 7-Day Average

-11%
Change in 7-Day Average

Daily Trends in Number of New COVID-19 Hospital Admissions in the United States


The most recent data in the vertical gray bar are provisional and should be interpreted with caution.
resize iconView Larger
More Hospital Data


Deaths


In recent weeks, the number of COVID-19 deaths has fluctuated. However, there has been an overall decline of 56.6% of the 7-day moving average since January 13, 2021. As of March 10, 2021, a total of 527,726 COVID-19 deaths were reported. The current 7-day average of deaths is 1,465, a 19.3% decrease from the previous 7-day average of 1,816 daily deaths.

Jurisdictions have submitted several historical corrections in the past 2 weeks, which affect the 7-day moving averages and percent change of the 7-day moving averages. Thus, the table below represents the new deaths (not historical), the current and previous 7-day averages, and the percent change in the 7-day average with these historical data excluded. These historical corrections are included in the total deaths below.

1,513
New Deaths Reported*

1,465
Current 7-Day Average**

527,726
Total Deaths Reported

1,816
Prior 7-Day Average

3,378
Peak of 7-day Average***

-19.3%
change in the 7-Day Average Since the Prior Week


* New deaths reported here may differ slightly from those on the COVID Data Tracker as new methods are being used to account for historical corrections.

** In the current week, there were 138 historical deaths excluded, and in the prior week, there were 806 historical deaths excluded.

*** The highest peak in the 7-day average of new deaths (Jan 11, 2021).

Daily Trends in Number of COVID-19 Deaths in the United States Reported to CDC
red-line.jpg

7-Day moving average

resize iconView Larger
More Death Data


Recent Publications
  1. Racial and Ethnic Disparities in COVID-19 Incidence by Age, Sex, and Time Period Among Persons Aged <25 Years ? 16 U.S. Jurisdictions, January 1?December 31, 2020
  2. Health Equity Considerations and Racial and Ethnic Minority Groups | CDC
Notes

The Coronavirus Disease 2019 (COVID-19)-Associated Hospitalization Surveillance Network (COVID-NET) is an additional source for hospitalization data collected through a network of more than 250 acute-care hospitals in 14 states (representing ~10% of the U.S. population). Detailed data on patient demographics, including race/ethnicity, underlying medical conditions, medical interventions, and clinical outcomes, are collected using a standardized case reporting form.

CDC?s website also provides new data views such as county-specific summaries (under ?Your Community? in Data Tracker), vaccination trends (under ?Your Community? in Data Tracker), and information on SARS-CoV-2 variants.

Last Updated March 12, 2021

https://www.cdc.gov/coronavirus/2019-ncov/covid-data/covidview/past-reports/03122021.html
 
covid-tracker-header-lrg.jpg
COVID Data Tracker Weekly Review


Updated Mar. 19, 2021
Print
Subscribe to the Weekly Review


Interpretive Summary for March 19, 2021
Hindsight is 2020: A Year of Heartbreak and Hope


On March 11, 2020, the World Health Organization first characterized COVID-19 as a pandemic. The toll of this disease, the continued loss of life around the world, and the burden in our nation are heartbreaking. In one year, we lost over half a million Americans to COVID-19. Our nation has also experienced separation from friends, family, and loved ones; food insecurity and financial burden; and an unprecedented mental health crisis.

After a year of this pandemic, many of us are feeling tired, lonely, and impatient. Still, through it all, there is determination; there are stories of giving and hope, of stamina and perseverance. It was a hard year, but the progress we?ve made has given us hope?
  • Vaccines are available. Today, more than 1 in 5 Americans have received at least one dose of COVID-19 vaccine. Each day millions more people are being vaccinated, providing hope that we can soon gather with our friends and family safely. On March 12, 2021, we reached 100 million vaccine doses administered in just 88 days?thanks to three safe and effective vaccines that have been distributed throughout the United States. CDC recently released recommendations for fully vaccinated people as the first step in safely returning to normal activities.
  • Schools across the nation are reopening. CDC released an operational strategy to help pave the way for students? return to the classroom and childcare guidelines to ensure the safety of our children. Safer communities mean safer schools.
  • Testing is widespread. Since the beginning of the pandemic, more than 354 million RT-PCR tests to detect COVD-19 have been performed in the United States. This week, CDC released updated testing guidance to help healthcare providers and public health professionals use testing as a part of a comprehensive pandemic response strategy. Quickly identifying people infected with the virus that causes COVID-19 means they can get medical care and stay away from others, preventing the spread of COVID-19. If you think you may have COVID-19 now or may have had it in the past, learn more about the different types of COVID-19 tests and how to get tested.
  • Hospitalizations and deaths are declining. Hospital admissions and deaths are on the decline. We have come a long way from where we were, but we still have much work to do. We must continue to follow proven prevention strategies, and get vaccinated when a vaccine is available to you. We are just starting to turn a corner and the data are moving in the right direction, but where this goes depends on whether we all do what we can to protect ourselves, our loved ones, and our communities.
Even when this crisis is over, we will still need a strong public health system. The COVID-19 pandemic illuminated long-standing inequalities in health among racial and ethnic minority groups; demonstrated the need for resilient, fast, and accurate data systems; and showed the essential role a robust, skilled, and diverse public health workforce plays in protecting Americans. We cannot build the public health infrastructure the nation needs overnight or in the middle of an emergency. We must work together over the months and years ahead to build on the foundations, partnerships, and innovations that we have created during this crisis. It is one way we can turn tragedy into lasting progress and improved health for all.


Reported Cases


Overall, COVID-19 cases have decreased for the past 9 weeks. The current 7-day moving average of new cases (53,200) decreased 78.7% compared with the highest peak on January 11, 2021, (249,389), and 20.9% compared with the second highest peak on July 23, 2020 (67,277). On March 17, there was a 3.0% decrease in the 7-day average number of daily cases reported compared with the prior week, which provides an encouraging sign of continued progress.

56,900
New Cases Reported*

53,200
Current 7-Day Average**

29,431,658
Total Cases Reported

54,825
Prior 7-Day Average

249,389
Peak of 7-Day Average***

-3.0%
Change in 7-Day Average since Prior Week

* New cases reported here may differ slightly from those on the COVID Data Tracker as new methods are being used to account for historical corrections.

** In the current week, 4,007 historical cases were excluded, and in the prior week, 87,670 historical cases were excluded.

*** Highest peak for 7-day average (January 11, 2021).

Note: The table above excludes historical data from the new cases, the current and previous 7-day averages, and the percent change in the 7-day average.

Daily Trends in COVID-19 Cases in the United States Reported to CDC
red-line.jpg

7-Day moving average

resize iconView Larger
More Case Data


SARS-CoV-2 Variants


A total of 5,576 B.1.1.7 variant cases have been reported in 51 jurisdictions. One hundred eighty cases attributed to B.1.351 in 26 jurisdictions and 48 cases attributed to P.1 in 15 jurisdictions have also been detected in the United States. In addition, the B.1.427 and B.1.429 variants that were first identified in the United States in January 2021 are also being closely monitored. CDC and partners are increasing the numbers of specimens sequenced in laboratories around the country. Studies are underway to determine whether variants are more transmissible, cause more severe illness, or are likely to evade immunity brought on by prior illness or vaccination.

To better understand the significance of these emerging variants, CDC recently published a webpage describing how variants are classified. CDC also recently published a new Variant Proportions in the U.S. web page, which describes CDC characterization of the proportion of SARS-CoV-2 lineages circulating in the United States. Additionally, the page highlights the estimated proportion of SARS-CoV-2 variants of concern in select states for which CDC has at least 300 genome sequences available from specimens collected during the 4-week period ending February 13, 2021.

Variant

Reported Cases in US

Number of Jurisdictions with ?1 Case Reported

B.1.1.7

5,576

51

B.1.351

180

26

P.1

48

15


Cases of Variants of Concern in the United States

resize iconView Larger
More Variants Data and Maps


Testing


The percent of COVID-19 RT-PCR tests that are positive (percent positivity) has increased slightly from the previous week. The 7-day average of percent positivity from tests is now 4.2%. No states or territories have higher than 10% positivity. The 7-day average test volume for March 5-March 11, 2021, was 1,170,972, down 5.0% from 1,231,973 for the prior 7 days.

354,627,733
Total Tests Reported

1,170,972
7-Day Average Test Volume

4.2%
7-Day Average
% Positivity


+1.7%
Change in 7-Day
% Positivity

COVID-19 Viral (RT-PCR) Laboratory Test 7-day Percent Positivity by State/Territory

resize iconView Larger
More Testing Dataexternal icon


Vaccinations


The U.S. COVID-19 Vaccination Program began December 14. As of March 18, 2021, 115.7 million vaccine doses have been administered. Overall, about 75.5 million people, or 22.7% of the U.S. population, have received at least one dose of vaccine. About 41.0 million people, or 12.3% of the U.S. population have been fully vaccinated*. As of March 18, the 7-day average number of administered vaccine doses reported to CDC per day was 2.5 million, a 12.1% increase from the previous week.

Recent COVID Data Tracker updates show the percent of the population 65 years and older who have been vaccinated, and breakdowns of vaccine delivery, administration, and series completion by type. As of March 18, 66.3% of people 65 years or older have received at least one dose of vaccine; 38.6% are fully vaccinated.

115,730,008
Vaccines Administered

75,495,716
People who received at least one dose

40,981,464
People who are fully vaccinated*

*People who are fully vaccinated (formerly ?receiving 2 doses?) represents the number of people who have received the second dose in a two-dose COVID-19 vaccine series or one dose of the single-shot J&J/Janssen COVID-19 vaccine.

Daily Change in Number of COVID-19 Vaccinations in the United States Reported to CDC

red-line.jpg

7-Day moving average

resize iconView Larger
More Vaccination Data


New Hospital Admissions


Hospital admissions of patients with confirmed COVID-19 decreased 71.6% from the national 7-day average peak of 16,540 admissions on January 9, 2021, to 4,696 admissions over the week ending March 16, 2021. The average number of daily admissions fell by 4.2%, compared to the previous week.

4,927
New Admissions

4,696
Current 7-Day Average

1,881,819
Total New Admissions

4,902
Prior 7-Day Average


16,540
Peak 7-Day Average

-4.2%
Change in 7-Day Average

Daily Trends in Number of New COVID-19 Hospital Admissions in the United States


The most recent data in the vertical gray bar are provisional and should be interpreted with caution.
resize iconView Larger
More Hospital Data


Deaths


In recent weeks, the number of COVID-19 deaths has declined. Overall, deaths have decreased for the past 9 weeks. The current 7-day moving average of new deaths (1,025) decreased 69.7% compared with the highest peak on January 13, 2021 (3,379), and 10.7% compared with the peak on August 1, 2020 (1,148). As of March 17, 2021, a total of 535,217 COVID-19 deaths were reported.

1,118
New Deaths Reported*

1,025
Current 7-Day Average**

535,217
Total Deaths Reported

1,476
Prior 7-Day Average

3,378
Peak of 7-day Average***

-30.6%
Change in the 7-Day Average Since the Prior Week


* New deaths reported here may differ slightly from those on the COVID Data Tracker as new methods are being used to account for historical corrections.

** In the current week, there were 195 historical deaths excluded, and in the prior week, there were 138 historical deaths excluded.

*** The highest peak in the 7-day average of new deaths (Jan 11, 2021).

Note: The table above excludes historical data from the new deaths, the current and previous 7-day averages, and the percent change in the 7-day average.

Daily Trends in Number of COVID-19 Deaths in the United States Reported to CDC
red-line.jpg

7-Day moving average

resize iconView Larger
More Death Data


Recent Publications
  1. Association of Children?s Mode of School Instruction with Child and Parent Experiences and Well-Being During the COVID-19 Pandemic ? COVID Experiences Survey, United States, October 8?November 13, 2020 | MMWR (cdc.gov)
  2. COVID-19 Vaccine Second-Dose Completion and Interval Between First and Second Doses Among Vaccinated Persons ? United States, December 14, 2020?February 14, 2021
  3. Effectiveness of the Pfizer-BioNTech COVID-19 Vaccine Among Residents of Two Skilled Nursing Facilities Experiencing COVID-19 Outbreaks ? Connecticut, December 2020?February 2021
  4. Low SARS-CoV-2 Transmission in Elementary Schools ? Salt Lake County, Utah, December 3, 2020?January 31, 2021
  5. Minimal SARS-CoV-2 Transmission After Implementation of a Comprehensive Mitigation Strategy at a School ? New Jersey, August 20?November 27, 2020
Notes

The Coronavirus Disease 2019 (COVID-19)-Associated Hospitalization Surveillance Network (COVID-NET) is an additional source for hospitalization data collected through a network of more than 250 acute-care hospitals in 14 states (representing ~10% of the U.S. population). Detailed data on patient demographics, including race/ethnicity, underlying medical conditions, medical interventions, and clinical outcomes, are collected using a standardized case reporting form.

CDC?s website also provides new data views such as county-specific summaries (under ?Your Community? in Data Tracker), vaccination trends (under ?Your Community? in Data Tracker), and information on SARS-CoV-2 variants.
homeCases, Data & Surveillance
https://www.cdc.gov/coronavirus/2019-ncov/covid-data/covidview/index.html
 
covid-tracker-header-lrg.jpg
COVID Data Tracker Weekly Review


Updated Mar. 26, 2021
Print
Subscribe to the Weekly Review


Interpretive Summary for March 26, 2021
Testing?testing?1,2,3


A robust and responsive laboratory testing system is essential to our success in stopping the spread of SARS-CoV-2, the virus that causes COVID-19. Testing is important to diagnose illness when someone has symptoms or has been exposed to COVID-19, and to track illness trends in communities. Expanded testing helps pandemic response efforts in the United States and informs individuals? actions to stop further spread.

CDC?s updated guidance on SARS-CoV-2 testing offers a comprehensive approach that helps prevent the spread of COVID-19. The new guidance explains reasons for testing, the impact of vaccination on testing, available tests used to detect COVID-19 infection, how to choose which test to use, and health equity issues related to testing. These recommendations can help health department staff, healthcare providers, school officials, and the public make informed decisions about COVID-19 testing as a critical component of our national testing strategy.

Last week, the U.S. Department of Education announcedexternal icon it would provide all states, Puerto Rico, and the District of Columbia with $122 billion to support states to reopen K-12 schools safely and equitably expand opportunity for students who need it most. The U.S. Department of Health and Human Services also recently announcedexternal icon $10 billion to support expanded COVID-19 testing in schools nationwide. Testing to diagnose COVID-19 in schools, together with universal and correct use of masks, physical distancing, handwashing, and cleaning and maintaining healthy facilities, can help schools protect students and their families, teachers and staff, and the broader community by slowing the spread of COVID-19 while returning to in-person learning safely.

CDC is also investing $2.25 billion to address COVID-19 health disparities and advance health equity among people who are underserved or at higher risk of exposure, infection, hospitalization, and mortality, including racial and ethnic minority groups and people living in rural areas. To help track disparities, COVID-NET Hospitalization Surveillance Network data now allows COVID Data Tracker users to view COVID-19-associated hospitalizations by race/ethnicity over time. Ending this pandemic requires that everyone has equal access to affordable and timely testing, treatment, and vaccination.


Reported Cases


Overall, COVID-19 cases have decreased for the past 10 weeks, although we have seen consistent increases in the 7-day average of new cases over the past few days. The current 7-day moving average of new cases (56,995) decreased 77.2% compared with the highest peak on January 11, 2021 (250,400), and 15.4% compared with the second highest peak on July 23, 2020 (67,337). On March 24, there was a 6.7% increase in the 7-day average number of daily cases reported compared with the prior week.

64,397
New Cases Reported*

56,995
Current 7-Day Average**

29,834,734
Total Cases Reported

53,433
Prior 7-Day Average

250,400
Peak of 7-Day Average***

+6.7%
Change in 7-Day Average since Prior Week

*New cases and 7-day averages reported here may differ slightly from those on the COVID Data Tracker as we continue to incorporate jurisdictions? updates to their historical data.

** In the current week, 1,775 historical cases were excluded, and in the prior week, 4,007 historical cases were excluded.

***Highest peak for 7-day average (January 11, 2021).

Note: The table above excludes historical data from the new cases, the current and previous 7-day averages, and the percent change in the 7-day average.

Daily Trends in COVID-19 Cases in the United States Reported to CDC
red-line.jpg

7-Day moving average

resize iconView Larger
More Case Data


SARS-CoV-2 Variants


CDC recently published a Variant Proportions in the U.S. web page, which describes how CDC characterizes the proportion of SARS-CoV-2 lineages circulating in the United States. This page also highlights the estimated proportion of SARS-CoV-2 variants of concern in select states for which CDC has at least 300 genome sequences available from specimens collected during the 4-week period ending February 27, 2021.

This is updated every Wednesday, and additional work is underway to produce model-based estimates of the prevalence of SARS-CoV-2 variants. These model-based estimates will be reported on the COVID Data Tracker soon.

As of March 25, a total of 8,337 B.1.1.7 variant cases have been reported in 51 jurisdictions. Also, 266 cases attributed to B.1.351 in 29 jurisdictions and 79 cases attributed to P.1 in 19 jurisdictions have been reported in the United States. In addition, the B.1.427 and B.1.429 variants that were first identified in the United States in January 2021 are also being closely monitored. CDC and partners are increasing the numbers of specimens sequenced in laboratories around the country. Studies are underway to determine whether variants are more transmissible, cause more severe illness, or are likely to evade immunity brought on by prior illness or vaccination.

Variant

Reported Cases in US

Number of Jurisdictions with ?1 Case Reported

B.1.1.7

8,337

51

B.1.351

266

29

P.1

79

19


SARS-CoV-2 Variants Circulating in the United States

resize iconView Larger
More Variants Data


Testing


The percent of COVID-19 RT-PCR tests that are positive (percent positivity) has increased slightly from the previous week. The 7-day average of percent positivity from tests is now 4.7%. The 7-day average test volume for March 19-March 25, 2021, was 1,079,735, down 9.9% from 1,199,024 for the prior 7 days.

363,143,628
Total Tests Reported

1,079,735
7-Day Average Test Volume

4.7%
7-Day Average
% Positivity


+9.4%
Change in 7-Day
% Positivity

COVID-19 Viral (RT-PCR) Laboratory Test 7-day Percent Positivity by State/Territory

resize iconView Larger
More Testing Dataexternal icon


Vaccinations


The U.S. COVID-19 Vaccination Program began December 14. As of March 24, 2021, 130.5 million vaccine doses have been administered. Overall, about 85.5 million people, or 25.7% of the U.S. population, have received at least one dose of vaccine. About 46.4 million people, or 14.0% of the U.S. population, have been fully vaccinated*. As of March 24, the 7-day average number of administered vaccine doses reported to CDC per day was 2.5 million, a 0.7% increase from the previous week.

Recent COVID Data Tracker updates show the percent of the population 65 years and older who have been vaccinated, and breakdowns of vaccine delivery, administration, and series completion by type. As of March 24, 70.3% of people 65 years or older have received at least one dose of vaccine; 43.8% are fully vaccinated.

130,473,853
Vaccines Administered

85,472,166
People who received at least one dose

46,365,515
People who are fully vaccinated*

*People who are fully vaccinated (formerly ?receiving 2 doses?) represents the number of people who have received the second dose in a two-dose COVID-19 vaccine series or one dose of the single-shot J&J/Janssen COVID-19 vaccine.

Daily Change in Number of COVID-19 Vaccinations in the United States Reported to CDC

red-line.jpg

7-Day moving average

resize iconView Larger
More Vaccination Data


New Hospital Admissions


Hospital admissions of patients with confirmed COVID-19 decreased 71.5% from the national 7-day average peak of 16,540 admissions on January 9, 2021, to an average of 4,714 admissions over the 7-day period ending March 23, 2021. The average number of daily admissions increased by 0.1% compared to the previous week.

5,165
New Admissions

4,714
Current 7-Day Average

1,914,903
Total New Admissions

4,707
Prior 7-Day Average


16,540
Peak 7-Day Average

+0.1%
Change in 7-Day Average

Daily Trends in Number of New COVID-19 Hospital Admissions in the United States


The most recent data in the vertical gray bar are provisional and should be interpreted with caution.
resize iconView Larger
More Hospital Data


Trends in Hospitalizations among Racial and Ethnic Minority Groups


Long-standing inequalities have increased the risk for severe COVID-19 illnesses and death for many people in racial and ethnic minority groups. By improving race and ethnicity data collection and reporting, we continue to increase our understanding of health disparities related to COVID-19. This knowledge helps us create more equitable public health policies and prevention strategies.

COVID-19-associated hospitalization rates have decreased in all races and ethnicities after peaking in early January. Rates for American Indian and Alaska Native persons have dropped by more than 50% from a peak of 46.9 per 100,000 in November to less than 15 per 100,000 in recent weeks. Similar declines of more than 50% have been seen for other race and ethnicity groups; as well, hospitalizations have decreased from their highest point in early January 2021.

Rates of COVID-19-Associated Hospitalization

resize iconView Larger
The Coronavirus Disease 2019 (COVID-19)-Associated Hospitalization Surveillance Network (COVID-NET) is an additional source for hospitalization data collected through a network of more than 250 acute-care hospitals in 14 states (representing ~10% of the U.S. population). Detailed data on patient demographics, including race/ethnicity, underlying medical conditions, medical interventions, and clinical outcomes, are collected using a standardized case reporting form.
More COVID-NET Data


Deaths


The number of COVID-19 deaths has continued to decline, a trend we observed over the past 10 weeks. The current 7-day moving average of new deaths (946) decreased 72.0% compared with the highest peak on January 13, 2021 (3,379), and 17.5% compared with the peak on August 1, 2020 (1,148). As of March 24, 2021, a total of 542,584 COVID-19 deaths were reported.

1,262
New Deaths Reported*

946
Current 7-Day Average**

542,584
Total Deaths Reported

1,031
Prior 7-Day Average

3,379
Peak of 7-day Average***

-8.2%
Change in the 7-Day Average Since the Prior Week


*New cases and 7-day averages reported here may differ slightly from those on the COVID Data Tracker as we continue to incorporate jurisdictions? updates to their historical data.

** In the current week, there were 655 historical deaths excluded, and in the prior week, there were 195 historical deaths excluded.

*** The highest peak in the 7-day average of new deaths (Jan 13, 2021).

Note: The table above excludes historical data from the new deaths, the current and previous 7-day averages, and the percent change in the 7-day average.

Daily Trends in Number of COVID-19 Deaths in the United States Reported to CDC
red-line.jpg

7-Day moving average

resize iconView Larger
More Death Data


Recent Publications
  1. Counties with High COVID-19 Incidence and Relatively Large Racial and Ethnic Minority Populations ? United States, April 1?December 22, 2020
  2. County-Level COVID-19 Vaccination Coverage and Social Vulnerability ? United States, December 14, 2020?March 1, 2021
  3. COVID-19 in Primary and Secondary School Settings During the First Semester of School Reopening ? Florida, August?December 2020
  4. Pilot Investigation of SARS-CoV-2 Secondary Transmission in Kindergarten Through Grade 12 Schools Implementing Mitigation Strategies ? St. Louis County and City of Springfield, Missouri, December 2020
Recent COVID Data Tracker Updates
  • The enhanced Community Characteristics table on the County View tab classifies counties according to their urban/rural status and provides county, state and US estimates for each characteristic for comparison.
  • New COVID-NET Hospitalization Surveillance Network tab in the Health Care Settings Data section allows users to view COVID-19-associated hospitalizations by age, sex, race/ethnicity, underlying medical conditions, and more, over time.
  • New About Health Care Setting Data page describes the various health care setting data streams displayed.
  • New dashboards on COVID Data Tracker display changes in the impact of the pandemic over time. This feature includes interactive visualizations that allow users to see changes in the impact of the pandemic over time by race and ethnicity.
  • The COVID-19 Vaccinations in the US and the COVID-19 Vaccinations in Long-Term Care Facilities pages now include the Johnson & Johnson Janssen vaccine. Additional updates to the COVID-19 Vaccinations in the US page show the percent of the population 65 years and older who have been vaccinated, and the breakdown of vaccine delivery, administration, and series completion by vaccination manufacturer type.
homeMore Resources
https://www.cdc.gov/coronavirus/2019-ncov/covid-data/covidview/index.html
 
covid-tracker-header-lrg.jpg
COVID Data Tracker Weekly Review


Updated Apr. 2, 2021
Print
Subscribe to the Weekly Review


Interpretive Summary for April 2, 2021
The Race to Vaccinate


The United States recently administered a record 3.38 million doses of COVID-19 vaccine in a single day. As of April 1, 2021, nearly 154 million doses of COVID-19 vaccine have been administered in the United States, with over 56 million people having been fully vaccinated. We now have three historic, safe, and effective vaccines being administered across the country at a rapid pace, and more vaccines are in the works. A new CDC study shows that COVID-19 vaccines are effective at preventing COVID-19 infections and serious COVID-19 illness. Once fully vaccinated, a person?s risk of infection is reduced by up to 90%.

However, we are also seeing an increase in COVID-19 cases, including cases from new and emerging COVID-19 variants of concern. These variants of concern are mutated versions of the SARS-CoV-2 virus and have the potential to cause COVID-19 to be more severe, spread more easily between humans, require different treatments, or change the effectiveness of current vaccines.

Scientists continue to learn how the vaccines protect people from variants. Until most of the U.S. population is fully vaccinated, consistent use of public health prevention strategies, such as universal and correct use of masks, social distancing, hand washing, and vaccination, will help to limit the spread of SARS-CoV-2, the virus that causes COVID-19. Even if you have been fully vaccinated against COVID-19, you should keep taking these everyday precautions in public places.

The race to vaccinate people and contain the virus is underway. The actions we take today determine how long it will take to stop the virus and end the pandemic.


Reported Cases


COVID-19 cases were steadily decreasing for approximately 10 weeks; however, trends are changing, and cases have increased during the past 12 days. The current 7-day moving average of daily new cases (62,167) increased 8.4% compared with the previous 7 days. Compared with previous peaks, however, the 7-day average decreased 75.2% compared with the highest peak on January 11, 2021 (250,446), and 7.7% compared with the second highest peak on July 23, 2020 (67,337).

64,149
New Cases Reported*

62,167
Current 7-Day Average**

30,277,908
Total Cases Reported

57,343
Prior 7-Day Average

250,446
Peak of 7-Day Average***

+8.4%
Change in 7-Day Average since Prior Week

*New cases and 7-day averages reported here may differ slightly from those on the COVID Data Tracker as we continue to incorporate jurisdictions? updates to their historical data.

**Historical cases are excluded from 7-day average calculations. Of 22,178 historical cases reported retroactively, 4,451 were reported in the current week, and 1,775 in the prior week.

***Highest peak for 7-day average (January 11, 2021).

Note: The table above excludes historical data from the new cases, the current and previous 7-day averages, and the percent change in the 7-day average.

Daily Trends in COVID-19 Cases in the United States Reported to CDC
red-line.jpg

7-Day moving average

resize iconView Larger
More Case Data


SARS-CoV-2 Variants


CDC recently updated the Variant Proportions in the U.S. web page to include the most recent proportions of SARS-CoV-2 variants nationally and in states where there is enough data for CDC to monitor variants. Also, a new Variant Surveillance Section of the COVID Data Tracker was recently published with sequencing data and the global variant report map by country.

As of April 1, 2021, 12,505 B.1.1.7 variant cases have been reported in 51 jurisdictions. The United States has detected a total of 323 cases attributed to B.1.351 in 31 jurisdictions and 224 cases attributed to P.1 in 22 jurisdictions. In addition, we are closely monitoring the B.1.427 and B.1.429 variants that were first identified in the United States in January 2021. CDC and partners are increasing the numbers of specimens sequenced in laboratories around the country. Studies are underway to determine whether variants are more transmissible, cause more severe illness, or are likely to evade immunity brought on by prior illness or vaccination.

Variant

Reported Cases in US

Number of Jurisdictions with ?1 Case Reported

B.1.1.7

12,505

51

B.1.351

323

31

P.1

224

22


SARS-CoV-2 Variants Circulating in the United States

resize iconView Larger
More Variants Data


Testing


The percentage of COVID-19 RT-PCR tests that are positive (percent positivity) has increased slightly from the previous week. The 7-day average of percent positivity from tests is now 5.1%. The 7-day average test volume for March 19-March 25, 2021, was 1,162,774, down 1.5% from 1,180,332 for the prior 7 days.

375,521,522
Total Tests Reported

1,162,774
7-Day Average Test Volume

5.1%
7-Day Average
% Positivity


+13.0%
Change in 7-Day
% Positivity

COVID-19 Viral (RT-PCR) Laboratory Test 7-day Percent Positivity by State/Territory

resize iconView Larger
More Testing Dataexternal icon


Vaccinations


The U.S. COVID-19 Vaccination Program began December 14. As of April 1, 2021, 153.6 million vaccine doses have been administered. Overall, about 99.6 million people, or 30% of the U.S. population, have received at least one dose of vaccine. About 56.1 million people, or 16.9% of the U.S. population have been fully vaccinated.* As of April 1, the 7-day average number of administered vaccine doses reported to CDC per day was 2.9 million, a 15.7% increase from the previous week.

The new COVID Data Tracker Vaccination Demographic Trends tab shows vaccination trends by age group. As of April 1, 73.7% of people 65 or older have received at least one dose of vaccine; 52% are fully vaccinated. More than one-third (38.4%) of people 18 or older have received at least one dose of vaccine; 21.7% are fully vaccinated.

153,631,404
Vaccines Administered

99,565,311
People who received at least one dose

56,089,614
People who are fully vaccinated*

30%
Percentage of the U.S. population that has received at least 1 dose

16.9%
Percentage of the U.S. population that has been fully vaccinated*

*People who are fully vaccinated (formerly ?receiving 2 doses?) represents the number of people who have received the second dose in a two-dose COVID-19 vaccine series or one dose of the single-shot J&J/Janssen COVID-19 vaccine.

Daily Change in Number of COVID-19 Vaccinations in the United States Reported to CDC

red-line.jpg

7-Day moving average

resize iconView Larger
More Vaccination Data


New Hospital Admissions


Hospital admissions of patients with confirmed COVID-19 decreased by 70.1% from the national 7-day average peak of 16,522 admissions on January 9, 2021, to an average of 4,948 admissions over the 7-day period ending March 30, 2021. This, however, is a 4.8% increase from the previous 7-day period.

5,261
New Admissions

4,948
Current 7-Day Average

1,947,825
Total New Admissions

4,722
Prior 7-Day Average


16,522
Peak 7-Day Average

+4.8%
Change in 7-Day Average

Daily Trends in Number of New COVID-19 Hospital Admissions in the United States


The most recent data in the vertical gray bar are provisional and should be interpreted with caution.
resize iconView Larger
More Hospital Data


Trends in Hospitalizations among Racial and Ethnic Minority Groups


Long-standing systemic health and social inequities have increased the risk for severe COVID-19 illnesses and death for many people in racial and ethnic minority groups. By improving race and ethnicity data collection and reporting, we continue to increase our understanding of health disparities related to COVID-19. This knowledge helps us create more equitable public health policies and prevention strategies.

COVID-19-associated hospitalization rates have decreased in all races and ethnicities after peaking in early January. Rates for American Indian and Alaska Native persons have dropped from a peak of 47.4 per 100,000 in November to less than 10 per 100,000 in recent weeks. Declines of more than 50% have been seen for other race and ethnicity groups. In addition, hospitalizations have decreased from their highest point in early January 2021.

Rates of COVID-19-Associated Hospitalization

resize iconView Larger
The Coronavirus Disease 2019 (COVID-19)-Associated Hospitalization Surveillance Network (COVID-NET) is an additional source for hospitalization data collected through a network of more than 250 acute-care hospitals in 14 states (representing ~10% of the U.S. population). Detailed data on patient demographics, including race/ethnicity, underlying medical conditions, medical interventions, and clinical outcomes, are collected using a standardized case reporting form.
More COVID-NET Data


Deaths


Except for an increase during March 27-28, 2021, overall, deaths have decreased for the past 11 weeks. On March 31, the 7-day average of daily new deaths decreased 7.7% compared with the prior 7 days (although the absolute number of deaths increased compared to the previous day). Compared with prior peaks, the current 7-day moving average of 880 daily new deaths decreased 74.0% compared with the highest peak on January 13, 2021 (3,379 deaths), and 23.3% compared with the peak on August 1, 2020 (1,148 deaths). As of March 31, 2021, a total of 549,098 COVID-19 deaths have been reported.

917
New Deaths Reported*

880
Current 7-Day Average**

549,098
Total Deaths Reported

953
Prior 7-Day Average

3,379
Peak of 7-day Average***

-7.7%
Change in the 7-Day Average Since the Prior Week


*New cases and 7-day averages reported here may differ slightly from those on the COVID Data Tracker as we continue to incorporate jurisdictions? updates to their historical data.

** Of 13,233 historical deaths reported retroactively, 19 were reported on March 31, 2021; 286 were reported in the current week; and 655 in the prior week.

*** The highest peak in the 7-day average of new deaths (Jan 13, 2021).

Note: The table above excludes historical data from the new deaths, the current and previous 7-day averages, and the percent change in the 7-day average.

Daily Trends in Number of COVID-19 Deaths in the United States Reported to CDC
red-line.jpg

7-Day moving average

resize iconView Larger
More Death Data


Recent Publications
  1. Death Certificate?Based ICD-10 Diagnosis Codes for COVID-19 Mortality Surveillance ? United States, January?December 2020
  2. Interim Estimates of Vaccine Effectiveness of BNT162b2 and mRNA-1273 COVID-19 Vaccines in Preventing SARS-CoV-2 Infection Among Health Care Personnel, First Responders, and Other Essential and Frontline Workers ? Eight U.S. Locations, December 2020?March 2021
  3. Provisional Mortality Data ? United States, 2020
Recent COVID Data Tracker Updates
  • New county-level vaccination data on the County View tab allow users to view and download data at the county level, including percent of total population fully vaccinated, percent of the population ?18 years of age fully vaccinated, and percent of the population ?65 years of age fully vaccinated.
  • New Vaccination Demographic Trends tab shows vaccination trends by age group.
  • New Genomic Surveillance section of COVID Data Tracker tracks published COVID-19 genomic sequences and the global variant report map by country.
  • New COVID-NET Hospitalization Surveillance Network tab in the Health Care Settings Data section allows users to view COVID-19-associated hospitalizations by age, sex, race/ethnicity, underlying medical conditions, and more, over time.


homeMore Resources
https://www.cdc.gov/coronavirus/2019-ncov/covid-data/covidview/index.html
 
covid-tracker-header-lrg.jpg
COVID Data Tracker Weekly Review


Updated Apr. 9, 2021
Print


Interpretive Summary for April 9, 2021
Vigilance Matters When Viruses Vary


The United States is in the fourth week of an upward trend in COVID-19 cases. The lifting of social distancing and mask mandates in some areas could be contributing to this increase. This increase could also be due to the presence of more contagious variants of SARS-CoV-2, the virus that causes COVID-19, which is why it is important to remain vigilant.

Viruses change constantly through mutation, so new variants are expected to occur as the virus spreads. Some variants pose a bigger threat than others. B.1.1.7 is the most common variant circulating in the United States and has been reported in all 50 states, the District of Columbia, and Puerto Rico. Understanding variants and their spread will help us contain the virus.

CDC recently introduced a classification system to rank the risk of the variants that we are monitoring, similar to the way the weather service ranks hurricanes. The classification system characterizes emerging variants based on their characteristics and the resulting actions and consequences for public health. CDC?s three classification categories include Variants of Interest (VOI), Variants of Concern (VOC) and Variants of High Consequence (VOHC). CDC is currently monitoring five variants of concern in the United States; none of the variants circulating in the United States are classified as variants of high consequence. Many of the variants circulating in the United States do not fall into one of these categories, but CDC continues to monitor them.
YesYesYes
YesYesYes
YesYesYes
NoYesYes
NoYesYes
NoYesYes
NoYesYes
NoNoYes
NoNoYes
NoNoYes
Variants may have one or more of the listed attributes

*none at this time

The best way to slow the emergence of new variants is to slow the spread of COVID-19 by wearing a mask that covers your nose and mouth, staying 6 feet away from people who don?t live with you, avoiding crowds and poorly ventilated indoor spaces, and getting a COVID-19 vaccine as soon as it is available to you.


Reported Cases


Since March 20, 2021, the 7-day moving average of new cases has consistently remained higher compared with the previous 7-day moving average. The current 7-day moving average of daily new cases (64,152) increased 2.0% compared with the previous 7-day moving average. However, the 7-day average decreased 74.3% compared with the highest peak on January 8, 2021 (249,697), and 4.7% compared with the second highest peak on July 23, 2020 (67,348). A total of 30,737,477 COVID-19 cases were reported as of April 7, 2021, including 74,860 new cases.

74,860
New Cases Reported

64,152
Current 7-Day Average*

30,737,477
Total Cases Reported

62,869
Prior 7-Day Average

249,697
Peak of 7-Day Average**

+2.0%
Change in 7-Day Average since Prior Week

*Historical cases are excluded from 7-day average calculations. Of 24,809 historical cases reported retroactively, 2,631 were reported in the current week, and 4,451 were reported in the prior week.

**Highest peak for 7-day average (January 8, 2021).

Note: The table above excludes historical data from the new cases, the current and previous 7-day averages, and the percent change in the 7-day average.

Daily Trends in COVID-19 Cases in the United States Reported to CDC
red-line.jpg

7-Day moving average

resize iconView Larger
More Case Data


SARS-CoV-2 Variants


CDC recently updated the COVID Data Tracker to include the most recent proportions of SARS-CoV-2 variants nationally and in states where there is enough data for CDC to monitor variants. The Variant Surveillance section of the COVID Data Tracker provides an overview of published sequencing data and a global variant report map by country.

To provide a better picture of how widespread specific variants are in the US, CDC analyzes available genomic sequence data from specimens of SARS-CoV-2 collected from patients. This data is weighted to account for known differences in diagnostic testing and sequencing across time and geography. Based on the currently available data from early March, an estimated 27.2% of COVID-19 cases in the United States are caused by the SARS-CoV-2 variant B.1.1.7. The proportion of cases caused by B.1.429 is estimated at 9.1% and the proportion of cases caused by B.1.427 is estimated at 4.3%. Variants P.1 and B.1.351 are both estimated to be 0.5% of the current COVID-19 cases.

CDC and partners are increasing the numbers of specimens sequenced in laboratories around the country. Studies are underway to determine whether variants are more transmissible, cause more severe illness, or are likely to evade immunity brought on by prior illness or vaccination.

US COVID-19 Cases Caused by Variants

Variant

Reported Cases in US

Number of Jurisdictions with ?1 Case Reported

B.1.1.7

19,554

52

B.1.351

424

36

P.1

434

28


SARS-CoV-2 Variants Circulating in the United States

resize iconView Larger
More Variants Data


Testing


The percentage of COVID-19 RT-PCR tests that are positive (percent positivity) has increased from the previous week. The 7-day average of percent positivity from tests is now 5.5%. The 7-day average test volume for March 26?April 1, 2021, was 1,172,235, down 2.2% from 1,198,428 for the prior 7 days.

384,580,206
Total Tests Reported

1,172,235
7-Day Average Test Volume

5.5%
7-Day Average
% Positivity


+8.7%
Change in 7-Day
% Positivity

COVID-19 Viral (RT-PCR) Laboratory Test 7-day Percent Positivity by State/Territory

resize iconView Larger
More Testing Dataexternal icon


Vaccinations


The US COVID-19 Vaccination Program began December 14. As of April 8, 2021, 174.9 million vaccine doses have been administered. Overall, about 112.0 million people, or 33.7% of the US population, have received at least one dose of vaccine. About 66.2 million people, or 19.9% of the US population, have been fully vaccinated.* As of April 8, the 7-day average number of administered vaccine doses reported to CDC per day was 3.0 million, a 4.5% increase from the previous week.

The COVID Data Tracker Vaccination Demographic Trends tab shows vaccination trends by age group. As of April 8, 76.9% of people 65 or older have received at least one dose of vaccine; 58.4% are fully vaccinated. More than one-third (43.2%) of people 18 or older have received at least one dose of vaccine; 25.6% are fully vaccinated.

174,879,716
Vaccines Administered

112,046,611
People who received at least one dose

66,203,123
People who are fully vaccinated*

33.7%
Percentage of the US population that has received at least one dose

19.9%
Percentage of the US population that has been fully vaccinated*

+3.7
percentage point increase from last week

+3.0
percentage point increase from last week

*People who are fully vaccinated (formerly ?receiving 2 doses?) represents the number of people who have received the second dose in a two-dose COVID-19 vaccine series or one dose of the single-shot J&J/Janssen COVID-19 vaccine.

Daily Change in Number of COVID-19 Vaccinations in the United States Reported to CDC

red-line.jpg

7-Day moving average

resize iconView Larger
More Vaccination Data


New Hospital Admissions


Hospital admissions of patients with confirmed COVID-19 decreased by 67.7% from the national 7-day average peak of 16,521 admissions on January 9, 2021, to an average of 5,336 admissions over the 7-day period ending April 06, 2021. This however is a 7.3% increase from the previous 7-day period (March 24?30, 2021).

6,583
New Admissions

5,336
Current 7-Day Average

1,985,128
Total New Admissions

4,974
Prior 7-Day Average


16,521
Peak 7-Day Average*

+7.3%
Change in 7-Day Average


*Highest peak for 7-day average (January 9, 2021).

Daily Trends in Number of New COVID-19 Hospital Admissions in the United States


The most recent data in the vertical gray bar are provisional and should be interpreted with caution.
resize iconView Larger
More Hospital Data


Trends in Hospitalizations by Age Group


Older adults are at increased risk for severe COVID-19 illness, including an increased risk for hospitalization. Since the start of the pandemic, adults aged 65 years and older were the age group with the highest rates of COVID-19-associated hospitalization. While rates of hospitalization have fallen for all age groups since the peak in early January 2021, the rates for these older adults have fallen the most. Rates of hospitalization in adults aged 65 years and older have decreased by more than 70% in the past two months, from 70.2 per 100,000 in early January to less than 20 per 100,000 in recent weeks. However, rates have plateaued or risen in recent weeks in all age groups.

Rates of COVID-19-Associated Hospitalizations

resize iconView Larger
The Coronavirus Disease 2019 (COVID-19)-Associated Hospitalization Surveillance Network (COVID-NET) is an additional source for hospitalization data collected through a network of more than 250 acute-care hospitals in 14 states (representing ~10% of the U.S. population). Detailed data on patient demographics, including race/ethnicity, underlying medical conditions, medical interventions, and clinical outcomes, are collected using a standardized case reporting form.
More COVID-NET Data


Deaths


Overall, the 7-day moving average of daily new deaths has generally decreased for the past 12 weeks. On April 7, the 7-day average of daily new deaths (711) decreased 20.6% compared with the prior 7-day average; decreased 79.2% compared with the highest peak on January 13, 2021 (3,409); and decreased 38.2% compared with the peak on August 1, 2020 (1,151). As of April 7, 2021, a total of 556,106 COVID-19 deaths have been reported, including 871 new deaths.

871
New Deaths Reported

711
Current 7-Day Average*

556,106
Total Deaths Reported

895
Prior 7-Day Average

3,409
Peak of 7-day Average**

-20.6%
Change in the 7-Day Average Since the Prior Week


*Of 13,386 historical deaths reported retroactively, 153 were reported in the current week, and 286 were reported in the prior week.

** The highest peak in the 7-day average of new deaths (Jan 13, 2021).

Note: The table above excludes historical data from the new deaths, the current and previous 7-day averages, and the percent change in the 7-day average.

Daily Trends in Number of COVID-19 Deaths in the United States Reported to CDC
red-line.jpg

7-Day moving average

resize iconView Larger
More Death Data


Recent CDC COVID-19 Publications
  1. Community Transmission of SARS-CoV-2 Associated with a Local Bar Opening Event ? Illinois, February 2021
  2. Factors Associated with Participation in Elementary School?Based SARS-CoV-2 Testing ? Salt Lake County, Utah, December 2020?January 2021
Recent COVID Data Tracker Updates
https://www.cdc.gov/coronavirus/2019-ncov/covid-data/covidview/index.html
 
covid-tracker-header-lrg.jpg
COVID Data Tracker Weekly Review


Updated Apr. 23, 2021
Print
Subscribe to the Weekly Review


Interpretive Summary for April 23, 2021
Have You Heard? We?re at One-Third!


As of April 22, 2021, one in three people in the United States over the age of 18 years are fully vaccinated and more than half of U.S. adults have received at least one dose of a COVID-19 vaccine. Widespread vaccination is a critical tool to help stop the pandemic. A recent CDC study shows that, once fully vaccinated, a person?s risk of infection is reduced by up to 90%.* The efficacy seen in clinical trials is now being shown in the real world. Current data also suggest that COVID-19 vaccines offer protection against the variants circulating in the United States.

Some people who are fully vaccinated against COVID-19 may still get sick because no vaccine is 100% effective. Last week, CDC released data on the number of ?breakthrough? infections of people who, despite being vaccinated, still tested positive for COVID-19 more than 14 days after getting their second dose of a COVID-19 vaccine. However, as of last week, there were fewer than 6,000 ?breakthrough? infections reported, which represents less than 1% of people who have been fully vaccinated. Of these, approximately 30% had no symptoms at all. Two recent CDC reports[SUP]1,2[/SUP] show that COVID-19 vaccines help protect people who are vaccinated from getting COVID-19 and may reduce severity of illness among people who get vaccinated but still get COVID-19.

Getting a vaccine will help protect you, help protect others, and help end the pandemic. More vaccinations equals fewer infections and fewer variants. Previously, certain groups were prioritized for COVID-19 vaccination. Now, all people in the United States age 16 and older are eligible for a COVID-19 vaccine. Vaccines are free and increasingly available. To find a vaccination provider near you, visit Vaccine Finderexternal icon or your state or local public health department website.

* A recent CDC study provides strong evidence that mRNA COVID-19 vaccines, which include the Pfizer-BioNTech and Moderna vaccines, are highly effective in preventing SARS-CoV-2 infections in real-world conditions. The study found that ?partial? vaccination (two weeks after a single dose) with either a Pfizer-BioNTech or Moderna vaccine reduced the risk of infection by 80%. ?Full? vaccination (two weeks after the second dose) reduced risk of infection by 90%. Last week the FDAexternal icon and CDC recommended a pause in the use of the Johnson & Johnson/Janssen (J&J) vaccine to review data involving six reported U.S. cases of a rare and severe type of blood clot in individuals after receiving the J&J vaccine. These cases are rare and were identified through CDC?s vaccine safety monitoring system. The events of last week serve as a reminder that safety is a top priority.


Reported Cases


The current 7-day moving average of daily new cases (62,596) decreased 10.1% compared with the previous 7-day moving average (69,614). Compared with the highest peak on January 8, 2021 (249,436), the current 7-day average decreased 74.9%. A total of 31,666,546 COVID-19 cases were reported as of April 21, 2021, including 62,827 new cases.

62,827
New Cases Reported

62,596
Current 7-Day Average*

31,666,546
Total Cases Reported

69,614
Prior 7-Day Average

249,436
Peak of 7-Day Average**

-10.1%
Change in 7-Day Average since Prior Week

*Historical cases are excluded from 7-day average calculations. Of 89,900 historical cases reported retroactively (with missing report dates), 5,434 were reported in the current week, and 6,301 were reported in the prior week.

**Highest peak for 7-day average (January 8, 2021).

Note: The table above excludes historical data with missing report dates from the new cases, the current and previous 7-day averages, and the percent change in the 7-day average.

Daily Trends in COVID-19 Cases in the United States Reported to CDC
red-line.jpg

7-Day moving average

resize iconView Larger
More Case Data


SARS-CoV-2 Variants


Multiple variants of the virus that causes COVID-19 are circulating globally and within the United States. Based on specimens collected from March 14 to March 27, an estimated 44.7% of COVID-19 cases in the United States are caused by the SARS-CoV-2 variant B.1.1.7. The proportion of cases caused by B.1.429 is estimated at 6.9%, and the proportion of cases caused by B.1.427 is estimated at 3.1%. Variant P.1 is estimated to comprise 1.5% of COVID-19 cases, and the proportion of B.1.351 cases is estimated to be 0.7% for the end of March. Proportion estimates provided in COVID Data Tracker can now be viewed at the national or regional level in 2-week intervals.

CDC and partners are increasing the numbers of specimens sequenced in laboratories around the country. For the week ending April 17, over 31,000 sequences were published in public repositories through CDC sequencing efforts. Studies are underway to determine whether variants are more transmissible, cause more severe illness, or are likely to evade immunity brought on by prior illness or vaccination.

Note: To paint a clearer picture of how prevalent specific variants are in the United States, CDC analyzes available genomic sequence data from specimens of SARS-CoV-2 collected from patients. These data are weighted to account for known differences in diagnostic testing and sequencing across time and geography.

SARS-CoV-2 Variants Circulating in the United States

resize iconView Larger

resize iconView Larger
More Variants Data


Testing


The percentage of COVID-19 RT-PCR tests that are positive (percent positivity) has decreased from the previous week. The 7-day average of percent positivity from tests is now 5.2%. The 7-day average test volume for April 9-April 15, 2021, was 1,189,820, up 1.6% from 1,170,968 for the prior 7 days.

404,035,737
Total Tests Reported

1,189,820
7-Day Average Test Volume

5.2%
7-Day Average
% Positivity


-5.4%
Change in 7-Day
% Positivity

COVID-19 Viral (RT-PCR) Laboratory Test 7-day Percent Positivity by State/Territory

resize iconView Larger
More Testing Dataexternal icon


Vaccinations


The U.S. COVID-19 Vaccination Program began December 14, 2020. As of April 22, 2021, 218.9 million vaccine doses have been administered. Overall, about 135.8 million people, or 40.9% of the total U.S. population, have received at least one dose of vaccine. About 89.2 million people, or 26.9% of the total U.S. population, have been fully vaccinated.* As of April 22, the 7-day average number of administered vaccine doses reported to CDC per day was 2.9 million, a 12% decrease from the previous week.

The COVID Data Tracker Vaccination Demographic Trends tab shows vaccination trends by age group. As of April 22, 80.7% of people ages 65 or older have received at least one dose of vaccine and 66% are fully vaccinated. Just over one-half (52%) of people ages 18 or older have received at least one dose of vaccine and 34.4% are fully vaccinated.

218,947,643
Vaccines Administered

135,791,031
People who received at least one dose

89,245,776
People who are fully vaccinated*

40.9%
Percentage of the US population that has received at least one dose

26.9%
Percentage of the US population that has been fully vaccinated*

+3.0
percentage point increase from last week

+3.3
percentage point increase from last week

*People who are fully vaccinated (formerly ?receiving 2 doses?) represents the number of people who have received the second dose in a two-dose COVID-19 vaccine series or one dose of the single-shot J&J/Janssen COVID-19 vaccine.

Daily Change in Number of COVID-19 Vaccinations in the United States Reported to CDC

red-line.jpg

7-Day moving average

resize iconView Larger
More Vaccination Data


Hospitalizations

New Hospital Admissions


New admissions have decreased considerably since their January peaks. However, since March 22, 2021, the 7-day moving average has been generally increasing. The current 7-day average for April 14?April 20, 2021, was 5,631. This is a 1.6% increase from the prior 7-day average (5,541) from April 7?April 13, 2021.

5,963
New Admissions

5,631
Current 7-Day Average

2,062,916
Total New Admissions

5,541
Prior 7-Day Average


16,521
Peak 7-Day Average*

+1.6%
Change in 7-Day Average


*Highest peak for 7-day average (January 9, 2021).

COVID-NET: Trends in Clinical Outcomes


CDC?s Coronavirus Disease 2019-Associated Hospitalization Surveillance Network (COVID-NET) now has monthly data describing severe COVID-19 over the first year of the pandemic, including data related to demographics, underlying medical and clinical outcomes, including intensive care unit admission. Among hospitalized cases, the percentage of intensive care unit (ICU) admissions declined during the first 7 months of the pandemic, then leveled off or increased in November through January. The percentage of hospitalized cases admitted to the ICU decreased in February 2021, when 15.9%, or about 1 in 6 hospitalized COVID-19 patients, were admitted to the ICU. Positive trends over the pandemic, especially during the first 7 months, may in part have been due to evolving healthcare provider and system practices, guided by increasing knowledge and experience in treating patients with COVID-19.

Daily Trends in Number of New COVID-19 Hospital Admissions in the United States

resize iconView Larger
New admissions are pulled from a 10 am EST snapshot of the HHS Unified Hospital Timeseries Dataset. Due to potential reporting delays, data from the most recent 7 days, as noted in the figure above with the grey bar, should be interpreted with caution. Small shifts in historic data may also occur due to changes in the CMS Provider of Services file, which is used to identify the cohort of included hospitals.

More Hospital Data
Trends in Intensive Care Unit Admission in COVID-19 Associated Hospitalizations


resize iconView Larger
The Coronavirus Disease 2019 (COVID-19)-Associated Hospitalization Surveillance Network (COVID-NET) is an additional source for hospitalization data collected through a network of more than 250 acute-care hospitals in 14 states (representing ~10% of the U.S. population). Detailed data on patient demographics, including race/ethnicity, underlying medical conditions, medical interventions, and clinical outcomes, are collected using a standardized case reporting form.
More COVID-NET Data

Deaths


The 7-day average of daily new deaths (691) decreased 3.7% compared with the prior 7-day average. As of April 21, 2021, a total of 566,494 COVID-19 deaths have been reported, including 875 new deaths.

875
New Deaths Reported

691
Current 7-Day Average*

566,494
Total Deaths Reported

717
Prior 7-Day Average

3,457
Peak of 7-day Average**

-3.7%
Change in the 7-Day Average Since the Prior Week


*Of 13,837 historical deaths reported retroactively (with missing report dates), 257 were reported in the current week, and 194 were reported in the prior week.

**The highest peak in the 7-day average of new deaths (Jan 13, 2021).

Note: The table above excludes historical data with missing report dates from the new deaths, the current and previous 7-day averages, and the percent change in the 7-day average.

Daily Trends in Number of COVID-19 Deaths in the United States Reported to CDC
red-line.jpg

7-Day moving average

resize iconView Larger
More Death Data


Recent CDC COVID-19 Publications
  1. Post-vaccination SARS-CoV-2 Infections Among Skilled Nursing Facility Residents and Staff Members ? Chicago, Illinois, December 2020?March 2021
  2. COVID-19 Outbreak Associated with a SARS-CoV-2 R.1 Lineage Variant in a Skilled Nursing Facility After Vaccination Program ? Kentucky, March 2021
Recent COVID Data Tracker Updates
https://www.cdc.gov/coronavirus/2019-ncov/covid-data/covidview/index.html
 
covid-tracker-header-lrg.jpg
COVID Data Tracker Weekly Review


Updated Apr. 30, 2021
Print
Subscribe to the Weekly Review


Interpretive Summary for April 30, 2021
Think Globally. Get Vaccinated. Travel Locally.


The COVID-19 pandemic continues to break daily records, even as the global vaccination pace accelerates. Additionally, multiple variants of the virus that causes COVID-19 are circulating globally and within the United States. On April 19, 2021, the U.S. Department of Stateexternal icon issued a Travel Advisory Updateexternal icon resulting in a significant increase in the number of countries classified as ?Level 4: Do Not Travel,? to approximately 80% of countries worldwide.

With summer quickly approaching and vaccination rates increasing, many people are eager to travel. Additionally, many countries and states are loosening restrictions for visitors. CDC recommends delaying travel until you are fully vaccinated because travel increases your chance of getting and spreading COVID-19. International travel poses additional risks, and even fully vaccinated travelers are at increased risk for getting and possibly spreading new COVID-19 variants. The COVID-19 situation differs from country to country, and you should pay close attention to the situation at your destination before traveling.

Once you are fully vaccinated, you can travel safely within the United States but you should follow domestic travel recommendations and consider levels of community transmission when selecting a domestic travel destination. Your method of transportation, type of accommodation, and activities during travel can increase your risk of getting and spreading COVID-19. If you are not fully vaccinated and must travel, you should get tested for COVID-19 before and after travel.

The safest way to travel is by practicing prevention strategies and getting vaccinated. To find a vaccine provider near you, visit Vaccine Finderexternal icon or your state or local public health department website.


Reported Cases


The current 7-day moving average of daily new cases (52,528) decreased 16.2% compared with the previous 7-day moving average (62,653). Compared with the highest peak on January 8, 2021 (249,669), the current 7-day average decreased 79.0%. A total of 32,031,068 COVID-19 cases have been reported as of April 28.

32,031,068
Total Cases Reported

52,528
Current 7-Day Average*

62,653
Prior 7-Day Average

-16.2%
Change in 7-Day Average since Prior Week

*Historical cases are excluded from daily new cases and 7-day average calculations until they are incorporated into the dataset for the applicable date. Of 84,981 historical cases reported retroactively, 3,462 were reported in the current week and 4,324 were reported in the prior week.

Note: In the above table, historical data with missing report dates are excluded from current and prior 7-day averages, and the percent change in the 7-day average.

Daily Trends in COVID-19 Cases in the United States Reported to CDC
red-line.jpg

7-Day moving average

resize iconView Larger
More Case Data


SARS-CoV-2 Variants


Multiple variants of the virus that causes COVID-19 are circulating globally and within the United States. To date, five variants have been classified as a variant of concern, and the proportions of cases caused by these variants are summarized below. Based on specimens collected from March 28 to April 10, an estimated 59.2% of COVID-19 cases in the United States are caused by the SARS-CoV-2 variant B.1.1.7. The proportion of cases caused by B.1.429 is estimated at 4.5%, and the proportion of cases caused by B.1.427 is estimated at 1.8%. Variant P.1 is estimated to comprise 3.5% of COVID-19 cases, and the proportion of B.1.351 cases is estimated to be 0.9% for the two weeks ending April 10. Proportion estimates provided in COVID Data Tracker can now be viewed at the national or regional level in 2-week intervals.

CDC and partners are increasing the number of specimens sequenced in laboratories around the country. For the week ending April 24, over 27,000 sequences were published in public repositories through CDC sequencing efforts. Studies are underway to determine whether variants are more transmissible, cause more severe illness, or are likely to evade immunity brought on by prior illness or vaccination.

Note: To paint a clearer picture of how prevalent specific variants are in the United States, CDC analyzes available genomic sequence data from specimens of SARS-CoV-2 collected from patients. These data are weighted to account for known differences in diagnostic testing and sequencing across time and geography.

SARS-CoV-2 Variants Circulating in the United States

resize iconView Larger

resize iconView Larger
More Variants Data


Testing


The percentage of COVID-19 RT-PCR tests that are positive (percent positivity) has decreased from the previous week. The 7-day average of percent positivity from tests is now 4.5%. The 7-day average number of tests reported for April 16-April 22 was 1,213,013, down 3.1% from 1,251,597 for the prior 7 days.

413,060,172
Total Tests Reported

1,213,013
7-Day Average Tests Reported

4.5%
7-Day Average % Positivity

5.1%
Previous 7-Day Average % Positivity

-12.2%
Change in 7-Day Average % Positivity since Prior Week

COVID-19 Viral (RT-PCR) Laboratory Test 7-day Percent Positivity by State/Territory

resize iconView Larger
More Testing Dataexternal icon


Vaccinations


The U.S. COVID-19 Vaccination Program began December 14, 2020. As of April 29, 237.4 million vaccine doses have been administered. Overall, about 143.7 million people, or 43.3% of the total U.S. population, have received at least one dose of vaccine. About 99.7 million people, or 30% of the total U.S. population, have been fully vaccinated.* As of April 29, the 7-day average number of administered vaccine doses reported to CDC per day was 2.6 million, a 10.7% decrease from the previous week.

The COVID Data Tracker Vaccination Demographic Trends tab shows vaccination trends by age group. As of April 29, 82.1% of people ages 65 or older have received at least one dose of vaccine and 68.4% are fully vaccinated. Just over one-half (54.9%) of people ages 18 or older have received at least one dose of vaccine and 38.4% are fully vaccinated.

237,360,493
Vaccines Administered

143,793,565
People who received at least one dose

99,668,945
People who are fully vaccinated*

43.3%
Percentage of the US population that has received at least one dose

30%
Percentage of the US population that has been fully vaccinated*

+2.4
Percentage point increase from last week

+3.1
Percentage point increase from last week

*People who are fully vaccinated (formerly ?receiving 2 doses?) represents the number of people who have received the second dose in a two-dose COVID-19 vaccine series or one dose of the single-shot J&J/Janssen COVID-19 vaccine.

Daily Change in Number of COVID-19 Vaccinations in the United States Reported to CDC

red-line.jpg

7-Day moving average

resize iconView Larger
More Vaccination Data


Hospitalizations

New Hospital Admissions


The current 7-day average for April 21?April 27 was 5,057. This is a 9.8% decrease from the prior 7-day average (5,607) from April 14?April 20. Previously, the 7-day moving average for new admissions had been generally increasing from March 22 until April 18.

2,098,135
Total New Admissions

5,057
Current 7-Day Average

5,607
Prior 7-Day Average

-9.8%
Change in 7-Day Average

Daily Trends in Number of New COVID-19 Hospital Admissions in the United States

resize iconView Larger
New admissions are pulled from a 10 am EST snapshot of the HHS Unified Hospital Timeseries Dataset. Due to potential reporting delays, data from the most recent 7 days, as noted in the figure above with the grey bar, should be interpreted with caution. Small shifts in historic data may also occur due to changes in the CMS Provider of Services file, which is used to identify the cohort of included hospitals.

More Hospital Data


COVID-NET: Trends in Clinical Outcomes


CDC?s Coronavirus Disease 2019-Associated Hospitalization Surveillance Network (COVID-NET) now has monthly data describing severe COVID-19 over the first year of the pandemic, including data on in-hospital deaths. Among hospitalized cases, the percentage of in-hospital deaths declined during the first 8 months of the pandemic, then increased to 12.9% in December. In February 2021, the percentage of hospitalized patients who died in the hospital decreased to 6.4%, possibly as a result of a lower proportion of older patients hospitalized compared to past months. Positive trends may also in part have been due to evolving healthcare provider and system practices, guided by increasing knowledge and experience in treating patients with COVID-19.

Additional information on monthly trends in clinical outcomes can be found hereexternal icon.

Trends in In-Hospital Deaths in COVID-19 Associated Hospitalizations


resize iconView Larger
The Coronavirus Disease 2019 (COVID-19)-Associated Hospitalization Surveillance Network (COVID-NET) is an additional source for hospitalization data collected through a network of more than 250 acute-care hospitals in 14 states (representing ~10% of the U.S. population). Detailed data on patient demographics, including race/ethnicity, underlying medical conditions, medical interventions, and clinical outcomes, are collected using a standardized case reporting form.
More COVID-NET Data

Deaths


Since April 19, the 7-day moving average has been lower compared with the 7-day moving average of the prior week. The current 7-day moving average of new deaths (628) decreased 8.2% compared with the previous 7-day moving average (684). As of April 28, a total of 571,297 COVID-19 deaths have been reported.

571,297
Total Deaths Reported

628
Current 7-Day Average*

684
Prior 7-Day Average

-8.2%
Change in 7-Day Average Since Prior Week

*Historical deaths are excluded from the daily new deaths and 7-day average calculations until they are incorporated into the dataset by their applicable date. Of 14,101 historical deaths reported retroactively, 278 were reported in the current week and 243 were reported in the prior week.

Note: In the above table, historical data with missing report dates are excluded from current and prior 7-day averages, and the percent change in the 7-day average.

Daily Trends in Number of COVID-19 Deaths in the United States Reported to CDC
red-line.jpg

7-Day moving average

resize iconView Larger
More Death Data


Recent CDC COVID-19 Publications
  1. Updated Recommendations from the Advisory Committee on Immunization Practices for Use of the Janssen (Johnson & Johnson) COVID-19 Vaccine After Reports of Thrombosis with Thrombocytopenia Syndrome Among Vaccine Recipients ? United States, April 2021
  2. Health Care Utilization and Clinical Characteristics of Nonhospitalized Adults in an Integrated Health Care System 28?180 Days After COVID-19 Diagnosis ? Georgia, May 2020?March 2021
  3. Airport Traveler Testing Program for SARS-CoV-2 ? Alaska, June?November 2020
  4. COVID-19 Outbreaks in Correctional Facilities with Work-Release Programs ? Idaho, July?November 2020
  5. Laboratory Modeling of SARS-CoV-2 Exposure Reduction Through Physically Distanced Seating in Aircraft Cabins Using Bacteriophage Aerosol ? November 2020
  6. Effectiveness of Pfizer-BioNTech and Moderna Vaccines Against COVID-19 Among Hospitalized Adults Aged ?65 Years ? United States, January?March 2021
Recent COVID Data Tracker Updates
 
covid-tracker-header-lrg.jpg
COVID Data Tracker Weekly Review


Updated May 7, 2021
Print
Subscribe to the Weekly Review


Interpretive Summary for May 7, 2021
Going Once? Going Twice? Vaccinated!


resize iconView Larger
Following a rapid acceleration in vaccination rates, we are now seeing U.S. vaccination progress slow. This is not surprising considering the prior focus on vaccinating people at increased risk. Also, people eager to be immunized when they became eligible may have already secured their vaccine in line with increased supply. While more than 8 in 10 people 65 years and older have received at least one dose of vaccine, only around 1 in 3 people ages 18-29 have. All age groups currently eligible for the vaccine can benefit from the protection it provides themselves and others, especially as more states are easing prevention measures.

Three COVID-19 vaccines are currently authorized and recommended for use in the United States, including the one-dose Johnson & Johnson/Janssen vaccine and the two-dose Pfizer BioNTech and Moderna vaccines. All three vaccines are safe, effective, and reduce your risk of severe illness. To receive the most protection, you should receive all recommended doses of a COVID-19 vaccine. It typically takes about two weeks after your last dose for the body to build full protection, which means you should still practice the same prevention measures you did before vaccination. Once you are fully vaccinated, you can start doing many things you had stopped doing because of the pandemic.

Everyone who gets vaccinated does so for a reason?to protect themselves and their family, or to safely get back to activities like seeing friends, resuming work, or returning to school. Still, some people are hesitant to get their COVID-19 vaccine. COVID-19 vaccines are new, and it?s normal for people to have questions about them. If you or someone you know is hesitant about COVID-19 vaccination, CDC has information to help with the decision. To find a vaccine provider near you, visit Vaccines.gov or your state or local public health department website.


Reported Cases


The current 7-day moving average of daily new cases (45,817) decreased 13.2% compared with the previous 7-day moving average (52,772). Compared with the highest peak on January 8, 2021 (249,672), the current 7-day average decreased 81.6%. A total of 32,356,034 COVID-19 cases have been reported as of May 5.

32,356,034
Total Cases Reported

45,817
Current 7-Day Average*

52,772
Prior 7-Day Average

-13.2%
Change in 7-Day Average since Prior Week

*Historical cases are excluded from daily new cases and 7-day average calculations until they are incorporated into the dataset for the applicable date. Of 86,630 historical cases reported retroactively, 1,649 were reported in the current week and 3,462 were reported in the prior week.

Note: In the above table, historical data with missing report dates are excluded from current and prior 7-day averages, and the percent change in the 7-day average.

Daily Trends in COVID-19 Cases in the United States Reported to CDC
red-line.jpg

7-Day moving average

resize iconView Larger
More Case Data


SARS-CoV-2 Variants


Multiple variants of the virus that causes COVID-19 are circulating globally and within the United States. To date, five variants have been classified as a variant of concern, and the weighted estimates of proportions of SARS-CoV-2 cases caused by these variants are summarized below.

Based on specimens collected from March 28 to April 10, an estimated 59.6% of COVID-19 cases in the United States are caused by the SARS-CoV-2 variant B.1.1.7. Twenty-five states now have B.1.1.7 proportions greater than 30%. The proportion of cases caused by B.1.429 is estimated at 4.4%, and the proportion of cases caused by B.1.427 is estimated at 1.7%. California continues to have the highest proportion of B.1.427/429 at 38.4%. Variant P.1 is estimated to comprise 3.7% of COVID-19 cases, and the proportion of B.1.351 cases is estimated to be 1.0% for the two weeks ending April 10. Proportion estimates provided in COVID Data Tracker can now be viewed at the national or regional level in 2-week intervals.

Note: To paint a clearer picture of how prevalent specific variants are in the United States, CDC analyzes available genomic sequence data from specimens of SARS-CoV-2 collected from patients. These data are weighted to account for known differences in diagnostic testing and sequencing across time and geography. Nowcasting (modeling) estimates are now available on the Variant Proportions tab of the COVID Data Tracker.

SARS-CoV-2 Variants Circulating in the United States

resize iconView Larger

resize iconView Larger
More Variants Data


Testing


The percentage of COVID-19 RT-PCR tests that are positive (percent positivity) has decreased from the previous week. The 7-day average of percent positivity from tests is now 4.0%. The 7-day average number of tests reported for April 23-April 29 was 1,185,345, down 3.8% from 1,232,468 for the prior 7 days.

421,479,492
Total Tests Reported

1,185,345
7-Day Average Tests Reported

4.0%
7-Day Average % Positivity

4.4 %
Previous 7-Day Average % Positivity

-8.5%
Change in 7-Day Average % Positivity since Prior Week

COVID-19 Viral (RT-PCR) Laboratory Test 7-day Percent Positivity by State/Territory

resize iconView Larger
More Testing Dataexternal icon


Vaccinations


The U.S. COVID-19 Vaccination Program began December 14, 2020. As of May 6, 252 million vaccine doses have been administered. Overall, about 149.5 million people, or 45% of the total U.S. population, have received at least one dose of vaccine. About 108.9 million people, or 32.8% of the total U.S. population, have been fully vaccinated.* As of May 6, the 7-day average number of administered vaccine doses reported to CDC per day was 2.1 million, a 26% decrease from the previous week.

The COVID Data Tracker Vaccination Demographic Trends tab shows vaccination trends by age group. As of May 6, 83.0% of people ages 65 or older have received at least one dose of vaccine and 70.2% are fully vaccinated. Over one-half (57%) of people ages 18 or older have received at least one dose of vaccine and 41.9% are fully vaccinated.

251,973,752
Vaccines Administered

149,462,265
People who received at least one dose

108,926,627
People who are fully vaccinated*

45.0%
Percentage of the US population that has received at least one dose

32.8%
Percentage of the US population that has been fully vaccinated*

+1.7
Percentage point increase from last week

+2.8
Percentage point increase from last week

*People who are fully vaccinated represents the number of people who have received the second dose in a two-dose COVID-19 vaccine series or one dose of the single-shot J&J/Janssen COVID-19 vaccine.

Daily Change in Number of COVID-19 Vaccinations in the United States Reported to CDC

red-line.jpg

7-Day moving average

resize iconView Larger
More Vaccination Data


Hospitalizations

New Hospital Admissions


The current 7-day average for April 28?May 4 was 4,640. This is an 8.4% decrease from the prior 7-day average (5,066) from April 21?April 27. The 7-day moving average for new admissions has been consistently decreasing since April 19.

2,127,202
Total New Admissions

4,640
Current 7-Day Average

5,066
Prior 7-Day Average

-8.4%
Change in 7-Day Average

Daily Trends in Number of New COVID-19 Hospital Admissions in the United States

resize iconView Larger
New admissions are pulled from a 10 am EST snapshot of the HHS Unified Hospital Timeseries Dataset. Due to potential reporting delays, data from the most recent 7 days, as noted in the figure above with the grey bar, should be interpreted with caution. Small shifts in historic data may also occur due to changes in the CMS Provider of Services file, which is used to identify the cohort of included hospitals.

More Hospital Data


COVID-NET: Trends in Hospitalizations in Adults ?65 Years


Older adults are at increased risk for severe COVID-19 illness, including an increased risk for hospitalization. Since the start of the pandemic, people ages 65 and older were the age group with the largest percentage of COVID-19-associated hospitalizations, sometimes accounting for more than half of hospitalizations. Beginning in January, the proportion of cases in older adults began to decline as overall rates fell. Data from April show that people ages 65 and older now account for fewer than 1 in 3 hospitalizations. Since the beginning of April, people 18?49 years and 50?64 years both account for a larger portion of COVID-19-associated hospitalizations than people 65 years and older. This decline in the proportion of COVID-19-associated hospitalizations in older adults coincides with continued increased vaccination coverage in this age group.

Trends in COVID-19 Associated Hospitalizations in Adults ?65 Years


resize iconView Larger
The Coronavirus Disease 2019 (COVID-19)-Associate??d Hospitalization Surveillance Network (COVID-NET) is an additional source for hospitalization data collected through a network of more than 250 acute-care hospitals in 14 states (representing ~10% of the U.S. population). Detailed data on patient demographics, including race/ethnicity, underlying medical conditions, medical interventions, and clinical outcomes, are collected using a standardized case reporting form.
More COVID-NET Data

Deaths


The current 7-day moving average of new deaths (656) increased 3.8% compared with the previous 7-day moving average (632). As of May 5, a total of 576,238 COVID-19 deaths have been reported.

576,238
Total Deaths Reported

656
Current 7-Day Average*

632
Prior 7-Day Average

3.8%
Change in 7-Day Average Since Prior Week

*Historical deaths are excluded from the daily new deaths and 7-day average calculations until they are incorporated into the dataset by their applicable date. Of 14,357 historical deaths reported retroactively, 256 were reported in the current week and 278 were reported in the prior week.

Note: In the above table, historical data with missing report dates are excluded from current and prior 7-day averages, and the percent change in the 7-day average.

Daily Trends in Number of COVID-19 Deaths in the United States Reported to CDC
red-line.jpg

7-Day moving average

resize iconView Larger
More Death Data


Recent CDC COVID-19 Publications
  1. Rapid Emergence and Epidemiologic Characteristics of the SARS-CoV-2 B.1.526 Variant ? New York City, New York, January 1?April 5, 2021
  2. Identification of and Surveillance for the SARS-CoV-2 Variants B.1.427 and B.1.429 ? Colorado, January?March 2021
  3. Modeling of Future COVID-19 Cases, Hospitalizations, and Deaths, by Vaccination Rates and Nonpharmaceutical Intervention Scenarios ? United States, April?September 2021
  4. Safety Monitoring of the Janssen (Johnson & Johnson) COVID-19 Vaccine ? United States, March?April 2021
  5. Anxiety-Related Adverse Event Clusters After Janssen COVID-19 Vaccination ? Five U.S. Mass Vaccination Sites, April 2021
  6. COVID-19 Outbreak Among Farmworkers ? Okanogan County, Washington, May?August 2020
  7. COVID-19 Among Workers in the Seafood Processing Industry: Implications for Prevention Measures ? Alaska, March?October 2020
  8. Linked Clusters of SARS-CoV-2 Variant B.1.351 ? Maryland, January?February 2021
  9. Postvaccination SARS-CoV-2 Infections Among Skilled Nursing Facility Residents and Staff Members ? Chicago, Illinois, December 2020?March 2021
  10. COVID-19 Outbreak Associated with a SARS-CoV-2 R.1 Lineage Variant in a Skilled Nursing Facility After Vaccination Program ? Kentucky, March 2021
Recent COVID Data Tracker Updates
  • Updated Vaccination Demographic Trends tab now displays vaccination progress in the United States by sex and racial/ethnic group
  • Updated Cases, Deaths, and Testing tab displays case, death, and testing metrics in one location along with the level of community transmission by state, territory, or jurisdiction
  • Updated Variant Proportions tab now shows nowcast weighted estimates of variant proportions for the most recent 2-week interval
https://www.cdc.gov/coronavirus/2019-ncov/covid-data/covidview/index.html
 
covid-tracker-header-lrg.jpg
COVID Data Tracker Weekly Review


Updated May 14, 2021
Print
Subscribe to the Weekly Review


Interpretive Summary for May 14, 2021
Slay the Virus

On May 10, 2021, the Food and Drug Administrationexternal icon (FDA) issued an Emergency Use Authorization (EUA) for the Pfizer-BioNTech COVID-19 Vaccine for use in adolescents ages 12-15 years. On May 14, CDC?s Advisory Committee on Immunization Practices (ACIP) issued an interim recommendation in support of the EUA for the prevention of COVID-19 in adolescents ages 12-15 years. Additionally, CDC recently announced that fully vaccinated people, including adolescents, no longer need to wear masks in most situations. These announcements come as many families are looking forward to summer plans, including camp, youth sports, and travel. Authorization also comes as young people make up a rising proportion of new coronavirus cases in the United States.

Vaccinating adolescents is an important step toward stopping the spread of COVID-19. Yet, adolescent vaccination has been met with mixed reactions, with some parents eager to vaccinate their children against COVID-19, and others expressing hesitancy. Pfizer?s COVID-19 vaccine was found to be safe and effective in adolescents between the ages of 12-15 years in clinical trials. Side effects were generally consistent with those experienced by people ages 16-25 years. Side effects are typically normal signs that the body is building protection against the virus that causes COVID-19.

The COVID-19 pandemic has taken a toll on the mental health of many people, including adolescents. But as more people become eligible for vaccination, we have reason to be hopeful. In addition to preventing severe illness, COVID-19 vaccines will help adolescents safely return to doing the things they love ? whether that?s school, sports and other extracurricular activities, or socializing with friends. If you or someone you know is considering adolescent COVID-19 vaccination, talk with your pediatrician or family physician about the benefits of vaccination. CDC also has resources on credible vaccine information, and support for teens and young adults facing challenges during the COVID-19 pandemic.


Reported Cases


The current 7-day moving average of daily new cases (35,442) decreased 23.6% compared with the previous 7-day moving average (46,390). Compared with the highest peak on January 8, 2021 (250,037), the current 7-day average decreased 85.8%. A total of 32,643,851 COVID-19 cases have been reported as of May 12.

32,643,851
Total Cases Reported

35,442
Current 7-Day Average*

46,390
Prior 7-Day Average

-23.6%
Change in 7-Day Average since Prior Week

*Historical cases are excluded from daily new cases and 7-day average calculations until they are incorporated into the dataset for the applicable date. Of 89,986 historical cases reported retroactively, 1,651 were reported in the current week and 1,649 were reported in the prior week.

Note: In the above table, historical data with missing report dates are excluded from current and prior 7-day averages, and the percent change in the 7-day average.

Daily Trends in COVID-19 Cases in the United States Reported to CDC
red-line.jpg

7-Day moving average

resize iconView Larger
More Case Data


SARS-CoV-2 Variants


Nowcast estimates are now available on COVID Data Tracker. Current nowcast estimates are modeled data based on sequencing data from previous weeks. Nowcast provides timely estimates for the present, while accounting for limited sequence data availability, as specimens from the most current time interval are still being processed.

Multiple variants of the virus that causes COVID-19 are circulating globally and within the United States. To date, five variants have been classified as a variant of concern (VOC). Nowcast estimates of SARS-CoV-2 cases caused by these VOCs for the two weeks ending May 8 are summarized here. Nationally, B.1.1.7 proportions are predicted to increase to 72.4%; P.1 proportions are predicted to increase to 6.2%; B.1.427/B.1.429 proportions are predicted to decrease; and B.1.351 proportions are predicted to decrease. Nowcast estimates predict that B.1.1.7 proportions will increase to more than 60% in HHS regions 3 ? 10. B.1.351 is predicted to increase in regions 3 and 10; P.1 is predicted to increase in all regions except 7 and 8; and B.1.427/429 will be highest in regions 9 and 10. B.1.617.2, a new variant of interest, is predicted to increase in regions 2, and 7 ? 9.

SARS-CoV-2 Variants Circulating in the United States

resize iconView Larger

resize iconView Larger
More Variants Data


Testing


The percentage of COVID-19 RT-PCR tests that are positive (percent positivity) has decreased from the previous week. The 7-day average of percent positivity from tests is now 3.4%. The 7-day average number of tests reported for April 30-May 6 was 1,084,898, down 9.9% from 1,203,977 for the prior 7 days.

429,553,942
Total Tests Reported

1,084,898
7-Day Average Tests Reported

3.4%
7-Day Average % Positivity

4.0 %
Previous 7-Day Average % Positivity

-15.0%
Change in 7-Day Average % Positivity since Prior Week

COVID-19 Viral (RT-PCR) Laboratory Test 7-day Percent Positivity by State/Territory

resize iconView Larger
More Testing Dataexternal icon


Vaccinations


The U.S. COVID-19 Vaccination Program began December 14, 2020. As of May 13, 266.6 million vaccine doses have been administered. Overall, about 154.6 million people, or 46.6% of the total U.S. population, have received at least one dose of vaccine. About 119 million people, or 35.8% of the total U.S. population, have been fully vaccinated.* As of May 13, the 7-day average number of administered vaccine doses reported to CDC per day was 2.09 million, a 0.06% increase from the previous week.

The COVID Data Tracker Vaccination Demographic Trends tab shows vaccination trends by age group. As of May 13, 84.0% of people ages 65 or older have received at least one dose of vaccine and 71.8% are fully vaccinated. Over one-half (58.9%) of people ages 18 or older have received at least one dose of vaccine and 45.6% are fully vaccinated.

266,596,486
Vaccines Administered

154,624,231
People who received at least one dose

118,987,308
People who are fully vaccinated*

46.6%
Percentage of the US population that has received at least one dose

35.8%
Percentage of the US population that has been fully vaccinated*

+1.6
Percentage point increase from last week

+3.0
Percentage point increase from last week

*People who are fully vaccinated represents the number of people who have received the second dose in a two-dose COVID-19 vaccine series or one dose of the single-shot J&J/Janssen COVID-19 vaccine.

Daily Change in Number of COVID-19 Vaccinations in the United States Reported to CDC

red-line.jpg

7-Day moving average

resize iconView Larger
More Vaccination Data


Hospitalizations

New Hospital Admissions


The current 7-day average for May 5?May 11 was 4,049. This is a 12.4% decrease from the prior 7-day average (4,624) from April 28?May 4. The 7-day moving average for new admissions has been consistently decreasing since April 19.

2,178,309
Total New Admissions

4,049
Current 7-Day Average

4,624
Prior 7-Day Average

-12.4%
Change in 7-Day Average

Daily Trends in Number of New COVID-19 Hospital Admissions in the United States

resize iconView Larger
New admissions are pulled from a 10 am EST snapshot of the HHS Unified Hospital Timeseries Dataset. Due to potential reporting delays, data from the most recent 7 days, as noted in the figure above with the grey bar, should be interpreted with caution. Small shifts in historic data may also occur due to changes in the CMS Provider of Services file, which is used to identify the cohort of included hospitals.

More Hospital Data


COVID-NET: Trends in Hospitalizations in Children 5-17 years, including adolescents ages 12-17 years


Children ages 5-17 years have the lowest hospitalization rate of all age groups; however, children can experience severe illness and hospitalization associated with COVID-19. Hospitalization rates in adolescents ages 12-17 are comparable to those among children ages 0-4 years, and higher than those among children ages 5-11 years.

Among children ages 5-17 years, weekly COVID-19-associated hospitalization peaked at 1.3 per 100,000 persons in early January, then decreased to 0.4 per 100,000 persons in mid-March. However, data from late March and April show that hospitalization rates have steadily increased among children ages 5-17 years, increasing more than 200% since mid-March to 0.9 per 100,000 persons by late April. Hospitalization rates have increased in all pediatric age groups.

Rising hospitalization rates in children highlight the need for continuing prevention efforts, including mask-wearing and physical distancing. Now that COVID-19 vaccination is authorized for adolescents ages 12 years and older, implementation of COVID-19 vaccines for all eligible people is another critical tool to reduce the risk of COVID-19 hospitalization in children.

Trends in Hospitalizations in Children Ages 5-17 Years


resize iconView Larger
The Coronavirus Disease 2019 (COVID-19)-Associate??d Hospitalization Surveillance Network (COVID-NET) is an additional source for hospitalization data collected through a network of more than 250 acute-care hospitals in 14 states (representing ~10% of the U.S. population). Detailed data on patient demographics, including race/ethnicity, underlying medical conditions, medical interventions, and clinical outcomes, are collected using a standardized case reporting form.
More COVID-NET Data

Deaths


The current 7-day moving average of new deaths (592) decreased 10.3% compared with the previous 7-day moving average (660). As of May 12, a total of 580,837 COVID-19 deaths have been reported.

580,837
Total Deaths Reported

592
Current 7-Day Average*

660
Prior 7-Day Average

-10.3%
Change in 7-Day Average Since Prior Week

*Historical deaths are excluded from the daily new deaths and 7-day average calculations until they are incorporated into the dataset by their applicable date. Of 14,470 historical deaths reported retroactively, 213 were reported in the current week and 236 were reported in the prior week.

Note: In the above table, historical data with missing report dates are excluded from current and prior 7-day averages, and the percent change in the 7-day average.

Daily Trends in Number of COVID-19 Deaths in the United States Reported to CDC
red-line.jpg

7-Day moving average

resize iconView Larger
More Death Data


Recent CDC COVID-19 Publications
  1. Demographic and Social Factors Associated with COVID-19 Vaccination Initiation Among Adults Aged ?65 Years ? United States, December 14, 2020?April 10, 2021
  2. Diagnostic Performance of an Antigen Test with RT-PCR for the Detection of SARS-CoV-2 in a Hospital Setting ? Los Angeles County, California, June?August 2020
  3. Community-Based Testing for SARS-CoV-2 ? Chicago, Illinois, May?November 2020
  4. Rapid Emergence and Epidemiologic Characteristics of the SARS-CoV-2 B.1.526 Variant ? New York City, New York, January 1?April 5, 2021
  5. Identification of and Surveillance for the SARS-CoV-2 Variants B.1.427 and B.1.429 ? Colorado, January?March 2021
  6. Modeling of Future COVID-19 Cases, Hospitalizations, and Deaths, by Vaccination Rates and Nonpharmaceutical Intervention Scenarios ? United States, April?September 2021
  7. Demographic and Social Factors Associated with COVID-19 Vaccination Initiation Among Adults Aged ?65 Years ? United States, December 14, 2020?April 10, 2021
Recent COVID Data Tracker Updates
  • Addition of 12-15-year-old age group as a population of interest on the Vaccinations in the US tab
  • Updated Vaccination data on the County View tab shows the percentage of the population 12 years and over that is fully vaccinated by county
  • Addition of more bars to indicate vaccination administration in the last 14 days for each demographic category on the Vaccination Demographics tab
  • Addition of a new visualization to the New Hospital Admissions tab to show hospital admissions over time by state and age group
https://www.cdc.gov/coronavirus/2019...iew/index.html
 
Back
Top Bottom