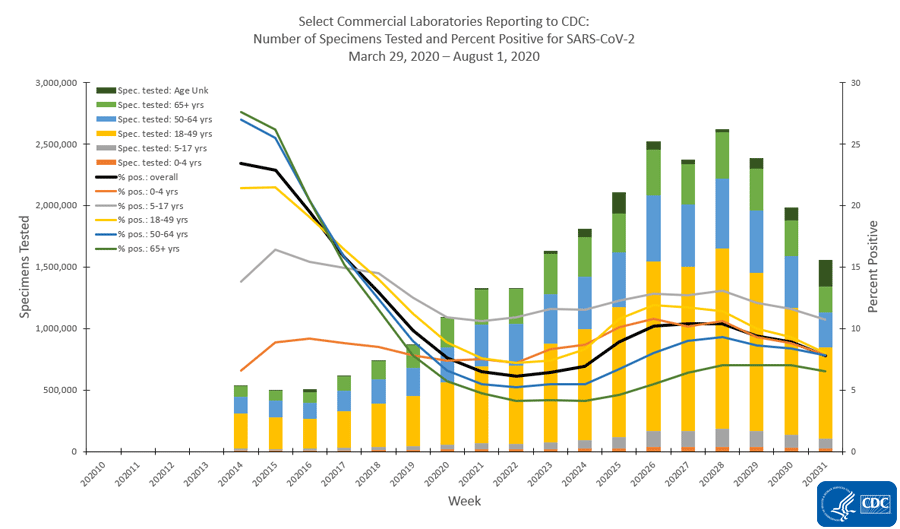
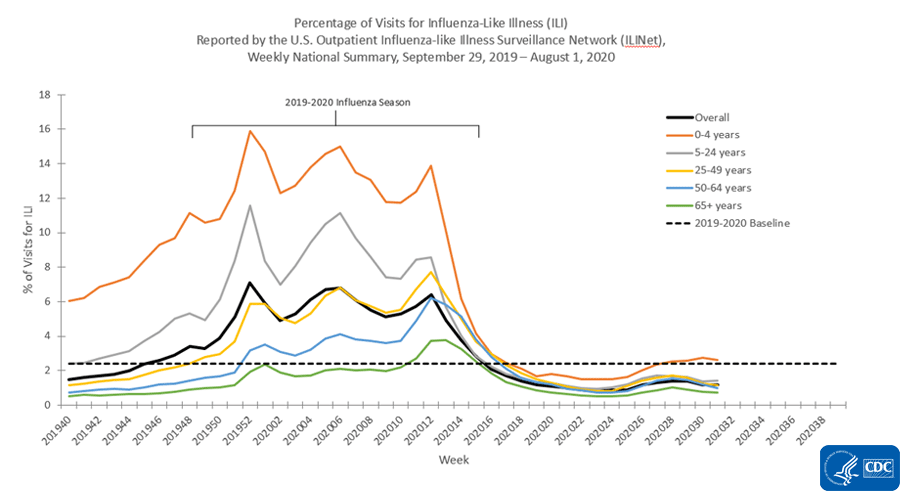
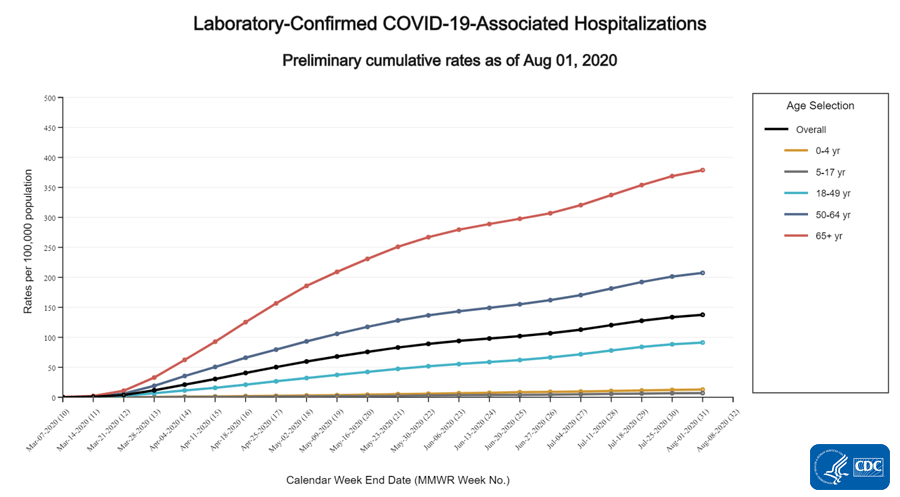
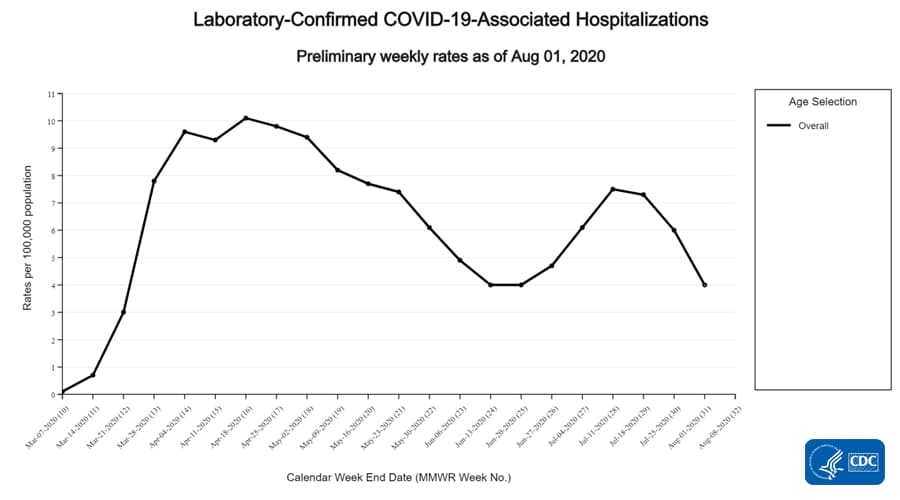
• FluTrackers.com Inc. does not provide medical advice. Information on this web site is collected from various internet resources, and the FluTrackers board of directors makes no warranty to the safety, efficacy, correctness or completeness of the information posted on this site by any author or poster. The information collated here is for instructional and/or discussion purposes only and is NOT intended to diagnose or treat any disease, illness, or other medical condition. Every individual reader or poster should seek advice from their personal physician/healthcare practitioner before considering or using any interventions that are discussed on this website. By continuing to access this website you agree to consult your personal physican before using any interventions posted on this website, and you agree to hold harmless FluTrackers.com Inc., the board of directors, the members, and all authors and posters for any effects from use of any medication, supplement, vitamin or other substance, device, intervention, etc. mentioned in posts on this website, or other internet venues referenced in posts on this website.
  • We are not asking for any donations. Do not donate to any entity who says they are raising funds for us.

US - CDC: COVIDView 2020/2021 - Not offered for exactness - Offered for trend analysis only

Ronan Kelly

Retired 2020
COVIDView: A Weekly Surveillance Summary of U.S. COVID-19 Activity
This CDC report provides a weekly summary and interpretation of key indicators being adapted to track
the COVID-19 pandemic in the United States. This includes information related to COVID-19 outpatient
visits, emergency department visits, hospitalizations and deaths, as well as laboratory data.
...


Key Points
o CDC is modifying existing surveillance systems, many used to track influenza and other respiratory
viruses annually, to track COVID-19.
o Visits to outpatient providers and emergency departments for illnesses with symptom presentation
similar to COVID-19 are elevated compared to what is normally seen at this time of year. At this time,
there is little influenza virus circulation.
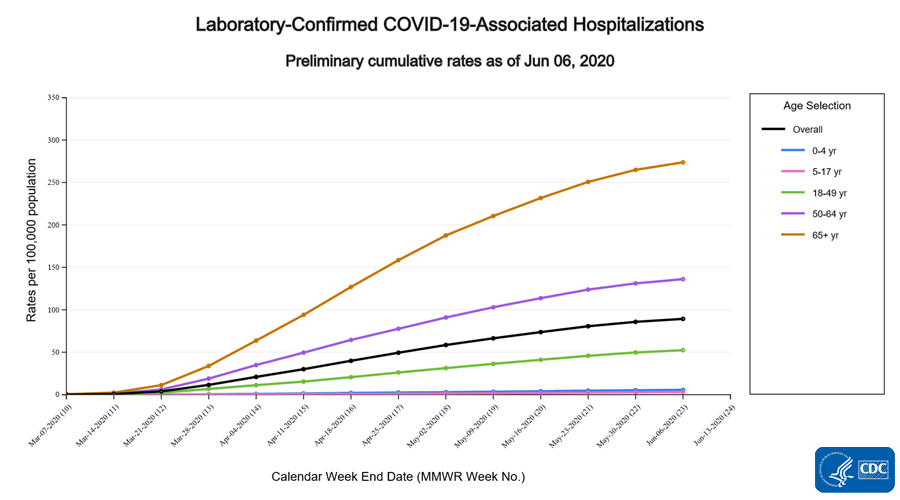
o The overall cumulative COVID-19 associated hospitalization rate is 4.6 per 100,000, with the highest
rates in persons 65 years and older (13.8 per 100,000) and 50-64 years (7.4 per 100,000). These rates
are similar to what is seen at the beginning of an annual influenza epidemic.
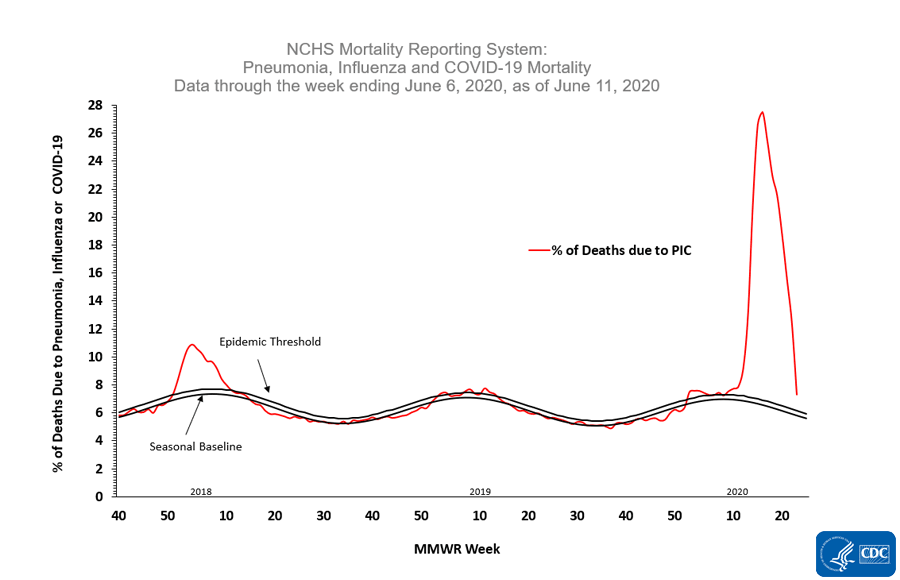
o The percentage of deaths attributed to pneumonia and influenza increased to 8.2% and is above the
epidemic threshold of 7.2%. The percent of deaths due to pneumonia has increased sharply since the
end of February, while those due to influenza increased modestly through early March and declined this
week. This could reflect an increase in deaths from pneumonia caused by non-influenza associated
infections including COVID-19.
o NCHS is monitoring deaths associated with COVID-19 and made those data publicly available on April 3,
2020.

...
https://www.cdc.gov/coronavirus/2019-ncov/covid-data/pdf/covidview.pdf
 
Provisional Death Counts for Coronavirus Disease (COVID-19)


alert icon

Note: Provisional death counts are based on death certificate data received and coded by the National Center for Health Statistics as of April 3, 2020. Death counts are delayed and may differ from other published sources (see Technical Notes). Counts will be updated periodically. Additional information will be added to this site as available.


The provisional counts for coronavirus disease (COVID-19) deaths are based on a current flow of mortality data in the National Vital Statistics System. National provisional counts include deaths occurring within the 50 states and the District of Columbia that have been received and coded as of the date specified. It is important to note that it can take several weeks for death records to be submitted to National Center for Health Statistics (NCHS), processed, coded, and tabulated. Therefore, the data shown on this page may be incomplete, and will likely not include all deaths that occurred during a given time period, especially for the more recent time periods. Death counts for earlier weeks are continually revised and may increase or decrease as new and updated death certificate data are received from the states by NCHS. COVID-19 death counts shown here may differ from other published sources, as data currently are lagged by an average of 1–2 weeks.

The provisional data presented on this page include the weekly provisional count of deaths in the United States due to COVID-19, deaths from all causes and percent of expected deaths (i.e., number of deaths received over number of deaths expected based on data from previous years), pneumonia deaths (excluding pneumonia deaths involving influenza), and pneumonia deaths involving COVID-19; (a) by week ending date, (b) by age at death, and (c) by specific jurisdictions. Future updates to this release may include additional detail such as demographic characteristics (e.g., sex), additional causes of death (e.g., acute respiratory distress syndrome or other comorbidities), or estimates based on models that account for reporting delays to generate more accurate predicted provisional counts.

Pneumonia deaths are included to provide context for understanding the completeness of COVID-19 mortality data and related trends. Deaths due to COVID-19 may be misclassified as pneumonia deaths in the absence of positive test results, and pneumonia may appear on death certificates as a comorbid condition. Thus, increases in pneumonia deaths may be an indicator of excess COVID-19-related mortality. Additionally, estimates of completeness for pneumonia deaths may provide context for understanding the lag in reporting for COVID-19 deaths, as it is anticipated that these causes would have similar delays in reporting, processing, and coding. However, it is possible that reporting of COVID-19 mortality may be slower or faster than for other causes of death, and that the delay may change over time. Analyses to better understand and quantify reporting delays for COVID-19 deaths and related causes are underway. The list of causes provided in these tables may expand in future releases as more data are received, and other potentially comorbid conditions are determined.
Download Datasets
Table 1. Deaths involving coronavirus disease 2019 (COVID-19) and pneumonia reported to NCHS by week ending date, United States. Week ending 2/1/2020 to 3/28/2020.*


Data as of 4/3/2020
Total Deaths1,150446,7788624,741469
02/01/20056,061942,9910
02/08/20056,209942,9850
02/15/20054,463922,8630
02/22/20054,017932,8330
02/29/20553,697932,8312
03/07/201652,506912,8265
03/14/204148,577852,73017
03/21/2030042,750742,642121
03/28/2078828,498502,040324
NOTE: Number of deaths reported in this table are the total number of deaths received and coded as of the date of analysis and do not represent all deaths that occurred in that period.

*Data during this period are incomplete because of the lag in time between when the death occurred and when the death certificate is completed, submitted to NCHS and processed for reporting purposes. This delay can range from 1 week to 8 weeks or more, depending on the jurisdiction, age, and cause of death.

[SUP]1[/SUP]Deaths with confirmed or presumed COVID-19, coded to ICD–10 code U07.1

[SUP]2[/SUP]Percent of expected deaths is the number of deaths for all causes for this week in 2020 compared to the average number across the same week in 2017–2019. Previous analyses of 2015–2016 provisional data completeness have found that completeness is lower in the first few weeks following the date of death (7).

[SUP]3[/SUP]Pneumonia death counts exclude pneumonia deaths involving influenza.
Table 2. Deaths involving coronavirus disease 2019 (COVID-19) and pneumonia reported to NCHS by age group, United States. Week ending 2/1/2020 to 3/28/2020.*


Data as of 4/3/2020
All ages1,150446,7788624,741469
Under 1 year02,39663190
1–4 years148974231
5–14 years071371260
15–24 years04,03678730
25–34 years88,424831893
35–44 years3312,076853888
45–54 years7523,2997798326
55–64 years12356,398832,82450
65–74 years26587,567884,77891
75–84 years331110,592886,590145
85 years and over314140,788848,848145
NOTE: Number of deaths reported in this table are the total number of deaths received and coded as of the date of analysis and do not represent all deaths that occurred in that period.

*Data during this period are incomplete because of the lag in time between when the death occurred and when the death certificate is completed, submitted to NCHS and processed for reporting purposes. This delay can range from 1 week to 8 weeks or more, depending on the jurisdiction, age, and cause of death.

[SUP]1[/SUP]Deaths with confirmed or presumed COVID-19, coded to ICD–10 code U07.1.

[SUP]2[/SUP]Percent of expected deaths is the number of deaths for all causes for this week in 2020 compared to the average number across the same week in 2017–2019.

[SUP]3[/SUP]Pneumonia death counts exclude pneumonia deaths involving influenza.
Table 3. Deaths involving coronavirus disease 2019 (COVID-19) and pneumonia reported to NCHS by jurisdiction of occurrence, United States. Week ending 2/1/2020 to 3/28/2020.*


Data as of 4/3/2020
United States1,150446,7788624,741469
Alabama08,136854080
Alaska058978230
Arizona010,532965230
Arkansas05,390922690
California5447,024933,13622
Colorado217,0209833411
Connecticut00000
Delaware01,11565500
District of Columbia092484580
Florida3837,346971,89912
Georgia1312,725835706
Hawaii01,904901180
Idaho12,389931101
Illinois918,762961,1554
Indiana010,635875990
Iowa05,007902950
Kansas34,441892401
Kentucky06,181703890
Louisiana446,8018225818
Maine02,640991780
Maryland58,721955020
Massachusetts69,893896633
Michigan1116,019907961
Minnesota47,613954072
Mississippi05,302923420
Missouri610,051844864
Montana01,49179660
Nebraska02,476791590
Nevada24,348932021
New Hampshire12,200981090
New Jersey4313,2109669424
New Mexico02,765791550
New York[SUP]4[/SUP]18017,731961,34398
New York City57910,9701101,012205
North Carolina03,060181510
North Dakota01,11589740
Ohio016,962756760
Oklahoma05,781783650
Oregon55,496832303
Pennsylvania1917,6927088010
Rhode Island01,49478500
South Carolina18,428943690
South Dakota11,28186700
Tennessee012,379927150
Texas632,459841,8252
Utah13,305971680
Vermont192387421
Virginia411,757944591
Washington929,8059356139
West Virginia02,563621400
Wisconsin09,200963760
Wyoming072789420
NOTE: Number of deaths reported in this table are the total number of deaths received and coded as of the date of analysis and do not represent all deaths that occurred in that period.

*Data during this period are incomplete because of the lag in time between when the death occurred and when the death certificate is completed, submitted to NCHS and processed for reporting purposes. This delay can range from 1 week to 8 weeks or more, depending on the jurisdiction, age, and cause of death.

[SUP]1[/SUP]Deaths with confirmed or presumed COVID-19, coded to ICD–10 code U07.1.

[SUP]2[/SUP]Percent of expected deaths is the number of deaths for all causes for this week in 2020 compared to the average number across the same week in 2017–2019.

[SUP]3[/SUP]Pneumonia death counts exclude pneumonia deaths involving influenza.

[SUP]4[/SUP]Excludes New York City.
Technical Notes


Comparing data in this report to other sources


Provisional death counts in this report will not match counts in other sources, such as media reports or numbers from county health departments. Death data, once received and processed by National Center for Health Statistics (NCHS), are tabulated by the state or jurisdiction in which the death occurred. Death counts are not tabulated by the decedent’s state of residence. COVID-19 deaths may also be classified or defined differently in various reporting and surveillance systems. Death counts in this report include laboratory confirmed COVID-19 deaths and clinically confirmed COVID-19 deaths. This includes deaths where COVID-19 is listed as a “presumed” or “probable” cause. Some local and state health departments only report laboratory-confirmed COVID deaths. This may partly account for differences between NCHS reported death counts and death counts reported in other sources. Provisional counts reported here track approximately 1–2 weeks behind other published data sources on the number of COVID-19 deaths in the U.S. (1,2,3).
Nature and sources of data


Provisional death counts are based on death records received and processed by NCHS as of a specified cutoff date. National provisional counts include deaths occurring within the 50 states and the District of Columbia. NCHS receives the death records from state vital registration offices through the Vital Statistics Cooperative Program. Provisional data are based on available records that meet certain data quality criteria at the time of analysis and may not include all deaths that occurred during a given time period especially for more recent periods. Estimates of completeness are provided. Therefore, they should not be considered comparable with final data and are subject to change.
Cause-of-death classification and definition of deaths


Mortality statistics are compiled in accordance with World Health Organization (WHO) regulations specifying that WHO member nations classify and code causes of death with the current revision of the International Statistical Classification of Diseases and Related Health Problems (ICD). ICD provides the basic guidance used in virtually all countries to code and classify causes of death. It provides not only disease, injury, and poisoning categories but also the rules used to select the single underlying cause of death for tabulation from the several diagnoses that may be reported on a single death certificate, as well as definitions, tabulation lists, the format of the death certificate, and regulations on use of the classification. Causes of death for data presented in this report were coded according to ICD guidelines described in annual issues of Part 2a of the NCHS Instruction Manual (4).

Coronavirus disease deaths are identified using the ICD–10 code U07.1. Deaths are coded to U07.1 when coronavirus disease 2019 or COVID-19 are reported as a cause that contributed to death on the death certificate. These can include laboratory confirmed cases, as well as cases without laboratory confirmation. If the certifier suspects COVID-19 or determines it was likely (e.g., the circumstances were compelling within a reasonable degree of certainty), they can report COVID-19 as “probable” or “presumed” on the death certificate (5).

Pneumonia deaths are identified using underlying cause-of-death codes from the 10th Revision of ICD (ICD–10): J12–J18, excluding deaths that involve influenza (J08–J11).
Estimated completeness of data


Provisional data are incomplete, and the level of completeness varies by jurisdiction, week, decedent’s age, and cause of death. Until data for a calendar year are finalized, typically in December of the following year, completeness of provisional data cannot be determined. However, completeness can be estimated in a variety of ways. Surveillance systems that rely on weekly monitoring of provisional mortality data, such as CDC’s FluView Interactive mortality surveillance (6), estimate completeness by comparing the count of deaths in a given week of the current year to the average count of deaths in that same week of the previous 3 years. These estimates can be generated for specific causes of death, jurisdictions, and age groups, and updated on a weekly or daily basis. For the purposes of COVID-19 surveillance, completeness is approximated by comparing the provisional number of deaths received to the number of expected deaths based on prior years data. Percent of expected deaths provided in this data release are based on the total count of deaths in the most recent weeks of the current year, compared with an average across the same weeks of the three previous years (i.e., 2017–2019). These estimates of completeness are calculated by week, jurisdiction of occurrence, and age group.

It is important to note that the true levels of completeness are unknown, and the estimates provided here are only a proxy. In cases where mortality rates are increasing rapidly, particularly when excess deaths due to a novel cause are occurring, values for completeness for recent weeks may exceed 100% even when NCHS has yet to receive all available data. Conversely, if the number of deaths was elevated in prior years due to a severe flu season, for example, estimated completeness in the most recent weeks may be lower than the true value. To avoid relying too heavily on comparisons to a single week of a single prior year, estimates of completeness included in this release are based on the average counts in a given week across 3 prior years (e.g., the 12th week of 2017, 2018, and 2019).

Percent of expected deaths provided in this release are shown to provide context for interpreting provisional counts of COVID-19 deaths and deaths due to related causes. Where estimated values are high (e.g., greater than 100%), this suggests that mortality is higher in 2020 relative to the same weeks of prior years. Where estimated values of completeness are low, this could indicate that data are incomplete due to delayed reporting, or that mortality is lower in 2020 compared with prior years, or some combination of these factors.
Delays in reporting


Provisional counts of deaths are underestimated relative to final counts. This is due to the many steps involved in reporting death certificate data. When a death occurs, a certifier (e.g. physician, medical examiner or coroner) will complete the death certificate with the underlying cause of death and any contributing causes of death. In some cases, laboratory tests or autopsy results may be required to determine the cause of death. Completed death certificate are sent to the state vital records office and then to NCHS for cause of death coding. At NCHS, about 80% of deaths are automatically processed and coded within seconds, but 20% of deaths need to manually coded, or coded by a person. Deaths involving certain conditions such as influenza and pneumonia are more likely to require manual coding than other causes of death. Furthermore, all deaths with COVID-19 are manually coded. Death certificates are typically manually coded within 7 days of receipt, although the coding delay can grow if there is a large increase in the number of deaths. As a result, underestimation of the number of deaths may be greater for certain causes of death than others.

Previous analyses of provisional data completeness from 2015 suggested that mortality data is approximately 27% complete within 2 weeks, 54% complete within 4 weeks, and at least 75% complete within 8 weeks of when the death occurred (7). Pneumonia deaths are 26% complete within 2 weeks, 52% complete within 4 weeks, and 72% complete within 8 weeks (unpublished). Data timeliness has improved in recent years, and current timeliness is likely higher than published rates.
Comparing deaths from different states


Death counts should not be compared across states. Data timeliness varies by state. Some states report deaths on a daily basis, while other states report deaths weekly or monthly. Furthermore, health departments and state vital record offices may be affected by COVID-19 related response activities, which could further delay death certificate reporting. Currently, 63% of U.S. deaths are reported within 10 days of the date of death, but there is variation within states. Twenty states report over 75% of deaths within the first 10 days, while three states report fewer than 1% of deaths within 10 days.
Why are pneumonia deaths included in this report?


Pneumonia deaths are included to provide context for understanding the completeness of COVID-19 mortality data and related trends. Deaths due to COVID-19 may be misclassified as pneumonia deaths in the absence of positive test results, and pneumonia may appear on death certificates as a comorbid condition. Thus, increases in pneumonia deaths may be an indicator of excess COVID-19-related mortality. Additionally, estimates of completeness for pneumonia deaths may provide context for understanding the lag in reporting for COVID-19 deaths, as it is anticipated that these causes would have similar delays in reporting, processing, and coding.
Source


NCHS, National Vital Statistics System. Estimates are based on provisional data.
References
  1. Dong E, Du H, Gardner L. An interactive web-based dashboard to track COVID-19 in real time. Lancet Infect Dis. 2020. Available from: https://doi.org/10.1016/S1473-3099(20)30120-1.external icon
  2. Wu J, McCann A, Collins K, Harris R, Huang J, Almukhtar S. Coronavirus in the U.S.: Latest map and case count. New York Times. https://www.nytimes.com/interactive/2020/us/coronavirus-us-cases.html.external icon
  3. National Center for Immunization and Respiratory Diseases (NCIRD), Division of Viral Diseases. Cases in the US. Centers for Disease Control and Prevention. 2020.
  4. National Vital Statistics System. Instructions for classifying the underlying cause of death. In: NCHS instruction manual; Part 2a. Published annually.
  5. World Health Organization. Emergency use ICD codes for COVID-19 disease outbreak. Available from: http://www9.who.int/classifications/icd/covid19/en/.external icon
  6. National Center for Immunization and Respiratory Diseases (NCIRD). CDC’s FluView Interactive. Centers for Disease Control and Prevention. Available from: https://www.cdc.gov/flu/weekly/index.htm.
  7. Spencer MR, Ahmad F. Timeliness of death certificate data for mortality surveillance and provisional estimates. National Center for Health Statistics. 2016.
Page last reviewed: April 3, 2020
Content source: CDC/National Center for Health StatisticsNational Vital Statistics System
Related Sites
https://www.cdc.gov/nchs/nvss/vsrr/COVID19/index.htm
 
Provisional Death Counts for Coronavirus Disease (COVID-19)


alert icon

Note: Provisional death counts are based on death certificate data received and coded by the National Center for Health Statistics as of April 10, 2020. Death counts are delayed and may differ from other published sources (see Technical Notes). Counts will be updated periodically. Additional information will be added to this site as available.


The provisional counts for coronavirus disease (COVID-19) deaths are based on a current flow of mortality data in the National Vital Statistics System. National provisional counts include deaths occurring within the 50 states and the District of Columbia that have been received and coded as of the date specified. It is important to note that it can take several weeks for death records to be submitted to National Center for Health Statistics (NCHS), processed, coded, and tabulated. Therefore, the data shown on this page may be incomplete, and will likely not include all deaths that occurred during a given time period, especially for the more recent time periods. Death counts for earlier weeks are continually revised and may increase or decrease as new and updated death certificate data are received from the states by NCHS. COVID-19 death counts shown here may differ from other published sources, as data currently are lagged by an average of 1–2 weeks.

The provisional data presented on this page include the weekly provisional count of deaths in the United States due to COVID-19, deaths from all causes and percent of expected deaths (i.e., number of deaths received over number of deaths expected based on data from previous years), pneumonia deaths (excluding pneumonia deaths involving influenza), pneumonia deaths, and influenza deaths involving COVID-19; (a) by week ending date, (b) by age at death, (c) by sex, and (d) by specific jurisdictions. Future updates to this release may include additional detail such as demographic characteristics, additional causes of death (e.g., acute respiratory distress syndrome or other comorbidities), or estimates based on models that account for reporting delays to generate more accurate predicted provisional counts.

Pneumonia and influenza deaths are included to provide context for understanding the completeness of COVID-19 mortality data and related trends. Deaths due to COVID-19 may be misclassified as pneumonia or influenza deaths in the absence of positive test results, and these conditions may appear on death certificates as a comorbid condition. Thus, increases in pneumonia or influenza deaths may be an indicator of excess COVID-19-related mortality. Additionally, estimates of completeness for influenza or pneumonia deaths may provide context for understanding the lag in reporting for COVID-19 deaths, as it is anticipated that these causes would have similar delays in reporting, processing, and coding. However, it is possible that reporting of COVID-19 mortality may be slower or faster than for other causes of death, and that the delay may change over time. Analyses to better understand and quantify reporting delays for COVID-19 deaths and related causes are underway. The list of causes provided in these tables may expand in future releases as more data are received, and other potentially comorbid conditions are determined.
Download Datasets

Table 1. Deaths involving coronavirus disease 2019 (COVID-19), pneumonia, and influenza reported to NCHS by week ending date, United States. Week ending 2/1/2020 to 4/4/2020.*


Data as of April 10, 2020
Table 1.webp

NOTE: Number of deaths reported in this table are the total number of deaths received and coded as of the date of analysis and do not represent all deaths that occurred in that period.

*Data during this period are incomplete because of the lag in time between when the death occurred and when the death certificate is completed, submitted to NCHS and processed for reporting purposes. This delay can range from 1 week to 8 weeks or more, depending on the jurisdiction, age, and cause of death.

[SUP]1[/SUP]Deaths with confirmed or presumed COVID-19, coded to ICD–10 code U07.1

[SUP]2[/SUP]Percent of expected deaths is the number of deaths for all causes for this week in 2020 compared to the average number across the same week in 2017–2019. Previous analyses of 2015–2016 provisional data completeness have found that completeness is lower in the first few weeks following the date of death (8).

[SUP]3[/SUP]Pneumonia death counts exclude pneumonia deaths involving influenza.

[SUP]4[/SUP]Influenza death counts include deaths with pneumonia or COVID-19 also listed as a cause of death.

[SUP]5[/SUP]Population is based on 2018 postcensal estimates from the U.S. Census Bureau (9)


Table 2. Deaths involving coronavirus disease 2019 (COVID-19), pneumonia, and influenza reported to NCHS by age group, United States. Week ending 2/1/2020 to 4/4/2020.*


Data as of April 10, 2020
Table 2.webp

NOTE: Number of deaths reported in this table are the total number of deaths received and coded as of the date of analysis and do not represent all deaths that occurred in that period.

*Data during this period are incomplete because of the lag in time between when the death occurred and when the death certificate is completed, submitted to NCHS and processed for reporting purposes. This delay can range from 1 week to 8 weeks or more, depending on the jurisdiction, age, and cause of death.

[SUP]1[/SUP]Deaths with confirmed or presumed COVID-19, coded to ICD–10 code U07.1.

[SUP]2[/SUP]Percent of expected deaths is the number of deaths for all causes for this week in 2020 compared to the average number across the same week in 2017–2019.

[SUP]3[/SUP]Pneumonia death counts exclude pneumonia deaths involving influenza.

[SUP]4[/SUP]Influenza death counts include deaths with pneumonia or COVID-19 also listed as a cause of death.

[SUP]5[/SUP]Population is based on 2018 postcensal estimates from the U.S. Census Bureau (9)


Table 3. Deaths involving coronavirus disease 2019 (COVID-19), pneumonia, and influenza reported to NCHS by sex, United States. Week ending 2/1/2020 to 4/4/2020.*


Data as of April 10, 2020
Table 3.webp

NOTE: Number of deaths reported in this table are the total number of deaths received and coded as of the date of analysis and do not represent all deaths that occurred in that period.

*Data during this period are incomplete because of the lag in time between when the death occurred and when the death certificate is completed, submitted to NCHS and processed for reporting purposes. This delay can range from 1 week to 8 weeks or more, depending on the jurisdiction, age, and cause of death.

[SUP]1[/SUP]Deaths with confirmed or presumed COVID-19, coded to ICD–10 code U07.1.

[SUP]2[/SUP]Percent of expected deaths is the number of deaths for all causes for this week in 2020 compared to the average number across the same week in 2017–2019.

[SUP]3[/SUP]Pneumonia death counts exclude pneumonia deaths involving influenza.

[SUP]4[/SUP]Influenza death counts include deaths with pneumonia or COVID-19 also listed as a cause of death.


Table 4. Deaths involving coronavirus disease 2019 (COVID-19), pneumonia, and influenza reported to NCHS by jurisdiction of occurrence, United States. Week ending 2/1/2020 to 4/4/2020.*


Data as of April 10, 2020
Table 4.webp

NOTE: Number of deaths reported in this table are the total number of deaths received and coded as of the date of analysis and do not represent all deaths that occurred in that period.

*Data during this period are incomplete because of the lag in time between when the death occurred and when the death certificate is completed, submitted to NCHS and processed for reporting purposes. This delay can range from 1 week to 8 weeks or more, depending on the jurisdiction, age, and cause of death.

[SUP]1[/SUP]Deaths with confirmed or presumed COVID-19, coded to ICD–10 code U07.1.

[SUP]2[/SUP]Percent of expected deaths is the number of deaths for all causes for this week in 2020 compared to the average number across the same week in 2017–2019.

[SUP]3[/SUP]Pneumonia death counts exclude pneumonia deaths involving influenza.

[SUP]4[/SUP]Influenza death counts include deaths with pneumonia or COVID-19 also listed as a cause of death.

[SUP]5[/SUP]United States death count includes the 50 states, plus the District of Columbia and New York City.

[SUP]6[/SUP]Excludes New York City.
Technical Notes


Comparing data in this report to other sources


Provisional death counts in this report will not match counts in other sources, such as media reports or numbers from county health departments. Death data, once received and processed by National Center for Health Statistics (NCHS), are tabulated by the state or jurisdiction in which the death occurred. Death counts are not tabulated by the decedent’s state of residence. COVID-19 deaths may also be classified or defined differently in various reporting and surveillance systems. Death counts in this report include laboratory confirmed COVID-19 deaths and clinically confirmed COVID-19 deaths. This includes deaths where COVID-19 is listed as a “presumed” or “probable” cause. Some local and state health departments only report laboratory-confirmed COVID deaths. This may partly account for differences between NCHS reported death counts and death counts reported in other sources. Provisional counts reported here track approximately 1–2 weeks behind other published data sources on the number of COVID-19 deaths in the U.S. (1,2,3).
Nature and sources of data


Provisional death counts are based on death records received and processed by NCHS as of a specified cutoff date. National provisional counts include deaths occurring within the 50 states and the District of Columbia. NCHS receives the death records from state vital registration offices through the Vital Statistics Cooperative Program. Provisional data are based on available records that meet certain data quality criteria at the time of analysis and may not include all deaths that occurred during a given time period especially for more recent periods. Estimates of completeness are provided. Therefore, they should not be considered comparable with final data and are subject to change.
Cause-of-death classification and definition of deaths


Mortality statistics are compiled in accordance with World Health Organization (WHO) regulations specifying that WHO member nations classify and code causes of death with the current revision of the International Statistical Classification of Diseases and Related Health Problems (ICD). ICD provides the basic guidance used in virtually all countries to code and classify causes of death. It provides not only disease, injury, and poisoning categories but also the rules used to select the single underlying cause of death for tabulation from the several diagnoses that may be reported on a single death certificate, as well as definitions, tabulation lists, the format of the death certificate, and regulations on use of the classification. Causes of death for data presented in this report were coded according to ICD guidelines described in annual issues of Part 2a of the NCHS Instruction Manual (4).

Coronavirus disease deaths are identified using the ICD–10 code U07.1. Deaths are coded to U07.1 when coronavirus disease 2019 or COVID-19 are reported as a cause that contributed to death on the death certificate. These can include laboratory confirmed cases, as well as cases without laboratory confirmation. If the certifier suspects COVID-19 or determines it was likely (e.g., the circumstances were compelling within a reasonable degree of certainty), they can report COVID-19 as “probable” or “presumed” on the death certificate (5, 6).

Pneumonia deaths are identified using underlying cause-of-death codes from the 10th Revision of ICD (ICD–10): J12–J18, excluding deaths that involve influenza (J09–J11). Influenza deaths are identified from the ICD–10 codes J09–J11, and include deaths with pneumonia or COVID-19 listed as a contributing cause of death.
Estimated completeness of data


Provisional data are incomplete, and the level of completeness varies by jurisdiction, week, decedent’s age, and cause of death. Until data for a calendar year are finalized, typically in December of the following year, completeness of provisional data cannot be determined. However, completeness can be estimated in a variety of ways. Surveillance systems that rely on weekly monitoring of provisional mortality data, such as CDC’s FluView Interactive mortality surveillance (7), estimate completeness by comparing the count of deaths in a given week of the current year to the average count of deaths in that same week of the previous 3 years. These estimates can be generated for specific causes of death, jurisdictions, and age groups, and updated on a weekly or daily basis. For the purposes of COVID-19 surveillance, completeness is approximated by comparing the provisional number of deaths received to the number of expected deaths based on prior years data. Percent of expected deaths provided in this data release are based on the total count of deaths in the most recent weeks of the current year, compared with an average across the same weeks of the three previous years (i.e., 2017–2019). These estimates of completeness are calculated by week, jurisdiction of occurrence, and age group.

It is important to note that the true levels of completeness are unknown, and the estimates provided here are only a proxy. In cases where mortality rates are increasing rapidly, particularly when excess deaths due to a novel cause are occurring, values for completeness for recent weeks may exceed 100% even when NCHS has yet to receive all available data. Conversely, if the number of deaths was elevated in prior years due to a severe flu season, for example, estimated completeness in the most recent weeks may be lower than the true value. To avoid relying too heavily on comparisons to a single week of a single prior year, estimates of completeness included in this release are based on the average counts in a given week across 3 prior years (e.g., the 12th week of 2017, 2018, and 2019).

Percent of expected deaths provided in this release are shown to provide context for interpreting provisional counts of COVID-19 deaths and deaths due to related causes. Where estimated values are high (e.g., greater than 100%), this suggests that mortality is higher in 2020 relative to the same weeks of prior years. Where estimated values of completeness are low, this could indicate that data are incomplete due to delayed reporting, or that mortality is lower in 2020 compared with prior years, or some combination of these factors.
Delays in reporting


Provisional counts of deaths are underestimated relative to final counts. This is due to the many steps involved in reporting death certificate data. When a death occurs, a certifier (e.g. physician, medical examiner or coroner) will complete the death certificate with the underlying cause of death and any contributing causes of death. In some cases, laboratory tests or autopsy results may be required to determine the cause of death. Completed death certificate are sent to the state vital records office and then to NCHS for cause of death coding. At NCHS, about 80% of deaths are automatically processed and coded within seconds, but 20% of deaths need to manually coded, or coded by a person. Deaths involving certain conditions such as influenza and pneumonia are more likely to require manual coding than other causes of death. Furthermore, all deaths with COVID-19 are manually coded. Death certificates are typically manually coded within 7 days of receipt, although the coding delay can grow if there is a large increase in the number of deaths. As a result, underestimation of the number of deaths may be greater for certain causes of death than others.

Previous analyses of provisional data completeness from 2015 suggested that mortality data is approximately 27% complete within 2 weeks, 54% complete within 4 weeks, and at least 75% complete within 8 weeks of when the death occurred (8). Pneumonia deaths are 26% complete within 2 weeks, 52% complete within 4 weeks, and 72% complete within 8 weeks (unpublished). Data timeliness has improved in recent years, and current timeliness is likely higher than published rates.
Comparing deaths from different states


Death counts should not be compared across states. Data timeliness varies by state. Some states report deaths on a daily basis, while other states report deaths weekly or monthly. Furthermore, health departments and state vital record offices may be affected by COVID-19 related response activities, which could further delay death certificate reporting. Currently, 63% of U.S. deaths are reported within 10 days of the date of death, but there is variation within states. Twenty states report over 75% of deaths within the first 10 days, while three states report fewer than 1% of deaths within 10 days.
Why are pneumonia and influenza deaths included in this report?


Pneumonia and influenza deaths are included to provide context for understanding the completeness of COVID-19 mortality data and related trends. Deaths due to COVID-19 may be misclassified as pneumonia or influenza deaths in the absence of positive test results, and pneumonia or influenza may appear on death certificates as a comorbid condition. Additionally, COVID-19 symptoms can be similar to influenza-like illness, thus deaths may be misclassified as influenza. Thus, increases in pneumonia and influenza deaths may be an indicator of excess COVID-19-related mortality. Additionally, estimates of completeness for pneumonia and influenza deaths may provide context for understanding the lag in reporting for COVID-19 deaths, as it is anticipated that these causes would have similar delays in reporting, processing, and coding.
Source


NCHS, National Vital Statistics System. Estimates are based on provisional data.
References
  1. Dong E, Du H, Gardner L. An interactive web-based dashboard to track COVID-19 in real time. Lancet Infect Dis. 2020. Available from: https://doi.org/10.1016/S1473-3099(20)30120-1.external icon
  2. Wu J, McCann A, Collins K, Harris R, Huang J, Almukhtar S. Coronavirus in the U.S.: Latest map and case count. New York Times. https://www.nytimes.com/interactive/2020/us/coronavirus-us-cases.html.external icon
  3. National Center for Immunization and Respiratory Diseases (NCIRD), Division of Viral Diseases. Cases in the US. Centers for Disease Control and Prevention. 2020.
  4. National Vital Statistics System. Instructions for classifying the underlying cause of death. In: NCHS instruction manual; Part 2a. Published annually.
  5. National Center for Health Statistics. Guidance for certifying deaths due to COVID–19. Hyattsville, MD. 2020. Available from: https://www.cdc.gov/nchs/data/nvss/vsrg/vsrg03-508.pdf.pdf icon
  6. National Center for Health Statistics. New ICD code introduced for COVID-19 deaths. Hyattsville, MD. 2020. Available from: https://www.cdc.gov/nchs/data/nvss/coronavirus/Alert-2-New-ICD-code-introduced-for-COVID-19-deaths.pdfpdf icon
  7. National Center for Immunization and Respiratory Diseases (NCIRD). CDC’s FluView Interactive. Centers for Disease Control and Prevention. Available from: https://www.cdc.gov/flu/weekly/index.htm.
  8. Spencer MR, Ahmad F. Timeliness of death certificate data for mortality surveillance and provisional estimates. National Center for Health Statistics. 2016.
  9. U.S. Census Bureau. Annual estimates of the resident population by single year of age and sex for the United States: April 1, 2010 to July 1, 2018. Available from: https://factfinder.census.gov/faces/tableservices/jsf/pages/productview.xhtml?pid=PEP_2018_PEPSYASEXN&prodType =table.external icon
Page last reviewed: April 10, 2020
Content source: CDC/National Center for Health Statistics

https://www.cdc.gov/nchs/nvss/vsrr/COVID19/index.htm

 
Updated April 10, 2020

Download Weekly Summary pdf icon[10 Pages, 2 MB]

Key Updates for Week 14, ending April 4, 2020

This CDC report provides a weekly summary and interpretation of key indicators that have been adapted to track the COVID-19 pandemic in the United States. While influenza-like-illness (ILI) declined, it is still elevated and laboratory confirmed COVID-19 activity continues to increase as do COVID-19 severity indicators (hospitalizations and deaths).

Virus
Public Health, Commercial and Clinical Laboratories
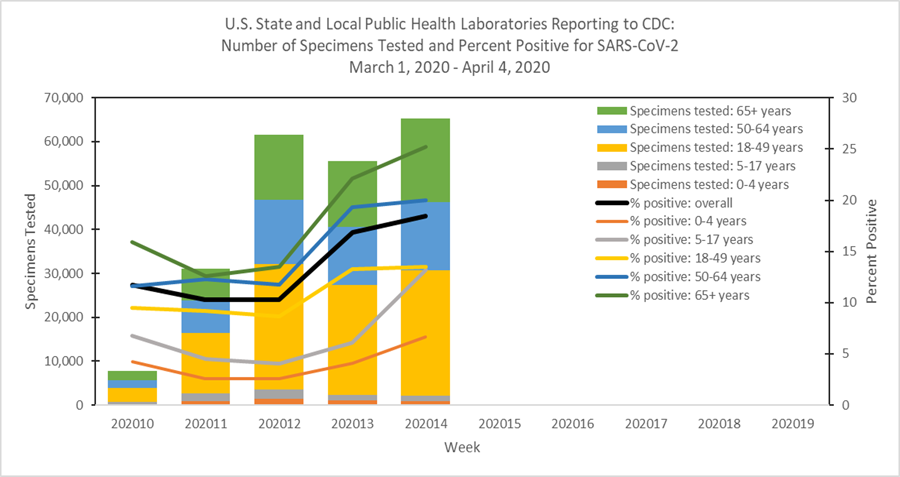
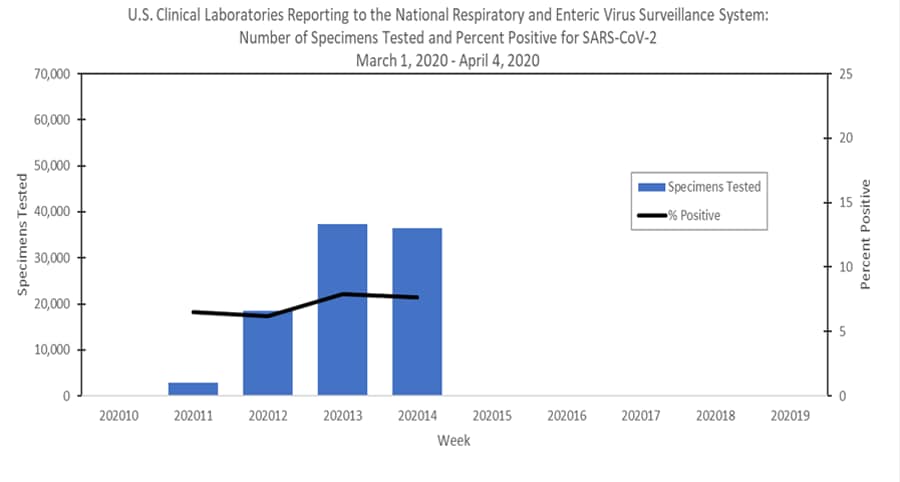
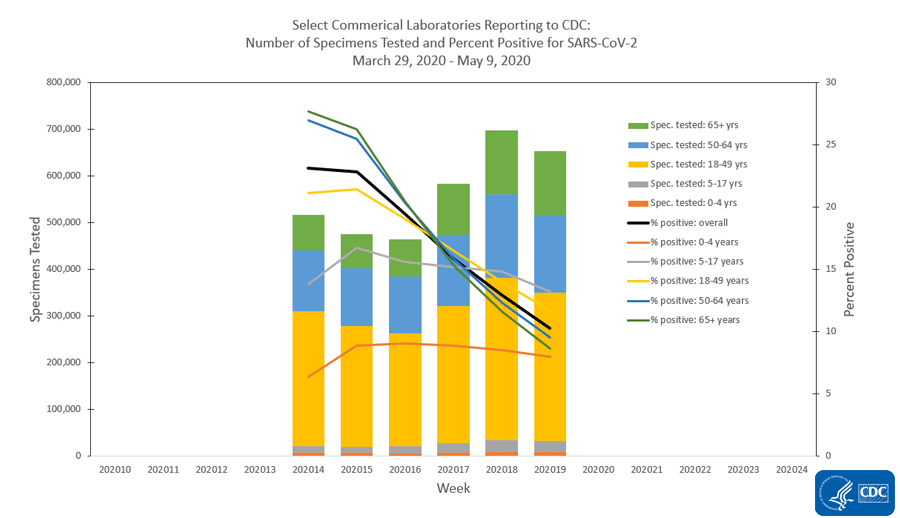
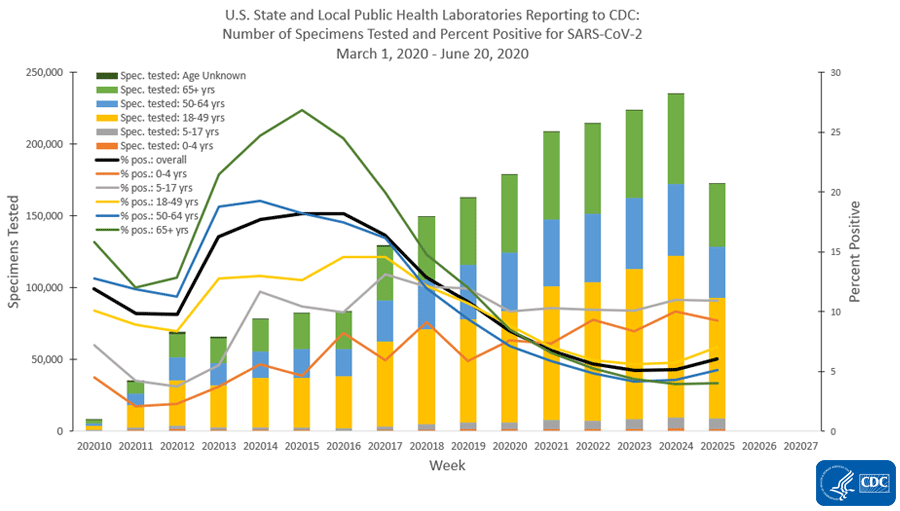
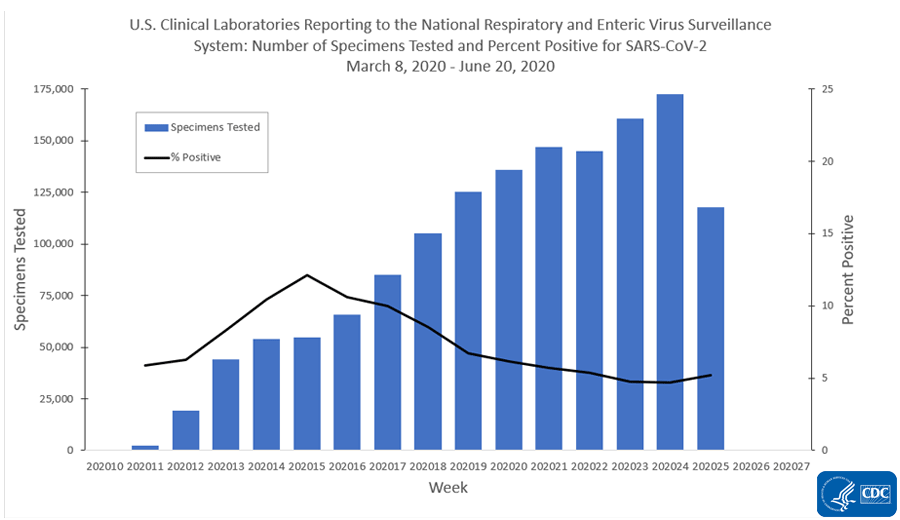
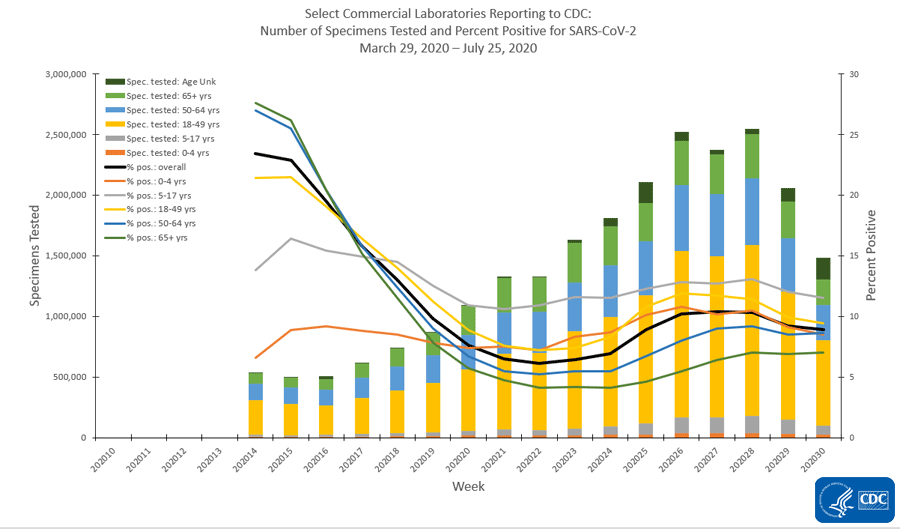
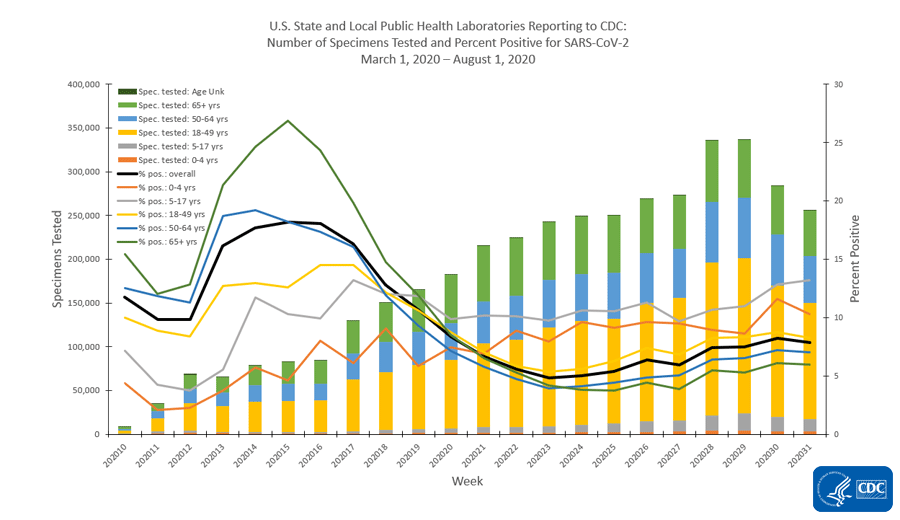
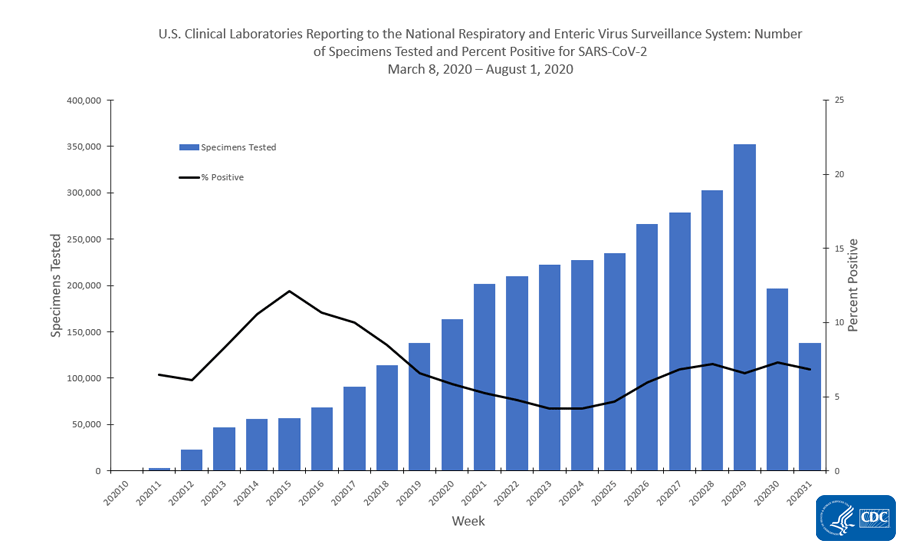
Public health, commercial and clinical laboratories are all testing for SARS-CoV-2 and reporting their results. The national percentage of respiratory specimens testing positive for SARS-CoV-2 is increasing overall and for week 14 is distributed as follows:
  • 18.5% at public health laboratories, and
  • 7.7% at clinical laboratories.
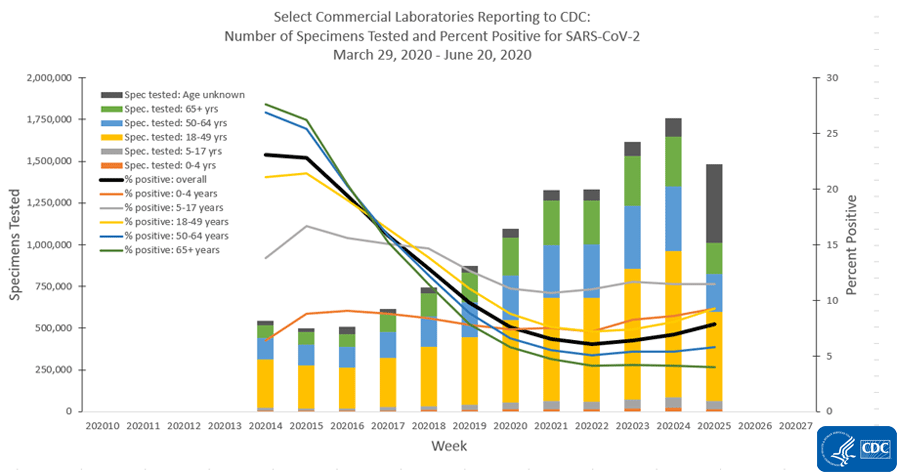
Since the start of the outbreak, 17.6 % of specimens tested at commercial laboratories have been positive for SARS-CoV-2.

Outpatient and Emergency Department Visits
Outpatient Influenza-Like Illness Network (ILINet) and National Syndromic Surveillance Program (NSSP)
Two indicators from existing surveillance systems are being monitored to track outpatient or emergency department (ED) visits for potential COVID-19 illness.
  • Nationally, the percentages of visits for influenza-like illness (ILI) and COVID-19-like illness (CLI) are elevated compared to what is normally seen at this time but decreased compared to last week.
Recent changes in health care seeking behavior are likely impacting both networks, making it difficult to draw further conclusions at this time. Tracking these systems moving forward will give additional insight into illness related to COVID-19.

Severe Disease
Hospitalizations
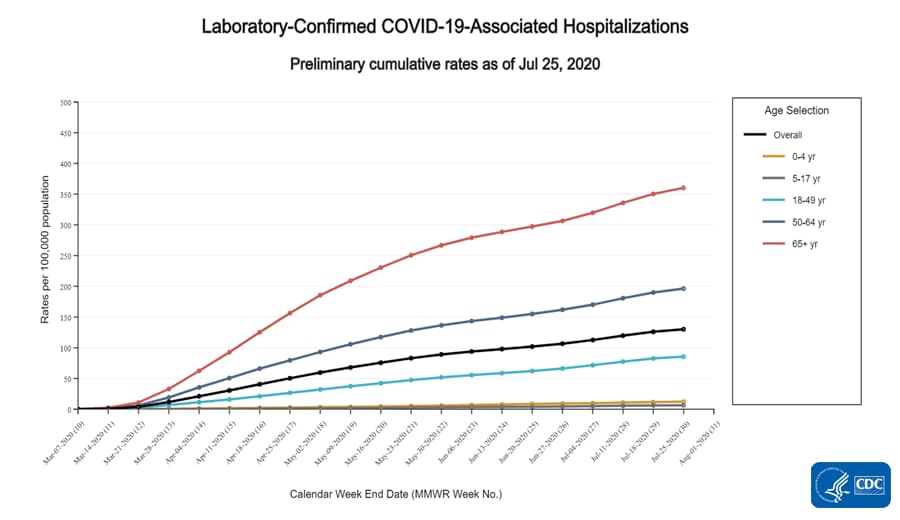
Cumulative COVID-19-associated hospitalization rates since March 1, 2020, will be updated weekly. The overall cumulative hospitalization rate is 12.3 per 100,000, with the highest rates in persons 65 years and older (38.7 per 100,000) and 50-64 years (20.7 per 100,000).

Mortality
Based on death certificate data, the percentage of deaths attributed to COVID-19 increased from 4.0% during week 13 to 6.9% during week 14. The percentage of deaths due to pneumonia (excluding COVID-19 or influenza) decreased from 7.5% during week 13 to 7.2% during week 14.

All data are preliminary and may change as more reports are received.

A description of the surveillance systems summarized in COVIDView, including methodology and detailed descriptions of each data component, is available on the surveillance methods page.

Key Points
  • CDC is modifying existing surveillance systems, many used to track influenza and other respiratory viruses annually, to track COVID-19.
  • Nationally, the percentage of laboratory specimens testing positive for SARS-CoV-2 continued to increase.
  • Visits to outpatient providers and emergency departments (EDs) for illnesses with symptoms consistent with COVID-19 are elevated compared to what is normally seen at this time of year but decreased compared to levels reported last week. At this time, there is little influenza virus circulation so the elevated proportion of people presenting with these symptoms is likely due to COVID-19, but may be tempered by a number of factors including less ILI overall because of widespread adoption of social distancing efforts as well as changes in healthcare seeking practices.
  • The overall cumulative COVID-19 associated hospitalization rate is 12.3 per 100,000, with the highest rates in persons 65 years and older (38.7 per 100,000) and 50-64 years (20.7 per 100,000). Hospitalization rates for COVID-19 in older people are higher than what is typically seen early in a flu season.
  • Based on death certificate data, the percentage of deaths attributed to COVID-19 increased from 4.0% during week 13 to 6.9% during week 14. The percentage of deaths due to pneumonia (excluding COVID-19 or influenza) decreased from 7.5% during week 13 to 7.2% during week 14.

U.S. Virologic Surveillance

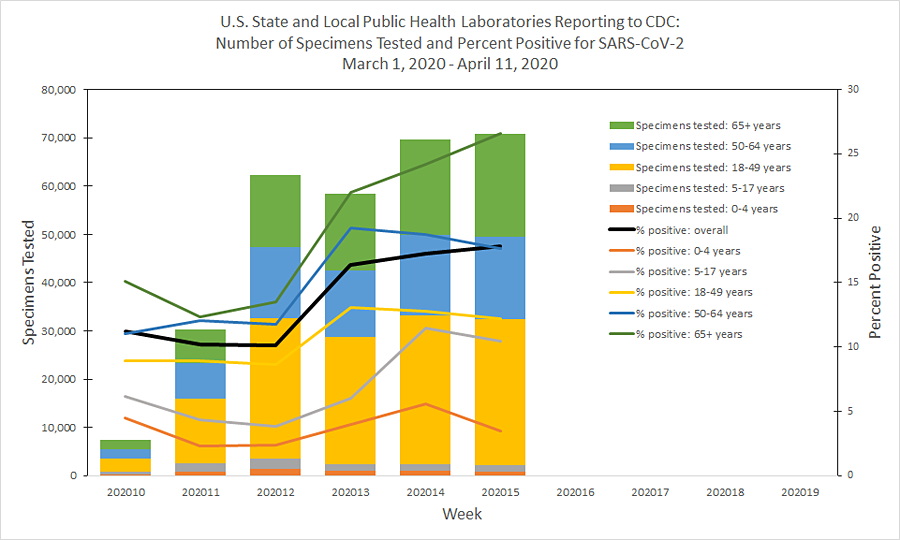
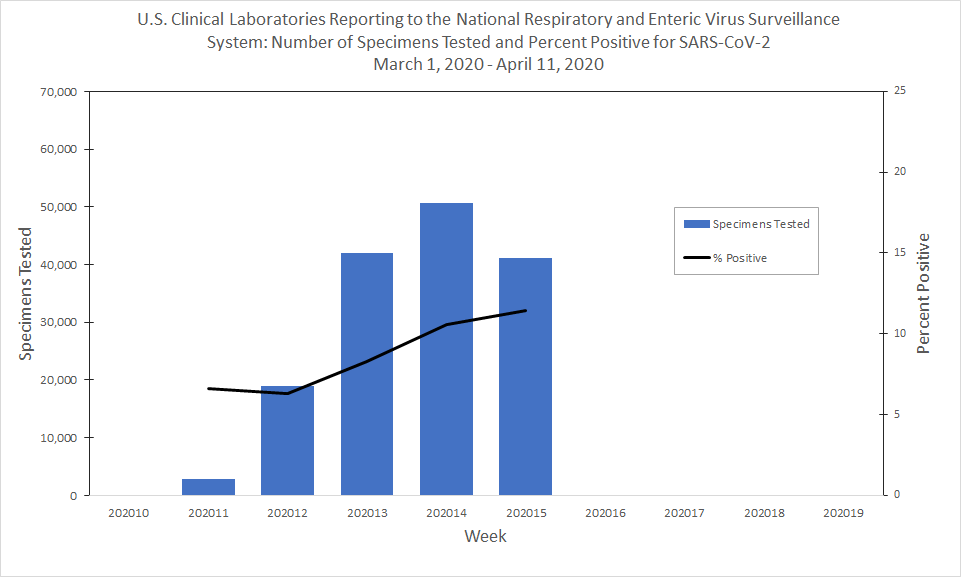
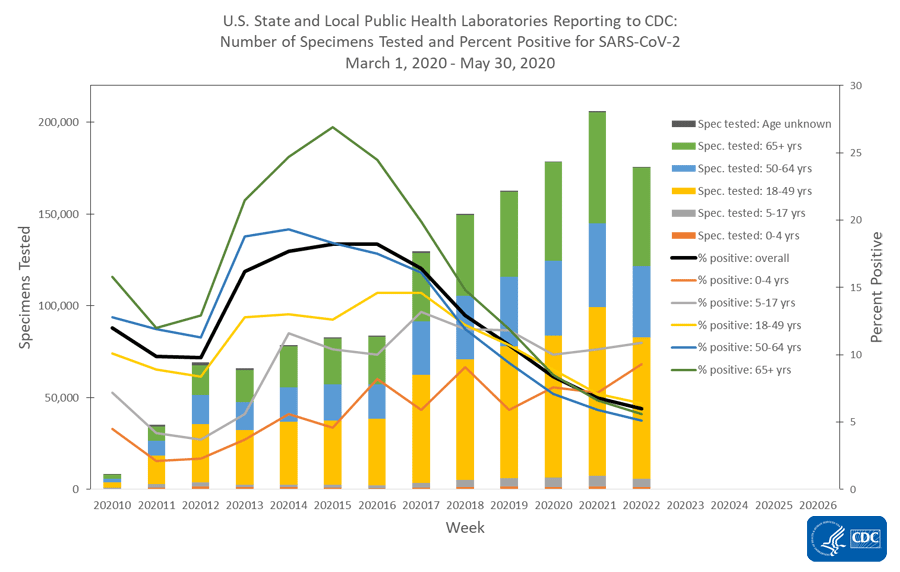
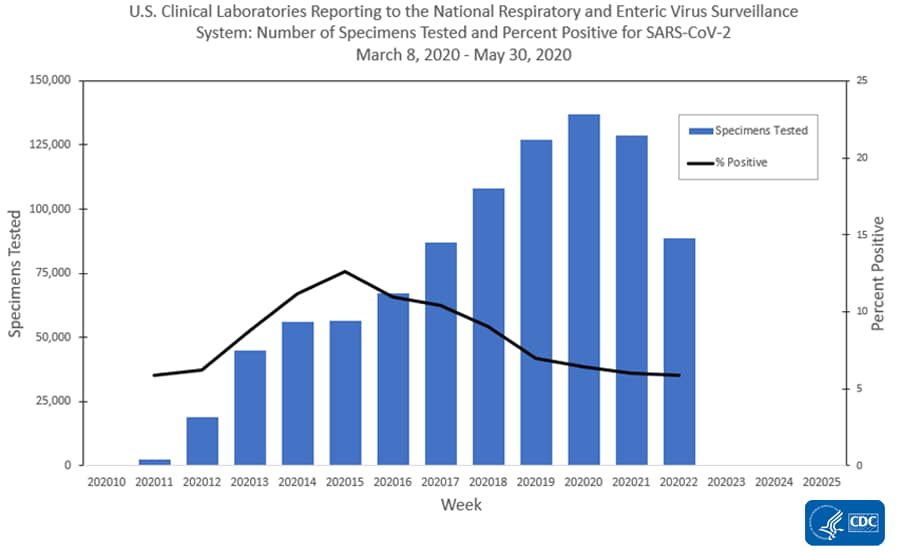
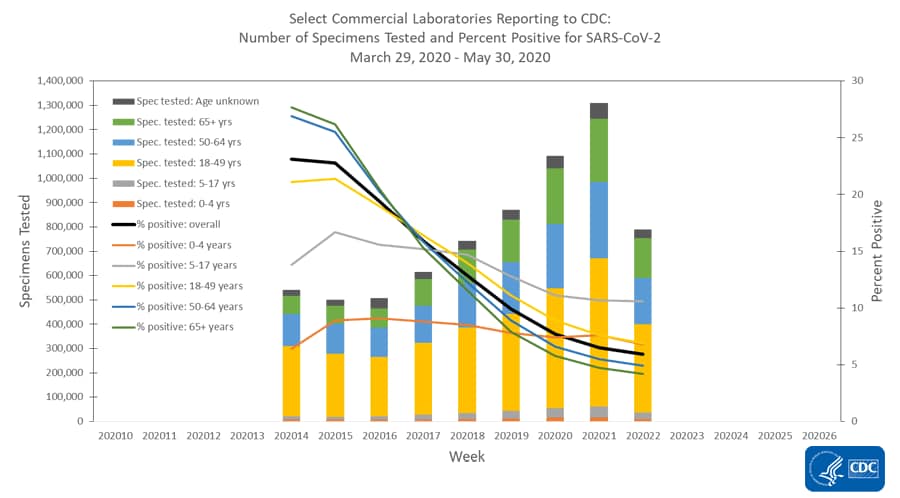
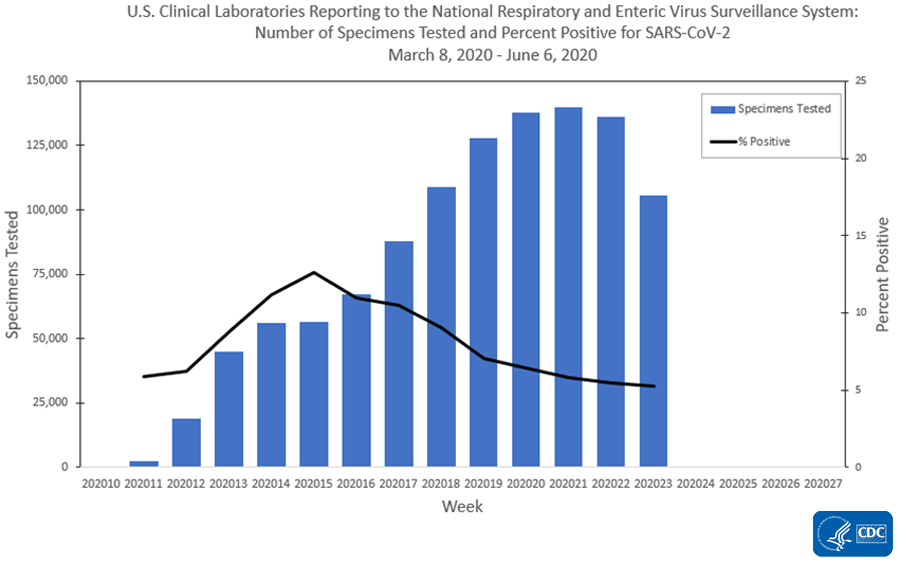
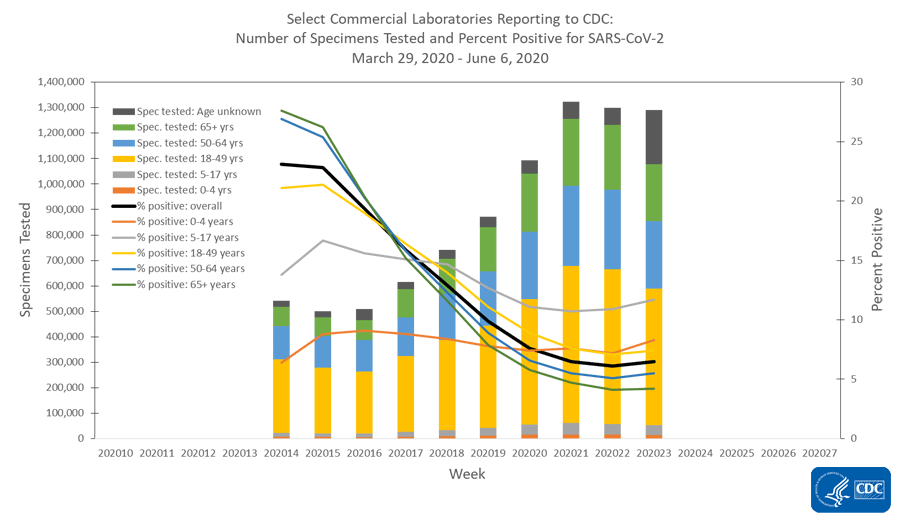
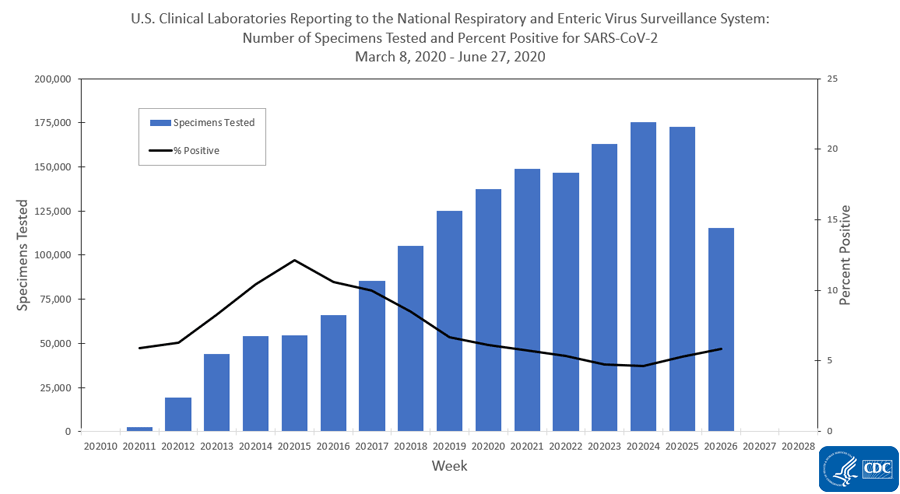
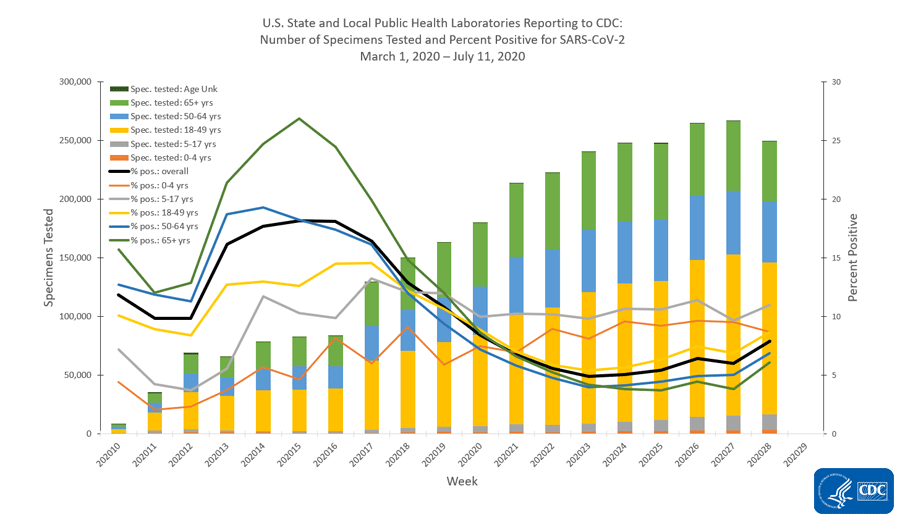
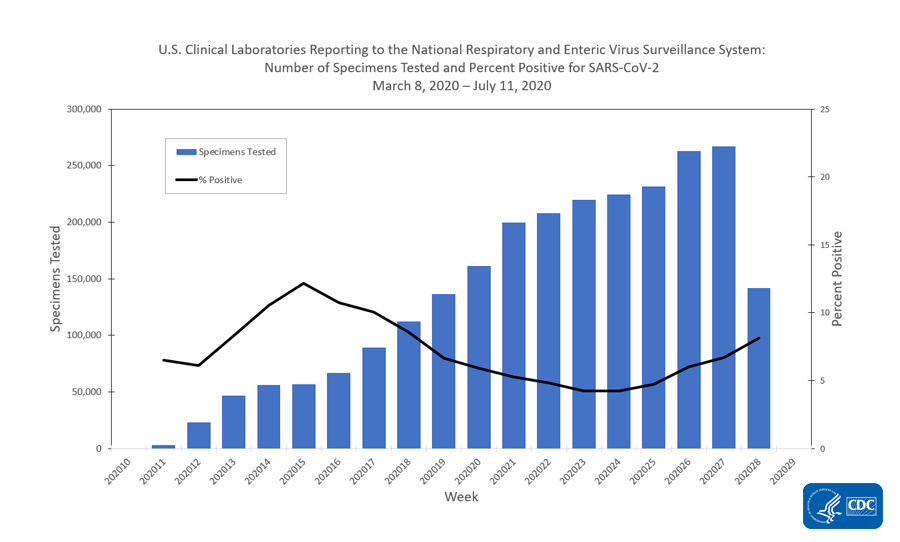
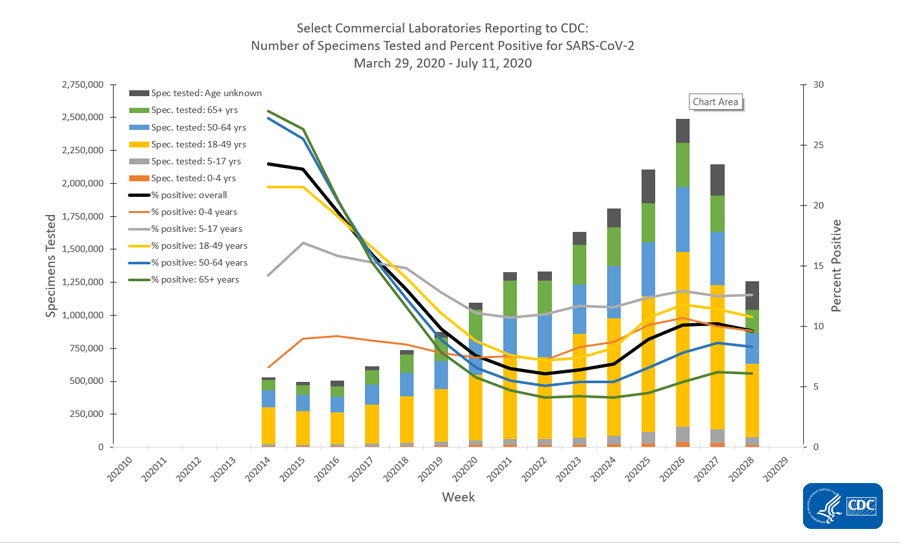
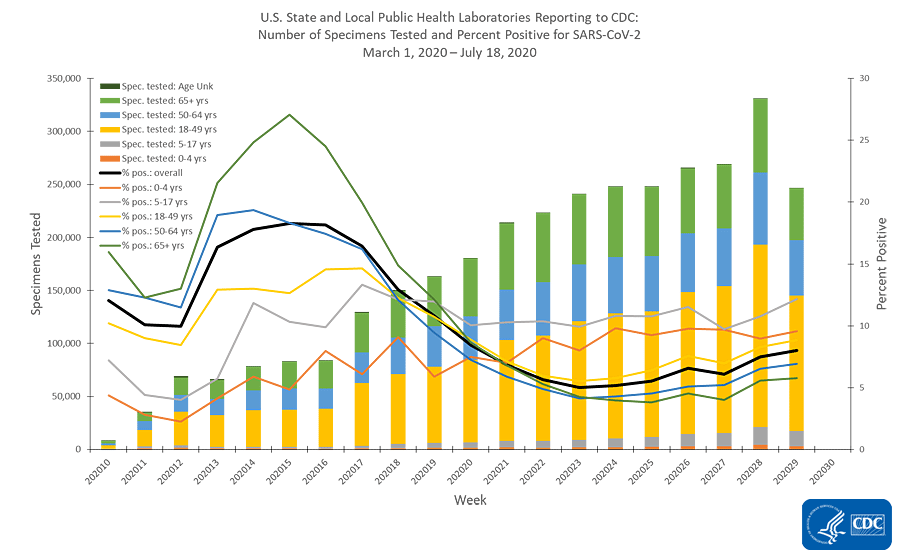
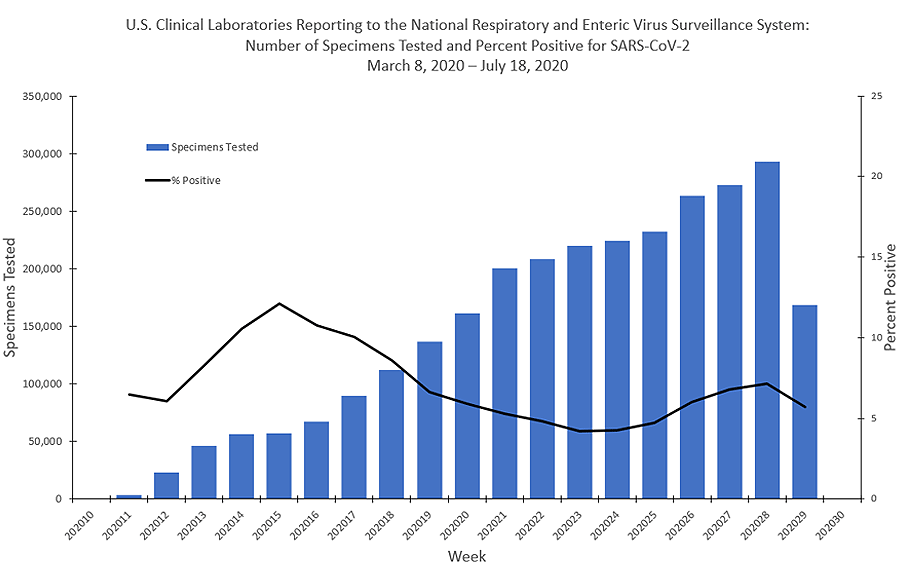
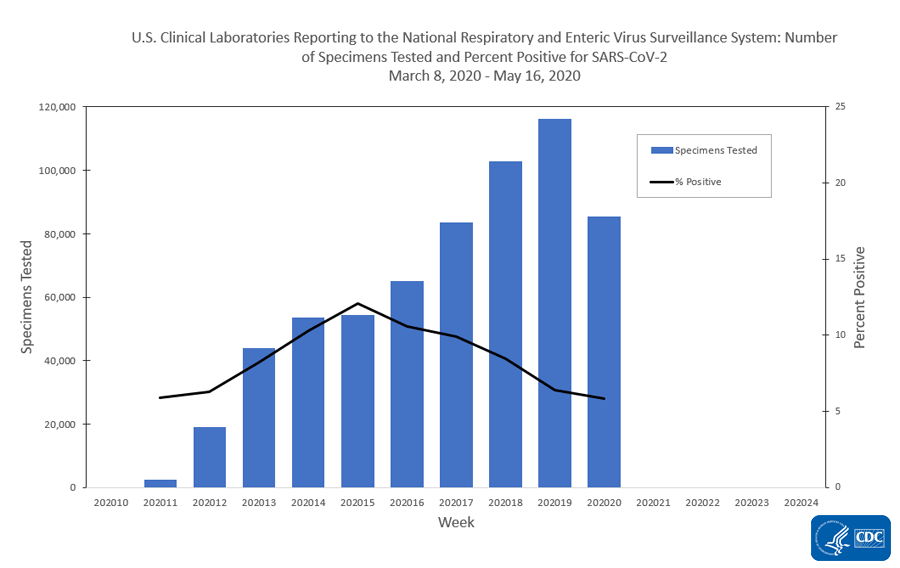
The number of specimens tested for SARS-CoV-2 and reported to CDC by public health laboratories and a subset of clinical and commercial laboratories in the United States are summarized below. At this point in the outbreak, all laboratories are performing primary diagnostic functions; therefore, the percentage of specimens testing positive across laboratory types can be used to monitor trends in COVID-19 activity. As the outbreak progresses, it is possible that different types of laboratories will take on different roles, and the data interpretation may need to be modified. The lower percentage of specimens testing positive in the clinical laboratories compared to the public health and commercial laboratories is likely due to the amount of COVID-19 activity in areas with reporting laboratories and a larger proportion of specimens from children.
65,917225,850
36,46895,137
1,241,214
12,177 (18.5%)32,437 (14.4%)
2,798 (7.7%)7,095 (7.5%)
218,454 (17.6%)
* Commercial and clinical laboratory data represents select laboratories and does not capture all tests performed in the United States.
Public Health Laboratories

public-health-lab.png
Data Table

Clinical Laboratories

clinical-labs.png
Data Table


Additional virologic surveillance information: Surveillance Methods

Outpatient/Emergency Department Illness

Two syndromic surveillance systems are being used to monitor trends in outpatient and emergency department visits that may be related to COVID-19. Each system monitors a slightly different syndrome, and together these systems provide a more comprehensive picture of mild to moderate COVID-19 illness than either would individually. Both systems are currently being affected by recent changes in health care seeking behavior, including increasing use of telemedicine and recommendations to limit emergency department (ED) visits to severe illness, as well as increased social distancing. These changes affect the numbers of people and their reasons for seeking care in the outpatient and ED settings.
ILINet


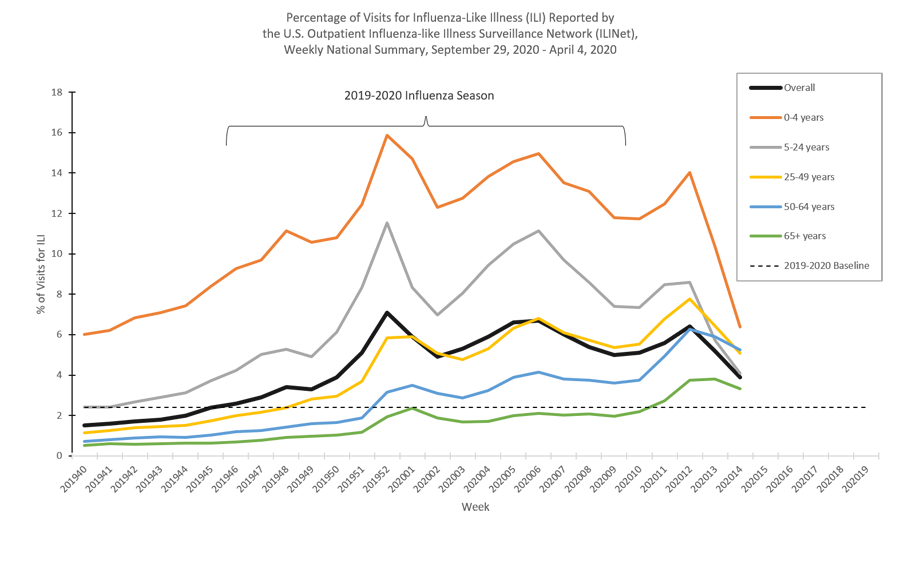
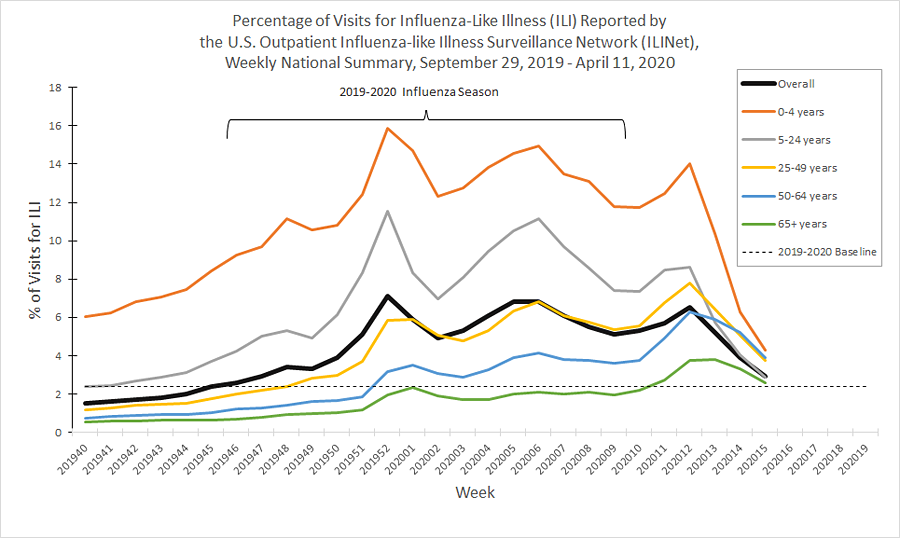
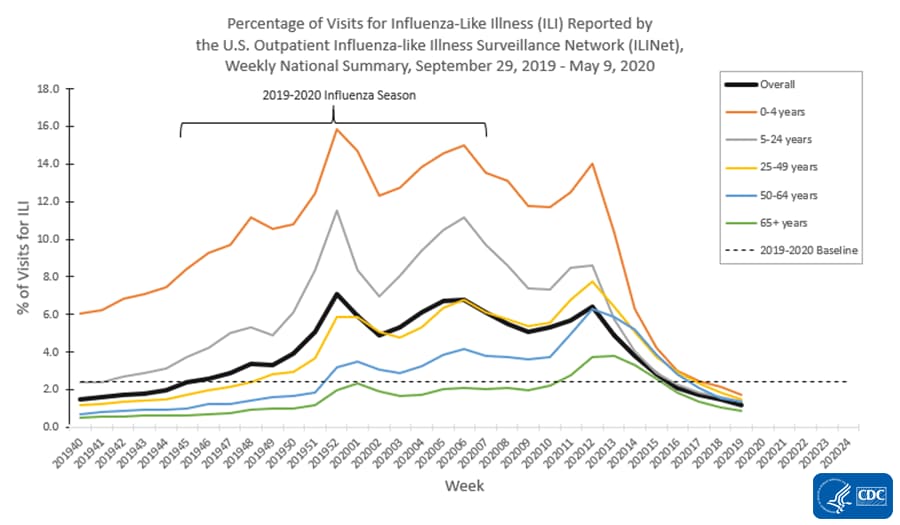
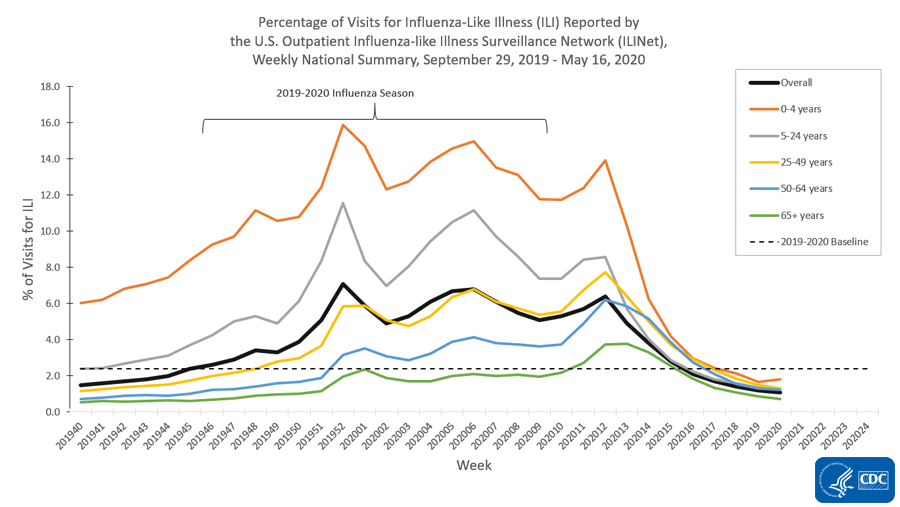
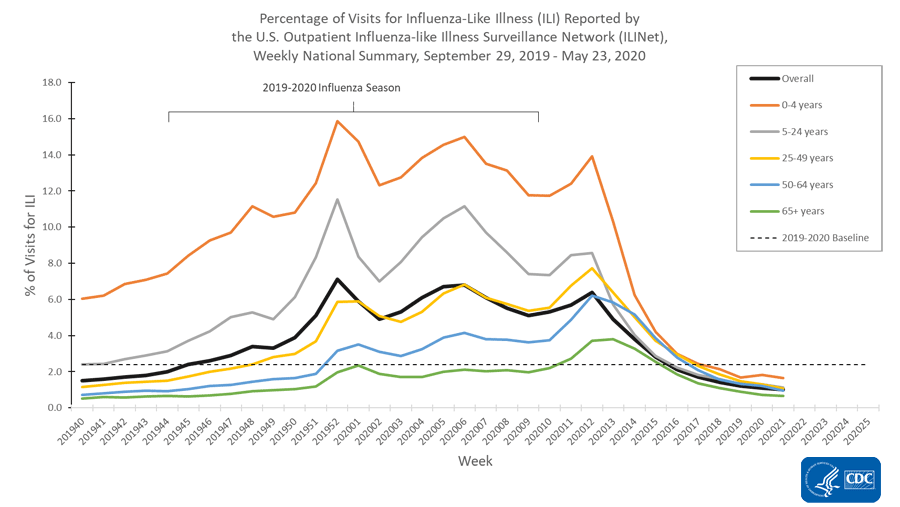
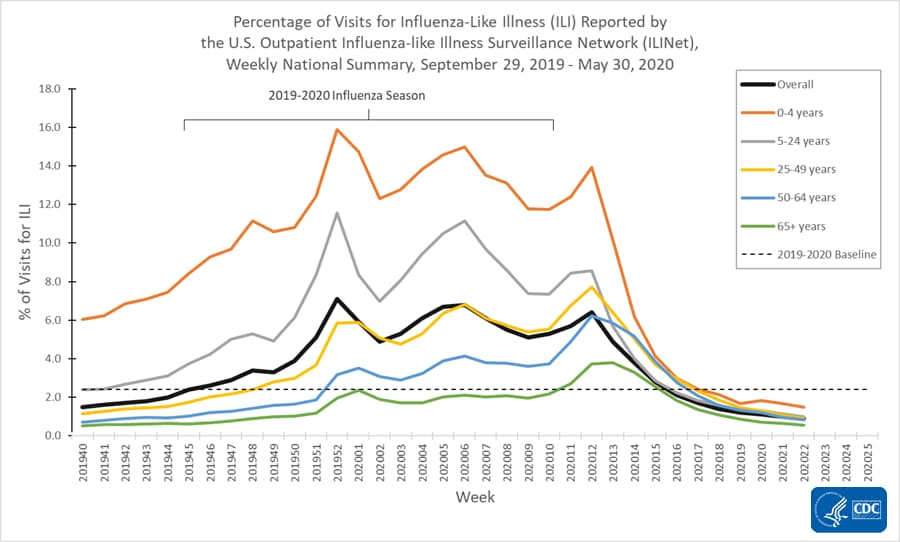
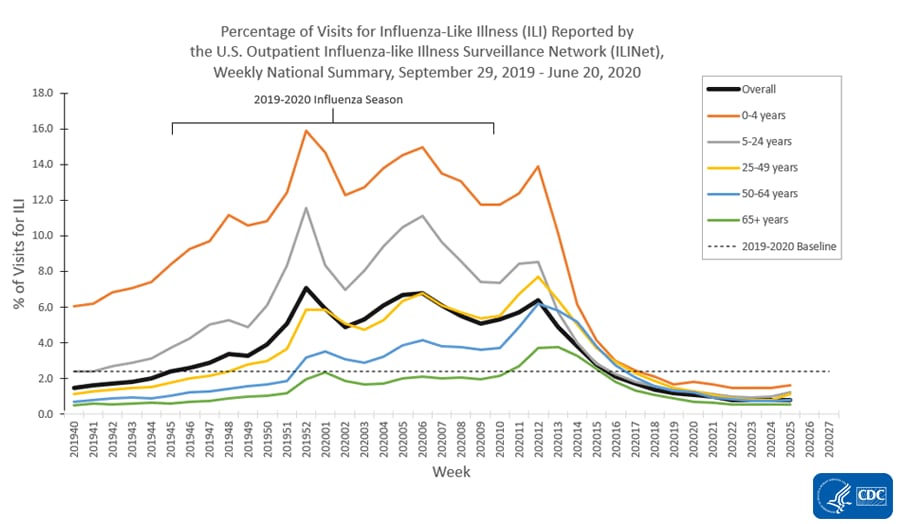
The U.S. Outpatient Influenza-like Illness Surveillance Network (ILINet) provides data on visits for influenza-like illness (ILI) (fever [≥100[SUP]○[/SUP]F] and cough and/or sore throat) to approximately 2,600 primary care providers, emergency departments and urgent care centers in all 50 states, Puerto Rico, the District of Columbia and the U.S. Virgin Islands. Mild COVID-19 illness presents with symptoms similar to ILI, so ILINet is being used to track trends of mild COVID-19 illness and allows for comparison with prior influenza seasons.

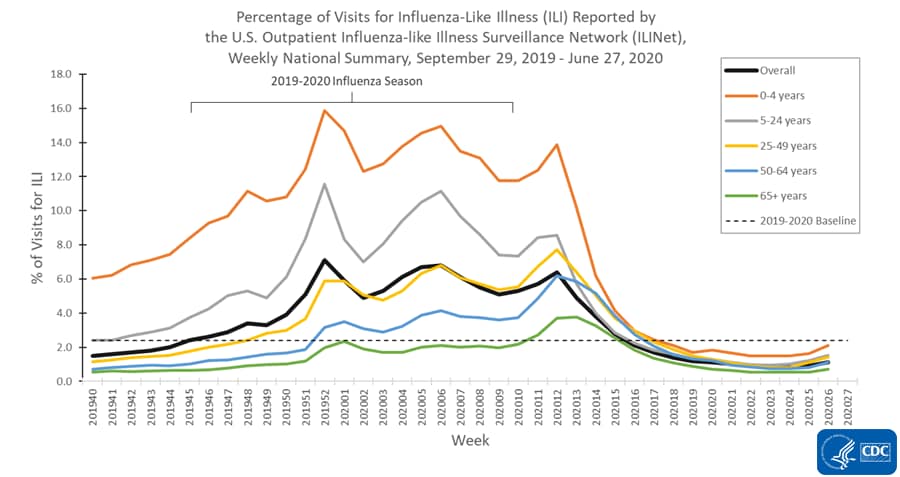
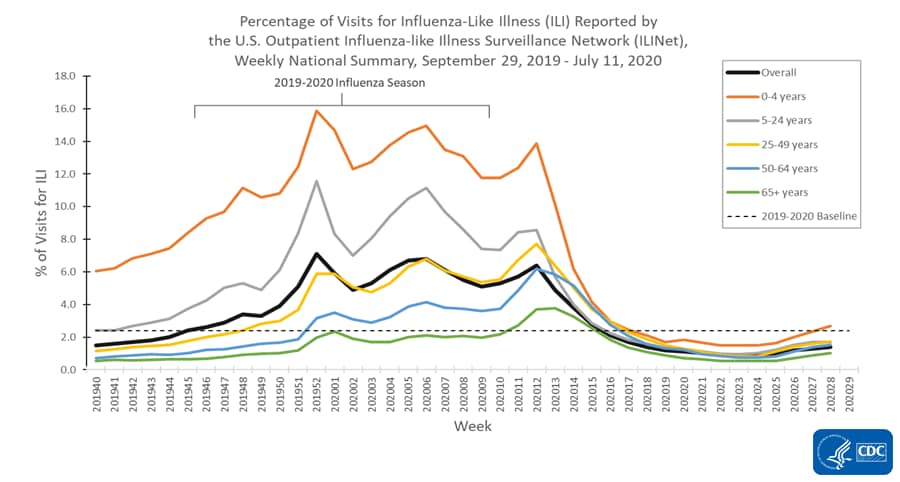
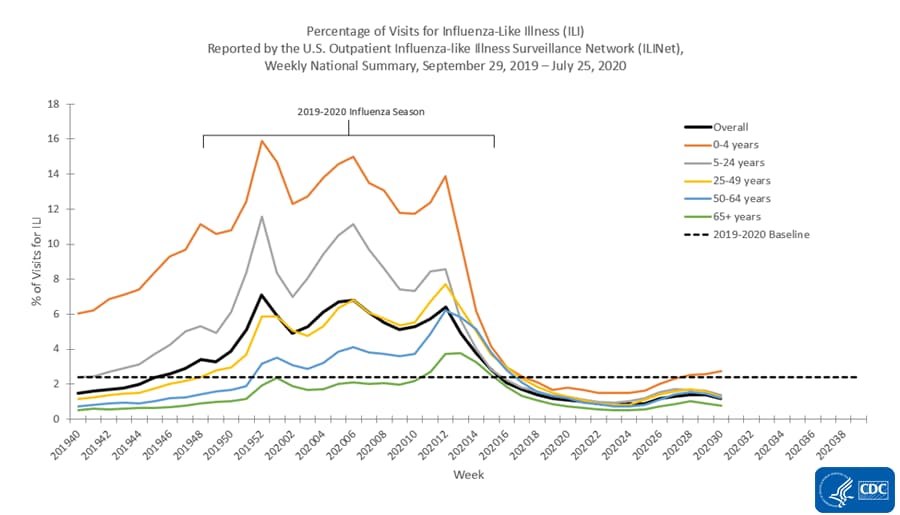
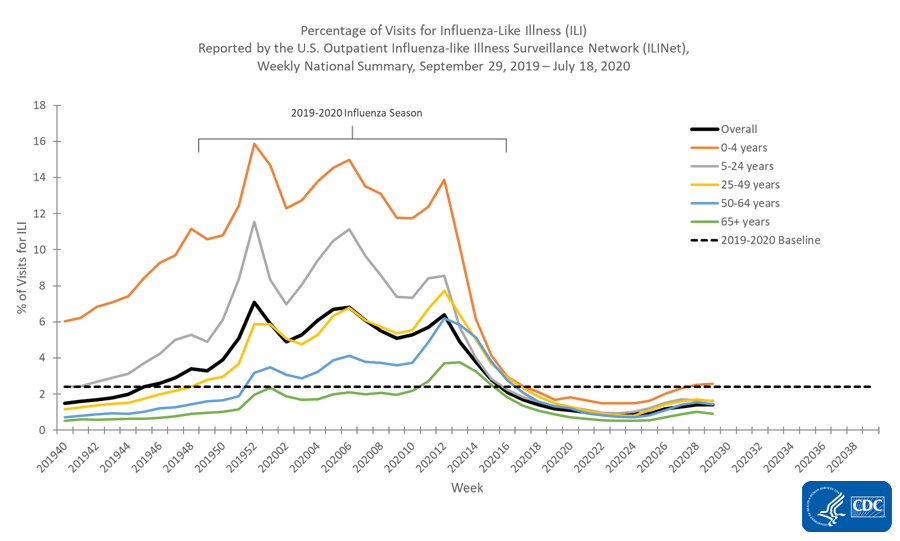
Nationwide during week 14, 3.9% of patient visits reported through ILINet were due to ILI. This percentage is above the national baseline of 2.4%, but represents the second week of a decline after three weeks of increase beginning in early March. The percentage of visits for ILI decreased in all age groups. Nationally, laboratory confirmed influenza activity as reported by clinical laboratories decreased to levels usually seen in summer months which, along with changes in healthcare seeking behavior and the impact of social distancing, is likely driving the decrease in ILI activity.
percent-ili-visits.png
Overall Percentage of Visits for ILI | Age Group ILI Data


* Age-group specific percentages should not be compared to the national baseline.

On a regional levelexternal icon, the percentage of outpatient visits for ILI ranged from 2.4% to 10.0% during week 14; all regions reported a decreased percentage of outpatient visits for ILI compared to week 13 but remained above their regions-specific baselines.
ILI Activity Levels


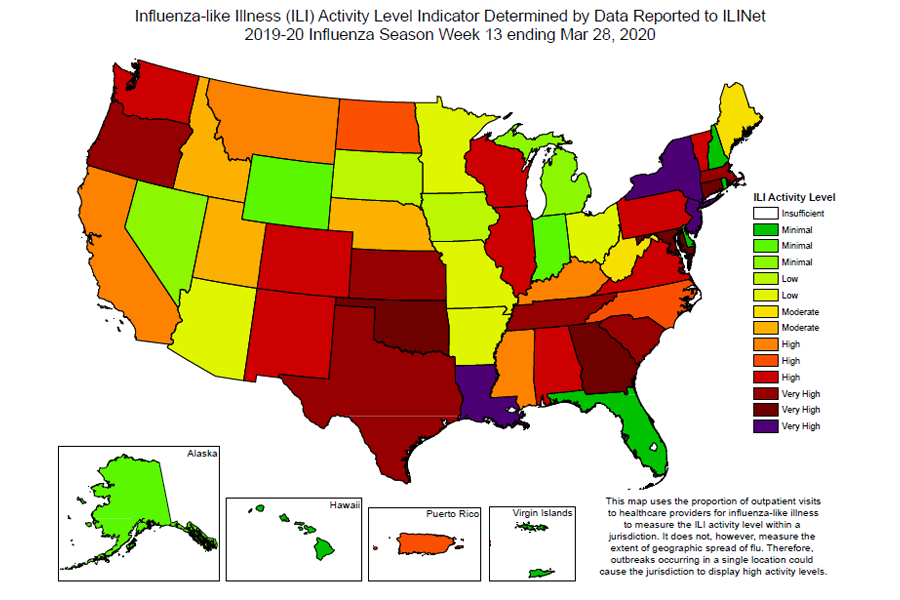
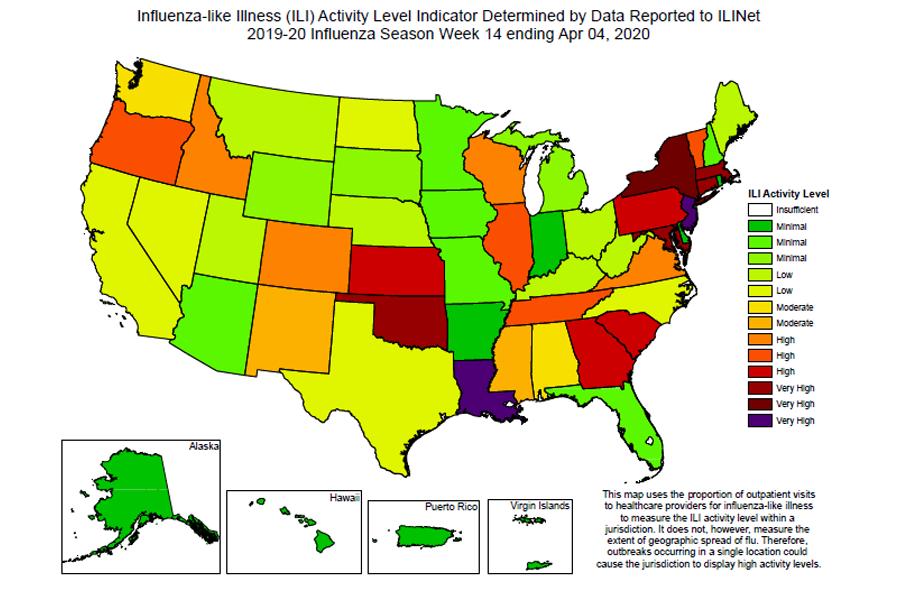
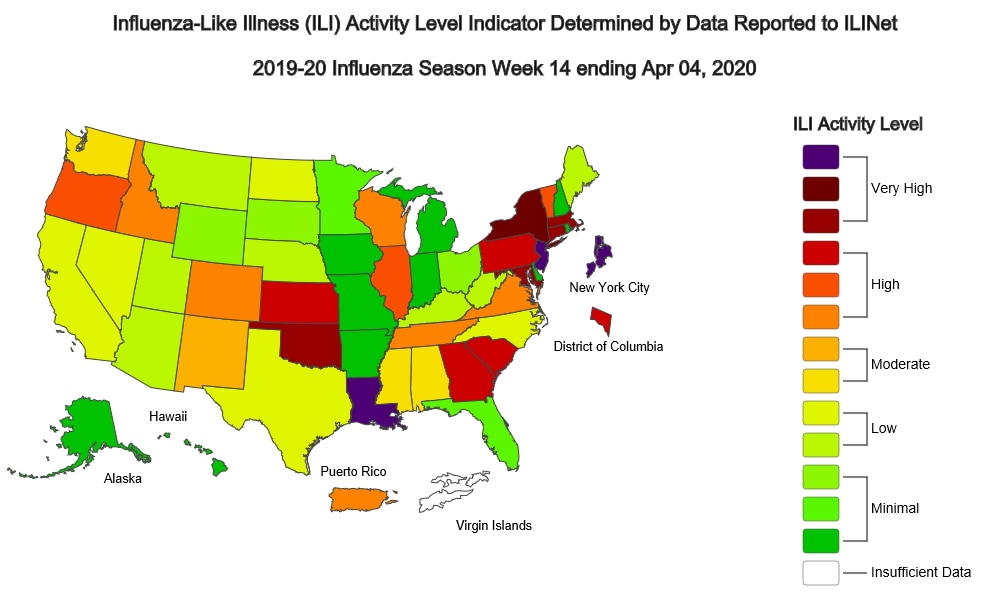
Data collected in ILINet are used to produce a measure of ILI activity for all 50 states, Puerto Rico, the District of Columbia and New York City. The mean reported percentage of visits due to ILI for the current week is compared to the mean reported during non-influenza weeks, and the activity levels correspond to the number of standard deviations below, at or above the mean.

The number of jurisdictions at each activity level during week 14 and the change compared to the previous week are summarized in the table below and shown in the following maps. The decreasing percentage of visits for ILI described above are reflected in this week’s ILI activity levels. [TABLE="cellpadding: 5"]
[TR]
[TD]Activity Level[/TD]
[TD="colspan: 2"]Number of Jurisdictions[/TD]
[/TR]
[TR]
[TD]Week 14 (Week ending April 4, 2020)[/TD]
[TD]Compared to Previous Week[/TD]
[/TR]
[TR]
[TD]Very High[/TD]
[TD]8[/TD]
[TD]-6[/TD]
[/TR]
[TR]
[TD]High[/TD]
[TD]13[/TD]
[TD]-4[/TD]
[/TR]
[TR]
[TD]Moderate[/TD]
[TD]4[/TD]
[TD]-1[/TD]
[/TR]
[TR]
[TD]Low[/TD]
[TD]12[/TD]
[TD]+5[/TD]
[/TR]
[TR]
[TD]Minimal[/TD]
[TD]16[/TD]
[TD]+6[/TD]
[/TR]
[TR]
[TD]Insufficient Data*[/TD]
[TD]1[/TD]
[TD]No change[/TD]
[/TR]
[/TABLE]
ili-map-1.png

ili-map-2.png


The “very high” activity level was recently developed and will be reflected in other postings of the ILINet activity map when the map is updated on April 17, 2020.
National Syndromic Surveillance Program (NSSP): Emergency Department (ED) Visits


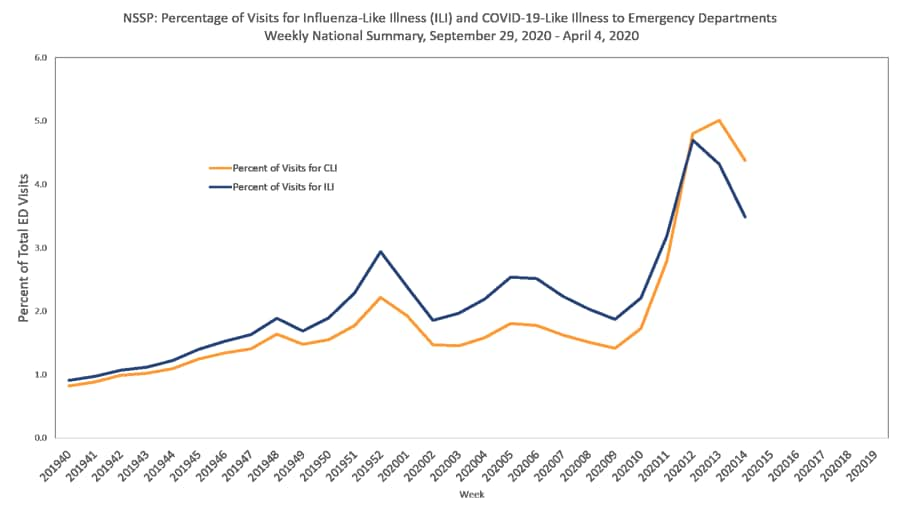
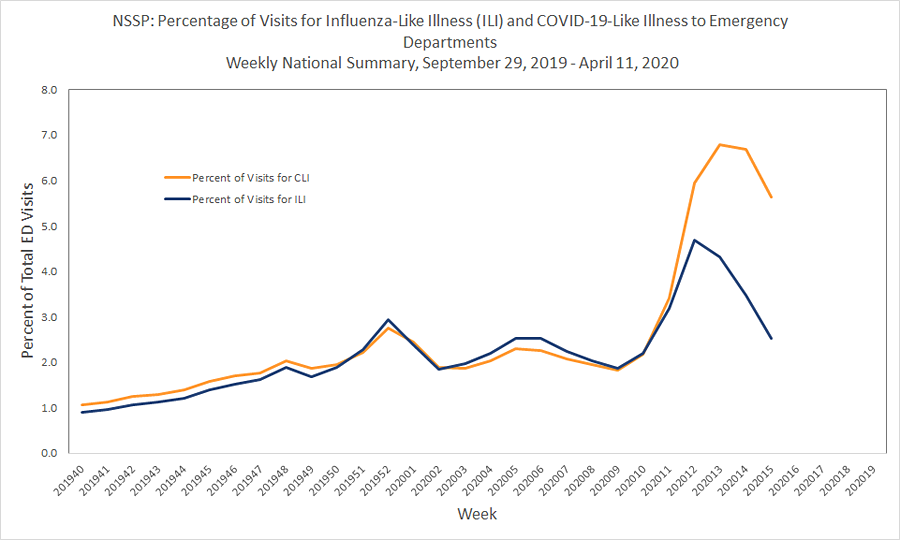
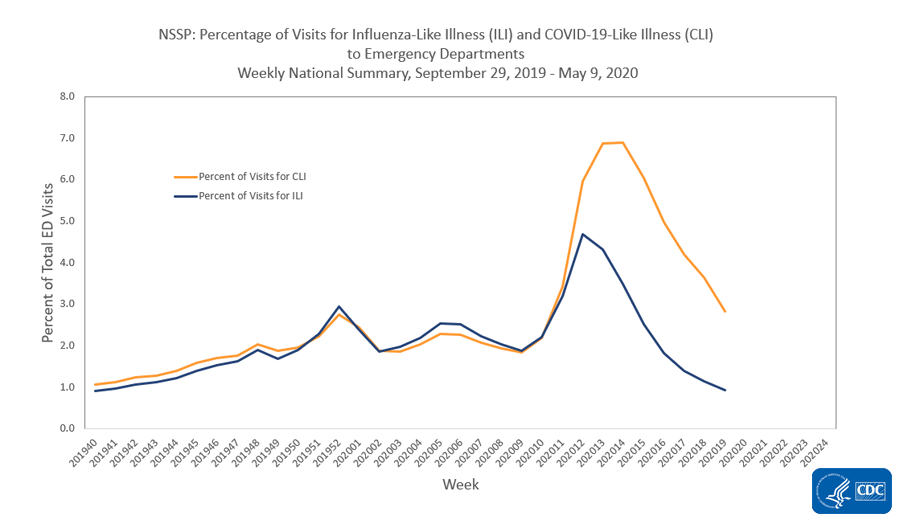
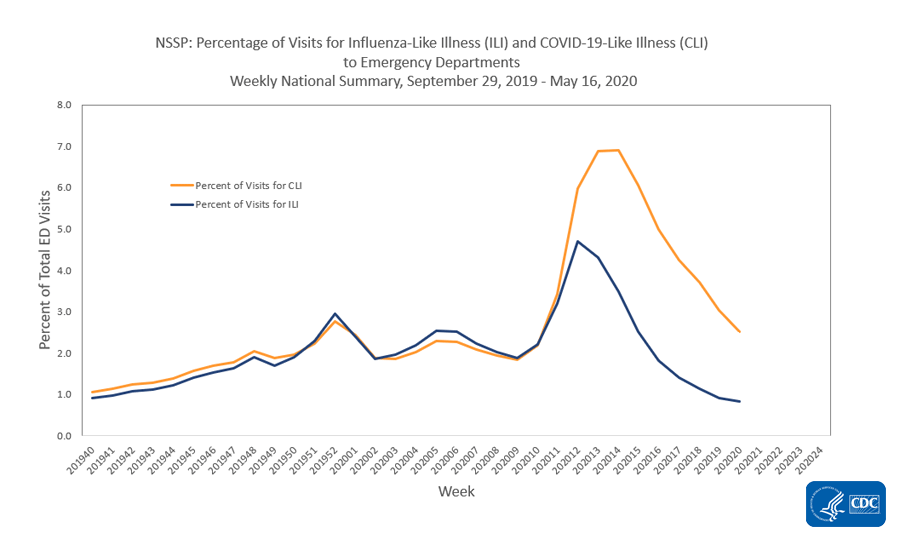
NSSP is a collaboration among CDC, federal partners, local and state health departments, and academic and private sector partners to collect, analyze and share electronic patient encounter data received from multiple health care settings. To track trends of potential COVID-19 visits, visits for COVID-19-like illness (CLI) (fever and cough or shortness of breath or difficulty breathing) and ILI to a subset of emergency departments in 47 states are being monitored.

Nationwide during week 14, 4.4% of emergency department visits captured in NSSP were due to CLI and 3.5% were due to ILI. This is the second week of decline in percentage of visits for ILI and the first week of decline in percentage of visits for CLI. All 10 HHS regionsexternal icon experienced a decline in percentage of visits for ILI and CLI.
Data Table


Additional information about medically attended outpatient and emergency department visits for ILI and CLI: Surveillance Methods

Hospitalizations

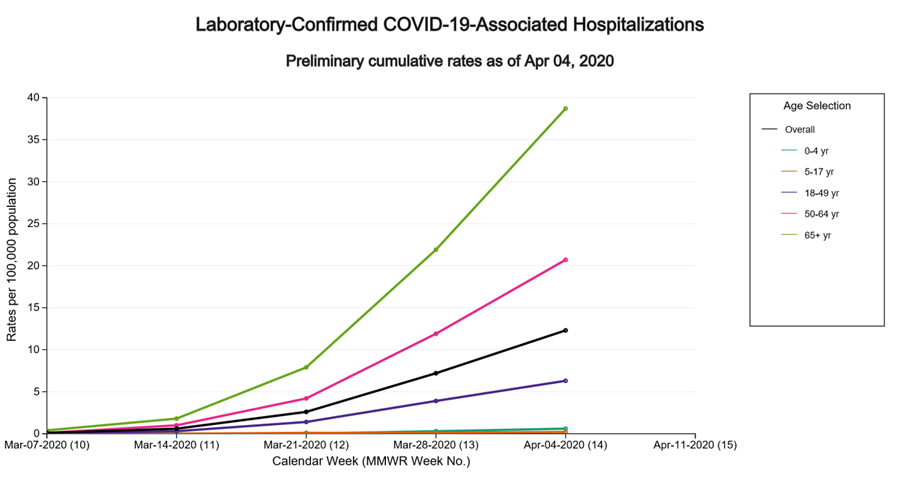
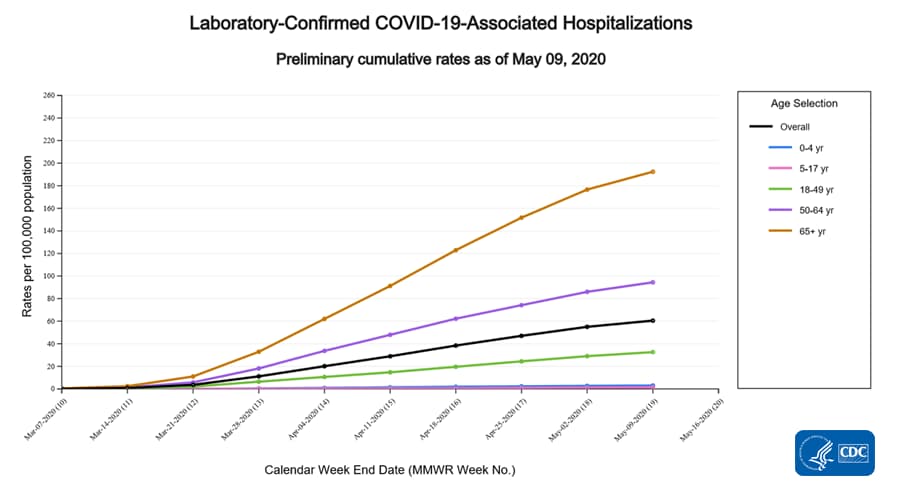
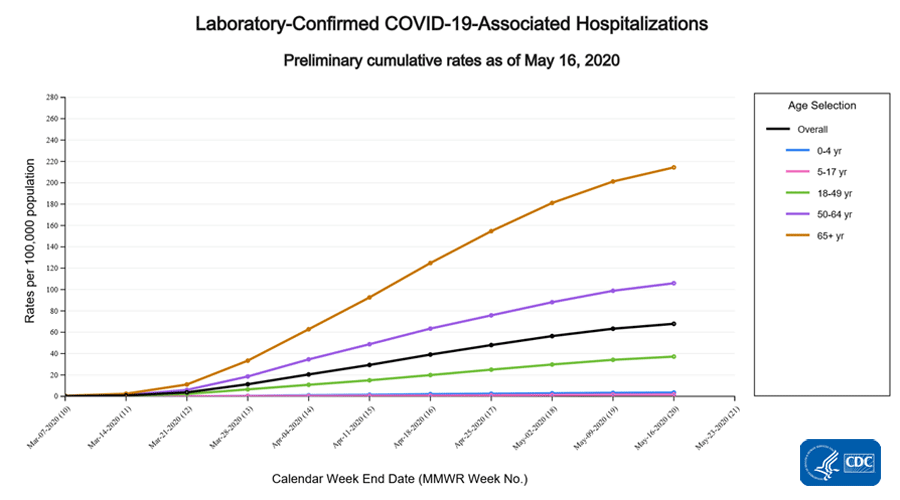
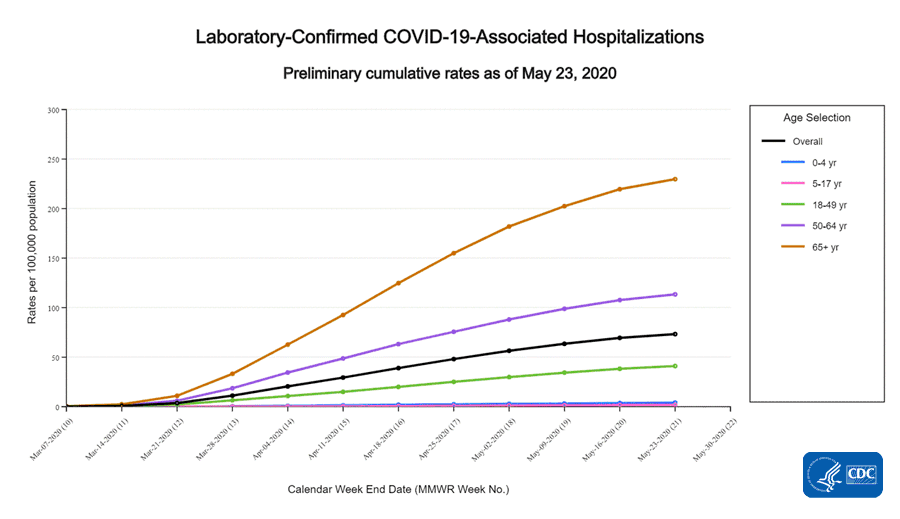
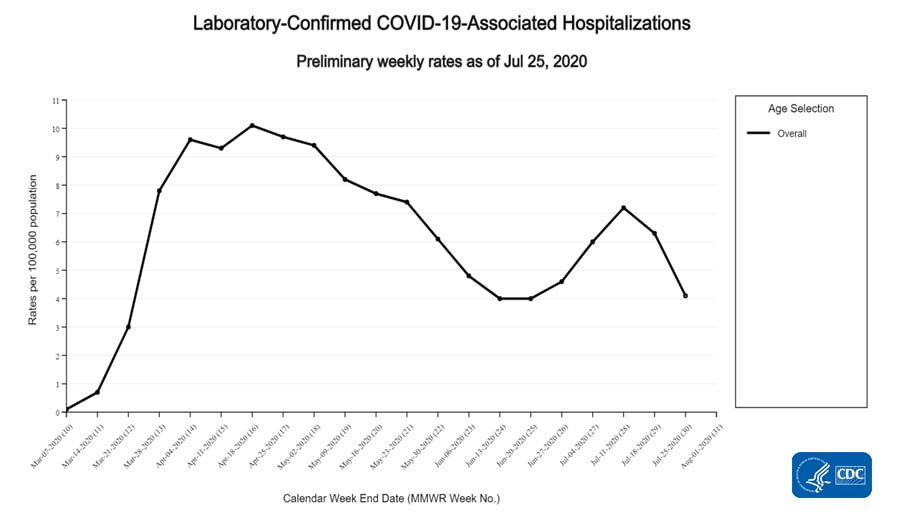
The COVID-19-Associated Hospitalization Surveillance Network (COVID-NET) conducts population-based surveillance for laboratory-confirmed COVID-19-associated hospitalizations in select counties participating in the Emerging Infections Program (EIP) and Influenza Hospitalization Surveillance Project (IHSP) states. COVID-NET-estimated hospitalization rates will be updated weekly.

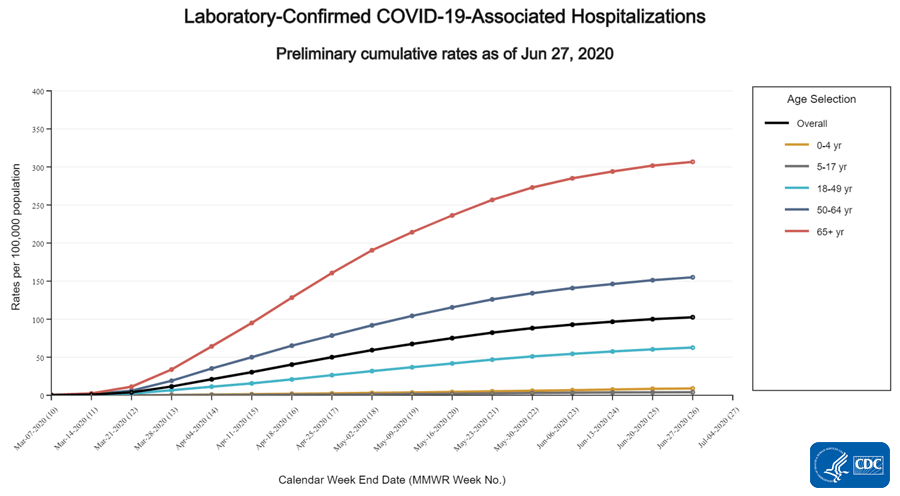
A total of 4,001 laboratory-confirmed COVID-19-associated hospitalizations were reported by COVID-NET sites between March 1, 2020, and April 4, 2020. The overall cumulative hospitalization rate was 12.3 per 100,000 population, with the highest rates in those aged 65 years and older (38.7 per 100,000) followed by adults aged 50-64 years (20.7 per 100,000).
lab-confirmed-hospitalizations.png


Additional hospitalization surveillance information: Surveillance Methods | COVID-Net interactive data

Mortality Surveillance

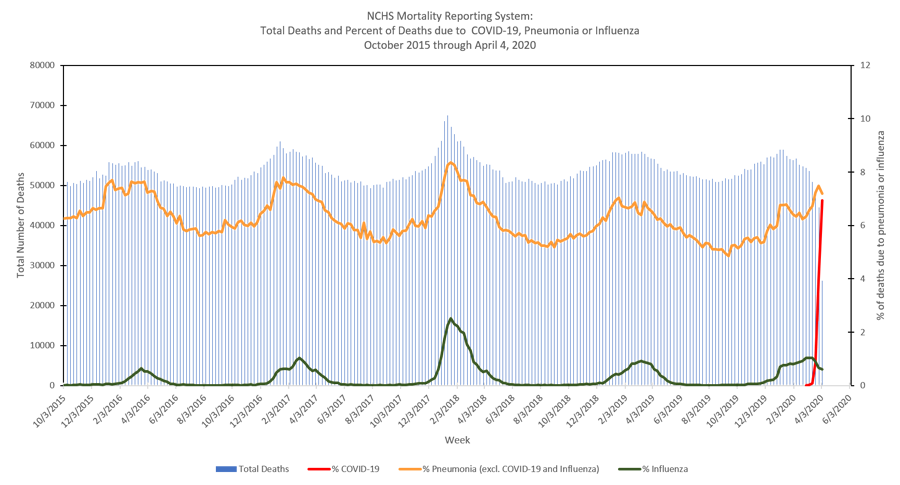
The National Center for Health Statistics (NCHS) collects death certificate data from vital statistics offices for all deaths occurring in the United States. Based on death certificate data available on April 9, 2020, 6.9% of all deaths occurring during the week ending April 4, 2020 (week 14) had COVID-19 listed as a cause of death, 7.2% had pneumonia (excluding deaths involving COVID-19 or influenza) listed as a cause of death, and 0.6% had influenza listed as a cause of death. The weekly percentage of deaths due to COVID-19 has increased each week since the start of the COVID-19 outbreak in the United States. The percentage of deaths due to pneumonia (excluding deaths involving COVID-19 or influenza) decreased during week 14 compared to week 13.
nchs-mortality-report.png
Data Table


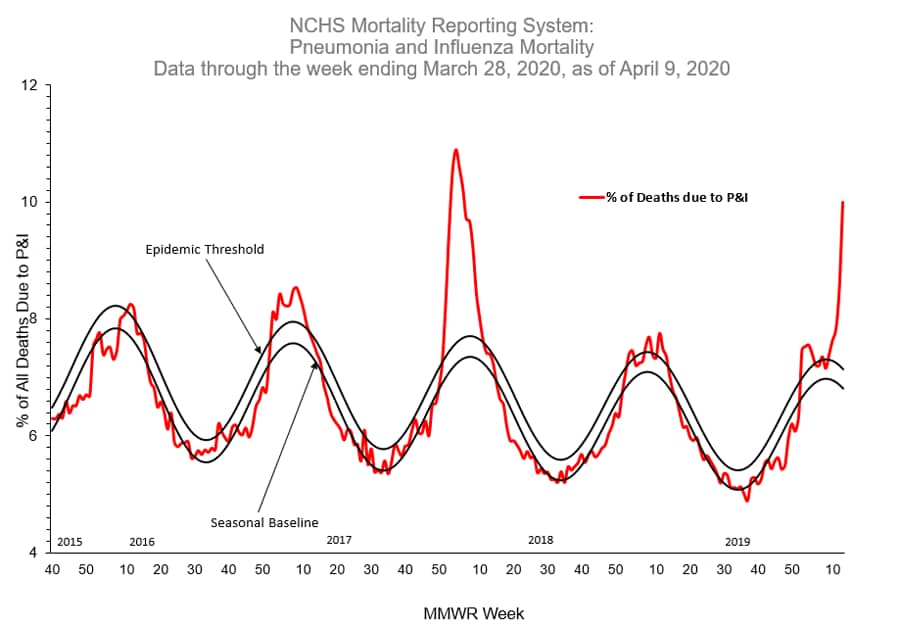
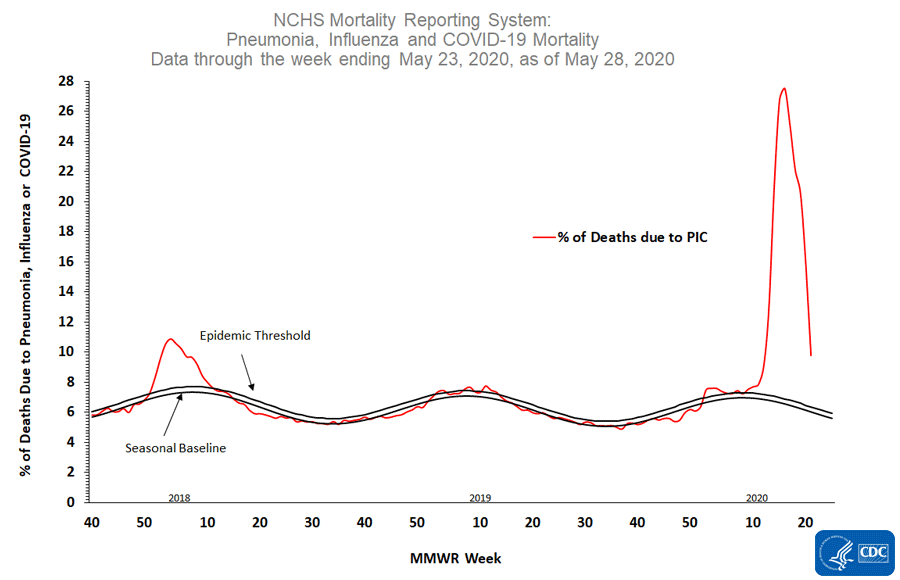
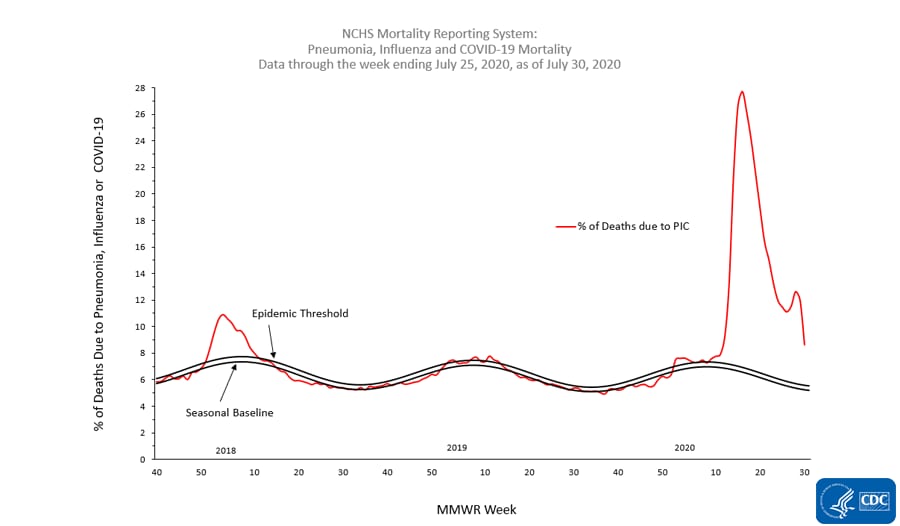
NCHS data are also used to monitor the percentage of death occurring in a given week that had pneumonia and/or influenza (P&I) listed as a cause of death. When the percentage of P&I deaths exceeds the epidemic threshold, that indicates that significantly more P&I deaths occurred than would be expected at that time of year. During the most recent week for which these data are available (week ending March 28, 2020), 10.0% of deaths were due to P&I. This percentage is above the epidemic threshold of 7.1% for that week. The increase in P&I percentage is being driven primarily by an increase in non-influenza pneumonia deaths due to COVID-19.
pneumonia-influenza.png


Additional NCHS mortality surveillance information: Surveillance Methods | Provisional Death Counts for COVID-19

View Page In:pdf icon 10 Pages, 2 MB
Page last reviewed: April 10, 2020
Content source: National Center for Immunization and Respiratory Diseases (NCIRD), Division of Viral DiseaseshomeCoronavirus Disease 2019 (COVID-19)
email_03Get Email Updates

To receive email updates about COVID-19, enter your email address:
Email Address
What's this?
Submit
https://www.cdc.gov/coronavirus/2019...iew/index.html
 
COVIDView.jpg
COVIDView Weekly Summary


Print Page
Updated April 17, 2020

Download Weekly Summary pdf icon[10 Pages, 2 MB]

Key Updates for Week 15, ending April 11, 2020

This CDC report provides a weekly summary and interpretation of key indicators that have been adapted to track the COVID-19 pandemic in the United States. While influenza-like illness (ILI) declined, it is still elevated and laboratory confirmed COVID-19 activity continues to increase as do COVID-19 severity indicators (hospitalizations and deaths).

Virus
Public Health, Commercial and Clinical Laboratories
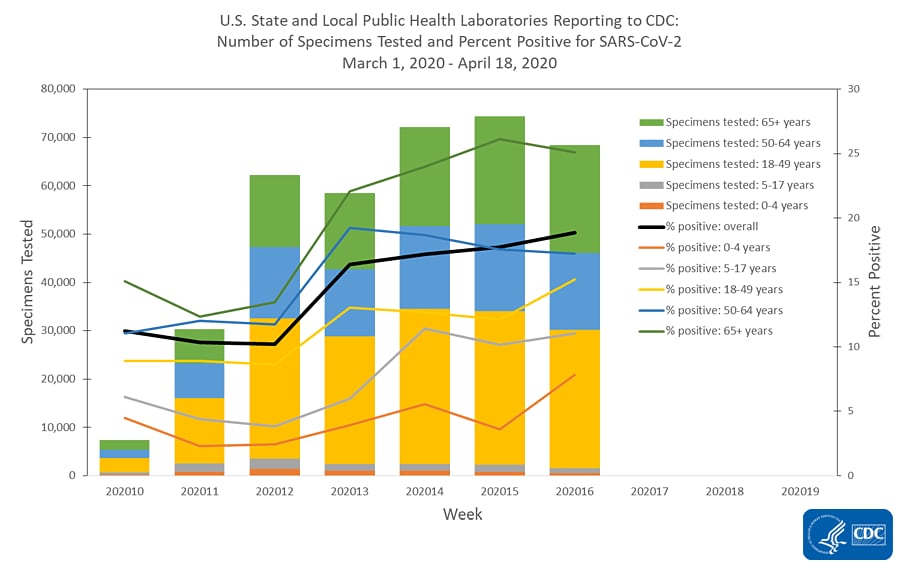
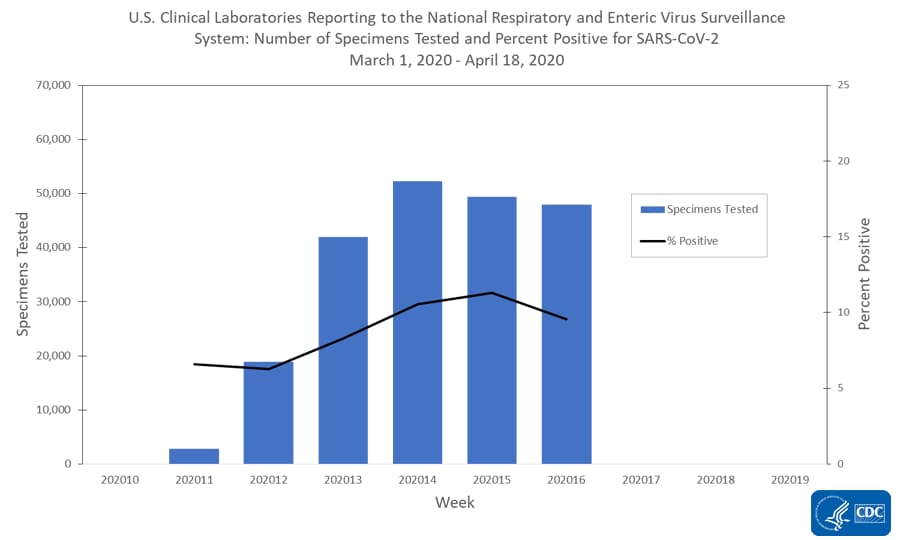
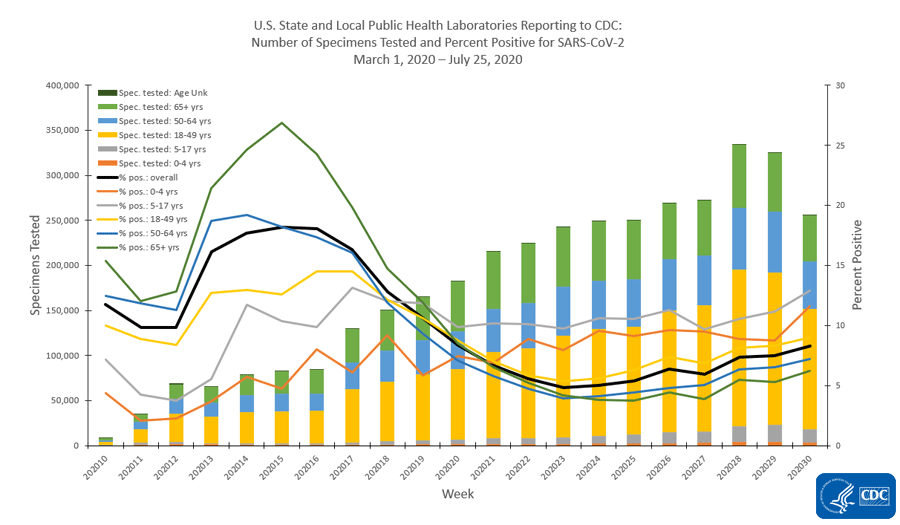
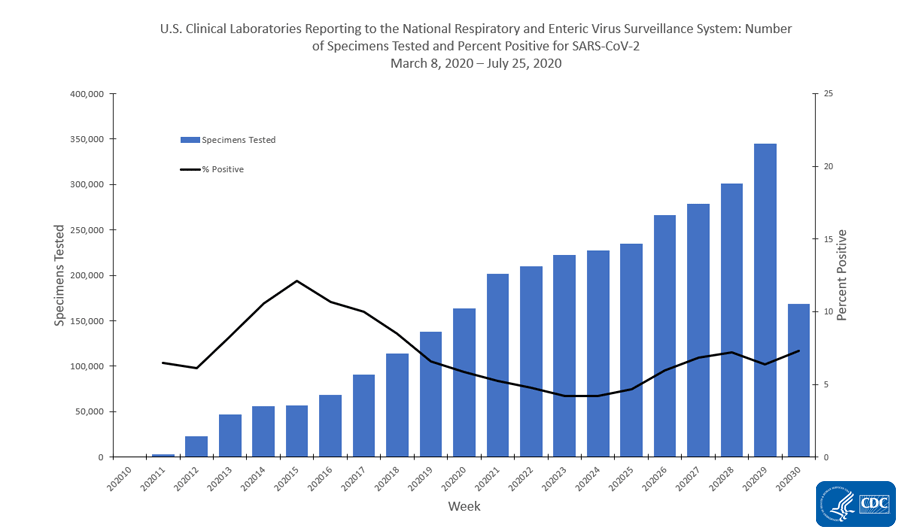
Public health, commercial and clinical laboratories are all testing for SARS-CoV-2, the virus that causes COVID-19, and reporting their results. The national percentage of respiratory specimens testing positive for SARS-CoV-2 increased from week 14 to week 15 and is as follows:
  • Public health laboratories – increased from 17.3% during week 14 to 17.8% during week 15;
  • Clinical laboratories – increased from 10.6% during week 14 to 11.5% during week 15;
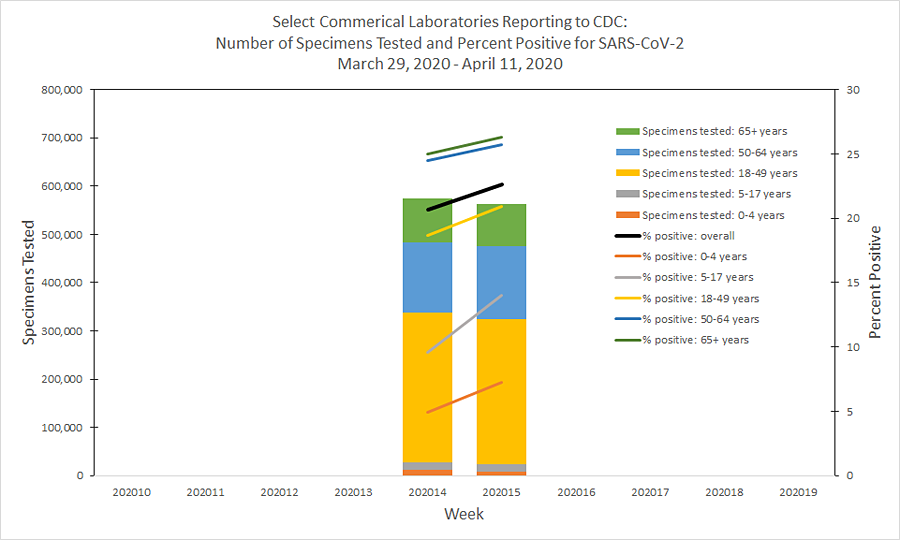
  • Commercial laboratories – increased from 20.6% during week 14 to 22.6% during week 15.
Outpatient and Emergency Department Visits
Outpatient Influenza-Like Illness Network (ILINet) and National Syndromic Surveillance Program (NSSP)
Two indicators from existing surveillance systems are being monitored to track outpatient or emergency department (ED) visits for potential COVID-19 illness.
  • Nationally, the percentages of visits for influenza-like illness (ILI) and COVID-19-like illness (CLI) are elevated but decreased compared to last week.
Recent changes in health care seeking behavior are likely impacting data from both networks, making it difficult to draw further conclusions at this time. Tracking these systems moving forward will give additional insight into illness related to COVID-19.

Severe Disease
Hospitalizations
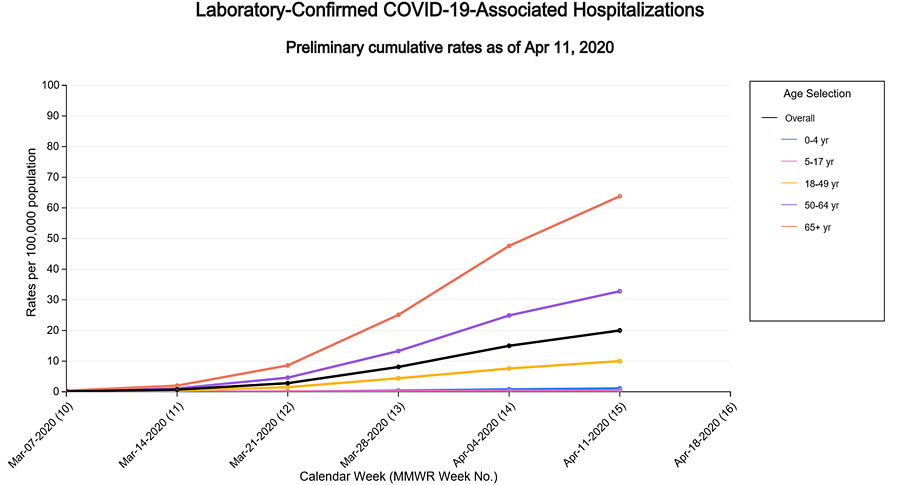
Cumulative COVID-19-associated hospitalization rates since March 1, 2020, are updated weekly. The overall cumulative hospitalization rate is 20.0 per 100,000, with the highest rates in persons 65 years and older (63.8 per 100,000) and 50-64 years (32.8 per 100,000).

Mortality
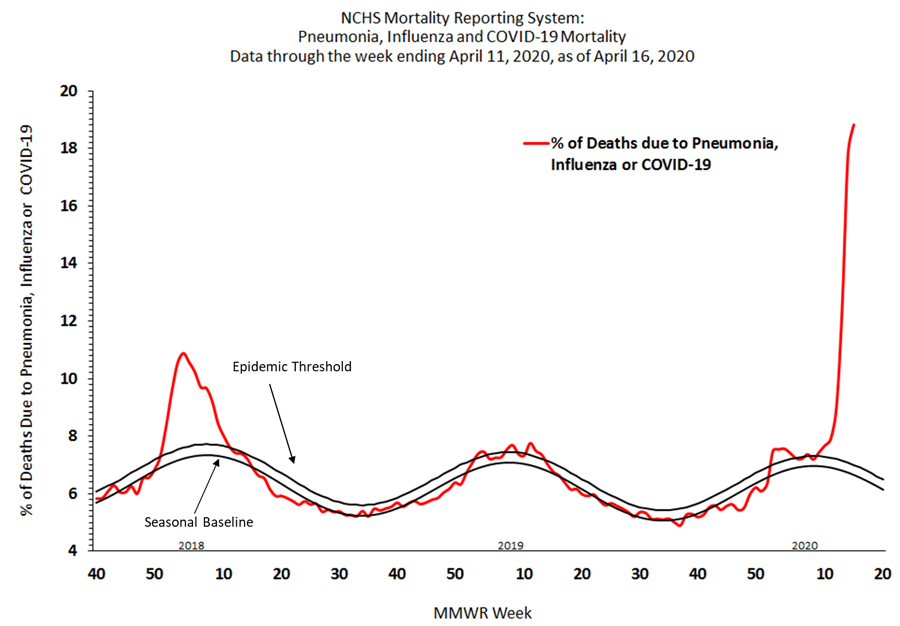
Based on death certificate data, the percentage of deaths attributed to COVID-19, pneumonia or influenza increased from 17.8% during week 14 to 18.8% during week 15.

All data are preliminary and may change as more reports are received.

A description of the surveillance systems summarized in COVIDView, including methodology and detailed descriptions of each data component, is available on the surveillance methods page.

Key Points
  • CDC has modified existing surveillance systems, many used to track influenza and other respiratory viruses annually, to track COVID-19.
  • Nationally, the percentage of laboratory specimens testing positive for SARS-CoV-2 continued to increase.
  • Visits to outpatient providers and emergency departments (EDs) for illnesses with symptoms consistent with COVID-19 are elevated compared to what is normally seen at this time of year but decreased compared to levels reported last week. At this time, there is little influenza virus circulation. The levels of people presenting for care with these symptoms is likely due to COVID-19 but may be tempered by a number of factors including less ILI overall because of widespread adoption of social distancing efforts and changes in healthcare seeking behavior.
  • The overall cumulative COVID-19 associated hospitalization rate is 20.0 per 100,000, with the highest rates in persons 65 years and older (63.8 per 100,000) and 50-64 years (32.8 per 100,000). Hospitalization rates for COVID-19 in older people are higher than what is typically seen early in a flu season.
  • Based on death certificate data, the percentage of deaths attributed to COVID-19, pneumonia or influenza increased from 17.8% during week 14 to 18.8% during week 15.

U.S. Virologic Surveillance

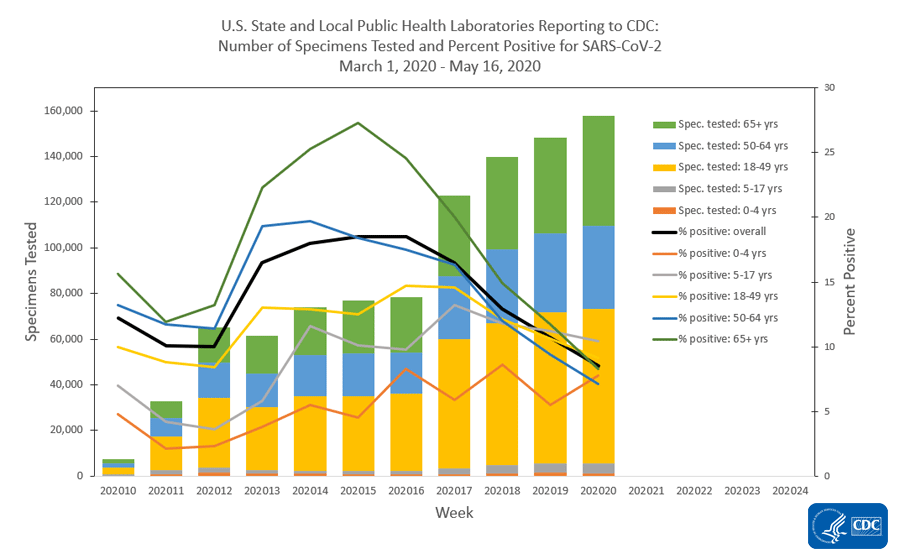
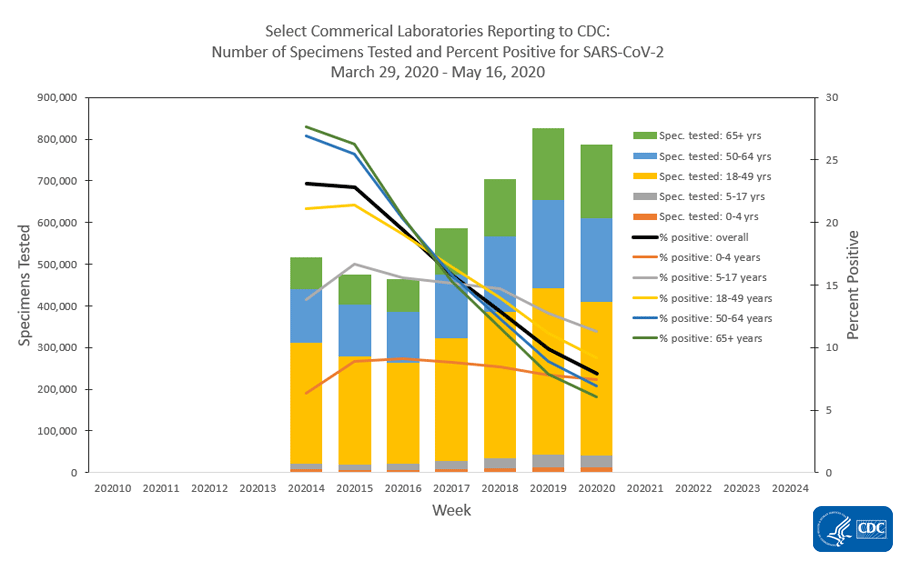
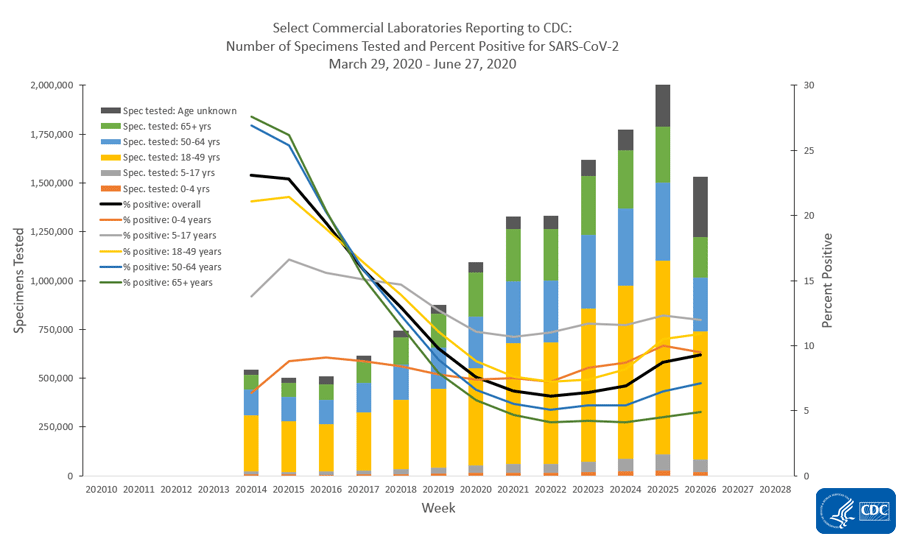
The number of specimens tested for SARS-CoV-2 and reported to CDC by public health laboratories and a subset of clinical and commercial laboratories in the United States are summarized below. At this point in the outbreak, all laboratories are performing primary diagnostic functions; therefore, the percentage of specimens testing positive across laboratory types can be used to monitor trends in COVID-19 activity. As the outbreak progresses, it is possible that different types of laboratories will take on different roles, and the data interpretation may need to be modified. The lower percentage of specimens testing positive in the clinical laboratories compared to the public health and commercial laboratories is likely due to the amount of COVID-19 activity in areas with reporting laboratories and a larger proportion of specimens from children.

COVIDVIEW1.webp


Public Health Laboratories

public-health-lab.png
Data Table

Clinical Laboratories

clinical-labs.png
Data Table

Commercial Laboratories

commercial-lab.png


* Commercial laboratories began testing for SARS-CoV-2 in early March, but the number and geographic distribution of reporting commercial laboratories became stable enough to calculate a weekly percentage of specimens testing positive as of March 29, 2020.
Data Table


Additional virologic surveillance information: Surveillance Methods

Outpatient/Emergency Department Illness

Two syndromic surveillance systems are being used to monitor trends in outpatient and emergency department visits that may be related to COVID-19. Each system monitors a slightly different syndrome, and together these systems provide a more comprehensive picture of mild to moderate COVID-19 illness than either would individually. Both systems are currently being affected by recent changes in healthcare seeking behavior, including increasing use of telemedicine and recommendations to limit emergency department (ED) visits to severe illness, as well as increased social distancing. These changes affect the numbers of people and their reasons for seeking care in the outpatient and ED settings.
ILINet


The U.S. Outpatient Influenza-like Illness Surveillance Network (ILINet) provides data on visits for influenza-like illness (ILI) (fever [≥100[SUP]○[/SUP]F] and cough and/or sore throat) to approximately 2,600 primary care providers, emergency departments and urgent care centers in all 50 states, Puerto Rico, the District of Columbia and the U.S. Virgin Islands. Mild COVID-19 illness presents with symptoms similar to ILI, so ILINet is being used to track trends of mild to moderate COVID-19 illness and allows for comparison with prior influenza seasons.

Nationwide during week 15, 2.9% of patient visits reported through ILINet were due to ILI. This percentage is above the national baseline of 2.4% but represents the third week of a decline after three weeks of increase beginning in early March. The percentage of visits for ILI decreased in all age groups. Nationally, laboratory confirmed influenza activity as reported by clinical laboratories decreased to levels usually seen in summer months which, along with changes in healthcare seeking behavior and the impact of social distancing, is likely driving the decrease in ILI activity.
percent-ili-visits.png


* Age-group specific percentages should not be compared to the national baseline.

On a regional levelexternal icon, the percentage of outpatient visits for ILI ranged from 1.3% to 8.3% during week 15; all regions reported a decreased percentage of outpatient visits for ILI compared to week 14 and five regions are below their region-specific baselines.
Overall Percentage of Visits for ILI | Age Group ILI Data

ILI Activity Levels


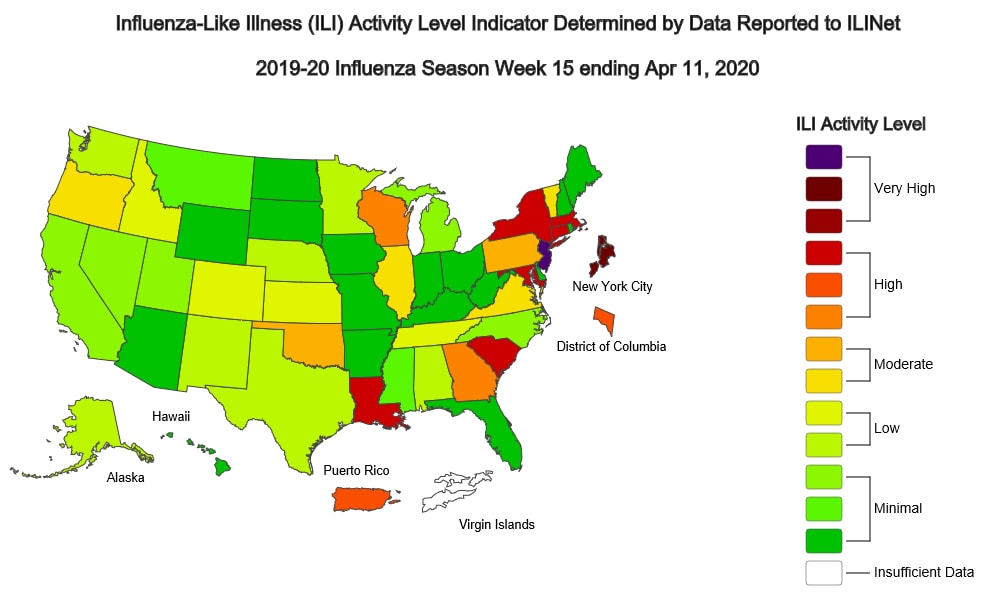
Data collected in ILINet are used to produce a measure of ILI activity for all 50 states, Puerto Rico, the District of Columbia and New York City. The mean reported percentage of visits due to ILI for the current week is compared to the mean reported during non-influenza weeks, and the activity levels correspond to the number of standard deviations below, at or above the mean.

The number of jurisdictions at each activity level during week 15 and the change compared to the previous week are summarized in the table below and shown in the following maps. The decreasing percentage of visits for ILI described above are reflected in this week’s ILI activity levels. [TABLE="cellpadding: 5"]
[TR]
[TD]Activity Level[/TD]
[TD="colspan: 2"]Number of Jurisdictions[/TD]
[/TR]
[TR]
[TD]Week 15
(Week ending April 11, 2020)[/TD]
[TD]Compared to Previous Week[/TD]
[/TR]
[TR]
[TD]Very High[/TD]
[TD]2[/TD]
[TD]-6[/TD]
[/TR]
[TR]
[TD]High[/TD]
[TD]10[/TD]
[TD]-4[/TD]
[/TR]
[TR]
[TD]Moderate[/TD]
[TD]6[/TD]
[TD]+2[/TD]
[/TR]
[TR]
[TD]Low[/TD]
[TD]11[/TD]
[TD]-1[/TD]
[/TR]
[TR]
[TD]Minimal[/TD]
[TD]24[/TD]
[TD]+9[/TD]
[/TR]
[TR]
[TD]Insufficient Data*[/TD]
[TD]1[/TD]
[TD]No change[/TD]
[/TR]
[/TABLE]
ili-map-1.png

ili-map-2.png


*Data collected in ILINet may disproportionally represent certain populations within a state, and may not accurately depict the full picture of influenza activity for the whole state. Differences in the data presented here by CDC and independently by some state health departments likely represent differing levels of data completeness with data presented by the state likely being the more complete.
National Syndromic Surveillance Program (NSSP): Emergency Department (ED) Visits


NSSP is a collaboration among CDC, federal partners, local and state health departments and academic and private sector partners to collect, analyze and share electronic patient encounter data received from multiple healthcare settings. To track trends of potential COVID-19 visits, visits for COVID-19-like illness (CLI) (fever and cough or shortness of breath or difficulty breathing or presence of a coronavirus diagnosis code) and ILI to a subset of emergency departments in 47 states are being monitored. The coronavirus diagnosis code was added to the CLI definition this week after input from public health and community partners. This addition changed the magnitude of the percentage of visits for CLI but it did not change the trends.

Nationwide during week 15, 5.6% of emergency department visits captured in NSSP were due to CLI and 2.5% were due to ILI. This is the third week of decline in percentage of visits for ILI and the second week of decline in percentage of visits for CLI. All 10 HHS regionsexternal icon experienced a decline in percentage of visits for ILI and CLI.
Data Table


Additional information about medically attended outpatient and emergency department visits for ILI and CLI: Surveillance Methods

Hospitalizations

The COVID-19-Associated Hospitalization Surveillance Network (COVID-NET) conducts population-based surveillance for laboratory-confirmed COVID-19-associated hospitalizations in select counties participating in the Emerging Infections Program (EIP) and Influenza Hospitalization Surveillance Project (IHSP) states. COVID-NET-estimated hospitalization rates will be updated weekly.

A total of 6,485 laboratory-confirmed COVID-19-associated hospitalizations were reported by sites between March 1, 2020, and April 11, 2020. The overall cumulative hospitalization rate was 20 per 100,000 population with the highest rates among adults aged 65 years and older (63.8 per 100,000) followed by adults aged 50-64 years (32.8 per 100,000).
lab-confirmed-hospitalizations.png


Among 1,968 cases with information on race/ethnicity, 43.4% were non-Hispanic white, 32.0% were non-Hispanic black, 11.7% were Hispanic and 12.9% were other race, including unknown race. [TABLE="cellpadding: 5"]
[TR]
[TD] [/TD]
[TD="align: center"]Overall[/TD]
[TD="align: center"]0-4

years[/TD]
[TD="align: center"]5-17

years[/TD]
[TD="align: center"]18-49 years[/TD]
[TD="align: center"]50-64 years[/TD]
[TD="align: center"]65+

years[/TD]
[/TR]
[TR]
[TD] [/TD]
[TD="align: center"]N (%)[/TD]
[TD="align: center"]N (%)[/TD]
[TD="align: center"]N (%)[/TD]
[TD="align: center"]N (%)[/TD]
[TD="align: center"]N (%)[/TD]
[TD="align: center"]N (%)[/TD]
[/TR]
[TR]
[TD]Non-Hispanic White[/TD]
[TD="align: center"]854 (43.4)[/TD]
[TD="align: center"]3 (60.0)[/TD]
[TD="align: center"]3 (33.3)[/TD]
[TD="align: center"]136 (29.2)[/TD]
[TD="align: center"]239 (37.5)[/TD]
[TD="align: center"]473 (55.6)[/TD]
[/TR]
[TR]
[TD]Non-Hispanic Black[/TD]
[TD="align: center"]630 (32.0)[/TD]
[TD="align: center"]0 (0.0)[/TD]
[TD="align: center"]6 (66.7)[/TD]
[TD="align: center"]158 (34.0)[/TD]
[TD="align: center"]229 (35.9)[/TD]
[TD="align: center"]237 (27.8)[/TD]
[/TR]
[TR]
[TD]Hispanic[/TD]
[TD="align: center"]230 (11.7)[/TD]
[TD="align: center"]2 (40.0)[/TD]
[TD="align: center"]0 (0.0)[/TD]
[TD="align: center"]107 (23.0)[/TD]
[TD="align: center"]82 (12.9)[/TD]
[TD="align: center"]39 (4.6)[/TD]
[/TR]
[TR]
[TD]Other[/TD]
[TD="align: center"]254 (12.9)[/TD]
[TD="align: center"]0 (0.0)[/TD]
[TD="align: center"]0 (0.0)[/TD]
[TD="align: center"]64 (13.8)[/TD]
[TD="align: center"]88 (13.8)[/TD]
[TD="align: center"]102 (12.0)[/TD]
[/TR]
[/TABLE]
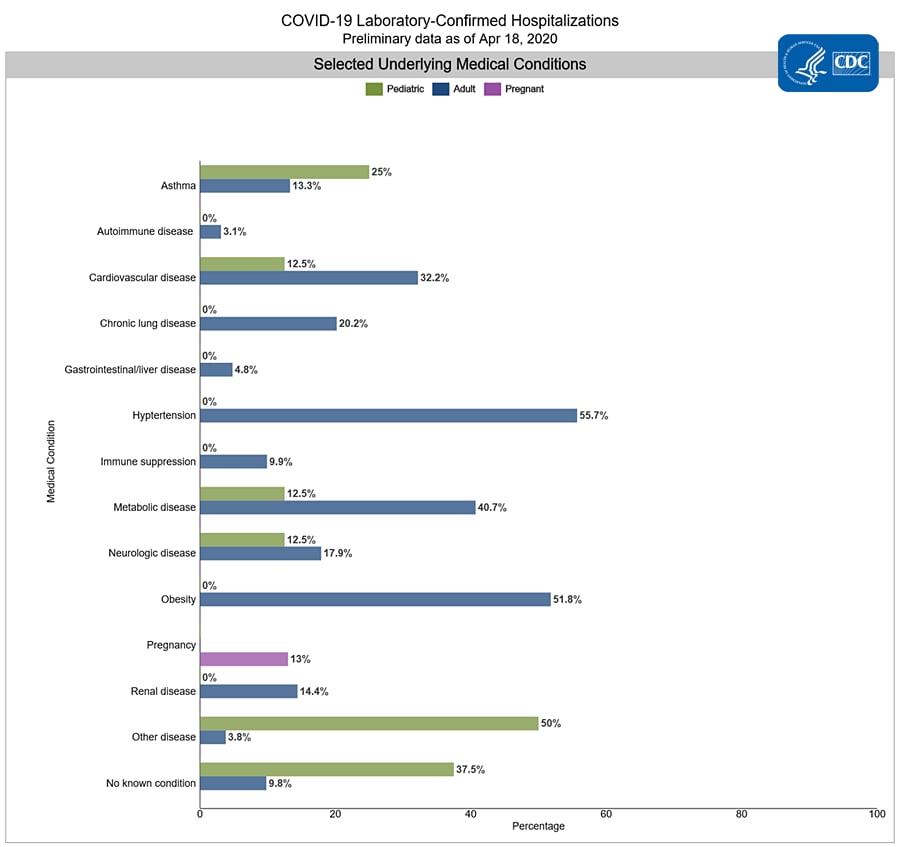
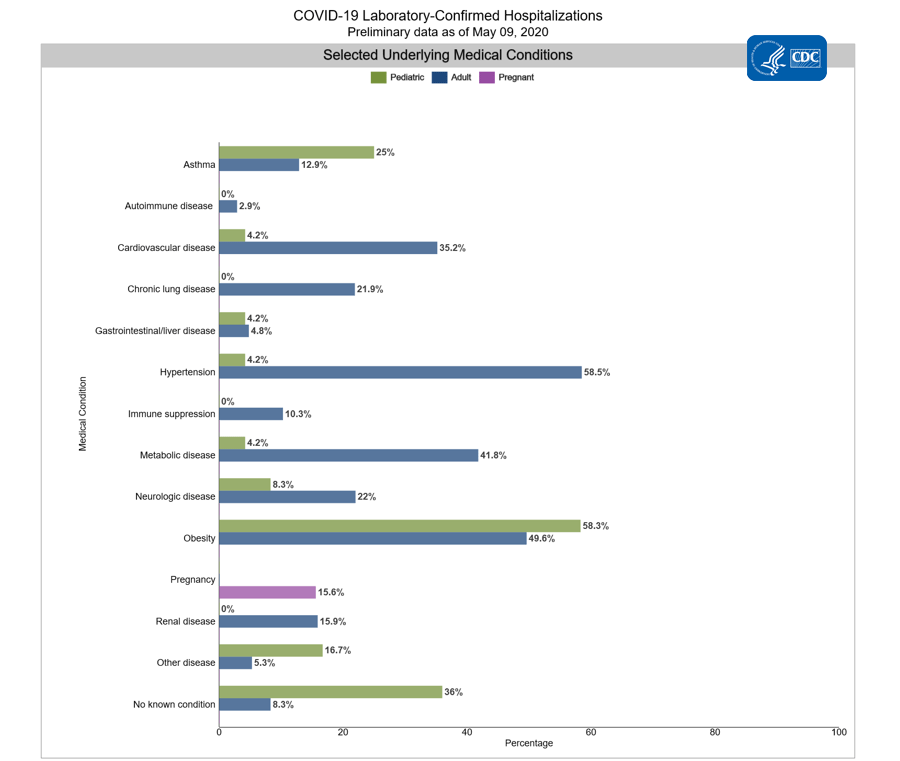
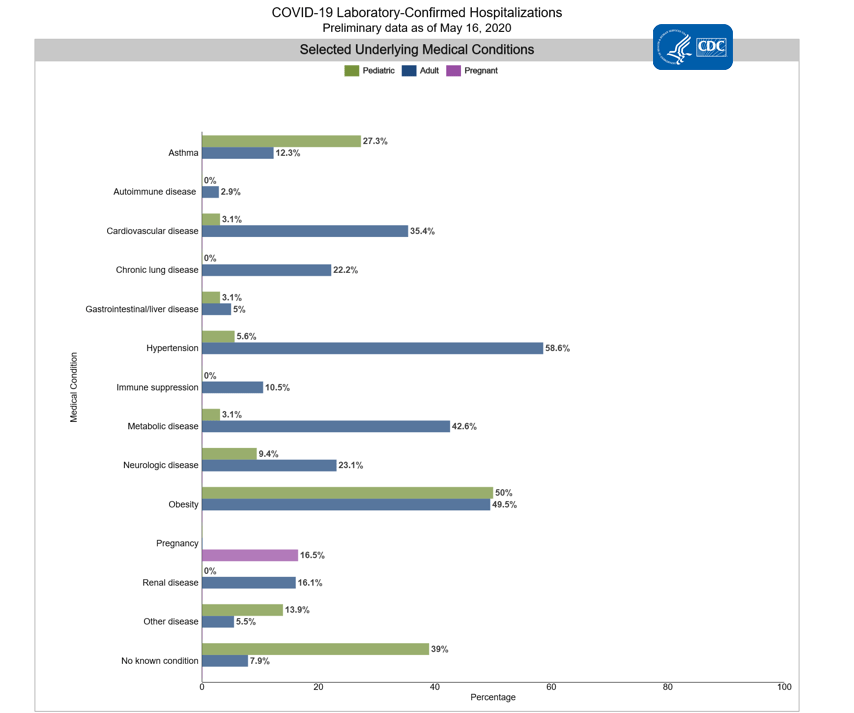
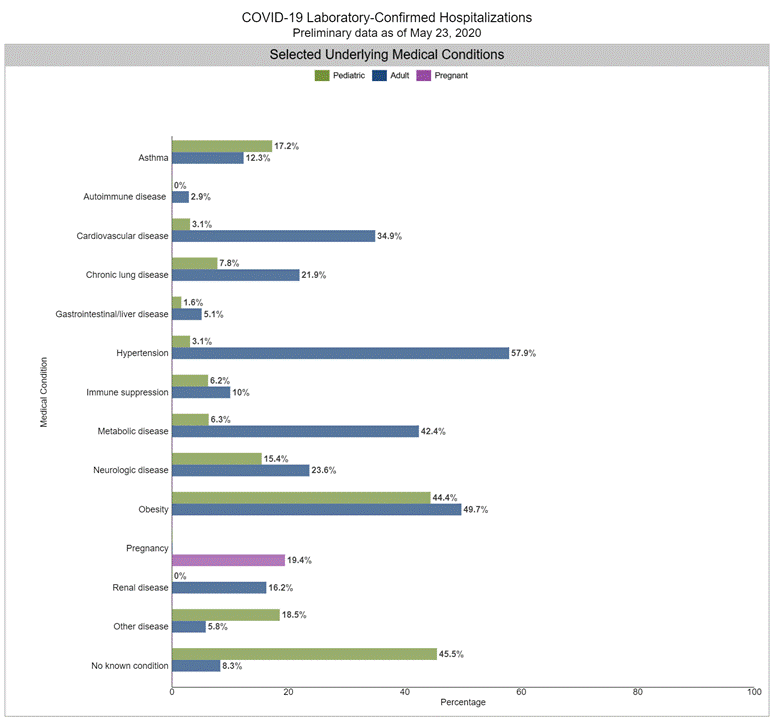
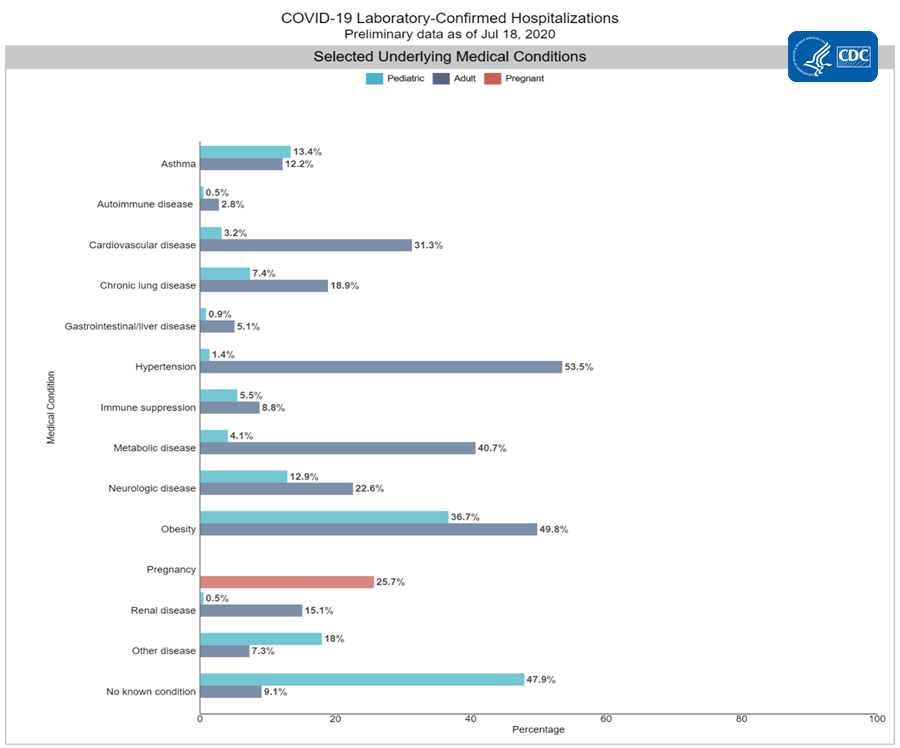
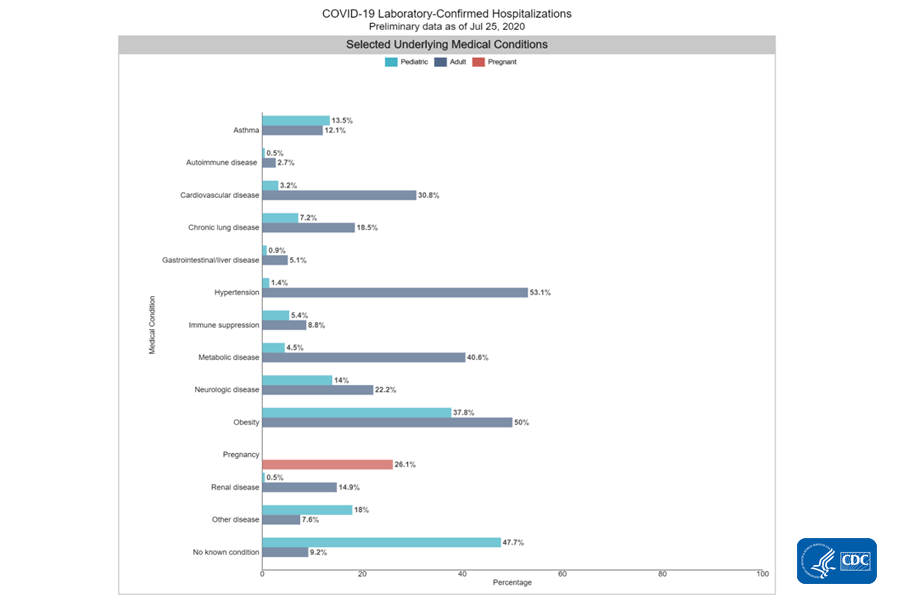
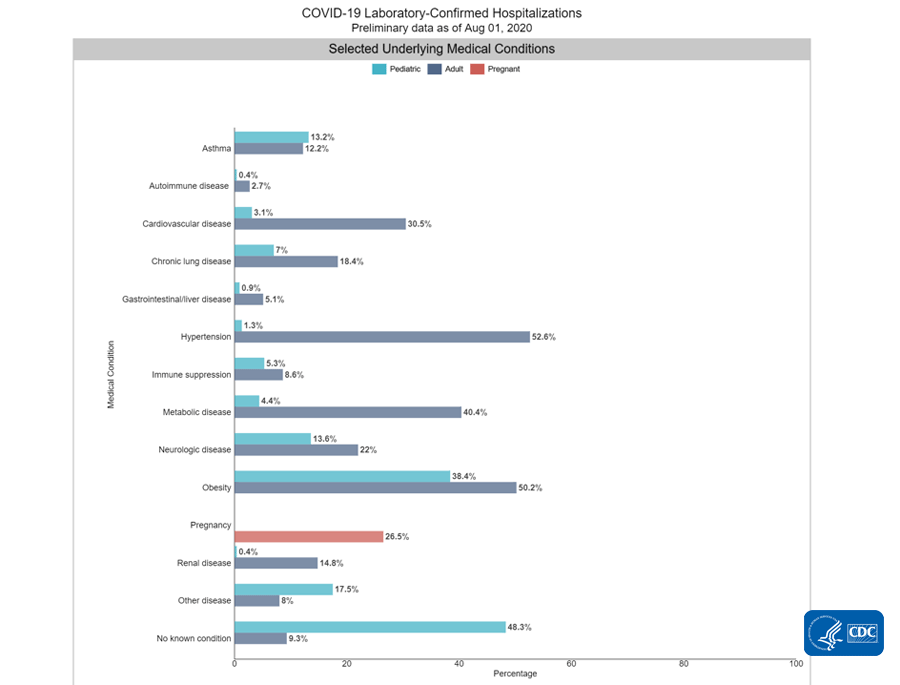
Among 886 hospitalized adults with information on underlying medical conditions, 90% had at least one reported underlying medical condition; the most commonly reported were hypertension, obesity, chronic metabolic disease and cardiovascular disease. Among 7 hospitalized children with information on underlying medical conditions, 71.4% had at least one underlying medical condition; the most commonly reported was asthma.

Additional hospitalization surveillance information: Surveillance Methods | Additional rate data | Additional demographic and clinical data

Mortality Surveillance

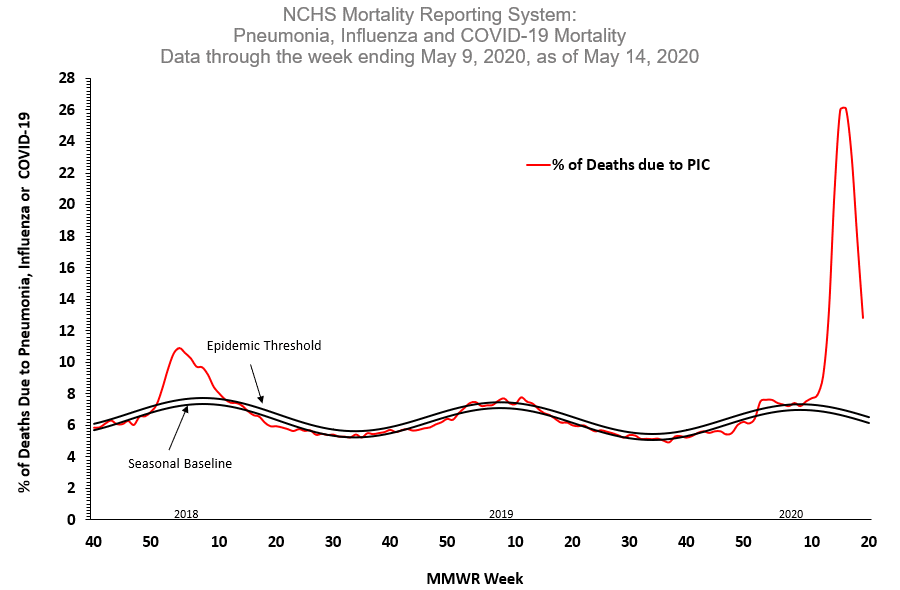
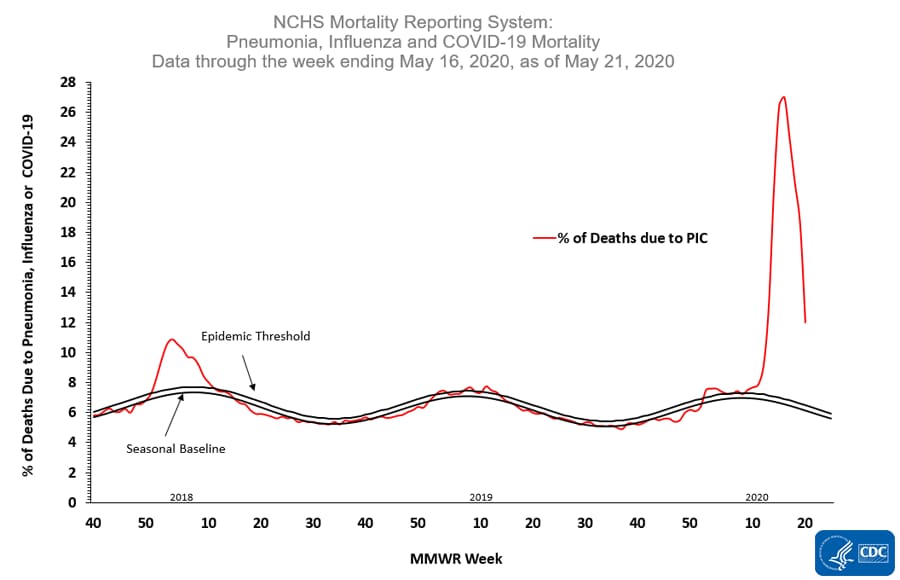
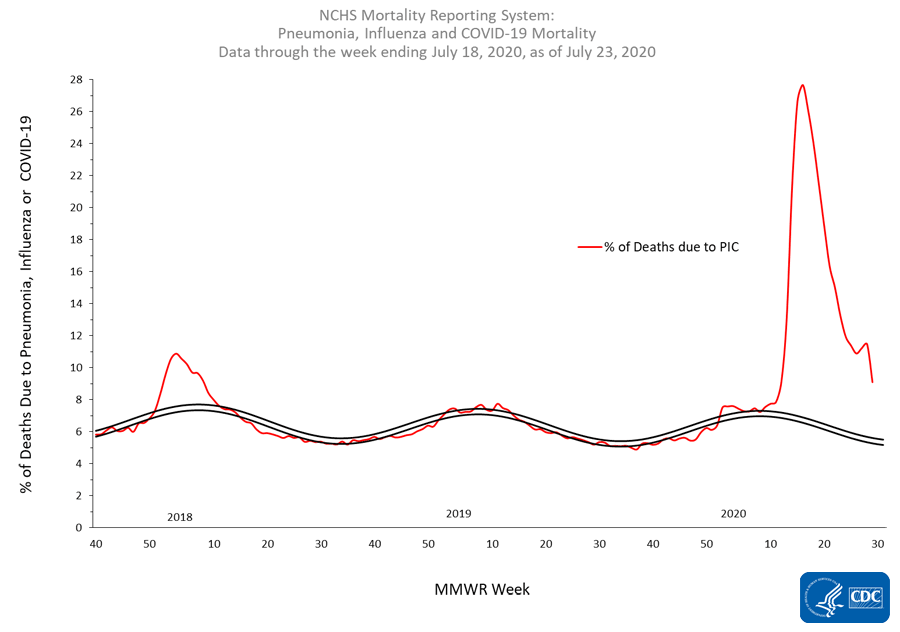
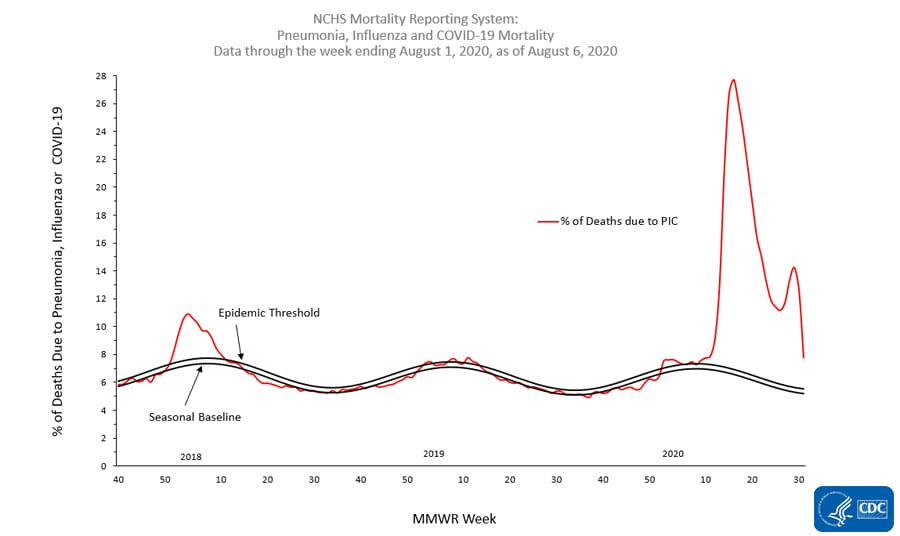
The National Center for Health Statistics (NCHS) collects death certificate data from vital statistics offices for all deaths occurring in the United States. Based on death certificate data available on April 16, 2020, 18.8% of all deaths occurring during the week ending April 11, 2020 (week 15) were due to pneumonia, influenza or COVID-19 (PIC). This percentage is above the epidemic threshold of 7.0% for week 15 and has been increasing sharply since the end of February.
nchs-mortality-report.png


*Data during recent weeks are incomplete because of the lag in time between when the death occurred and when the death certificate is completed, submitted to NCHS and processed for reporting purposes.
Data Table


Additional NCHS mortality surveillance information: Surveillance Methods | Provisional Death Counts for COVID-19 | Provisional Death Counts for PICpdf icon

View Page In:pdf icon 10 Pages, 2 MB
Page last reviewed: April 17, 2020
Content source: National Center for Immunization and Respiratory Diseases (NCIRD), Division of Viral Diseases

https://www.cdc.gov/coronavirus/2019...iew/index.html
 
COVIDView.jpg
COVIDView Weekly Summary


Print Page
Updated April 24, 2020

Download Weekly Summary pdf icon[42 Pages, 2 MB]

Key Updates for Week 16, ending April 18, 2020

Levels of influenza-like illness (ILI) declined again and are below the national baseline but remain elevated in the northeast and northwest of the country. Levels of laboratory confirmed COVID-19 activity remained similar to, or decreased slightly, compared to last week. Mortality attributed to COVID-19 decreased compared to last week but remains significantly elevated and may increase as additional death certificates are counted.

Virus
Public Health, Commercial and Clinical Laboratories
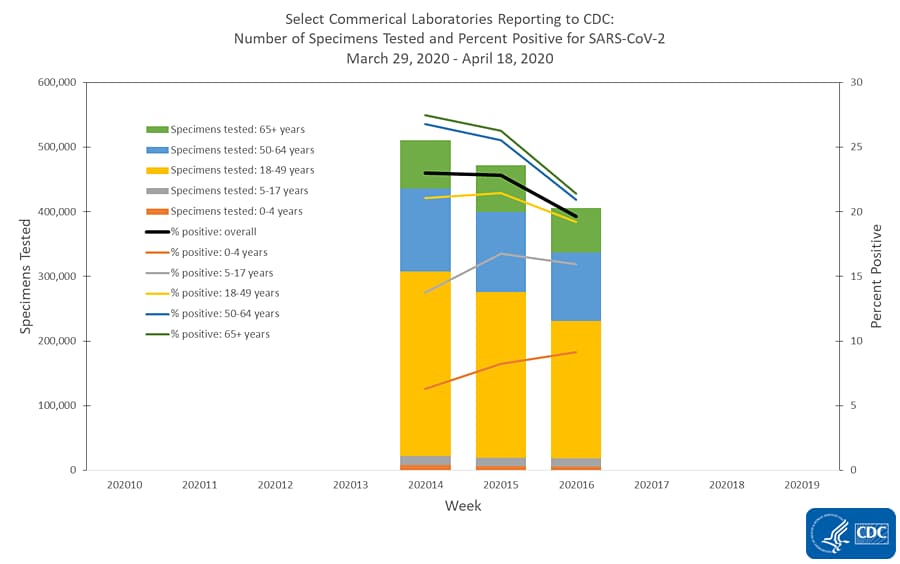
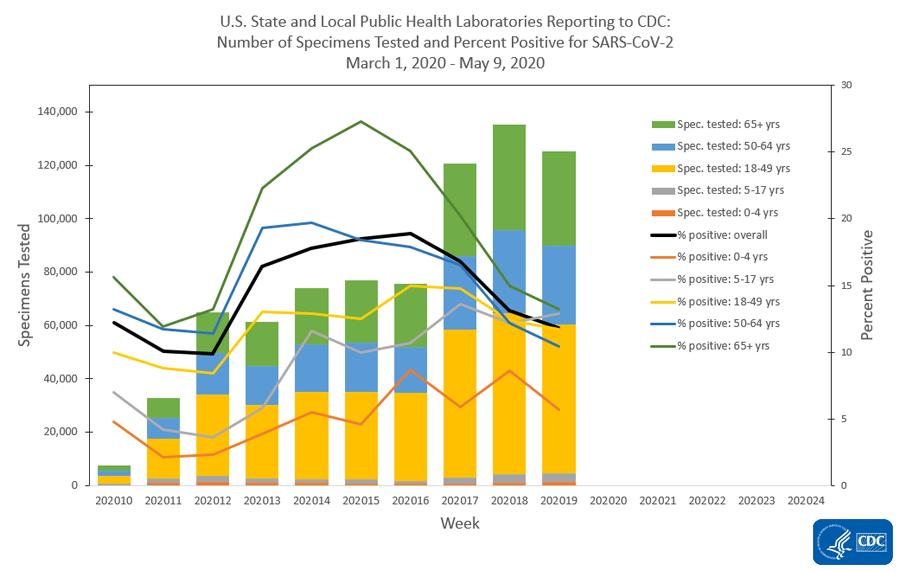
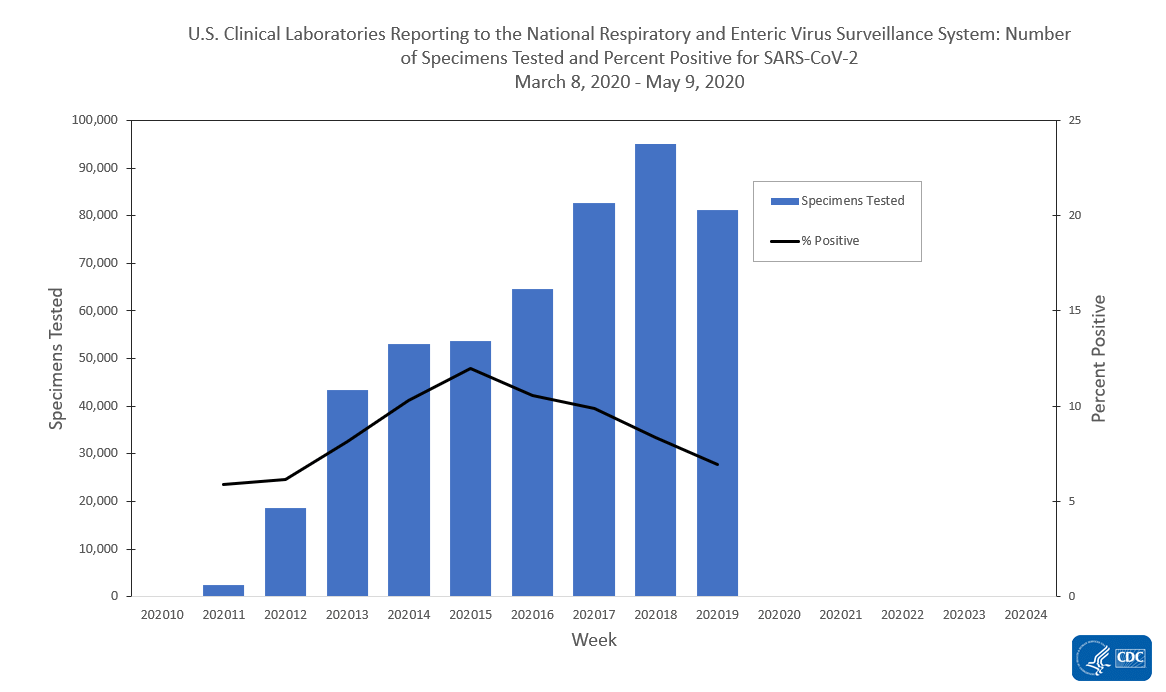
The national percentage of respiratory specimens testing positive for SARS-CoV-2 at public health, clinical and commercial laboratories remained similar to, or decreased slightly from, week 15 to week 16 and is as follows:
  • Public health laboratories – increased from 17.8% during week 15 to 18.8% during week 16;
  • Clinical laboratories – decreased from 11.3% during week 15 to 9.6% during week 16;
  • Commercial laboratories – decreased from 22.8% during week 15 to 19.7% during week 16.
Outpatient and Emergency Department Visits
Outpatient Influenza-Like Illness Network (ILINet) and National Syndromic Surveillance Program (NSSP)
Two indicators from existing surveillance systems are being monitored to track outpatient or emergency department (ED) visits for potential COVID-19 illness.
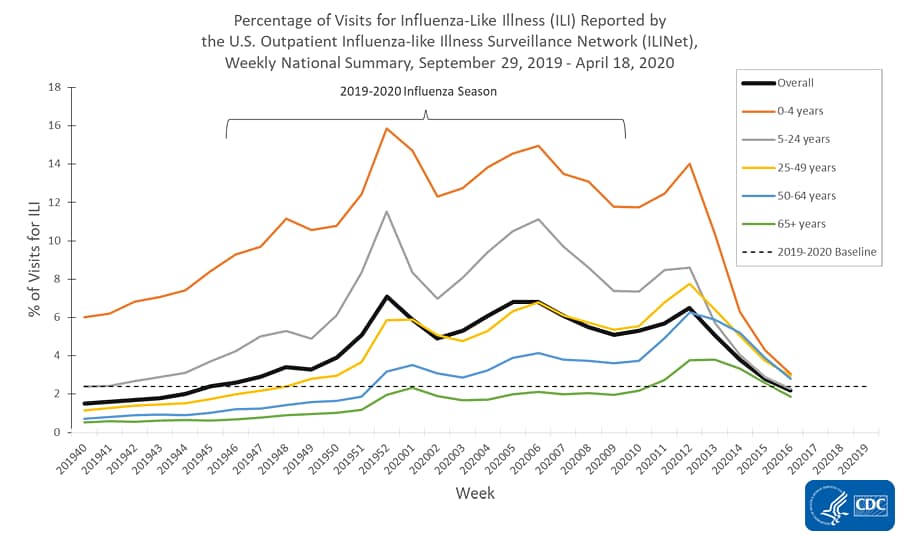
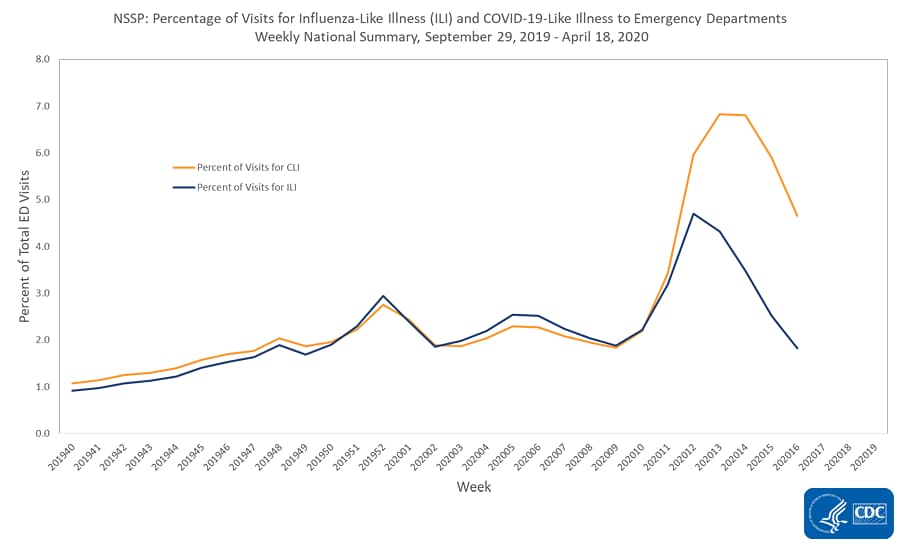
  • Nationally, the percentages of visits for ILI and COVID-19-like illness (CLI) decreased compared to last week and levels of ILI are now below baseline.
Recent changes in health care seeking behavior are likely impacting data from both networks, making it difficult to draw further conclusions at this time. Tracking these systems moving forward will give additional insight into illness related to COVID-19.

Severe Disease
Hospitalizations
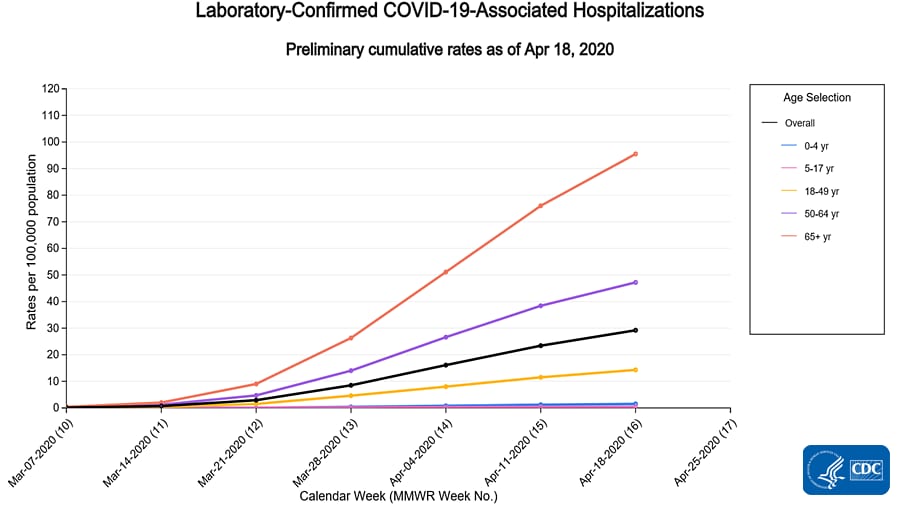
Cumulative COVID-19-associated hospitalization rates since March 1, 2020, are updated weekly. The overall cumulative hospitalization rate is 29.2 per 100,000, with the highest rates in people 65 years and older (95.5 per 100,000) and 50-64 years (47.2 per 100,000).

Mortality
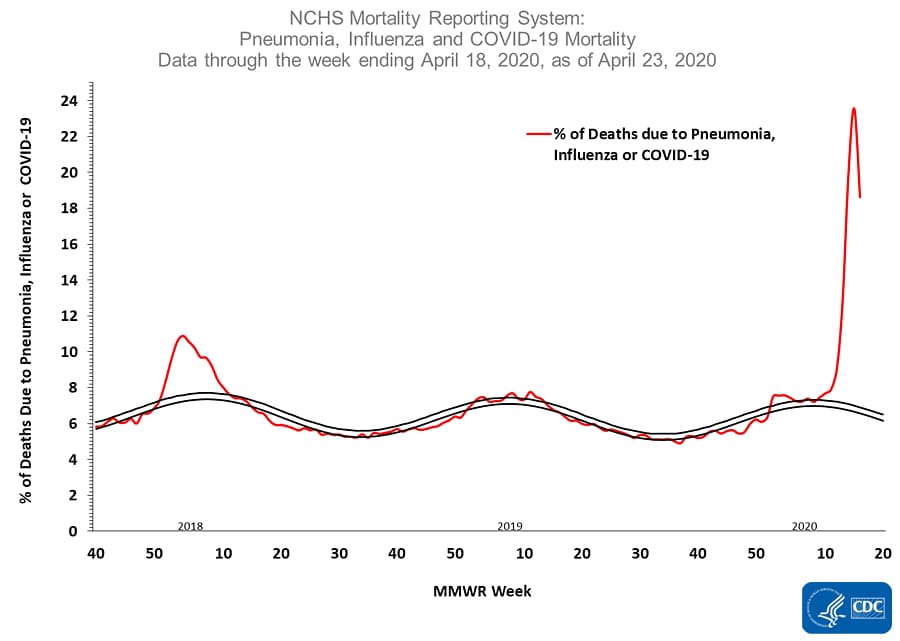
Based on death certificate data, the percentage of deaths attributed to pneumonia, influenza or COVID-19 (PIC) decreased from 23.6% during week 15 to 18.6% during week 16 but remained significantly above baseline. This percentage may change as additional death certificates are processed.

All data are preliminary and may change as more reports are received.

A description of the surveillance systems summarized in COVIDView, including methodology and detailed descriptions of each data component, is available on the surveillance methods page.

Key Points
  • Nationally, the percentage of laboratory specimens testing positive for SARS-CoV-2 remained similar to, or decreased, compared to last week.
  • Nationally, visits to outpatient providers and emergency departments (EDs) for illnesses with symptoms consistent with COVID-19 continued to decline and are below baseline in many areas of the country.
    • The decrease in the percentage of people presenting for care with these symptoms may be due to decline in COVID-19 but may be tempered by a number of factors including less ILI overall because of widespread adoption of social distancing efforts and changes in healthcare seeking behavior.
    • At this time, there is little influenza activity.
  • The overall cumulative COVID-19 associated hospitalization rate is 29.2 per 100,000, with the highest rates in persons 65 years and older (95.5 per 100,000) and 50-64 years (47.2 per 100,000). Hospitalization rates for COVID-19 in older people are higher than what is typically seen early in a flu season.
  • Based on death certificate data, the percentage of deaths attributed to pneumonia, influenza or COVID-19 (PIC) decreased from 23.6% during week 15 to 18.6% during week 16 but remained significantly above baseline. This is very elevated in the context of any influenza season. The percentage may change as additional death certificates are processed.
  • Declines in some key indicators used to track COVID-19 from one week to the next could change as additional data are received but also may be a result of widespread social distancing measures.

U.S. Virologic Surveillance

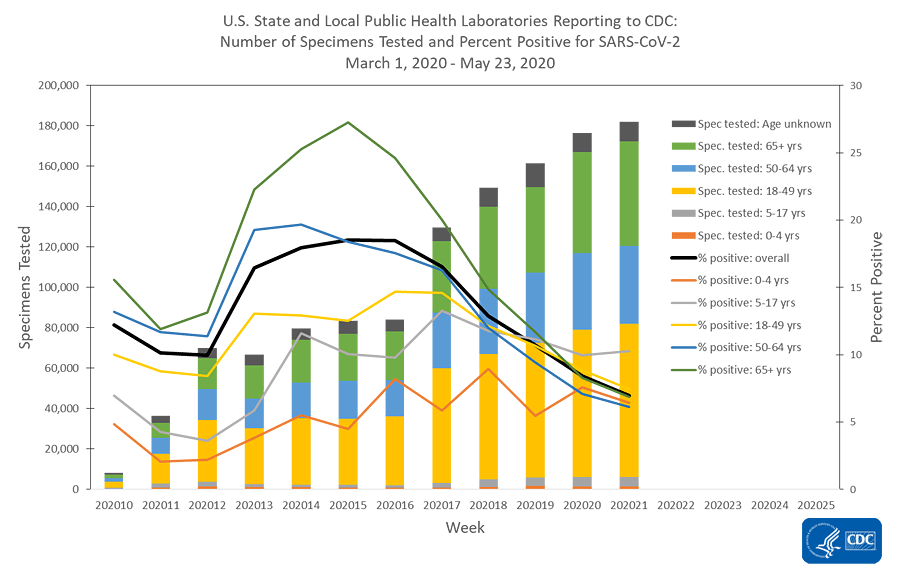
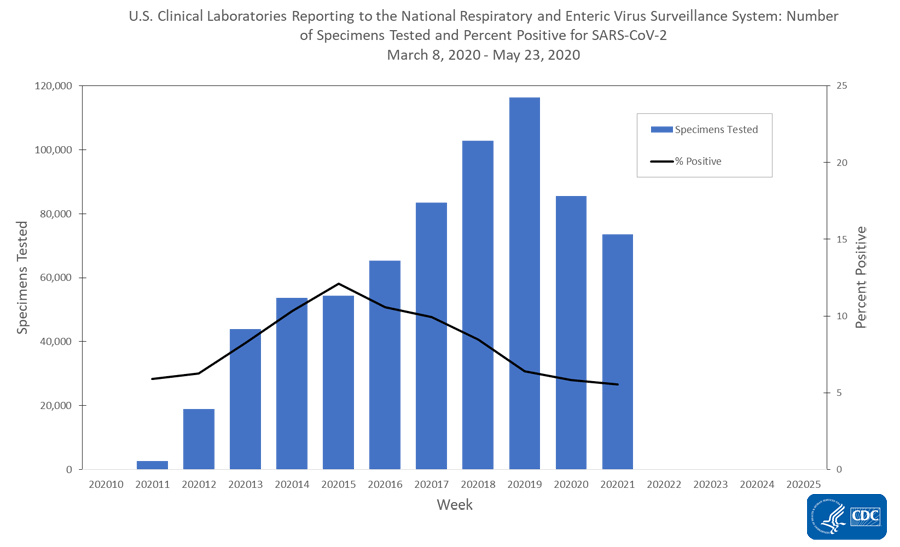
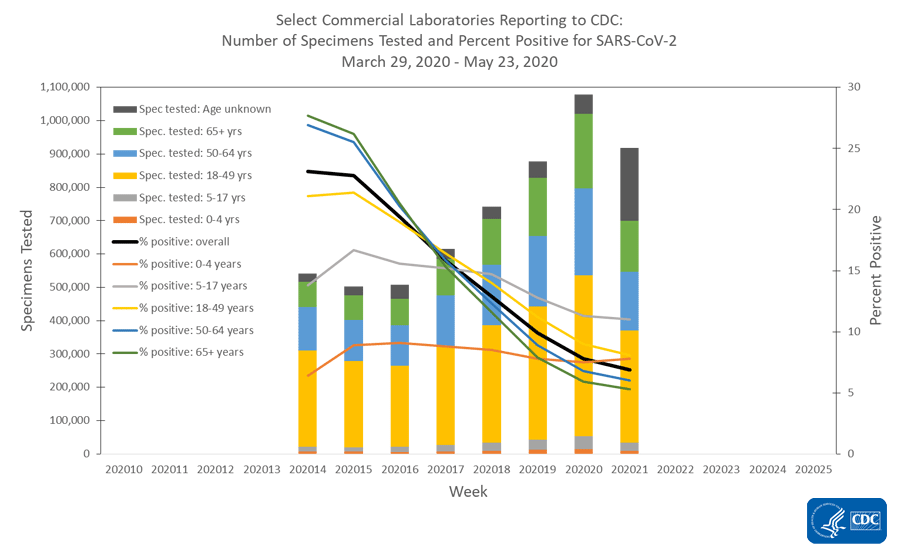
The number of specimens tested for SARS-CoV-2 and reported to CDC by public health laboratories and a subset of clinical and commercial laboratories in the United States are summarized below. At this point in the outbreak, all laboratories are performing primary diagnostic functions; therefore, the percentage of specimens testing positive across laboratory types can be used to monitor trends in COVID-19 activity. As the outbreak progresses, it is possible that different types of laboratories will take on different roles, and the data interpretation may need to be modified. The lower percentage of specimens testing positive in the clinical laboratories compared to the public health and commercial laboratories is likely due to the amount of COVID-19 activity in areas with reporting laboratories and a larger proportion of specimens from children.
72,345401,159
47,983213,427
455,1622,550,201
13,636 (18.8%)62,686 (15.6%)
4,585 (9.6%)20,555 (9.6%)
89,482 (19.7%)498,381 (19.5%)
* Commercial and clinical laboratory data represents select laboratories and does not capture all tests performed in the United States.
Public Health Laboratories


resize iconView LargerData Table

Clinical Laboratories


resize iconView LargerData Table

Commercial Laboratories


resize iconView Larger


* Commercial laboratories began testing for SARS-CoV-2 in early March, but the number and geographic distribution of reporting commercial laboratories became stable enough to calculate a weekly percentage of specimens testing positive as of March 29, 2020.
Data Table


Additional virologic surveillance information: Surveillance Methods


Outpatient/Emergency Department Illness

Two syndromic surveillance systems are being used to monitor trends in outpatient and emergency department visits that may be related to COVID-19. Each system monitors a slightly different syndrome, and together these systems provide a more comprehensive picture of mild to moderate COVID-19 illness than either would individually. Both systems are currently being affected by recent changes in healthcare seeking behavior, including increasing use of telemedicine and recommendations to limit emergency department (ED) visits to severe illness, as well as increased social distancing. These changes affect the numbers of people and their reasons for seeking care in the outpatient and ED settings.
ILINet


The U.S. Outpatient Influenza-like Illness Surveillance Network (ILINet) provides data on visits for influenza-like illness (ILI) (fever [≥100[SUP]○[/SUP]F] and cough and/or sore throat) to approximately 2,600 primary care providers, emergency departments and urgent care centers in all 50 states, Puerto Rico, the District of Columbia and the U.S. Virgin Islands. Mild COVID-19 illness presents with symptoms similar to ILI, so ILINet is being used to track trends of mild to moderate COVID-19 illness and allows for comparison with prior influenza seasons.

Nationwide during week 16, 2.2% of patient visits reported through ILINet were due to ILI. This percentage is below the national baseline of 2.4% and represents the fourth week of a decline after three weeks of increase beginning in early March. The percentage of visits for ILI decreased in all age groups. Nationally, laboratory-confirmed influenza activity as reported by clinical laboratories has decreased to levels usually seen in summer months which, along with changes in healthcare seeking behavior and the impact of social distancing, is likely contributing to the decrease in ILI activity.

resize iconView Larger


* Age-group specific percentages should not be compared to the national baseline.

On a regional levelexternal icon, the percentage of outpatient visits for ILI ranged from 1.1% to 5.4% during week 16; all regions reported a decreased percentage of outpatient visits for ILI compared to week 15 and six regions are below their region-specific baselines.
Overall Percentage of Visits for ILI | Age Group ILI Data

ILI Activity Levels


Data collected in ILINet are used to produce a measure of ILI activity for all 50 states, Puerto Rico, the District of Columbia and New York City. The mean reported percentage of visits due to ILI for the current week is compared to the mean reported during non-influenza weeks, and the activity levels correspond to the number of standard deviations below, at or above the mean.

The number of jurisdictions at each activity level during week 16 and the change compared to the previous week are summarized in the table below and shown in the following maps. The decreasing percentage of visits for ILI described above are reflected in this week’s ILI activity levels. [TABLE="cellpadding: 5"]
[TR]
[TD]Activity Level[/TD]
[TD="colspan: 2"]Number of Jurisdictions[/TD]
[/TR]
[TR]
[TD]Week 16
(Week ending April 18, 2020)
[/TD]
[TD]Compared to Previous Week[/TD]
[/TR]
[TR]
[TD]Very High[/TD]
[TD]1[/TD]
[TD]-1[/TD]
[/TR]
[TR]
[TD]High[/TD]
[TD]7[/TD]
[TD]-3[/TD]
[/TR]
[TR]
[TD]Moderate[/TD]
[TD]3[/TD]
[TD]-3[/TD]
[/TR]
[TR]
[TD]Low[/TD]
[TD]8[/TD]
[TD]-1[/TD]
[/TR]
[TR]
[TD]Minimal[/TD]
[TD]34[/TD]
[TD]+8[/TD]
[/TR]
[TR]
[TD]Insufficient Data*[/TD]
[TD]1[/TD]
[TD]No change[/TD]
[/TR]
[/TABLE]

*Data collected in ILINet may disproportionally represent certain populations within a state, and may not accurately depict the full picture of influenza activity for the whole state. Differences in the data presented here by CDC and independently by some state health departments likely represent differing levels of data completeness with data presented by the state likely being the more complete.
National Syndromic Surveillance Program (NSSP): Emergency Department (ED) Visits


NSSP is a collaboration among CDC, federal partners, local and state health departments and academic and private sector partners to collect, analyze and share electronic patient encounter data received from multiple healthcare settings. To track trends of potential COVID-19 visits, visits for COVID-19-like illness (CLI) (fever and cough or shortness of breath or difficulty breathing or presence of a coronavirus diagnosis code) and ILI to a subset of emergency departments in 47 states are being monitored.

Nationwide during week 16, 4.7% of emergency department visits captured in NSSP were due to CLI and 1.8% were due to ILI. This is the fourth week of decline in percentage of visits for ILI and the third week of stable or declining percentage of visits for CLI. All 10 HHS regionsexternal icon experienced a decline in percentage of visits for ILI and CLI.

resize iconView LargerData Table


Additional information about medically attended outpatient and emergency department visits for ILI and CLI: Surveillance Methods


Hospitalizations

The COVID-19-Associated Hospitalization Surveillance Network (COVID-NET) conducts population-based surveillance for laboratory-confirmed COVID-19-associated hospitalizations in select counties participating in the Emerging Infections Program (EIP) and Influenza Hospitalization Surveillance Project (IHSP) states. COVID-NET-estimated hospitalization rates will be updated weekly.

A total of 9,483 laboratory-confirmed COVID-19-associated hospitalizations were reported by sites between March 1, 2020 and April 18, 2020. The overall cumulative hospitalization rate was 29.2 per 100,000 population. The highest rate of hospitalization is among adults aged ≥ 65 (95.5 per 100,000), followed by adults aged 50-64 years (47.2 per 100,000) and adults aged 18-49 years (14.3 per 100,000).
lab-confirmed-hospitalizations.png

resize iconView Larger


Among 2,803 cases with information on race/ethnicity, 43.7% were non-Hispanic white, 31.4% were non-Hispanic black, 12.4% were Hispanic, and 12.6% were other race, including unknown race. [TABLE="cellpadding: 5"]
[TR]
[TD] [/TD]
[TD="align: center"]Overall[/TD]
[TD="align: center"]0-4 years[/TD]
[TD="align: center"]5-17 years[/TD]
[TD="align: center"]18-49 years[/TD]
[TD="align: center"]50-64 years[/TD]
[TD="align: center"]65+ years[/TD]
[/TR]
[TR]
[TD] [/TD]
[TD="align: center"]N (%)[/TD]
[TD="align: center"]N (%)[/TD]
[TD="align: center"]N (%)[/TD]
[TD="align: center"]N (%)[/TD]
[TD="align: center"]N (%)[/TD]
[TD="align: center"]N (%)[/TD]
[/TR]
[TR]
[TD]Non-Hispanic White[/TD]
[TD="align: center"]1,224 (43.7)[/TD]
[TD="align: center"]3 (50.0)[/TD]
[TD="align: center"]2 (18.2)[/TD]
[TD="align: center"]173 (27.0)[/TD]
[TD="align: center"]334 (38.1)[/TD]
[TD="align: center"]712 (56.2)[/TD]
[/TR]
[TR]
[TD]Non-Hispanic Black[/TD]
[TD="align: center"]879 (31.4)[/TD]
[TD="align: center"]0 (0.0)[/TD]
[TD="align: center"]6 (54.5)[/TD]
[TD="align: center"]211 (32.9)[/TD]
[TD="align: center"]305 (34.8)[/TD]
[TD="align: center"]357 (28.2)[/TD]
[/TR]
[TR]
[TD]Hispanic[/TD]
[TD="align: center"]347 (12.4)[/TD]
[TD="align: center"]2 (33.3)[/TD]
[TD="align: center"]2 (18.2)[/TD]
[TD="align: center"]162 (25.3)[/TD]
[TD="align: center"]121 (13.8)[/TD]
[TD="align: center"]60 (4.7)[/TD]
[/TR]
[TR]
[TD]Other[/TD]
[TD="align: center"]353 (12.6)[/TD]
[TD="align: center"]1 (16.7)[/TD]
[TD="align: center"]1 (9.1)[/TD]
[TD="align: center"]95 (14.8)[/TD]
[TD="align: center"]117 (13.3)[/TD]
[TD="align: center"]139 (11.0)[/TD]
[/TR]
[/TABLE]
Among 1,393 hospitalized adults with information on underlying medical conditions, 90.2% had at least one reported underlying medical condition, the most commonly reported were hypertension, obesity, chronic metabolic disease, and cardiovascular disease.
lab-confirmed-hospitalizations-underlying.png

resize iconView Larger


Additional hospitalization surveillance information: Surveillance Methods | Additional rate data | Additional demographic and clinical data


Mortality Surveillance

The National Center for Health Statistics (NCHS) collects death certificate data from vital statistics offices for all deaths occurring in the United States. Based on death certificate data available on April 23, 2020, 18.6% of all deaths occurring during the week ending April 18, 2020 (week 16) were due to pneumonia, influenza or COVID-19 (PIC). This percentage is above the epidemic threshold of 6.9% for week 16 and represents the first week of a decline in PIC percentage since the end of February; however, data for week 16 are incomplete and the PIC percentage may increase as more death certificates are filed.

resize iconView Larger


*Data during recent weeks are incomplete because of the lag in time between when the death occurred and when the death certificate is completed, submitted to NCHS and processed for reporting purposes.
Data Table


Additional NCHS mortality surveillance information: Surveillance Methods | Provisional Death Counts for COVID-19

View Page In:pdf icon 10 Pages, 2 MB
Page last reviewed: April 24, 2020
Content source: National Center for Immunization and Respiratory Diseases (NCIRD), Division of Viral Diseases

https://www.cdc.gov/coronavirus/2019...iew/index.html
 
COVIDView.jpg
COVIDView Weekly Summary


Print Page
Updated May 1, 2020

Download Weekly Summary pdf icon[42 Pages, 2 MB]

Key Updates for Week 17, ending April 25, 2020

Nationally, levels of influenza-like illness (ILI) declined again this week. They have been below the national baseline for two weeks but remain elevated in the northeastern and northwestern part of the country. Levels of laboratory confirmed SARS-CoV-2 activity remained similar or decreased compared to last week. Mortality attributed to COVID-19 decreased compared to last week but remains significantly elevated and may increase as additional death certificates are counted.

Virus
Public Health, Commercial and Clinical Laboratories
The national percentage of respiratory specimens testing positive for SARS-CoV-2 at public health, clinical and commercial laboratories remained similar or decreased from week 16 to week 17. Percentages by type of laboratory:
  • Public health laboratories – decreased from 19.4% during week 16 to 17.1% during week 17;
  • Clinical laboratories – remained similar with 10.9% during week 16 and 11.0% during week 17;
  • Commercial laboratories – decreased from 19.5% during week 16 to 16.4% during week 17.
Outpatient and Emergency Department Visits
Outpatient Influenza-Like Illness Network (ILINet) and National Syndromic Surveillance Program (NSSP)
Two indicators from existing surveillance systems are being used to track outpatient or emergency department (ED) visits for illness with symptoms compatible with COVID-19.
  • Nationally, the percentages of visits for ILI and COVID-19-like illness (CLI) decreased compared to last week. Levels of ILI are now below baseline for the second week.
Recent changes in health care seeking behavior are likely affecting data reported from both networks, making it difficult to draw further conclusions at this time. Tracking these systems moving forward will give additional insight into illness related to COVID-19.

Severe Disease
Hospitalizations
Cumulative COVID-19-associated hospitalization rates since March 1, 2020, are updated weekly. The overall cumulative hospitalization rate is 40.4 per 100,000, with the highest rates in people 65 years and older (131.6 per 100,000) and 50-64 years (63.7 per 100,000).

Mortality
Based on death certificate data, the percentage of deaths attributed to pneumonia, influenza or COVID-19 (PIC) decreased from 23.6% during week 16 to 14.6% during week 17 but remained significantly above baseline. This is the second week of declines in this indicator, but this percentage may change as death certificates representing recent deaths are processed.

All data are preliminary and may change as more reports are received.

A description of the surveillance systems summarized in COVIDView, including methodology and detailed descriptions of each data component, is available on the surveillance methods page.

Key Points
  • Nationally, the percentage of laboratory specimens testing positive for SARS-CoV-2 remained similar, or decreased, compared to last week.
  • Nationally, visits to outpatient providers and emergency departments (EDs) for illnesses with symptoms consistent with COVID-19 continued to decline and are below baseline nationally and in many regions of the country. They remain elevated in the northeast and northwest.
    • The decrease in the percentage of people presenting for care with ILI and CLI may be due to a decline in COVID-19 illness. Reported levels of activity may be decreasing because of widespread adoption of social distancing efforts and changes in healthcare seeking behavior.
    • Little influenza virus activity has been reported in recent weeks.
  • The overall cumulative COVID-19 associated hospitalization rate is 40.4 per 100,000, with the highest rates in people 65 years and older (131.6 per 100,000) and 50-64 years (63.7 per 100,000).
    • Hospitalization rates for COVID-19 in adults (18-64 years) are higher than hospitalization rates for influenza at comparable time points* during the past 5 influenza seasons.
    • For people 65 years and older, current COVID-19 hospitalization rates are similar to those observed during comparable time points* during recent high severity influenza seasons.
    • For children (0-17 years), COVID-19 hospitalization rates are much lower than influenza hospitalization rates during recent influenza seasons.
  • Based on death certificate data, the percentage of deaths attributed to pneumonia, influenza or COVID-19 (PIC) decreased from 23.6% during week 16 to 14.6% during week 17 which is still significantly above baseline. This is the second week of decline in this indicator, but the percentage remains high compared with any influenza season. The percentage may change as additional death certificates for deaths during recent weeks are processed.
  • Declines in some key indicators used to track COVID-19 from one week to the next could change as additional data are received but also may be a result of widespread social distancing measures.
*Number of weeks since 10% of specimens tested positive for SARS-CoV-2 and influenza, respectively.
...
https://www.cdc.gov/coronavirus/2019...iew/index.html
 
COVIDView.jpg
COVIDView Weekly Summary


Print Page
Updated May 8, 2020

Download Weekly Summary pdf icon[43 Pages, 2 MB]

Key Updates for Week 18, ending May 2, 2020

Nationally, levels of influenza-like illness (ILI) and COVID-19-like illness (CLI) and the percentage of specimens testing positive for SARS-CoV-2, the virus that causes COVID-19, continues to decline. Mortality attributed to COVID-19 also decreased compared to last week but remains elevated above baseline and may increase as additional death certificates are counted.

Virus
Public Health, Commercial and Clinical Laboratories
The national percentage of respiratory specimens testing positive for SARS-CoV-2 at public health, clinical and commercial laboratories decreased from week 17 to week 18. Percentages by type of laboratory:
  • Public health laboratories – decreased from 17.7% during week 17 to 13.2% during week 18;
  • Clinical laboratories – decreased from 10.3% during week 17 to 9.0% during week 18;
  • Commercial laboratories – decreased from 15.9% during week 17 to 13.2% during week 18.
Outpatient and Emergency Department Visits
Outpatient Influenza-Like Illness Network (ILINet) and National Syndromic Surveillance Program (NSSP)
Two indicators from existing surveillance systems are being used to track outpatient or emergency department (ED) visits for illness with symptoms compatible with COVID-19.
  • Nationally, the percentages of visits for ILI and COVID-19-like illness (CLI) decreased compared to last week. Levels of ILI are now below baseline nationally for the second week and in all 10 surveillance regions.
Recent changes in health care seeking behavior, including increasing use of telemedicine, recommendations to limit emergency department (ED) visits to severe illnesses, and increased practice of social distancing, are likely affecting data reported from both networks, making it difficult to draw further conclusions at this time. Tracking these systems moving forward will give additional insight into illness related to COVID-19.

Severe Disease
Hospitalizations
Cumulative COVID-19-associated hospitalization rates since March 1, 2020, are updated weekly. The overall cumulative hospitalization rate is 50.3 per 100,000, with the highest rates in people 65 years and older (162.2 per 100,000) and 50-64 years (79.0 per 100,000).

Mortality
Based on death certificate data, the percentage of deaths attributed to pneumonia, influenza or COVID-19 (PIC) decreased from 21.0% during week 17 to 10.6% during week 18 but remained above baseline. This is the third week of a stable or declining percentage of deaths due to PIC, but this percentage may change as death certificates representing recent deaths are processed.

All data are preliminary and may change as more reports are received.

A description of the surveillance systems summarized in COVIDView, including methodology and detailed descriptions of each data component, is available on the surveillance methods page.

Key Points
  • Nationally, the percentages of laboratory specimens testing positive for SARS-CoV-2 decreased compared to last week.
  • Nationally, visits to outpatient providers and emergency departments (EDs) for illnesses with symptoms consistent with COVID-19 continued to decline and are below baseline nationally and in all regions of the country.
    • The decrease in the percentage of people presenting for care with ILI and CLI may be due to a decline in COVID-19 illness, which could be in part a result of widespread adoption of social distancing in addition to changes in healthcare seeking behavior.
    • There has been very little influenza virus activityin recent weeks.
  • The overall cumulative COVID-19 associated hospitalization rate is 50.3 per 100,000, with the highest rates in people aged 65 years and older (162.2 per 100,000) and 50-64 years (79.0 per 100,000). Hospitalization rates are cumulative and expected to increase as the COVID-19 pandemic continues.
    • Hospitalization rates for COVID-19 in adults (18-64 years) are already higher than hospitalization rates for influenza at comparable time points* during the past 5 influenza seasons.
    • For people 65 years and older, current COVID-19 hospitalization rates are within ranges observed during comparable time points* in recent influenza seasons.
    • For children (0-17 years), COVID-19 hospitalization rates are much lower than influenza hospitalization rates during recent influenza seasons.
  • Based on death certificate data, the percentage of deaths attributed to pneumonia, influenza or COVID-19 (PIC) decreased from 21.0% during week 17 to 10.6% during week 18 but remained above baseline. This is the third week during which a declining percentage of deaths due to PIC has been seen, but the percentage remains high compared with any influenza season. The percentage may change as additional death certificates for deaths during recent weeks are processed.
*Number of weeks since 10% of specimens tested positive for SARS-CoV-2 and influenza, respectively.
...
https://www.cdc.gov/coronavirus/2019...iew/index.html
 
COVIDView.jpg
COVIDView: A Weekly Surveillance Summary of U.S. COVID-19 Activity


Print Page
Updated May 15, 2020

Download Weekly Summary pdf icon[46 Pages, 2 MB]
Key Updates for Week 19, ending May 9, 2020


Nationally, levels of influenza-like illness (ILI) and COVID-19-like illness (CLI) and the percentage of specimens testing positive for SARS-CoV-2, the virus that causes COVID-19, continue to decline. Mortality attributed to COVID-19 also decreased compared to last week but remains elevated above baseline and may increase as additional death certificates are counted.
Virus

Public Health, Commercial and Clinical Laboratories


The national percentage of respiratory specimens testing positive for SARS-CoV-2 at public health, clinical and commercial laboratories decreased from week 18 to week 19. Percentages by type of laboratory:
  • Public health laboratories – decreased from 13.1% during week 18 to 11.8% during week 19;
  • Clinical laboratories – decreased from 8.4% during week 18 to 6.9% during week 19;
  • Commercial laboratories – decreased from 13.0% during week 18 to 10.2% during week 19.
Outpatient and Emergency Department Visits

Outpatient Influenza-Like Illness Network (ILINet) and National Syndromic Surveillance Program (NSSP)


Two indicators from existing surveillance systems are being used to track outpatient or emergency department (ED) visits for illness with symptoms compatible with COVID-19.
  • Nationally, the percentages of visits for ILI and CLI decreased compared to last week. Levels of ILI are now below baseline nationally for the third week and in all 10 surveillance regions.
Recent changes in health care seeking behavior, including increasing use of telemedicine, recommendations to limit emergency department (ED) visits to severe illnesses, and increased practice of social distancing, are likely affecting data reported from both networks, making it difficult to draw further conclusions at this time. Tracking these systems moving forward will give additional insight into illness related to COVID-19.
Severe Disease

Hospitalizations


Cumulative COVID-19-associated hospitalization rates since March 1, 2020, are updated weekly. The overall cumulative hospitalization rate is 60.5 per 100,000, with the highest rates in people aged 65 years and older (192.4 per 100,000) and 50-64 years (94.4 per 100,000).
Mortality


Based on death certificate data, the percentage of deaths attributed to pneumonia, influenza or COVID-19 (PIC) decreased from 17.8% during week 18 to 12.8% during week 19 but remained above baseline. This is the third week of a declining percentage of deaths due to PIC, but this percentage may change as more death certificates are processed, particularly for recent weeks.

All data are preliminary and may change as more reports are received.

A description of the surveillance systems summarized in COVIDView, including methodology and detailed descriptions of each data component, is available on the surveillance methods page.
Key Points
  • Nationally, the percentages of laboratory specimens testing positive for SARS-CoV-2 decreased compared to last week.
    • While the number of specimens from children <18 years of age tested is low (<5% of all specimens tested in public health and commercial laboratories), the percentage of these testing positive for SARS-CoV-2 in this age group has either trended upward or remained relatively stable in recent weeks. Other age groups have seen declines in percent positivity during the same time period.
  • Nationally, visits to outpatient providers and emergency departments (EDs) for illnesses with symptoms consistent with COVID-19 continued to decline. Outpatient ILI visits are below baseline nationally and in all regions of the country.
    • The decrease in the percentage of people presenting for care with ILI and CLI may be due to a decline in COVID-19 illness, which could be in part a result of widespread adoption of social distancing in addition to changes in healthcare seeking behavior.
    • There has been very little influenza virus activity in recent weeks.
  • The overall cumulative COVID-19 associated hospitalization rate is 60.5 per 100,000, with the highest rates in people 65 years of age and older (192.4 per 100,000) and 50-64 years (94.4 per 100,000). Hospitalization rates are cumulative and will increase as the COVID-19 pandemic continues.
    • Hospitalization rates for COVID-19 in adults (18-64 years) are already higher than hospitalization rates for influenza at comparable time points* during the past 5 influenza seasons.
    • For people 65 years and older, current COVID-19 hospitalization rates are within ranges of influenza hospitalization rates observed at comparable time points* during recent influenza seasons.
    • For children (0-17 years), COVID-19 hospitalization rates are much lower than influenza hospitalization rates at comparable time points* during recent influenza seasons.
  • Based on death certificate data, the percentage of deaths attributed to pneumonia, influenza or COVID-19 (PIC) decreased from 17.8% during week 18 to 12.8% during week 19, but remained above baseline. This is the third week during which a declining percentage of deaths due to PIC has been seen, but the percentage remains high compared with any influenza season. The percentage may change as additional death certificates for deaths during recent weeks are processed.
*Number of weeks since 10% of specimens tested positive for SARS-CoV-2 and influenza, respectively.
National10.2Declining (5 weeks)1.2BelowDeclining (7 weeks)2.8Declining (5 weeks)12.8AboveDeclining (3 weeks)
Region 114.0Declining (4 weeks)1.4BelowDeclining (7 weeks)4.7Declining (4 weeks)24.2AboveDeclining (2 weeks)
Region 213.9Declining (5 weeks)2.0BelowDeclining (6 weeks)3.8Declining (5 weeks)30.0AboveDeclining (3 weeks)
Region 314.6Declining (3 weeks)1.4BelowDeclining (7 weeks)4.0Declining (4 weeks)13.1AboveDeclining (3 weeks)
Region 46.6Declining (6 weeks)0.9BelowDeclining (7 weeks)1.8Declining (6 weeks)7.2AboveDeclining (4 weeks)
Region 510.8Declining (2 weeks)1.2BelowDeclining (7 weeks)3.7Declining (5 weeks)9.2AboveDeclining (3 weeks)
Region 67.1Declining (5 weeks)1.4BelowDeclining (7 weeks)2.1Declining (6 weeks)7.4AboveDeclining (4 weeks)
Region 712.0Declining (2 weeks)0.6BelowDeclining (1 week)1.6Declining (7 weeks)9.1AboveDeclining (3 weeks)
Region 87.2Increasing (1 week)0.8BelowDeclining (8 weeks)3.0Declining (6 weeks)5.0BelowDeclining (2 weeks)
Region 97.3Declining (3 weeks)1.2BelowNo change2.5Declining (7 weeks)7.4AboveDeclining (3 weeks)
Region 105.0Declining (3 weeks)1.1BelowDeclining (7 weeks)1.6Declining (7 weeks)

[TD="colspan: 3"]Insufficient Data for Week 19[/TD]
* Public health, clinical and commercial laboratory data combined.
U.S. Virologic Surveillance


The number of specimens tested for SARS-CoV-2 and reported to CDC by public health laboratories and a subset of clinical and commercial laboratories in the United States are summarized below. At this point in the outbreak, all laboratories are performing primary diagnostic functions; therefore, the percentage of specimens testing positive across laboratory types can be used to monitor trends in COVID-19 activity. As the outbreak progresses, it is possible that different types of laboratories will take on different roles, and the data interpretation may need to change. The lower percentage of specimens testing positive in clinical laboratories compared to public health and commercial laboratories may be influenced by COVID-19 activity in areas with reporting laboratories and by larger proportions of specimens obtained from children tested in these laboratories.
955,7146,012,947
131,841836,543
81,269494,880
742,6044,681,524
97,237 (10.1%)945,395 (15.7%)
15,501 (11.8%)124,473 (14.9%)
5,641 (6.9%)45,312 (9.2%)
76,095 (10.2%)775,610 (16.6%)
* Commercial and clinical laboratory data represents select laboratories and does not capture all tests performed in the United States.
Public Health Laboratories


resize iconView LargerView Data Table

Clinical Laboratories


resize iconView LargerView Data Table

Commercial Laboratories


resize iconView Larger


* Commercial laboratories began testing for SARS-CoV-2 in early March, but the number and geographic distribution of reporting commercial laboratories became stable enough to calculate a weekly percentage of specimens testing positive as of March 29, 2020.
View Data Table


Additional virologic surveillance information: Surveillance Methods


Outpatient/Emergency Department Illness


Two syndromic surveillance systems are being used to monitor trends in outpatient and emergency department visits that may be associated with COVID-19. Each system monitors a slightly different syndrome, and together these systems provide a more comprehensive picture of mild to moderate COVID-19 illness than either would individually. Both systems are currently being affected by recent changes in healthcare seeking behavior, including increased use of telemedicine, recommendations to limit emergency department (ED) visits to severe illnesses, and increased practice of social distancing. These changes affect the numbers of people and their reasons for seeking care in the outpatient and ED settings.
ILINet


The U.S. Outpatient Influenza-like Illness Surveillance Network (ILINet) provides data on visits for influenza-like illness (ILI) (fever [≥100[SUP]○[/SUP]F] and cough and/or sore throat) to approximately 2,600 primary care providers, emergency departments and urgent care centers in all 50 states, Puerto Rico, the District of Columbia and the U.S. Virgin Islands. Mild COVID-19 illness presents with symptoms similar to ILI, so ILINet is being used to track trends of mild to moderate COVID-19 illness and allows for comparison with prior influenza seasons.

Nationwide during week 19, 1.2% of patient visits reported through ILINet were due to ILI. This percentage is below the national baseline of 2.4% and represents the seventh week of decline after three weeks of increase beginning in early March. The percentage of visits for ILI decreased in all age groups. Nationally, laboratory-confirmed influenza activity as reported by clinical laboratories has decreased to levels usually seen in summer months which, along with changes in healthcare seeking behavior and the impact of social distancing, is likely contributing to the decrease in ILI activity.

resize iconView Larger


* Age-group specific percentages should not be compared to the national baseline.

On a regional levelexternal icon, the percentage of outpatient visits for ILI ranged from 0.6% to 2.0% during week 19. Compared to week 18, the percent of outpatient visits for ILI was unchanged in region 9, but decreased in all other regions, and all ten regions are below their region-specific baselines.
Overall Percentage of Visits for ILI | Age Group ILI Data

ILI Activity Levels


Data collected in ILINet are used to produce a measure of ILI activity for all 50 states, Puerto Rico, the District of Columbia and New York City. The mean reported percentage of visits due to ILI for the current week is compared to the mean reported during non-influenza weeks, and the activity levels correspond to the number of standard deviations below, at or above the mean.

The number of jurisdictions at each activity level during week 19 and the change compared to the previous week are summarized in the table below and shown in the following maps. The decreasing percentage of visits for ILI described above are reflected in this week’s ILI activity levels.
Activity Level
Week 19
(Week ending May 9, 2020)
Compared to Previous Week
Very High0No change
High1-1
Moderate2No change
Low2-2
Minimal48+3
Insufficient Data*1No change

[TD="colspan: 2"] Number of Jurisdictions [/TD]

*Data collected in ILINet may disproportionally represent certain populations within a state and may not accurately depict the full picture of influenza activity for the whole state. Differences in the data presented here by CDC and independently by some state health departments likely represent differing levels of data completeness with data presented by the state likely being the more complete.
National Syndromic Surveillance Program (NSSP): Emergency Department (ED) Visits


NSSP is a collaboration among CDC, federal partners, local and state health departments and academic and private sector partners to collect, analyze and share electronic patient encounter data received from multiple healthcare settings. To track trends of potential COVID-19 visits, visits for COVID-19-like illness (CLI) (fever and cough or shortness of breath or difficulty breathing or presence of a coronavirus diagnosis code) and ILI to a subset of emergency departments in 47 states are being monitored.

Nationwide during week 19, 2.8% of emergency department visits captured in NSSP were due to CLI and 0.9% were due to ILI. This is the seventh week of decline in percentage of visits for ILI and the sixth week of stable or declining percentage of visits for CLI. All 10 HHS regionsexternal icon experienced a decline in percentage of visits for ILI and CLI.

resize iconView LargerView Data Table


Additional information about medically attended outpatient and emergency department visits for ILI and CLI: Surveillance Methods


Hospitalizations


The COVID-19-Associated Hospitalization Surveillance Network (COVID-NET) conducts population-based surveillance for laboratory-confirmed COVID-19-associated hospitalizations in select counties participating in the Emerging Infections Program (EIP) and states participating in the Influenza Hospitalization Surveillance Project (IHSP). COVID-NET-estimated hospitalization rates are updated weekly.

A total of 19,637 laboratory-confirmed COVID-19-associated hospitalizations were reported by sites between March 1, 2020, and May 9, 2020. The overall cumulative hospitalization rate was 60.5 per 100,000 population. Among the 0-4 years, 5-17 years, 18-49 years, 50-64 years, and ≥ 65 years age groups, the highest rate of hospitalization is among adults aged 65 years (192.4 per 100,000), followed by adults aged 50-64 years (94.4 per 100,000) and adults aged 18-49 years (32.6 per 100,000).
lab-confirmed-hospitalizations.gif

resize iconView Larger
Within the 18-49 years and ≥ 65 years age groups, the hospitalization rates increased with increasing age.
Overall60.5
0-4 years3.0
5-17 years1.4
18-49 years32.6
18-29 years15.4
30-39 years32.0
40-49 years55.6
50-64 years94.4
65+ years192.4
65-74 years141.2
75-84 years232.0
85+ years352.0
Among 13,441 cases with information on race/ethnicity, 36.5% were non-Hispanic white, 40.0% were non-Hispanic black, 14.2% were Hispanic, and 9.3% were other race.
Overall0-4 years5-17 years18-49 years50-64 years65+ years
RaceN (%)N (%)N (%)N (%)N (%)N (%)
Cases with available race1,3441 (68.4)29 (50.0)46 (62.2)2,987 (63.6)3,947 (67.5)6,432 (71.8)
Non-Hispanic White4,908 (36.5)7 (24.1)8 (17.4)568 (19.0)1,159 (29.4)3,166 (49.2)
Non-Hispanic Black5,372 (40.0)9 (31.0)16 (34.8)1,165 (39.0)1,780 (45.1)2,402 (37.3)
Hispanic1,906 (14.2)7 (24.1)19 (41.3)898 (30.1)616 (15.6)366 (5.7)
Other[SUP]1[/SUP]1,255 (9.3)6 (20.7)3 (6.5)356 (11.9)392 (9.9)498 (7.7)
Cases missing race[SUP]2[/SUP]6,196 (31.6)29 (50.0)28 (37.8)1,708 (36.4)1,904 (32.5)2,527 (28.2)
[SUP]1[/SUP] Other includes data on persons who are Asian, American Indian/Alaskan Native, Multi-race, and persons for whom race/ethnicity data is unknown; [SUP]2[/SUP] Cases with missing race include those for whom chart reviews have not yet been conducted to ascertain race; these data will be updated as additional race data become available

Among 3,734 hospitalized adults with information on underlying medical conditions, 91.7% had at least one reported underlying medical condition, the most commonly reported were hypertension, obesity, chronic metabolic disease, and cardiovascular disease.
lab-confirmed-hospitalizations-underlying.gif

resize iconView Larger


Additional hospitalization surveillance information: Surveillance Methods | Additional rate data | Additional demographic and clinical data


Mortality Surveillance


The National Center for Health Statistics (NCHS) collects death certificate data from vital statistics offices for all deaths occurring in the United States. Based on death certificate data available on May 14, 2020, 12.8% of all deaths occurring during the week ending May 9, 2020 (week 19) were due to pneumonia, influenza or COVID-19 (PIC). This is the third week of a declining percentage of deaths due to PIC; however, the percentage remains above the epidemic threshold of 6.6% for week 19. Data for recent weeks are incomplete, and the PIC percentage may increase as more death certificates representing deaths during these weeks are filed.

Weekly mortality surveillance data include a combination of machine coded and manually coded causes of death collected from death certificates. Percentages of deaths due to PIC are higher among manually coded records than more rapidly available machine coded records. Due to the additional time needed for manual coding, the initially reported PIC percentages may be lower than percentages calculated from final data. Given the amount of manually coded data available for deaths occurring during week 19, it is possible that when additional death certificates are processed, the week 19 PIC percentage may be greater than what was reported for week 18.

resize iconView Larger


*Data during recent weeks are incomplete because of the lag in time between when the death occurred and when the death certificate is completed, submitted to NCHS and processed for reporting purposes.
View Data Table


Additional NCHS mortality surveillance information: Surveillance Methods | Provisional Death Counts for COVID-19

View Page In:pdf icon 46 Pages, 2 MB
Page last reviewed: May 15, 2020
Content source: National Center for Immunization and Respiratory Diseases (NCIRD), Division of Viral DiseaseshomeCoronavirus Disease 2019 (COVID-19)
email_03Get Email Updates

To receive email updates about COVID-19, enter your email address:
Email Address
What's this?
Submit
Spanish Resources
https://www.cdc.gov/coronavirus/2019...iew/index.html
 
Updated May 22, 2020

Download Weekly Summary pdf icon[49 Pages, 3 MB]
Key Updates for Week 20, ending May 16, 2020


Nationally, levels of influenza-like illness (ILI) and COVID-19-like illness (CLI) and the percentage of specimens testing positive for SARS-CoV-2, the virus that causes COVID-19, continue to decline. Mortality attributed to COVID-19 also decreased compared to last week but remains elevated above baseline and may increase as additional death certificates are processed.
Virus

Public Health, Commercial and Clinical Laboratories


The national percentage of respiratory specimens testing positive for SARS-CoV-2 at public health, clinical and commercial laboratories decreased from week 19 to week 20. Percentages by type of laboratory:
  • Public health laboratories – decreased from 10.7% during week 19 to 8.5% during week 20;
  • Clinical laboratories – decreased from 6.4% during week 19 to 5.8% during week 20;
  • Commercial laboratories – decreased from 9.9 % during week 19 to 7.9% during week 20.
Outpatient and Emergency Department Visits

Outpatient Influenza-Like Illness Network (ILINet) and National Syndromic Surveillance Program (NSSP)


Two indicators from existing surveillance systems are being used to track outpatient or emergency department (ED) visits for illness with symptoms compatible with COVID-19.
  • Nationally, the percentages of visits for ILI and CLI decreased, compared to last week. Levels of ILI are below baseline nationally for the fifth week and in all 10 surveillance regions.
Recent changes in health care seeking behavior, including increasing use of telemedicine, recommendations to limit emergency department (ED) visits to severe illnesses, and increased practice of social distancing, are likely affecting data reported from both networks, making it difficult to draw further conclusions at this time. Tracking these systems moving forward will give additional insight into illness related to COVID-19.
Severe Disease

Hospitalizations


Cumulative COVID-19-associated hospitalization rates since March 1, 2020, are updated weekly. The overall cumulative hospitalization rate is 67.9 per 100,000, with the highest rates in people aged 65 years and older (214.4 per 100,000) and 50-64 years (105.9 per 100,000).
Mortality


Based on death certificate data, the percentage of deaths attributed to pneumonia, influenza or COVID-19 (PIC) decreased from 18.5% during week 19 to 12.0% during week 20 but remained above baseline. This is the fourth week of a declining percentage of deaths due to PIC, but this percentage may change as more death certificates are processed, particularly for recent weeks.

All data are preliminary and may change as more reports are received.

A description of the surveillance systems summarized in COVIDView, including methodology and detailed descriptions of each data component, is available on the surveillance methods page.
Key Points
  • Nationally, the percentages of laboratory specimens testing positive for SARS-CoV-2 decreased compared to last week.
    • While the number of specimens from children <18 years of age tested is low (<5% of all specimens tested in public health and commercial laboratories), the percentage of these testing positive for SARS-CoV-2 in this age group has either trended upward or remained relatively stable in recent weeks. Other age groups have seen declines in percent positivity during the same time period.
  • Nationally, visits to outpatient providers and emergency departments (EDs) for illnesses with symptoms consistent with COVID-19 continued to decline. Outpatient ILI visits are below baseline nationally and in all regions of the country.
    • The decrease in the percentage of people presenting for care with ILI and CLI may be due to a decline in COVID-19 illness, which could be in part a result of widespread adoption of social distancing in addition to changes in healthcare seeking behavior.
    • There has been very little influenza virus activity in recent weeks.
  • The overall cumulative COVID-19 associated hospitalization rate is 67.9 per 100,000, with the highest rates in people 65 years of age and older (214.4 per 100,000) followed by people 50-64 years (105.9 per 100,000). Hospitalization rates are cumulative and will increase as the COVID-19 pandemic continues.
    • Hospitalization rates for COVID-19 in adults (18-64 years) are higher than hospitalization rates for influenza at comparable time points* during the past 5 influenza seasons.
    • For people 65 years and older, current COVID-19 hospitalization rates are within ranges of influenza hospitalization rates observed at comparable time points* during recent influenza seasons.
    • For children (0-17 years), COVID-19 hospitalization rates are much lower than influenza hospitalization rates at comparable time points* during recent influenza seasons.
  • Based on death certificate data, the percentage of deaths attributed to pneumonia, influenza or COVID-19 (PIC) decreased from 18.5% during week 19 to 12.0% during week 20 but remained above baseline. This is the fourth week during which a declining percentage of deaths due to PIC has been recorded, but the percentage remains high compared with any influenza season. The percentage may change as additional death certificates for deaths during recent weeks are processed.
*Number of weeks since 10% of specimens tested positive for SARS-CoV-2 and influenza, respectively.
National7.9Declining (6 weeks)1.1BelowDeclining (8 weeks)2.5Declining (6 weeks)12.0AboveDeclining (4 weeks)
Region 19.4Declining (5 weeks)1.2BelowDeclining (8 weeks)4.0Declining (5 weeks)25.5AboveDeclining (4 weeks)
Region 29.4Declining (6 weeks)1.8BelowDeclining (7 weeks)2.9Declining (6 weeks)25.1AboveDeclining (4 weeks)
Region 312.0Declining (4 weeks)1.2BelowDeclining (8 weeks)3.4Declining (5 weeks)13.8AboveDeclining (2 weeks)
Region 45.8Declining (7 weeks)0.8BelowNo change1.8Declining (7 weeks)6.2AboveDeclining (4 weeks)
Region 57.8Declining (3 weeks)1.3BelowIncreasing (1 week)3.3Declining (6 weeks)8.8AboveDeclining (4 weeks)
Region 67.0Declining (6 weeks)1.2BelowDeclining (8 weeks)2.0Declining (7 weeks)6.0BelowDeclining (5 weeks)
Region 79.5Declining (3 weeks)0.6BelowNo change1.5Declining (7 weeks)7.2AboveDeclining (1 week)
Region 85.4Declining (3 weeks)0.7BelowDeclining (9 weeks)2.8Declining (7 weeks)6.2BelowDeclining (3 weeks)
Region 96.0Declining (4 weeks)0.8BelowDeclining (8 weeks)2.4Declining (8 weeks)7.2AboveDeclining (4 weeks)
Region 104.4Declining (4 weeks)1.1BelowNo change1.5Declining (8 weeks)

[TD="colspan: 3"]Insufficient Data for Week 20[/TD]
* Public health, clinical and commercial laboratory data combined.
U.S. Virologic Surveillance


The number of specimens tested for SARS-CoV-2 using a molecular assay and reported to CDC by public health laboratories and a subset of clinical and commercial laboratories in the United States are summarized below. All laboratories are performing primary diagnostic functions; therefore, the percentage of specimens testing positive across laboratory types can be used to monitor overall trends in COVID-19 activity. As the outbreak progresses, it is possible that different types of laboratories will take on different roles, and the data interpretation may need to change. The lower percentage of specimens testing positive in clinical laboratories compared to public health and commercial laboratories may be influenced by COVID-19 activity in areas with reporting laboratories and by larger proportions of specimens obtained from children tested in these laboratories
1,133,4207,362,526
163,9051,031,408
85,445626,747
884,0705,704,371
88,975 (7.9%)1,049,239 (14.3%)
13,912 (8.5%)139,682 (13.5%)
4,983 (5.8%)53,424 (8.5%)
70,080 (7.9%)856,133 (15.0%)
* Commercial and clinical laboratory data represents select laboratories and does not capture all tests performed in the United States.
Public Health Laboratories


resize iconView LargerView Data Table

Clinical Laboratories


resize iconView LargerView Data Table

Commercial Laboratories


resize iconView Larger


* Commercial laboratories began testing for SARS-CoV-2 in early March, but the number and geographic distribution of reporting commercial laboratories became stable enough to calculate a weekly percentage of specimens testing positive as of March 29, 2020.
View Data Table


Additional virologic surveillance information: Surveillance Methods


Outpatient/Emergency Department Illness


Two syndromic surveillance systems are being used to monitor trends in outpatient and emergency department visits that may be associated with COVID-19 illness. Each system monitors a slightly different syndrome, and together these systems provide a more comprehensive picture of mild to moderate COVID-19 illness than either would individually. Both systems are currently being affected by recent changes in healthcare seeking behavior, including increased use of telemedicine, compliance with recommendations to limit emergency department (ED) visits to severe illnesses, and increased practice of social distancing. These changes affect the numbers of people seeking care in the outpatient and ED settings and their reasons for doing so.
ILINet


The U.S. Outpatient Influenza-like Illness Surveillance Network (ILINet) provides data on visits for influenza-like illness (ILI) (fever [≥100[SUP]○[/SUP]F] and cough and/or sore throat) to approximately 2,600 primary care providers, emergency departments and urgent care centers in all 50 states, Puerto Rico, the District of Columbia and the U.S. Virgin Islands. Mild COVID-19 illness presents with symptoms similar to ILI, so ILINet is being used to track trends of mild to moderate COVID-19 illness and allows for comparison with prior influenza seasons.

Nationwide during week 20, 1.1% of patient visits reported through ILINet were due to ILI. This percentage is low and below the national baseline of 2.4% and represents the eighth week of decline after three weeks of increase beginning in early March. Compared to week 19, the percentage of visits for ILI in week 20 decreased among adults 25 years of age and older, stayed the same in children and adults aged 5-24 years, and increased slightly in children 0-4 years of age. Nationally, laboratory-confirmed influenza activity as reported by clinical laboratories has decreased to levels usually seen during summer months which, along with changes in healthcare seeking behavior and the impact of social distancing, is likely contributing to the decrease in ILI activity.

resize iconView Larger


* Age-group specific percentages should not be compared to the national baseline.

On a regional levelexternal icon, the percentage of outpatient visits for ILI ranged from 0.6% to 1.8% during week 20. Compared to week 19, the percent of outpatient visits for ILI increased slightly in region 5, remained unchanged in regions 4, 7, and 10, and decreased in the remaining 6 regions. All ten regions are below their region-specific baselines.
Overall Percentage of Visits for ILI | Age Group ILI Data

ILI Activity Levels


Data collected in ILINet are used to produce a measure of ILI activity for all 50 states, Puerto Rico, the District of Columbia and New York City. The mean reported percentage of visits due to ILI for the current week is compared to the mean reported during non-influenza weeks, and the activity levels correspond to the number of standard deviations below, at or above the mean.

The number of jurisdictions at each activity level during week 20 and the change compared to the previous week are summarized in the table below and shown in the following maps. The decreasing percentage of visits for ILI described above are reflected in this week’s ILI activity levels.
Activity Level
Week 20
(Week ending May 16, 2020)
Compared to Previous Week
Very High0No change
High1No change
Moderate2No change
Low2-1
Minimal48+1
Insufficient Data*1No change

[TD="colspan: 2"] Number of Jurisdictions [/TD]

*Data collected in ILINet may disproportionally represent certain populations within a state and may not accurately depict the full picture of influenza activity for the whole state. Differences in the data presented here by CDC and independently by some state health departments likely represent differing levels of data completeness with data presented by the state likely being the more complete.
National Syndromic Surveillance Program (NSSP): Emergency Department (ED) Visits


NSSP is a collaboration among CDC, federal partners, local and state health departments and academic and private sector partners to collect, analyze and share electronic patient encounter data received from multiple healthcare settings. To track trends of potential COVID-19 visits, visits for COVID-19-like illness (CLI) (fever and cough or shortness of breath or difficulty breathing or presence of a coronavirus diagnosis code) and ILI to a subset of emergency departments in 47 states are being monitored.

Nationwide during week 20, 2.5% of emergency department visits captured in NSSP were due to CLI and 0.8% were due to ILI. This is the eighth week of decline in percentage of visits for ILI and the sixth week of declining percentage of visits for CLI. Compared to week 19, all 10 HHS regionsexternal icon had declining percentages of visits for CLI during week 20; 7 regions also had declining percentages of visits for ILI while regions 4, 6 and 7 had no change in percent of visits for ILI from week 19 to week 20.

resize iconView LargerView Data Table


Additional information about medically attended outpatient and emergency department visits for ILI and CLI: Surveillance Methods


Hospitalizations


The COVID-19-Associated Hospitalization Surveillance Network (COVID-NET) conducts population-based surveillance for laboratory-confirmed COVID-19-associated hospitalizations in select counties participating in the Emerging Infections Program (EIP) and states participating in the Influenza Hospitalization Surveillance Project (IHSP). COVID-NET-estimated hospitalization rates are updated weekly.

A total of 22,060 laboratory-confirmed COVID-19-associated hospitalizations were reported by sites between March 1, 2020, and May 16, 2020. The overall cumulative hospitalization rate was 67.9 per 100,000 population. Among the 0-4 years, 5-17 years, 18-49 years, 50-64 years, and ≥ 65 years age groups, the highest rate of hospitalization is among adults aged 65 years (214.4 per 100,000), followed by adults aged 50-64 years (105.9 per 100,000) and adults aged 18-49 years (37.2 per 100,000).
lab-confirmed-hospitalizations.gif

resize iconView Larger
Within the 18-49 years and ≥ 65 years age groups, the hospitalization rates increased with increasing age.
Overall67.9
0-4 years3.5
5-17 years1.7
18-49 years37.2
18-29 years17.8
30-39 years36.8
40-49 years62.8
50-64 years105.9
65+ years214.4
65-74 years156.6
75-84 years258.3
85+ years396.4
Among 18,136 cases with information on race/ethnicity, 35.8% were non-Hispanic white, 34.9% were non-Hispanic black, 17.4% were Hispanic, and 11.8% were other race.
Overall0-4 years5-17 years18-49 years50-64 years65+ years
RaceN (%)N (%)N (%)N (%)N (%)N (%)
Cases with available race18,136 (82.2)52 (76.5)72 (79.1)4,170 (77.9)5,304 (80.8)8,538 (85.5)
Non-Hispanic White6,495 (35.8)11 (21.2)10 (13.9)760 (18.2)1,533 (28.9)4,181 (49.0)
Non-Hispanic Black6,331 (34.9)10 (19.2)24 (33.3)1,362 (32.7)2,108 (39.7)2,827 (33.1)
Hispanic3,162 (17.4)22 (42.3)32 (44.4)1,451 (34.8)981 (18.5)676 (7.9)
Other[SUP]1[/SUP]2,148 (11.8)9 (17.3)6 (8.3)597 (14.3)682 (12.9)854 (10.0)
Cases missing race[SUP]2[/SUP]3,924 (17.8)16 (23.5)19 (20.9)1,186 (22.1)1,257 (19.2)1,446 (14.5)
[SUP]1[/SUP] Other includes data on persons who are Asian, American Indian/Alaskan Native, Multi-race, and persons for whom race/ethnicity data is unknown; [SUP]2[/SUP] Cases with missing race include those for whom chart reviews have not yet been conducted to ascertain race; these data will be updated as additional race data become available; NH=non-Hispanic

Among 4,247 hospitalized adults with information on underlying medical conditions, 92.1% had at least one reported underlying medical condition, the most commonly reported were hypertension, obesity, chronic metabolic disease, and cardiovascular disease.
lab-confirmed-hospitalizations-underlying.gif

resize iconView Larger


Additional hospitalization surveillance information: Surveillance Methods | Additional rate data | Additional demographic and clinical data


Mortality Surveillance


The National Center for Health Statistics (NCHS) collects death certificate data from vital statistics offices for all deaths occurring in the United States. Based on death certificate data available on May 21, 2020, 12.0% of all deaths occurring during the week ending May 16, 2020 (week 20) were due to pneumonia, influenza or COVID-19 (PIC). This is the fourth week of a declining percentage of deaths due to PIC; however, the percentage remains above the epidemic threshold of 6.5% for week 20 and is high compared to any influenza season. Data for recent weeks are incomplete, and the PIC percentage may increase as more death certificates representing deaths during these weeks are processed.

Weekly mortality surveillance data include a combination of machine coded and manually coded causes of death collected from death certificates. Percentages of deaths due to PIC are higher among manually coded records than more rapidly available machine coded records. Due to the additional time needed for manual coding, the initially reported PIC percentages may be lower than percentages calculated from final data. Given the amount of manually coded data available for deaths occurring during week 20, it is possible that when additional death certificates are processed, the week 20 PIC percentage may be greater than what was reported for week 19.

resize iconView Larger


*Data during recent weeks are incomplete because of the lag in time between when the death occurred and when the death certificate is completed, submitted to NCHS and processed for reporting purposes.
View Data Table


Additional NCHS mortality surveillance information: Surveillance Methods | Provisional Death Counts for COVID-19

View Page In:pdf icon 49 Pages, 3 MB
Page last reviewed: May 22, 2020
Content source: National Center for Immunization and Respiratory Diseases (NCIRD), Division of Viral DiseaseshomeCoronavirus Disease 2019 (COVID-19)
email_03Get Email Updates

To receive email updates about COVID-19, enter your email address:
Email Address
What's this?
Submit
Spanish Resources
https://www.cdc.gov/coronavirus/2019...iew/index.html
 
COVIDView.jpg
COVIDView: A Weekly Surveillance Summary of U.S. COVID-19 Activity


Print Page
Updated May 29, 2020

Download Weekly Summary pdf icon[47 Pages, 2 MB]
Key Updates for Week 21, ending May 23, 2020


Nationally, levels of influenza-like illness (ILI) and COVID-19-like illness (CLI) and the percentage of specimens testing positive for SARS-CoV-2, the virus that causes COVID-19, continue to decline or remain stable. Mortality attributed to COVID-19 also decreased compared to last week but remains elevated above baseline and may increase as additional death certificates are processed.
Virus

Public Health, Commercial and Clinical Laboratories


The national percentage of respiratory specimens testing positive for SARS-CoV-2 at public health, clinical and commercial laboratories decreased from week 20 to week 21; however, percent positivity increased slightly in two regions. National percentages by type of laboratory:
  • Public health laboratories – decreased from 8.4% during week 20 to 7.0% during week 21;
  • Clinical laboratories – decreased from 6.3% during week 20 to 5.6% during week 21;
  • Commercial laboratories – decreased from 7.8 % during week 20 to 6.9% during week 21.
Outpatient and Emergency Department Visits

Outpatient Influenza-Like Illness Network (ILINet) and National Syndromic Surveillance Program (NSSP)


Two surveillance indicators are being used to track outpatient or emergency department (ED) visits for illness with symptoms compatible with COVID-19.
  • Nationally, the percentages of visits for ILI and CLI decreased or remained stable at low levels, compared to last week. Levels of ILI are below baseline nationally for the sixth week and in all 10 surveillance regions for the past four to seven weeks.
Recent changes in health care seeking behavior, including increasing use of telemedicine, recommendations to limit emergency department (ED) visits to severe illnesses, and increased practice of social distancing, are likely affecting data reported from both networks, making it difficult to draw conclusions at this time. Tracking these systems moving forward will give additional insight into illness related to COVID-19.
Severe Disease

Hospitalizations


Cumulative COVID-19-associated hospitalization rates since March 1, 2020, are updated weekly. The overall cumulative COVID-19 hospitalization rate is 73.3 per 100,000, with the highest rates in people aged 65 years and older (229.7 per 100,000) and 50-64 years (113.4 per 100,000).
Mortality


Based on death certificate data, the percentage of deaths attributed to pneumonia, influenza or COVID-19 (PIC) decreased from 15.9% during week 20 to 9.8% during week 21 but remained above baseline. This is the fifth week of a declining percentage of deaths due to PIC, but this percentage may change as more death certificates are processed, particularly for recent weeks.

All data are preliminary and may change as more reports are received.

A description of the surveillance systems summarized in COVIDView, including methodology and detailed descriptions of each data component, is available on the surveillance methods page.
Key Points
  • Nationally, the percentages of laboratory specimens testing positive for SARS-CoV-2 with a molecular assay decreased compared to last week; however, there are two developments in particular worth noting:
    • The percent positivity increased slightly in two HHS surveillance regions (Regions 4 [the southeast] and 10 [the Pacific northwest]).
    • While the number of specimens from children <18 years of age tested is low (<5% of all specimens tested in public health and commercial laboratories), the percentage testing positive for SARS-CoV-2 in this age group has either trended upward or remained relatively stable in recent weeks. Other age groups have seen declines in percent positivity during the same time period.
  • Nationally, visits to outpatient providers and emergency departments (EDs) for illnesses with symptoms consistent with COVID-19 continued to decline or remain stable at low levels. Outpatient ILI visits are below baseline nationally and in all regions of the country.
    • The decrease in the percentage of people presenting for care with ILI and CLI may be due to a decline in COVID-19 illness, which could be in part a result of widespread adoption of social distancing, in addition to decreases in healthcare seeking behavior.
    • There has been very little influenza virus activity in recent weeks.
  • The overall cumulative COVID-19 associated hospitalization rate is 73.3 per 100,000, with the highest rates in people 65 years of age and older (229.7 per 100,000) followed by people 50-64 years (113.4 per 100,000). Hospitalization rates are cumulative and will increase as the COVID-19 pandemic continues.
    • This week’s report presents additional information on racial and ethnic disparities among reported COVID-19 hospitalizations. Non-Hispanic Black and non-Hispanic American Indian/Alaska Native populations have rates approximately 4.5 times that of non-Hispanic Whites, while Hispanic/Latinos have a rate approximately 3.5 times that of non-Hispanic Whites.
    • Cumulative hospitalization rates for COVID-19 in adults (18-64 years) at this time are higher than cumulative end-of-season hospitalization rates for influenza over each of the past 5 influenza seasons.
    • For people 65 years and older, current cumulative COVID-19 hospitalization rates are within ranges of cumulative influenza hospitalization rates observed at comparable time points* during recent influenza seasons.
    • For children (0-17 years), cumulative COVID-19 hospitalization rates are much lower than cumulative influenza hospitalization rates at comparable time points* during recent influenza seasons.
  • Based on death certificate data, the percentage of deaths attributed to pneumonia, influenza or COVID-19 (PIC) decreased from 15.9% during week 20 to 9.8% during week 21 but remained above baseline. This is the fifth week during which a declining percentage of deaths due to PIC has been recorded. The percentage remains above the epidemic threshold, and is now similar to what has been observed at the peak of some influenza seasons. The percentage may change as additional death certificates for deaths during recent weeks are processed.
*Number of weeks since 10% of specimens tested positive for SARS-CoV-2 and influenza, respectively.

U.S. Virologic Surveillance


The number of specimens tested for SARS-CoV-2 using a molecular assay and reported to CDC by public health laboratories and a subset of clinical and commercial laboratories in the United States are summarized below. All laboratories are performing primary diagnostic functions; therefore, the percentage of specimens testing positive across laboratory types can be used to monitor overall trends in COVID-19 activity. As the outbreak progresses, it is possible that different types of laboratories will take on different roles, and the data interpretation may need to change. The lower percentage of specimens testing positive in clinical laboratories compared to public health and commercial laboratories may be influenced by COVID-19 activity in areas with reporting laboratories and by larger proportions of specimens obtained from children tested in these laboratories.
1,171,5468,762,465
182,0091,227,717
72,256740,691
917,2816,794,057
79,898 (6.8%)1,145,733 (13.1%)
12,702 (7.0%)153,579 (12.5%)
4,041 (5.6%)60,520 (8.2%)
63,155 (6.9%)931,634 (13.7%)
* Commercial and clinical laboratory data represents select laboratories and does not capture all tests performed in the United States.
Public Health Laboratories


resize iconView LargerView Data Table

Clinical Laboratories


resize iconView LargerView Data Table

Commercial Laboratories


resize iconView Larger


* Commercial laboratories began testing for SARS-CoV-2 in early March, but the number and geographic distribution of reporting commercial laboratories became stable enough to calculate a weekly percentage of specimens testing positive as of March 29, 2020.
View Data Table


Additional virologic surveillance information: Surveillance Methods


Outpatient/Emergency Department Illness


Two syndromic surveillance systems are being used to monitor trends in outpatient and emergency department visits that may be associated with COVID-19 illness. Each system monitors a slightly different syndrome, and together these systems provide a more comprehensive picture of mild to moderate COVID-19 illness than either would individually. Both systems are currently being affected by recent changes in healthcare seeking behavior, including increased use of telemedicine, compliance with recommendations to limit emergency department (ED) visits to severe illnesses, and increased practice of social distancing. These changes affect the numbers of people seeking care in the outpatient and ED settings and their reasons for doing so.
ILINet


The U.S. Outpatient Influenza-like Illness Surveillance Network (ILINet) provides data on visits for influenza-like illness (ILI) (fever [≥100[SUP]○[/SUP]F] and cough and/or sore throat) to approximately 2,600 primary care providers, emergency departments and urgent care centers in all 50 states, Puerto Rico, the District of Columbia and the U.S. Virgin Islands. Mild COVID-19 illness presents with symptoms similar to ILI, so ILINet is being used to track trends of mild to moderate COVID-19 illness and allows for comparison with prior influenza seasons.

Nationwide during week 21, 1.0% of patient visits reported through ILINet were due to ILI. This percentage is low and below the national baseline of 2.4% and represents the ninth week of decline after three weeks of increase beginning in early March. Compared to week 20, the percentage of visits for ILI in week 21 decreased slightly among all age groups. Nationally, laboratory-confirmed influenza activity as reported by clinical laboratories is at levels usually seen during summer months which, along with changes in healthcare seeking behavior and the impact of social distancing, is likely contributing to the low level of ILI activity.

resize iconView Larger


* Age-group specific percentages should not be compared to the national baseline.

On a regional levelexternal icon, the percentage of outpatient visits for ILI ranged from 0.4% to 1.5% during week 21. Compared to week 20, the percent of outpatient visits for ILI decreased or remained stable at low levels in all ten regions and all regions are below their region-specific baselines.

Note: In response to the COVID-19 pandemic, new sites will be enrolled in ILINet throughout the summer. This will result in an increase in patient visits and the percentage of visits for ILI may change in comparison to previous weeks. During week 21, new sites were added in Regions 1, 4, and 6. While these regions remain below baseline levels for ILI, these system changes should be kept in mind when drawing conclusions from these data. Any changes in ILI due to changes in respiratory virus circulation will be highlighted here.
Overall Percentage of Visits for ILI | Age Group ILI Data

ILI Activity Levels


Data collected in ILINet are used to produce a measure of ILI activity for all 50 states, Puerto Rico, the District of Columbia and New York City. The mean reported percentage of visits due to ILI for the current week is compared to the mean reported during non-influenza weeks, and the activity levels correspond to the number of standard deviations below, at or above the mean.

The number of jurisdictions at each activity level during week 21 and the change compared to the previous week are summarized in the table below and shown in the following maps. The decreasing percentage of visits for ILI described above are reflected in this week’s ILI activity levels.
Activity Level
Week 21
(Week ending May 23, 2020)
Compared to Previous Week
Very High0No change
High1No change
Moderate0-2
Low2No change
Minimal49+1
Insufficient Data2+1

[TD="colspan: 2"] Number of Jurisdictions [/TD]

*Data collected in ILINet may disproportionally represent certain populations within a state and may not accurately depict the full picture of influenza activity for the whole state. Differences in the data presented here by CDC and independently by some state health departments likely represent differing levels of data completeness with data presented by the state likely being the more complete.
National Syndromic Surveillance Program (NSSP): Emergency Department (ED) Visits


NSSP is a collaboration among CDC, federal partners, local and state health departments and academic and private sector partners to collect, analyze and share electronic patient encounter data received from multiple healthcare settings. To track trends of potential COVID-19 visits, visits for COVID-19-like illness (CLI) (fever and cough or shortness of breath or difficulty breathing or presence of a coronavirus diagnosis code) and ILI to a subset of emergency departments in 47 states are being monitored.

Nationwide during week 21, 2.2% of emergency department visits captured in NSSP were due to CLI and 0.7% were due to ILI. This is the ninth week of decline in the percentage of visits for ILI and the seventh week of declining percentage of visits for CLI. Compared to week 20, all 10 HHS regionsexternal icon had declining percentages of visits for CLI during week 21; all 10 regions also had declining or stable percentages of visits for ILI.


Additional information about medically attended outpatient and emergency department visits for ILI and CLI: Surveillance Methods


Hospitalizations


The COVID-19-Associated Hospitalization Surveillance Network (COVID-NET) conducts population-based surveillance for laboratory-confirmed COVID-19-associated hospitalizations in select counties participating in the Emerging Infections Program (EIP) and the Influenza Hospitalization Surveillance Project (IHSP).

A total of 23,811 laboratory-confirmed COVID-19-associated hospitalizations were reported by sites between March 1, 2020, and May 23, 2020. The overall cumulative hospitalization rate was 73.3 per 100,000 population. Among the 0-4 years, 5-17 years, 18-49 years, 50-64 years, and ≥ 65 years age groups, the highest rate of hospitalization is among adults aged 65 years (229.7 per 100,000), followed by adults aged 50-64 years (113.4 per 100,000) and adults aged 18-49 years (41.0 per 100,000).
lab-confirmed-hospitalizations.gif

resize iconView Larger
Within the 18-49 years and ≥ 65 years age groups, the hospitalization rates increased with increasing age.
Overall73.3
0-4 years4.1
5-17 years1.9
18-49 years41.0
18-29 years20.1
30-39 years40.7
40-49 years68.5
50-64 years113.4
65+ years229.7
65-74 years167.6
75-84 years276.2
85+ years426.7
Among the 23,811 laboratory-confirmed COVID-19-associated hospitalized cases, 19,775 (83%) had information available on race and ethnicity while collection of race and ethnicity data was still pending for 4,036 (17%) cases. Of the 19,775 cases with race and ethnicity data, 35.6% were non-Hispanic White, 34.1% were non-Hispanic Black, 17.9% were Hispanic/Latino, 4.5% were non-Hispanic Asian/Pacific Islander, 1.4% were non-Hispanic American Indian/Alaska Native, 0.2% were multiple race, and 6.3% had unknown race. In comparison, the COVID-NET catchment area population includes 58.8% non-Hispanic White, 17.7% non-Hispanic Black, 14.0% Hispanic/Latino, 8.8% non-Hispanic Asian/Pacific Islander, and 0.7% non-Hispanic American Indian/Alaska Native residents. Additional data on race and ethnicity by age are available.

COVID-19-associated hospitalization rates by race and ethnicity are calculated using hospitalized COVID-NET cases with known race and ethnicity for the numerator and NCHS bridged-race population estimates for the denominator. Rates are adjusted to account for differences in age distributions within race and ethnicity strata in the COVID-NET catchment area; the age strata used for the adjustment include 0-17, 18-49, 50-64, 75-84, and ≥85 years. Age-adjusted hospitalization rates are highest in non-Hispanic American Indian/Alaska Native and non-Hispanic Black populations, followed by Hispanic/Latino. Non-Hispanic Black and non-Hispanic American Indian/Alaska Native populations have a rate approximately 4.5 times that of non-Hispanic Whites, while Hispanic/Latinos have a rate approximately 3.5 times that of non-Hispanic Whites.

Among 5,187 hospitalized adults with information on underlying medical conditions, 91.7% had at least one reported underlying medical condition, the most commonly reported were hypertension, obesity, chronic metabolic disease, and cardiovascular disease.
lab-confirmed-hospitalizations-underlying.gif

resize iconView Larger


Additional hospitalization surveillance information: Surveillance Methods | Additional rate data | Additional demographic and clinical data


Mortality Surveillance


The National Center for Health Statistics (NCHS) collects death certificate data from vital statistics offices for all deaths occurring in the United States. Based on death certificate data available on May 28, 2020, 9.8% of all deaths occurring during the week ending May 23, 2020 (week 21) were due to pneumonia, influenza or COVID-19 (PIC). This is the fifth week of a declining percentage of deaths due to PIC; however, the percentage remains above the epidemic threshold of 6.4% for week 21. Data for recent weeks are incomplete, and the PIC percentage may increase as more death certificates representing deaths during these weeks are processed.

Weekly mortality surveillance data include a combination of machine coded and manually coded causes of death collected from death certificates. Percentages of deaths due to PIC are higher among manually coded records than more rapidly available machine coded records. Due to the additional time needed for manual coding, the initially reported PIC percentages may be lower than percentages calculated from final data.
nchs-mortality-report.gif

resize iconView Larger


*Data during recent weeks are incomplete because of the lag in time between when the death occurred and when the death certificate is completed, submitted to NCHS and processed for reporting purposes.
View Data Table


Additional NCHS mortality surveillance information: Surveillance Methods | Provisional Death Counts for COVID-19

More Information
View Page In:pdf icon 49 Pages, 3 MB
Page last reviewed: May 29, 2020
Content source: National Center for Immunization and Respiratory Diseases (NCIRD), Division of Viral Diseases

https://www.cdc.gov/coronavirus/2019...iew/index.html
 
COVIDView.jpg
COVIDView: A Weekly Surveillance Summary of U.S. COVID-19 Activity


Print Page
Updated June 5, 2020

Download Weekly Summary pdf icon[47 Pages, 2 MB]
Key Updates for Week 22, ending May 30, 2020


Nationally, levels of influenza-like illness (ILI) and COVID-19-like illness (CLI) and the percentage of specimens testing positive for SARS-CoV-2, the virus that causes COVID-19, continue to decline or remain stable at low levels. Mortality attributed to COVID-19 also decreased compared to last week but remains elevated above baseline and may increase as additional death certificates are processed.
Virus

Public Health, Commercial and Clinical Laboratories


The national percentage of respiratory specimens testing positive for SARS-CoV-2 at public health, clinical and commercial laboratories decreased from week 21 to week 22; however, percent positivity increased slightly in four regions. National percentages by type of laboratory:
  • Public health laboratories – decreased from 6.8% during week 21 to 6.0% during week 22;
  • Clinical laboratories – decreased from 6.0% during week 21 to 5.9% during week 22;
  • Commercial laboratories – decreased from 6.5% during week 21 to 5.9% during week 22.
Outpatient and Emergency Department Visits

Outpatient Influenza-Like Illness Network (ILINet) and National Syndromic Surveillance Program (NSSP)


Two surveillance indicators are being used to track outpatient or emergency department (ED) visits for illness with symptoms compatible with COVID-19.
  • Nationally, the percentages of visits for ILI and CLI decreased or remained stable at low levels, compared to last week. Levels of ILI are below baseline nationally for the seventh week and in all 10 surveillance regions for the past five to eight weeks.
Recent changes in health care seeking behavior, including increasing use of telemedicine, recommendations to limit emergency department (ED) visits to severe illnesses, and increased practice of social distancing, are likely affecting data reported from both networks, making it difficult to draw conclusions at this time. Tracking these systems moving forward will give additional insight into illness related to COVID-19.
Severe Disease

Hospitalizations


Cumulative COVID-19-associated hospitalization rates since March 1, 2020, are updated weekly. The overall cumulative COVID-19 hospitalization rate is 82.0 per 100,000, with the highest rates in people aged 65 years and older (254.7 per 100,000) and 50-64 years (126.2 per 100,000).
Mortality


Based on death certificate data, the percentage of deaths attributed to pneumonia, influenza or COVID-19 (PIC) decreased from 13.7% during week 21 to 8.4% during week 22 but remained above baseline. This is the sixth week of a declining percentage of deaths due to PIC, but this percentage may change as more death certificates are processed, particularly for recent weeks.

All data are preliminary and may change as more reports are received.

A description of the surveillance systems summarized in COVIDView, including methodology and detailed descriptions of each data component, is available on the surveillance methods page.
Key Points
  • Nationally, the percentages of laboratory specimens testing positive for SARS-CoV-2 with a molecular assay decreased compared to last week; however, there are two developments in particular worth noting:
    • The percent positivity increased in four HHS surveillance regions: Region 4 (the southeast), Region 6 (the south central, Region 9 (the west coast) and Region 10 (the Pacific northwest).
    • While the number of specimens from children <18 years of age tested is low (<5% of all specimens tested in public health and commercial laboratories), the percentage testing positive for SARS-CoV-2 in this age group continued to either trend upward or remain relatively stable while other age groups have seen consistent declines in percent positivity in recent weeks.
  • Nationally, visits to outpatient providers and emergency departments (EDs) for illnesses with symptoms consistent with COVID-19 continued to decline or remain stable at low levels. Outpatient ILI visits are below baseline nationally and in all regions of the country.
    • The decrease in the percentage of people presenting for care with ILI and CLI may be due to a decline in COVID-19 illness, which could be in part a result of widespread adoption of social distancing, in addition to decreases in healthcare seeking behavior.
    • There has been very little influenza virus activity in recent weeks.
  • The overall cumulative COVID-19 associated hospitalization rate is 82.0 per 100,000, with the highest rates in people 65 years of age and older (254.7 per 100,000) followed by people 50-64 years (126.2 per 100,000). Hospitalization rates are cumulative and will increase as the COVID-19 pandemic continues.
    • Non-Hispanic American Indian or Alaska Native persons have a rate approximately 5 times that of non-Hispanic White persons, non-Hispanic Black persons have a rate approximately 4.5 times that of non-Hispanic White persons, while Hispanics or Latino persons have a rate approximately 3.5 times that of non-Hispanic White persons.
    • Cumulative hospitalization rates for COVID-19 in adults (18-64 years) at this time are higher than cumulative end-of-season hospitalization rates for influenza over each of the past 5 influenza seasons.
    • For people 65 years and older, current cumulative COVID-19 hospitalization rates are within ranges of cumulative influenza hospitalization rates observed at comparable time points* during recent influenza seasons.
    • For children (0-17 years), cumulative COVID-19 hospitalization rates are much lower than cumulative influenza hospitalization rates at comparable time points* during recent influenza seasons.
  • Based on death certificate data, the percentage of deaths attributed to pneumonia, influenza or COVID-19 (PIC) decreased from 13.7% during week 21 to 8.4% during week 22. This is the sixth week during which a declining percentage of deaths due to PIC has been recorded; however, the percentage remains above the epidemic threshold, and is now similar to what has been observed at the peak of some influenza seasons. The percentage may change as additional death certificates for deaths during recent weeks are processed.
*Number of weeks since 10% of specimens tested positive for SARS-CoV-2 and influenza, respectively.

U.S. Virologic Surveillance


The number of specimens tested for SARS-CoV-2 using a molecular assay and reported to CDC by public health laboratories and a subset of clinical and commercial laboratories in the United States are summarized below. All laboratories are performing primary diagnostic functions; therefore, the percentage of specimens testing positive across laboratory types can be used to monitor overall trends in COVID-19 activity. As the outbreak progresses, it is possible that different types of laboratories will take on different roles, and the data interpretation may need to change.
1,054,62610,337,330
175,5851,426,171
88,660922,190
790,3817,988,969
62,403 (5.9%)1,239,169 (12.0%)
10,529 (6.0%)163,645 (11.5%)
5,206 (5.9%)75,477 (8.2%)
46,668 (5.9%)1,000,047 (12.5%)
* Commercial and clinical laboratory data represents select laboratories and does not capture all tests performed in the United States.
Public Health Laboratories


resize iconView LargerView Data Table

Clinical Laboratories


resize iconView LargerView Data Table

Commercial Laboratories


resize iconView Larger


* Commercial laboratories began testing for SARS-CoV-2 in early March, but the number and geographic distribution of reporting commercial laboratories became stable enough to calculate a weekly percentage of specimens testing positive as of March 29, 2020.
View Data Table


Additional virologic surveillance information: Surveillance Methods


Outpatient/Emergency Department Illness


Two syndromic surveillance systems are being used to monitor trends in outpatient and emergency department visits that may be associated with COVID-19 illness. Each system monitors a slightly different syndrome, and together these systems provide a more comprehensive picture of mild to moderate COVID-19 illness than either would individually. Both systems are currently being affected by recent changes in healthcare seeking behavior, including increased use of telemedicine, compliance with recommendations to limit emergency department (ED) visits to severe illnesses, and increased practice of social distancing. These changes affect the numbers of people seeking care in the outpatient and ED settings and their reasons for doing so.
ILINet


The U.S. Outpatient Influenza-like Illness Surveillance Network (ILINet) provides data on visits for influenza-like illness (ILI) (fever [≥100[SUP]○[/SUP]F] and cough and/or sore throat) to approximately 2,600 primary care providers, emergency departments and urgent care centers in all 50 states, Puerto Rico, the District of Columbia and the U.S. Virgin Islands. Mild COVID-19 illness presents with symptoms similar to ILI, so ILINet is being used to track trends of mild to moderate COVID-19 illness and allows for comparison with prior influenza seasons.

Nationwide during week 22, 0.9% of patient visits reported through ILINet were due to ILI. This percentage is well below the national baseline of 2.4% and represents the tenth week of decline after three weeks of increase beginning in early March. The percentage of visits for ILI in week 22 remains low among all age groups. Nationally, laboratory-confirmed influenza activity as reported by clinical laboratories is at levels usually seen during summer months which, along with changes in healthcare seeking behavior and the impact of social distancing, is likely contributing to the low level of ILI activity.

resize iconView Larger


* Age-group specific percentages should not be compared to the national baseline.

On a regional levelexternal icon, the percentage of outpatient visits for ILI ranged from 0.5% to 1.3% during week 22. All ten regions are at low levels and below their region-specific baselines.

Note: In response to the COVID-19 pandemic, new sites will be enrolled in ILINet throughout the summer. This will result in an increase in patient visits and the percentage of visits for ILI may change in comparison to previous weeks. During week 21, new sites were added in Regions 1, 4, and 6. While these regions remain below baseline levels for ILI, these system changes should be kept in mind when drawing conclusions from these data. Any changes in ILI due to changes in respiratory virus circulation will be highlighted here.
Overall Percentage of Visits for ILI | Age Group ILI Data

ILI Activity Levels


Data collected in ILINet are used to produce a measure of ILI activity for all 50 states, Puerto Rico, the District of Columbia and New York City. The mean reported percentage of visits due to ILI for the current week is compared to the mean reported during non-influenza weeks, and the activity levels correspond to the number of standard deviations below, at or above the mean.

The number of jurisdictions at each activity level during week 22 and the change compared to the previous week are summarized in the table below and shown in the following maps. The decreasing percentage of visits for ILI described above are reflected in this week’s ILI activity levels.
Activity Level
Week 22
(Week ending May 30, 2020)
Compared to Previous Week
Very High0No change
High0-1
Moderate1+1
Low1-1
Minimal51+2
Insufficient Data1-1

[TD="colspan: 2"] Number of Jurisdictions [/TD]

*Data collected in ILINet may disproportionally represent certain populations within a state and may not accurately depict the full picture of influenza activity for the whole state. Differences in the data presented here by CDC and independently by some state health departments likely represent differing levels of data completeness with data presented by the state likely being the more complete.
National Syndromic Surveillance Program (NSSP): Emergency Department (ED) Visits


NSSP is a collaboration among CDC, federal partners, local and state health departments and academic and private sector partners to collect, analyze and share electronic patient encounter data received from multiple healthcare settings. To track trends of potential COVID-19 visits, visits for COVID-19-like illness (CLI) (fever and cough or shortness of breath or difficulty breathing or presence of a coronavirus diagnosis code) and ILI to a subset of emergency departments in 47 states are being monitored.

Nationwide during week 22, 1.8% of emergency department visits captured in NSSP were due to CLI and 0.6% were due to ILI. This is the tenth week of decline in the percentage of visits for ILI and the eighth week of declining percentage of visits for CLI. Compared to week 21, all 10 HHS regionsexternal icon had declining percentages of visits for CLI during week 22; all 10 regions also had declining or stable percentages of visits for ILI.


Additional information about medically attended outpatient and emergency department visits for ILI and CLI: Surveillance Methods


Hospitalizations


The COVID-19-Associated Hospitalization Surveillance Network (COVID-NET) conducts population-based surveillance for laboratory-confirmed COVID-19-associated hospitalizations in select counties participating in the Emerging Infections Program (EIP) and the Influenza Hospitalization Surveillance Project (IHSP).

A total of 26,623 laboratory-confirmed COVID-19-associated hospitalizations were reported by sites between March 1, 2020, and May 30, 2020. The overall cumulative hospitalization rate was 82.0 per 100,000 population. Among the 0-4 years, 5-17 years, 18-49 years, 50-64 years, and ≥ 65 years age groups, the highest rate of hospitalization is among adults aged ≥ 65 years (254.7 per 100,000), followed by adults aged 50-64 years (126.2 per 100,000) and adults aged 18-49 years (46.7 per 100,000).
lab-confirmed-hospitalizations.gif

resize iconView Larger
Within the 18-49 years and ≥ 65 years age groups, the cumulative hospitalization rates increased with increasing age.
Overall82.0
0-4 years4.9
5-17 years2.4
18-49 years46.7
18-29 years23.7
30-39 years46.2
40-49 years77.1
50-64 years126.2
65+ years254.7
65-74 years185.7
75-84 years307.5
85+ years470.6
Among the 0-4 years and 5-17 years age groups, there appears to be a slight upward trend in weekly hospitalization rates, though these rates are limited by smaller case counts and may change as additional data are received. Weekly rates in the 18-29 years age group have been holding steady, while weekly rates have been declining in all other age groups.

Among the 26,623 laboratory-confirmed COVID-19-associated hospitalized cases, 21,282 (79.9%) had information available on race and ethnicity while collection of race and ethnicity data was still pending for 5,341 (20.1%) cases. Of the 21,282 cases with race and ethnicity data, 35.5% were non-Hispanic White, 33.5% were non-Hispanic Black, 18.2% were Hispanic or Latino, 4.7% were non-Hispanic Asian or Pacific Islander, and 1.5% were non-Hispanic American Indian and or Alaska Native persons. Persons of multiple races represented 0.2% of cases, and 6.4% of cases had unknown race and ethnicity. In comparison, the COVID-NET catchment area population includes 58.8% non-Hispanic White, 17.7% non-Hispanic Black, 14.0% Hispanic or Latino, 8.8% non-Hispanic Asian or Pacific Islander, and 0.7% non-Hispanic American Indian or Alaska Native residents. Additional data on race and ethnicity are available.

COVID-19-associated hospitalization rates by race/ethnicity are calculated using hospitalized COVID-NET cases with known race and ethnicity for the numerator and NCHS bridged-race population estimates for the denominator. Rates are adjusted to account for differences in age distributions within race/ethnicity strata in the COVID-NET catchment area; the age strata used for the adjustment include 0-17, 18-49, 50-64, 65-74, 75-84, and ≥ 85 years. Age-adjusted hospitalization rates are highest among non-Hispanic American Indian or Alaska Native and non-Hispanic Black persons, followed by Hispanic or Latino persons. Non-Hispanic American Indian or Alaska Native persons have a rate approximately 5 times that of non-Hispanic White persons, non-Hispanic Black persons have a rate approximately 4.5 times that of non-Hispanic White persons, while Hispanics or Latinos persons have a rate approximately 3.5 times that of non-Hispanic White persons.

Among 6,000 hospitalized adults with information on underlying medical conditions, 91.6% had at least one reported underlying medical condition. The most commonly reported were hypertension, obesity, chronic metabolic disease, and cardiovascular disease.
lab-confirmed-hospitalizations-underlying.gif

resize iconView Larger


Additional data on demographics, signs and symptoms at admission, underlying conditions, interventions, outcomes, and discharge diagnoses, stratified by age, sex, and race and ethnicity, are available.

Additional hospitalization surveillance information: Surveillance Methods | Additional rate data | Additional demographic and clinical data


Mortality Surveillance


The National Center for Health Statistics (NCHS) collects death certificate data from vital statistics offices for all deaths occurring in the United States. Based on death certificate data available on June 4, 2020, 8.4% of all deaths occurring during the week ending May 30, 2020 (week 22) were due to pneumonia, influenza or COVID-19 (PIC). This is the sixth week of a declining percentage of deaths due to PIC; however, the percentage remains above the epidemic threshold of 6.3% for week 22. Data for recent weeks are incomplete, and the PIC percentage may increase as more death certificates representing deaths during these weeks are processed.

Weekly mortality surveillance data include a combination of machine coded and manually coded causes of death collected from death certificates. Percentages of deaths due to PIC are higher among manually coded records than more rapidly available machine coded records. Due to the additional time needed for manual coding, the initially reported PIC percentages may be lower than percentages calculated from final data.
nchs-mortality-report.gif

resize iconView Larger


*Data during recent weeks are incomplete because of the lag in time between when the death occurred and when the death certificate is completed, submitted to NCHS and processed for reporting purposes.
View Data Table


Additional NCHS mortality surveillance information: Surveillance Methods | Provisional Death Counts for COVID-19

More Information
View Page In:pdf icon 49 Pages, 3 MB
Page last reviewed: June 5, 2020
Content source: National Center for Immunization and Respiratory Diseases (NCIRD), Division of Viral DiseaseshomeCoronavirus Disease 2019 (COVID-19)
email_03Get Email Updates

To receive email updates about COVID-19, enter your email address:
Email Address
What's this?
Submit
Spanish Resources
https://www.cdc.gov/coronavirus/2019...iew/index.html
 
COVIDView.jpg
COVIDView: A Weekly Surveillance Summary of U.S. COVID-19 Activity


Print Page
Updated June 12, 2020

Download Weekly Summary pdf icon[47 Pages, 2 MB]
Key Updates for Week 23, ending June 6, 2020


Nationally, levels of influenza-like illness (ILI) and COVID-19-like illness (CLI) continue to decline or remain stable at low levels. The percentage of specimens testing positive for SARS-CoV-2, the virus that causes COVID-19, increased slightly from last week. Mortality attributed to COVID-19 also decreased compared to last week but remains elevated above baseline and may increase as additional death certificates are processed.
Virus

Public Health, Commercial and Clinical Laboratories


The overall percentage of respiratory specimens testing positive for SARS-CoV-2 increased slightly from week 22 (6.0%) to week 23 (6.3%) nationally driven by increases in four regions. National percentages by type of laboratory:
  • Public health laboratories – decreased from 5.8% during week 22 to 5.0% during week 23;
  • Clinical laboratories – decreased from 5.5% during week 22 to 5.3% during week 23;
  • Commercial laboratories – increased from 6.1% during week 22 to 6.5% during week 23.
Outpatient and Emergency Department Visits

Outpatient Influenza-Like Illness Network (ILINet) and National Syndromic Surveillance Program (NSSP)


Two surveillance indicators are being used to track outpatient or emergency department (ED) visits for illness with symptoms compatible with COVID-19.
  • Nationally, the percentages of visits for ILI and CLI decreased or remained stable at low levels, compared to last week. Levels of ILI are below baseline nationally for the eighth week and in all 10 surveillance regions for the past six to nine weeks.
Recent changes in health care seeking behavior, including increasing use of telemedicine, recommendations to limit emergency department (ED) visits to severe illnesses, and increased practice of social distancing, are likely affecting data reported from both networks, making it difficult to draw conclusions at this time. Tracking these systems moving forward will give additional insight into illness related to COVID-19.
Severe Disease

Hospitalizations


Cumulative COVID-19-associated hospitalization rates since March 1, 2020, are updated weekly. The overall cumulative COVID-19 hospitalization rate is 89.3 per 100,000, with the highest rates in people aged 65 years and older (273.8 per 100,000) and 50-64 years (136.1 per 100,000).
Mortality


Based on death certificate data, the percentage of deaths attributed to pneumonia, influenza or COVID-19 (PIC) decreased from 12.4% during week 22 to 7.3% during week 23 but remained above baseline. This is the seventh week of a declining percentage of deaths due to PIC, but this percentage may change as more death certificates are processed, particularly for recent weeks.

All data are preliminary and may change as more reports are received.

A description of the surveillance systems summarized in COVIDView, including methodology and detailed descriptions of each data component, is available on the surveillance methods page.
Key Points
  • Nationally, using combined data from the three laboratory types, the percentages of laboratory specimens testing positive for SARS-CoV-2 with a molecular assay increased slightly compared to last week.
    • The national increase was driven by increases in four HHS surveillance regions: Region 2 (North East), Region 4 (South East), Region 6 (South Central), and Region 10 (Pacific Northwest).
    • While the number of specimens from children <18 years of age tested is low (<5% of all specimens tested in public health and commercial laboratories), the percentage testing positive for SARS-CoV-2 in this age group is higher than it is in the adult age groups.
  • While the number of COVID-19 cases reported to CDC is cumulative and continues to increase, nationally, the proportion of visits to outpatient providers and emergency departments (EDs) for illnesses with symptoms consistent with COVID-19 continued to decline or remain stable at low levels. Outpatient ILI visits are below baseline nationally and in all regions of the country.
    • The low levels of people presenting for care with ILI and CLI may reflect low levels of COVID-19 and other respiratory illness, which could be in part a result of widespread adoption of social distancing, in addition to changes in healthcare seeking behavior.
    • There has been very little influenza virus activity in recent weeks.
  • The overall cumulative COVID-19 associated hospitalization rate is 89.3 per 100,000, with the highest rates in people 65 years of age and older (273.8 per 100,000) followed by people 50-64 years (136.1 per 100,000). Hospitalization rates are cumulative and will increase as the COVID-19 pandemic continues.
    • Non-Hispanic American Indian or Alaska Native persons have a rate approximately 5 times that of non-Hispanic White persons, non-Hispanic Black persons have a rate approximately 4.5 times that of non-Hispanic White persons, and Hispanic or Latino persons have a rate approximately 4 times that of non-Hispanic White persons.
    • Cumulative hospitalization rates for COVID-19 in adults (18-64 years) at this time are higher than cumulative end-of-season hospitalization rates for influenza over each of the past 5 influenza seasons.
    • For people 65 years and older, current cumulative COVID-19 hospitalization rates are within ranges of cumulative influenza hospitalization rates observed at comparable time points* during recent influenza seasons.
    • For children (0-17 years), cumulative COVID-19 hospitalization rates are much lower than cumulative influenza hospitalization rates at comparable time points* during recent influenza seasons.
  • Based on death certificate data, the percentage of deaths attributed to pneumonia, influenza or COVID-19 (PIC) decreased from 12.4% during week 22 to 7.3% during week 23. This is the seventh week during which a declining percentage of deaths due to PIC has been recorded; however, the percentage remains above the epidemic threshold. The percentage may change as additional death certificates for deaths during recent weeks are processed.
*Number of weeks since 10% of specimens tested positive for SARS-CoV-2 and influenza, respectively.

U.S. Virologic Surveillance


The number of specimens tested for SARS-CoV-2 using a molecular assay and reported to CDC by public health laboratories and a subset of clinical and commercial laboratories in the United States are summarized below. All laboratories are performing primary diagnostic functions; therefore, the percentage of specimens testing positive across laboratory types can be used to monitor overall trends in COVID-19 activity. As the outbreak progresses, it is possible that different types of laboratories will take on different roles, and the data interpretation may need to change.
1,587,07212,604,300
189,8151,650,462
105,6701,089,500
1,291,5879,864,338
99,357 (6.3%)1,379,860 (10.9%)
9,543 (5.0%)174,716 (10.6%)
5,593 (5.3%)83,910 (7.7%)
84,221 (6.5%)1,121,234 (11.4%)
* Commercial and clinical laboratory data represents select laboratories and does not capture all tests performed in the United States.
Public Health Laboratories


resize iconView LargerView Data Table

Clinical Laboratories


resize iconView LargerView Data Table

Commercial Laboratories


resize iconView Larger


* Commercial laboratories began testing for SARS-CoV-2 in early March, but the number and geographic distribution of reporting commercial laboratories became stable enough to calculate a weekly percentage of specimens testing positive as of March 29, 2020.
View Data Table


Additional virologic surveillance information: Surveillance Methods


Outpatient/Emergency Department Illness


Two syndromic surveillance systems are being used to monitor trends in outpatient and emergency department visits that may be associated with COVID-19 illness. Each system monitors a slightly different syndrome, and together these systems provide a more comprehensive picture of mild to moderate COVID-19 illness than either would individually. Both systems are currently being affected by recent changes in healthcare seeking behavior, including increased use of telemedicine, compliance with recommendations to limit emergency department (ED) visits to severe illnesses, and increased practice of social distancing. These changes affect the numbers of people seeking care in the outpatient and ED settings and their reasons for doing so.
ILINet


The U.S. Outpatient Influenza-like Illness Surveillance Network (ILINet) provides data on visits for influenza-like illness (ILI) (fever [≥100[SUP]○[/SUP]F] and cough and/or sore throat) to approximately 2,600 primary care providers, emergency departments and urgent care centers in all 50 states, Puerto Rico, the District of Columbia and the U.S. Virgin Islands. Mild COVID-19 illness presents with symptoms similar to ILI, so ILINet is being used to track trends of mild to moderate COVID-19 illness and allows for comparison with prior influenza seasons.

Nationwide during week 23, 0.7% of patient visits reported through ILINet were due to ILI. This percentage is well below the national baseline of 2.4% and represents the eleventh week of decline after three weeks of increase beginning in early March. The percentage of visits for ILI in week 23 remains low among all age groups. Nationally, laboratory-confirmed influenza activity as reported by clinical laboratories is at levels usually seen during summer months which, along with changes in healthcare seeking behavior and the impact of social distancing, is likely contributing to the low level of ILI activity.

resize iconView Larger


* Age-group specific percentages should not be compared to the national baseline.

On a regional levelexternal icon, the percentage of outpatient visits for ILI ranged from 0.4% to 1.1% during week 23. All ten regions are at low levels and below their region-specific baselines.

Note: In response to the COVID-19 pandemic, new sites will be enrolled in ILINet throughout the summer. This will result in an increase in patient visits and the percentage of visits for ILI may change in comparison to previous weeks. During week 21, new sites were added in Regions 1, 4, and 6. While these regions remain below baseline levels for ILI, these system changes should be kept in mind when drawing conclusions from these data. Any changes in ILI due to changes in respiratory virus circulation will be highlighted in this report.
Overall Percentage of Visits for ILI | Age Group ILI Data

ILI Activity Levels


Data collected in ILINet are used to produce a measure of ILI activity for all 50 states, Puerto Rico, the District of Columbia and New York City. The mean reported percentage of visits due to ILI for the current week is compared to the mean reported during non-influenza weeks, and the activity levels correspond to the number of standard deviations below, at or above the mean.

The number of jurisdictions at each activity level during week 23 and the change compared to the previous week are summarized in the table below and shown in the following maps. The decreasing percentage of visits for ILI described above are reflected in this week’s ILI activity levels.
Activity Level
Week 23
(Week ending June 6, 2020)
Compared to Previous Week
Very High0No change
High0No change
Moderate0-1
Low1No change
Minimal52+1
Insufficient Data1No change

[TD="colspan: 2"] Number of Jurisdictions [/TD]

*Data collected in ILINet may disproportionally represent certain populations within a state and may not accurately depict the full picture of influenza activity for the whole state. Differences in the data presented here by CDC and independently by some state health departments likely represent differing levels of data completeness with data presented by the state likely being the more complete.
National Syndromic Surveillance Program (NSSP): Emergency Department (ED) Visits


NSSP is a collaboration among CDC, federal partners, local and state health departments and academic and private sector partners to collect, analyze and share electronic patient encounter data received from multiple healthcare settings. To track trends of potential COVID-19 visits, visits for COVID-19-like illness (CLI) (fever and cough or shortness of breath or difficulty breathing or presence of a coronavirus diagnosis code) and ILI to a subset of emergency departments in 47 states are being monitored.

Nationwide during week 23, 1.6% of emergency department visits captured in NSSP were due to CLI and 0.6% were due to ILI. This is the eleventh week of declining or stable percentage of visits for ILI and the ninth week of declining percentage of visits for CLI. Compared to week 22, all 10 HHS regionsexternal icon had declining or stable percentages of visits for CLI during week 23; all 10 regions also had declining or stable percentages of visits for ILI.


Additional information about medically attended outpatient and emergency department visits for ILI and CLI: Surveillance Methods


Hospitalizations


The COVID-19-Associated Hospitalization Surveillance Network (COVID-NET) conducts population-based surveillance for laboratory-confirmed COVID-19-associated hospitalizations in select counties participating in the Emerging Infections Program (EIP) and the Influenza Hospitalization Surveillance Project (IHSP).

A total of 28,987 laboratory-confirmed COVID-19-associated hospitalizations were reported by sites between March 1, 2020, and June 6, 2020. The overall cumulative hospitalization rate was 89.3 per 100,000 population. Among the 0-4 years, 5-17 years, 18-49 years, 50-64 years, and ≥ 65 years age groups, the highest rate of hospitalization is among adults aged 65 years (273.8 per 100,000), followed by adults aged 50-64 years (136.1 per 100,000) and adults aged 18-49 years (52.4 per 100,000).
lab-confirmed-hospitalizations.gif

resize iconView Larger
Overall89.3
0-4 years5.6
5-17 years3.1
18-49 years52.4
18-29 years27.3
30-39 years52.5
40-49 years84.6
50-64 years136.1
65+ years273.8
65-74 years198.7
75-84 years329.3
85+ years513.2
Among the 28,987 laboratory-confirmed COVID-19-associated hospitalized cases, 24,936 (86.0%) had information on race and ethnicity, while collection of race and ethnicity was still pending for 4,051 (14.0%) cases. Of the 24,936 cases with race and ethnicity data, 34.2% were non-Hispanic White, 32.9% were non-Hispanic Black, 20.2% were Hispanic or Latino, 4.6% were non-Hispanic Asian or Pacific Islander, and 1.5% were non-Hispanic American Indian or Alaska Native persons. Persons of multiple races represented 0.2% of cases, and 6.4% of cases had unknown race and ethnicity. In comparison, the COVID-NET catchment area population includes 58.8% non-Hispanic White, 17.7% non-Hispanic Black, 14.0% Hispanic or Latino, 8.8% non-Hispanic Asian or Pacific Islander, and 0.7% non-Hispanic American Indian or Alaska Native residents. Additional data on race and ethnicity are available.

COVID-19-associated hospitalization rates by race/ethnicity are calculated using hospitalized COVID-NET cases with known race and ethnicity for the numerator and NCHS bridged-race population estimates for the denominator. Rates are adjusted to account for differences in age distributions within race/ethnicity strata in the COVID-NET catchment area; the age strata used for the adjustment include 0-17, 18-49, 50-64, 65-74, 75-84, and ≥ 85 years. Age-adjusted hospitalization rates are highest among non-Hispanic American Indian or Alaska Native and non-Hispanic Black persons, followed by Hispanic or Latino persons. Non-Hispanic American Indian or Alaska Native persons have a rate approximately 5 times that of non-Hispanic White persons, non-Hispanic Black persons have a rate approximately 4.5 times that of non-Hispanic White persons, while Hispanic or Latino persons have a rate approximately 4 times that of non-Hispanic White persons.

Among 6,693 hospitalized adults with information on underlying medical conditions, 91.5% had at least one reported underlying medical condition. The most commonly reported were hypertension, obesity, chronic metabolic disease, and cardiovascular disease. Among 128 hospitalized children with information on underlying conditions, 53.1% had at least one reported underlying medical condition. The most commonly reported condition was obesity.
lab-confirmed-hospitalizations-underlying.gif

resize iconView Larger


Additional data on demographics, signs and symptoms at admission, underlying conditions, interventions, outcomes, and discharge diagnoses, stratified by age, sex, and race and ethnicity, are available.

Additional hospitalization surveillance information: Surveillance Methods | Additional rate data | Additional demographic and clinical data


Mortality Surveillance


The National Center for Health Statistics (NCHS) collects death certificate data from vital statistics offices for all deaths occurring in the United States. Based on death certificate data available on June 11, 2020, 7.3% of all deaths occurring during the week ending June 6, 2020 (week 23) were due to pneumonia, influenza or COVID-19 (PIC). This is the seventh week of a declining percentage of deaths due to PIC; however, the percentage remains above the epidemic threshold of 6.2% for week 23. Data for recent weeks are incomplete, and the PIC percentage may increase as more death certificates representing deaths during these weeks are processed.

Weekly mortality surveillance data include a combination of machine coded and manually coded causes of death collected from death certificates. Percentages of deaths due to PIC are higher among manually coded records than more rapidly available machine coded records. Due to the additional time needed for manual coding, the initially reported PIC percentages may be lower than percentages calculated from final data.
nchs-mortality-report.gif

resize iconView Larger


*Data during recent weeks are incomplete because of the lag in time between when the death occurred and when the death certificate is completed, submitted to NCHS and processed for reporting purposes.
View Data Table


Additional NCHS mortality surveillance information: Surveillance Methods | Provisional Death Counts for COVID-19

More Information
View Page In:pdf icon 49 Pages, 3 MB
Page last reviewed: June 12, 2020
Content source: National Center for Immunization and Respiratory Diseases (NCIRD), Division of Viral Diseases


https://www.cdc.gov/coronavirus/2019...iew/index.html
 
COVIDView.jpg
COVIDView: A Weekly Surveillance Summary of U.S. COVID-19 Activity


Print Page
Download Weekly Summary pdf icon[49 Pages, 2.45 MB]
Key Updates for Week 25, ending June 20, 2020


Nationally, levels of influenza-like illness (ILI) and COVID-19-like illness (CLI) remain lower than peaks seen in March and April but are increasing in several regions. The percentage of specimens testing positive for SARS-CoV-2, the virus that causes COVID-19, also increased from last week. Mortality attributed to COVID-19 decreased compared to last week but remains elevated above baseline and may increase as additional death certificates are processed.
Virus

Public Health, Commercial and Clinical Laboratories


The overall percentage of respiratory specimens testing positive for SARS-CoV-2 increased from week 24 (6.5%) to week 25 (7.6%) nationally, driven by increases in seven regions. National percentages by type of laboratory:
  • Public health laboratories – increased from 5.2% during week 24 to 6.1% during week 25;
  • Clinical laboratories – increased from 4.7% during week 24 to 5.2% during week 25;
  • Commercial laboratories – increased from 6.9% during week 24 to 7.9% during week 25.
Outpatient and Emergency Department Visits

Outpatient Influenza-Like Illness Network (ILINet) and National Syndromic Surveillance Program (NSSP)


Two surveillance indicators are being used to track outpatient or emergency department (ED) visits for illness with symptoms compatible with COVID-19.
  • Nationally, levels of ILI remain below baseline for the tenth week and in all 10 surveillance regions for the past eight to eleven weeks. However, several regions reported increases in percentage of visits for ILI and CLI.
  • Recent changes in health care seeking behavior, including increasing use of telemedicine, recommendations to limit emergency department (ED) visits to severe illnesses, and increased practice of social distancing, are likely affecting data reported from both networks, making it difficult to draw conclusions at this time. Tracking these systems moving forward will give additional insight into illness related to COVID-19.
Severe Disease

Hospitalizations


Cumulative COVID-19-associated hospitalization rates since March 1, 2020, are updated weekly. The overall cumulative COVID-19 hospitalization rate is 98.4 per 100,000, with the highest rates in people aged 65 years and older (297.6 per 100,000) and 50-64 years (148.6 per 100,000).
Mortality


Based on death certificate data, the percentage of deaths attributed to pneumonia, influenza or COVID-19 (PIC) decreased from 9.5% during week 24 to 6.9% during week 25 but remained above baseline. This is the ninth week of a declining percentage of deaths due to PIC, but this may change as more death certificates are processed, particularly for recent weeks.

All data are preliminary and may change as more reports are received.

A description of the surveillance systems summarized in COVIDView, including methodology and detailed descriptions of each data component, is available on the surveillance methods page.
Key Points
  • Overall, indicators used to monitor COVID-19 activity remain lower than peaks seen in March and April; however, increases are being seen in the percentage of specimens testing positive for SARS-CoV-2 and percentage of visits for ILI or CLI in multiple parts of the country, in some case for consecutive weeks.
  • Nationally, using combined data from the three laboratory types, the percentages of laboratory specimens testing positive for SARS-CoV-2 with a molecular assay increased from week 24 (6.5%) to week 25 (7.6%).
    • Increases were reported in seven of ten HHS surveillance regions, three of which (Region 4 [South East], Region 6 [South Central], and Region 9 [South West/Coast]) reported >10% of specimens positive for SARS-CoV-2.
    • Three regions (Region 1 [New England], Region 3 [Mid-Atlantic] and Region 5 [Midwest]), reported a decrease in percentage of specimens testing positive for SARS-CoV-2.
  • The percentage of outpatient and emergency department visits for ILI are below baseline nationally and in all regions of the country. Most regions have remained stable, compared to last week; however, a few regions experienced an increase in the percentage of visits for CLI and/or ILI with the largest increases in Regions 4 (South East), 6 (South Central), and 9 (South West/Coast).
    • Systems monitoring ILI and CLI may be influenced by recent changes in health care seeking behavior, including increasing use of telemedicine, recommendations to limit emergency department (ED) visits to severe illnesses, and increased practice of social distancing.
  • The overall cumulative COVID-19 associated hospitalization rate is 98.4 per 100,000, with the highest rates in people 65 years of age and older (297.6 per 100,000) followed by people 50-64 years (148.6 per 100,000). Hospitalization rates are cumulative and will increase as the COVID-19 pandemic continues.
    • Non-Hispanic American Indian or Alaska Native persons have an age-adjusted hospitalization rate approximately 5 times that of non-Hispanic White persons, while non-Hispanic Black persons and Hispanic or Latino persons each have a rate approximately 4.5 times that of non-Hispanic White persons.
    • Cumulative hospitalization rates for COVID-19 in adults (18-64 years) at this time are higher than cumulative end-of-season hospitalization rates for influenza over each of the past 5 influenza seasons.
    • For people 65 years and older, current cumulative COVID-19 hospitalization rates are within ranges of cumulative influenza hospitalization rates observed at comparable time points* during recent influenza seasons.
    • For children (0-17 years), cumulative COVID-19 hospitalization rates are much lower than cumulative influenza hospitalization rates at comparable time points* during recent influenza seasons.
  • Based on death certificate data, the percentage of deaths attributed to pneumonia, influenza or COVID-19 (PIC) decreased from 9.5% during week 24 to 6.9% during week 25. This is the ninth week during which a declining percentage of deaths due to PIC has been recorded; however, the percentage remains above the epidemic threshold. The percentage may change as additional death certificates for deaths during recent weeks are processed.
*Number of weeks since 10% of specimens tested positive for SARS-CoV-2 and influenza, respectively.

U.S. Virologic Surveillance


The number of specimens tested for SARS-CoV-2 using a molecular assay and reported to CDC by public health laboratories and a subset of clinical and commercial laboratories in the United States are summarized below. All laboratories are performing primary diagnostic functions; therefore, the percentage of specimens testing positive across laboratory types can be used to monitor overall trends in COVID-19 activity. As the outbreak progresses, it is possible that different types of laboratories will take on different roles, and the data interpretation may need to change.
1,772,63116,998,825
172,7482,101,748
117,7321,434,393
1,482,15113,462,684
133,899 (7.6%)1,677,604 (9.9%)
10,474 (6.1%)199,744 (9.5%)
6,162 (5.2%)96,572 (6.7%)
117,263 (7.9%)1,381,288 (10.3%)
* Commercial and clinical laboratory data represents select laboratories and does not capture all tests performed in the United States.
Public Health Laboratories


resize iconView LargerView Data Table

Clinical Laboratories


resize iconView LargerView Data Table

Commercial Laboratories


resize iconView Larger


* Commercial laboratories began testing for SARS-CoV-2 in early March, but the number and geographic distribution of reporting commercial laboratories became stable enough to calculate a weekly percentage of specimens testing positive as of March 29, 2020.
View Data Table


Additional virologic surveillance information: Surveillance Methods


Outpatient/Emergency Department Illness


Two syndromic surveillance systems are being used to monitor trends in outpatient and emergency department visits that may be associated with COVID-19 illness. Each system monitors a slightly different syndrome, and together these systems provide a more comprehensive picture of mild to moderate COVID-19 illness than either would individually. Both systems are currently being affected by recent changes in healthcare seeking behavior, including increased use of telemedicine, compliance with recommendations to limit emergency department (ED) visits to severe illnesses, and increased practice of social distancing. These changes affect the numbers of people seeking care in the outpatient and ED settings and their reasons for doing so.
ILINet


The U.S. Outpatient Influenza-like Illness Surveillance Network (ILINet) provides data on visits for influenza-like illness (ILI) (fever [≥100[SUP]○[/SUP]F] and cough and/or sore throat) to approximately 2,600 primary care providers, emergency departments and urgent care centers in all 50 states, Puerto Rico, the District of Columbia and the U.S. Virgin Islands. Mild COVID-19 illness presents with symptoms similar to ILI, so ILINet is being used to track trends of mild to moderate COVID-19 illness and allows for comparison with prior influenza seasons.

Nationwide during week 25, 0.8% of patient visits reported through ILINet were due to ILI. This percentage is well below the national baseline of 2.4%. The percentage of visits for ILI in week 25 remains low among all age groups but increased slightly for persons less than 65 years of age. Nationally, laboratory-confirmed influenza activity as reported by clinical laboratories is at levels usually seen during summer months which, along with changes in healthcare seeking behavior and the impact of social distancing, is likely contributing to the low level of ILI activity.

resize iconView Larger


* Age-group specific percentages should not be compared to the national baseline.

On a regional levelexternal icon, the percentage of outpatient visits for ILI ranged from 0.4% to 1.4% during week 25. All ten regions are at low levels and below their region-specific baselines; however, Region 4 (South East) increased from 0.9% during week 24 to 1.3% during week 25; Regions 7 (Central), 8 (West) and 9 (South West/Coast) also reported slight increases.

Note: In response to the COVID-19 pandemic, new data sources will be incorporated into ILINet as we move into summer weeks when lower levels of influenza and other respiratory virus circulation are typical. Starting in week 21, increases in the number of patient visits will be seen as new sites are enrolled and the percentage of visits for ILI may change in comparison to previous weeks. While all regions remain below baseline levels for ILI, these system changes should be kept in mind when drawing conclusions from these data. Any changes in ILI due to changes in respiratory virus circulation will be highlighted here.
Overall Percentage of Visits for ILI | Age Group ILI Data

ILI Activity Levels


Data collected in ILINet are used to produce a measure of ILI activity for all 50 states, Puerto Rico, the District of Columbia and New York City. The mean reported percentage of visits due to ILI for the current week is compared to the mean reported during non-influenza weeks, and the activity levels correspond to the number of standard deviations below, at or above the mean.

The number of jurisdictions at each activity level during week 25 and the change compared to the previous week are summarized in the table below and shown in the following maps. The decreasing percentage of visits for ILI described above are reflected in this week’s ILI activity levels.
Activity Level
Week 25
(Week ending
June 20, 2020)
Compared to Previous Week
Very High0No change
High0No change
Moderate0No change
Low1+1
Minimal51-2
Insufficient Data2+1

[TD="colspan: 2"] Number of Jurisdictions [/TD]

*Data collected in ILINet may disproportionally represent certain populations within a state and may not accurately depict the full picture of influenza activity for the whole state. Differences in the data presented here by CDC and independently by some state health departments likely represent differing levels of data completeness with data presented by the state likely being the more complete.
National Syndromic Surveillance Program (NSSP): Emergency Department (ED) Visits


NSSP is a collaboration among CDC, federal partners, local and state health departments and academic and private sector partners to collect, analyze and share electronic patient encounter data received from multiple healthcare settings. To track trends of potential COVID-19 visits, visits for COVID-19-like illness (CLI) (fever and cough or shortness of breath or difficulty breathing or presence of a coronavirus diagnosis code) and ILI to a subset of emergency departments in 47 states are being monitored.

Nationwide during week 25, 2.1% of emergency department visits captured in NSSP were due to CLI and 0.8% were due to ILI. This is the first week of an increasing percentage of visits for CLI and ILI nationally since activity peaked in early April. Compared to week 24, 3 of 10 HHS regionsexternal icon (Regions 4 [South East], 6 [South Central] and 9 [South West/Coast]) reported increases in the percentages of visits for both CLI and ILI during week 25. One additional region reported a slight increase in percentage of visits for CLI during week 25 (Region 8 [Mountain]) and 2 additional regions reported a slight increase in percentage of visits for ILI (Regions 3 [Mid-Atlantic] and 7 [Central]).


Additional information about medically attended outpatient and emergency department visits for ILI and CLI: Surveillance Methods


Hospitalizations


The COVID-19-Associated Hospitalization Surveillance Network (COVID-NET) conducts population-based surveillance for laboratory-confirmed COVID-19-associated hospitalizations in select counties participating in the Emerging Infections Program (EIP) and the Influenza Hospitalization Surveillance Project (IHSP).

A total of 31,934 laboratory-confirmed COVID-19-associated hospitalizations were reported by sites between March 1, 2020 and June 20, 2020. The overall cumulative hospitalization rate was 98.4 per 100,000 population. Among the 0-4 years, 5-17 years, 18-49 years, 50-64 years, and ≥ 65 years age groups, the highest rate of hospitalization is among adults aged ≥ 65 years, followed by adults aged 50-64 years and adults aged 18-49 years.
lab-confirmed-hospitalizations.gif

resize iconView Larger
Overall98.4
0-4 years8.0
5-17 years3.7
18-49 years59.2
18-29 years32.1
30-39 years59.2
40-49 years94.1
50-64 years148.6
65+ years297.6
65-74 years216.3
75-84 years358.2
85+ years556.2
Among the 31,934 laboratory-confirmed COVID-19-associated hospitalized cases, 29,789 (93.3%) had information on race and ethnicity while collection of race and ethnicity was still pending for 2,145 (6.7%) cases. Non-Hispanic American Indian or Alaska Native persons have an age-adjusted hospitalization rate approximately 5 times that of non-Hispanic White persons, while non-Hispanic Black persons and Hispanic or Latino persons each have a rate approximately 4.5 times that of non-Hispanic White persons. Additional data on race and ethnicity are available.


Non-Hispanic White persons represent the highest proportion of hospitalized cases reported to COVID-NET, followed by non-Hispanic Black, Hispanic or Latino, non-Hispanic Asian or Pacific Islander, and non-Hispanic American Indian or Alaska Native persons. However, some racial and ethnic groups are disproportionately represented among hospitalized cases as compared with the overall population of the catchment area. Prevalence ratios show a similar pattern to that of the age-adjusted hospitalization rates: non-Hispanic American Indian or Alaska Native persons have the highest prevalence ratio, followed by non-Hispanic Black, and Hispanic or Latino persons.
231.0202.2192.854.243.5
1.5%32.6%22.0%4.7%32.8%
0.7%17.7%14.0%8.8%58.8%
2.11.81.50.50.6
[SUP]1[/SUP]COVID-19-associated hospitalization rates by race/ethnicity are calculated using hospitalized COVID-NET cases with known race and ethnicity for the numerator and NCHS bridged-race population estimates NCHS bridged-race population estimates for the denominator. Rates are adjusted to account for differences in age distributions within race/ethnicity strata in the COVID-NET catchment area; the age strata used for the adjustment include 0-17, 18-49, 50-64, 65-74, 75-84, and 85 years.

[SUP]2[/SUP] Persons of multiple races (0.2%) or unknown race and ethnicity (6.2%) are not represented in the table but are included as part of the denominator.

[SUP]3 [/SUP]Prevalence ratio is calculated as the ratio of the proportion of hospitalized COVID-NET cases over the proportion of population in COVID-NET catchment area.

Among 8,089 hospitalized adults with information on underlying medical conditions, 91% had at least one reported underlying medical condition. The most commonly reported were hypertension, obesity, chronic metabolic disease, and cardiovascular disease. Among 158 hospitalized children with information on underlying conditions, 53.2% had at least one reported underlying medical condition. The most commonly reported were obesity, asthma, and neurologic conditions.
lab-confirmed-hospitalizations-underlying.gif

resize iconView Larger


Additional data on demographics, signs and symptoms at admission, underlying conditions, interventions, outcomes, and discharge diagnoses, stratified by age, sex, and race and ethnicity, are available.

Additional hospitalization surveillance information: Surveillance Methods | Additional rate data | Additional demographic and clinical data


Mortality Surveillance


The National Center for Health Statistics (NCHS) collects death certificate data from vital statistics offices for all deaths occurring in the United States. Based on death certificate data available on June 25, 2020, 6.9% of all deaths occurring during the week ending June 20, 2020 (week 25) were due to pneumonia, influenza or COVID-19 (PIC). This is the ninth week of a declining percentage of deaths due to PIC; however, the percentage remains above the epidemic threshold of 5.9% for week 25. Data for recent weeks are incomplete, and the PIC percentage may increase as more death certificates representing deaths during these weeks are processed.

Weekly mortality surveillance data include a combination of machine coded and manually coded causes of death collected from death certificates. Percentages of deaths due to PIC are higher among manually coded records than more rapidly available machine coded records. Due to the additional time needed for manual coding, the initially reported PIC percentages may be lower than percentages calculated from final data.
nchs-mortality-report.gif

resize iconView Larger


*Data during recent weeks are incomplete because of the lag in time between when the death occurred and when the death certificate is completed, submitted to NCHS and processed for reporting purposes.
View Data Table


Additional NCHS mortality surveillance information: Surveillance Methods | Provisional Death Counts for COVID-19

More Information
View Page In:pdf icon 49 Pages, 2.45 MB
Page last reviewed: June 26, 2020
Content source: National Center for Immunization and Respiratory Diseases (NCIRD), Division of Viral DiseaseshomeCoronavirus Disease 2019 (COVID-19)
email_03Get Email Updates

To receive email updates about COVID-19, enter your email address:
Email Address
What's this?
Submit
Spanish Resources
https://www.cdc.gov/coronavirus/2019...iew/index.html
 
COVIDView.jpg
  1. CASES, DATA & SURVEILLANCE
COVIDView: A Weekly Surveillance Summary of U.S. COVID-19 Activity


Updated July 3, 2020
Print
Download Weekly Summary pdf icon[49 Pages, 2.45 MB]
Key Updates for Week 26, ending June 27, 2020


Nationally, levels of influenza-like illness (ILI) and COVID-19-like illness (CLI) activity remain lower than peaks seen in March and April but are increasing in most regions. The percentage of specimens testing positive for SARS-CoV-2, the virus that causes COVID-19, also increased from last week. Mortality attributed to COVID-19 decreased compared to last week and is currently at the epidemic threshold but will likely increase as additional death certificates are processed.
Virus

Public Health, Commercial and Clinical Laboratories


The overall percentage of respiratory specimens testing positive for SARS-CoV-2 increased from week 25 (8.1%) to week 26 (8.7%) nationally, driven by increases in seven regions. National percentages of specimens testing positive for SARS-CoV-2 by type of laboratory:
  • Public health laboratories – increased from 5.6% during week 25 to 6.3% during week 26;
  • Clinical laboratories – increased from 5.3% during week 25 to 5.8% during week 26;
  • Commercial laboratories – increased from 8.7% during week 25 to 9.3% during week 26.
Outpatient and Emergency Department Visits

Outpatient Influenza-Like Illness Network (ILINet) and National Syndromic Surveillance Program (NSSP)


Two surveillance indicators are being used to track outpatient or emergency department (ED) visits for illness with symptoms compatible with COVID-19.
  • Nationally, levels of ILI activity remain below baseline for the eleventh week and in all 10 surveillance regions for the past nine to twelve weeks. However, most regions reported increases in percentage of visits for ILI, which is atypical for this time of year. CLI also increased the past week.
  • Recent changes in health care seeking behavior, including increasing use of telemedicine, recommendations to limit emergency department (ED) visits to severe illnesses, and increased practice of social distancing, are likely affecting data reported from both networks, making it difficult to draw conclusions at this time. Tracking these systems moving forward will give additional insight into illness related to COVID-19.
Severe Disease

Hospitalizations


Cumulative COVID-19-associated hospitalization rates since March 1, 2020, are updated weekly. The overall cumulative COVID-19 hospitalization rate is 102.5 per 100,000, with the highest rates in people aged 65 years and older (306.7 per 100,000) and 50-64 years (155.0 per 100,000).
Mortality


Based on death certificate data, the percentage of deaths attributed to pneumonia, influenza or COVID-19 (PIC) decreased from 9.0% during week 25 to 5.9% during week 26, representing the tenth week of a declining percentage of deaths due to PIC. The percentage is currently at the epidemic threshold but will likely change as more death certificates are processed, particularly for recent weeks.

All data are preliminary and may change as more reports are received.

A description of the surveillance systems summarized in COVIDView, including methodology and detailed descriptions of each data component, is available on the surveillance methods page.
Key Points
  • Indicators used to monitor COVID-19 activity remain lower than peaks seen in March and April; however, there are increases in the percentage of specimens testing positive for SARS-CoV-2 and percentage of visits for ILI or CLI in multiple parts of the country, which have been sustained in some cases for multiple consecutive weeks.
  • Nationally, using combined data from the three laboratory types, the percentage of respiratory specimens testing positive for SARS-CoV-2 with a molecular assay increased from week 25 (8.1%) to week 26 (8.7%).
    • Increases were reported in seven of ten HHS surveillance regions.
      • Four regions reported between 4% and 6% of specimens positive for SARS-CoV-2: Regions 2 [NY/NJ/Puerto Rico], 5 [Midwest], 7 [Central] and 10 [Pacific Northwest].
      • Two regions reported between 10% and 15% of specimens positive for SARS-CoV-2: Regions 4 [South East] and 9 [South West/Coast].
      • Region 6 [South Central] reported >15% of specimens positive for SARS-CoV-2.
    • Three regions (Regions 1 [New England], 3 [Mid-Atlantic] and 8 [Mountain]) reported a stable or decreasing percentage of specimens testing positive for SARS-CoV-2.
  • The percentage of outpatient and emergency department visits for ILI are below baseline nationally and in all regions of the country; however, increases in the percentage of visits for ILI and CLI were reported in seven of ten HHS surveillance regions, with the largest increases in Regions 4 (South East), 6 (South Central) and 9 (South West/Coast).
    • Systems monitoring ILI and CLI may be influenced by recent changes in health care seeking behavior, including increasing use of telemedicine, recommendations to limit emergency department (ED) visits to severe illnesses, and increased practice of social distancing.
  • The overall cumulative COVID-19 associated hospitalization rate is 102.5 per 100,000, with the highest rates in people 65 years of age and older (306.7 per 100,000) followed by people 50-64 years (155.0 per 100,000). Hospitalization rates are cumulative and will increase as the COVID-19 pandemic continues.
    • Non-Hispanic American Indian or Alaska Native persons have an age-adjusted hospitalization rate approximately 5.7 times that of non-Hispanic White persons, non-Hispanic Black persons have a rate approximately 4.7 times that of non-Hispanic White persons, and Hispanic or Latino persons have a rate approximately 4.5 times that of non-Hispanic White persons.
    • Cumulative hospitalization rates for COVID-19 in adults (18-64 years) at this time are higher than cumulative end-of-season hospitalization rates for influenza over each of the past 5 influenza seasons.
    • For people 65 years and older, current cumulative COVID-19 hospitalization rates at this time are higher than cumulative end-of season hospitalization rates for influenza for 4 of the 5 past influenza seasons; lower only than rates observed during the 2017-18 season.
    • For children (0-17 years), cumulative COVID-19 hospitalization rates are much lower than cumulative influenza hospitalization rates at comparable time points* during recent influenza seasons.
  • Based on death certificate data, the percentage of deaths attributed to pneumonia, influenza or COVID-19 (PIC) decreased from 9.0% during week 25 to 5.9% during week 26, representing the tenth consecutive week during which a declining percentage of deaths due to PIC has been recorded. The percentage is currently at the epidemic threshold but will likely change as additional death certificates for deaths during recent weeks are processed.
*Number of weeks since 10% of specimens tested positive for SARS-CoV-2 and influenza, respectively.

U.S. Virologic Surveillance


The number of specimens tested for SARS-CoV-2 using a molecular assay and reported to CDC by public health laboratories and a subset of clinical and commercial laboratories in the United States are summarized below. All laboratories are performing primary diagnostic functions; therefore, the percentage of specimens testing positive across laboratory types can be used to monitor overall trends in COVID-19 activity. As the outbreak progresses, it is possible that different types of laboratories will take on different roles, and the data interpretation may need to change.
1,873,57119,789,038
225,5572,423,954
115,4831,615,750
1,532,53115,749,334
162,750 (8.7%)1,927,728 (9.7%)
14,234 (6.3%)217,831 (9.0%)
6,669 (5.8%)106,653 (6.6%)
141,847 (9.3%)1,603,244 (10.2%)
* Commercial and clinical laboratory data represents select laboratories and does not capture all tests performed in the United States.
Public Health Laboratories


resize iconView LargerView Data Table

Clinical Laboratories


resize iconView LargerView Data Table

Commercial Laboratories


resize iconView Larger


* Commercial laboratories began testing for SARS-CoV-2 in early March, but the number and geographic distribution of reporting commercial laboratories became stable enough to calculate a weekly percentage of specimens testing positive as of March 29, 2020.
View Data Table


Additional virologic surveillance information: Surveillance Methods


Outpatient/Emergency Department Illness


Two syndromic surveillance systems are being used to monitor trends in outpatient and emergency department visits that may be associated with COVID-19 illness. Each system monitors a slightly different syndrome, and together these systems provide a more comprehensive picture of mild to moderate COVID-19 illness than either would individually. Both systems are currently being affected by recent changes in healthcare seeking behavior, including increased use of telemedicine, compliance with recommendations to limit emergency department (ED) visits to severe illnesses, and increased practice of social distancing. These changes affect the numbers of people seeking care in the outpatient and ED settings and their reasons for doing so.
ILINet


The U.S. Outpatient Influenza-like Illness Surveillance Network (ILINet) provides data on visits for influenza-like illness (ILI) (fever [≥100[SUP]○[/SUP]F] and cough and/or sore throat) to approximately 2,600 primary care providers, emergency departments and urgent care centers in all 50 states, Puerto Rico, the District of Columbia and the U.S. Virgin Islands. Mild COVID-19 illness presents with symptoms similar to ILI, so ILINet is being used to track trends of mild to moderate COVID-19 illness and allows for comparison with prior influenza seasons.

Nationwide during week 26, 1.1% of patient visits reported through ILINet were due to ILI. This percentage is well below the national baseline of 2.4% but is increasing, which is atypical for this time of year. The pattern of increasing percentage of visits for ILI was reported for all age groups. Nationally, laboratory-confirmed influenza activity as reported by clinical laboratories is at levels usually seen during summer months which, along with changes in healthcare seeking behavior and the impact of social distancing, is likely contributing to the low level of ILI activity.

resize iconView Larger


* Age-group specific percentages should not be compared to the national baseline.

On a regional levelexternal icon, the percentage of outpatient visits for ILI ranged from 0.5% to 1.9% during week 26. All ten regions are below their region-specific baselines; however, Region 4 (South East) increased from 1.3% during week 25 to 1.7% during week 26, Region 6 (South Central) increased from 1.4% to 1.9% and Region 7 (Central) increased from 0.6% to 0.8%; Regions 2 (NY/NY/PR), 5 (Midwest), 8 (Mountain), 9 (South West/Coast) and 10 (Pacific Northwest) also reported slight increases.

Note: In response to the COVID-19 pandemic, new data sources will be incorporated into ILINet as we move into summer weeks when lower levels of influenza and other respiratory virus circulation are typical. Starting in week 21, increases in the number of patient visits will be seen as new sites are enrolled and the percentage of visits for ILI may change in comparison to previous weeks. While all regions remain below baseline levels for ILI, these system changes should be kept in mind when drawing conclusions from these data. Any changes in ILI due to changes in respiratory virus circulation will be highlighted here.
Overall Percentage of Visits for ILI | Age Group ILI Data

ILI Activity Levels


Data collected in ILINet are used to produce a measure of ILI activity for all 50 states, Puerto Rico, the District of Columbia and New York City. The mean reported percentage of visits due to ILI for the current week is compared to the mean reported during non-influenza weeks, and the activity levels correspond to the number of standard deviations below, at or above the mean.

The number of jurisdictions at each activity level during week 26 and the change compared to the previous week are summarized in the table below and shown in the following maps.
Activity Level
Week 26
(Week ending
June 27, 2020)
Compared to Previous Week
Very High0No change
High0No change
Moderate0No change
Low1No change
Minimal52+1
Insufficient Data1-1

[TD="colspan: 2"] Number of Jurisdictions [/TD]

*Data collected in ILINet may disproportionally represent certain populations within a state and may not accurately depict the full picture of influenza activity for the whole state. Differences in the data presented here by CDC and independently by some state health departments likely represent differing levels of data completeness with data presented by the state likely being the more complete.
National Syndromic Surveillance Program (NSSP): Emergency Department (ED) Visits


NSSP is a collaboration among CDC, federal partners, local and state health departments and academic and private sector partners to collect, analyze and share electronic patient encounter data received from multiple healthcare settings. To track trends of potential COVID-19 visits, visits for COVID-19-like illness (CLI) (fever and cough or shortness of breath or difficulty breathing or presence of a coronavirus diagnosis code) and ILI to a subset of emergency departments in 47 states are being monitored.

Nationwide during week 26, 2.7% of emergency department visits captured in NSSP were due to CLI and 0.9% were due to ILI. This is the second week of an increasing percentage of visits for CLI and ILI nationally since activity peaked in early April. Compared to week 25, 7 of 10 HHS regionsexternal icon (Regions 4 [South East], 5 [Midwest], 6 [South Central], 7 [Central], 8 [Mountain], 9 [South West/Coast] and 10 [Pacific Northwest]) reported increases in the percentages of visits for both CLI and ILI during week 26. One additional region, Region 1 (New England), reported a slight increase in percentage of visits for ILI during week 26.


Additional information about medically attended outpatient and emergency department visits for ILI and CLI: Surveillance Methods


Hospitalizations


The COVID-19-Associated Hospitalization Surveillance Network (COVID-NET) conducts population-based surveillance for laboratory-confirmed COVID-19-associated hospitalizations in select counties participating in the Emerging Infections Program (EIP) and the Influenza Hospitalization Surveillance Project (IHSP).

A total of 33,277 laboratory-confirmed COVID-19-associated hospitalizations were reported by sites between March 1, 2020 and June 27, 2020. The overall cumulative hospitalization rate was 102.5 per 100,000 population. Among the 0-4 years, 5-17 years, 18-49 years, 50-64 years, and 65 years age groups, the highest rate of hospitalization is among adults aged 65, followed by adults aged 50-64 years and adults aged 18-49 years.
lab-confirmed-hospitalizations.gif

resize iconView Larger
Overall102.5
0-4 years8.9
5-17 years4.0
18-49 years62.6
18-29 years34.7
30-39 years62.5
40-49 years98.6
50-64 years155.0
65+ years306.7
65-74 years222.5
75-84 years370.1
85+ years573.1
Among the 33,277 laboratory-confirmed COVID-19-associated hospitalized cases, 31,486 (94.6%) had information on race and ethnicity while collection of race and ethnicity was still pending for 1791 (5.4%) cases. Non-Hispanic American Indian or Alaska Native persons have an age-adjusted hospitalization rate approximately 5.7 times that of non-Hispanic White persons, non-Hispanic Black persons have a rate approximately 4.7 times that of non-Hispanic White persons, and Hispanic or Latino persons have a rate approximately 4.5 times that of non-Hispanic White persons. Additional data on race and ethnicity by age are available.


Non-Hispanic White persons and non-Hispanic Black persons represent the highest proportions of hospitalized cases reported to COVID-NET, followed by Hispanic or Latino, non-Hispanic Asian or Pacific Islander, and non-Hispanic American Indian or Alaska Native persons. However, some racial and ethnic groups are disproportionately represented among hospitalized cases as compared with the overall population of the catchment area. Prevalence ratios show a similar pattern to that of the age-adjusted hospitalization rates: non-Hispanic American Indian or Alaska Native persons have the highest prevalence ratio, followed by non-Hispanic Black, and Hispanic or Latino persons.
261.3212.8205.057.645.7
1.6%32.5%22.2%4.7%32.6%
0.7%17.7%14.0%8.8%58.8%
2.31.81.60.50.6
[SUP]1[/SUP]COVID-19-associated hospitalization rates by race/ethnicity are calculated using hospitalized COVID-NET cases with known race and ethnicity for the numerator and NCHS bridged-race population estimates for the denominator. Rates are adjusted to account for differences in age distributions within race/ethnicity strata in the COVID-NET catchment area; the age strata used for the adjustment include 0-17, 18-49, 50-64, 65-74, 75-84, 85+ years.

[SUP]2[/SUP] Persons of multiple races (0.2%) or unknown race and ethnicity (6.2%) are not represented in the table but are included as part of the denominator.
[SUP]3[/SUP] Prevalence ratio is calculated as the ratio of the proportion of hospitalized COVID-NET cases over the proportion of population in COVID-NET catchment area.

Among 8,672 hospitalized adults with information on underlying medical conditions, 91% had at least one reported underlying medical condition. The most commonly reported were hypertension, obesity, chronic metabolic disease, and cardiovascular disease. Among 180 hospitalized children with information on underlying conditions, 51.7% had at least one reported underlying medical condition. The most commonly reported were obesity, asthma, and neurologic conditions.
lab-confirmed-hospitalizations-underlying.gif

resize iconView Larger


Additional data on demographics, signs and symptoms at admission, underlying conditions, interventions, outcomes, and discharge diagnoses, stratified by age, sex, and race and ethnicity, are available.

Additional hospitalization surveillance information: Surveillance Methods | Additional rate data | Additional demographic and clinical data


Mortality Surveillance


The National Center for Health Statistics (NCHS) collects death certificate data from vital statistics offices for all deaths occurring in the United States. Based on death certificate data available on July 2, 2020, 5.9% of all deaths occurring during the week ending June 27, 2020 (week 26) were due to pneumonia, influenza or COVID-19 (PIC). This is the tenth consecutive week of a declining percentage of deaths due to PIC. The percentage is equal to the epidemic threshold of 5.9% for week 26. Data for recent weeks are incomplete, and the PIC percentage may increase as more death certificates representing deaths during these weeks are processed.

Weekly mortality surveillance data include a combination of machine coded and manually coded causes of death collected from death certificates. Percentages of deaths due to PIC are higher among manually coded records than more rapidly available machine coded records. Due to the additional time needed for manual coding, the initially reported PIC percentages may be lower than percentages calculated from final data.
nchs-mortality-report.gif

resize iconView Larger


*Data during recent weeks are incomplete because of the lag in time between when the death occurred and when the death certificate is completed, submitted to NCHS and processed for reporting purposes.
View Data Table


Additional NCHS mortality surveillance information: Surveillance Methods | Provisional Death Counts for COVID-19

More Information
View Page In:pdf icon 49 Pages, 2.45 MB
Page last reviewed: July 3, 2020
Content source: National Center for Immunization and Respiratory Diseases (NCIRD), Division of Viral Diseases

https://www.cdc.gov/coronavirus/2019...iew/index.html
 
COVIDView.jpg
  1. CASES, DATA & SURVEILLANCE
COVIDView: A Weekly Surveillance Summary of U.S. COVID-19 Activity


Updated July 10, 2020
Print
Download Weekly Summary pdf icon[13 Pages, 1 MB]
Key Updates for Week 27, ending July 4, 2020


Nationally, levels of influenza-like illness (ILI) and COVID-19-like illness (CLI) activity continue to increase overall. The percentage of specimens testing positive for SARS-CoV-2, the virus that causes COVID-19, decreased slightly from last week; however, this past week included a holiday, which could impact both testing and reporting. Mortality attributed to COVID-19 decreased compared to last week and is currently at the epidemic threshold but will likely increase as additional death certificates are processed.
Virus

Public Health, Commercial and Clinical Laboratories


The overall percentage of respiratory specimens testing positive for SARS-CoV-2 decreased from week 26 (9.2%) to week 27 (8.8%) nationally but increased in five regions. National percentages of specimens testing positive for SARS-CoV-2 by type of laboratory:
  • Public health laboratories – decreased from 6.4% during week 26 to 6.0% during week 27;
  • Clinical laboratories – increased from 5.7% during week 26 to 8.0% during week 27;
  • Commercial laboratories – decreased from 9.9% during week 26 to 9.4% during week 27.
Outpatient and Emergency Department Visits

Outpatient Influenza-Like Illness Network (ILINet) and National Syndromic Surveillance Program (NSSP)


Two surveillance indicators are being used to track outpatient or emergency department (ED) visits for illness with symptoms compatible with COVID-19.
  • Nationally, levels of ILI activity remain below baseline for the twelfth week and in all 10 surveillance regions for the past ten to thirteen weeks. However, most regions reported increases in percentage of visits for ILI, which is atypical for this time of year, and some parts of the country are seeing activity levels higher than levels seen in March and April. CLI also increased this past week.
  • Recent changes in health care seeking behavior, including increasing use of telemedicine, recommendations to limit emergency department (ED) visits to severe illnesses, and increased practice of social distancing, are likely affecting data reported from both networks, making it difficult to draw conclusions at this time. Tracking these systems moving forward will give additional insight into illness related to COVID-19.
Severe Disease

Hospitalizations


Cumulative COVID-19-associated hospitalization rates since March 1, 2020, are updated weekly. The overall cumulative COVID-19 hospitalization rate is 107.2 per 100,000, with the highest rates in people aged 65 years and older (316.9 per 100,000) and 50-64 years (161.7 per 100,000).
Mortality


Based on death certificate data, the percentage of deaths attributed to pneumonia, influenza or COVID-19 (PIC) decreased from 6.9% during week 26 to 5.5% during week 27, representing the eleventh week of a declining percentage of deaths due to PIC. The percentage is currently below the epidemic threshold but will likely change as more death certificates are processed, particularly for recent weeks.

All data are preliminary and may change as more reports are received.

A description of the surveillance systems summarized in COVIDView, including methodology and detailed descriptions of each data component, is available on the surveillance methods page.
Key Points
  • There are increases in the percentage of specimens testing positive for SARS-CoV-2 and percentage of visits for ILI or CLI in multiple parts of the country. Three HHS regions (Regions 4 [South East], 6 [South Central] and 9 [South West/Coast]) are reporting percentage of visits for CLI and/or percentage of specimens testing positive for SARS-CoV-2 at higher levels than was seen in March/April.
  • Using combined data from the three laboratory types, the national percentage of respiratory specimens testing positive for SARS-CoV-2 with a molecular assay decreased slightly from week 26 (9.2%) to week 27 (8.8%).
    • Increases were reported in five of ten HHS surveillance regions: Regions 2 (NY/NJ/Puerto Rico), 4 (South East), 5 (Midwest), 6 (South Central), and 7 (Central).
      • The highest percentages of specimens testing positive for SARS-CoV-2 were seen in Regions 4 (14.1%), 6 (16.8%) and 9 (11.3%).
    • Five regions (Regions 1 [New England], 3 [Mid-Atlantic], 8 [Mountain], 9 [South West/Coast] and 10 [Pacific Northwest] reported a stable or decreasing percentage of specimens testing positive for SARS-CoV-2.
  • The percentage of outpatient and emergency department visits for ILI are below baseline nationally and in all regions of the country; however, increases in the percentage of visits for ILI and/or CLI were reported in seven of ten HHS surveillance regions, with the largest increases in Regions 4 (South East), 6 (South Central) and 9 (South West/Coast).
    • Systems monitoring ILI and CLI may be influenced by recent changes in health care seeking behavior, including increasing use of telemedicine, recommendations to limit emergency department (ED) visits to severe illnesses, and increased practice of social distancing.
  • The overall cumulative COVID-19 associated hospitalization rate is 107.2 per 100,000, with the highest rates in people 65 years of age and older (316.9 per 100,000) followed by people 50-64 years (161.7 per 100,000). Hospitalization rates are cumulative and will increase as the COVID-19 pandemic continues.
    • Non-Hispanic American Indian or Alaska Native persons have an age-adjusted hospitalization rate approximately 5.7 times that of non-Hispanic White persons, non-Hispanic Black persons have a rate approximately 4.7 times that of non-Hispanic White persons, and Hispanic or Latino persons have a rate approximately 4.6 times that of non-Hispanic White persons.
    • Cumulative hospitalization rates for COVID-19 in adults (18-64 years) at this time are higher than cumulative end-of-season hospitalization rates for influenza over each of the past 5 influenza seasons.
    • For people 65 years and older, current cumulative COVID-19 hospitalization rates at this time are higher than cumulative end-of season hospitalization rates for influenza for 4 of the 5 past influenza seasons; lower only than rates observed during the 2017-18 season.
    • For children (0-17 years), cumulative COVID-19 hospitalization rates are much lower than cumulative influenza hospitalization rates at comparable time points* during recent influenza seasons.
  • Based on death certificate data, the percentage of deaths attributed to pneumonia, influenza or COVID-19 (PIC) decreased from 6.9% during week 26 to 5.5% during week 27, representing the eleventh consecutive week during which a declining percentage of deaths due to PIC has been recorded. The percentage is currently below the epidemic threshold but will likely change as additional death certificates for deaths during recent weeks are processed.
*Number of weeks since 10% of specimens tested positive for SARS-CoV-2 and influenza, respectively.

U.S. Virologic Surveillance


The number of specimens tested for SARS-CoV-2 using a molecular assay and reported to CDC by public health laboratories and a subset of clinical and commercial laboratories in the United States are summarized below. All laboratories are performing primary diagnostic functions; therefore, the percentage of specimens testing positive across laboratory types can be used to monitor overall trends in COVID-19 activity. As the outbreak progresses, it is possible that different types of laboratories will take on different roles, and the data interpretation may need to change.
1,723,77022,622,762
227,4842,693,456
134,8182,194,464
1,361,46817,734,842
151,949 (8.8%)2,176,626 (9.6%)
13,589 (6.0%)233,973 (8.7%)
10,837 (8.0%)136,501 (6.2%)
128,077 (9.4%)1,806,152 (10.2%)
* Commercial and clinical laboratory data represent select laboratories and do not capture all tests performed in the United States.
Public Health Laboratories


resize iconView LargerView Data Table

Clinical Laboratories


resize iconView LargerView Data Table

Commercial Laboratories


resize iconView Larger


* Commercial laboratories began testing for SARS-CoV-2 in early March, but the number and geographic distribution of reporting commercial laboratories became stable enough to calculate a weekly percentage of specimens testing positive as of March 29, 2020.
View Data Table


Additional virologic surveillance information: Surveillance Methods


Outpatient/Emergency Department Illness


Two syndromic surveillance systems are being used to monitor trends in outpatient and emergency department visits that may be associated with COVID-19 illness. Each system monitors a slightly different syndrome, and together these systems provide a more comprehensive picture of mild to moderate COVID-19 illness than either would individually. Both systems are currently being affected by recent changes in healthcare seeking behavior, including increased use of telemedicine, compliance with recommendations to limit emergency department (ED) visits to severe illnesses, and increased practice of social distancing. These changes affect the numbers of people seeking care in the outpatient and ED settings and their reasons for doing so.
ILINet


The U.S. Outpatient Influenza-like Illness Surveillance Network (ILINet) provides data on visits for influenza-like illness (ILI) (fever [≥100[SUP]○[/SUP]F] and cough and/or sore throat) to approximately 2,600 primary care providers, emergency departments and urgent care centers in all 50 states, Puerto Rico, the District of Columbia and the U.S. Virgin Islands. Mild COVID-19 illness presents with symptoms similar to ILI, so ILINet is being used to track trends of mild to moderate COVID-19 illness and allows for comparison with prior influenza seasons.

Nationwide during week 27, 1.2% of patient visits reported through ILINet were due to ILI. This percentage is well below the national baseline of 2.4% but is increasing, which is atypical for this time of year compared to previous influenza seasons. The pattern of increasing percentage of visits for ILI was reported for all age groups. Nationally, laboratory-confirmed influenza activity as reported by clinical laboratories is at levels usually seen during summer months which, along with changes in healthcare seeking behavior and the impact of social distancing, is likely contributing to the low level of ILI activity.

resize iconView Larger


* Age-group specific percentages should not be compared to the national baseline.

On a regional levelexternal icon, the percentage of outpatient visits for ILI ranged from 0.5% to 2.2% during week 27. All ten regions are below their region-specific baselines; however, Region 4 (South East) increased from 1.7% during week 26 to 2.1% during week 27, Region 6 (South Central) increased from 1.9% to 2.2%, Region 7 (Central) increased from 0.8% to 0.9%, and Region 10 (Pacific Northwest) increased from 0.7% to 0.8%; Regions 2 (NY/NY/PR) and 8 (Mountain) also reported slight increases.

Note: In response to the COVID-19 pandemic, new data sources will be incorporated into ILINet as we move into summer weeks when lower levels of influenza and other respiratory virus circulation are typical. Starting in week 21, increases in the number of patient visits will be seen as new sites are enrolled and the percentage of visits for ILI may change in comparison to previous weeks. While all regions remain below baseline levels for ILI, these system changes should be kept in mind when drawing conclusions from these data. Any changes in ILI due to changes in respiratory virus circulation will be highlighted here.
Overall Percentage of Visits for ILI | Age Group ILI Data

ILI Activity Levels


Data collected in ILINet are used to produce a measure of ILI activity for all 50 states, Puerto Rico, the District of Columbia and New York City. The mean reported percentage of visits due to ILI for the current week is compared to the mean reported during non-influenza weeks, and the activity levels correspond to the number of standard deviations below, at or above the mean.

The number of jurisdictions at each activity level during week 26 and the change compared to the previous week are summarized in the table below and shown in the following maps.
Activity Level
Week 27
(Week ending
July 4, 2020)
Compared to Previous Week
Very High0No change
High0No change
Moderate0No change
Low3+2
Minimal50-2
Insufficient Data1No change

[TD="colspan: 2"] Number of Jurisdictions [/TD]

*Data collected in ILINet may disproportionally represent certain populations within a state and may not accurately depict the full picture of influenza activity for the whole state. Differences in the data presented here by CDC and independently by some state health departments likely represent differing levels of data completeness with data presented by the state likely being the more complete.
National Syndromic Surveillance Program (NSSP): Emergency Department (ED) Visits


NSSP is a collaboration among CDC, federal partners, local and state health departments and academic and private sector partners to collect, analyze and share electronic patient encounter data received from multiple healthcare settings. To track trends of potential COVID-19 visits, visits for COVID-19-like illness (CLI) (fever and cough or shortness of breath or difficulty breathing or presence of a coronavirus diagnosis code) and ILI to a subset of emergency departments in 47 states are being monitored.

Nationwide during week 27, 3.2% of emergency department visits captured in NSSP were due to CLI and 1.0% were due to ILI. This is the third week of an increasing percentage of visits for CLI and ILI nationally since activity peaked in early April. Compared to week 26, 5 of 10 HHS regionsexternal icon (Regions 4 [South East], 6 [South Central], 7 [Central], 9 [South West/Coast] and 10 [Pacific Northwest]) reported increases in the percentages of visits for both CLI and ILI during week 27. Region 3 (Mid-Atlantic) reported a slight increase in percentage of visits for ILI during week 27, and Region 5 (Midwest) reported an increase in the percentage of visits for ILI during week 27.


Additional information about medically attended outpatient and emergency department visits for ILI and CLI: Surveillance Methods


Hospitalizations


The COVID-19-Associated Hospitalization Surveillance Network (COVID-NET) conducts population-based surveillance for laboratory-confirmed COVID-19-associated hospitalizations in select counties participating in the Emerging Infections Program (EIP) and the Influenza Hospitalization Surveillance Project (IHSP).

A total of 34,791 laboratory-confirmed COVID-19-associated hospitalizations were reported by sites between March 1, 2020 and July 4, 2020. The overall cumulative hospitalization rate was 107.2 per 100,000 population. Among the 0-4 years, 5-17 years, 18-49 years, 50-64 years, and ≥ 65 years age groups, the highest rate of hospitalization is among adults aged ≥ 65, followed by adults aged 50-64 years and adults aged 18-49 years.
lab-confirmed-hospitalizations.gif

resize iconView Larger
Overall107.2
0-4 years9.4
5-17 years4.4
18-49 years66.7
18-29 years37.8
30-39 years66.3
40-49 years104.4
50-64 years161.7
65+ years316.9
65-74 years230.6
75-84 years381.5
85+ years590.3
Among the 34,791 laboratory-confirmed COVID-19-associated hospitalized cases, 32,766 (94.2%) had information on race and ethnicity while collection of race and ethnicity was still pending for 2,025 (5.8%) cases. When examining overall age-adjusted rates by race/ethnicity, non-Hispanic American Indian or Alaska Native persons have an age-adjusted hospitalization rate approximately 5.8 times that of non-Hispanic White persons, non-Hispanic Black persons have a rate approximately 4.7 times that of non-Hispanic White persons, and Hispanic or Latino persons have a rate approximately 4.6 times that of non-Hispanic White persons.


When examining age-stratified crude hospitalization rates by race and ethnicity, compared with non-Hispanic white persons in the same age group, crude hospitalization rates were 8.7 times higher among Hispanic or Latino persons aged 0-17 years; 11.2 times higher among non-Hispanic American Indian or Alaska Native persons aged 18-49 years; 9.9 times higher among non-Hispanic Black persons aged 50-64 years; and 7.0 times higher among non-Hispanic Black person aged ≥65 years. Additional data on race and ethnicity by age are available.
Age Category
Rate[SUP]1[/SUP]Rate Ratio[SUP]2[/SUP]Rate[SUP]1[/SUP]Rate Ratio[SUP]2[/SUP]Rate[SUP]1[/SUP]Rate Ratio[SUP]2[/SUP]Rate[SUP]1[/SUP]Rate Ratio[SUP]2[/SUP]Rate[SUP]1[/SUP]Rate Ratio[SUP]2[/SUP]
0-17y5.94.56.44.911.38.73.42.61.31.0
18-49y185.411.2110.56.7132.78.028.41.716.51.0
50-64y474.28.1583.29.9201.23.492.81.658.81.0
65+y584.23.11328.67.0209.71.1212.51.1189.51.0
Overall rate[SUP]3[/SUP] (age-adjusted)270.55.8221.54.7215.84.660.51.347.01.0

[TD="colspan: 2"] Non-Hispanic
American Indian or Alaska Native
[/TD]
[TD="colspan: 2"] Non-Hispanic Black [/TD]
[TD="colspan: 2"] Hispanic or Latino [/TD]
[TD="colspan: 2"] Non-Hispanic Asian or Pacific Islander [/TD]
[TD="colspan: 2"] Non-Hispanic White [/TD]
[SUP]1[/SUP]COVID-19-associated hospitalization rates by race/ethnicity are calculated using hospitalized COVID-NET cases with known race and ethnicity for the numerator and NCHS bridged-race population estimates for the denominator.
[SUP]2[/SUP]For each age category, rate ratios are the ratios between crude hospitalization rates within each racial/ethnic group and the crude hospitalization rate among non-Hispanic white persons in the same age category.
[SUP]3[/SUP]Overall rates are adjusted to account for differences in age distributions within race/ethnicity strata in the COVID-NET catchment area; the age strata used for the adjustment include 0-17, 18-49, 50-64, and 65+ years.

Non-Hispanic White persons and non-Hispanic Black persons represent the highest proportions of hospitalized cases reported to COVID-NET, followed by Hispanic or Latino, non-Hispanic Asian or Pacific Islander, and non-Hispanic American Indian or Alaska Native persons. However, some racial and ethnic groups are disproportionately represented among hospitalized cases as compared with the overall population of the catchment area. Prevalence ratios show a similar pattern to that of the age-adjusted hospitalization rates: non-Hispanic American Indian or Alaska Native persons have the highest prevalence ratio, followed by non-Hispanic Black, and Hispanic or Latino persons.
1.6%32.6%22.4%4.7%32.2%
0.7%17.7%14.0%8.8%58.8%
2.31.81.60.50.5
[SUP]1[/SUP] Persons of multiple races (0.2%) or unknown race and ethnicity (5.8%) are not represented in the table but are included as part of the denominator.
[SUP]2[/SUP] Prevalence ratio is calculated as the ratio of the proportion of hospitalized COVID-NET cases over the proportion of population in COVID-NET catchment area.

Among 9,130 hospitalized adults with information on underlying medical conditions, 90.9% had at least one reported underlying medical condition. The most commonly reported were hypertension, obesity, chronic metabolic disease, and cardiovascular disease. Among 186 hospitalized children with information on underlying conditions, 51.6% had at least one reported underlying medical condition. The most commonly reported were obesity, asthma, and neurologic conditions.
lab-confirmed-hospitalizations-underlying.gif

resize iconView Larger


Additional data on demographics, signs and symptoms at admission, underlying conditions, interventions, outcomes, and discharge diagnoses, stratified by age, sex, and race and ethnicity, are available.

Additional hospitalization surveillance information: Surveillance Methods | Additional rate data | Additional demographic and clinical data


Mortality Surveillance


The National Center for Health Statistics (NCHS) collects death certificate data from vital statistics offices for all deaths occurring in the United States. Based on death certificate data available on July 9, 2020, 5.5% of all deaths occurring during the week ending July 4, 2020 (week 27) were due to pneumonia, influenza or COVID-19 (PIC). This is the eleventh consecutive week of a declining percentage of deaths due to PIC. The percentage is below the epidemic threshold of 5.8% for week 27, but above the baseline of 5.4%. Data for recent weeks are incomplete, and the PIC percentage may increase as more death certificates representing deaths during these weeks are processed.

Weekly mortality surveillance data include a combination of machine coded and manually coded causes of death collected from death certificates. Percentages of deaths due to PIC are higher among manually coded records than more rapidly available machine coded records. Due to the additional time needed for manual coding, the initially reported PIC percentages may be lower than percentages calculated from final data.
nchs-mortality-report.gif

resize iconView Larger


*Data during recent weeks are incomplete because of the lag in time between when the death occurred and when the death certificate is completed, submitted to NCHS and processed for reporting purposes.
View Data Table


Additional NCHS mortality surveillance information: Surveillance Methods | Provisional Death Counts for COVID-19

More Information
View Page In:pdf icon 13 Pages, 1 MB
Page last reviewed: July 10, 2020
Content source: National Center for Immunization and Respiratory Diseases (NCIRD), Division of Viral Diseases

https://www.cdc.gov/coronavirus/2019...iew/index.html
 
COVIDView.jpg
  1. CASES, DATA & SURVEILLANCE
COVIDView: A Weekly Surveillance Summary of U.S. COVID-19 Activity


Updated July 17, 2020
Print
Download Weekly Summary pdf icon[14 Pages, 1 MB]
Key Updates for Week 28, ending July 11, 2020


Nationally, levels of influenza-like illness (ILI) are low overall, but high for this time of year. Changes in indicators that track COVID-19-like illness (CLI) and laboratory confirmed SARS-CoV-2 were inconsistent during the most recent week, with some increasing but others decreasing. This could be due to changes in healthcare seeking behavior around the holiday that occurred during week 27. However, in several regions, those indicators increased compared to the previous week (week 26), suggesting an increasing trend in many areas of the country. Hospitalizations rates, which typically lag behind illness indicators, show an increasing trend. Mortality attributed to COVID-19 decreased compared to last week but is currently above the epidemic threshold and will likely increase as additional death certificates are processed.
Virus

Public Health, Commercial and Clinical Laboratories


Nationally, the overall percentage of respiratory specimens testing positive for SARS-CoV-2 decreased slightly from week 27 (9.4%) to week 28 (9.2%) but increased in four regions. National percentages of specimens testing positive for SARS-CoV-2 by type of laboratory:
  • Public health laboratories – increased from 6.0% during week 27 to 7.9% during week 28;
  • Clinical laboratories – increased from 6.7% during week 27 to 8.1% during week 28;
  • Commercial laboratories – decreased from 10.2% during week 27 to 9.6% during week 28.
Outpatient and Emergency Department Visits

Outpatient Influenza-Like Illness Network (ILINet) and National Syndromic Surveillance Program (NSSP)


Two surveillance networks are being used to track outpatient or emergency department (ED) visits for illness with symptoms compatible with COVID-19.
  • Nationally, ILI activity remains below baseline for the thirteenth week but has increased for 5 weeks now and is atypically high for this time of year. During week 28, most regions reported increases in the percentage of visits for ILI, and several regions also reported increases in CLI activity.
  • Recent changes in health care seeking behavior, including increasing use of telemedicine, recommendations to limit emergency department (ED) visits to severe illnesses, and increased practice of social distancing, are likely affecting data reported from both networks, making it difficult to draw conclusions at this time. Tracking these systems moving forward will give additional insight into illness related to COVID-19.
Severe Disease

Hospitalizations


Cumulative COVID-19-associated hospitalization rates since March 1, 2020, are updated weekly. The overall cumulative COVID-19 hospitalization rate is 113.6 per 100,000, with the highest rates in people aged 65 years and older (321.8 per 100,000) and 50-64 years (171.8 per 100,000). From June 20 – July 4, there was a two week consecutive increase in overall weekly hospitalization rates, the first multiple-week increase seen since early April.
Mortality


Based on death certificate data, the percentage of deaths attributed to pneumonia, influenza or COVID-19 (PIC) decreased from 8.1% during week 27 to 6.4% during week 28, representing the twelfth week of a declining percentage of deaths due to PIC. The percentage is currently above the epidemic threshold and will likely change as more death certificates are processed, particularly for recent weeks.

All data are preliminary and may change as more reports are received.

A description of the surveillance systems summarized in COVIDView, including methodology and detailed descriptions of each data component, is available on the surveillance methods page.
Key Points
  • There are increases in the percentage of specimens testing positive for SARS-CoV-2 and percentage of visits for ILI and/or CLI in multiple parts of the country. Three HHS regions (Regions 4 [South East], 6 [South Central] and 9 [South West/Coast]) are reporting percentage of visits for CLI and/or percentage of specimens testing positive for SARS-CoV-2 at higher levels than were seen in March/April.
  • Using combined data from the three laboratory types, the national percentage of respiratory specimens testing positive for SARS-CoV-2 with a molecular assay decreased slightly from week 27 (9.4%) to week 28 (9.2%).
    • The highest percentages of specimens testing positive for SARS-CoV-2 were seen in Regions 4 (South East, 14.0%), 6 (South Central, 17.1%) and 9 (South West/Coast, 11.2%).
    • Increases were reported in four of ten HHS surveillance regions: Regions 2 (NY/NJ/Puerto Rico), 5 (Midwest), 7 (Central) and 8 (Mountain).
    • Six HHS regions (Regions 1 [New England], 3 [Mid-Atlantic], 4 [South East], 6 [South Central], 9 [South West/Coast] and 10 [Pacific Northwest]) reported a stable or decreasing percentage of specimens testing positive for SARS-CoV-2 during week 28 compared to week 27. However, the percentage of specimens testing positive for SARS-CoV-2 in Regions 4 (South East) and 6 (South Central) were higher during week 28 than week 26. Week 27 included a holiday that could have affected both testing and reporting practices during that week.
  • The percentage of outpatient and emergency department visits for ILI are below baseline nationally and in all regions of the country; however, increases in the percentage of visits for ILI and/or CLI were reported in seven of ten HHS surveillance regions when compared to week 27 and in nine surveillance regions when compared to week 26. This could be due to changes in healthcare seeking behavior around the holiday that occurred during week 27.
    • Systems monitoring ILI and CLI may be influenced by recent changes in health care seeking behavior, including increasing use of telemedicine, recommendations to limit emergency department (ED) visits to severe illnesses, and increased practice of social distancing.
  • The overall cumulative COVID-19 associated hospitalization rate is 113.6 per 100,000, with the highest rates in people 65 years of age and older (321.8 per 100,000) followed by people 50-64 years (171.8 per 100,000). Hospitalization rates are cumulative and will increase as the pandemic continues.
    • From week 25 – week 27 (June 20 – July 4), there was a two consecutive week increase in overall weekly hospitalization rates. This is the first time since early April that an increase in weekly hospitalization rates has been observed over a multiple-week period.
    • Non-Hispanic American Indian or Alaska Native persons have an age-adjusted hospitalization rate approximately 5.6 times that of non-Hispanic White persons and non-Hispanic Black persons and Hispanic or Latino persons have a rate approximately 4.6 times that of non-Hispanic White persons.
    • Overall cumulative hospitalization rates for COVID-19 at this time are higher than cumulative end-of-season hospitalization rates for influenza over each of the past 5 influenza seasons. However, for children (0-17 years), cumulative COVID-19 hospitalization rates are much lower than cumulative influenza hospitalization rates during recent influenza seasons.
  • Based on death certificate data, the percentage of deaths attributed to pneumonia, influenza or COVID-19 (PIC) decreased from 8.1% during week 27 to 6.4% during week 28, representing the twelfth consecutive week during which a declining percentage of deaths due to PIC has been recorded. The percentage is currently above the epidemic threshold and will likely change as additional death certificates for deaths during recent weeks are processed.
U.S. Virologic Surveillance


The number of specimens tested for SARS-CoV-2 using a molecular assay and reported to CDC by public health laboratories and a subset of clinical and commercial laboratories in the United States are summarized below. All laboratories are performing primary diagnostic functions; therefore, the percentage of specimens testing positive across laboratory types can be used to monitor overall trends in COVID-19 activity. As the outbreak progresses, it is possible that different types of laboratories will take on different roles, and the data interpretation may need to change.
1,650,62225,502,956
249,2613,002,829
141,5692,507,197
1,259,79219,992,930
151,503 (9.2%)2,461,009 (9.6%)
19,680 (7.9%)256,823 (8.6%)
11,512 (8.1%)158,150 (6.3%)
120,311 (9.6%)2,046,036 (10.2%)
* Commercial and clinical laboratory data represent select laboratories and do not capture all tests performed in the United States.
Public Health Laboratories


resize iconView LargerView Data Table

Clinical Laboratories


resize iconView LargerView Data Table

Commercial Laboratories


resize iconView Larger


* Commercial laboratories began testing for SARS-CoV-2 in early March, but the number and geographic distribution of reporting commercial laboratories became stable enough to calculate a weekly percentage of specimens testing positive as of March 29, 2020.
View Data Table


Additional virologic surveillance information: Surveillance Methods


Outpatient/Emergency Department Illness


Two syndromic surveillance systems are being used to monitor trends in outpatient and emergency department visits that may be associated with COVID-19 illness. Each system monitors a slightly different syndrome, and together these systems provide a more comprehensive picture of mild to moderate COVID-19 illness than either would individually. Both systems are currently being affected by recent changes in healthcare seeking behavior, including increased use of telemedicine, compliance with recommendations to limit emergency department (ED) visits to severe illnesses, and increased practice of social distancing. These changes affect the numbers of people seeking care in the outpatient and ED settings and their reasons for doing so.
ILINet


The U.S. Outpatient Influenza-like Illness Surveillance Network (ILINet) provides data on visits for influenza-like illness (ILI) (fever [≥ 100[SUP]○[/SUP]F] and cough and/or sore throat) to approximately 2,600 primary care providers, emergency departments and urgent care centers in all 50 states, Puerto Rico, the District of Columbia and the U.S. Virgin Islands. Mild COVID-19 illness presents with symptoms similar to ILI, so ILINet is being used to track trends of mild to moderate COVID-19 illness and allows for comparison with prior influenza seasons.

Nationwide during week 28, 1.4% of patient visits reported through ILINet were due to ILI. This percentage is well below the national baseline of 2.4% but is increasing, which is atypical for this time of year compared to previous influenza seasons. The pattern of increasing percentage of visits for ILI was reported for 0-4 year olds and persons 25 years of age and older.

resize iconView Larger


* Age-group specific percentages should not be compared to the national baseline.

On a regional levelexternal icon, the percentage of outpatient visits for ILI ranged from 0.5% to 2.3% during week 28. All ten regions are below their region-specific baselines; however, compared to week 27, the percentage of visits for ILI during week 28 increased in seven of the ten regions (Regions 2 [NY/NJ/PR], 3 [Mid-Atlantic], 4 [South East], 5 [Midwest], 7 [Central], 8 [Mountain], and 9 [South/West Coast] and remained stable in two regions (Regions 1 [New England] and 10 [Pacific Northwest]). In Regions 6 (South Central) and 10 [Pacific Northwest), the percentage of visits for ILI reported during week 28 was less than or the same as the percentage reported during week 27 but greater than the percentage reported for week 26. This could be due to changes in healthcare seeking behavior around the holiday that occurred during week 27.

Note: In response to the COVID-19 pandemic, new data sources will be incorporated into ILINet as we move into summer weeks when lower levels of influenza and other respiratory virus circulation are typical. Starting in week 21, increases in the number of patient visits will be seen as new sites are enrolled and the percentage of visits for ILI may change in comparison to previous weeks. While all regions remain below baseline levels for ILI, these system changes should be kept in mind when drawing conclusions from these data. Any changes in ILI due to changes in respiratory virus circulation will be highlighted here.
Overall Percentage of Visits for ILI | Age Group ILI Data

ILI Activity Levels


Data collected in ILINet are used to produce a measure of ILI activity for all 50 states, Puerto Rico, the District of Columbia and New York City. The mean reported percentage of visits due to ILI for the current week is compared to the mean reported during non-influenza weeks, and the activity levels correspond to the number of standard deviations below, at or above the mean.

The number of jurisdictions at each activity level during week 28 and the change compared to the previous week are summarized in the table below and shown in the following maps.
Activity Level
Week 28
(Week ending
July 11, 2020)
Compared to Previous Week
Very High0No change
High0No change
Moderate2+2
Low3No change
Minimal46-4
Insufficient Data3+2

[TD="colspan: 2"] Number of Jurisdictions [/TD]

*Data collected in ILINet may disproportionally represent certain populations within a state and may not accurately depict the full picture of influenza activity for the whole state. Differences in the data presented here by CDC and independently by some state health departments likely represent differing levels of data completeness with data presented by the state likely being the more complete.
National Syndromic Surveillance Program (NSSP): Emergency Department (ED) Visits


NSSP is a collaboration among CDC, federal partners, local and state health departments and academic and private sector partners to collect, analyze and share electronic patient encounter data received from multiple healthcare settings. To track trends of potential COVID-19 visits, visits for COVID-19-like illness (CLI) (fever and cough or shortness of breath or difficulty breathing or presence of a coronavirus diagnosis code) and ILI to a subset of emergency departments in 47 states are being monitored.

Nationwide during week 28, 3.5% of emergency department visits captured in NSSP were due to CLI and 1.1% were due to ILI. In comparison to week 27, this week there was a slight decrease in the percentage of visits for CLI and ILI remained steady. However, both CLI and ILI percentages during week 28 were higher than they were in week 26. This could be due to changes in healthcare seeking behavior around the holiday that occurred during week 27.

During week 28, five of 10 HHS regionsexternal icon (Regions 3 [Mid-Atlantic], 4 [South East], 5 [Midwest], 7 [Central], and 8 [Mountain]) reported a stable or increasing percentages of visits for both CLI and ILI compared to week 27. Three regions (Regions 6 [South Central], 9 [South/West Coast], and 10 [Pacific Northwest] reported a decreasing percentage of visits for CLI and ILI during week 28 compared to week 27 but the week 28 percentage of visits for CLI and/or ILI was higher than what was reported for week 26. This could be due to changes in healthcare seeking behavior around the holiday that occurred during week 27. Regions 1 (New England) and 2 (NY/NJ/PR) have not reported an increase in CLI or ILI in recent weeks.


Additional information about medically attended outpatient and emergency department visits for ILI and CLI: Surveillance Methods


Hospitalizations


The COVID-19-Associated Hospitalization Surveillance Network (COVID-NET) conducts population-based surveillance for laboratory-confirmed COVID-19-associated hospitalizations in select counties participating in the Emerging Infections Program (EIP) and the Influenza Hospitalization Surveillance Project (IHSP).

A total of 37,052 laboratory-confirmed COVID-19-associated hospitalizations were reported by sites between March 1, 2020 and July 11, 2020. The overall cumulative hospitalization rate was 113.6 per 100,000 population. Among the 0-4 years, 5-17 years, 18-49 years, 50-64 years, and 65 years age groups, the highest rate of hospitalization is among adults aged 65, followed by adults aged 50-64 years and adults aged 18-49 years.
lab-confirmed-hospitalizations.gif

resize iconView Larger
Overall113.6
0-4 years10.6
5-17 years5.3
18-49 years72.4
18-29 years42.7
30-39 years70.9
40-49 years112.5
50-64 years171.8
65+ years321.8
65-74 years236.1
75-84 years382.1
85+ years607.3
From June 20 (MMWR week 25) – July 4 (MMWR week 27), there was a two consecutive week increase in overall weekly hospitalization rates. This is the first time since early April that an increase in weekly hospitalization rates has been observed over a multiple-week period. Data for week ending July 11 (MMWR week 28) currently show a decline; however, those data are likely to change as more data for admissions occurring during that week are received.
covid-19-associated.gif

resize iconView Larger
Among the 37,052 laboratory-confirmed COVID-19-associated hospitalized cases, 34,669 (93.6%) had information on race and ethnicity while collection of race and ethnicity was still pending for 2,383 (6.4%) cases. When examining overall age-adjusted rates by race/ethnicity, non-Hispanic American Indian or Alaska Native persons have an age-adjusted hospitalization rate approximately 5.6 times that of non-Hispanic White persons. Rates for non-Hispanic Black persons and Hispanic or Latino persons were approximately 4.6 times the rate among non-Hispanic White persons.


When examining age-stratified crude hospitalization rates by race and ethnicity, compared with non-Hispanic white persons in the same age group, crude hospitalization rates were 8.1 times higher among Hispanic or Latino persons persons aged 0-17 years; 10.6 times higher among non-Hispanic American Indian or Alaska Native persons aged 18-49 years; 7.6 times higher among non-Hispanic American Indian or Alaska Native persons aged 50-64 years; and 3.8 times higher among non-Hispanic Black person aged ≥ 65 years.
Age Category
Rate[SUP]1[/SUP]Rate Ratio[SUP]2[/SUP]Rate[SUP]1[/SUP]Rate Ratio[SUP]2[/SUP]Rate[SUP]1[/SUP]Rate Ratio[SUP]2[/SUP]Rate[SUP]1[/SUP]Rate Ratio[SUP]2[/SUP]Rate[SUP]1[/SUP]Rate Ratio[SUP]2[/SUP]
0-17y7.84.68.24.813.88.13.62.11.71.0
18-49y20110.6107.75.7177.79.431.91.718.91.0
50-64y491.87.6353.85.5387.46.0102.81.664.91.0
65+y5933.0743.13.8474.62.4196.11.0196.31.0
Overall rate[SUP]3[/SUP] (age-adjusted)273.05.6227.14.6224.24.662.71.349.01.0

[TD="colspan: 2"] Non-Hispanic
American Indian or Alaska Native
[/TD]
[TD="colspan: 2"] Non-Hispanic Black [/TD]
[TD="colspan: 2"] Hispanic or Latino [/TD]
[TD="colspan: 2"] Non-Hispanic Asian or Pacific Islander [/TD]
[TD="colspan: 2"] Non-Hispanic White [/TD]
[SUP]1[/SUP] COVID-19-associated hospitalization rates by race/ethnicity are calculated using hospitalized COVID-NET cases with known race and ethnicity for the numerator and NCHS bridged-race population estimates for the denominator.
[SUP]2[/SUP] For each age category, rate ratios are the ratios between crude hospitalization rates within each racial/ethnic group and the crude hospitalization rate among non-Hispanic white persons in the same age category.
[SUP]3[/SUP] Overall rates are adjusted to account for differences in age distributions within race/ethnicity strata in the COVID-NET catchment area; the age strata used for the adjustment include 0-17, 18-49, 50-64, and 65+ years.

Non-Hispanic White persons and non-Hispanic Black persons represent the highest proportions of hospitalized cases reported to COVID-NET, followed by Hispanic or Latino, non-Hispanic Asian or Pacific Islander, and non-Hispanic American Indian or Alaska Native persons. However, some racial and ethnic groups are disproportionately represented among hospitalized cases as compared with the overall population of the catchment area. Prevalence ratios show a similar pattern to that of the age-adjusted hospitalization rates: non-Hispanic American Indian or Alaska Native persons have the highest prevalence ratio, followed by non-Hispanic Black, and Hispanic or Latino persons.
1.5%32.6%22.7%4.8%32.0%
0.7%17.7%14.0%8.8%58.8%
2.11.81.60.50.5
[SUP]1[/SUP] Persons of multiple races (0.2%) or unknown race and ethnicity (6.1%) are not represented in the table but are included as part of the denominator.
[SUP]2[/SUP] Prevalence ratio is calculated as the ratio of the proportion of hospitalized COVID-NET cases over the proportion of population in COVID-NET catchment area.

Among 9,736 hospitalized adults with information on underlying medical conditions, 90.9% had at least one reported underlying medical condition. The most commonly reported were hypertension, obesity, chronic metabolic disease and cardiovascular disease. Among 199 hospitalized children with information on underlying conditions, 51.3% had at least one reported underlying medical condition. The most commonly reported were obesity, asthma and neurologic conditions.
lab-confirmed-hospitalizations-underlying.gif

resize iconView Larger


Additional data on demographics, signs and symptoms at admission, underlying conditions, interventions, outcomes, and discharge diagnoses, stratified by age, sex, and race and ethnicity, are available.

Additional hospitalization surveillance information: Surveillance Methods | Additional rate data | Additional demographic and clinical data


Mortality Surveillance


The National Center for Health Statistics (NCHS) collects death certificate data from vital statistics offices for all deaths occurring in the United States. Based on death certificate data available on July 16, 2020, 6.4% of all deaths occurring during the week ending July 11, 2020 (week 28) were due to pneumonia, influenza or COVID-19 (PIC). This is the twelfth consecutive week of a declining percentage of deaths due to PIC. The percentage is above the epidemic threshold of 5.7% for week 28. Data for recent weeks are incomplete, and the PIC percentage may increase as more death certificates representing deaths during these weeks are processed.

Weekly mortality surveillance data include a combination of machine coded and manually coded causes of death collected from death certificates. Percentages of deaths due to PIC are higher among manually coded records than more rapidly available machine coded records. Due to the additional time needed for manual coding, the initially reported PIC percentages may be lower than percentages calculated from final data.
nchs-mortality-report.gif

resize iconView Larger


*Data during recent weeks are incomplete because of the lag in time between when the death occurred and when the death certificate is completed, submitted to NCHS and processed for reporting purposes.
View Data Table


Additional NCHS mortality surveillance information: Surveillance Methods | Provisional Death Counts for COVID-19

More Information
View Page In:pdf icon 14 Pages, 1 MB
Page last reviewed: July 17, 2020
Content source: National Center for Immunization and Respiratory Diseases (NCIRD), Division of Viral DiseaseshomeCases, Data & Surveillance
email_03Get Email Updates

To receive email updates about COVID-19, enter your email address:
Email Address
What's this?
Submit
Spanish Resources
https://www.cdc.gov/coronavirus/2019...iew/index.html
 
COVIDView.jpg
  1. CASES, DATA & SURVEILLANCE
COVIDView: A Weekly Surveillance Summary of U.S. COVID-19 Activity


Updated July 24, 2020
Print
Download Weekly Summary pdf icon[14 Pages, 1 MB]
Key Updates for Week 29, ending July 18, 2020


Nationally, levels of influenza-like illness (ILI) are below baseline, but higher than typically seen at this time of year. Indicators that track COVID-19-like illness (CLI) and laboratory confirmed SARS-CoV-2 showed decreases from week 28 to week 29 nationally; however there were regional differences. Areas of the country with high levels of CLI and laboratory confirmed SARS-CoV-2 in recent weeks (Regions 4 [South East], 6 [South Central] and 9 [South West/ Coast]) are starting to show signs of decreasing activity whereas other parts of the country (Regions 7 [Midwest], 5 [Central] and 8 [Mountain]) are increasing. Hospitalization rates show an increasing trend. Mortality attributed to COVID-19 remains above the epidemic threshold and increased slightly during the first two weeks of July after declining for 11 weeks since mid-April.
Virus

Public Health, Commercial and Clinical Laboratories


Nationally, the overall percentage of respiratory specimens testing positive for SARS-CoV-2 decreased from week 28 (9.3%) to week 29 (8.6%) but increased in four regions. National percentages of specimens testing positive for SARS-CoV-2 by type of laboratory:
  • Public health laboratories – increased from 7.5% during week 28 to 8.0% during week 29;
  • Clinical laboratories – decreased from 7.2% during week 28 to 5.7% during week 29;
  • Commercial laboratories – decreased from 9.9% during week 28 to 9.1% during week 29.
Outpatient and Emergency Department Visits

Outpatient Influenza-Like Illness Network (ILINet) and National Syndromic Surveillance Program (NSSP)


Two surveillance networks are being used to track outpatient or emergency department (ED) visits for illness with symptoms compatible with COVID-19.
  • Nationally, ILI activity remains below baseline for the fourteenth week but is higher than typically seen at this time of year.
  • During week 29, most regions had only slight changes in the percentage of visits for ILI or CLI; however, Regions 4 (South East), 6 (South Central) and 9 (South West/ Coast) reported a decrease in the percentage of visits for CLI.
  • Recent changes in health care seeking behavior, including increasing use of telemedicine, recommendations to limit emergency department (ED) visits to severe illnesses, and increased practice of social distancing, are likely affecting data reported from both networks, making it difficult to draw conclusions at this time. Tracking these systems moving forward will give additional insight into illness related to COVID-19.
Severe Disease

Hospitalizations


Cumulative COVID-19-associated hospitalization rates since March 1, 2020, are updated weekly. The overall cumulative COVID-19 hospitalization rate is 120.9 per 100,000, with the highest rates in people aged 65 years and older (338.2 per 100,000) and 50-64 years (182.3 per 100,000). From June 20 – July 11, overall weekly hospitalization rates increased for three consecutive weeks.
Mortality


Based on death certificate data, the percentage of deaths attributed to pneumonia, influenza or COVID-19 (PIC) increased from week 26 – week 28 (June 27 – July 11) for the first time since mid-April. The percentage for week 29 is 9.1% and currently lower than the percentage during week 28 (11.5%); however,the percentage remains above the epidemic threshold. These percentages will likely change as more death certificates are processed.

All data are preliminary and may change as more reports are received.

A description of the surveillance systems summarized in COVIDView, including methodology and detailed descriptions of each data component, is available on the surveillance methods page.
Key Points
  • There are increases in the percentage of specimens testing positive for SARS-CoV-2 and the percentage of visits for ILI and/or CLI in multiple parts of the country. Three HHS regions (Regions 4 [South East], 6 [South Central] and 9 [South West/Coast]) are reporting percentage of visits for CLI and/or percentage of specimens testing positive for SARS-CoV-2 at higher levels than were seen in March/April, but these regions are starting to show evidence of declines in activity following the early July peak.
  • Using combined data from the three laboratory types, the national percentage of respiratory specimens testing positive for SARS-CoV-2 with a molecular assay decreased from week 28 (9.3%) to week 29 (8.6%).
    • The highest percentages of specimens testing positive for SARS-CoV-2 were seen in Regions 4 (South East, 13.9%), 6 (South Central, 15.7%) and 9 (South West/Coast, 9.7%).
    • Increasing trends in the percentage of specimens testing positive for SARS-CoV-2 were reported in four of ten HHS surveillance regions: Regions 2 (NY/NJ/Puerto Rico), 5 (Midwest), 7 (Central) and 8 (Mountain).
  • The percentage of outpatient and ED visits for ILI are below baseline nationally and in all regions of the country; however, ILI activity is above what is typical for this time of year. The percentage of visits to EDs for CLI decreased nationally and in the 3 regions (Region 4 [South East], 6 [South Central] and 9 [South West/ Coast] that were previously reporting the highest levels of CLI activity. CLI remained stable in the remaining areas of the country.
    • Systems monitoring ILI and CLI may be influenced by recent changes in health care seeking behavior, including increasing use of telemedicine, recommendations to limit emergency department (ED) visits to severe illnesses, and increased practice of social distancing.
  • The overall cumulative COVID-19-associated hospitalization rate is 120.9 per 100,000; rates were highest in people 65 years of age and older (338.2 per 100,000) followed by people 50-64 years (182.3 per 100,000). Hospitalization rates are cumulative and will increase as the pandemic continues.
    • From week 25 – week 28 (weeks ending June 20 – July 11), overall weekly hospitalization rates increased for three consecutive weeks.
    • Non-Hispanic American Indian or Alaska Native persons have an age-adjusted hospitalization rate approximately 5.3 times that of non-Hispanic White persons. Rates for non-Hispanic Black persons and Hispanic or Latino persons are approximately 4.7 and 4.6 times the rate among non-Hispanic White persons, respectively.
    • Over a period of time similar to the length of an influenza season, overall cumulative hospitalization rates for COVID-19 are higher than cumulative end-of-season hospitalization rates for influenza for each of the past 5 influenza seasons. However, for children (0-17 years), cumulative COVID-19 hospitalization rates are lower than cumulative influenza hospitalization rates during recent influenza seasons.
  • Based on death certificate data, the percentage of deaths attributed to pneumonia, influenza or COVID-19 (PIC) increased from week 26 – week 28 (weeks ending June 27 – July 11) after declining for 11 weeks since mid-April. The percentage of deaths due to PIC for week 29 is 9.1%, lower than the percentage during week 28 (11.5%), but above the epidemic threshold. These percentages will likely change as more death certificates are processed.
U.S. Virologic Surveillance


The number of specimens tested for SARS-CoV-2 using a molecular assay and reported to CDC by public health laboratories and a subset of clinical and commercial laboratories in the United States are summarized below. All laboratories are performing primary diagnostic functions; therefore, the percentage of specimens testing positive across laboratory types can be used to monitor overall trends in COVID-19 activity. As the outbreak progresses, it is possible that different types of laboratories will take on different roles, and the data interpretation may need to change.
1,796,22328,745,587
246,8393,342,648
168,3892,834,547
1,380,99522,568,392
155,204 (8.6%)2,762,464 (9.6%)
19,771 (8.0%)285,259 (8.5%)
9,615 (5.7%)177,956 (6.3%)
125,818 (9.1%)2,299,249 (10.2%)
* Commercial and clinical laboratory data represent select laboratories and do not capture all tests performed in the United States.
Public Health Laboratories


resize iconView LargerView Data Table

Clinical Laboratories


resize iconView LargerView Data Table

Commercial Laboratories


resize iconView Larger


* Commercial laboratories began testing for SARS-CoV-2 in early March, but the number and geographic distribution of reporting commercial laboratories became stable enough to calculate a weekly percentage of specimens testing positive as of March 29, 2020.
View Data Table


Additional virologic surveillance information: Surveillance Methods


Outpatient/Emergency Department Illness


Two syndromic surveillance systems are being used to monitor trends in outpatient and emergency department visits that may be associated with COVID-19 illness. Each system monitors a slightly different syndrome, and together, these systems provide a more comprehensive picture of mild-to-moderate COVID-19 illness than either would individually. Both systems are currently being affected by changes in health care seeking behavior, including increased use of telemedicine, compliance with recommendations to limit emergency department (ED) visits to severe illnesses, and increased social distancing. These changes affect the numbers of people seeking care in the outpatient and ED settings and their reasons for doing so.
ILINet


The U.S. Outpatient Influenza-like Illness Surveillance Network (ILINet) provides data on visits for influenza-like illness (ILI) (fever [≥ 100[SUP]○[/SUP]F] and cough and/or sore throat) to approximately 2,600 primary care providers, emergency departments and urgent care centers in all 50 states, Puerto Rico, the District of Columbia and the U.S. Virgin Islands. Mild COVID-19 illness presents with symptoms similar to ILI, so ILINet is being used to track trends of mild to moderate COVID-19 illness and allows for comparison with prior influenza seasons.

Nationwide during week 29, 1.4% of patient visits reported through ILINet were due to ILI. This percentage is well below the national baseline of 2.4% and, while low overall, is higher than what is typical for this time of year compared to previous influenza seasons. Compared to week 28, the percentage of visits for ILI during week 29 was slightly higher for 0-4 year olds but slightly lower for all other age groups.

resize iconView Larger


* Age-group specific percentages should not be compared to the national baseline.

On a regional levelexternal icon, the percentage of outpatient visits for ILI ranged from 0.5% to 2.2% during week 29. All ten regions are below their region-specific baselines and reported only slight fluctuations in the percentrage of visits for ILI during week 29 compared to week 28.

Note: In response to the COVID-19 pandemic, new data sources will be incorporated into ILINet as we move into summer weeks when lower levels of influenza and other respiratory virus circulation are typical. Starting in week 21, increases in the number of patient visits will be seen as new sites are enrolled and the percentage of visits for ILI may change in comparison to previous weeks. While all regions remain below baseline levels for ILI, these system changes should be considered when drawing conclusions from these data. Any changes in ILI due to changes in respiratory virus circulation will be highlighted here.
Overall Percentage of Visits for ILI | Age Group ILI Data

ILI Activity Levels


Data collected in ILINet are used to produce a measure of ILI activity for all 50 states, Puerto Rico, the District of Columbia and New York City. The mean reported percentage of visits due to ILI for the current week is compared to the mean reported during non-influenza weeks, and the activity levels correspond to the number of standard deviations below, at or above the mean.

The number of jurisdictions at each activity level during week 29 and the change compared to the previous week are summarized in the table below and shown in the following maps.
Activity Level
Week 29
(Week ending
July 18, 2020)
Compared to Previous Week
Very High0No change
High0No change
Moderate2No change
Low3+1
Minimal48-1
Insufficient Data1No change

[TD="colspan: 2"] Number of Jurisdictions [/TD]

*Data collected in ILINet may disproportionally represent certain populations within a state and may not accurately depict the full picture of influenza activity for the whole state. Differences in the data presented here by CDC and independently by some state health departments likely represent differing levels of data completeness with data presented by the state likely being the more complete.
National Syndromic Surveillance Program (NSSP): Emergency Department (ED) Visits


NSSP is a collaboration among CDC, federal partners, local and state health departments and academic and private sector partners to collect, analyze and share electronic patient encounter data received from multiple healthcare settings. To track trends of potential COVID-19 visits, visits for COVID-19-like illness (CLI) (fever and cough or shortness of breath or difficulty breathing or presence of a coronavirus diagnosis code) and ILI to a subset of emergency departments in 47 states are being monitored.

Nationwide during week 29, 3.5% of emergency department visits captured in NSSP were due to CLI and 1.0% were due to ILI. In comparison to week 28, this week there was a decrease in the percentage of visits for both CLI and ILI. However, the percentage of visits for CLI increased from week 23 through week 28, and trends presented this week may change as more ED visit data are received.

During week 29, seven of ten HHS regionsexternal icon (Regions 1 [New England], 2 [NY/NJ/Puerto Rico], 3 [Mid-Atlantic], 5 [Midwest], 7 [Central], 9 [Mountain] and 10 [Pacific Northwest]) reported only slight fluctuations in percentage of visits for CLI compared to week 28. Three regions (Regions 4 [South East], 6 [South Central] and 9 [South West/Coast]) that have been reporting elevated levels of CLI for several weeks, reported declines in week 29 compared to week 28.


Additional information about medically attended outpatient and emergency department visits for ILI and CLI: Surveillance Methods


Hospitalizations


The COVID-19-Associated Hospitalization Surveillance Network (COVID-NET) conducts population-based surveillance for laboratory-confirmed COVID-19-associated hospitalizations in select counties participating in the Emerging Infections Program (EIP) and the Influenza Hospitalization Surveillance Project (IHSP).

A total of 39,432 laboratory-confirmed COVID-19-associated hospitalizations were reported by sites between March 1, 2020 and July 18, 2020. The overall cumulative hospitalization rate is 120.9 per 100,000 population. Among the 0-4 years, 5-17 years, 18-49 years, 50-64 years, and ≥ 65 years age groups, the highest rate of hospitalization is among adults aged ≥ 65, followed by adults aged 50-64 years and adults aged 18-49 years.
lab-confirmed-hospitalizations.gif

resize iconView Larger
Overall120.9
0-4 years11.2
5-17 years5.8
18-49 years78.6
18-29 years47.1
30-39 years77.2
40-49 years121.0
50-64 years182.3
65+ years338.2
65-74 years249.6
75-84 years400.1
85+ years635.1
From June 20 (MMWR week 25) – July 11 (MMWR week 28), overall weekly hospitalization rates increased for three consecutive weeks. . Data for the week ending July 18 (MMWR week 29) currently show a decline; however, those data are likely to change as more data for admissions occurring during that week are received.
lab-confirmed-hospitalizations-weekly.gif

resize iconView Larger
Among the 39,432 laboratory-confirmed COVID-19-associated hospitalized cases, 37,108 (94.1%) have information on race and ethnicity, while collection of race and ethnicity is still pending for 2,324 (5.9%) cases. When examining overall age-adjusted rates by race/ethnicity, non-Hispanic American Indian or Alaska Native persons have an age-adjusted hospitalization rate approximately 5.3 times that of non-Hispanic White persons. Rates for non-Hispanic Black persons and Hispanic or Latino persons are approximately 4.7 and 4.6 times the rate among non-Hispanic White persons, respectively.


When examining age-stratified crude hospitalization rates by race and ethnicity, compared with non-Hispanic white persons in the same age group, crude hospitalization rates are 7.5 times higher among Hispanic or Latino persons aged 0-17 years; 9.8 times higher among non-Hispanic American Indian or Alaska Native persons aged 18-49 years; 7.4 times higher among non-Hispanic American Indian or Alaska Native persons aged 50-64 years; and 3.8 times higher among non-Hispanic Black persons aged ≥ 65 years.
Age Category
Rate[SUP]1[/SUP]Rate Ratio[SUP]2[/SUP]Rate[SUP]1[/SUP]Rate Ratio[SUP]2[/SUP]Rate[SUP]1[/SUP]Rate Ratio[SUP]2[/SUP]Rate[SUP]1[/SUP]Rate Ratio[SUP]2[/SUP]Rate[SUP]1[/SUP]Rate Ratio[SUP]2[/SUP]
0-17y7.83.99.24.614.97.53.61.82.01.0
18-49y205.89.8120.05.7190.89.134.81.720.91.0
50-64y510.47.4381.05.5414.36.0107.01.569.31.0
65+y597.22.9784.53.8513.42.5204.51.0206.91.0
Overall rate[SUP]3[/SUP] (age-adjusted)281.05.3246.84.7242.54.666.71.353.01.0

[TD="colspan: 2"] Non-Hispanic
American Indian or Alaska Native
[/TD]
[TD="colspan: 2"] Non-Hispanic Black [/TD]
[TD="colspan: 2"] Hispanic or Latino [/TD]
[TD="colspan: 2"] Non-Hispanic Asian or Pacific Islander [/TD]
[TD="colspan: 2"] Non-Hispanic White [/TD]
[SUP]1[/SUP] COVID-19-associated hospitalization rates by race/ethnicity are calculated using hospitalized COVID-NET cases with known race and ethnicity for the numerator and NCHS bridged-race population estimates for the denominator.
[SUP]2[/SUP] For each age category, rate ratios are the ratios between crude hospitalization rates within each racial/ethnic group and the crude hospitalization rate among non-Hispanic white persons in the same age category.
[SUP]3[/SUP] Overall rates are adjusted to account for differences in age distributions within race/ethnicity strata in the COVID-NET catchment area; the age strata used for the adjustment include 0-17, 18-49, 50-64, and 65+ years.

Non-Hispanic Black persons and non-Hispanic White persons represent the highest proportions of hospitalized cases reported to COVID-NET, followed by Hispanic or Latino, non-Hispanic Asian or Pacific Islander, and non-Hispanic American Indian or Alaska Native persons. However, some racial and ethnic groups are disproportionately represented among hospitalized cases as compared with the overall population of the catchment area. Prevalence ratios show a similar pattern to that of the age-adjusted hospitalization rates: non-Hispanic American Indian or Alaska Native persons have the highest prevalence ratio, followed by non-Hispanic Black, and Hispanic or Latino persons.
1.5%32.9%22.8%4.7%31.8%
0.7%17.7%14.0%8.8%58.8%
2.11.91.60.50.5
[SUP]1[/SUP] Persons of multiple races (0.2%) or unknown race and ethnicity (6.1%) are not represented in the table but are included as part of the denominator.
[SUP]2[/SUP] Prevalence ratio is calculated as the ratio of the proportion of hospitalized COVID-NET cases over the proportion of population in COVID-NET catchment area.

Among 10,227 hospitalized adults with information on underlying medical conditions, 90.9% have at least one reported underlying medical condition. The most commonly reported were hypertension, obesity, chronic metabolic disease, and cardiovascular disease. Among 217 hospitalized children with information on underlying conditions, 52.1% had at least one reported underlying medical condition. The most commonly reported were obesity, asthma, and neurologic conditions.
lab-confirmed-hospitalizations-underlying.gif

resize iconView Larger


Additional data on demographics, signs and symptoms at admission, underlying conditions, interventions, outcomes, and discharge diagnoses, stratified by age, sex, and race and ethnicity, are available.

Additional hospitalization surveillance information: Surveillance Methods | Additional rate data | Additional demographic and clinical data


Mortality Surveillance


The National Center for Health Statistics (NCHS) collects death certificate data from vital statistics offices for all deaths occurring in the United States. Based on death certificate data available on July 23, 2020, the percentage of deaths attributed to pneumonia, influenza or COVID-19 (PIC) increased from week 26 – week 28 (June 27 – July 11) after declining for 11 weeks since mid-April. The percentage of deaths due to PIC for week 29 is 9.1% and, while lower than the percentage during week 28 (11.5%), remains above the epidemic threshold. These percentages will likely change as more death certificates are processed.

Weekly mortality surveillance data include a combination of machine coded and manually coded causes of death collected from death certificates. Percentages of deaths due to PIC are higher among manually coded records than more rapidly available machine coded records. Due to the additional time needed for manual coding, the initially reported PIC percentages may be lower than percentages calculated from final data.
nchs-mortality-report.gif

resize iconView Larger


*Data during recent weeks are incomplete because of the lag in time between when the death occurred and when the death certificate is completed, submitted to NCHS and processed for reporting purposes.
View Data Table


Additional NCHS mortality surveillance information: Surveillance Methods | Provisional Death Counts for COVID-19

More Information
View Page In:pdf icon 14 Pages, 1 MB
Last Updated July 24, 2020
Content source: National Center for Immunization and Respiratory Diseases (NCIRD), Division of Viral DiseaseshomeCases, Data & Surveillance
email_03Get Email Updates

To receive email updates about COVID-19, enter your email address:
Email Address
What's this?
Submit
Spanish Resources
https://www.cdc.gov/coronavirus/2019...iew/index.html
 
COVIDView Summary ending on July 25, 2020


Updated July 31, 2020
Print
Download Weekly Summary pdf icon[15 Pages, 1 MB]
Key Updates for Week 30, ending July 25, 2020


Nationally, levels of influenza-like illness (ILI) are below baseline but higher than typically seen at this time of year. Indicators that track ILI and COVID-19-like illness (CLI) showed decreases nationally from week 29 to week 30, with decreasing or stable levels in nearly all regions of the country. Nationally, the percentage of laboratory tests positive for SARS-CoV-2 remained stable from week 29 to week 30 but increased in six of ten HHS regions. Weekly hospitalization rates and mortality attributed to COVID-19 declined during week 30 but may change as more data for admissions and deaths occurring during the most recent weeks are received. Mortality attributed to COVID-19 remains above the epidemic threshold.
Virus

Public Health, Commercial and Clinical Laboratories


Nationally, the overall percentage of respiratory specimens testing positive for SARS-CoV-2 was 8.7% for both weeks 29 and 30; however, increases were seen in six regions. National percentages of specimens testing positive for SARS-CoV-2 by type of laboratory are listed as follows:
  • Public health laboratories – increased from 7.5% during week 29 to 8.3% during week 30;
  • Clinical laboratories – increased from 6.4% during week 29 to 7.3% during week 30;
  • Commercial laboratories – decreased from 9.2% during week 29 to 8.9% during week 30.
Outpatient and Emergency Department Visits

Outpatient Influenza-Like Illness Network (ILINet) and National Syndromic Surveillance Program (NSSP)


Two surveillance networks are being used to track outpatient or emergency department (ED) visits for illness with symptoms compatible with COVID-19.
  • Nationally, ILI activity remains below baseline for the fifteenth week but is higher than typically seen at this time of year.
  • During week 30, the percentage of visits for ILI, but not CLI, increased in Region 2 (NY/NJ/Puerto Rico) compared to week 29; the percentages of visits for ILI and CLI decreased or were stable in all other regions.
  • Recent changes in health care seeking behavior, including increasing use of telemedicine, recommendations to limit emergency department (ED) visits to severe illnesses, and increased social distancing, are likely affecting data reported from both networks, making it difficult to draw conclusions at this time. Tracking these systems moving forward will give additional insight into illness related to COVID-19.
Severe Disease

Hospitalizations


Cumulative COVID-19-associated hospitalization rates since March 1, 2020, are updated weekly. The overall cumulative COVID-19 hospitalization rate is 130.1 per 100,000, with the highest rates in people aged 65 years and older (360.2 per 100,000) and 50-64 years (196.3 per 100,000).
Mortality


Based on death certificate data, the percentage of deaths attributed to pneumonia, influenza or COVID-19 (PIC) increased from week 26 – week 28 (June 27 – July 11) for the first time since mid-April. The percentage for week 30 is 8.6% and currently lower than the percentage during week 29 (12.0%); however, the percentage remains above the epidemic threshold. Percentages for recent weeks will likely increase as more death certificates are processed.

All data are preliminary and may change as more reports are received.

A description of the surveillance systems summarized in COVIDView, including methodology and detailed descriptions of each data component, is available on the surveillance methods page.
Key Points
  • The percentage of specimens testing positive for SARS-CoV-2 increased in six of ten HHS regions, but the percentages of visits for ILI and CLI decreased or remained stable in nine of ten regions. The percentage of visits for ILI increased in Region 2 (NY/NJ/Puerto Rico) compared to last week.
  • Using combined data from the three laboratory types, the national percentage of respiratory specimens testing positive for SARS-CoV-2 with a molecular assay remained stable from week 29 to week 30 at 8.7%.
    • The highest percentages of specimens testing positive for SARS-CoV-2 were seen in Regions 4 (South East, 13.6%), 6 (South Central, 16.5%) and 9 (South West/Coast, 8.9%); however, the percentages are decreasing in Regions 4 (South East) and 9 (South West/Coast) following peaks seen in weeks 28 and 27, respectively.
    • Increases in the percentage of specimens testing positive for SARS-CoV-2 were reported in six of ten HHS surveillance regions: Regions 2 (NY/NJ/Puerto Rico), 5 (Midwest), 6 (South Central), 7 (Central), 8 (Mountain) and 10 (Pacific Northwest).
  • The percentage of outpatient and ED visits for ILI are below baseline nationally and in all regions of the country; however, ILI activity is above what is typical for this time of year. The percentage of visits to EDs for CLI decreased nationally for the second consecutive week, and compared to the previous week, decreased or remained stable in all ten HHS regions.
    • Systems monitoring ILI and CLI may be influenced by recent changes in health care seeking behavior, including increasing use of telemedicine, recommendations to limit emergency department (ED) visits to severe illnesses, and increased social distancing.
  • The overall cumulative COVID-19-associated hospitalization rate was 130.1 per 100,000; rates were highest in people 65 years of age and older (360.2 per 100,000) followed by people 50-64 years (196.3 per 100,000). Cumulative hospitalization rates will increase as the pandemic continues.
    • From week 25 – week 28 (weeks ending June 20 – July 11), overall weekly hospitalization rates increased for three consecutive weeks.
    • Non-Hispanic American Indian or Alaska Native persons had an age-adjusted hospitalization rate approximately 5.3 times that of non-Hispanic White persons. Rates among non-Hispanic Black persons and Hispanic or Latino persons were both approximately 4.7 times the rate among non-Hispanic White persons.
  • Based on death certificate data, the percentage of deaths attributed to pneumonia, influenza or COVID-19 (PIC) increased from week 26 – week 28 (weeks ending June 27 – July 11) after declining for 11 weeks since mid-April. The percentage of deaths due to PIC for week 30 is 8.6%, lower than the percentage during week 29 (12.0%), but above the epidemic threshold. These percentages will likely increase as more death certificates are processed.
  • All surveillance systems aim to provide the most complete data available. Estimates from previous weeks are subject to change as data are updated with the most complete data available.
U.S. Virologic Surveillance


The number of specimens tested for SARS-CoV-2 using a molecular assay and reported to CDC by public health laboratories and a subset of clinical and commercial laboratories in the United States are summarized below. All laboratories are performing primary diagnostic functions; therefore, the percentage of specimens testing positive across laboratory types can be used to monitor overall trends in COVID-19 activity. As the outbreak progresses, it is possible that different types of laboratories will take on different roles, and the data interpretation may need to change.
1,906,63132,009,840
255,7883,709,287
168,9243,217,358
1,481,91925,083,195
165,955 (8.7%)3,057,280 (9.6%)
21,264 (8.3%)309,094 (8.3%)
12,308 (7.3%)204,488 (6.4%)
132,383 (8.9%)2,543,698 (10.1%)
* Commercial and clinical laboratory data represent select laboratories and do not capture all tests performed in the United States.
Public Health Laboratories


resize iconView LargerView Data Table

Clinical Laboratories


resize iconView LargerView Data Table

Commercial Laboratories


resize iconView Larger


* Commercial laboratories began testing for SARS-CoV-2 in early March, but the number and geographic distribution of reporting commercial laboratories became stable enough to calculate a weekly percentage of specimens testing positive as of March 29, 2020.
View Data Table


Additional virologic surveillance information: Surveillance Methods


Outpatient/Emergency Department Illness


Two syndromic surveillance systems are being used to monitor trends in outpatient and emergency department (ED) visits that may be associated with COVID-19 illness. Each system monitors a slightly different syndrome, and together, these systems provide a more comprehensive picture of mild-to-moderate COVID-19 illness than either would individually. Both systems are currently being affected by changes in health care seeking behavior, including increased use of telemedicine, compliance with recommendations to limit ED visits to severe illnesses, and increased social distancing. These changes affect the numbers of people seeking care in the outpatient and ED settings and their reasons for doing so.
ILINet


The U.S. Outpatient Influenza-like Illness Surveillance Network (ILINet) provides data on visits for influenza-like illness (ILI) (fever [≥ 100[SUP]○[/SUP]F] and cough and/or sore throat) to approximately 2,600 primary care providers, emergency departments and urgent care centers in all 50 states, Puerto Rico, the District of Columbia and the U.S. Virgin Islands. Mild COVID-19 illness presents with symptoms similar to ILI, so ILINet is being used to track trends of mild-to-moderate COVID-19 illness and allows for comparison with prior influenza seasons.

Nationwide during week 30, 1.2% of patient visits reported through ILINet were due to ILI. This percentage is well below the national baseline of 2.4% and, while low overall, is higher than what is typical for this time of year compared to previous influenza seasons. Compared to week 29, the percentage of visits for ILI during week 30 was slightly higher for 0-4 year olds but slightly lower for all other age groups.

resize iconView Larger


* Age-group specific percentages should not be compared to the national baseline.

On a regional levelexternal icon, the percentage of outpatient visits for ILI ranged from 0.5% to 1.8% during week 30. All ten regions are below their region-specific baselines, and in nine of ten regions, the percentage of visits for ILI was lower or stable in week 30 compared to week 29. In Region 2 (NY/NJ/Puerto Rico), the percentage of visits for ILI was slightly higher in week 30 compared to week 29.

Note: In response to the COVID-19 pandemic, new data sources will be incorporated into ILINet as we move into summer weeks when lower levels of influenza and other respiratory virus circulation are typical. Starting in week 21, increases in the number of patient visits will be seen as new sites are enrolled and the percentage of visits for ILI may change in comparison to previous weeks. While all regions remain below baseline levels for ILI, these system changes should be considered when drawing conclusions from these data. Any changes in ILI due to changes in respiratory virus circulation will be highlighted here.
Overall Percentage of Visits for ILI | Age Group ILI Data

ILI Activity Levels


Data collected in ILINet are used to produce a measure of ILI activity for all 50 states, Puerto Rico, the District of Columbia and New York City. The mean reported percentage of visits due to ILI for the current week is compared to the mean reported during non-influenza weeks, and the activity levels correspond to the number of standard deviations below, at or above the mean.

The number of jurisdictions at each activity level during week 30, and changes compared to the previous week are summarized in the table below and shown in the following maps.
Activity Level
Week 30
(Week ending
July 25, 2020)
Compared to Previous Week
Very High0No change
High0No change
Moderate1-1
Low1-2
Minimal49+1
Insufficient Data3+2

[TD="colspan: 2"] Number of Jurisdictions [/TD]

*Data collected in ILINet may disproportionally represent certain populations within a state and may not accurately depict the full picture of influenza activity for the whole state. Differences in the data presented here by CDC and independently by some state health departments likely represent differing levels of data completeness with data presented by the state likely being the more complete.
National Syndromic Surveillance Program (NSSP): Emergency Department (ED) Visits


NSSP is a collaboration among CDC, federal partners, local and state health departments and academic and private sector partners to collect, analyze and share electronic patient encounter data received from multiple health care settings. To track trends of potential COVID-19 visits, visits for COVID-19-like illness (CLI) (fever and cough or shortness of breath or difficulty breathing or presence of a coronavirus diagnosis code) and ILI to a subset of emergency departments in 47 states are being monitored.

Nationwide during week 30, 3.1% of emergency department visits captured in NSSP were due to CLI and 0.9% were due to ILI. Compared to week 29, this week there was a decrease in both percentages of visits for CLI and ILI. This was the second consecutive week the percentages of visits for CLI and ILI decreased since week 28.

During week 30, the percentages of visits for CLI and ILI decreased or remained steady in all ten HHS regions. Compared to week 29, eight of ten HHS regionsexternal icon (Regions 1 [New England], 4 [South East], 5 [Midwest], 6 [South Central], 7 [Central], 8 [Mountain], 9 [South West/Coast] and 10 [Pacific Northwest]) saw a decrease in the percentage of visits for CLI, and five of ten HHS regions (Regions 4 [South East], 6 [South Central], 7 [Central], 9 [South West/ Coast] and 10 [Pacific Northwest]) saw a decrease in the percentage of visits for ILI.


Additional information about medically attended outpatient and emergency department visits for ILI and CLI: Surveillance Methods


Hospitalizations


The COVID-19-Associated Hospitalization Surveillance Network (COVID-NET) conducts population-based surveillance for laboratory-confirmed COVID-19-associated hospitalizations in select counties participating in the Emerging Infections Program (EIP) and the Influenza Hospitalization Surveillance Project (IHSP).

A total of 42,403 laboratory-confirmed COVID-19-associated hospitalizations were reported by sites between March 1, 2020 and July 25, 2020. The overall cumulative hospitalization rate was 130.1 per 100,000 population. Among the 0-4 years, 5-17 years, 18-49 years, 50-64 years, and ≥ 65 years age groups, the highest rate of hospitalization was among adults aged ≥ 65, followed by adults aged 50-64 years and adults aged 18-49 years.
lab-confirmed-hospitalizations.gif

resize iconView Larger
Overall130.1
0-4 years12.3
5-17 years6.4
18-49 years85.5
18-29 years51.6
30-39 years84.3
40-49 years130.6
50-64 years196.3
65+ years360.2
65-74 years266.4
75-84 years427.4
85+ years670.5
From June 20 (MMWR week 25) – July 11 (MMWR week 28), overall weekly hospitalization rates increased for three consecutive weeks. Data for the weeks ending July 18 and July 25 (MMWR weeks 29 and 30) currently show a decline; however, those data are likely to change as more data for admissions occurring during those weeks are received.
lab-confirmed-hospitalizations-weekly.gif

resize iconView Larger
Among the 42,403 laboratory-confirmed COVID-19-associated hospitalized cases, 39,983 (94.3%) had information on race and ethnicity, while collection of race and ethnicity was still pending for 2,420 (5.7%) cases. When examining overall age-adjusted rates by race/ethnicity, non-Hispanic American Indian or Alaska Native persons had an age-adjusted hospitalization rate approximately 5.3 times that of non-Hispanic White persons. Rates among non-Hispanic Black persons and Hispanic or Latino persons were both approximately 4.7 times the rate among non-Hispanic White persons.


When examining age-stratified crude hospitalization rates by race and ethnicity, compared with non-Hispanic white persons in the same age group, crude hospitalization rates were 7.8 times higher among Hispanic or Latino persons aged 0-17 years; 9.8 times higher among non-Hispanic American Indian or Alaska Native persons aged 18-49 years; 7.2 times higher among non-Hispanic American Indian or Alaska Native persons aged 50-64 years; and 3.8 times higher among non-Hispanic Black persons aged ≥ 65 years.
Age Category
Rate[SUP]1[/SUP]Rate Ratio[SUP]2[/SUP]Rate[SUP]1[/SUP]Rate Ratio[SUP]2[/SUP]Rate[SUP]1[/SUP]Rate Ratio[SUP]2[/SUP]Rate[SUP]1[/SUP]Rate Ratio[SUP]2[/SUP]Rate[SUP]1[/SUP]Rate Ratio[SUP]2[/SUP]
0-17y7.83.710.55.016.47.84.01.92.11.0
18-49y221.49.8133.75.9208.59.238.91.722.61.0
50-64y539.77.2407.35.5451.56.1117.91.674.51.0
65+y630.92.9830.73.8573.62.6219.31.0219.21.0
Overall rate[SUP]3[/SUP] (age-adjusted)298.65.3265.14.7266.64.772.81.356.51.0

[TD="colspan: 2"] Non-Hispanic
American Indian or Alaska Native
[/TD]
[TD="colspan: 2"] Non-Hispanic Black [/TD]
[TD="colspan: 2"] Hispanic or Latino [/TD]
[TD="colspan: 2"] Non-Hispanic Asian or Pacific Islander [/TD]
[TD="colspan: 2"] Non-Hispanic White [/TD]
[SUP]1[/SUP] COVID-19-associated hospitalization rates by race/ethnicity are calculated using hospitalized COVID-NET cases with known race and ethnicity for the numerator and NCHS bridged-race population estimates for the denominator.
[SUP]2[/SUP] For each age category, rate ratios are the ratios between crude hospitalization rates within each racial/ethnic group and the crude hospitalization rate among non-Hispanic white persons in the same age category.
[SUP]3[/SUP] Overall rates are adjusted to account for differences in age distributions within race/ethnicity strata in the COVID-NET catchment area; the age strata used for the adjustment include 0-17, 18-49, 50-64, and 65+ years.

Non-Hispanic Black persons and non-Hispanic White persons represented the highest proportions of hospitalized cases reported to COVID-NET, followed by Hispanic or Latino, non-Hispanic Asian or Pacific Islander and non-Hispanic American Indian or Alaska Native persons. However, some racial and ethnic groups are disproportionately represented among hospitalized cases as compared with the overall population of the catchment area. Prevalence ratios showed a similar pattern to that of the age-adjusted hospitalization rates: non-Hispanic American Indian or Alaska Native persons have the highest prevalence ratio, followed by non-Hispanic Black and Hispanic or Latino persons.
1.5%32.9%23.2%4.8%31.5%
0.7%17.9%14.1%8.9%58.5%
2.11.81.60.50.5
[SUP]1[/SUP] Persons of multiple races (0.2%) or unknown race and ethnicity (5.9%) are not represented in the table but are included as part of the denominator.
[SUP]2[/SUP] Prevalence ratio is calculated as the ratio of the proportion of hospitalized COVID-NET cases over the proportion of population in COVID-NET catchment area.

Among 10,687 hospitalized adults with information on underlying medical conditions, 90.8% had at least one reported underlying medical condition. The most commonly reported were hypertension, obesity, chronic metabolic disease and cardiovascular disease. Among 222 hospitalized children with information on underlying conditions, 52.3% had at least one reported underlying medical condition. The most commonly reported were obesity, neurologic conditions and asthma.
lab-confirmed-hospitalizations-underlying.gif

resize iconView Larger


Additional data on demographics, signs and symptoms at admission, underlying conditions, interventions, outcomes and discharge diagnoses, stratified by age, sex and race and ethnicity, are available.

Additional hospitalization surveillance information: Surveillance Methods | Additional rate data | Additional demographic and clinical data


Mortality Surveillance


The National Center for Health Statistics (NCHS) collects death certificate data from vital statistics offices for all deaths occurring in the United States. Based on death certificate data available on July 30, 2020, the percentage of deaths attributed to pneumonia, influenza or COVID-19 (PIC) increased from week 26 – week 28 (June 27 – July 11) after declining for 11 weeks since mid-April. The percentage of deaths due to PIC for week 30 is 8.6% and, while lower than the percentage during week 29 (12.0%), remains above the epidemic threshold. Percentages for recent weeks will likely increase as more death certificates are processed.

Weekly mortality surveillance data include a combination of machine coded and manually coded causes of death collected from death certificates. Percentages of deaths due to PIC are higher among manually coded records than more rapidly available machine coded records. Due to the additional time needed for manual coding, the initially reported PIC percentages may be lower than percentages calculated from final data.
nchs-mortality-report.gif

resize iconView Larger


*Data during recent weeks are incomplete because of the lag in time between when the death occurred and when the death certificate is completed, submitted to NCHS and processed for reporting purposes.
View Data Table


Additional NCHS mortality surveillance information: Surveillance Methods | Provisional Death Counts for COVID-19

More Information
View Page In:pdf icon 15 Pages, 1 MB
Last Updated July 31, 2020

https://www.cdc.gov/coronavirus/2019-ncov/covid-data/covidview/past-reports/07312020.html
 
  1. CASES, DATA & SURVEILLANCE
COVIDView Summary ending on August 1, 2020


Updated Aug. 7, 2020
Print
Download Weekly Summary pdf icon[14 Pages, 1 MB]
Key Updates for Week 31, ending August 1, 2020


Nationally, levels of influenza-like illness (ILI) are below baseline but higher than typically seen at this time of year. Indicators that track ILI and COVID-19-like illness (CLI) showed decreases nationally from week 30 to week 31, with decreasing or stable (change of ≤ 0.1%) levels in all regions of the country. Nationally, the percentage of laboratory tests positive for SARS-CoV-2 decreased from week 30 to week 31 and decreased in nine of ten HHS regions. Weekly hospitalization rates and mortality attributed to COVID-19 declined during week 31 but may change as more data for admissions and deaths occurring during the most recent weeks are received. Mortality attributed to COVID-19 remains above the epidemic threshold.
Virus

Public Health, Commercial and Clinical Laboratories


Nationally, the overall percentage of respiratory specimens testing positive for SARS-CoV-2 decreased from 8.7% during week 30 to 7.8% during week 31. Decreases were seen in nearly all regions. National percentages of specimens testing positive for SARS-CoV-2 by type of laboratory are listed as follows:
  • Public health laboratories – decreased from 8.2% during week 30 to 7.8% during week 31;
  • Clinical laboratories – decreased from 7.3% during week 30 to 6.8% during week 31;
  • Commercial laboratories – decreased from 8.9% during week 30 to 7.8% during week 31.
Outpatient and Emergency Department Visits

Outpatient Influenza-Like Illness Network (ILINet) and National Syndromic Surveillance Program (NSSP)


Two surveillance networks are being used to track outpatient or emergency department (ED) visits for illness with symptoms compatible with COVID-19.
  • Nationally, ILI activity remains below baseline for the sixteenth week but is higher than typically seen at this time of year.
  • Nationally, during week 31, the percentage of visits reported by ILINet participants for ILI was 1.2%, and the percentage of visits for CLI reported to NSSP was 2.9%. These percentages appear stable with only slight fluctuations seen over the most recent three weeks.
  • Recent changes in health care seeking behavior, including increasing use of telemedicine, recommendations to limit emergency department (ED) visits to severe illnesses and increased social distancing, are likely affecting data reported from both networks, making it difficult to draw conclusions at this time. Tracking these systems moving forward will give additional insight into illness related to COVID-19.
Severe Disease

Hospitalizations


Cumulative COVID-19-associated hospitalization rates since March 1, 2020, are updated weekly. The overall cumulative COVID-19 hospitalization rate is 137.6 per 100,000, with the highest rates in people aged 65 years and older (378.8 per 100,000) and 50-64 years (207.4 per 100,000).
Mortality


Based on death certificate data, the percentage of deaths attributed to pneumonia, influenza or COVID-19 (PIC) increased from week 26 – week 29 (June 27 – July 18) for the first time since mid-April. The percentage for week 31 is 7.8% and currently lower than the percentage during week 30 (12.6%); however, the percentage remains above the epidemic threshold. Percentages for recent weeks will likely increase as more death certificates are processed.

All data are preliminary and may change as more reports are received.

A description of the surveillance systems summarized in COVIDView, including methodology and detailed descriptions of each data component, is available on the surveillance methods page.
Key Points
  • The percentage of specimens testing positive for SARS-CoV-2 decreased in nine of ten HHS regions from week 30 to week 31. Percentages of visits for ILI and CLI decreased or remained stable (change of ≤ 0.1%).
  • Using combined data from the three laboratory types, the national percentage of respiratory specimens testing positive for SARS-CoV-2 with a molecular assay decreased from 8.7% during week 30 to 7.8% during week 31.
    • The highest percentages of specimens testing positive for SARS-CoV-2 were seen in Regions 4 (South East, 12.7%), 6 (South Central, 14.4%) and 9 (South West/Coast, 8.8%); however, the percentages are decreasing in these three regions following peaks seen in weeks 27 and 28.
  • The percentage of outpatient and ED visits for ILI are below baseline nationally and in all regions of the country; however, ILI activity is above what is typical for this time of year. The percentage of visits to EDs for CLI decreased nationally for the third consecutive week, and compared to the previous week, decreased or remained stable in all ten HHS regions.
    • Systems monitoring ILI and CLI may be influenced by recent changes in health care seeking behavior, including increasing use of telemedicine, recommendations to limit emergency department (ED) visits to severe illnesses and increased social distancing.
  • The overall cumulative COVID-19-associated hospitalization rate was 137.6 per 100,000; rates were highest in people 65 years of age and older (378.8 per 100,000) followed by people 50-64 years (207.4 per 100,000). Cumulative hospitalization rates will increase as the pandemic continues.
    • From week 25 – week 28 (weeks ending June 20 – July 11), overall weekly hospitalization rates increased for three consecutive weeks. Weekly rates have declined during the most recent three weeks but may increase as more data are received.
    • Non-Hispanic American Indian or Alaska Native persons had an age-adjusted hospitalization rate approximately 5.2 times that of non-Hispanic White persons. Rates among non-Hispanic Black persons and Hispanic or Latino persons were both approximately 4.7 times the rate among non-Hispanic White persons.
  • Based on death certificate data, the percentage of deaths attributed to pneumonia, influenza or COVID-19 (PIC) increased from week 26 – week 29 (weeks ending June 27 – July 18) after declining for 11 weeks since mid-April. The percentage of deaths due to PIC for week 31 is 7.8%, lower than the percentage during week 30 (12.6%), but above the epidemic threshold. These percentages will likely increase as more death certificates are processed.
  • All surveillance systems aim to provide the most complete data available. Estimates from previous weeks are subject to change as data are updated with the most complete data available.
U.S. Virologic Surveillance


The number of specimens tested for SARS-CoV-2 using a molecular assay and reported to CDC by public health laboratories and a subset of clinical and commercial laboratories in the United States are summarized below. All laboratories are performing primary diagnostic functions; therefore, the percentage of specimens testing positive across laboratory types can be used to monitor overall trends in COVID-19 activity. As the outbreak progresses, it is possible that different types of laboratories will take on different roles, and the data interpretation may need to change.
1,951,60934,990,702
255,6284,011,003
137,9163,391,898
1,558,06527,587,801
151,488 (7.8%)3,305,091 (9.4%)
20,026 (7.8%)332,644 (8.3%)
9,401 (6.8%)217,384 (6.4%)
122,061 (7.8%)2,755,063 (10.0%)
* Commercial and clinical laboratory data represent select laboratories and do not capture all tests performed in the United States.
Public Health Laboratories


resize iconView LargerView Data Table

Clinical Laboratories


resize iconView LargerView Data Table

Commercial Laboratories


resize iconView Larger


* Commercial laboratories began testing for SARS-CoV-2 in early March, but the number and geographic distribution of reporting commercial laboratories became stable enough to calculate a weekly percentage of specimens testing positive as of March 29, 2020.
View Data Table


Additional virologic surveillance information: Surveillance Methods


Outpatient/Emergency Department Illness


Two syndromic surveillance systems are being used to monitor trends in outpatient and emergency department (ED) visits that may be associated with COVID-19 illness. Each system monitors a slightly different syndrome, and together, these systems provide a more comprehensive picture of mild-to-moderate COVID-19 illness than either would individually. Both systems are currently being affected by changes in health care seeking behavior, including increased use of telemedicine, compliance with recommendations to limit ED visits to severe illnesses and increased social distancing. These changes affect the numbers of people seeking care in the outpatient and ED settings and their reasons for doing so.
ILINet


The U.S. Outpatient Influenza-like Illness Surveillance Network (ILINet) provides data on visits for influenza-like illness (ILI) (fever [≥ 100[SUP]○[/SUP]F] and cough and/or sore throat) to approximately 2,600 primary care providers, emergency departments and urgent care centers in all 50 states, Puerto Rico, the District of Columbia and the U.S. Virgin Islands. Mild COVID-19 illness presents with symptoms similar to ILI, so ILINet is being used to track trends of mild-to-moderate COVID-19 illness and allows for comparison with prior influenza seasons.

Nationwide during week 31, 1.2% of patient visits reported through ILINet were due to ILI. This percentage is well below the national baseline of 2.4% but, while low overall, is higher than what is typical for this time of year compared to previous influenza seasons. Compared to week 30, the percentage of visits for ILI during week 31 was the same or slightly lower overall and for all age groups.

resize iconView Larger


* Age-group specific percentages should not be compared to the national baseline.

On a regional levelexternal icon, the percentage of outpatient visits for ILI ranged from 0.5% to 1.6% during week 31. All ten regions are below their region-specific baselines, and only slight fluctuations in the percentage of outpatient visits for ILI have been seen over the most recent three weeks.

Note: In response to the COVID-19 pandemic, new data sources will be incorporated into ILINet as we move into summer weeks, when lower levels of influenza and other respiratory virus circulation are typical. Starting in week 21, increases in the number of patient visits will be seen as new sites are enrolled and the percentage of visits for ILI may change in comparison to previous weeks. While all regions remain below baseline levels for ILI, these system changes should be considered when drawing conclusions from these data. Any changes in ILI due to changes in respiratory virus circulation will be highlighted here.
Overall Percentage of Visits for ILI | Age Group ILI Data

ILI Activity Levels


Data collected in ILINet are used to produce a measure of ILI activity for all 50 states, Puerto Rico, the District of Columbia and New York City. The mean reported percentage of visits due to ILI for the current week is compared to the mean reported during non-influenza weeks, and the activity levels correspond to the number of standard deviations below, at or above the mean.

The number of jurisdictions at each activity level during week 31, and changes compared to the previous week are summarized in the table below and shown in the following maps.
Activity Level
Week 31
(Week ending
August 1, 2020)
Compared to Previous Week
Very High0No change
High0No change
Moderate1No change
Low1No change
Minimal49No change
Insufficient Data3No change

[TD="colspan: 2"] Number of Jurisdictions [/TD]

*Data collected in ILINet may disproportionally represent certain populations within a state and may not accurately depict the full picture of influenza activity for the whole state. Differences in the data presented here by CDC and independently by some state health departments likely represent differing levels of data completeness with data presented by the state likely being the more complete.
National Syndromic Surveillance Program (NSSP): Emergency Department (ED) Visits


NSSP is a collaboration among CDC, federal partners, local and state health departments and academic and private sector partners to collect, analyze and share electronic patient encounter data received from multiple health care settings. To track trends of potential COVID-19 visits, visits for COVID-19-like illness (CLI) (fever and cough or shortness of breath or difficulty breathing or presence of a coronavirus diagnosis code) and ILI to a subset of emergency departments in 47 states are being monitored.

Nationwide during week 31, 2.9% of emergency department visits captured in NSSP were due to CLI and 0.8% were due to ILI. Compared to week 30, this week there was a decrease in both percentages of visits for CLI and ILI. This was the third consecutive week the percentages of visits for CLI and ILI decreased since week 28. During these three weeks, the percentages of visits for CLI and ILI decreased or remained stable (changes of ≤ 0.1%) in all ten HHS regionsexternal icon.


Additional information about medically attended outpatient and emergency department visits for ILI and CLI: Surveillance Methods


Hospitalizations


The COVID-19-Associated Hospitalization Surveillance Network (COVID-NET) conducts population-based surveillance for laboratory-confirmed COVID-19-associated hospitalizations in select counties participating in the Emerging Infections Program (EIP) and the Influenza Hospitalization Surveillance Project (IHSP).

A total of 44,865 laboratory-confirmed COVID-19-associated hospitalizations were reported by sites between March 1, 2020, and August 1, 2020. The overall cumulative hospitalization rate was 137.6 per 100,000 population. Among the 0-4 year, 5-17 year, 18-49 year, 50-64 year and ≥ 65 year age groups, the highest rate of hospitalization was among adults aged ≥ 65 years, followed by adults aged 50-64 years and adults aged 18-49 years.
lab-confirmed-hospitalizations.gif

resize iconView Larger
Overall137.6
0-4 years12.9
5-17 years7.0
18-49 years91.3
18-29 years55.9
30-39 years90.0
40-49 years138.5
50-64 years207.4
65+ years378.8
65-74 years281.3
75-84 years451.4
85+ years695.0
From June 20 (MMWR week 25) – July 11 (MMWR week 28), there was an increase in overall weekly hospitalization rates for three consecutive weeks. Data for weeks ending July 18, July 25 and August 1 (MMWR weeks 29, 30 and 31) currently show a decline; however, those data are likely to change as more data for admissions occurring during these weeks are received.
lab-confirmed-hospitalizations-weekly.gif

resize iconView Larger
Among the 44,865 laboratory-confirmed COVID-19-associated hospitalized cases, 41,989 (93.6%) had information on race and ethnicity, while collection of race and ethnicity was still pending for 2,876 (6.4%) cases. When examining overall age-adjusted rates by race/ethnicity, non-Hispanic American Indian or Alaska Native persons had an age-adjusted hospitalization rate approximately 5.2 times that of non-Hispanic White persons. Rates for non-Hispanic Black persons and Hispanic or Latino persons were both approximately 4.7 times the rate among non-Hispanic White persons.


When examining age-stratified crude hospitalization rates by race and ethnicity, compared with non-Hispanic white persons in the same age group, crude hospitalization rates were 8.1 times higher among Hispanic or Latino persons aged 0-17 years; 9.3 times higher among non-Hispanic American Indian or Alaska Native persons aged 18-49 years; 7.1 times higher among non-Hispanic American Indian or Alaska Native persons aged 50-64 years; and 3.8 times higher among non-Hispanic Black persons aged ≥ 65 years.
Age Category
Rate[SUP]1[/SUP]Rate Ratio[SUP]2[/SUP]Rate[SUP]1[/SUP]Rate Ratio[SUP]2[/SUP]Rate[SUP]1[/SUP]Rate Ratio[SUP]2[/SUP]Rate[SUP]1[/SUP]Rate Ratio[SUP]2[/SUP]Rate[SUP]1[/SUP]Rate Ratio[SUP]2[/SUP]
0-17y9.74.611.25.317.18.14.01.92.11.0
18-49y225.39.3142.45.9218.79.141.81.724.11.0
50-64y553.07.1426.35.4473.76.0124.31.678.41.0
65+y651.92.9860.13.8605.32.7233.21.0228.21.0
Overall rate[SUP]3[/SUP] (age-adjusted)306.55.2277.24.7280.24.777.41.359.31.0

[TD="colspan: 2"] Non-Hispanic
American Indian or Alaska Native
[/TD]
[TD="colspan: 2"] Non-Hispanic Black [/TD]
[TD="colspan: 2"] Hispanic or Latino [/TD]
[TD="colspan: 2"] Non-Hispanic Asian or Pacific Islander [/TD]
[TD="colspan: 2"] Non-Hispanic White [/TD]
[SUP]1[/SUP] COVID-19-associated hospitalization rates by race/ethnicity are calculated using hospitalized COVID-NET cases with known race and ethnicity for the numerator and NCHS bridged-race population estimates for the denominator.
[SUP]2[/SUP] For each age category, rate ratios are the ratios between crude hospitalization rates within each racial/ethnic group and the crude hospitalization rate among non-Hispanic white persons in the same age category.
[SUP]3[/SUP] Overall rates are adjusted to account for differences in age distributions within race/ethnicity strata in the COVID-NET catchment area; the age strata used for the adjustment include 0-17, 18-49, 50-64 and 65+ years.

Non-Hispanic Black persons and non-Hispanic White persons represented the highest proportions of hospitalized cases reported to COVID-NET, followed by Hispanic or Latino, non-Hispanic Asian or Pacific Islander and non-Hispanic American Indian or Alaska Native persons. However, some racial and ethnic groups are disproportionately represented among hospitalized cases as compared with the overall population of the catchment area. Prevalence ratios showed a similar pattern to that of the age-adjusted hospitalization rates: non-Hispanic American Indian or Alaska Native persons have the highest prevalence ratio, followed by non-Hispanic Black and Hispanic or Latino persons.
1.4%32.8%23.2%4.9%31.4%
0.7%17.9%14.1%8.9%58.5%
2.01.81.60.60.5
[SUP]1[/SUP] Persons of multiple races (0.2%) or unknown race and ethnicity (6.1%) are not represented in the table but are included as part of the denominator.
[SUP]2[/SUP] Prevalence ratio is calculated as the ratio of the proportion of hospitalized COVID-NET cases over the proportion of population in COVID-NET catchment area.

Among 11,245 hospitalized adults with information on underlying medical conditions, 90.7% had at least one reported underlying medical condition. The most commonly reported were hypertension, obesity, metabolic disease and cardiovascular disease. Among 230 hospitalized children with information on underlying conditions, 51.7% had at least one reported underlying medical condition. The most commonly reported were obesity, neurologic conditions and asthma.
lab-confirmed-hospitalizations-underlying.gif

resize iconView Larger


Additional data on demographics, signs and symptoms at admission, underlying conditions, interventions, outcomes and discharge diagnoses, stratified by age, sex and race and ethnicity, are available.

Additional hospitalization surveillance information: Surveillance Methods | Additional rate data | Additional demographic and clinical data


Mortality Surveillance


The National Center for Health Statistics (NCHS) collects death certificate data from vital statistics offices for all deaths occurring in the United States. Based on death certificate data available on August 6, 2020, the percentage of deaths attributed to pneumonia, influenza or COVID-19 (PIC) increased from week 26 – week 29 (June 27 – July 18) after declining for 11 weeks since mid-April. The percentage of deaths due to PIC for week 31 is 7.8% and, while lower than the percentage during week 30 (12.6%), remains above the epidemic threshold. Percentages for recent weeks will likely increase as more death certificates are processed.

Weekly mortality surveillance data include a combination of machine coded and manually coded causes of death collected from death certificates. Percentages of deaths due to PIC are higher among manually coded records than more rapidly available machine coded records. Due to the additional time needed for manual coding, the initially reported PIC percentages may be lower than percentages calculated from final data.
nchs-mortality-report.gif

resize iconView Larger


*Data during recent weeks are incomplete because of the lag in time between when the death occurred and when the death certificate is completed, submitted to NCHS and processed for reporting purposes.
View Data Table


Additional NCHS mortality surveillance information: Surveillance Methods | Provisional Death Counts for COVID-19

More Information
View Page In:pdf icon 14 Pages, 1 MB
Last Updated Aug. 7, 2020

https://www.cdc.gov/coronavirus/2019-ncov/covid-data/covidview/past-reports/08072020.html
 
Back
Top Bottom