• FluTrackers.com Inc. does not provide medical advice. Information on this web site is collected from various internet resources, and the FluTrackers board of directors makes no warranty to the safety, efficacy, correctness or completeness of the information posted on this site by any author or poster. The information collated here is for instructional and/or discussion purposes only and is NOT intended to diagnose or treat any disease, illness, or other medical condition. Every individual reader or poster should seek advice from their personal physician/healthcare practitioner before considering or using any interventions that are discussed on this website. By continuing to access this website you agree to consult your personal physican before using any interventions posted on this website, and you agree to hold harmless FluTrackers.com Inc., the board of directors, the members, and all authors and posters for any effects from use of any medication, supplement, vitamin or other substance, device, intervention, etc. mentioned in posts on this website, or other internet venues referenced in posts on this website.
  • We are not asking for any donations. Do not donate to any entity who says they are raising funds for us.

US - CDC: COVIDView 2020/2021 - Not offered for exactness - Offered for trend analysis only

covid-tracker-header-lrg.jpg
COVID Data Tracker Weekly Review


Updated May 21, 2021


Interpretive Summary for May 21, 2021
Summer, Sun, and Safe Fun

resize iconView Larger

COVID-19 cases, hospitalizations, and deaths are going down, and the number of people vaccinated continues to go up, providing a sense of optimism as summer approaches. As of May 20, 48.4% of the U.S. population ages 18 years and older is fully vaccinated, and 60.5% have received at least one dose of a COVID-19 vaccine. Additionally, as of last week, millions more are now eligible to receive a COVID-19 vaccine. These trends and new CDC evidence-based guidance on masking provide encouragement that we are making progress toward returning to a sense of normalcy.

As you look ahead to summer, consider how COVID-19 is spreading in your community when choosing activities. Outdoor activities and visits are safer than those indoors, but fully vaccinated people can participate in most indoor activities without much risk. If you are not yet vaccinated, you should continue to practice prevention strategies such as wearing a well-fitted mask, practicing physical distancing, avoiding crowds, and washing your hands.

For more than a year, many people have focused on staying safe from COVID-19. While this continues to be important, returning to regular activities when you are fully vaccinated, such as travel, events, and other social gatherings, can provide hope for the days ahead. In addition, taking simple actions such as deep breathing, physical activity, healthy eating, practicing good sleep habits, and safely connecting with family, friends, and neighbors can improve your well-being.


Reported Cases


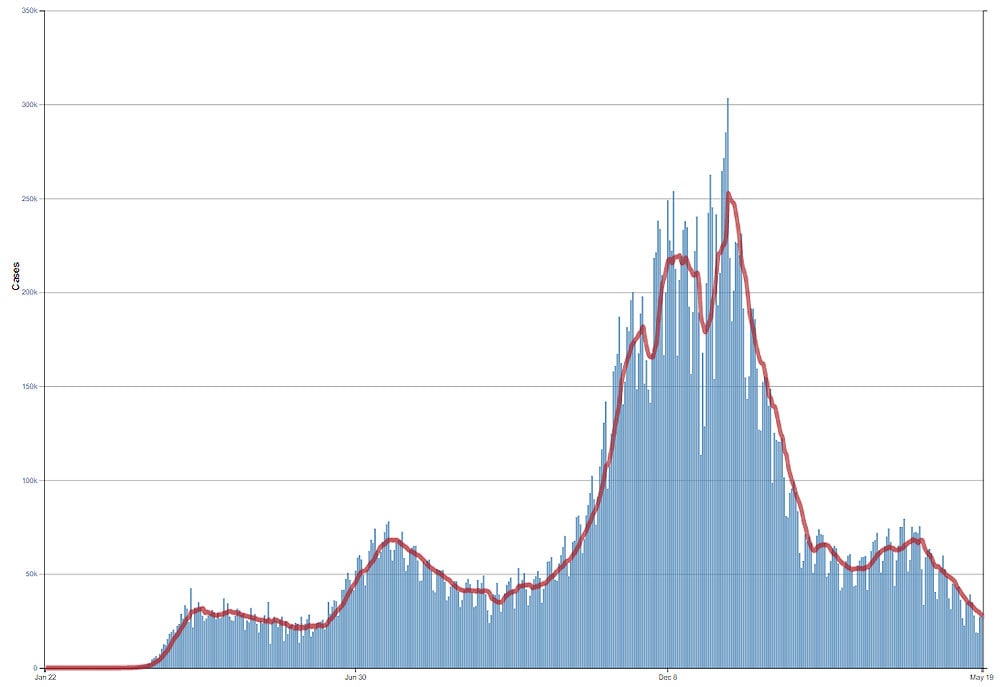
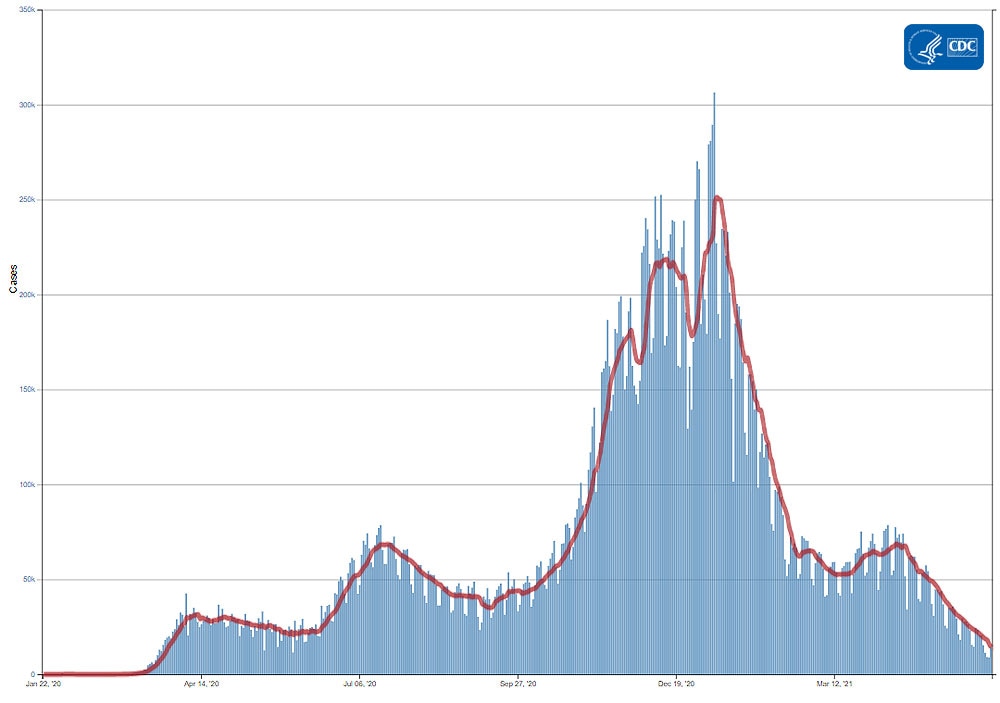
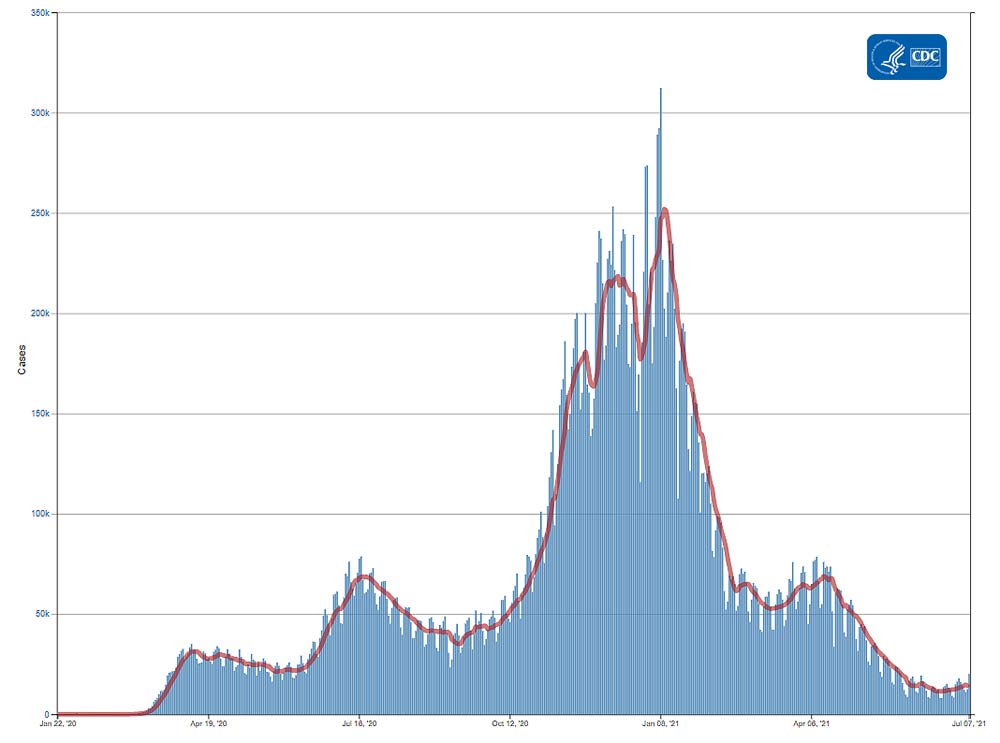
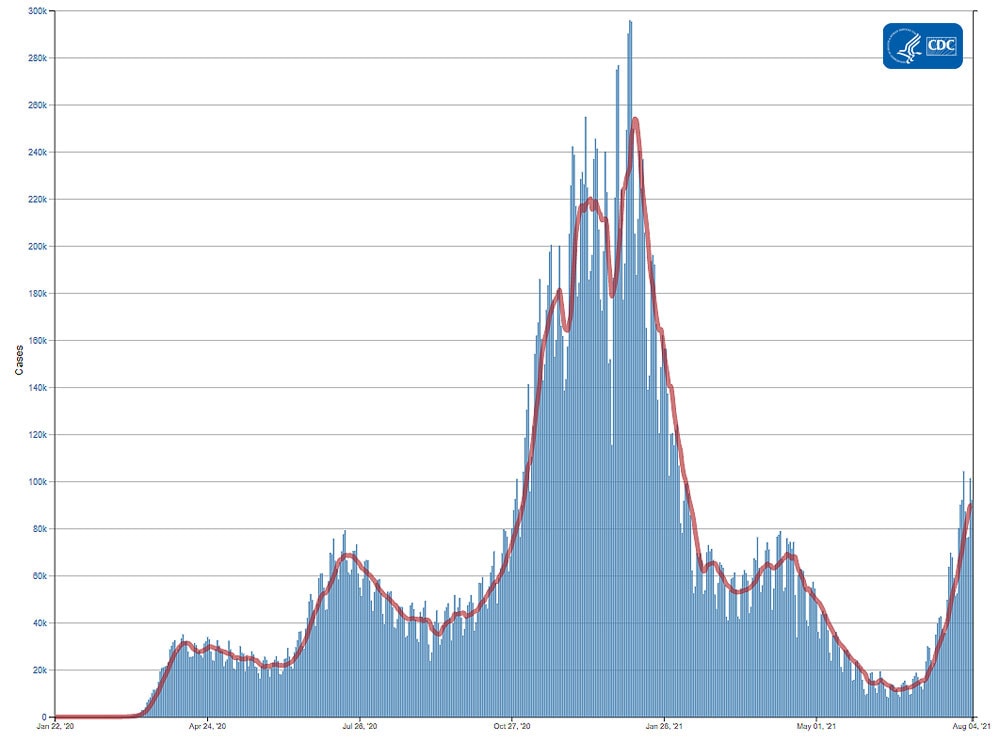
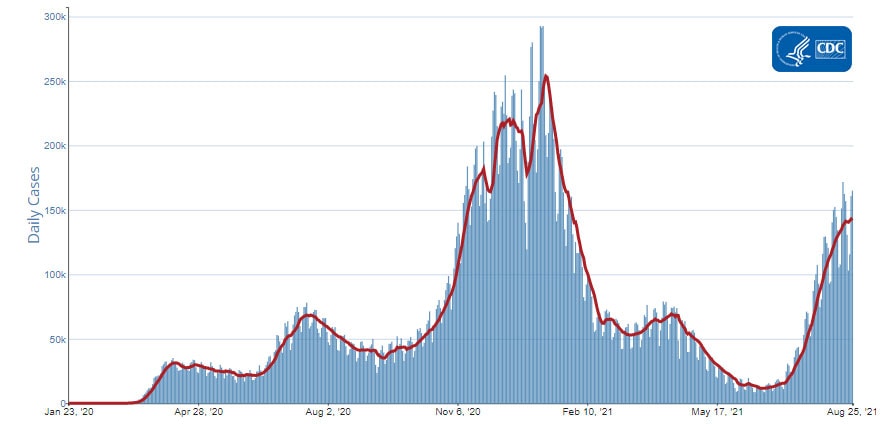
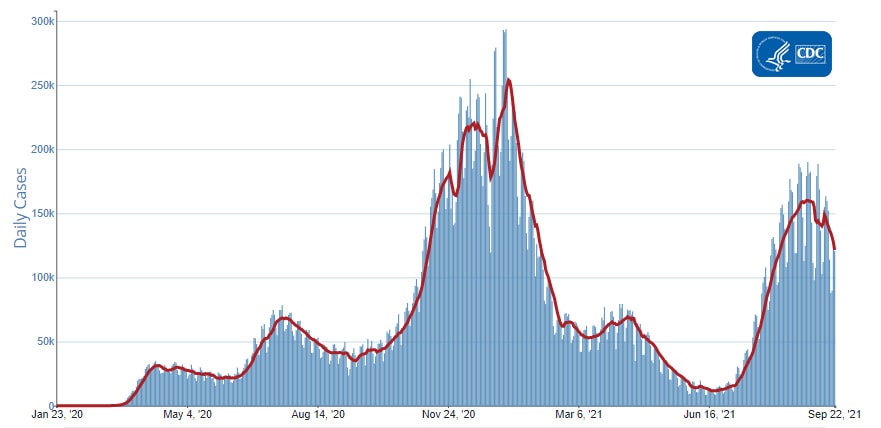
The current 7-day moving average of daily new cases (27,789) decreased 19.5% compared with the previous 7-day moving average (34,502). Compared with the highest peak on January 8, 2021 (252,768), the current 7-day average decreased 89.0%. A total of 32,855,010 COVID-19 cases have been reported as of May 19.

32,855,010
Total Cases Reported

27,789
Current 7-Day Average*

34,502
Prior 7-Day Average

-19.5%
Change in 7-Day Average since Prior Week

*Historical cases are excluded from daily new cases and 7-day average calculations until they are incorporated into the dataset for the applicable date. Of 85,596 historical cases reported retroactively, 246 were reported on the most recent submission date; 1,918 in the current week; and 1,461 were reported in the prior week.

Note: In the above table, historical data with missing report dates are excluded from current and prior 7-day averages, and the percent change in the 7-day average.

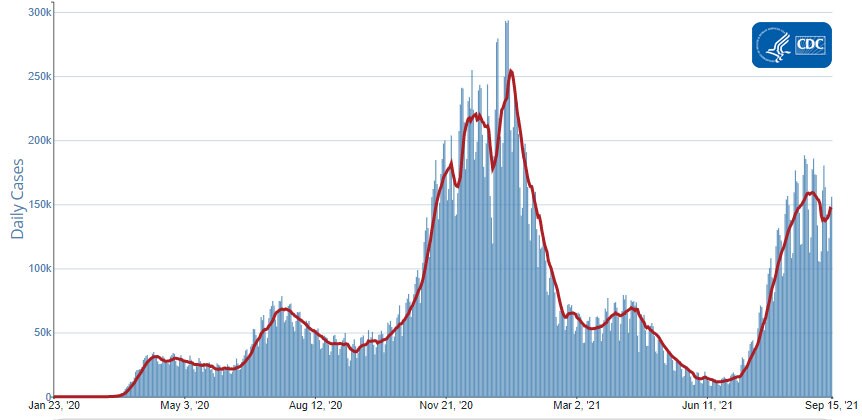
Daily Trends in COVID-19 Cases in the United States Reported to CDC
red-line.jpg

7-Day moving average

resize iconView Larger
More Case Data


SARS-CoV-2 Variants


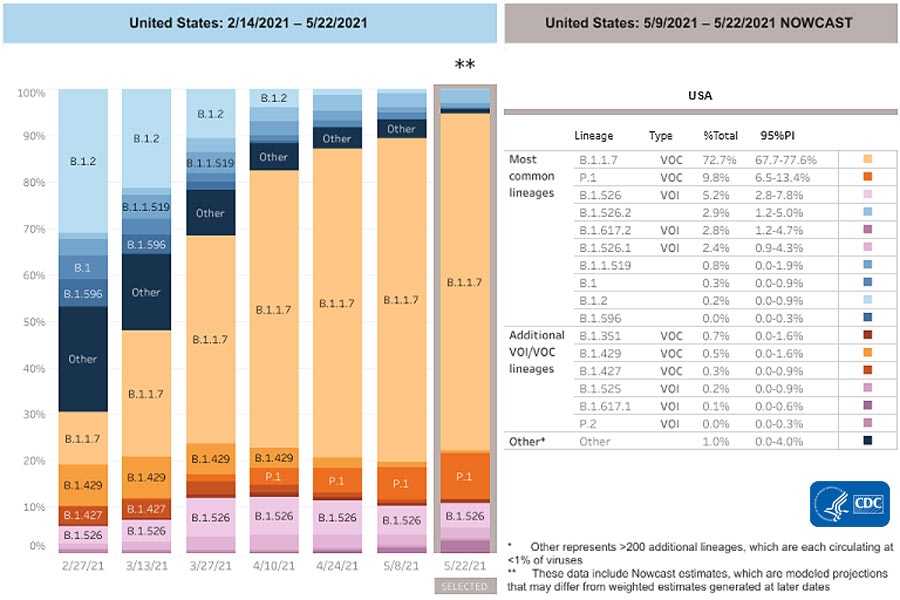
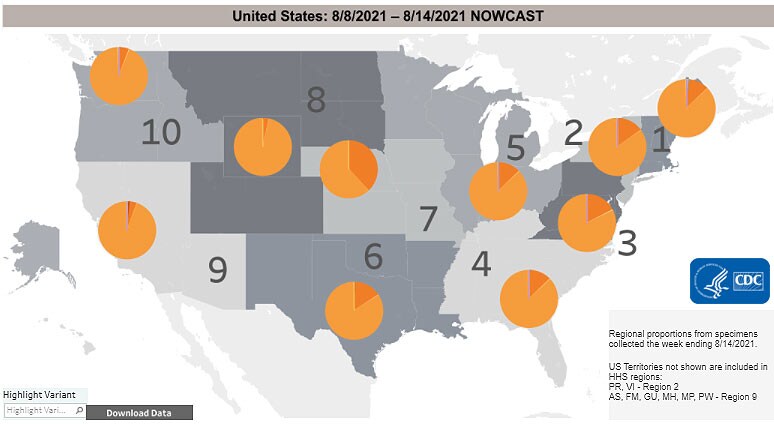
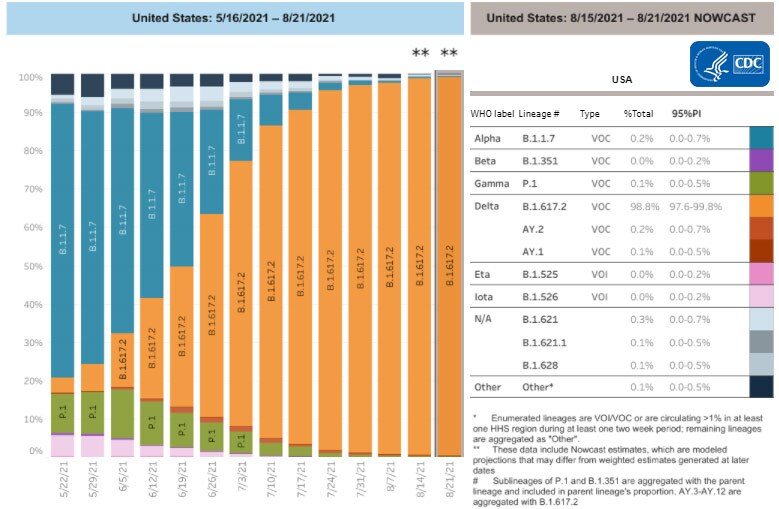
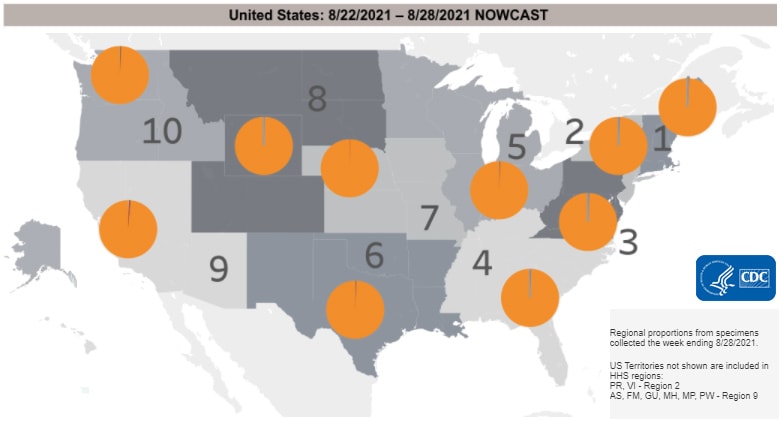
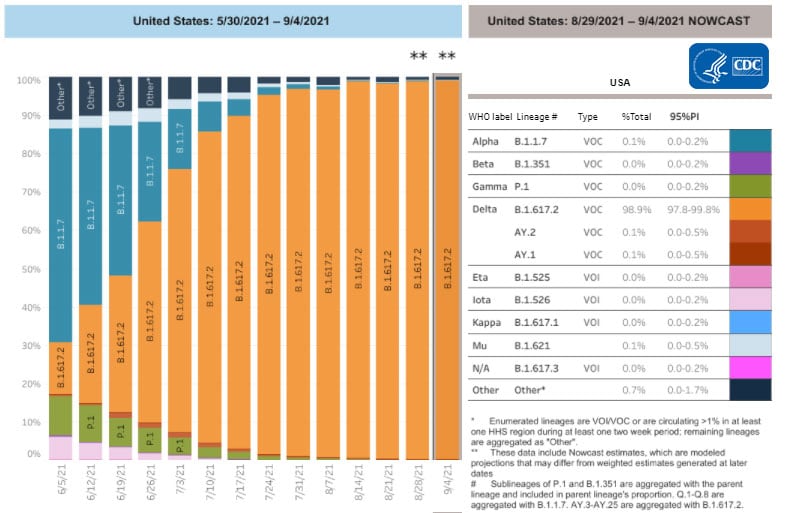
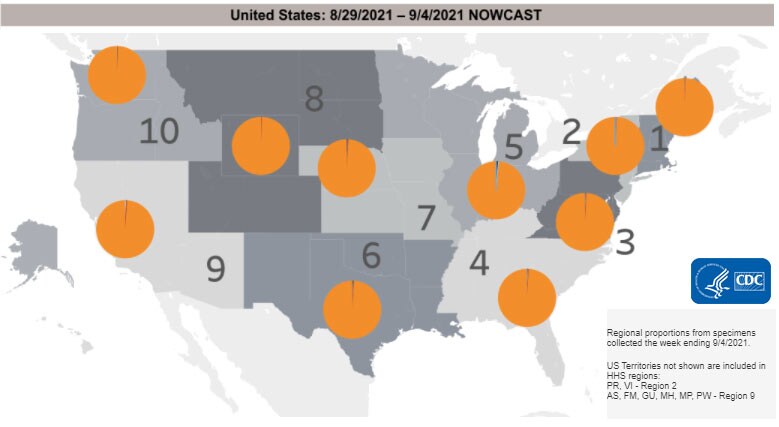
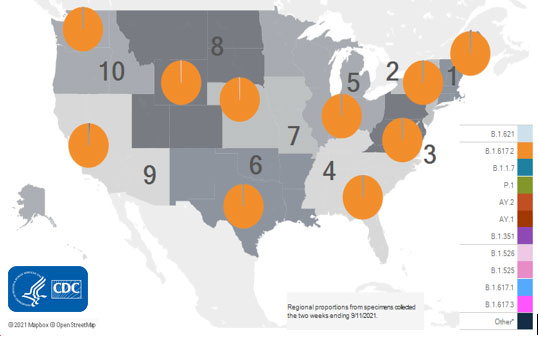
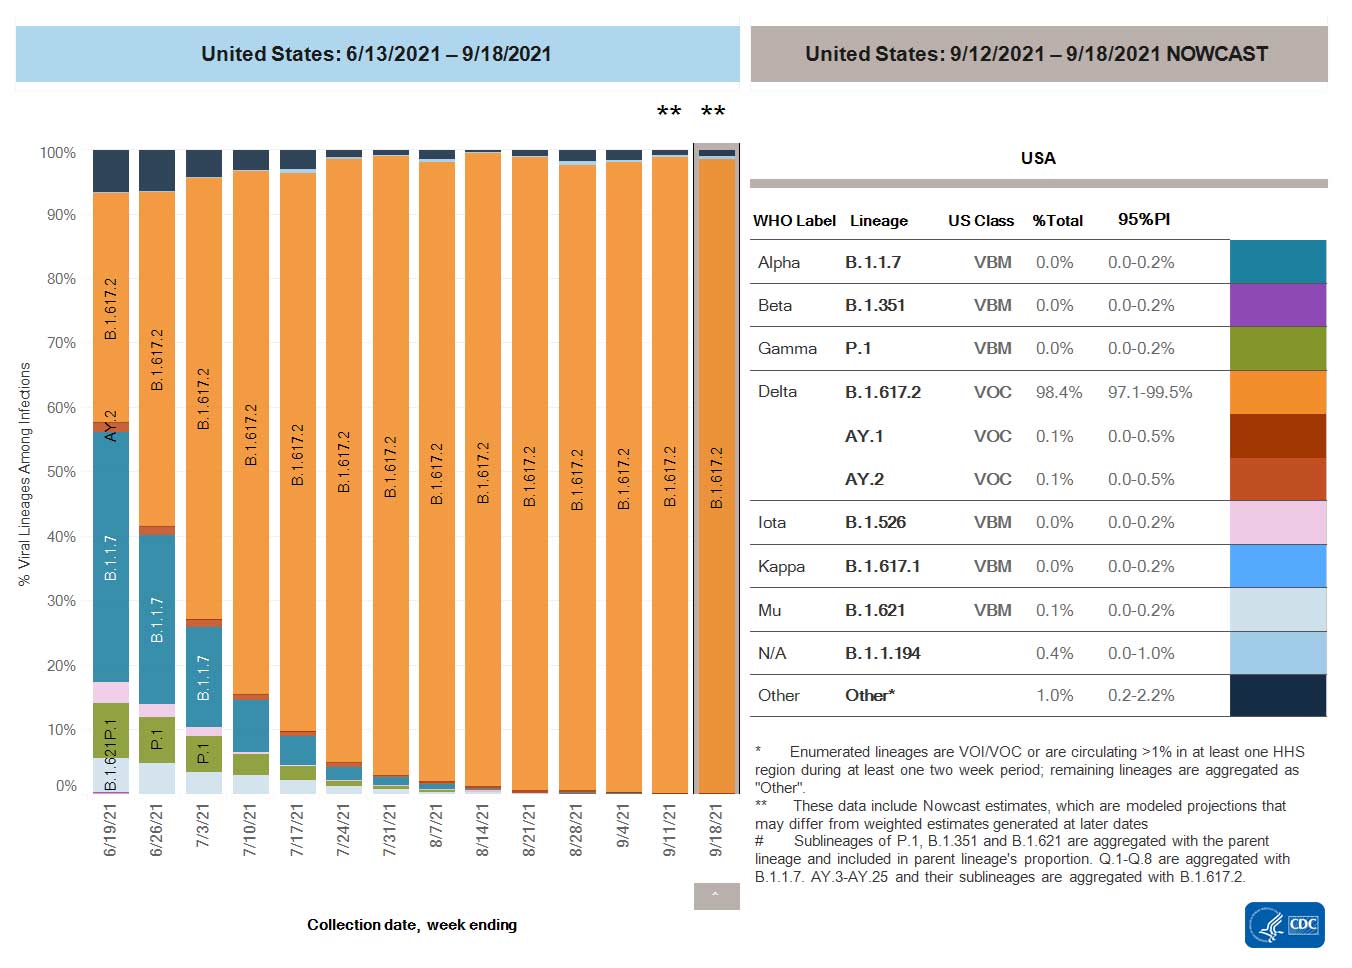
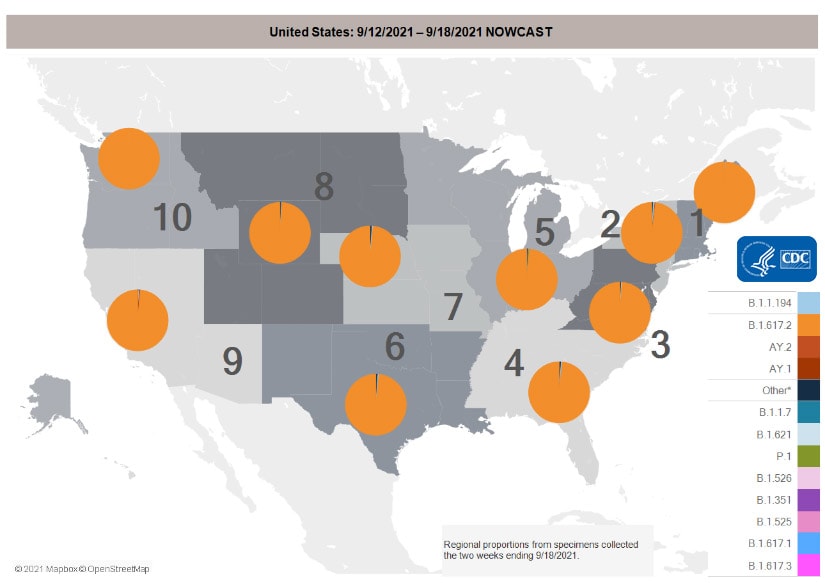
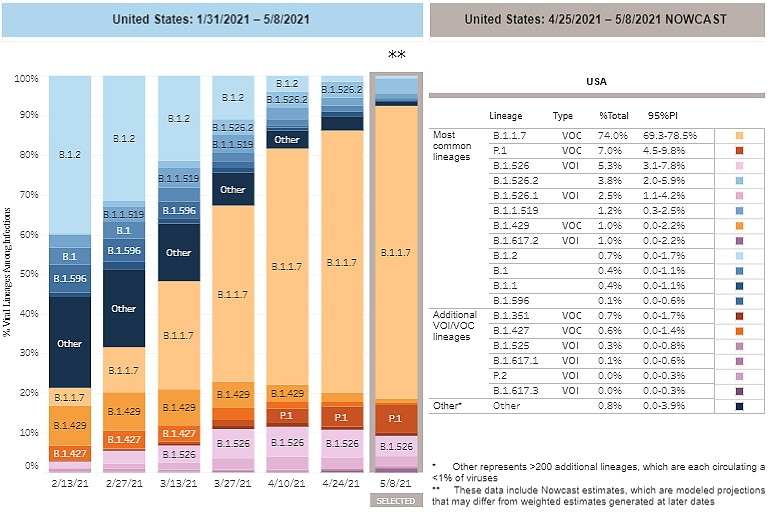
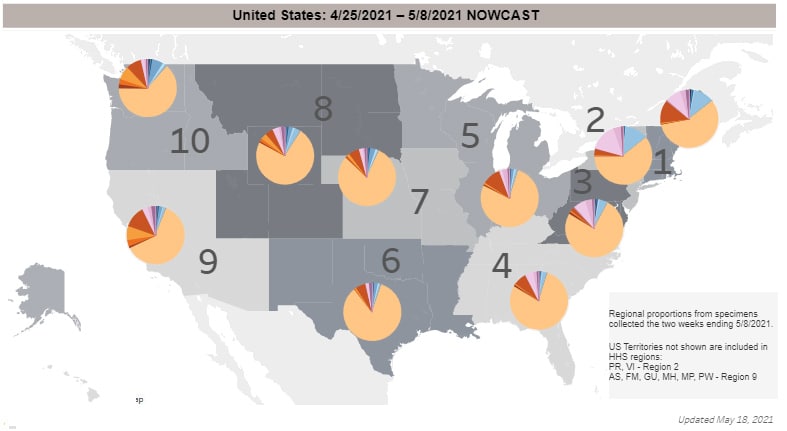
Multiple variants of the virus that causes COVID-19 are circulating globally and within the United States. To date, five variants have been classified as a variant of concern (VOC). Nowcast estimates* of SARS-CoV-2 cases caused by these VOCs for the two weeks ending May 8 are summarized here. Nationally, B.1.1.7 proportions are predicted to increase to 74%; P.1 proportions are predicted to increase to 7%; B.1.427/B.1.429 proportions are predicted to increase; and B.1.351 proportions are predicted to decrease. Nowcast estimates predict that B.1.1.7 proportions will increase to more than 60% in all but HHS region 1. B.1.351 is predicted to increase in regions 3, 4, 9, and 10; P.1 is predicted to increase in all regions; and B.1.427/429 will be highest in regions 9 and 10. B.1.617.2, a new variant of interest, is predicted to be highest in regions 1, 6, 8, and 9.

*Current nowcast estimates are modeled data based on sequencing data from previous weeks. Nowcast provides timely estimates for the present, while accounting for limited sequence data availability, as specimens from the most current time interval are still being processed.

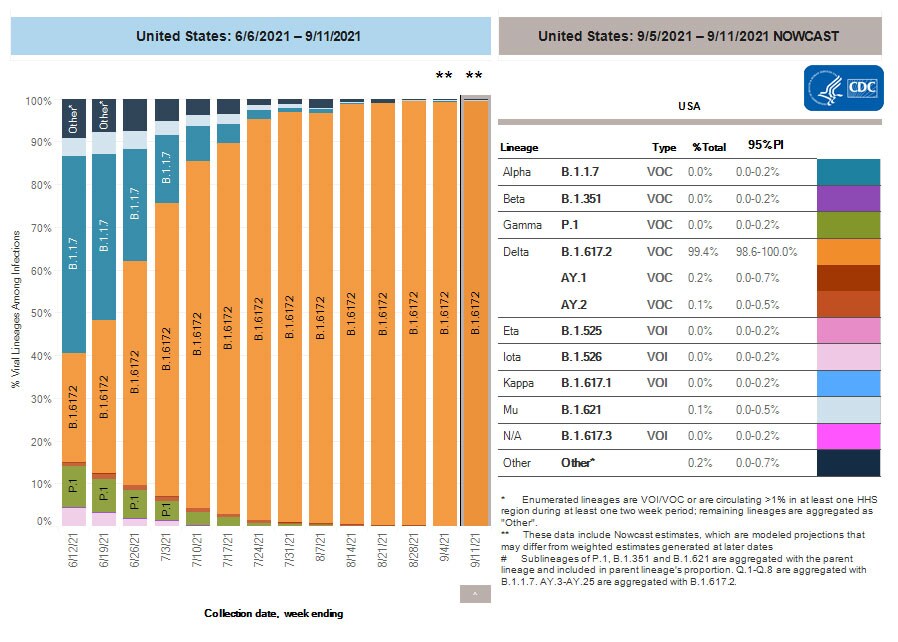
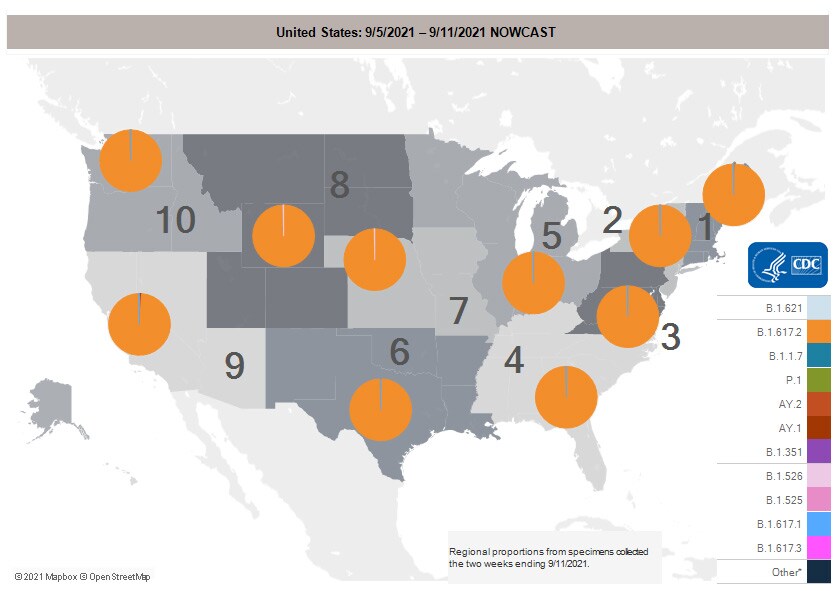
SARS-CoV-2 Variants Circulating in the United States
resize iconView Larger
resize iconView Larger
More Variants Data


Testing


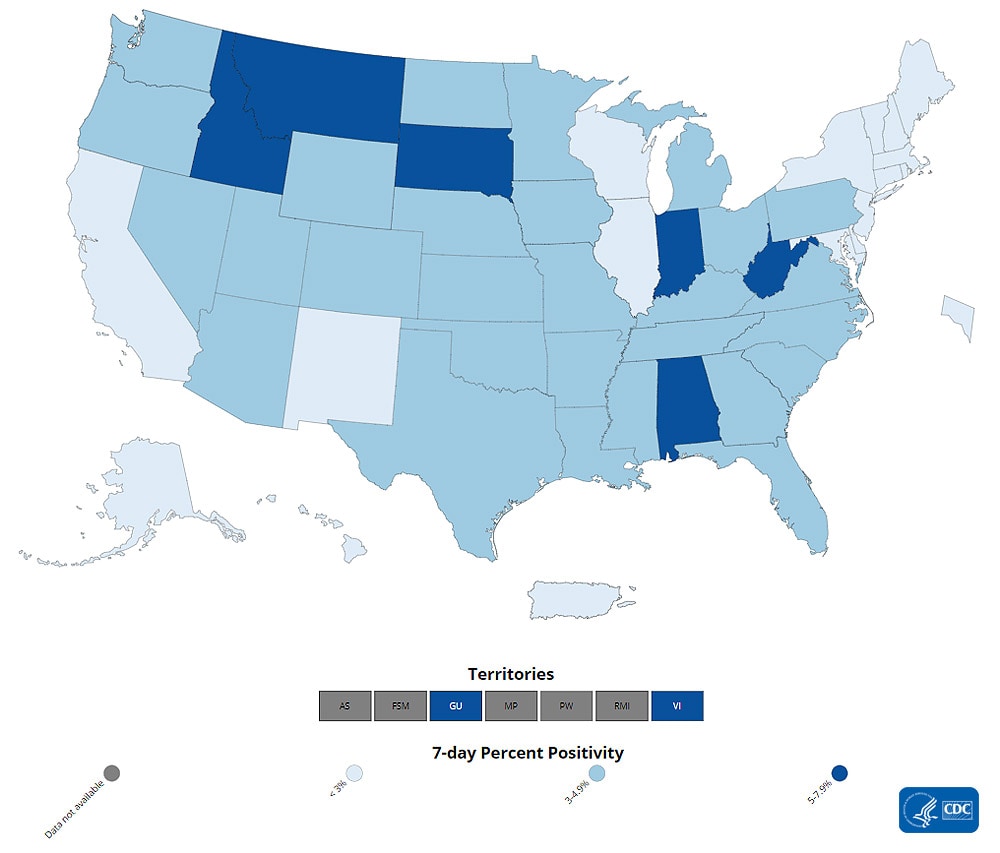
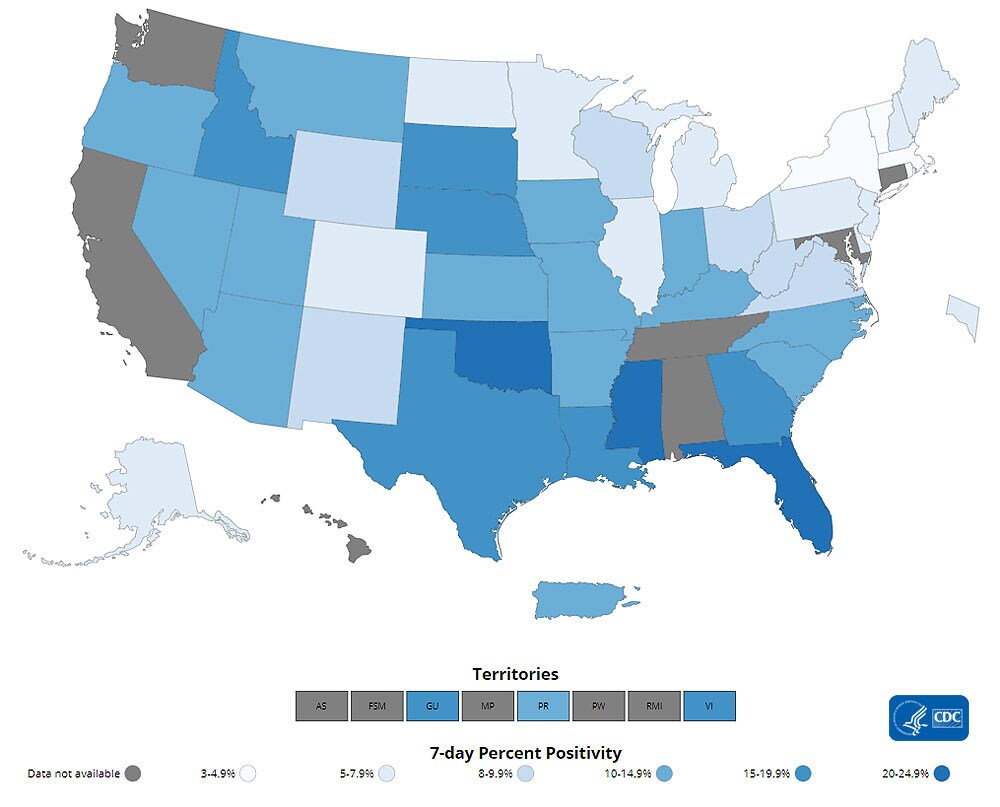
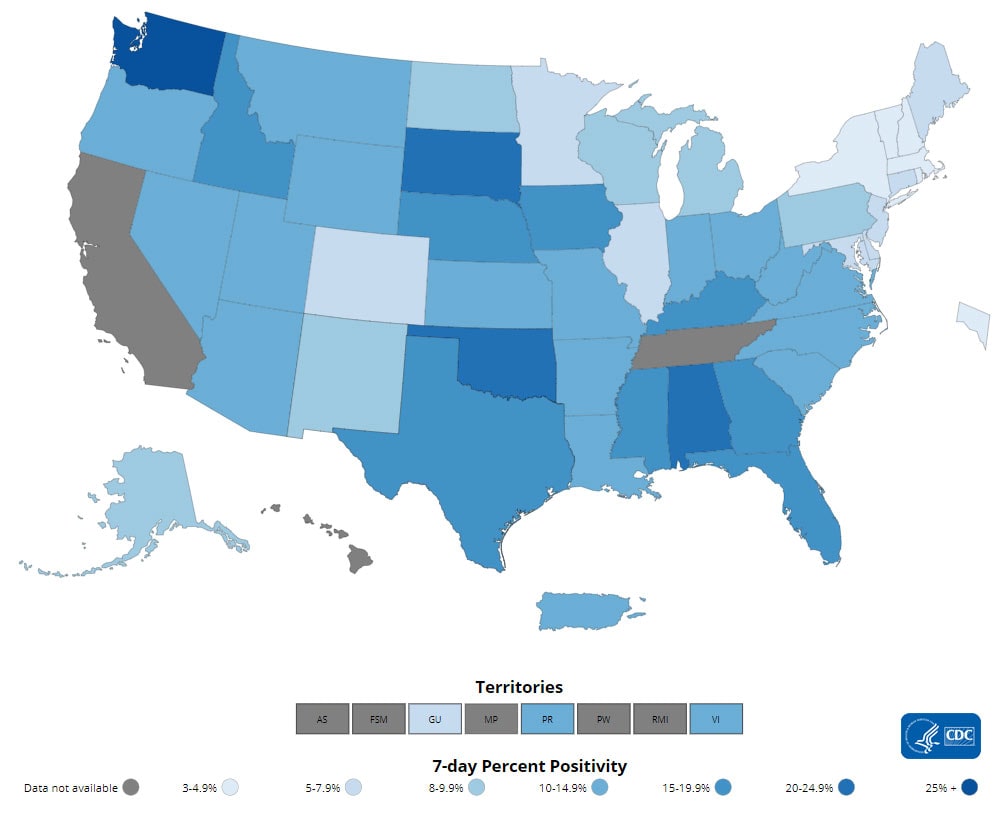
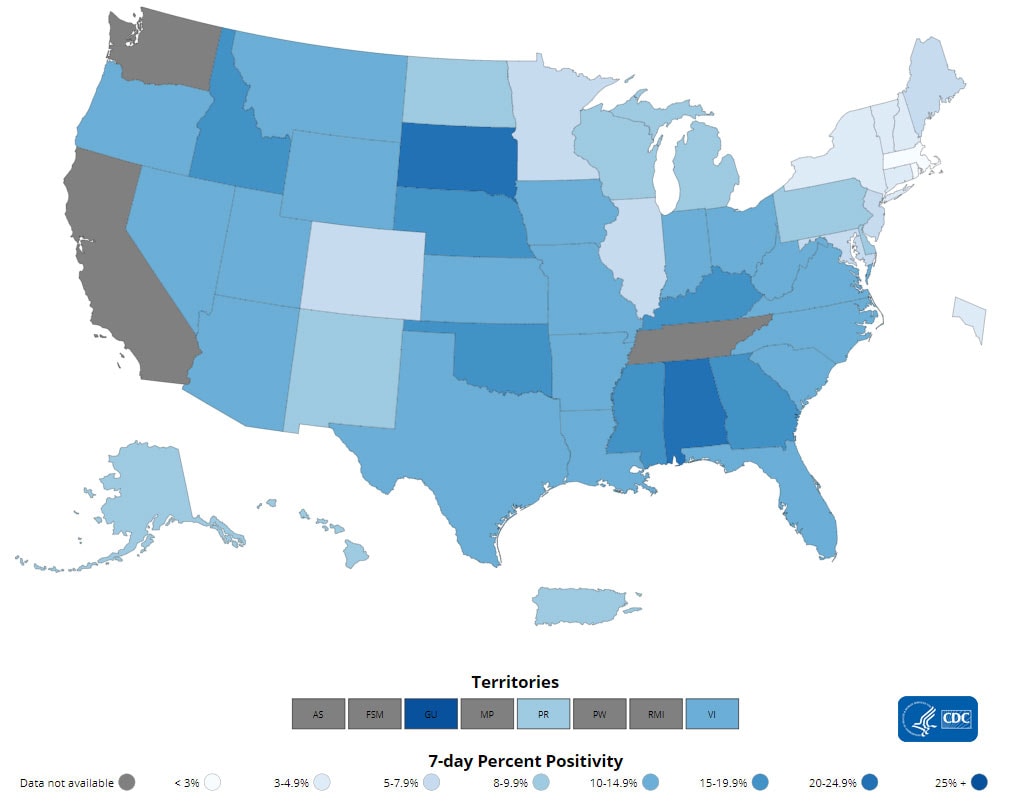
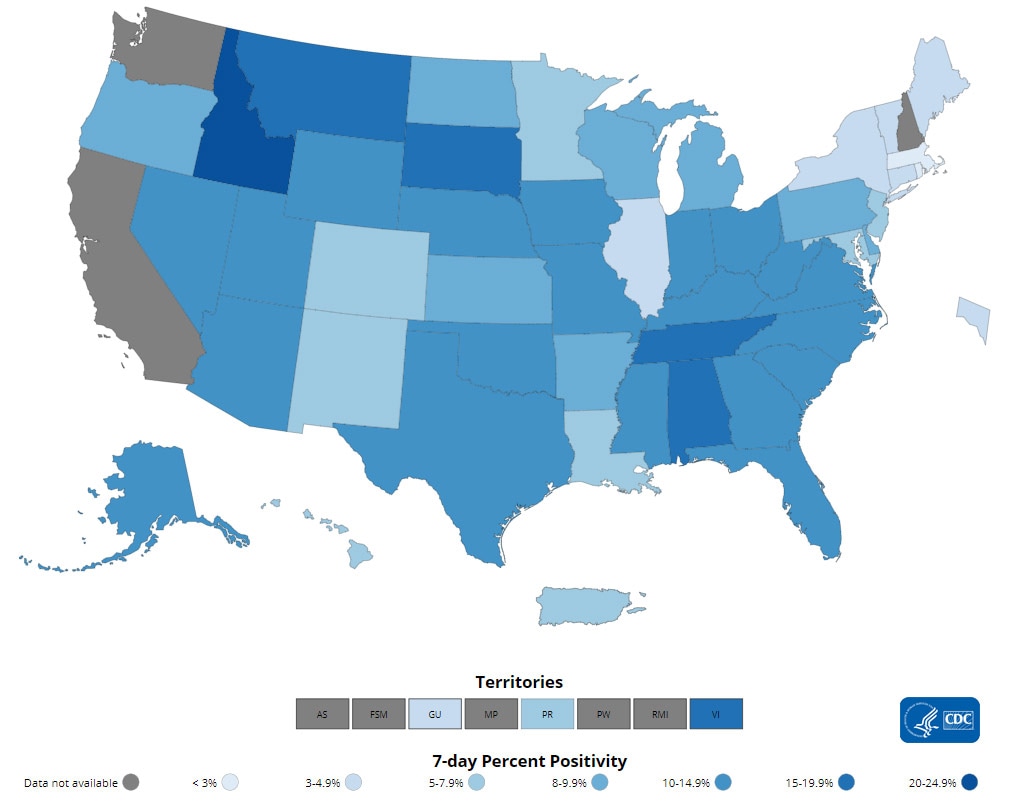
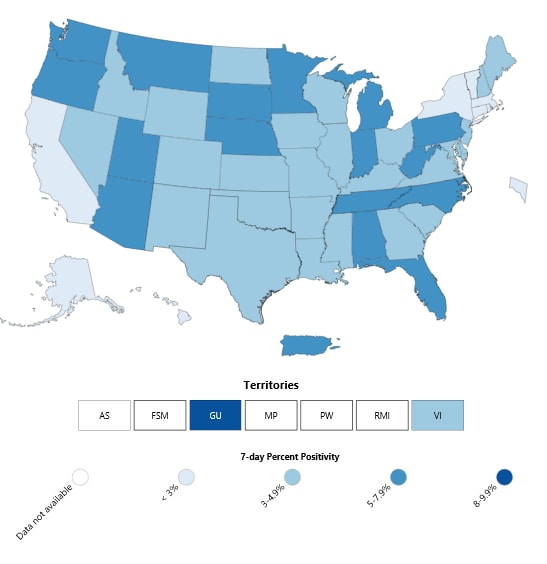
The percentage of COVID-19 NAATs (nucleic acid amplification tests) that are positive (percent positivity) has decreased from the previous week. The 7-day average of percent positivity from tests is now 3.0%. The 7-day average number of tests reported for May 7-May 13 was 1,007,699, down 9.4% from 1,112,391 for the prior 7 days.

437,214,993
Total Tests Reported

1,007,699
7-Day Average Tests Reported

3.0%
7-Day Average % Positivity

3.4%
Previous 7-Day Average % Positivity

-12.6%
Change in 7-Day Average % Positivity since Prior Week

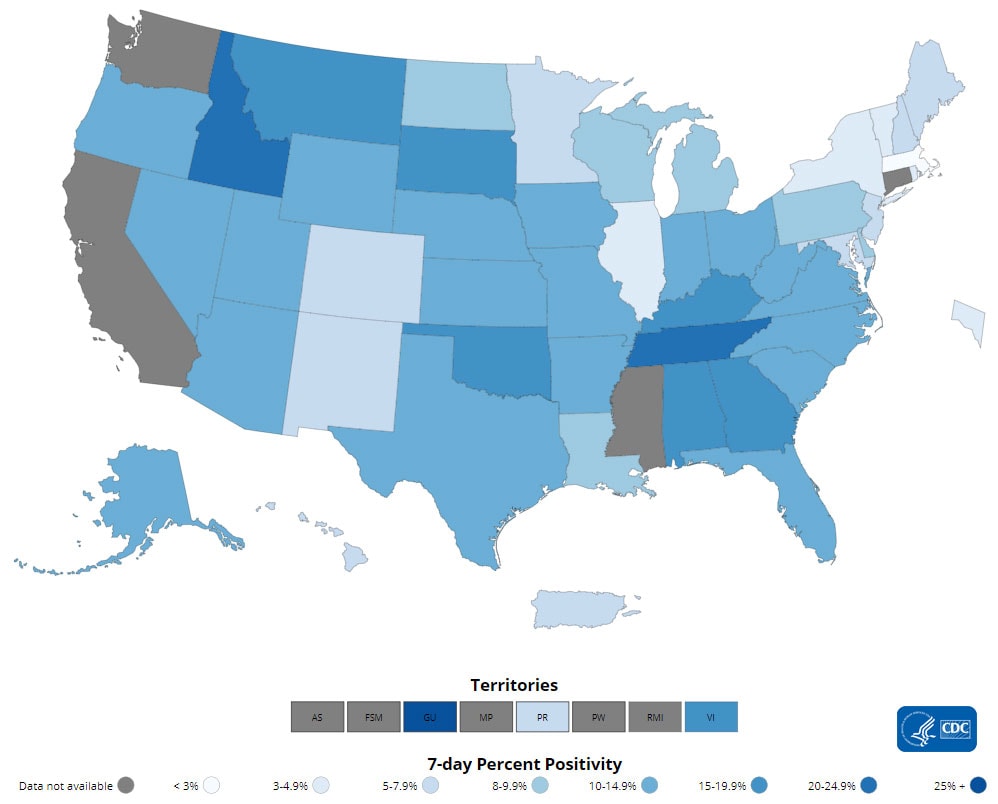
COVID-19 NAAT Laboratory Test 7-day Percent Positivity by State/Territory
resize iconView Larger
More Testing Dataexternal icon


Vaccinations


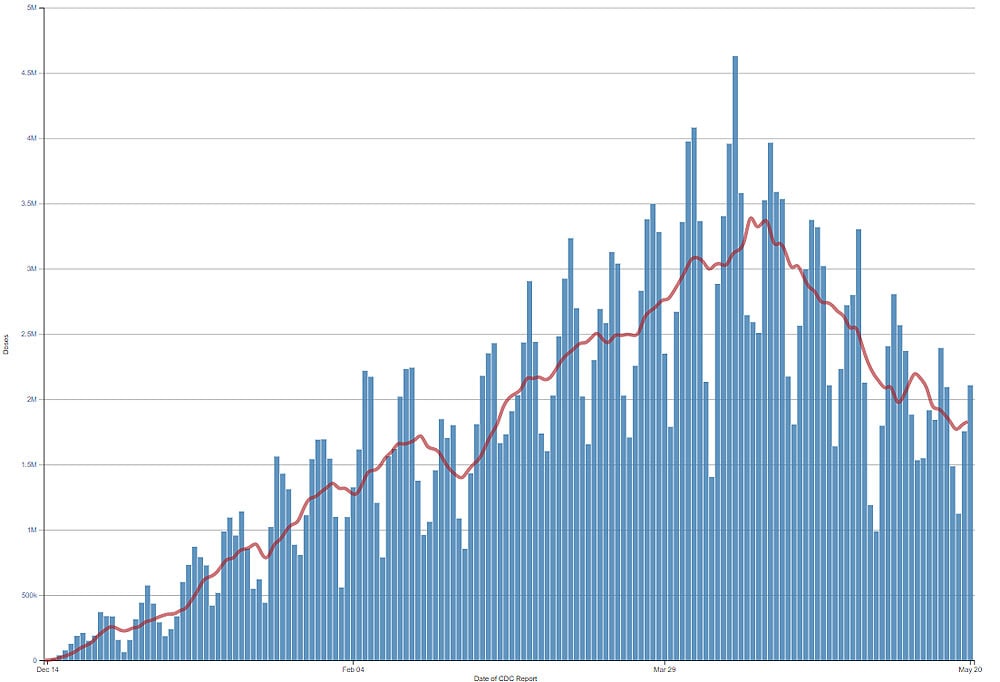
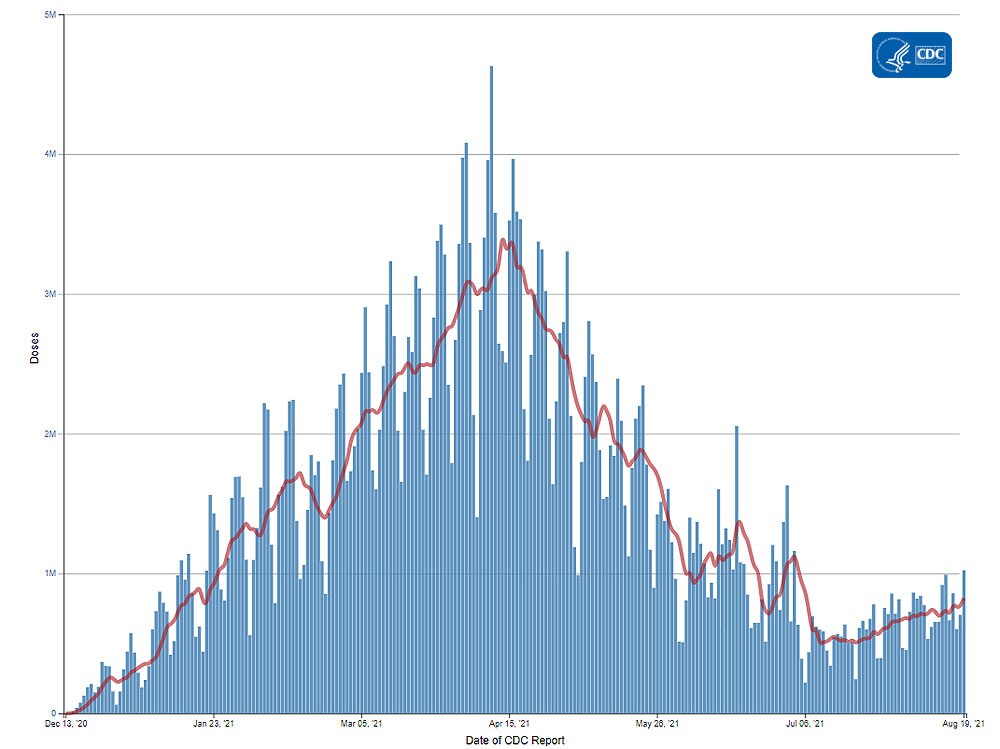
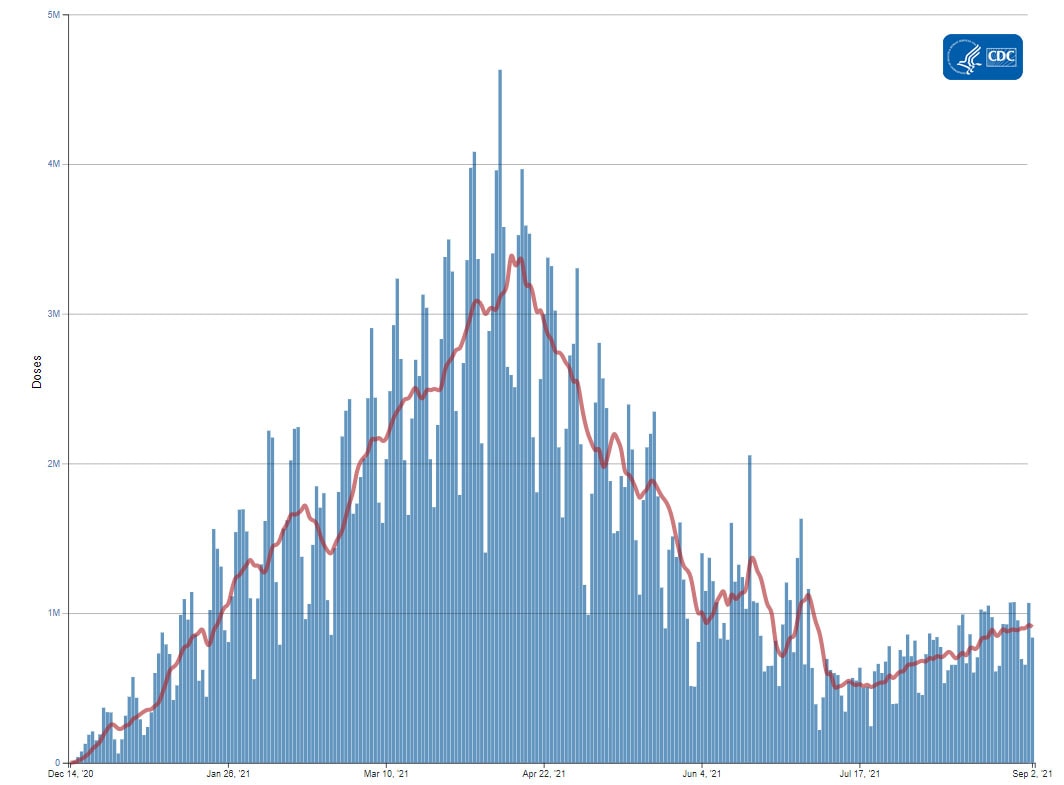
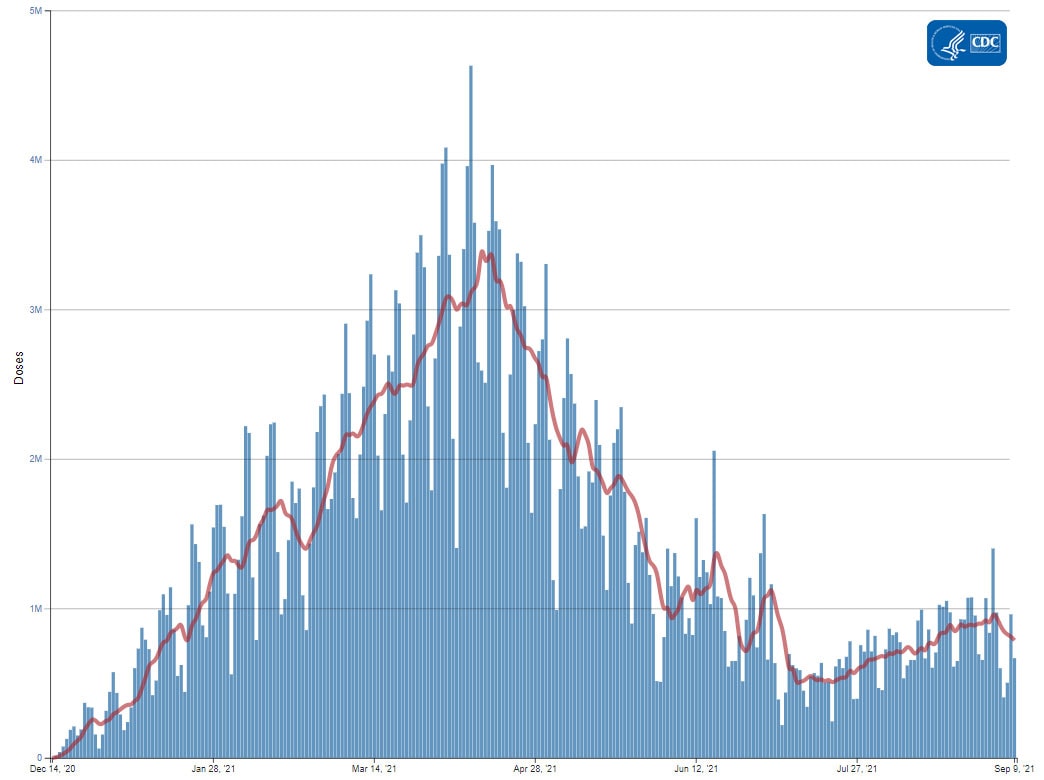
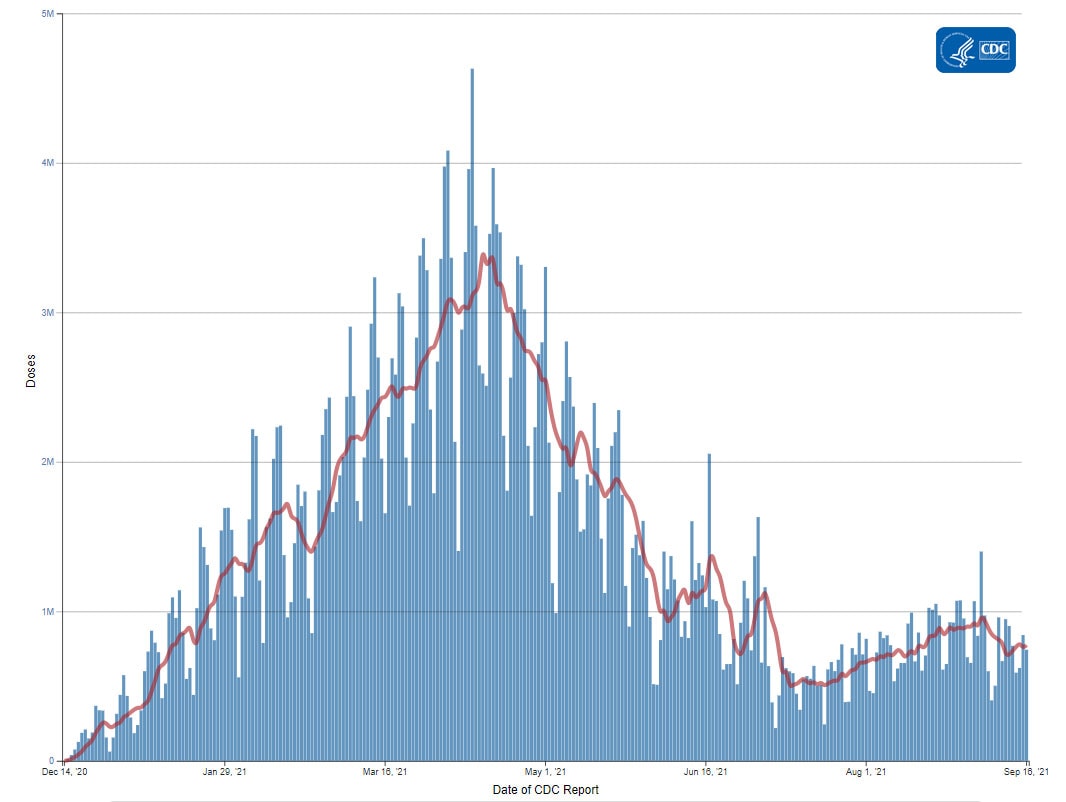
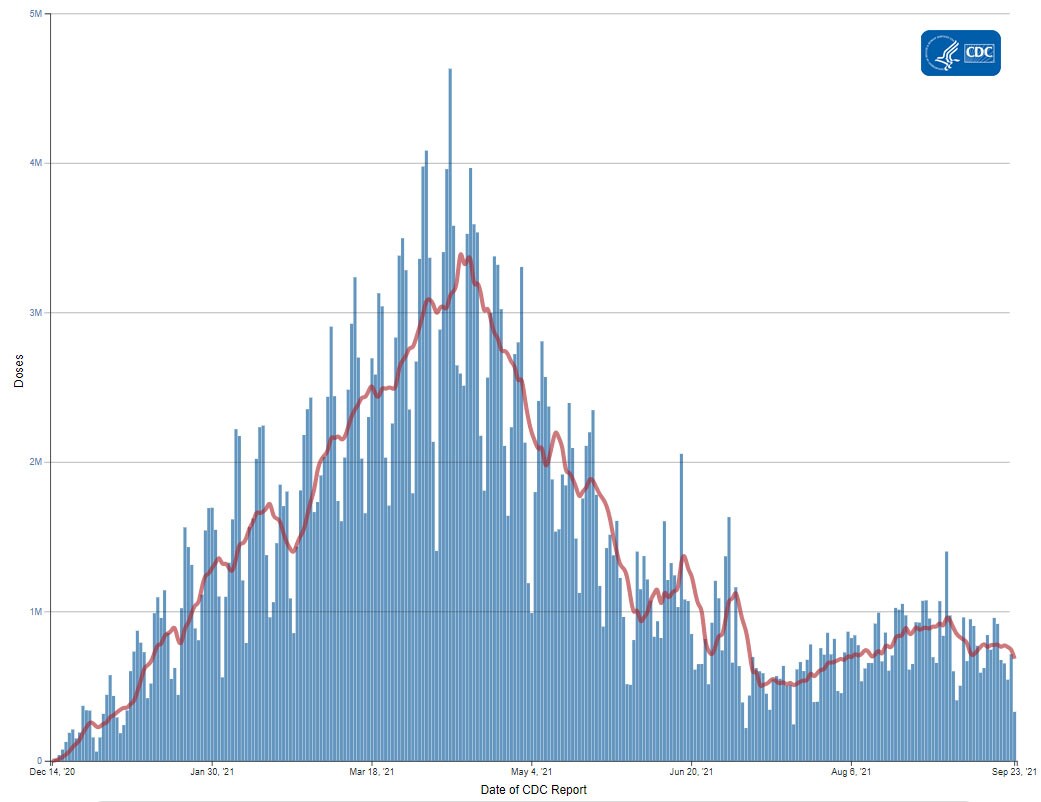
The U.S. COVID-19 Vaccination Program began December 14, 2020. As of May 20, 279.4 million vaccine doses have been administered. Overall, about 160.2 million people, or 48.2% of the total U.S. population, have received at least one dose of vaccine. About 126.6 million people, or 38.1% of the total U.S. population, have been fully vaccinated.* As of May 20, the 7-day average number of administered vaccine doses reported to CDC per day was 1.8 million, a 12.5% decrease from the previous week.

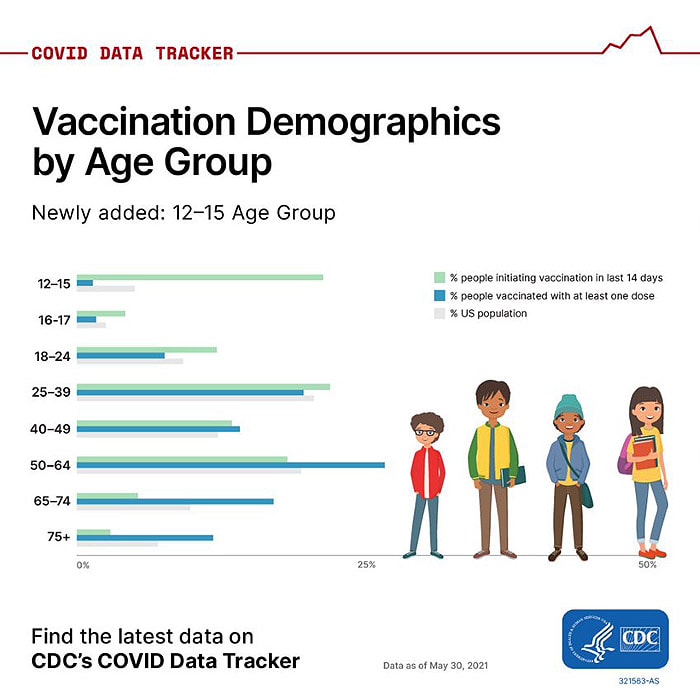
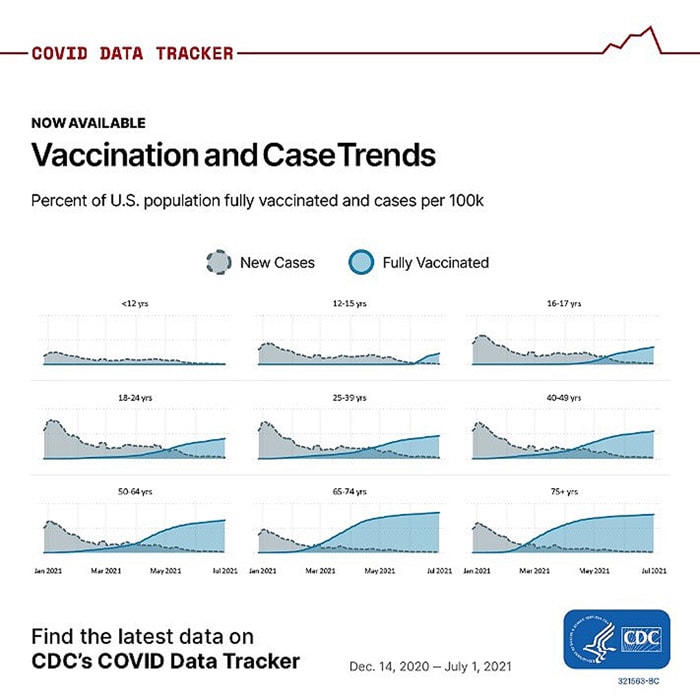
The COVID Data Tracker Vaccination Demographic Trends tab shows vaccination trends by age group. As of May 19, 84.9% of people ages 65 or older have received at least one dose of vaccine and 73.2% are fully vaccinated. Over half (60.5%) of people ages 18 or older have received at least one dose of vaccine and 48.4% are fully vaccinated.

279,397,250
Vaccines Administered

160,177,820
People who received at least one dose

126,605,166
People who are fully vaccinated*

48.2%
Percentage of the US population that has received at least one dose

38.1%
Percentage of the US population that has been fully vaccinated*

+1.6
Percentage point increase from last week

+2.3
Percentage point increase from last week

*People who are fully vaccinated represents the number of people who have received the second dose in a two-dose COVID-19 vaccine series or one dose of the single-shot J&J/Janssen COVID-19 vaccine.

Daily Change in Number of COVID-19 Vaccinations in the United States Reported to CDC

red-line.jpg

7-Day moving average

resize iconView Larger
More Vaccination Data


Hospitalizations

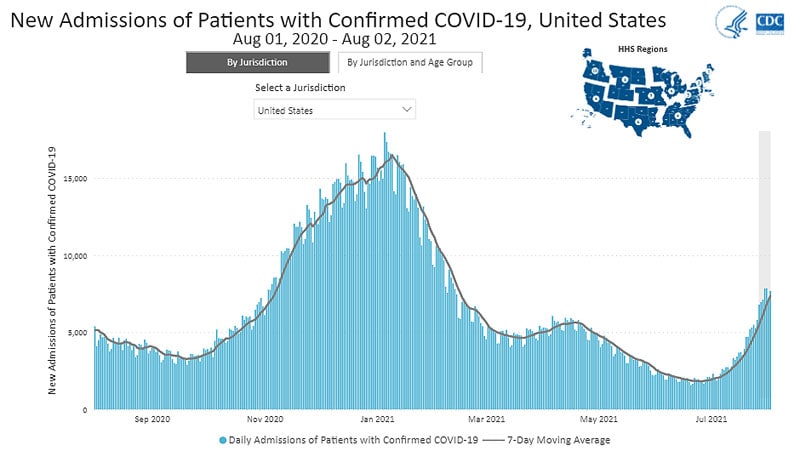
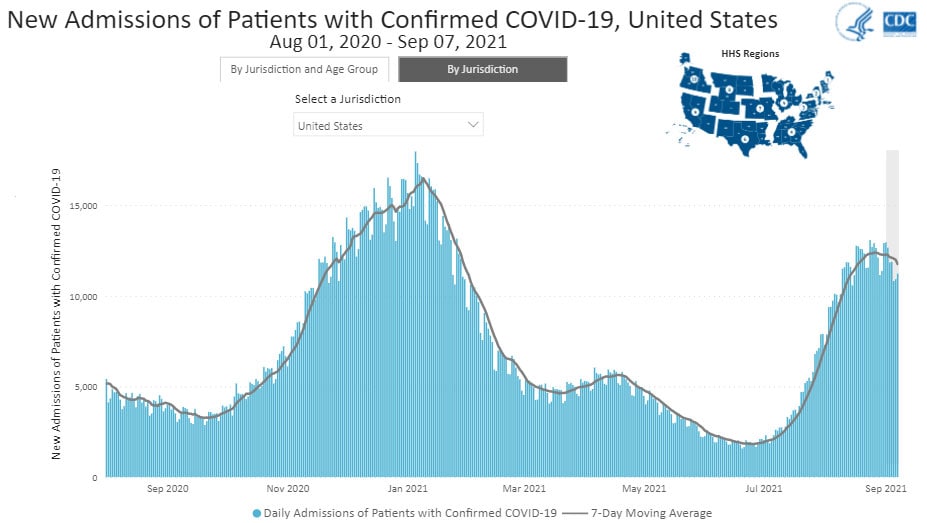
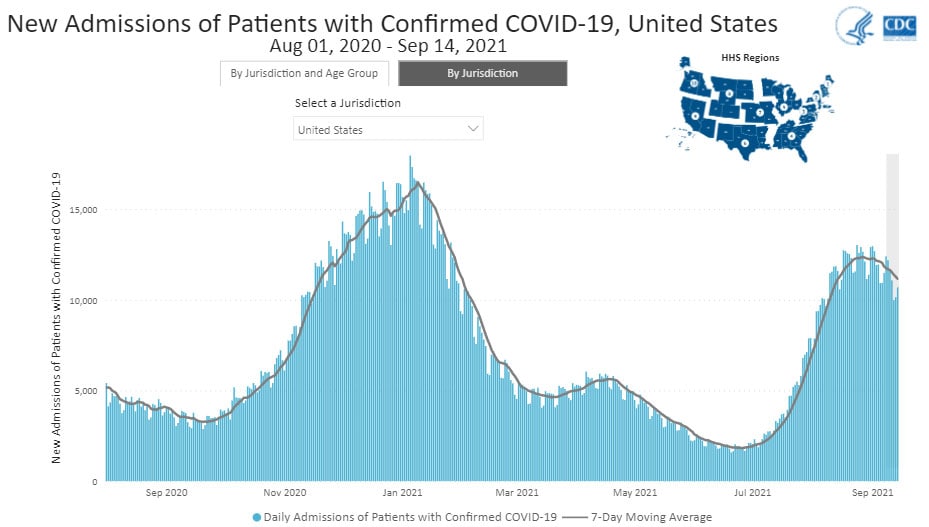
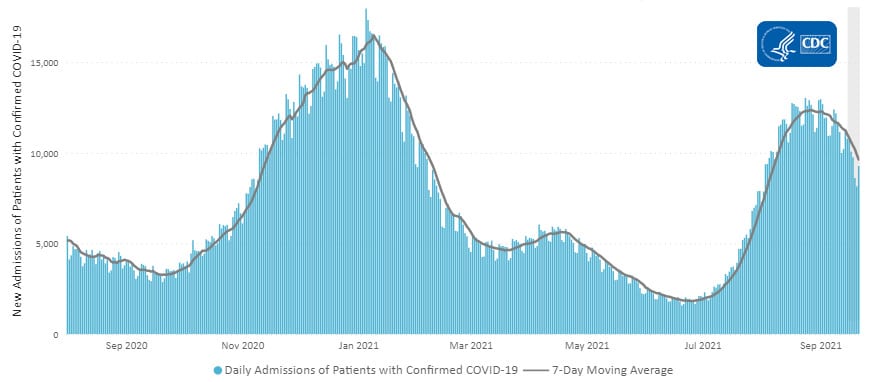
New Hospital Admissions


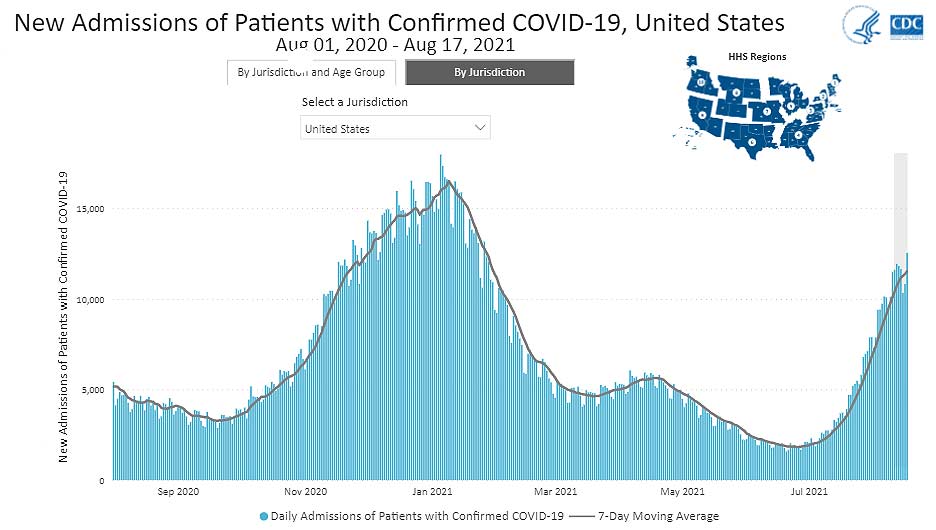
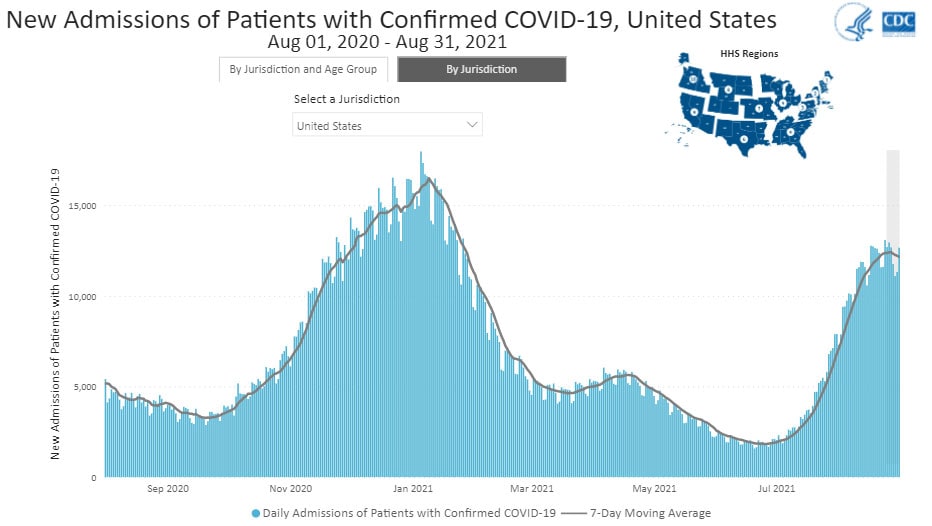
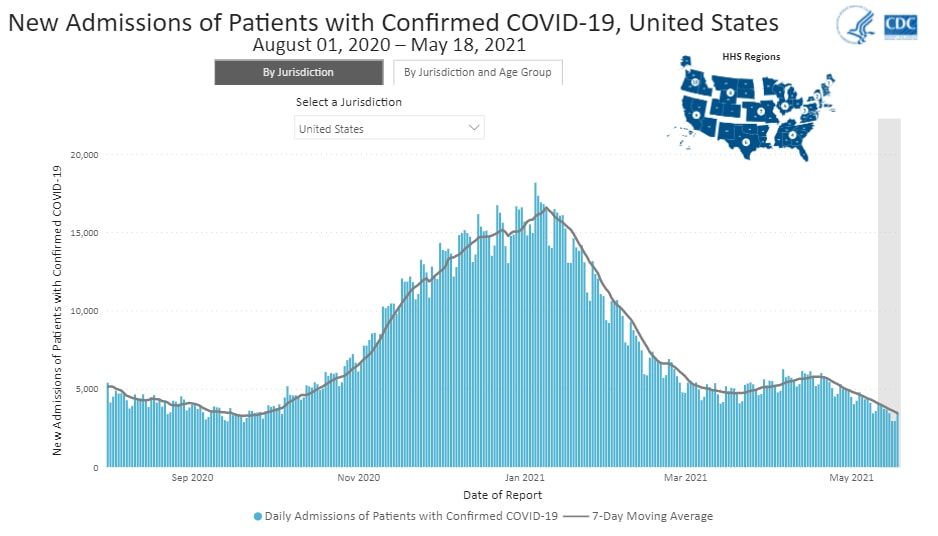
The current 7-day average for May 12–May 18 was 3,438. This is a 15.1% decrease from the prior 7-day average (4,051) from May 5–May 11. The 7-day moving average for new admissions has been consistently decreasing since April 19.

2,202,437
Total New Admissions

3,438
Current 7-Day Average

4,051
Prior 7-Day Average

-15.1%
Change in 7-Day Average

Daily Trends in Number of New COVID-19 Hospital Admissions in the United States
resize iconView Larger
New admissions are pulled from a 10 am EST snapshot of the HHS Unified Hospital Timeseries Dataset. Due to potential reporting delays, data from the most recent 7 days, as noted in the figure above with the grey bar, should be interpreted with caution. Small shifts in historic data may also occur due to changes in the CMS Provider of Services file, which is used to identify the cohort of included hospitals.

More Hospital Data


COVID-NET: Recent Trends in Hospitalizations in Non-Hispanic Black Persons


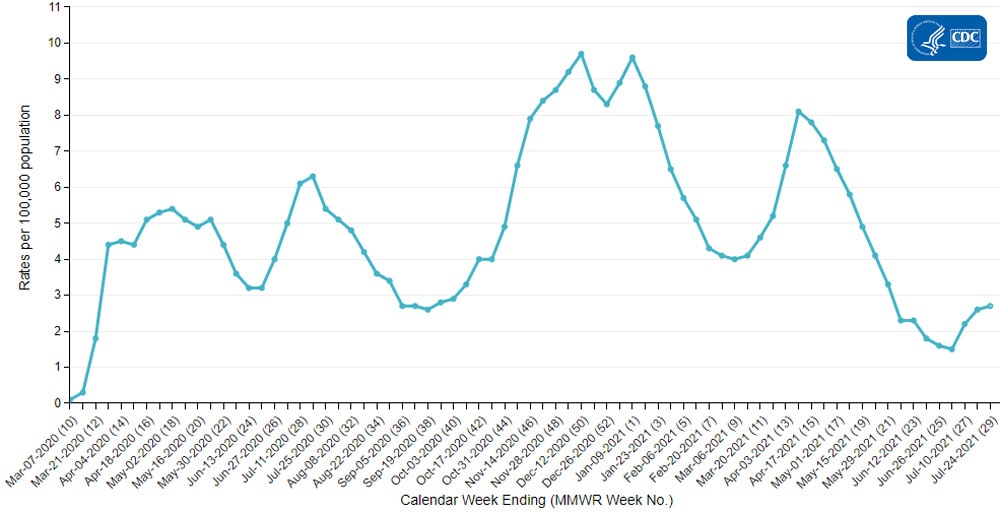
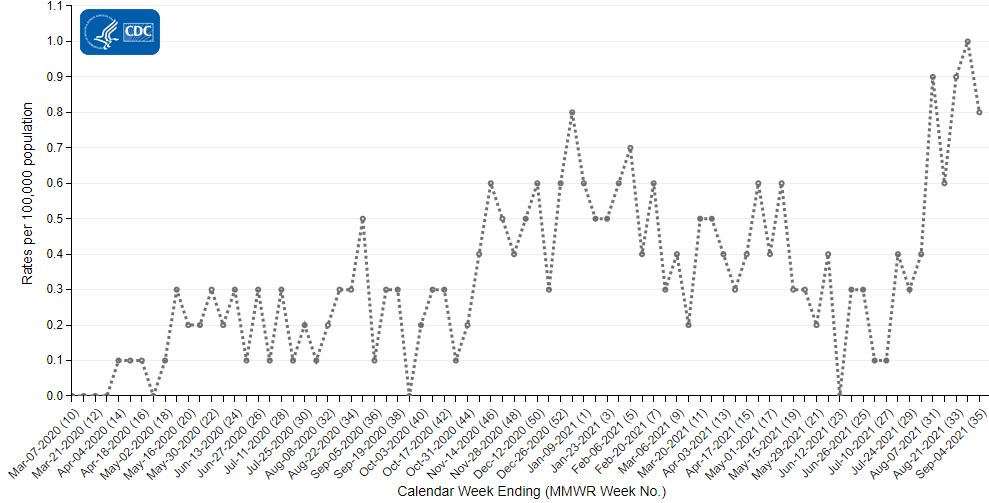
Since the start of the pandemic, people from racial and ethnic minority groups have been at increased risk for COVID-19-associated hospitalizations compared to non-Hispanic White persons. While rates of hospitalizations have fallen in all race and ethnicity groups since January 2021, the hospitalization rate for non-Hispanic Black persons remains higher than other groups and has been nearly twice as high as rates in non-Hispanic White persons since late January. After falling in January and February 2021, hospitalization rates increased again in all groups beginning in early March. The weekly rate of hospitalizations for non-Hispanic Black persons reached 17.3 per 100,000 population for the week ending April 17, double the rate for non-Hispanic White persons (7.9 per 100,000 population for the same week). While preliminary data for late April and early May show rates again decreasing for all groups, the hospitalization rate in non-Hispanic Black persons remains one of the highest.

Trends in Hospitalizations by Race/Ethnicity*


resize iconView Larger
*Only White, Black, and Hispanic/Latino groups were included in this figure. Additional race/ethnicity groups can be viewed by selecting Weekly Rates by Race/Ethnicity at the More COVID-NET Data link.

The Coronavirus Disease 2019 (COVID-19)-Associate­­d Hospitalization Surveillance Network (COVID-NET) is an additional source for hospitalization data collected through a network of more than 250 acute-care hospitals in 14 states (representing ~10% of the U.S. population). Detailed data on patient demographics, including race/ethnicity, underlying medical conditions, medical interventions, and clinical outcomes, are collected using a standardized case reporting form.
More COVID-NET Data

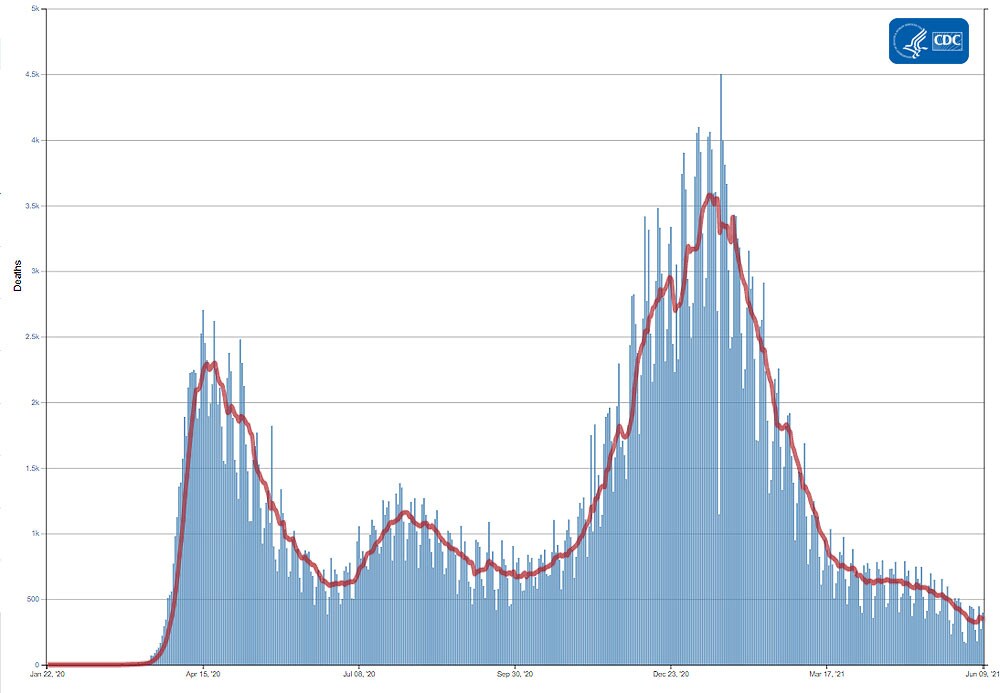
Deaths


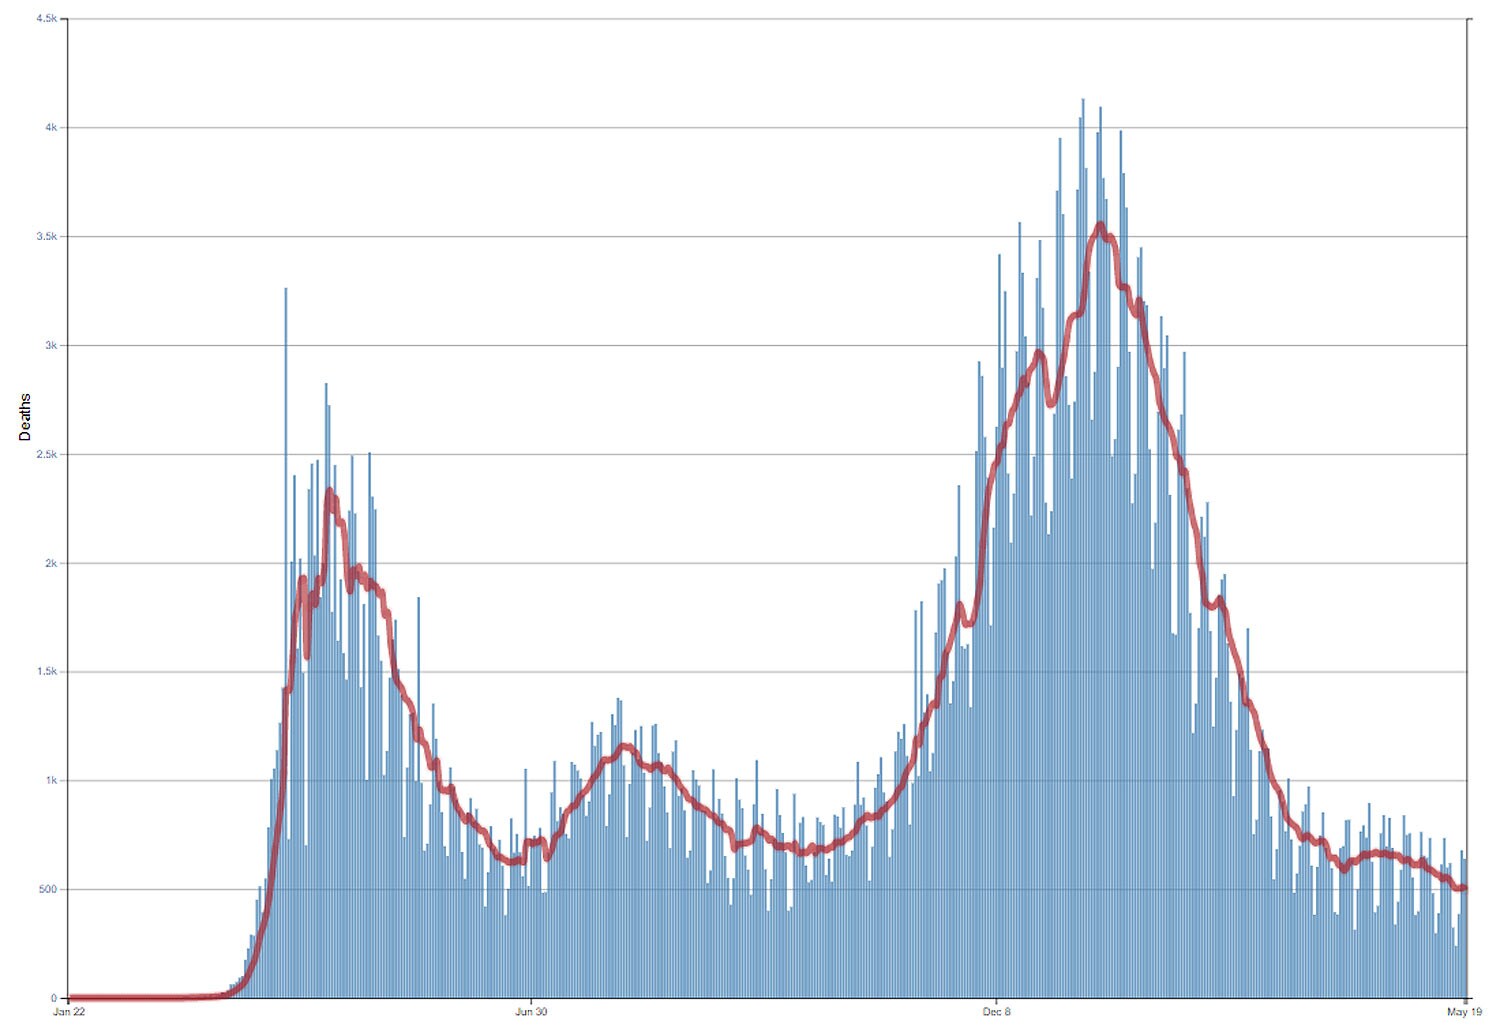
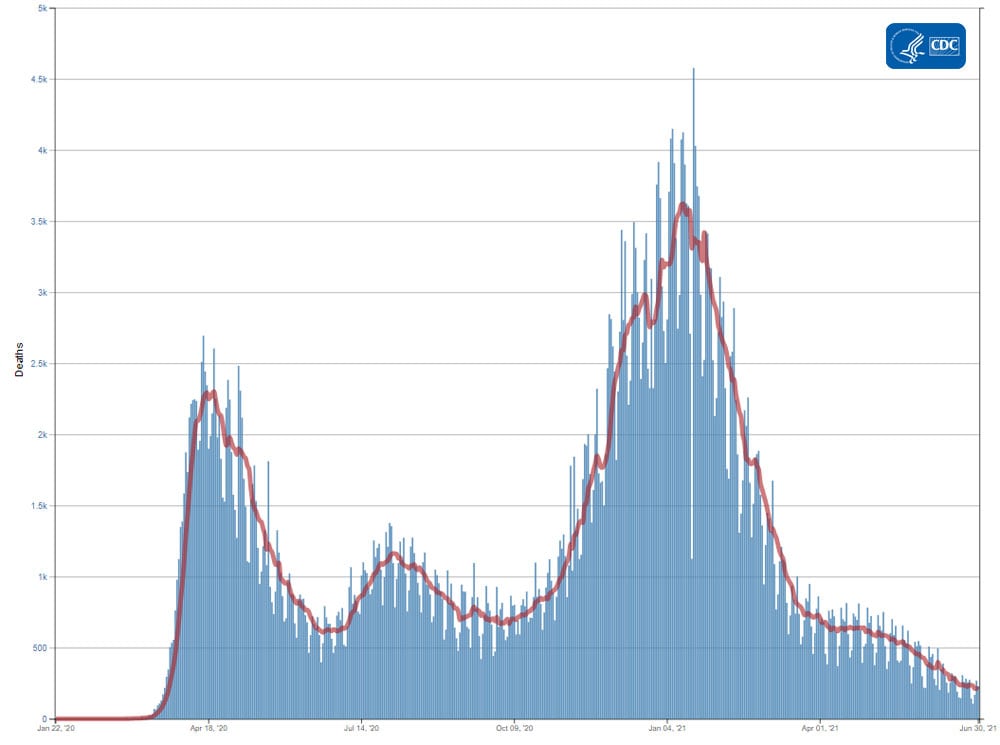
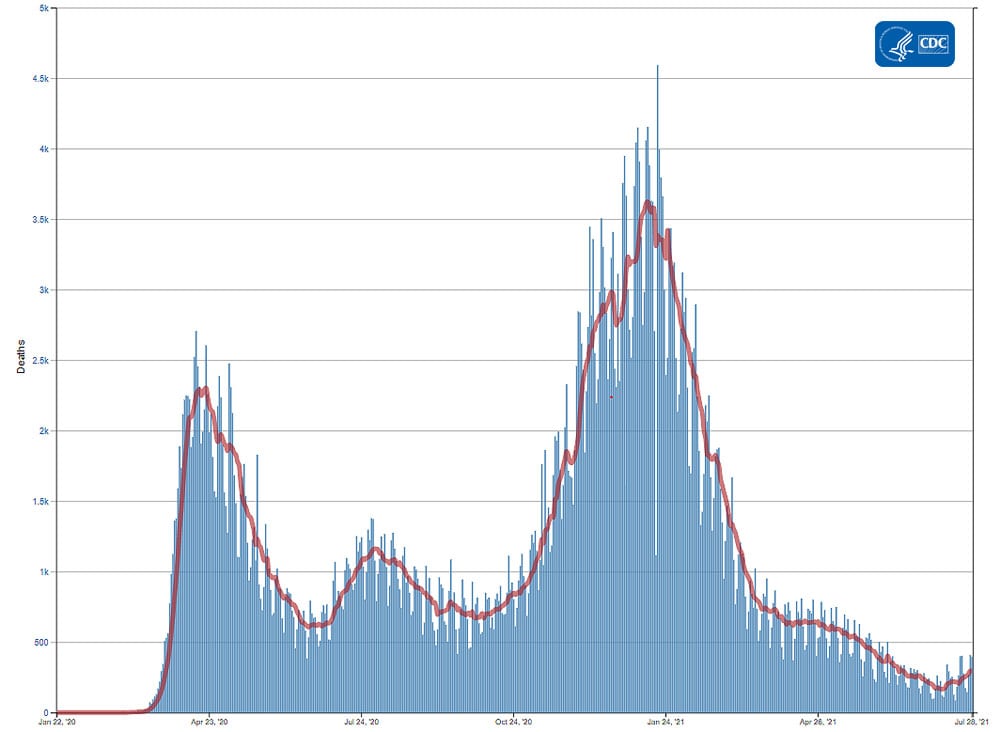
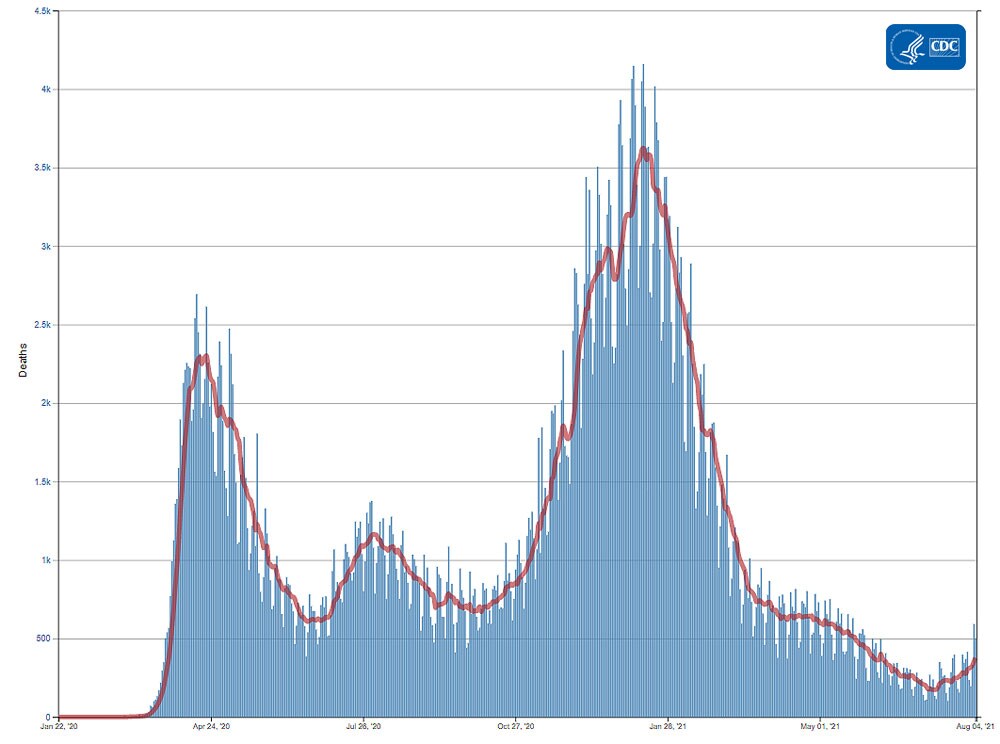
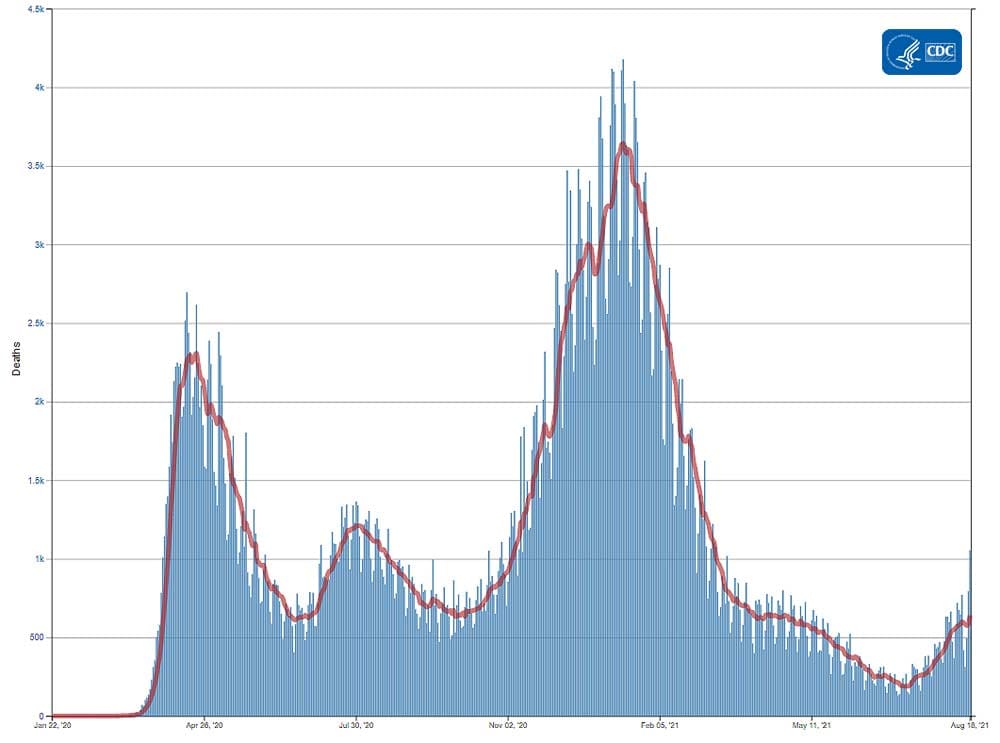
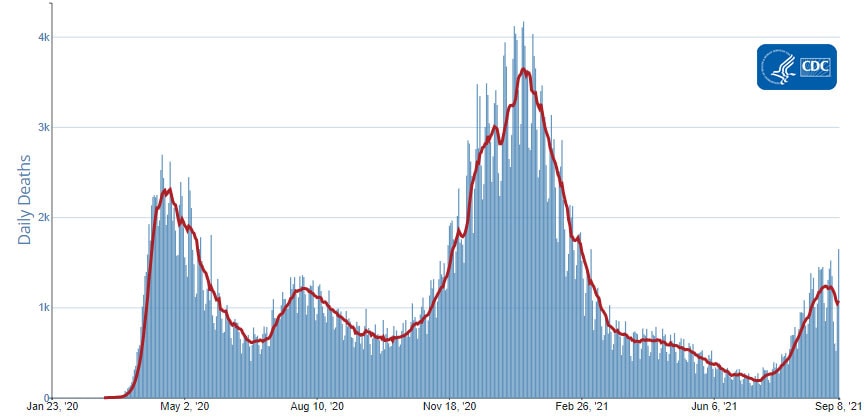
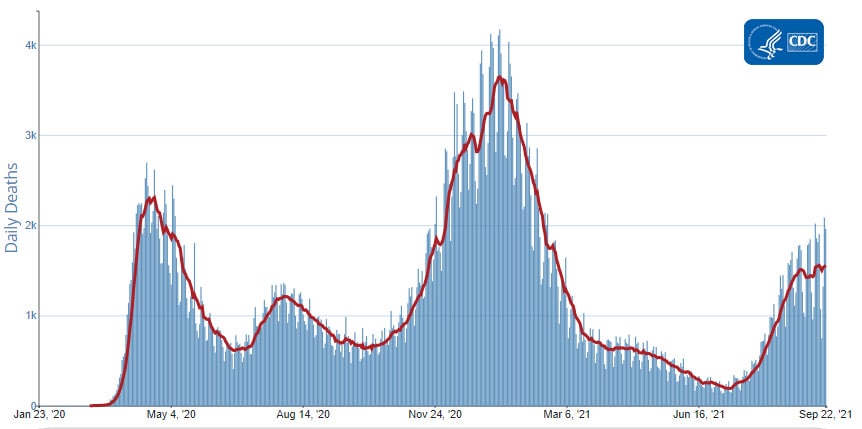
The current 7-day moving average of new deaths (498) decreased 10.5% compared with the previous 7-day moving average (556). As of May 19, a total of 584,975 COVID-19 deaths have been reported.

584,975
Total Deaths Reported

498
Current 7-Day Average*

556
Prior 7-Day Average

-10.5%
Change in 7-Day Average Since Prior Week

*Historical deaths are excluded from the daily new deaths and 7-day average calculations until they are incorporated into the dataset by their applicable date. Of 11,165 historical deaths reported retroactively, 182 were reported for the most recent submission date; 223 in the current week; and 6 were reported in the prior week.

Note: In the above table, historical data with missing report dates are excluded from current and prior 7-day averages, and the percent change in the 7-day average.

Daily Trends in Number of COVID-19 Deaths in the United States Reported to CDC
red-line.jpg

7-Day moving average

resize iconView Larger
More Death Data


Recent CDC COVID-19 Publications
  1. Characteristics of COVID-19 Cases and Outbreaks at Child Care Facilities — District of Columbia, July–December 2020
  2. Disparities in COVID-19 Vaccination Coverage Between Urban and Rural Counties — United States, December 14, 2020–April 10, 2021
  3. The Advisory Committee on Immunization Practices’ Interim Recommendation for Use of Pfizer-BioNTech COVID-19 Vaccine in Adolescents Aged 12–15 Years — United States, May 2021
  4. Interim Estimates of Vaccine Effectiveness of Pfizer-BioNTech and Moderna COVID-19 Vaccines Among Health Care Personnel — 33 U.S. Sites, January–March 2021
Recent COVID Data Tracker Updates
https://www.cdc.gov/coronavirus/2019...iew/index.html
 
covid-tracker-header-lrg.jpg
COVID Data Tracker Weekly Review


Print
Subscribe to the Weekly Review


Interpretive Summary for June 4, 2021
Trending: Teens


resize iconView Larger


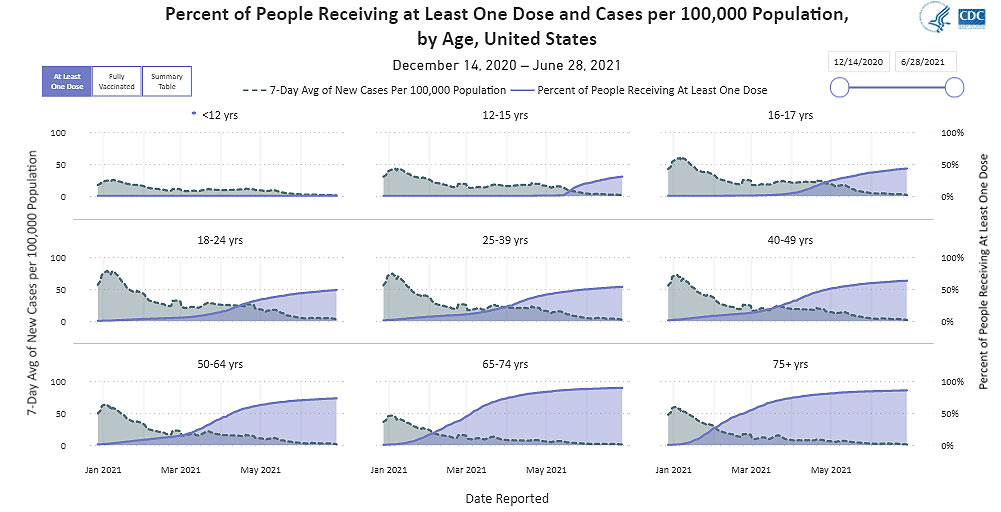
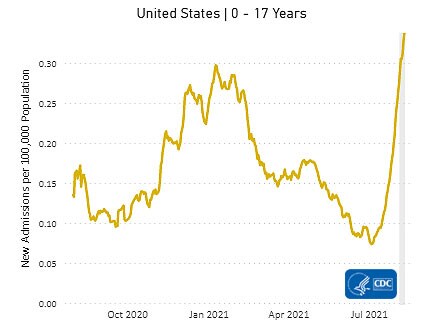
A recent CDC study found COVID-19-associated hospitalization rates among adolescents ages 12-17 years increased during March and April, following declines in January and February 2021. This trend differed from hospitalization rates among people ages 65 years and older—the age group with the highest COVID-19 vaccination coverage—who saw hospitalization rates stabilize during the same timeframe.

While rates of COVID-19-associated hospitalization in adolescents are lower than those in adults, cases of severe disease (including those requiring ICU admission or mechanical ventilation) have been documented in this age group. Recent increases in COVID-19-associated hospitalization rates and the potential for severe disease in adolescents reinforce the importance of continued prevention strategies, including vaccination and the correct and consistent use of masks in those who are not yet fully vaccinated.

With summer upon us, many adolescents are looking forward to returning to activities they may have missed last summer, including travel, hanging out with friends, work, and summer camp. Vaccinating adolescents is an important step toward stopping the spread of COVID-19. As of June 3, 2021, more than 5.9 million adolescents ages 12-17 years have received at least one dose of a COVID-19 vaccine. Fully vaccinated adolescents are at low risk of symptomatic or severe infection and are less likely to transmit COVID-19 to others. If you or someone you know is considering adolescent vaccination, talk with your pediatrician or healthcare provider about the benefits of vaccination. To find a vaccine provider near you, visit vaccines.gov.

Note to Readers: This week, CDC celebrates the 70[SUP]th[/SUP] anniversary of the Epidemic Intelligence Service (EIS) program, a unique training program of service and on-the-job learning. CDC’s EIS officers—better known as CDC’s elite “disease detectives”—have served on the front lines of public health, investigating threats in the United States and around the world. During the COVID-19 pandemic, more than 120 EIS officers have deployed nearly 400 times to airport screening stations, quarantine stations, state and local health departments, and the CDC Emergency Operations Center to assist with the nation’s response to COVID-19.


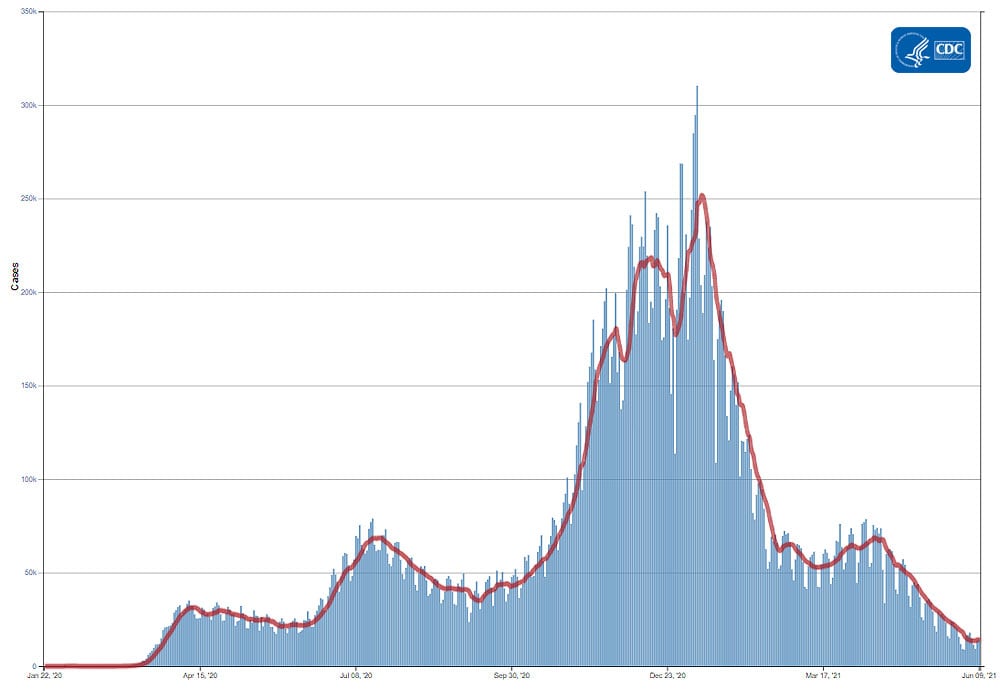
Reported Cases


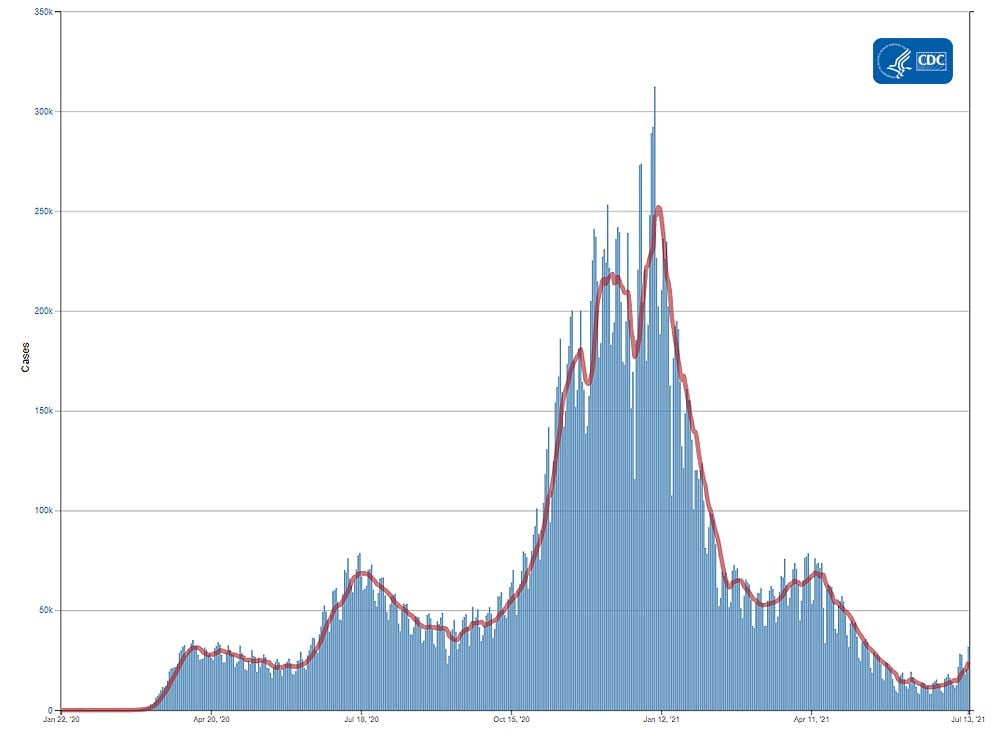
The current 7-day moving average of daily new cases (14,349) decreased 35.2% compared with the previous 7-day moving average (22,139). Compared with the highest peak on January 9, 2021 (251,374), the current 7-day average decreased 94.3%. A total of 33,130,027 COVID-19 cases have been reported as of June 2.

33,130,027
Total Cases Reported

14,349
Current 7-Day Average*

22,139
Prior 7-Day Average

-35.2%
Change in 7-Day Average since Prior Week

*Historical cases are excluded from daily new cases and 7-day average calculations until they are incorporated into the dataset for the applicable date. Of 71,176 historical cases reported retroactively, 1 was reported in the current week and none were reported in the prior week.

Note: In the above table, historical data with missing report dates are excluded from current and prior 7-day averages, and the percent change in the 7-day average.


Daily Trends in COVID-19 Cases in the United States Reported to CDC
red-line.jpg

7-Day moving average

resize iconView Larger
More Case Data


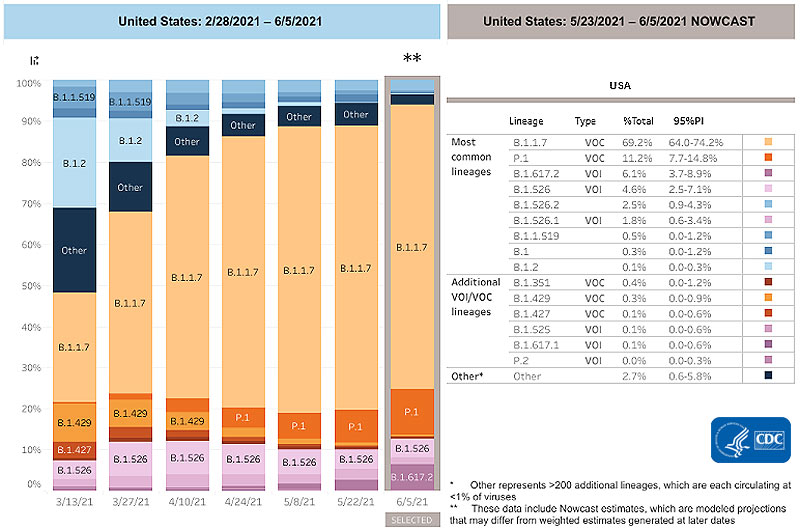
SARS-CoV-2 Variants


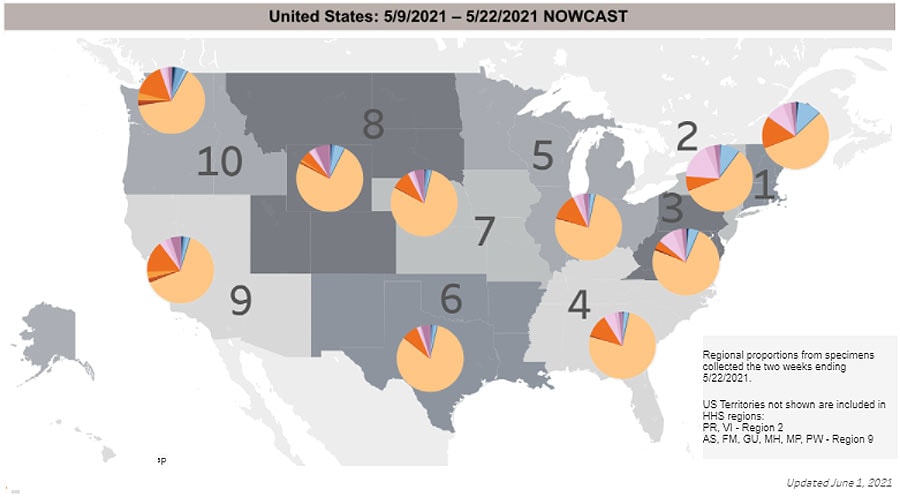
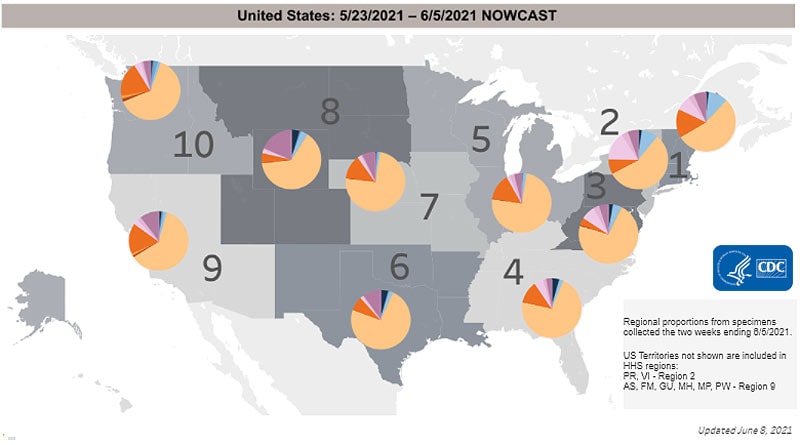
Multiple variants of the virus that causes COVID-19 are circulating globally and within the United States. To date, five variants have been classified as a variant of concern (VOC). Nowcast estimates* of SARS-CoV-2 cases caused by these VOCs for the two weeks ending May 22 are summarized here. Nationally, B.1.1.7 proportions are predicted to increase to 73%; P.1 proportions are predicted to increase to 9.8%. B.1.427/B.1.429 proportions are predicted to decrease; and B.1.351 proportions are predicted to stay the same. Nowcast estimates predict that B.1.1.7 proportions will remain at more than 60% in all but HHS regions 1, 2, and 10. B.1.351 is predicted to remain higher in regions 7, 9, and 10; P.1 is predicted to be more than 10% in regions 1 and 10; and B.1.427/429 will remain highest in regions 9 and 10. B.1.617.2, a variant of interest, is predicted to be higher in regions 6, 7, 8, and 9.

*Current Nowcast estimates are modeled data based on sequencing data from previous weeks. Nowcast provides timely estimates for the present, while accounting for limited sequence data availability, as specimens from the most current time interval are still being processed.

SARS-CoV-2 Variants Circulating in the United States

resize iconView Larger

resize iconView Larger
More Variants Data


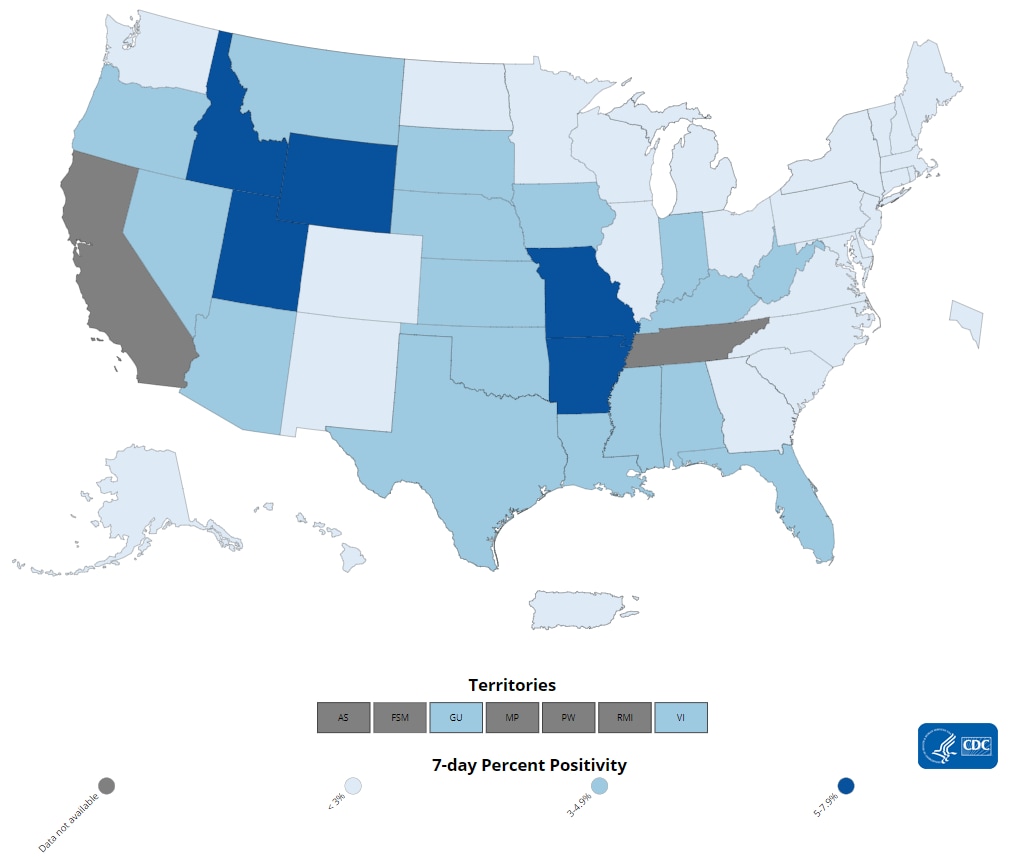
Testing


The percentage of COVID-19 NAATs (nucleic acid amplification tests) that are positive (percent positivity) has decreased from the previous week. The 7-day average of percent positivity from tests is now 2.2%. The 7-day average number of tests reported for May 21-May 27 was 814,444, down 11.2% from 916,804 for the prior 7 days.

449,236,831
Total Tests Reported

814,444
7-Day Average Tests Reported

2.2%
7-Day Average % Positivity

2.5%
Previous 7-Day Average % Positivity

-14.5%
Change in 7-Day Average % Positivity since Prior Week

COVID-19 NAAT Laboratory Test 7-day Percent Positivity by State/Territory

resize iconView Larger
More Testing Dataexternal icon


Vaccinations


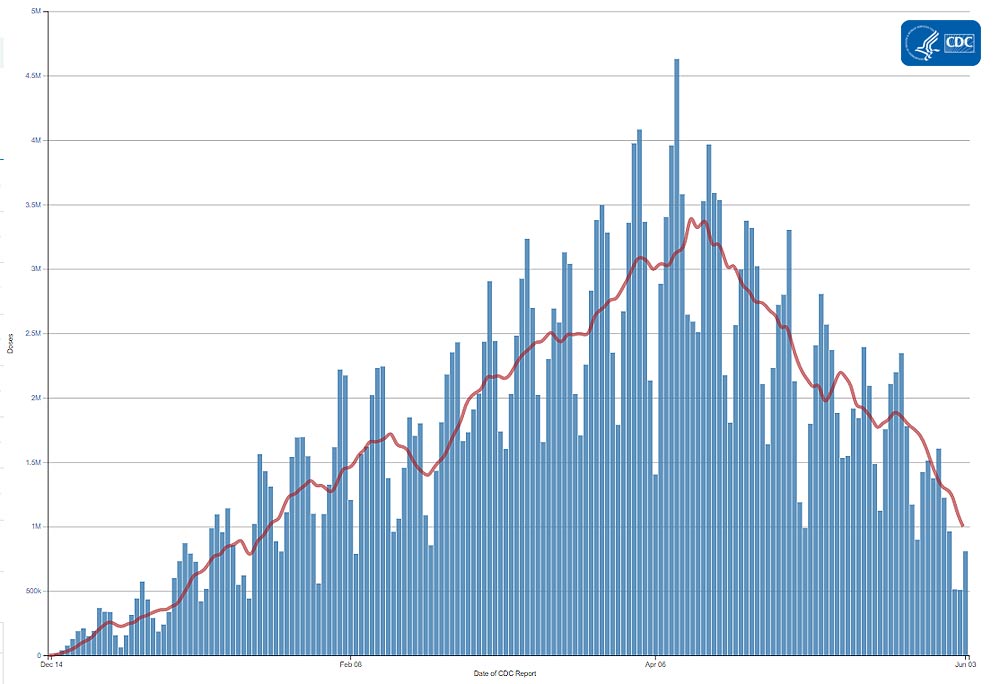
The U.S. COVID-19 Vaccination Program began December 14, 2020. As of June 3, 297.7 million vaccine doses have been administered. Overall, about 169.1 million people, or 50.9% of the total U.S. population, have received at least one dose of vaccine. About 136.6 million people, or 41.2% of the total U.S. population, have been fully vaccinated. As of June 3, the 7-day average number of administered vaccine doses reported to CDC per day was 1.0 million, a 38.2% decrease from the previous week.

The COVID Data Tracker Vaccination Demographic Trends tab shows vaccination trends by age group. As of June 3, 86% of people ages 65 or older have received at least one dose of vaccine and 75% are fully vaccinated. Over half (63%) of people ages 18 or older have received at least one dose of vaccine and 52% are fully vaccinated.

297,720,928
Vaccines Administered

169,090,262
People who received at least one dose

136,644,618
People who are fully vaccinated*

50.9%
Percentage of the US population that has received at least one dose

41.2%
Percentage of the US population that has been fully vaccinated*

+1.0
Percentage point increase from last week

+1.2
Percentage point increase from last week

*People who are fully vaccinated represents the number of people who have received the second dose in a two-dose COVID-19 vaccine series or one dose of the single-shot J&J/Janssen COVID-19 vaccine.

Daily Change in Number of COVID-19 Vaccinations in the United States Reported to CDC

red-line.jpg

7-Day moving average

resize iconView Larger
More Vaccination Data


Hospitalizations

New Hospital Admissions


The current 7-day average for May 26–June 1 was 2,574. This is a 17.8% decrease from the prior 7-day average (3,132) from May 19–May 25. The current 7-day average is the lowest 7-day average since August 1, 2020.* The 7-day moving average for new admissions has been consistently decreasing since April 19.

2,227,705
Total New Admissions

2,574
Current 7-Day Average

3,132
Prior 7-Day Average

-17.8%
Change in 7-Day Average

*The start of consistent reporting of hospitalization data was August 1, 2020.

Daily Trends in Number of New COVID-19 Hospital Admissions in the United States

resize iconView Larger
New admissions are pulled from a 10 am EST snapshot of the HHS Unified Hospital Timeseries Dataset. Due to potential reporting delays, data from the most recent 7 days, as noted in the figure above with the grey bar, should be interpreted with caution. Small shifts in historic data may also occur due to changes in the CMS Provider of Services file, which is used to identify the cohort of included hospitals.

More Hospital Data


COVID-NET: Rate of COVID-19-Associated Hospitalizations in Adolescents Ages 12–17 Years


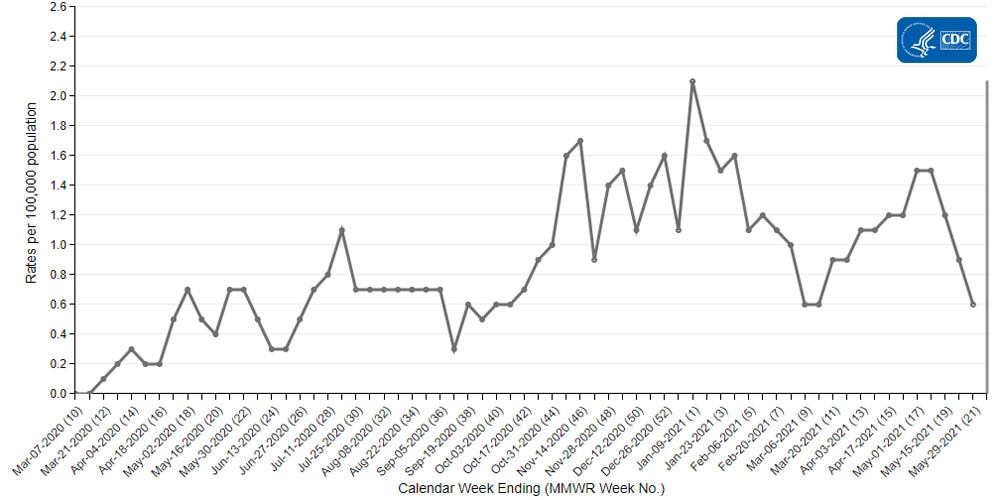
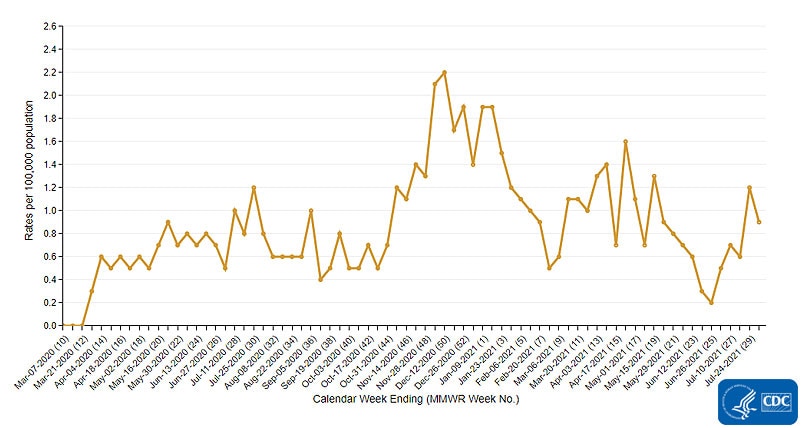
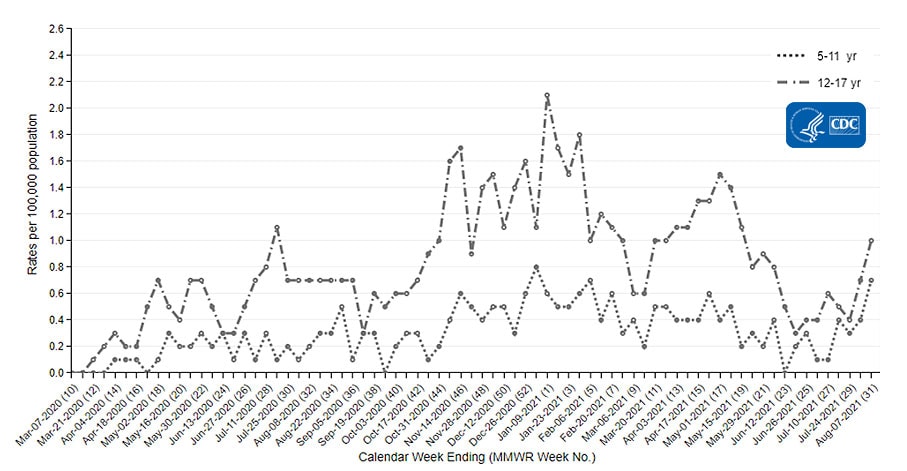
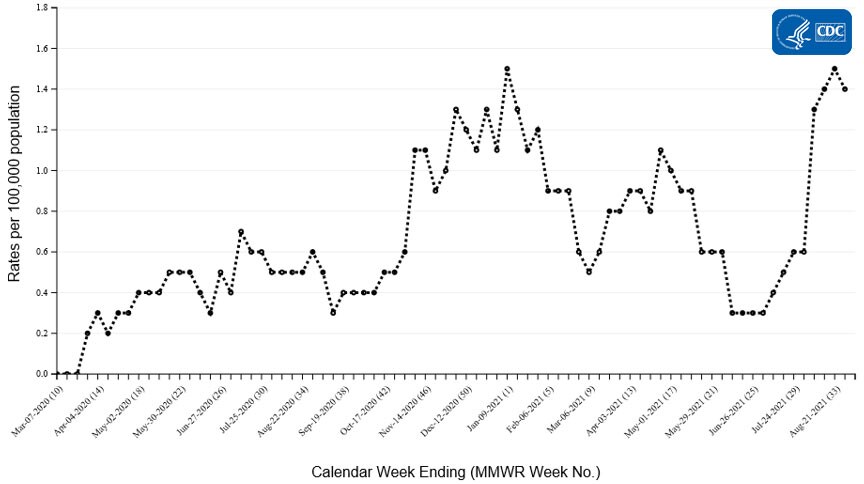
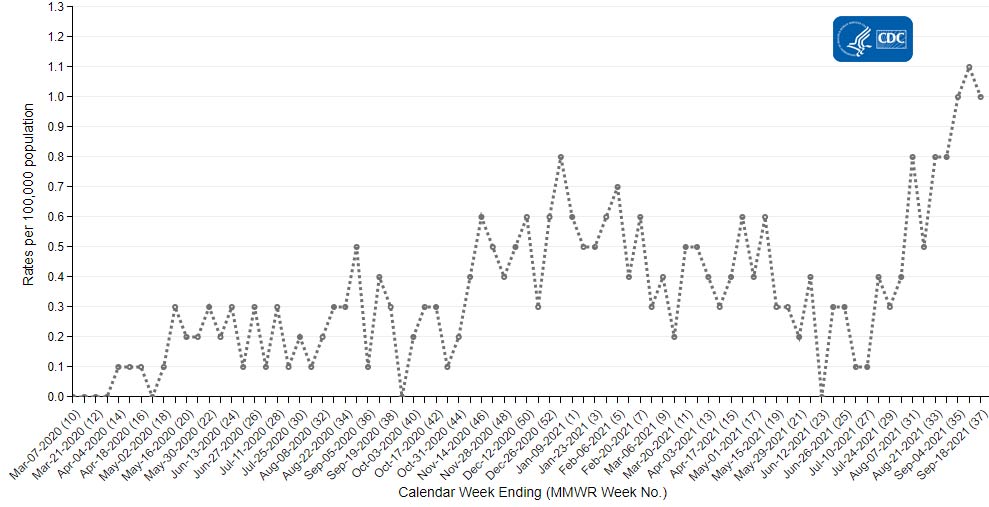
CDC’s Coronavirus Disease 2019-Associated Hospitalization Surveillance Network (COVID-NET) now has data describing COVID-19-associated hospitalizations in adolescents ages 12–17 years. While rates of COVID-19-associated hospitalization in adolescents ages 12–17 years are lower than those in adults, cases of severe disease have been documented in this younger age group. Weekly adolescent hospitalization rates peaked at 2.1 per 100,000 in early January 2021, declined to 0.6 in mid-March, and then rose again through April and early May to a peak of 1.5 per 100,000.

Additional information on COVID-19-associated hospitalizations in adolescents ages 12–17 years can be found in a new report using COVID-NET data here.

Rate of COVID-19-Associated Hospitalizations in Adolescents Ages 12–17 Years


resize iconView Larger
The Coronavirus Disease 2019 (COVID-19)-Associated Hospitalization Surveillance Network (COVID-NET) is an additional source for hospitalization data collected through a network of more than 250 acute-care hospitals in 14 states (representing ~10% of the U.S. population). Detailed data on patient demographics, including race/ethnicity, underlying medical conditions, medical interventions, and clinical outcomes, are collected using a standardized case reporting form.
More COVID-NET Data

Deaths


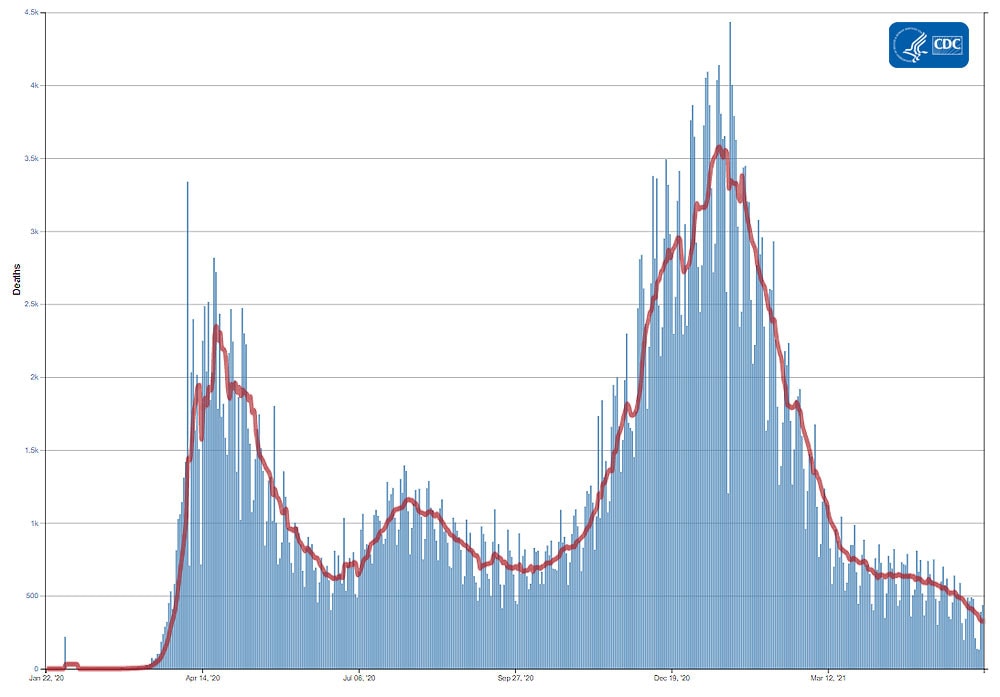
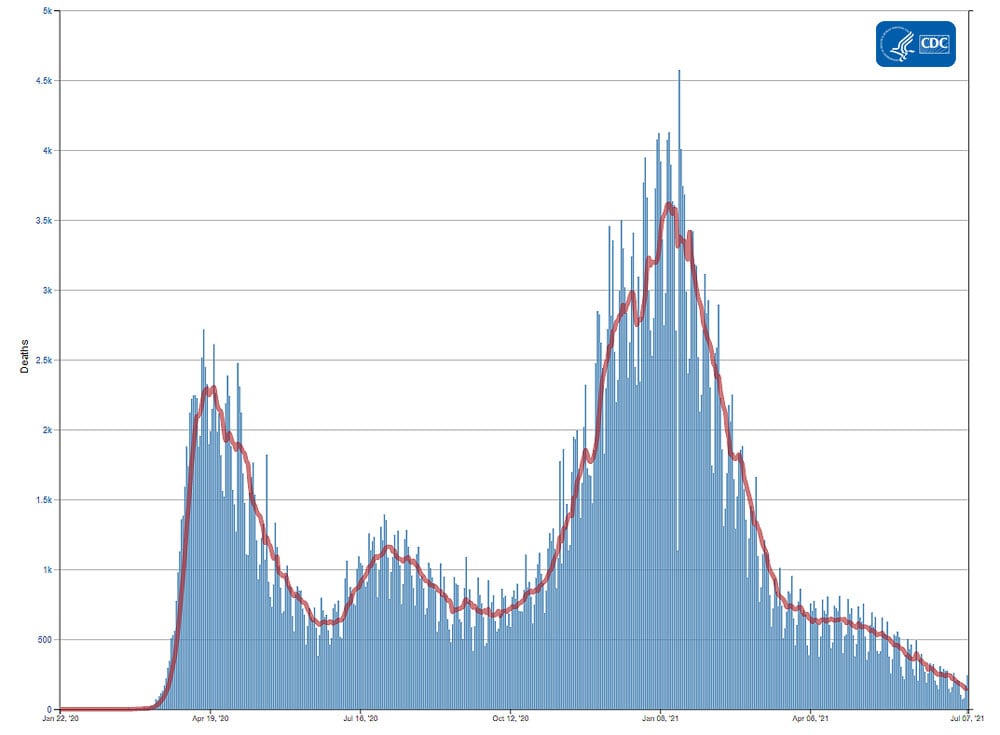
The current 7-day moving average of new deaths (325) has decreased 21.6% compared with the previous 7-day moving average (414). As of June 2, a total of 592,776 COVID-19 deaths have been reported.

592,776
Total Deaths Reported

325
Current 7-Day Average*

414
Prior 7-Day Average

-21.6%
Change in 7-Day Average Since Prior Week

*Historical deaths are excluded from the daily new deaths and 7-day average calculations until they are incorporated into the dataset by their applicable date. Of 11,315 historical deaths reported retroactively, 293 were reported in the current week and 134 were reported in the prior week.

Note: In the above table, historical data with missing report dates are excluded from current and prior 7-day averages, and the percent change in the 7-day average.

Daily Trends in Number of COVID-19 Deaths in the United States Reported to CDC
red-line.jpg

7-Day moving average

resize iconView Larger
More Death Data


Recent CDC COVID-19 Publications
  1. Hospitalization of Adolescents Aged 12–17 Years with Laboratory-Confirmed COVID-19 — COVID-NET, 14 States, March 1, 2020–April 24, 2021
  2. COVID-19 Severity and COVID-19-Associated Deaths Among Hospitalized Patients with HIV Infection — Zambia, March–December 2020
  3. Impact of Policy and Funding Decisions on COVID-19 Surveillance Operations and Case Reports — South Sudan, April 2020–February 2021
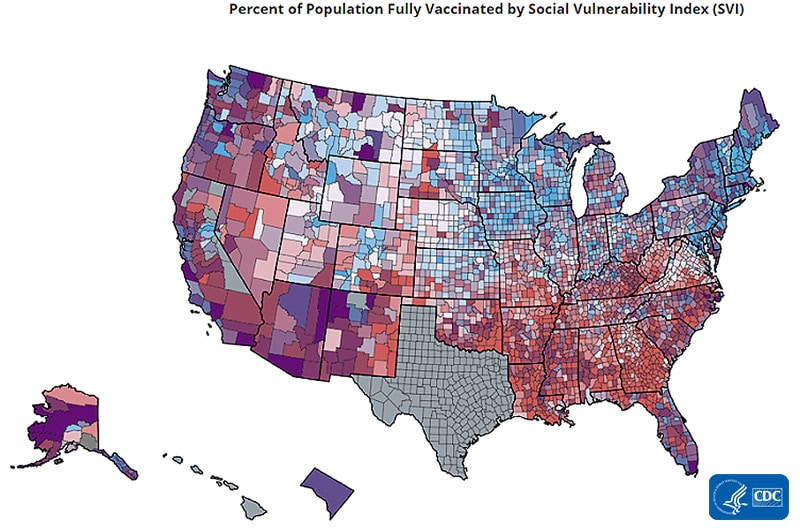
  4. Patterns in COVID-19 Vaccination Coverage, by Social Vulnerability and Urbanicity — United States, December 14, 2020–May 1, 2021
Recent COVID Data Tracker Updates
https://www.cdc.gov/coronavirus/2019-ncov/covid-data/covidview/index.html
 
covid-tracker-header-lrg.jpg
COVID Data Tracker Weekly Review


Print
Subscribe to the Weekly Review


Interpretive Summary for June 11, 2021
Healthier Together


resize iconView Larger


Long-standing systemic health and social inequities have put many people from racial and ethnic minority groups at increased risk from COVID-19. These inequities can also undermine a person’s physical, social, economic, and emotional health. Since the beginning of the pandemic, some racial and ethnic minority groups have experienced higher rates of COVID-19 infection, severe illness, hospitalization, and death.
Conditions in the places where people live, learn, work, play, worship, and age affect a wide range of health risks and outcomes. These and other conditions are known as social determinants of health. Some of the many inequities in the social determinants of health that put racial and ethnic minority groups at increased risk of getting sick and dying from COVID-19 include discrimination, healthcare access, occupation, gaps in education or income, and housing. These factors and others may have also contributed to higher rates of some medical conditions that increase a person’s risk of severe illness from COVID-19. In addition, community strategies to slow the spread of COVID-19 might cause unintentional harm, such as lost wages, reduced access to services, and increased stress for some racial and ethnic minority groups.
We all have a part in helping to prevent the spread of COVID-19 and in promoting fair access to health. To do this, we must work together to ensure that all people have resources to maintain their physical and mental health. Achieving health equity requires valuing everyone equally with focused and ongoing efforts to address avoidable inequities and historical and contemporary injustices, and to eliminate health and healthcare disparities. When policies, programs, and systems that support health are equitable, poor health outcomes can be reduced, health disparities can be prevented, and the whole of society benefits.

Note to Readers: COVID Data Tracker recently released a new Health Equity Data Page that catalogs current health equity-related data on the COVID Data Tracker. To explore additional information about health equity and the activities CDC supports to address health disparities within the COVID-19 response, visit Health Equity: Promoting Fair Access to Health and Health Equity in Action.


Reported Cases


The current 7-day moving average of daily new cases (13,997) decreased 6.0% compared with the previous 7-day moving average (14,890). Compared with the highest peak on January 10, 2021 (251,834), the current 7-day average decreased 94.4%. A total of 33,246,578 COVID-19 cases have been reported as of June 9.

33,246,578
Total Cases Reported

13,997
Current 7-Day Average*

14,890
Prior 7-Day Average

-6.0%
Change in 7-Day Average since Prior Week

*Historical cases are excluded from daily new cases and 7-day average calculations until they are incorporated into the dataset for the applicable date. Of 83,655 historical cases reported retroactively, 12,479 were reported in the current week and 1 was reported in the prior week.

Note: In the above table, historical data with missing report dates are excluded from current and prior 7-day averages, and the percent change in the 7-day average.


Daily Trends in COVID-19 Cases in the United States Reported to CDC
red-line.jpg

7-Day moving average

resize iconView Larger
More Case Data


SARS-CoV-2 Variants


Multiple variants of the virus that causes COVID-19 are circulating globally and within the United States. To date, five variants have been classified as a variant of concern (VOC). Nowcast estimates* of SARS-CoV-2 cases caused by these VOCs for the two weeks ending June 5 are summarized here. Nationally, B.1.1.7 proportions are predicted to remain at 69%; P.1 proportions are predicted to increase from 8% to 11%. B.1.427/B.1.429 proportions are predicted to decrease; and B.1.351 proportions are predicted to decrease. Nowcast estimates predict that B.1.1.7 proportions will remain at more than 60% in all but HHS regions 1 and 2. B.1.351 is predicted to be less than 1% in all regions; P.1 is predicted to be more than 10% in regions 1, 4, 5, 7, 9 and 10; and B.1.427/429 will continue to decline in all regions. B.1.617.2, a variant of interest, is predicted to be more than 4% in all but region 4 and highest in regions 8 and 9.

*Current nowcast estimates are modeled data based on sequencing data from previous weeks. Nowcast provides timely estimates for the present, while accounting for limited sequence data availability, as specimens from the most current time interval are still being processed.

SARS-CoV-2 Variants Circulating in the United States

resize iconView Larger

resize iconView Larger
More Variants Data


Testing


The percentage of COVID-19 NAATs (nucleic acid amplification tests) that are positive (percent positivity) has decreased from the previous week. The 7-day average of percent positivity from tests is now 1.8%. The 7-day average number of tests reported for May 28-Jun 3 was 677,764 down 17.8% from 824,188 for the prior 7 days.

454,141,202
Total Tests Reported

677,764
7-Day Average Tests Reported

1.8 %
7-Day Average % Positivity

2.2%
Previous 7-Day Average % Positivity

-16.5%
Change in 7-Day Average % Positivity since Prior Week

COVID-19 NAAT Laboratory Test 7-day Percent Positivity by State/Territory

resize iconView Larger
More Testing Dataexternal icon


Vaccinations


The U.S. COVID-19 Vaccination Program began December 14, 2020. As of June 10, 305.7 million vaccine doses have been administered. Overall, about 172.4 million people, or 51.9% of the total U.S. population, have received at least one dose of vaccine. About 141.6 million people, or 42.6% of the total U.S. population, have been fully vaccinated.* As of June 10, the 7-day average number of administered vaccine doses reported to CDC per day was 1.1 million, a 13.87% increase from the previous week.

The COVID Data Tracker Vaccination Demographic Trends tab shows vaccination trends by age group. As of June 10, 86.5% of people ages 65 or older have received at least one dose of vaccine and 75.8% are fully vaccinated. For people ages 18 or older, 64% have received at least one dose of vaccine and 53.4% are fully vaccinated. For people ages 12 or older, 61.5% have received at least one dose of vaccine and 50.5% are fully vaccinated.

305,687,618
Vaccines Administered

172,423,605
People who received at least one dose

141,583,252
People who are fully vaccinated*

51.9%
Percentage of the US population that has received at least one dose

42.6%
Percentage of the US population that has been fully vaccinated*

+1.0
Percentage point increase from last week

+1.4
Percentage point increase from last week

*People who are fully vaccinated represents the number of people who have received the second dose in a two-dose COVID-19 vaccine series or one dose of the single-shot J&J/Janssen COVID-19 vaccine.

Daily Change in Number of COVID-19 Vaccinations in the United States Reported to CDC

red-line.jpg

7-Day moving average

resize iconView Larger
More Vaccination Data


Hospitalizations

New Hospital Admissions


The current 7-day average for June 2–June 8 was 2,239. This is a 12.8% decrease from the prior 7-day average (2,567) from May 26–June 1. The 7-day moving average for new admissions has been generally decreasing since April 19.

2,243,371
Total New Admissions

2,239
Current 7-Day Average

2,567
Prior 7-Day Average

-12.8%
Change in 7-Day Average

*The start of consistent reporting of hospitalization data was August 1, 2020.

Daily Trends in Number of New COVID-19 Hospital Admissions in the United States

resize iconView Larger
New admissions are pulled from a 10 am EST snapshot of the HHS Unified Hospital Timeseries Dataset. Due to potential reporting delays, data from the most recent 7 days, as noted in the figure above with the grey bar, should be interpreted with caution. Small shifts in historic data may also occur due to changes in the CMS Provider of Services file, which is used to identify the cohort of included hospitals.

More Hospital Data


COVID-NET: Recent Trends in Hospitalizations in Non-Hispanic American Indian and Alaska Native People


Since the start of the pandemic, people from racial and ethnic minority groups have been at increased risk for COVID-19-associated hospitalizations compared to non-Hispanic White persons. While rates of COVID-19-associated hospitalizations have fallen in all race and ethnicity groups since January 2021, the hospitalization rates for non-Hispanic American Indian/Alaska Native people have risen in recent weeks.* In late March 2021, the rate of COVID-19-associated hospitalizations in non-Hispanic American Indian/Alaska Native people reached 4.6 per 100,000 people, one of the lowest rates seen in this group since the start of the pandemic. Since then, rates have risen to 14.4 per 100,000 people for the week ending May 8, the highest seen in all race and ethnicity groups for that week.

*It is important to note that these increases might be driven by a limited number of COVID-NET sites and might not be nationally representative.

Trends in Hospitalizations by Race/Ethnicity*


resize iconView Larger
*Only White, Black, and American Indian/Alaska Native groups were included in this figure. Additional race/ethnicity groups can be viewed by selecting Weekly Rates by Race/Ethnicity at the More COVID-NET Data link.

The Coronavirus Disease 2019 (COVID-19)-Associated Hospitalization Surveillance Network (COVID-NET) is an additional source for hospitalization data collected through a network of more than 250 acute-care hospitals in 14 states (representing ~10% of the U.S. population). Detailed data on patient demographics, including race/ethnicity, underlying medical conditions, medical interventions, and clinical outcomes, are collected using a standardized case reporting form.
More COVID-NET Data

Deaths


The current 7-day moving average of new deaths (347) has increased 1.9% compared with the previous 7-day moving average (340). As of June 9, a total of 596,059 COVID-19 deaths have been reported.

596,059
Total Deaths Reported

347
Current 7-Day Average*

340
Prior 7-Day Average

+1.9%
Change in 7-Day Average Since Prior Week

*Historical deaths are excluded from the daily new deaths and 7-day average calculations until they are incorporated into the dataset by their applicable date. Of 7,632 historical deaths reported retroactively, 68 were reported in the current week and 294 were reported in the prior week.

Note: In the above table, historical data with missing report dates are excluded from current and prior 7-day averages, and the percent change in the 7-day average.

Daily Trends in Number of COVID-19 Deaths in the United States Reported to CDC
red-line.jpg

7-Day moving average

resize iconView Larger
More Death Data


Recent CDC COVID-19 Publications
  1. Decreases in COVID-19 Cases, Emergency Department Visits, Hospital Admissions, and Deaths Among Older Adults Following the Introduction of COVID-19 Vaccine — United States, September 6, 2020–May 1, 2021
  2. Genomic Surveillance for SARS-CoV-2 Variants Circulating in the United States, December 2020–May 2021 | MMWR
  3. Impact of the COVID-19 Pandemic on Administration of Selected Routine Childhood and Adolescent Vaccinations — 10 U.S. Jurisdictions, March–September 2020
Recent COVID Data Tracker Updates
https://www.cdc.gov/coronavirus/2019-ncov/covid-data/covidview/index.html
 
covid-tracker-header-lrg.jpg
COVID Data Tracker Weekly Review


Print
Subscribe to the Weekly Review


Interpretive Summary for July 2, 2021
Freedom from the Virus


resize iconView Larger
The United States has made tremendous progress in the fight against COVID-19. As of July 1, 54.6% of the U.S. population had received at least one dose of a COVID-19 vaccine. At the same time, work remains to be done to reach freedom from the virus. COVID-19 cases are increasing in some parts of the country, and on June 23, 2021, the United States surpassed 600,000 total deaths from COVID-19. Additionally, vaccination rates among people ages 18-29 remain low, and a recent CDC report showed intent to get vaccinated was lowest among adults ages 18-39. Unvaccinated people are at serious risk of getting the virus and spreading it to others.

The emergence and spread of variants also have the potential to chip away at our nation’s progress to end this pandemic. On June 15, 2021, CDC announced classification of the SARS-CoV-2 variant B.1.617.2 (Delta) as a variant of concern because it spreads more easily. The spread of the more transmissible B.1.617.2 variant combined with the U.S. population that remains unvaccinated leaves many people at risk of infection. With B.1.617.2 now spreading across the country and infecting people worldwide, it’s more important than ever that all eligible people get vaccinated as soon as possible.

The COVID-19 vaccines authorized for use in the United States offer protection against all known variants, including the B.1.617.2 variant. Getting vaccinated will protect you and the people you love. COVID-19 vaccines are free and available for everyone ages 12 and up. They are nearly 100% effective against severe disease and death, meaning nearly every death due to COVID-19 is preventable. No matter your age, or your health history, until you’re fully vaccinated*—you are at risk of infection. By getting vaccinated and encouraging those around you to do the same, you can safely engage in activities you enjoyed prior to the COVID-19 pandemic. Get vaccinated, help others get vaccinated, and use prevention measures if not fully vaccinated so we can all celebrate our freedom from the virus.

* People are considered fully vaccinated 2 weeks after their second dose in a 2-dose series (such as the Pfizer or Moderna vaccines), or 2 weeks after a single-dose vaccine (such as Johnson & Johnson’s Janssen vaccine). If you don’t meet these requirements, regardless of your age, you are not fully vaccinated. Keep taking all precautions until you are fully vaccinated.

Note to readers: To find a vaccine provider near you, visit Vaccines.gov or your state or local public health department website. You can also text your zip code to 438829 to get 3 locations near you with vaccines in stock. If you prefer your information in Spanish, text your zip code to 822862. You can also call the National COVID-19 Vaccination Assistance Hotline at 1-800-232-0233 to get help in English, Spanish, and more than 150 other languages. It also has a TTY line to support access by hearing impaired callers. If you or someone you know is hesitant about COVID-19 vaccination, CDC has information and answers to frequently asked questions to help inform the decision.


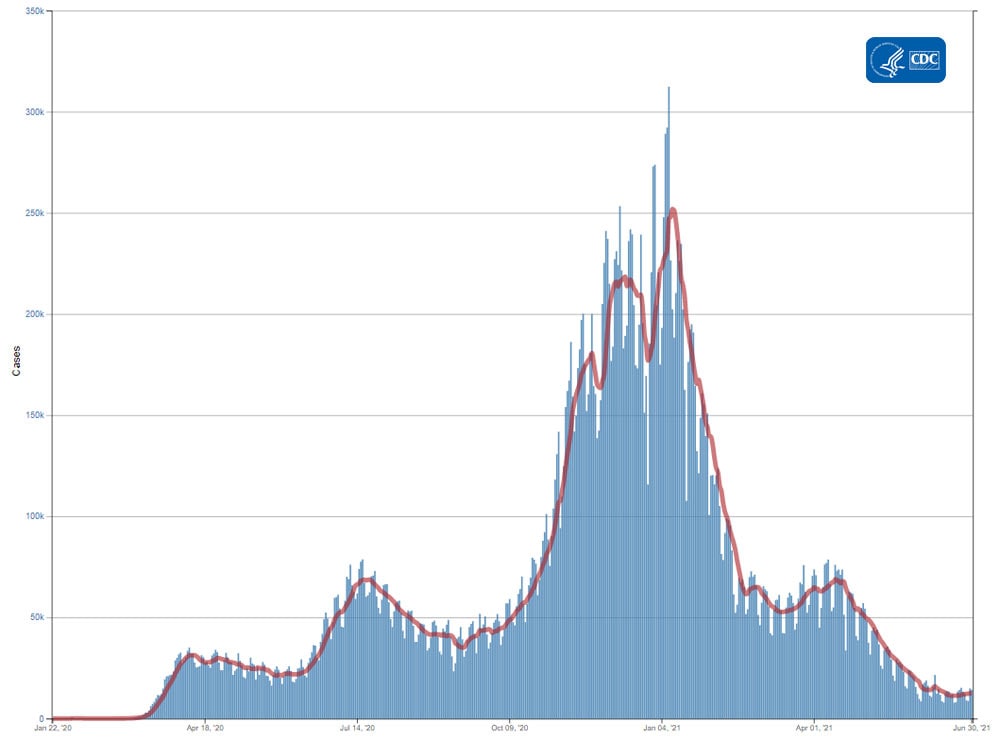
Reported Cases


The current 7-day moving average of daily new cases (12,514) increased 9.1% compared with the previous 7-day moving average (11,472). Compared with the highest peak on January 10, 2021 (252,905), the current 7-day average decreased 95.0%. A total of 33,496,454 COVID-19 cases have been reported as of June 30.

33,496,454
Total Cases Reported

12,514
Current 7-Day Average*

11,472
Prior 7-Day Average

+9.1%
Change in 7-Day Average since Prior Week

*Historical cases are excluded from daily new cases and 7-day average calculations until they are incorporated into the dataset for the applicable date. Of 72,725 historical cases reported retroactively, 810 were reported in the current week and 1,034 were reported in the prior week.

Daily Trends in COVID-19 Cases in the United States Reported to CDC
red-line.jpg

7-Day moving average

resize iconView Larger
More Case Data


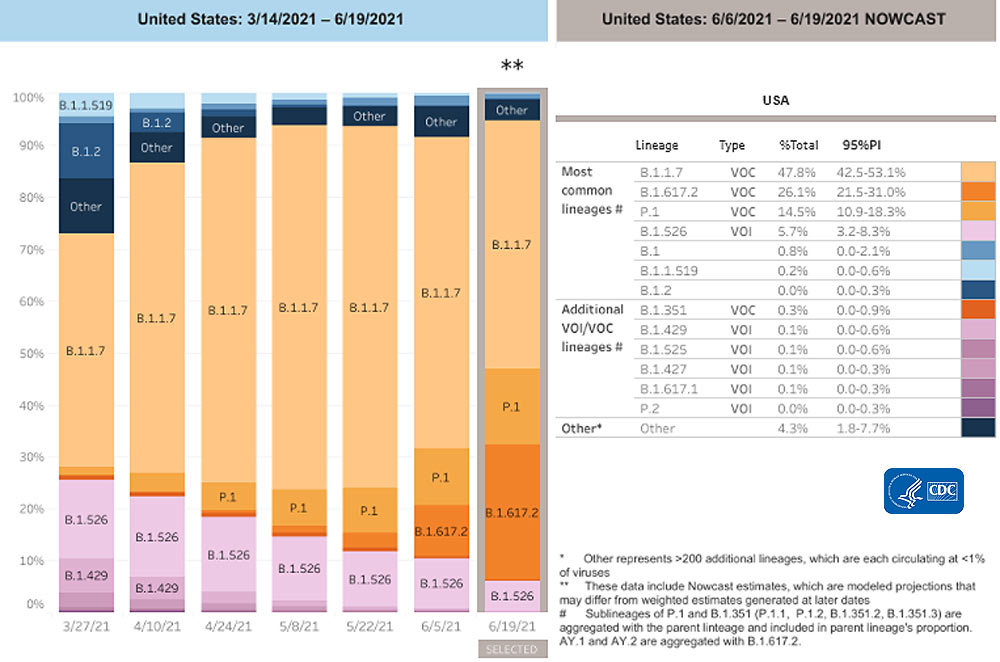
SARS-CoV-2 Variants


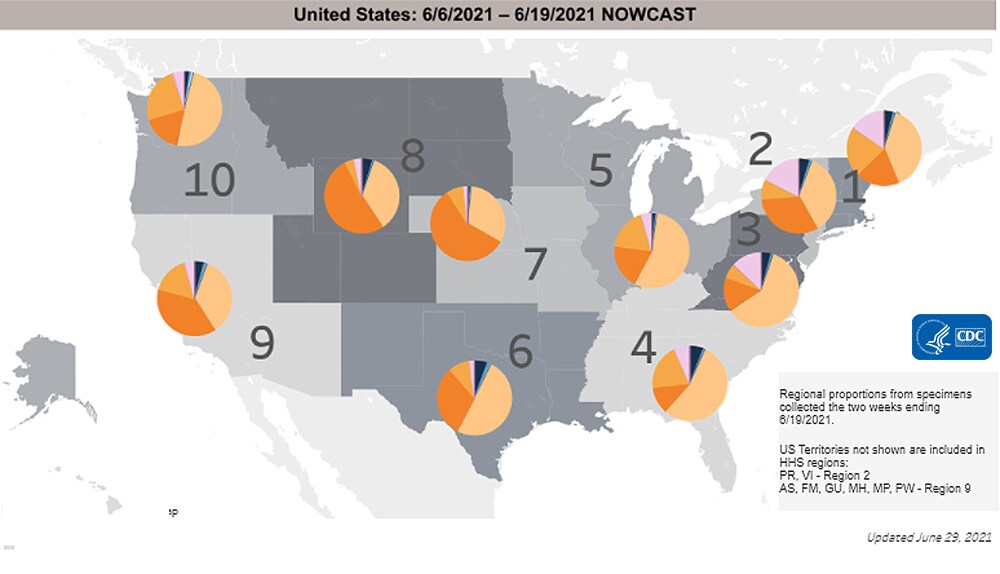
Multiple variants of the virus that causes COVID-19 are circulating globally and within the United States. To date, four variants have been classified as a variant of concern (VOC). Nowcast estimates* of SARS-CoV-2 cases caused by these VOCs for the two weeks ending June 19 are summarized here. Nationally, the proportion of cases attributed to B.1.1.7 (Alpha) is predicted to decrease to 47.8%; B.1.617.2 (Delta) proportion is predicted to increase to 26.1%; P.1 (Gamma) proportion is predicted to increase to 14.5%; and B.1.351 (Beta) is predicted to decrease to 0.3%. Nowcast estimates predict that B.1.1.7 (Alpha) proportions will be less than 50% in HHS regions 1, 2, 7, 8, 9, and 10. B.1.617.2 (Delta) is predicted to increase in all regions and to be more than 50% in regions 7 and 8. P.1 (Gamma) is predicted to be more than 20% in regions 1 and 10; and B.1.351 (Beta) is predicted to be below 1% in all HHS regions.

*The median time from specimen collection to sequence data reporting is about 3 weeks. As a result, weighted estimates for the most recent few weeks may be unstable or unavailable. CDC’s Nowcast is a data projection tool that helps fill this gap by generating timely estimates of variant proportions for variants that are circulating in the United States. View Nowcast estimates on CDC’s COVID Data Tracker website on the Variant Proportions page.

SARS-CoV-2 Variants Circulating in the United States

resize iconView Larger

resize iconView Larger
More Variants Data


Testing


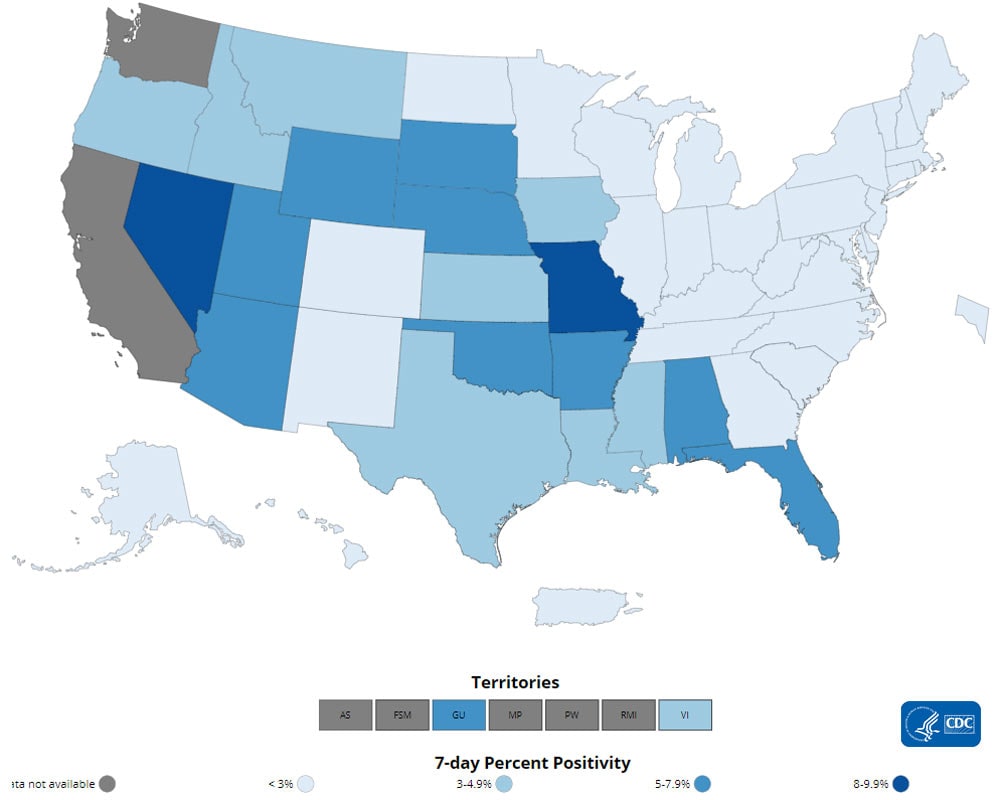
The percentage of COVID-19 NAATs (nucleic acid amplification tests) that are positive (percent positivity) has increased from the previous week. The 7-day average of percent positivity from tests is now 2.0 %. The 7-day average number of tests reported for June 18-June 24 was 598,859, down 8.1% from 651,734 for the prior 7 days.

468,067,207
Total Tests Reported

598,859
7-Day Average Tests Reported

2.0%
7-Day Average % Positivity

1.8%
Previous 7-Day Average % Positivity


+14.5%
Change in 7-Day Average % Positivity since Prior Week

COVID-19 NAAT Laboratory Test 7-day Percent Positivity by State/Territory

resize iconView Larger
More Testing Dataexternal icon


Vaccinations


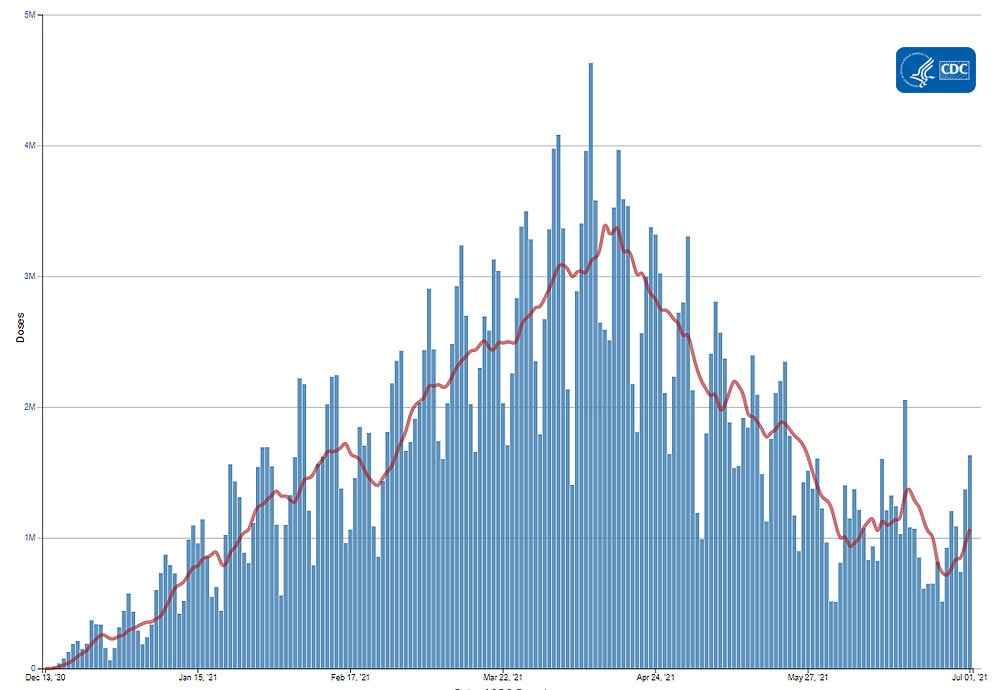
The U.S. COVID-19 Vaccination Program began December 14, 2020. As of July 1, 328.2 million vaccine doses have been administered. Overall, about 181.3 million people, or 54.6% of the total U.S. population, have received at least one dose of vaccine. About 155.9 million people, or 47.0% of the total U.S. population, have been fully vaccinated.* As of July 1, the 7-day average number of administered vaccine doses reported (by date administered) to CDC per day was 334,816, a 45.3% decrease from the previous week.

The COVID Data Tracker Vaccination Demographic Trends tab shows vaccination trends by age group. As of July 1, 88.2% of people ages 65 or older have received at least one dose of vaccine and 78.3% are fully vaccinated. Two-thirds (66.7%) of people ages 18 or older have received at least one dose of vaccine and 57.7% are fully vaccinated. For people ages 12 or older, 63.9% have received at least one dose of vaccine and 54.9% are fully vaccinated.

328,152,304
Vaccines Administered

181,339,416
People who received at least one dose

155,884,601
People who are fully vaccinated*

54.6%
Percentage of the US population that has received at least one dose

47.0%
Percentage of the US population that has been fully vaccinated*

+0.9
Percentage point increase from last week

+1.4
Percentage point increase from last week

*People who are fully vaccinated represents the number of people who have received the second dose in a two-dose COVID-19 vaccine series or one dose of the single-shot J&J/Janssen COVID-19 vaccine.

Daily Change in Number of COVID-19 Vaccinations in the United States Reported to CDC

red-line.jpg

7-Day moving average

resize iconView Larger
More Vaccination Data


Hospitalizations

New Hospital Admissions


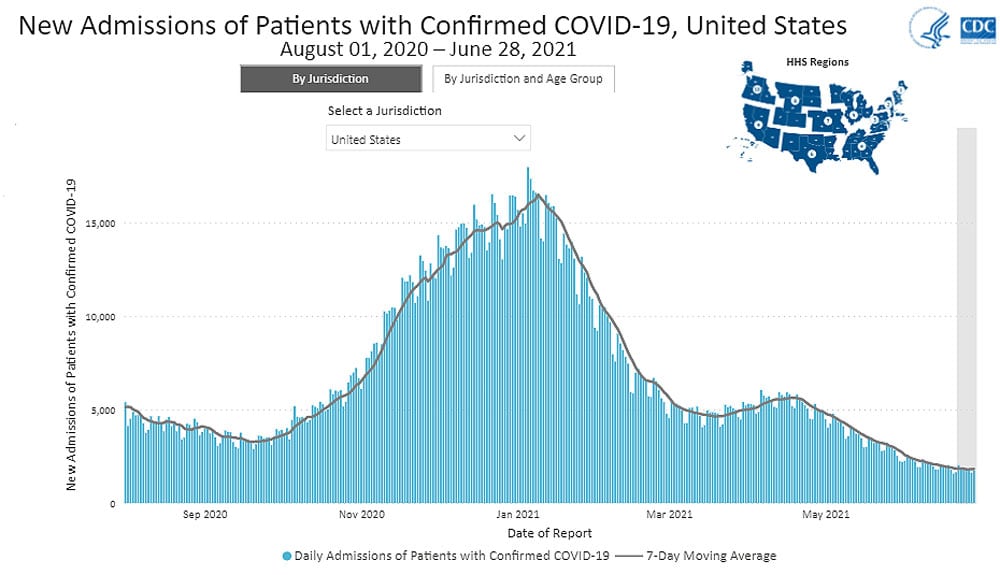
The current 7-day average for June 23–June 29 was 1,871. This is a 1.1% increase from the prior 7-day average (1,851) from June 16–June 22. The 7-day moving average for new admissions had been generally decreasing from April 19-June 22 but appears to have since plateaued.

2,283,486
Total New Admissions

1,871
Current 7-Day Average

1,851
Prior 7-Day Average

+1.1%
Change in 7-Day Average

The start of consistent reporting of hospital admissions data was August 1, 2020.

Daily Trends in Number of New COVID-19 Hospital Admissions in the United States

resize iconView Larger
New admissions are pulled from a 10 am EST snapshot of the HHS Unified Hospital Timeseries Dataset. Due to potential reporting delays, data from the most recent 7 days, as noted in the figure above with the grey bar, should be interpreted with caution. Small shifts in historic data may also occur due to changes in the CMS Provider of Services file, which is used to identify the cohort of included hospitals.

More Hospital Data


COVID-NET: Trends in Hospitalizations in Adults


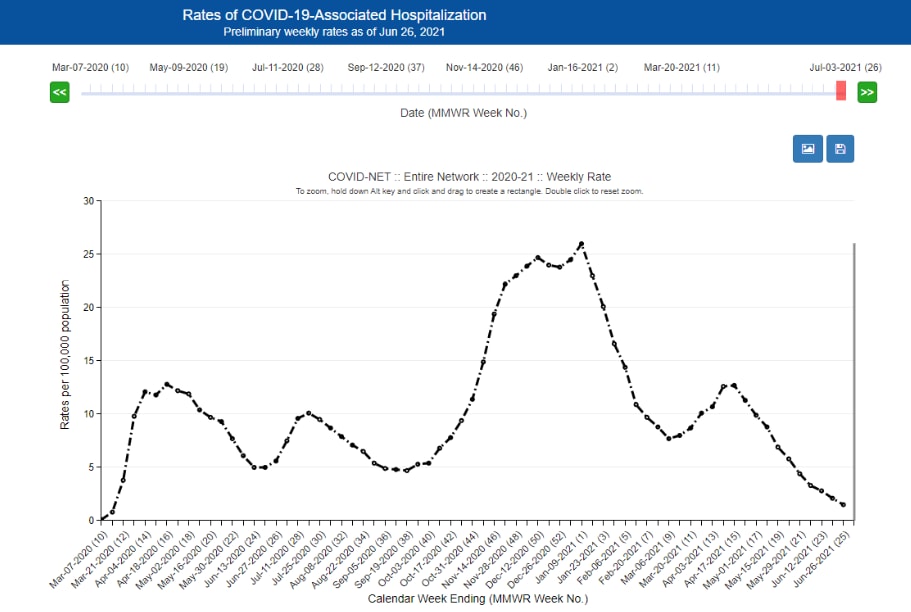
CDC’s Coronavirus Disease 2019-Associated Hospitalization Surveillance Network (COVID-NET) shows that across the entire COVID-19 pandemic, rates of COVID-19-associated hospitalizations in adults ages 18 years and older have been decreasing as the number of vaccinated adults has increased. Rates of COVID-19-associated hospitalizations for adults peaked at 26 per 100,000 people in early January 2021. Since then, rates in this group have fallen considerably. For the week ending June 12, 2021, the rate of COVID-19-associated hospitalization was 2.8 per 100,000 people. For this age group, this is the lowest rate of COVID-19-associated hospitalizations since March 2020.

Rate of COVID-19-Associated Hospitalizations in Adults Ages 18 Years and Older


resize iconView Larger
The Coronavirus Disease 2019 (COVID-19)-Associate­­d Hospitalization Surveillance Network (COVID-NET) is an additional source for hospitalization data collected through a network of more than 250 acute-care hospitals in 14 states (representing ~10% of the U.S. population). Detailed data on patient demographics, including race/ethnicity, underlying medical conditions, medical interventions, and clinical outcomes, are standardized case reporting form.
More COVID-NET Data

Deaths


The current 7-day moving average of new deaths (206) has decreased 11.5% compared with the previous 7-day moving average (233). As of June 30, a total of 602,401 COVID-19 deaths have been reported.

602,401
Total Deaths Reported

206
Current 7-Day Average*

233
Prior 7-Day Average

-11.5%
Change in 7-Day Average Since Prior Week

*Historical deaths are excluded from the daily new deaths and 7-day average calculations until they are incorporated into the dataset by their applicable date. Of 6,181 historical deaths reported retroactively, 13 were reported in the current week and 24 were reported in the prior week.

Daily Trends in Number of COVID-19 Deaths in the United States Reported to CDC
red-line.jpg

7-Day moving average

resize iconView Larger
More Death Data


Recent CDC COVID-19 Publications
  1. Symptoms of Depression, Anxiety, Post-Traumatic Stress Disorder, and Suicidal Ideation Among State, Tribal, Local, and Territorial Public Health Workers During the COVID-19 Pandemic — United States, March–April 2021
  2. COVID-19 Surveillance and Investigations in Workplaces — Seattle and King County, Washington, June 15–November 15, 2020
  3. COVID-19 Vaccination Coverage Among Adults — United States, December 14, 2020–May 22, 2021
  4. COVID-19 Vaccination Coverage and Intent Among Adults Aged 18–39 Years — United States, March–May 2021
  5. Disparities in Learning Mode Access Among K–12 Students During the COVID-19 Pandemic, by Race/Ethnicity, Geography, and Grade Level — United States, September 2020–April 2021
Recent COVID Data Tracker Updates
  • Addition of “Total Vaccines Administered” (US level only) to the Daily and Total Trends tab to allow for visualization alongside case, death, testing volume, percent positivity, daily vaccination trends and ED visits
Science & Research
https://www.cdc.gov/coronavirus/2019-ncov/covid-data/covidview/index.html
 
covid-tracker-header-lrg.jpg
COVID Data Tracker Weekly Review


Print
Subscribe to the Weekly Review


Interpretive Summary for July 9, 2021
A Needle Today Helps Keep COVID Away


resize iconView Larger
The highly transmissible B.1.617.2 (Delta) variant continues to spread across the United States at a rapid pace. Early data suggest that B.1.617.2 now makes up more than 50% of COVID-19 cases. In some parts of the country, this percentage is even higher, especially in areas with low vaccination rates. This rapid rise is concerning and threatens the progress the United States has made toward ending the pandemic.

We have seen the success of the U.S. vaccination program over the last 8 months. As of July 8, 2021, 183.2 million people have received at least one dose of a COVID-19 vaccine, and 158.3 million are fully vaccinated.* However, we are also seeing new and emerging trends that are concerning. Cases and hospitalizations are on the rise in areas with low vaccination coverage. Data from recent weeks show that adults ages 18–49 now account for more than 40% of COVID-19-associated hospitalizations.

Fortunately, we have safe and effective vaccines that prevent severe disease, hospitalization, and death. People who are fully vaccinated are protected from B.1.617.2. If you are not yet vaccinated, you are at risk of infection and should continue to practice prevention strategies and get vaccinated as soon as possible. Turning the corner on the pandemic, getting back to normal, and stopping the spread of B.1.617.2 requires all of us doing our part.

* People are considered fully vaccinated 2 weeks after their second dose in a 2-dose series (such as the Pfizer or Moderna vaccines), or 2 weeks after a single-dose vaccine (such as Johnson & Johnson’s Janssen vaccine). If you don’t meet these requirements, regardless of your age, you are not fully vaccinated. Keep taking all precautions until you are fully vaccinated.

Note to readers: To find a vaccine provider near you, visit Vaccines.gov or your state or local public health department website. You can also text your zip code to 438829 to get 3 locations near you with vaccines in stock. If you prefer your information in Spanish, text your zip code to 822862. You can also call the National COVID-19 Vaccination Assistance Hotline at 1-800-232-0233 to get help in English, Spanish, and more than 150 other languages. It also has a TTY line to support access by hearing impaired callers. If you or someone you know is hesitant about COVID-19 vaccination, CDC has information and answers to frequently asked questions to help inform the decision.


Reported Cases


The current 7-day moving average of daily new cases (14,885) increased 16.0% compared with the previous 7-day moving average (12,832). Compared with the highest peak on January 10, 2021 (251,897), the current 7-day average decreased 94.1%. A total of 33,604,986 COVID-19 cases have been reported as of July 7.

33,604,986
Total Cases Reported

14,885
Current 7-Day Average*

12,832
Prior 7-Day Average

+16.0%
Change in 7-Day Average since Prior Week

*Historical cases are excluded from daily new cases and 7-day average calculations until they are incorporated into the dataset for the applicable date. Of 72,292 historical cases reported retroactively, 697 were reported in the current week and 360 were reported in the prior week.

Daily Trends in COVID-19 Cases in the United States Reported to CDC
red-line.jpg

7-Day moving average

resize iconView Larger
More Case Data


SARS-CoV-2 Variants


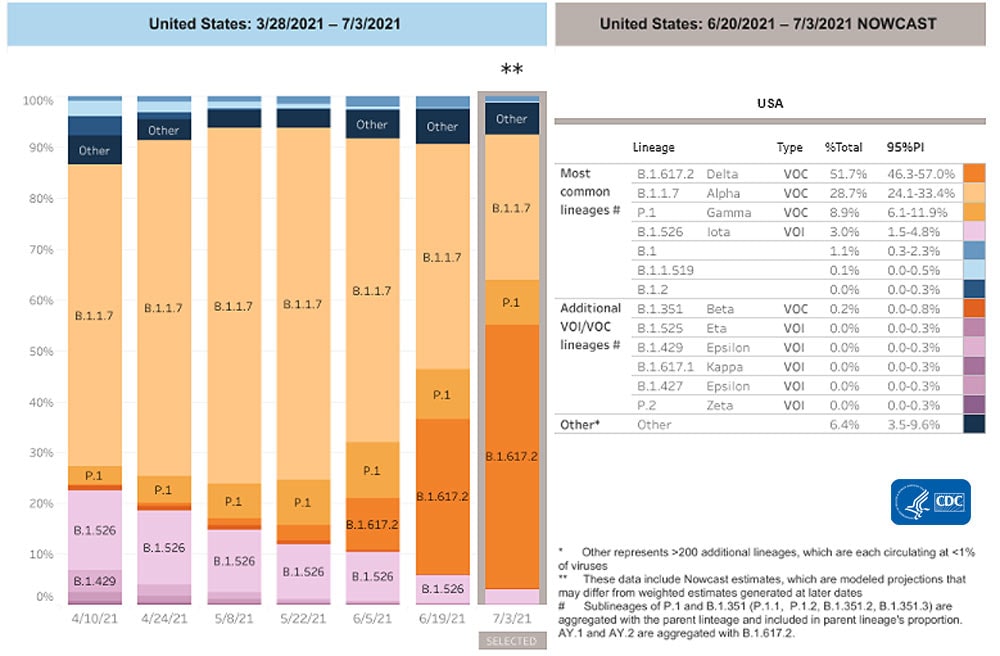
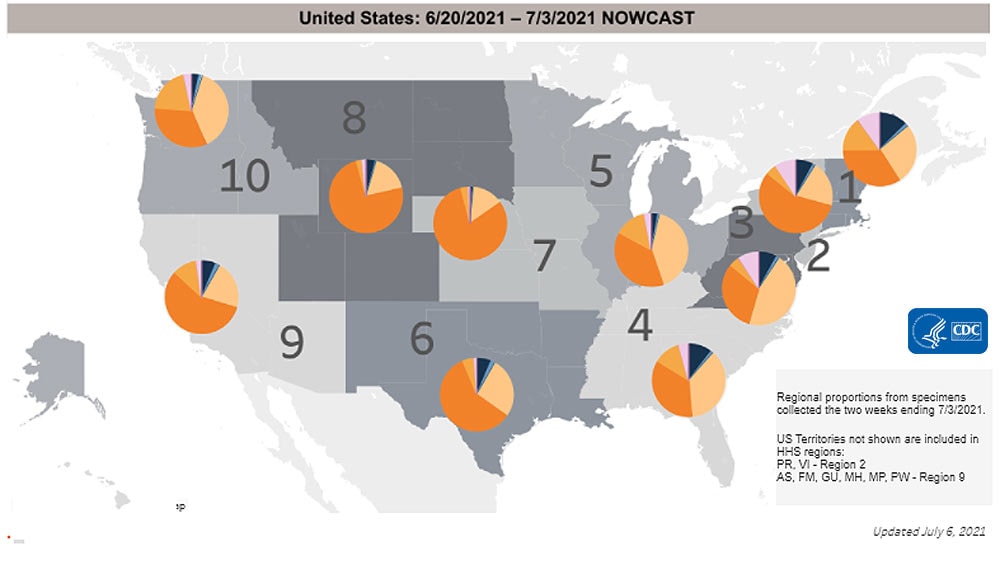
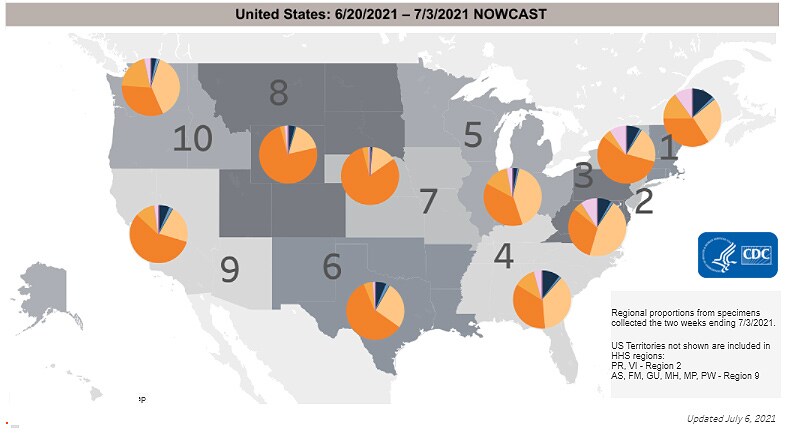
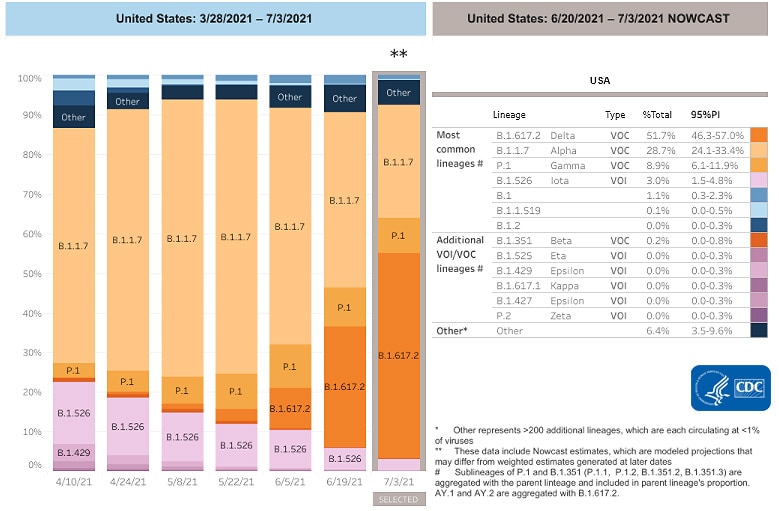
Multiple variants of the virus that causes COVID-19 are circulating globally and within the United States. To date, four variants have been classified as a variant of concern (VOC). Nowcast estimates* of SARS-CoV-2 cases caused by these VOCs for the two weeks ending July 3 are summarized here. Nationally, the proportion of cases attributed to B.1.617.2 (Delta) is predicted to increase to 51.7%, becoming the predominant lineage in the United States; B.1.1.7 (Alpha) proportion is predicted to decrease to 28.7%; P.1 (Gamma) proportion is predicted to decrease to 8.9%; and B.1.351 (Beta) is predicted to decrease slightly to 0.2%. Nowcast estimates predict that B.1.617.2 (Delta) will increase in all HHS regions and be more than 70% in regions 7 and 8. B.1.1.7 (Alpha) is predicted to be less than 50% in all HHS regions. P.1 (Gamma) is predicted to be more than 10% in regions 1, 4, 5, 9, and 10; and B.1.351 (Beta) is predicted to be less than or equal to 0.5% in all HHS regions.

*The median time from specimen collection to sequence data reporting is about 3 weeks. As a result, weighted estimates for the most recent few weeks may be unstable or unavailable. CDC’s Nowcast is a data projection tool that helps fill this gap by generating timely estimates of variant proportions for variants that are circulating in the United States. View Nowcast estimates on CDC’s COVID Data Tracker website on the Variant Proportions page.

SARS-CoV-2 Variants Circulating in the United States

resize iconView Larger

resize iconView Larger
More Variants Data


Testing


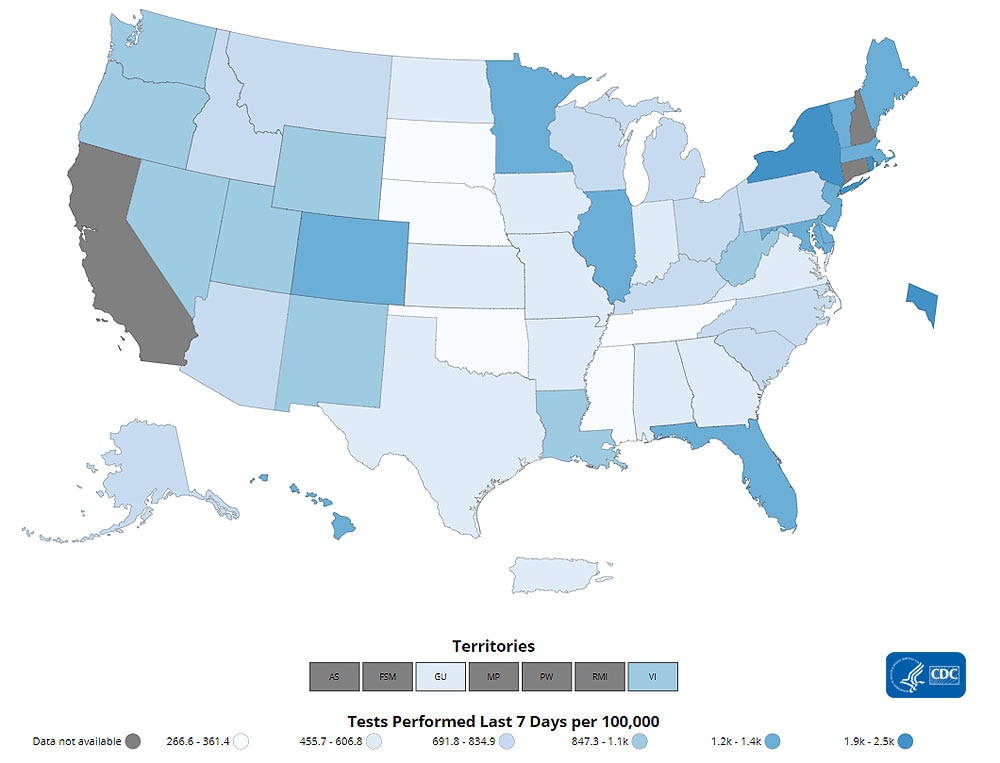
The percentage of COVID-19 NAATs (nucleic acid amplification tests) that are positive (percent positivity) has increased from the previous week. The 7-day average of percent positivity from tests is now 2.7%. The 7-day average number of tests reported for June 25 – July 01 was 558,867, down 7.9% from 606,864 for the prior 7 days.

472,035,159
Total Tests Reported

558,867
7-Day Average Tests Reported

2.7%
7-Day Average % Positivity

2.0%
Previous 7-Day Average % Positivity


+31.9%
Change in 7-Day Average % Positivity since Prior Week

COVID-19 NAAT Laboratory Test 7-day Percent Positivity by State/Territory

resize iconView Larger
More Testing Dataexternal icon


Vaccinations


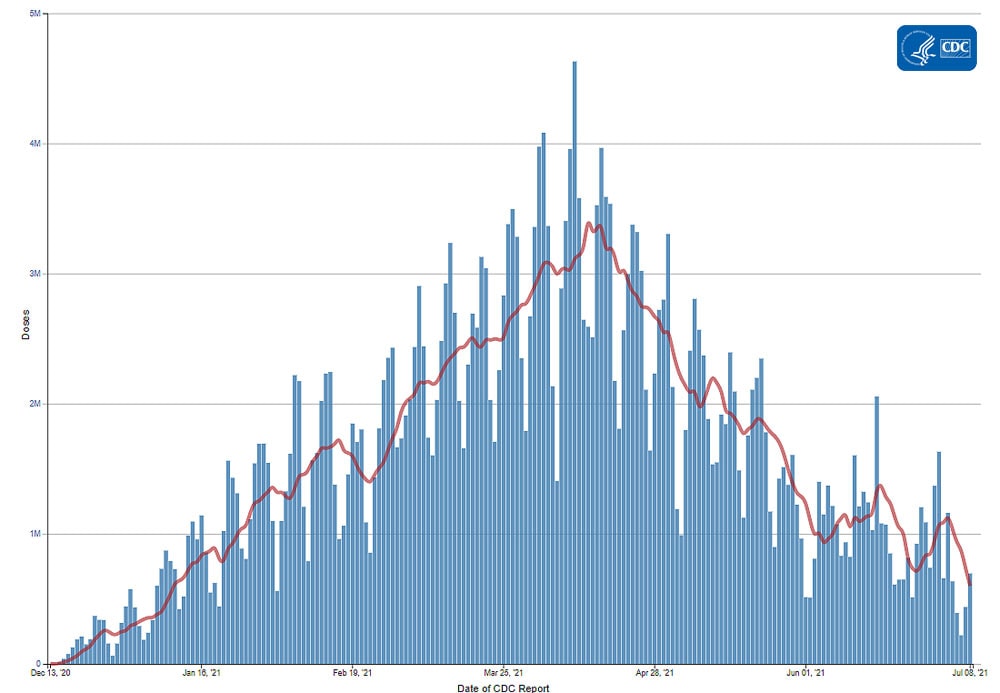
The U.S. COVID-19 Vaccination Program began December 14, 2020. As of July 8, 332.3 million vaccine doses have been administered. Overall, about 183.2 million people, or 55.2% of the total U.S. population, have received at least one dose of vaccine. About 158.3 million people, or 47.7% of the total U.S. population, have been fully vaccinated.* As of July 8, the 7-day average number of administered vaccine doses reported (by date administered) to CDC per day was 239,497, a 54.5% decrease from the previous week.

The COVID Data Tracker Vaccination Demographic Trends tab shows vaccination trends by age group. As of July 8, 88.5% of people ages 65 or older have received at least one dose of vaccine and 78.8% are fully vaccinated. Just over two-thirds (67.3%) of people ages 18 or older have received at least one dose of vaccine and 58.5% are fully vaccinated. For people ages 12 or older, 64.5% have received at least one dose of vaccine and 55.8% are fully vaccinated.

332,345,797
Vaccines Administered

183,237,046
People who received at least one dose

158,287,566
People who are fully vaccinated*

55.2%
Percentage of the US population that has received at least one dose

47.7%
Percentage of the US population that has been fully vaccinated*

+0.6
Percentage point increase from last week

+0.7
Percentage point increase from last week

*People are considered fully vaccinated 2 weeks after their second dose in a 2-dose series (such as the Pfizer or Moderna vaccines), or 2 weeks after a single-dose vaccine (such as Johnson & Johnson’s Janssen vaccine).


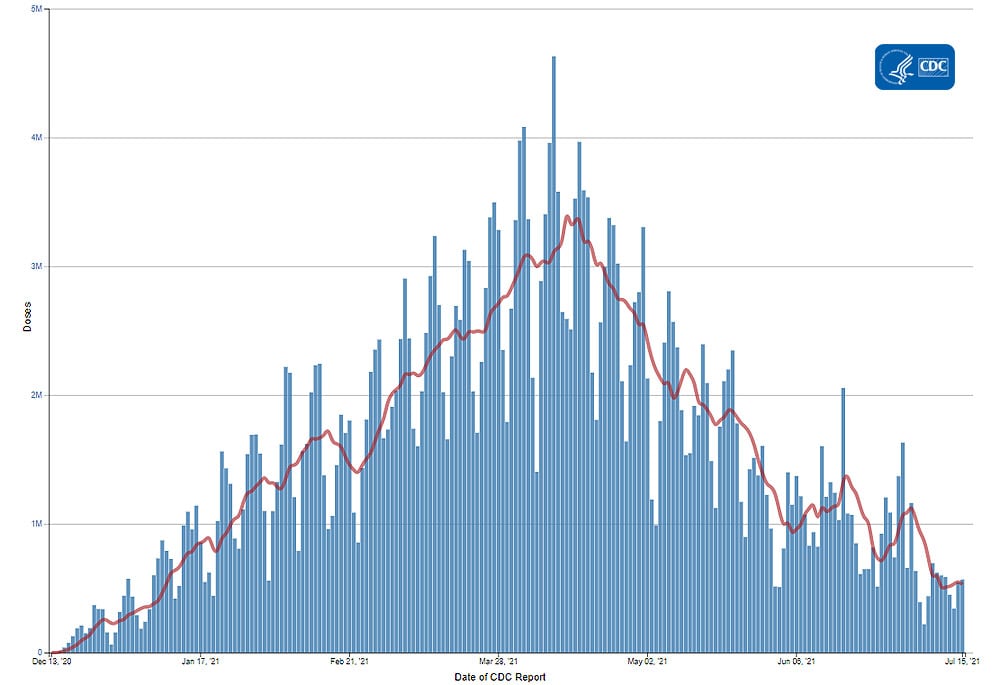
Daily Change in Number of COVID-19 Vaccinations in the United States Reported to CDC

red-line.jpg

7-Day moving average

resize iconView Larger
More Vaccination Data


Hospitalizations

New Hospital Admissions


The current 7-day average for June 29–July 5 was 2,037. This is an 8.6% increase from the prior 7-day average (1,875) from June 23–June 29. The 7-day moving average for new admissions has been consistently increasing since June 28, 2021.

2,297,764
Total New Admissions

2,037
Current 7-Day Average

1,875
Prior 7-Day Average

+8.6%
Change in 7-Day Average

The start of consistent reporting of hospital admissions data was August 1, 2020.

Daily Trends in Number of New COVID-19 Hospital Admissions in the United States

resize iconView Larger
New admissions are pulled from a 10 am EST snapshot of the HHS Unified Hospital Timeseries Dataset. Due to potential reporting delays, data from the most recent 7 days, as noted in the figure above with the grey bar, should be interpreted with caution. Small shifts in historic data may also occur due to changes in the CMS Provider of Services file, which is used to identify the cohort of included hospitals.

More Hospital Data


COVID-NET: Trends in Hospitalizations in Adults 18–49 Years


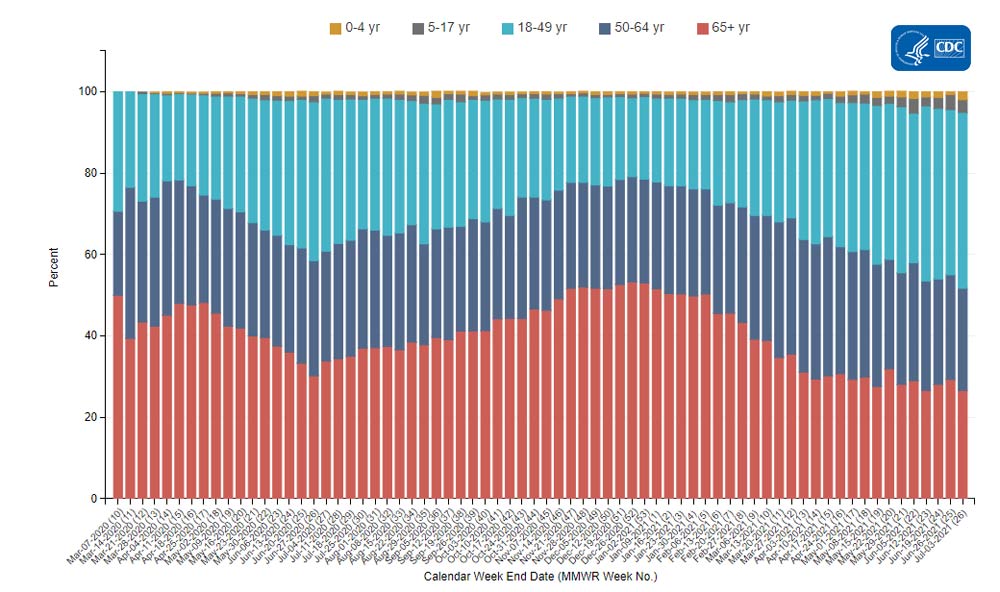
CDC’s Coronavirus Disease 2019-Associated Hospitalization Surveillance Network (COVID-NET) shows that since the start of the COVID-19 pandemic, people ages 65 years and older were the age group with the largest percentage of COVID-19-associated hospitalizations, sometimes accounting for more than half of hospitalizations. Data from May and June show that as more adults ages 65 and older became vaccinated, they accounted for fewer than 1 in 3 hospitalizations. However, data from recent weeks show that even though the number of COVID-19-associated hospitalizations continues to decline in all age groups, the proportion of hospitalized adults ages 18–49 years continues to climb and now accounts for more than 40% of COVID-19-associated hospitalizations. Since April, these younger adults now account for more hospitalizations than people 65 years and older, likely reflecting lower vaccination rates in this age group compared with older adults.

Proportion of COVID-19-Associated Hospitalizations by Age Group


resize iconView Larger
The Coronavirus Disease 2019 (COVID-19)-Associate­­d Hospitalization Surveillance Network (COVID-NET) is an additional source for hospitalization data collected through a network of more than 250 acute-care hospitals in 14 states (representing ~10% of the U.S. population). Detailed data on patient demographics, including race/ethnicity, underlying medical conditions, medical interventions, and clinical outcomes, are standardized case reporting form.
More COVID-NET Data

Deaths


The current 7-day moving average of new deaths (154) has decreased 25.2% compared with the previous 7-day moving average (205). As of July 7, a total of 603,958 COVID-19 deaths have been reported.

603,958
Total Deaths Reported

154
Current 7-Day Average*

205
Prior 7-Day Average

-25.2%
Change in 7-Day Average Since Prior Week

*Historical deaths are excluded from the daily new deaths and 7-day average calculations until they are incorporated into the dataset by their applicable date. Of 6,134 historical deaths reported retroactively, 30 were reported in the current week and 10 were reported in the prior week.

Daily Trends in Number of COVID-19 Deaths in the United States Reported to CDC
red-line.jpg

7-Day moving average

resize iconView Larger
More Death Data


Recent CDC COVID-19 Publications
  1. Use of mRNA COVID-19 Vaccine After Reports of Myocarditis Among Vaccine Recipients: Update from the Advisory Committee on Immunization Practices — United States, June 2021
  2. Efficacy of Portable Air Cleaners and Masking for Reducing Indoor Exposure to Simulated Exhaled SARS-CoV-2 Aerosols — United States, 2021
  3. Outcomes Among Patients Referred to Outpatient Rehabilitation Clinics after COVID-19 diagnosis — United States, January 2020–March 2021
Recent COVID Data Tracker Updates
  • A new Vaccination Equity tab displays a combined county-level view of vaccine coverage and Social Vulnerability Index (SVI) rating to visualize how each county’s vaccine coverage and estimated vulnerability level intersect
  • Static bivariate maps that illustrate cases by vaccination coverage were added to the COVID Data Tracker Communications Toolkit
homeScience & Research
https://www.cdc.gov/coronavirus/2019-ncov/covid-data/covidview/index.html
 
covid-tracker-header-lrg.jpg
COVID Data Tracker Weekly Review


Print
Subscribe to the Weekly Review


Interpretive Summary for July 16, 2021
Location, location, location


resize iconView Larger
The conditions in which people live, learn, work, and play can affect a wide range of health risks and outcomes. Differences in the prevalence of many risks and outcomes differ by metropolitan and non-metropolitan* areas. Long-standing systemic health and social inequities have put some rural residents at increased risk of getting or having severe illness from COVID-19. The COVID-19 cumulative death rate in non-metropolitan areas has exceeded that of metropolitan areas since December 2020.

Approximately 1 in 5 people in the United States live in rural communities. Rural areas can face different health challenges depending on where they are located. Many are considered highly vulnerable according to CDC’s Social Vulnerability Index (SVI), which includes factors such as housing, transportation, socioeconomic status, race, and ethnicity. Additionally, rural communities often have a higher proportion of residents who lack health insurance, live with a chronic disease or disability, are older than 65 years, and have limited access to health care facilities with intensive care capabilities. These factors place residents of rural communities at increased risk for COVID-19-associated illness and death.

Because of this increased risk, vaccination disparities between urban and rural areas could further undermine efforts to reduce morbidity and mortality from COVID-19 nationally. A recent CDC report found that COVID-19 vaccination coverage was lower in rural counties compared to urban counties. Efforts are underway to raise awareness about COVID-19 vaccines, and to make vaccines more accessible to residents of rural communities. We must work together to ensure that all people, regardless of geographic location, have resources to maintain and manage their physical and mental health, including easy access to accurate information and affordable medical care so all communities can thrive.

* Metropolitan vs. Non-Metropolitan classification type groups 6 National Center for Health Statistics (NCHS) Urban-Rural classifications, where “Metro” counties include Large Central Metro, Large Fringe Metro, Medium Metro, and Small Metro and “Non-Metro” counties include Micropolitan and Non-Core (Rural). Urban/rural classification type is based on the 2013 National Center for Health Statistics Urban-Rural Classification Scheme for Counties.

Note to readers: To find a vaccine provider near you, visit Vaccines.gov or your state or local public health department website. You can also text your zip code to 438829 to get 3 locations near you with vaccines in stock. If you prefer your information in Spanish, text your zip code to 822862. You can also call the National COVID-19 Vaccination Assistance Hotline at 1-800-232-0233 to get help in English, Spanish, and more than 150 other languages. It also has a TTY line to support access by hearing impaired callers. If you or someone you know is hesitant about COVID-19 vaccination, CDC has information and answers to frequently asked questions to help inform the decision.


Reported Cases


The current 7-day moving average of daily new cases (26,306) increased 69.3% compared with the previous 7-day moving average (15,541). The current 7-day moving average is 89.6% lower than the peak observed on January 10, 2021 (251,880) and is 129.3% higher than the lowest value observed on June 20, 2021 (11,472). A total of 33,797,400 COVID-19 cases have been reported as of July 14.

33,797,400
Total Cases Reported

26,306
Current 7-Day Average*

15,541
Prior 7-Day Average

+69.3%
Change in 7-Day Average since Prior Week

*Historical cases are excluded from daily new cases and 7-day average calculations until they are incorporated into the dataset for the applicable date. Of 73,766 historical cases reported retroactively, 1,474 were reported in the current week and 697 were reported in the prior week.

Daily Trends in COVID-19 Cases in the United States Reported to CDC
red-line.jpg

7-Day moving average

resize iconView Larger
More Case Data


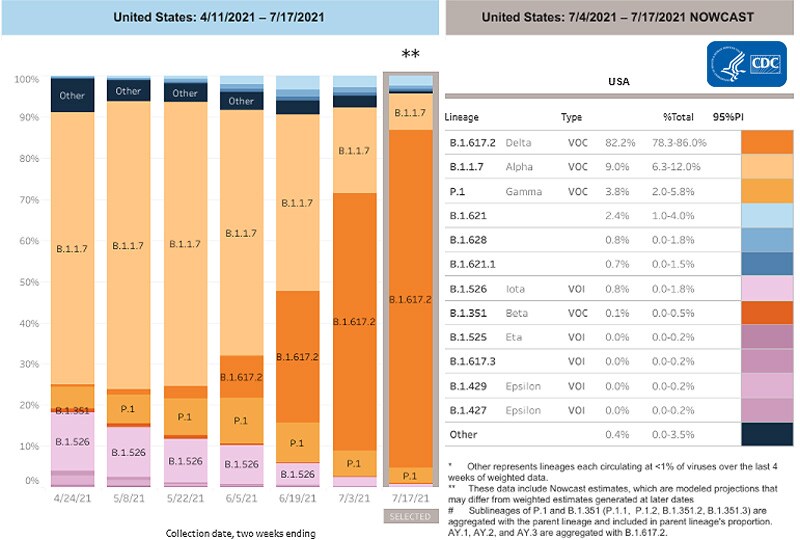
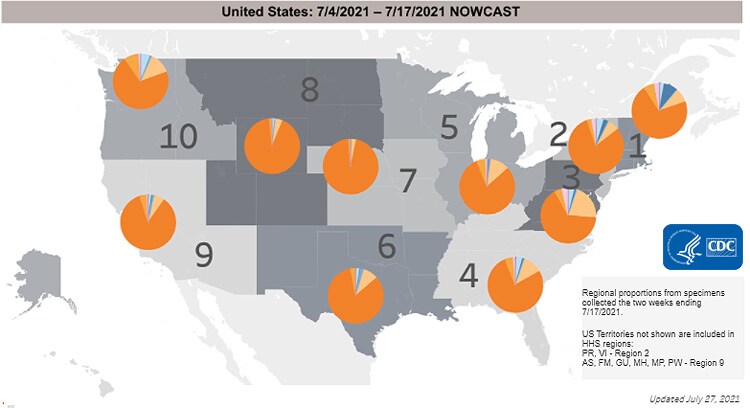
SARS-CoV-2 Variants


Multiple variants of the virus that causes COVID-19 are circulating globally, including within the United States. To date, four variants have been classified as a variant of concern (VOC). Nowcast estimates* of SARS-CoV-2 cases caused by these VOCs for the two weeks ending July 3 are summarized here. Nationally, the proportion of cases attributed to B.1.617.2 (Delta) is predicted to increase to 57.6%, becoming the predominant lineage in the United States; B.1.1.7 (Alpha) proportion is predicted to decrease to 24.9%; P.1 (Gamma) proportion is predicted to decrease to 7.7%; and B.1.351 (Beta) is predicted to decrease slightly to 0.1%. Nowcast estimates predict that B.1.617.2 (Delta) will be the predominant lineage circulating in all HHS regions and be more than 75% in regions 7 and 8. B.1.1.7 (Alpha) is predicted to be less than 40% in all HHS regions. P.1 (Gamma) is predicted to be more than 10% in regions 1, 5, and 10; and B.1.351 (Beta) is predicted to be less than or equal to 0.5% in all HHS regions.

*The median time from specimen collection to sequence data reporting is about 3 weeks. As a result, weighted estimates for the most recent few weeks may be unstable or unavailable. CDC’s Nowcast is a data projection tool that helps fill this gap by generating timely estimates of variant proportions for variants that are circulating in the United States. View Nowcast estimates on CDC’s COVID Data Tracker website on the Variant Proportions page.

SARS-CoV-2 Variants Circulating in the United States

resize iconView Larger

resize iconView Larger
More Variants Data


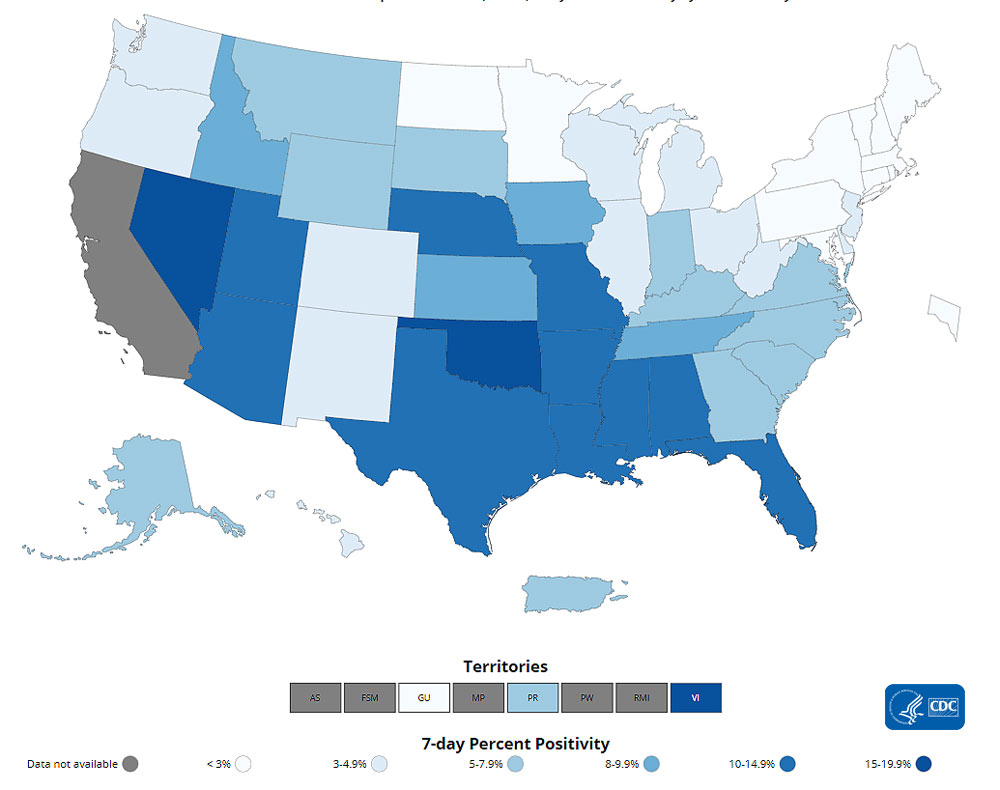
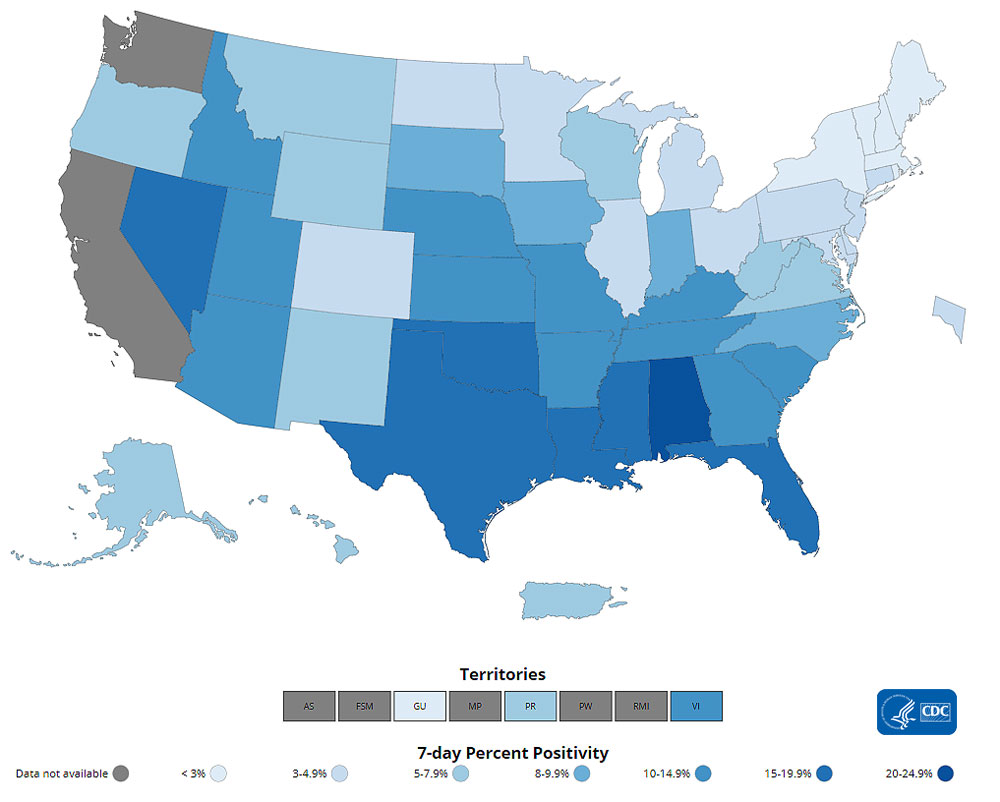
Testing


The percentage of COVID-19 NAATs (nucleic acid amplification tests) that are positive (percent positivity) has increased from the previous week. The 7-day average of percent positivity from tests is now 4.0%. The 7-day average number of tests reported for July 02 – July 08 was 507,379 down 11.0% from 569,778 for the prior 7 days.

476,020,464
Total Tests Reported

507,379
7-Day Average Tests Reported

4.0%
7-Day Average % Positivity

2.8%
Previous 7-Day Average % Positivity


+40.7%
Change in 7-Day Average % Positivity since Prior Week

COVID-19 NAAT Laboratory Test 7-day Percent Positivity by State/Territory

resize iconView Larger
More Testing Dataexternal icon


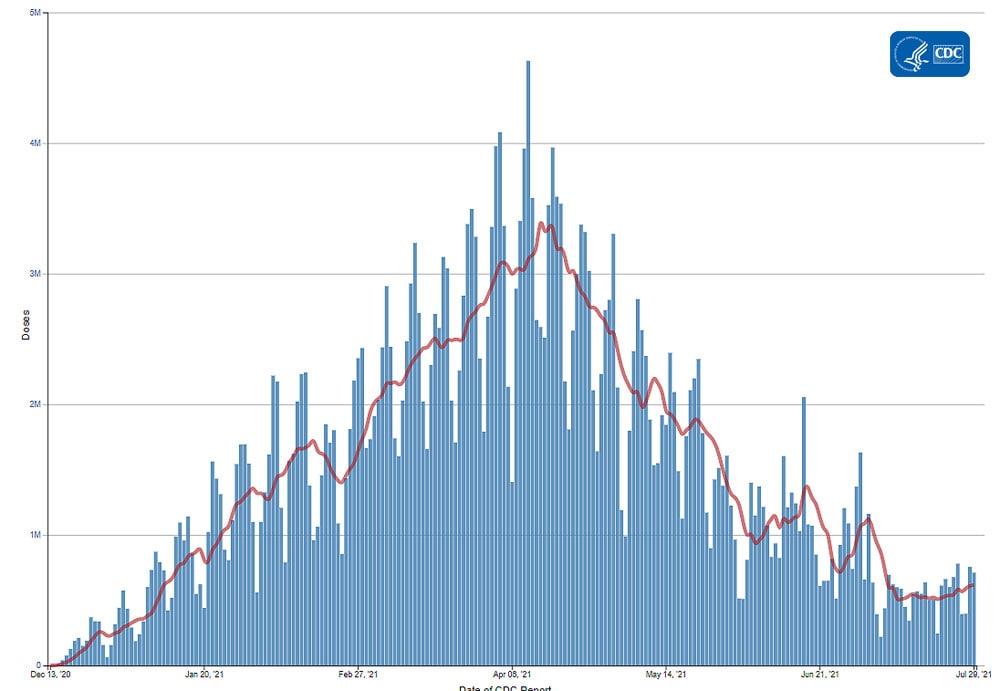
Vaccinations


The U.S. COVID-19 Vaccination Program began December 14, 2020. As of July 15, 336.1 million vaccine doses have been administered. Overall, about 185.1 million people, or 55.8% of the total U.S. population, have received at least one dose of vaccine. About 160.4 million people, or 48.3% of the total U.S. population, have been fully vaccinated.* As of July 15, the 7-day average number of administered vaccine doses reported (by date administered) to CDC per day was 270,592, a 35.7% decrease from the previous week.

The COVID Data Tracker Vaccination Demographic Trends tab shows vaccination trends by age group. As of July 15, 88.9% of people ages 65 or older have received at least one dose of vaccine and 79.3% are fully vaccinated. Just over two-thirds (67.9%) of people ages 18 or older have received at least one dose of vaccine and 59.2% are fully vaccinated. For people ages 12 or older, 65.2% have received at least one dose of vaccine and 56.5% are fully vaccinated.

336,054,953
Vaccines Administered

185,135,757
People who received at least one dose

160,408,538
People who are fully vaccinated*

55.8%
Percentage of the US population that has received at least one dose

48.3%
Percentage of the US population that has been fully vaccinated*

+0.6
Percentage point increase from last week

+0.6
Percentage point increase from last week

*People are considered fully vaccinated 2 weeks after their second dose in a 2-dose series (such as the Pfizer or Moderna vaccines), or 2 weeks after a single-dose vaccine (such as Johnson & Johnson’s Janssen vaccine).


Daily Change in Number of COVID-19 Vaccinations in the United States Reported to CDC

red-line.jpg

7-Day moving average

resize iconView Larger
More Vaccination Data


Hospitalizations

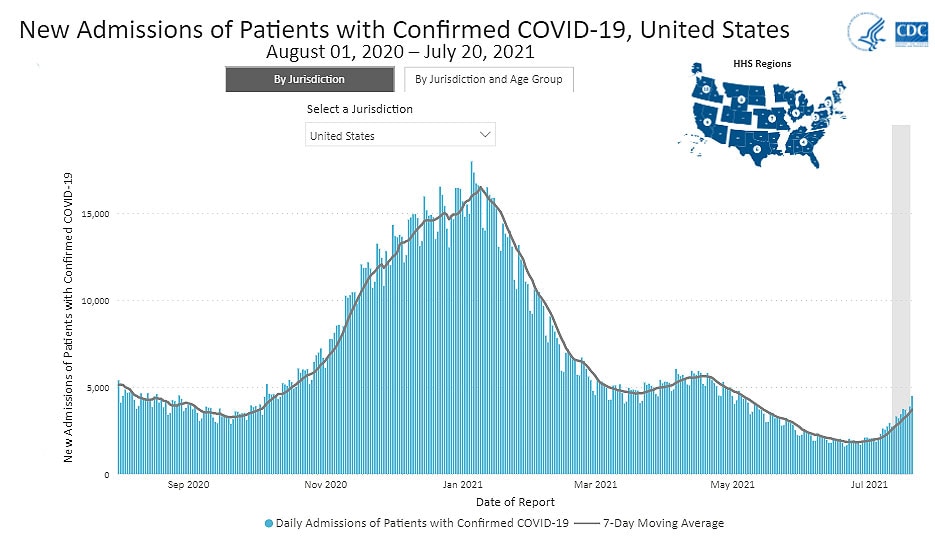
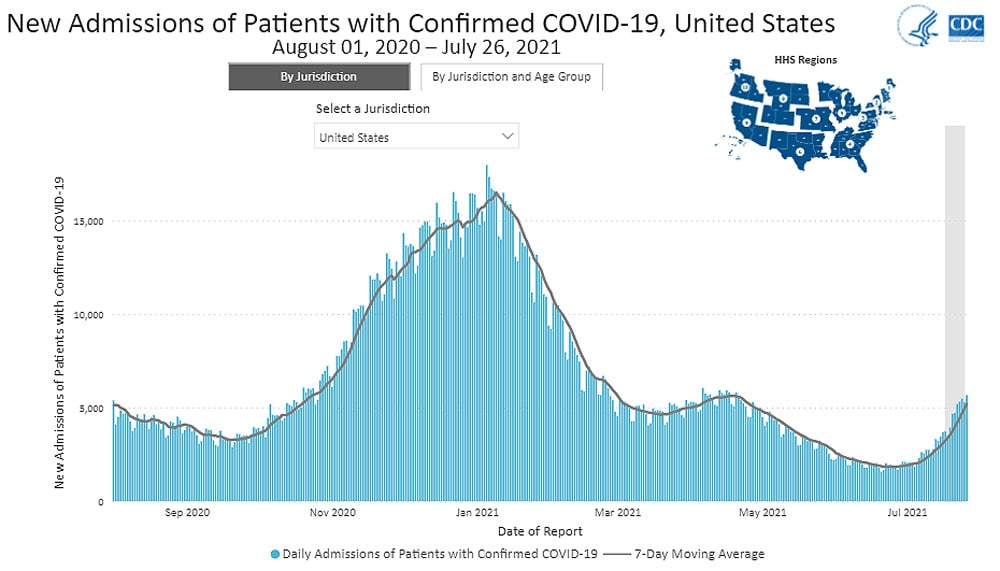
New Hospital Admissions


The current 7-day average for July 7–July 13 was 2,794. This is a 35.8% increase from the prior 7-day average (2,058) from June 30–July 6. The 7-day moving average for new admissions has consistently increased since June 25, 2021.

2,317,457
Total New Admissions

2,794
Current 7-Day Average

2,058
Prior 7-Day Average

+35.8%
Change in 7-Day Average

The start of consistent reporting of hospital admissions data was August 1, 2020.

Daily Trends in Number of New COVID-19 Hospital Admissions in the United States

resize iconView Larger
New admissions are pulled from a 10 am EST snapshot of the HHS Unified Hospital Timeseries Dataset. Due to potential reporting delays, data from the most recent 7 days, as noted in the figure above with the grey bar, should be interpreted with caution. Small shifts in historic data may also occur due to changes in the CMS Provider of Services file, which is used to identify the cohort of included hospitals.

More Hospital Data


Cumulative Trends in Hospitalizations in People in Racial and Ethnic Minority Groups


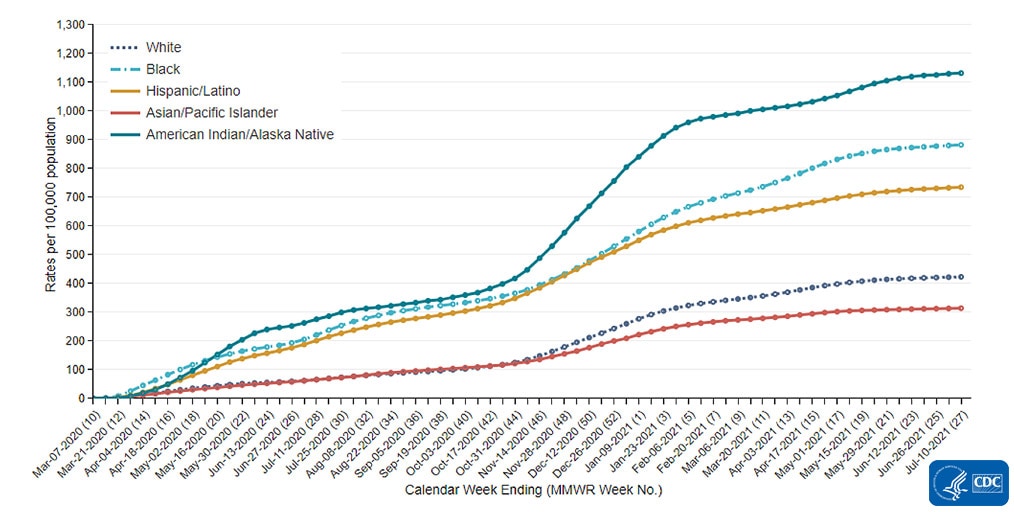
CDC’s Coronavirus Disease 2019-Associated Hospitalization Surveillance Network (COVID-NET) shows that since the start of the COVID-19 pandemic, people from racial and ethnic minority groups have been at increased risk for COVID-19-associated hospitalizations compared to non-Hispanic White people. The cumulative hospitalization rates* for many groups demonstrate how much some communities were disproportionately impacted by the pandemic. For the week ending July 3, 2021, the cumulative rate of hospitalizations was 1129.8 per 100,000 population for American Indian/Alaska Native people, 880.4 per 100,000 population for non-Hispanic Black people, and 733.0 per 100,000 population for Hispanic people. In comparison, the cumulative rate of COVID-19-associated hospitalizations in non-Hispanic White people is 422.1 per 100,000 population.

*While these rates are not adjusted for differences in age, additional data on age-adjusted rates by race/ethnicity for COVID-19-associated hospitalizations can be found here.

Trends in Hospitalizations in People in Racial and Ethnic Minority Groups


resize iconView Larger
The Coronavirus Disease 2019 (COVID-19)-Associate­­d Hospitalization Surveillance Network (COVID-NET) is an additional source for hospitalization data collected through a network of more than 250 acute-care hospitals in 14 states (representing ~10% of the U.S. population). Detailed data on patient demographics, including race/ethnicity, underlying medical conditions, medical interventions, and clinical outcomes, are standardized case reporting form.
More COVID-NET Data

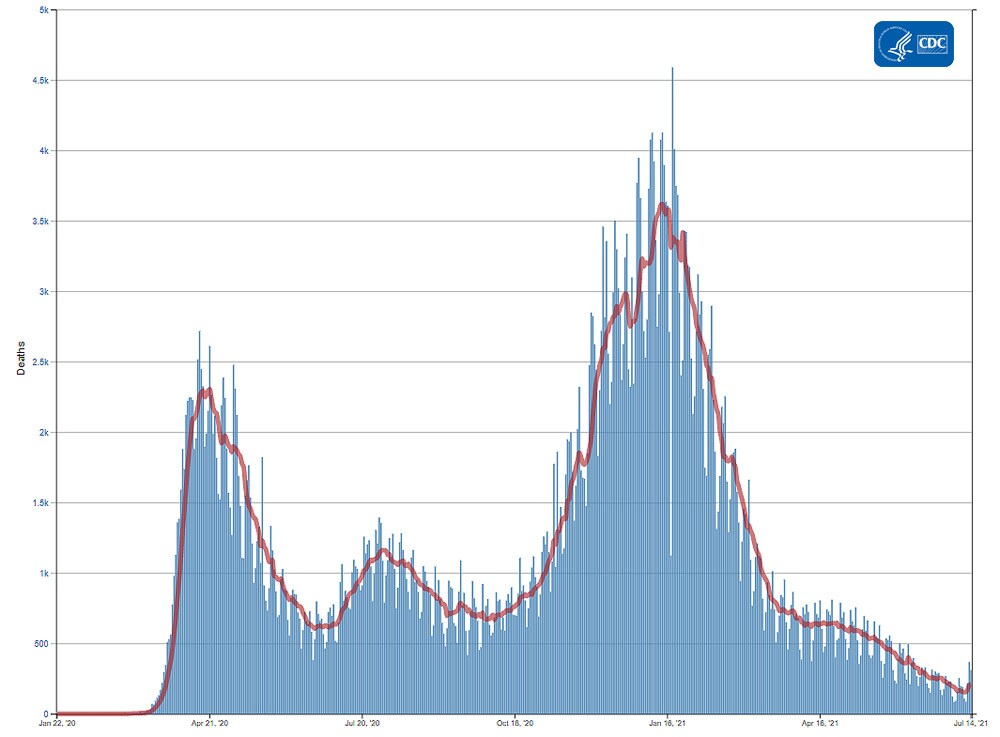
Deaths


The current 7-day moving average of new deaths (211) has increased 26.3% compared with the previous 7-day moving average (167). As of July 14, a total of 605,905 COVID-19 deaths have been reported.

605,905
Total Deaths Reported

211
Current 7-Day Average*

167
Prior 7-Day Average

+26.3%
Change in 7-Day Average Since Prior Week

*Historical deaths are excluded from the daily new deaths and 7-day average calculations until they are incorporated into the dataset by their applicable date. Of 6,110 historical deaths reported retroactively, 9 were reported in the current week and 1 was reported in the prior week.

Daily Trends in Number of COVID-19 Deaths in the United States Reported to CDC
red-line.jpg

7-Day moving average

resize iconView Larger
More Death Data


Recent CDC COVID-19 Publications
  1. Acceptability of Adolescent COVID-19 Vaccination Among Adolescents and Parents of Adolescents — United States, April 15–23, 2021
  2. SARS-CoV-2 B.1.617.2 (Delta) Variant COVID-19 Outbreak Associated with a Gymnastics Facility — Oklahoma, April–May 2021
Recent COVID Data Tracker Updates
  • A new Vaccination Equity tab displays a combined county-level view of vaccine coverage and Social Vulnerability Index (SVI) rating to visualize how each county’s vaccine coverage and estimated vulnerability level intersect
  • Static bivariate maps that illustrate cases by vaccination coverage were added to the COVID Data Tracker Communications Toolkit
homeScience & Research
https://www.cdc.gov/coronavirus/2019-ncov/covid-data/covidview/index.html
 
covid-tracker-header-lrg.jpg
COVID Data Tracker Weekly Review


Print
Subscribe to the Weekly Review


Interpretive Summary for July 23, 2021
Our Shot to End the Pandemic


resize iconView Larger
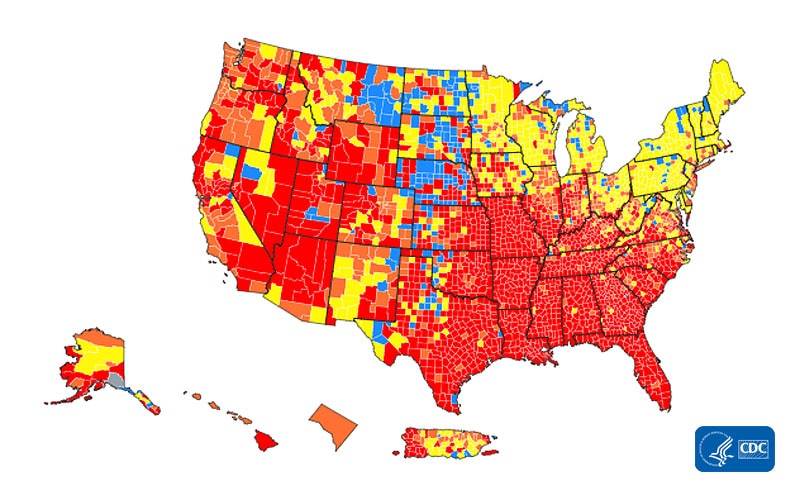
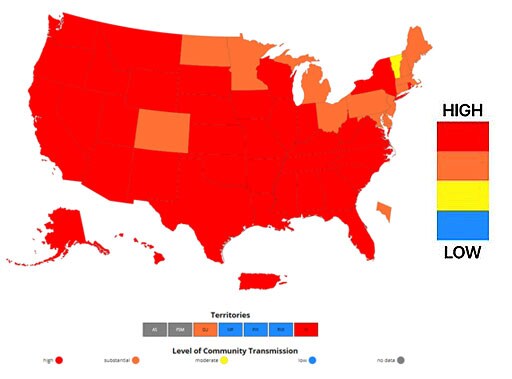
The United States is once again seeing a rise in COVID-19 cases, hospitalizations, and deaths. As of July 22, 35% of U.S. counties are experiencing high levels of community transmission. COVID-19 cases are on the rise in nearly 90% of U.S. jurisdictions, and we are seeing outbreaks in parts of the country that have low vaccination coverage. These worrisome trends are due, in part, to the rapid spread of the highly transmissible B.1.617.2 (Delta) variant. An increase in the number of cases will put more strain on healthcare resources and could lead to more hospitalizations and deaths.

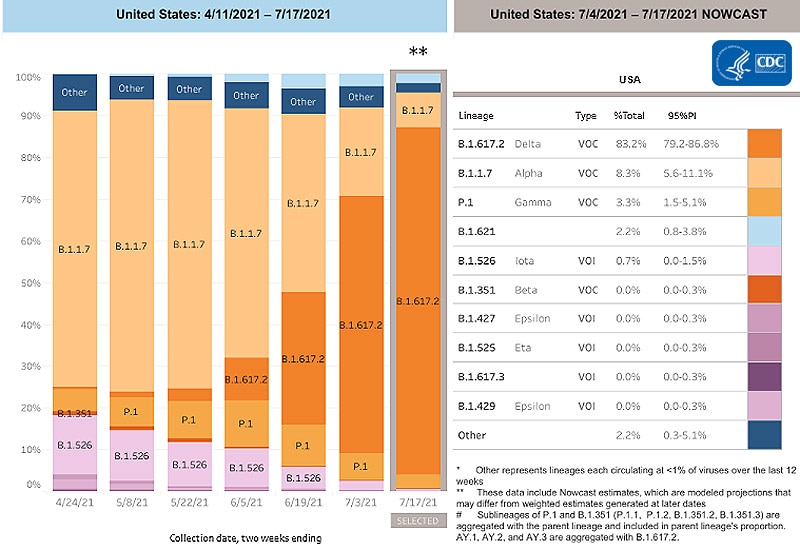
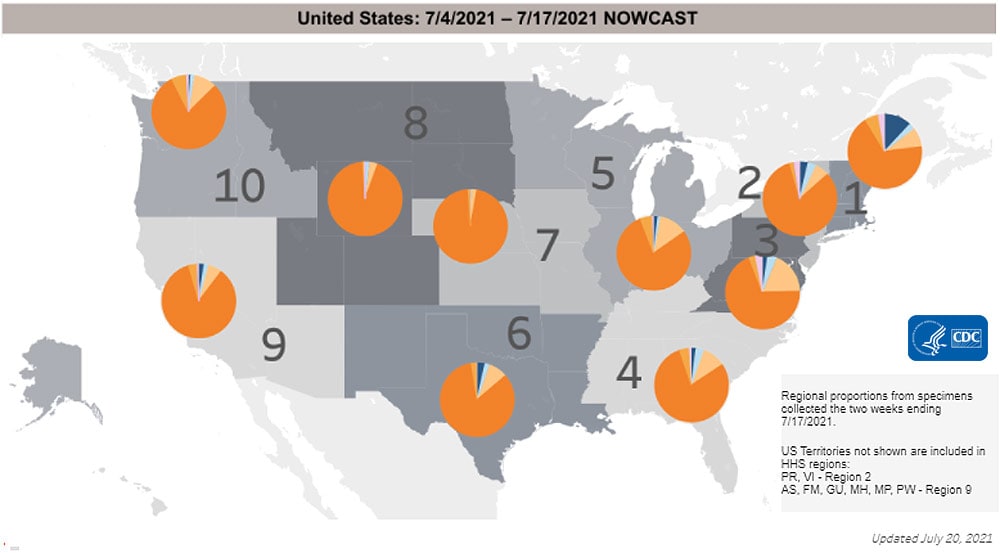
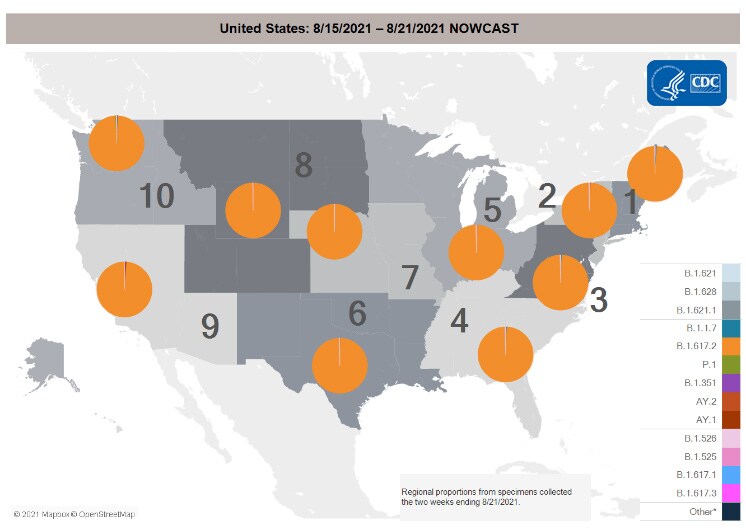
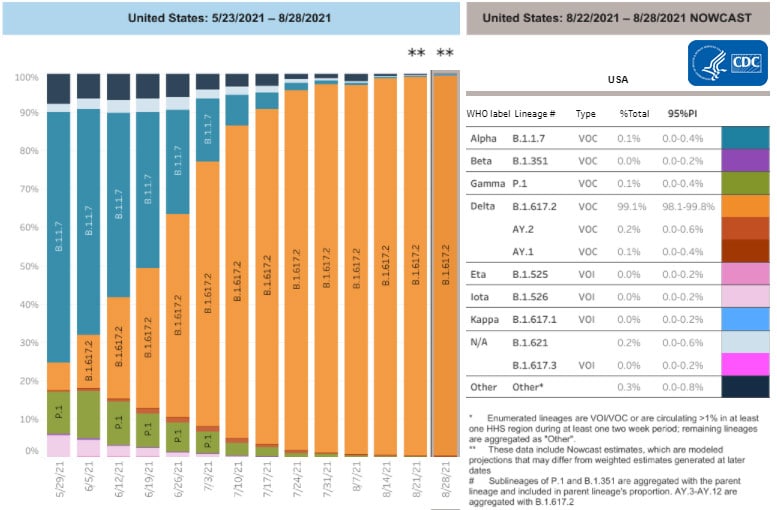
An increase in COVID-19 cases also creates more opportunities for the virus to mutate, which could lead to the emergence of new variants. Variants of the virus that causes COVID-19 are now responsible for all cases in the United States. The original strain is no longer detected among variants circulating throughout the country. The B.1.617.2 (Delta) variant is now the predominant variant in the United States, making up an estimated 83.2% of recent U.S. cases. The best way to slow the emergence of new variants is to reduce the spread of infection by taking measures to protect yourself, including getting a vaccine when it’s available to you.

COVID-19 is now a preventable disease. The COVID-19 vaccines authorized for use in the United States are safe and are effective against B.1.617.2 and other variants. If you receive a Pfizer-BioNTech or Moderna COVID-19 vaccine, you will need 2 shots to get the most protection. You should get your second shot even if you have side effects after the first shot, unless a vaccination provider or your doctor tells you not to get it. If you are only partially vaccinated, you are more likely to get infected, get sick, and spread the virus to other people. When you are fully vaccinated, you are protected against severe illness, hospitalization, and death.

Note to readers: To find a vaccine provider near you, visit Vaccines.gov or your state or local public health department website. You can also text your zip code to 438829 to get 3 locations near you with vaccines in stock. If you prefer your information in Spanish, text your zip code to 822862. You can also call the National COVID-19 Vaccination Assistance Hotline at 1-800-232-0233 to get help in English, Spanish, and more than 150 other languages. It also has a TTY line to support access by hearing impaired callers. If you or someone you know is hesitant about COVID-19 vaccination, CDC has information and answers to frequently asked questions to help inform the decision.


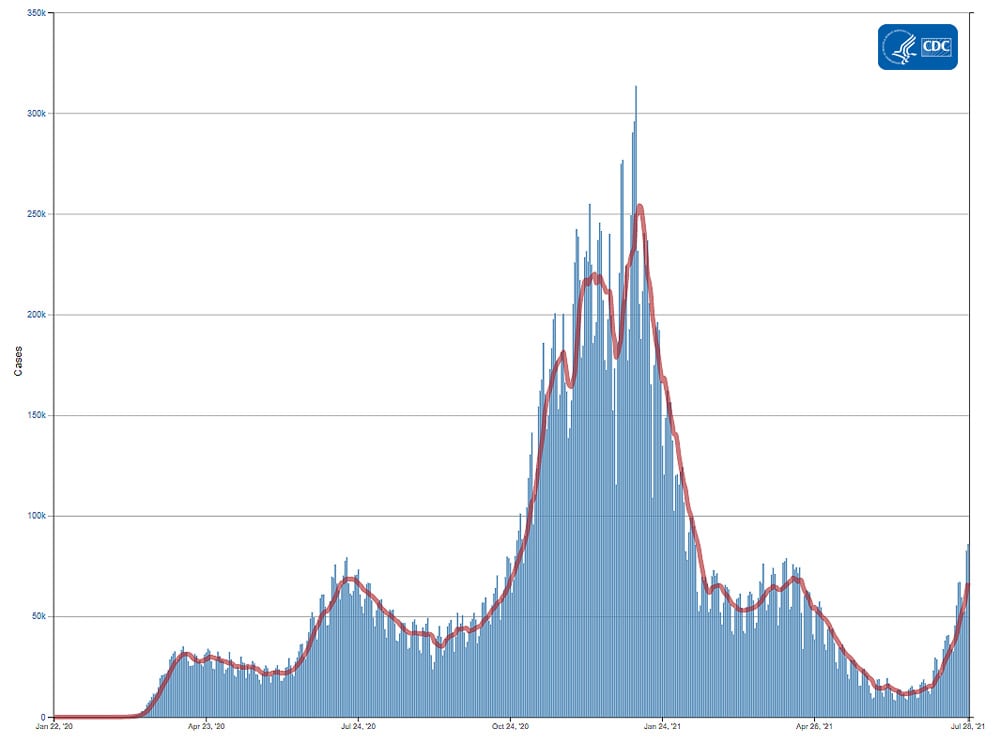
Reported Cases


The current 7-day moving average of daily new cases (40,246) increased 46.7% compared with the previous 7-day moving average (27,443). The current 7-day moving average is 84.2% lower than the peak observed on January 10, 2021 (254,052), and is 250.6% higher than the lowest value observed on June 19, 2021 (11,480). A total of 34,248,054 COVID-19 cases have been reported as of July 21.

34,248,054
Total Cases Reported

40,246
Current 7-Day Average*

27,443
Prior 7-Day Average

+46.7%
Change in 7-Day Average since Prior Week

*Historical cases are excluded from daily new cases and 7-day average calculations until they are incorporated into the dataset for the applicable date. Of 75,699 historical cases reported retroactively, 1,469 were reported in the current week and 1,474 were reported in the prior week.

Daily Trends in COVID-19 Cases in the United States Reported to CDC
red-line.jpg

7-Day moving average

resize iconView Larger
More Case Data


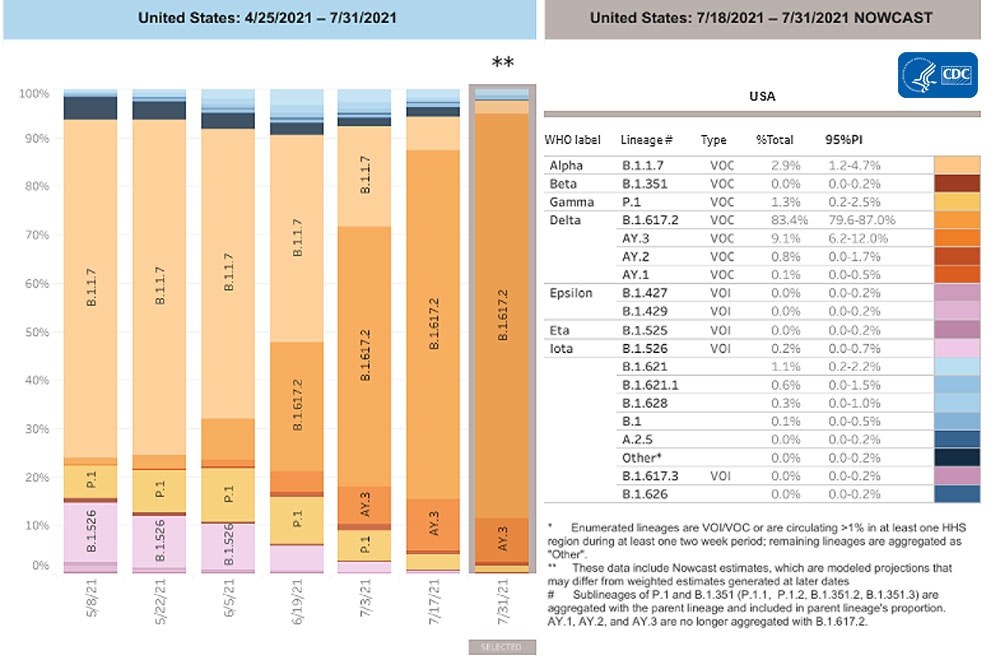
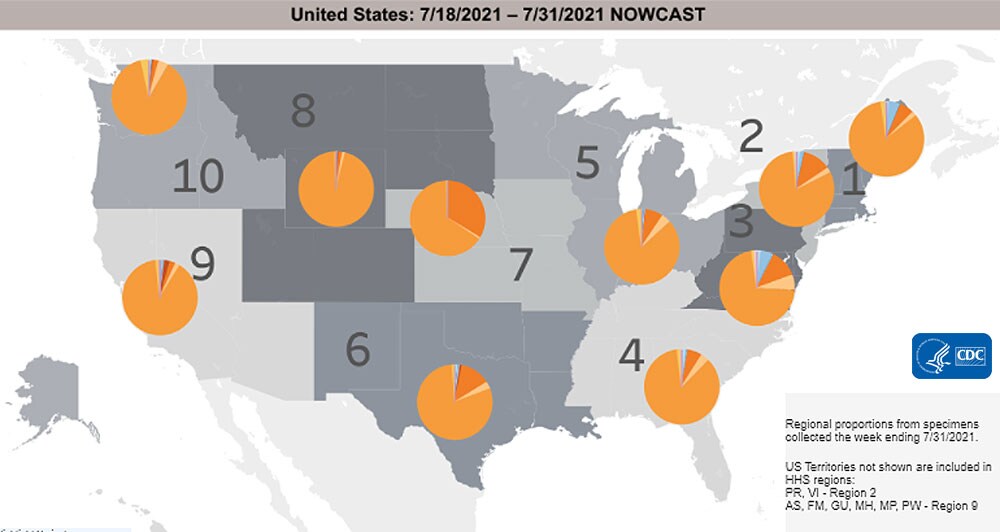
SARS-CoV-2 Variants


Multiple variants of the virus that causes COVID-19 are circulating globally, including within the United States. To date, four variants have been classified as a variant of concern (VOC). Nowcast estimates* of SARS-CoV-2 cases caused by these VOCs for the two weeks ending July 17 are summarized here. Nationally, the proportion of cases attributed to B.1.617.2 (Delta) is predicted to increase to 83.2%; B.1.1.7 (Alpha) proportion is predicted to decrease to 8.3%; P.1 (Gamma) proportion is predicted to decrease to 3.3%; and B.1.351 (Beta) is predicted to decrease to below 0.1%. Nowcast estimates predict that B.1.617.2 (Delta) will continue to be the predominant lineage circulating in all HHS regions and be more than 75% in eight HHS regions. B.1.1.7 (Alpha) is predicted to be less than 20% in all HHS regions. P.1 (Gamma) is predicted to be less than 7% in all HHS regions; and B.1.351 (Beta) is predicted to be less than or equal to 0.1% in all HHS regions.

*The median time from specimen collection to sequence data reporting is about 3 weeks. As a result, weighted estimates for the most recent few weeks may be unstable or unavailable. CDC’s Nowcast is a data projection tool that helps fill this gap by generating timely estimates of variant proportions for variants that are circulating in the United States. View Nowcast estimates on CDC’s COVID Data Tracker website on the Variant Proportions page.

SARS-CoV-2 Variants Circulating in the United States

resize iconView Larger

resize iconView Larger
More Variants Data


Testing


The percentage of COVID-19 NAATs (nucleic acid amplification tests) that are positive (percent positivity) has increased from the previous week. The 7-day average of percent positivity from tests is now 5.8%. The 7-day average number of tests reported for July 09 – July 15 was 599,054 up 15.9% from 516,701 for the prior 7 days.

480,535,511
Total Tests Reported

599,054
7-Day Average Tests Reported

5.8%
7-Day Average % Positivity

4.2%
Previous 7-Day Average % Positivity


+36.0%
Change in 7-Day Average % Positivity since Prior Week

COVID-19 NAAT Laboratory Test 7-day Percent Positivity by State/Territory

resize iconView Larger
More Testing Dataexternal icon


Vaccinations


The U.S. COVID-19 Vaccination Program began December 14, 2020. As of July 22, 339.8 million vaccine doses have been administered. Overall, about 187.2 million people, or 56.4% of the total U.S. population, have received at least one dose of vaccine. About 162.2 million people, or 48.8% of the total U.S. population, have been fully vaccinated.* As of July 22, the 7-day average number of administered vaccine doses reported (by date administered) to CDC per day was 291,565, a 35.2% decrease from the previous week.

The COVID Data Tracker Vaccination Demographic Trends tab shows vaccination trends by age group. As of July 22, 89.2% of people ages 65 or older have received at least one dose of vaccine and 79.6% are fully vaccinated. Just over two-thirds (68.6%) of people ages 18 or older have received at least one dose of vaccine and 59.7% are fully vaccinated. For people ages 12 or older, 65.9% have received at least one dose of vaccine and 57.1% are fully vaccinated.

339,763,765
Vaccines Administered

187,216,168
People who received at least one dose

162,174,165
People who are fully vaccinated*

56.4%
Percentage of the US population that has received at least one dose

48.8%
Percentage of the US population that has been fully vaccinated*

+0.6
Percentage point increase from last week

+0.5
Percentage point increase from last week

*People are considered fully vaccinated 2 weeks after their second dose in a 2-dose series (such as the Pfizer or Moderna vaccines), or 2 weeks after a single-dose vaccine (such as Johnson & Johnson’s Janssen vaccine).


Daily Change in Number of COVID-19 Vaccinations in the United States Reported to CDC

red-line.jpg

7-Day moving average

resize iconView Larger
More Vaccination Data


Hospitalizations

New Hospital Admissions


The current 7-day average for July 13–July 19 was 3,521. This is a 32.2% increase from the prior 7-day average (2,663) from July 6–July 12. The 7-day moving average for new admissions has consistently increased since June 25, 2021.

2,338,869
Total New Admissions

3,521
Current 7-Day Average

2,663
Prior 7-Day Average

+32.2%
Change in 7-Day Average

The start of consistent reporting of hospital admissions data was August 1, 2020.

Daily Trends in Number of New COVID-19 Hospital Admissions in the United States

resize iconView Larger
New admissions are pulled from a 10 am EST snapshot of the HHS Unified Hospital Timeseries Dataset. Due to potential reporting delays, data from the most recent 7 days, as noted in the figure above with the grey bar, should be interpreted with caution. Small shifts in historic data may also occur due to changes in the CMS Provider of Services file, which is used to identify the cohort of included hospitals.

More Hospital Data


COVID-NET: Trends in Hospitalizations in Adults Ages 65 Years and Older


CDC’s Coronavirus Disease 2019-Associated Hospitalization Surveillance Network (COVID-NET) shows that since the start of the COVID-19 pandemic, people ages 65 years and older were the age group with the highest rates of hospitalization among all adults. While hospitalization rates in this age group had been decreasing over several months, preliminary data from the past 3 weeks show that rates of COVID-19-associated hospitalizations are again rising in adults ages 65 years and older. These are the first increases in rates of COVID-19-associated hospitalizations seen in this age group since April 2021.

Trends in Rates of COVID-19-Associated Hospitalizations in Adults Ages 65 Years and Older


resize iconView Larger
The Coronavirus Disease 2019 (COVID-19)-Associate­­d Hospitalization Surveillance Network (COVID-NET) is an additional source for hospitalization data collected through a network of more than 250 acute-care hospitals in 14 states (representing ~10% of the U.S. population). Detailed data on patient demographics, including race/ethnicity, underlying medical conditions, medical interventions, and clinical outcomes, are standardized case reporting form.
More COVID-NET Data

Deaths


The current 7-day moving average of new deaths (223) has increased 9.3% compared with the previous 7-day moving average (204). As of July 21, a total of 607,684 COVID-19 deaths have been reported.

607,684
Total Deaths Reported

223
Current 7-Day Average*

204
Prior 7-Day Average

+9.3%
Change in 7-Day Average Since Prior Week

*Historical deaths are excluded from the daily new deaths and 7-day average calculations until they are incorporated into the dataset by their applicable date. Of 6,125 historical deaths reported retroactively, 15 were reported in the current week and 9 were reported in the prior week.

Daily Trends in Number of COVID-19 Deaths in the United States Reported to CDC
red-line.jpg

7-Day moving average

resize iconView Larger
More Death Data


Recent CDC COVID-19 Publications
  1. COVID-19 Vaccination Coverage Among Insured Persons Aged ≥16 Years, by Race/Ethnicity and Other Selected Characteristics — Eight Integrated Health Care Organizations, United States, December 14, 2020–May 15, 2021
  2. COVID-19 Vaccine Administration, by Race and Ethnicity — North Carolina, December 14, 2020–April 6, 2021
  3. Changes in Influenza and Other Respiratory Virus Activity During the COVID-19 Pandemic — United States, 2020–2021
Recent COVID Data Tracker Updates
homeScience & Research
https://www.cdc.gov/coronavirus/2019-ncov/covid-data/covidview/index.html
 
covid-tracker-header-lrg.jpg
COVID Data Tracker Weekly Review


Print
Subscribe to the Weekly Review


Interpretive Summary for July 30, 2021
Don’t Run Down the Shot Clock


COVID-19 cases, hospitalizations, and deaths are once again increasing in nearly all states, fueled by the B.1.617.2 (Delta) variant, which is much more contagious than past versions of the virus. The highest spread of cases and severe outcomes is happening in places with low vaccination rates. Although COVID-19 vaccination is the most effective prevention measure, vaccination rates across the United States have varied.

COVID-19 vaccines are very effective, but no vaccine is perfect. In some instances, fully vaccinated people will get COVID-19 and may be contagious. These are called “vaccine breakthrough cases.” A new CDC study finds that B.1.617.2 (Delta) can lead to breakthrough infections. This means that while vaccinated people are much less likely to get sick, it will still happen in some cases. As the number of people who are vaccinated goes up, the number of breakthrough cases is also expected to increase, even as the vaccines remain highly effective.

United States Levels of Community Transmission by County as of July 27, 2021

resize iconView Larger
Vaccines help protect people from getting COVID-19 or from getting severely ill from it. Unvaccinated people should get vaccinated and continue masking. CDC also recommends that fully vaccinated people wear masks in public indoor settings in areas of substantial or high transmission. With the B.1.617.2 (Delta) variant rapidly spreading throughout the country, this is more urgent than ever. To find a vaccine provider near you, visit Vaccines.gov or your state or local public health department website. If you or someone you know is hesitant about COVID-19 vaccination, CDC has information and answers to frequently asked questions to help them inform their decision.

Note to readers: On July 27, 2021, CDC announced updated Guidance for COVID-19 Prevention Strategies. Among strategies to prevent COVID-19, CDC recommends all unvaccinated people wear masks in public indoor settings. Based on emerging evidence of the B.1.617.2 (Delta) variant, CDC also recommends that fully vaccinated people wear masks in public indoor settings in areas of substantial or high transmission. To see the level of community transmission in your county, visit COVID Data Tracker.


Reported Cases


The current 7-day moving average of daily new cases (66,606) increased 64.1% compared with the previous 7-day moving average (40,597). The current 7-day moving average is 73.8% lower than the peak observed on January 10, 2021 (254,063) and is 480.1% higher than the lowest value observed on June 19, 2021 (11,483). A total of 34,722,631 COVID-19 cases have been reported as of July 28.

34,722,631
Total Cases Reported

66,606
Current 7-Day Average*

40,597
Prior 7-Day Average

+64.1%
Change in 7-Day Average since Prior Week

*Historical cases are excluded from daily new cases and 7-day average calculations until they are incorporated into the dataset for the applicable date. Of 77,785 historical cases reported retroactively, 2,086 were reported in the current week and 1,469 were reported in the prior week.

Daily Trends in COVID-19 Cases in the United States Reported to CDC
red-line.jpg

7-Day moving average

resize iconView Larger
More Case Data


SARS-CoV-2 Variants


Multiple variants of the virus that causes COVID-19 are circulating globally, including within the United States. Currently, four variants are classified as a variant of concern (VOC). Nowcast estimates* of SARS-CoV-2 cases caused by these VOCs for the two weeks ending July 17 are summarized here. Nationally, the proportion of cases attributed to B.1.617.2 (Delta) is predicted to increase to 82.2%; B.1.1.7 (Alpha) proportion is predicted to decrease to 9.0%; P.1 (Gamma) proportion is predicted to decrease to 3.8%; and B.1.351 (Beta) is predicted to remain steady at 0.1%. Nowcast estimates predict that B.1.617.2 (Delta) will continue to be the predominant lineage circulating in all HHS regions and be more than 70% in nine HHS regions. B.1.1.7 (Alpha) is predicted to be less than or equal to 21% in all HHS regions. P.1 (Gamma) is predicted to be less than 9% in all HHS regions; and B.1.351 (Beta) is predicted to be less than or equal to 0.2% in all HHS regions.

*The median time from specimen collection to sequence data reporting is about 3 weeks. As a result, weighted estimates for the most recent few weeks may be unstable or unavailable. CDC’s Nowcast is a data projection tool that helps fill this gap by generating timely estimates of variant proportions for variants that are circulating in the United States. View Nowcast estimates on CDC’s COVID Data Tracker website on the Variant Proportions page.

SARS-CoV-2 Variants Circulating in the United States

resize iconView Larger

resize iconView Larger
More Variants Data


Testing


The percentage of COVID-19 NAATs (nucleic acid amplification tests) that are positive (percent positivity) has increased from the previous week. The 7-day average of percent positivity from tests is now 7.8%. The 7-day average number of tests reported for July 16 – Jul 22 was 698,611 up 14.5% from 610,004 for the prior 7 days.

486,000,511
Total Tests Reported

698,611
7-Day Average Tests Reported

7.8%
7-Day Average % Positivity

6.0%
Previous 7-Day Average % Positivity


+31.0%
Change in 7-Day Average % Positivity since Prior Week

COVID-19 NAAT Laboratory Test 7-day Percent Positivity by State/Territory

resize iconView Larger
More Testing Dataexternal icon


Vaccinations


The U.S. COVID-19 Vaccination Program began December 14, 2020. As of July 29, 344.1 million vaccine doses have been administered. Overall, about 189.9 million people, or 57.2% of the total U.S. population, have received at least one dose of vaccine. About 163.9 million people, or 49.4% of the total U.S. population, have been fully vaccinated.* As of July 29, the 7-day average number of administered vaccine doses reported (by date of CDC report) to CDC per day was 615,404, a 16.15% increase from the previous week.

CDC’s COVID Data Tracker Vaccination Demographic Trends tab shows vaccination trends by age group. As of July 29, 89.7% of people ages 65 or older have received at least one dose of vaccine and 79.9% are fully vaccinated. Over two-thirds (69.4%) of people ages 18 or older have received at least one dose of vaccine and 60.3% are fully vaccinated. For people ages 12 or older, 66.9% have received at least one dose of vaccine and 57.7% are fully vaccinated.

344,071,595
Vaccines Administered

189,945,907
People who received at least one dose

163,868,916
People who are fully vaccinated*

57.2%
Percentage of the US population that has received at least one dose

49.4%
Percentage of the US population that has been fully vaccinated*

+0.8
Percentage point increase from last week

+0.6
Percentage point increase from last week

*People are considered fully vaccinated 2 weeks after their second dose in a 2-dose series (such as the Pfizer or Moderna vaccines), or 2 weeks after a single-dose vaccine (such as Johnson & Johnson’s Janssen vaccine).


Daily Change in the Total Number of Administered Doses Reported to CDC by the date of CDC Report, United States


red-line.jpg

7-Day moving average

resize iconView Larger
More Vaccination Data


Hospitalizations

New Hospital Admissions


The current 7-day average for July 21–July 27 was 5,475. This is a 46.3% increase from the prior 7-day average (3,742) from July 14–July 20. The 7-day moving average for new admissions has consistently increased since June 25, 2021.

2,381,644
Total New Admissions

5,475
Current 7-Day Average

3,742
Prior 7-Day Average

+46.3%
Change in 7-Day Average

The start of consistent reporting of hospital admissions data was August 1, 2020.

Daily Trends in Number of New COVID-19 Hospital Admissions in the United States

resize iconView Larger
New admissions are pulled from a 10 am EST snapshot of the HHS Unified Hospital Timeseries Dataset. Due to potential reporting delays, data from the most recent 7 days, as noted in the figure above with the grey bar, should be interpreted with caution. Small shifts in historic data may also occur due to changes in the CMS Provider of Services file, which is used to identify the cohort of included hospitals.

More Hospital Data


COVID-NET: Trends in Hospitalizations in Adults Ages 18–49 Years


CDC’s Coronavirus Disease 2019-Associated Hospitalization Surveillance Network (COVID-NET) shows that hospitalization rates are increasing in younger adults. While adults ages 65 years and older are most at-risk, younger adults are also at risk for COVID-19-associated hospitalizations. Rates of hospitalization remain low when compared to previous months of the pandemic, but preliminary data show that weekly rates of COVID-19-associated hospitalizations have increased significantly for adults ages 18 to 49 years. Compared to June 26, 2021, weekly rates in adults ages 18–49 years for the week ending July 10, 2021 have increased by nearly 40%. These are the first increases in rates of COVID-19-associated hospitalizations seen in this age group since April 2021.

Trends in Rates of COVID-19-Associated Hospitalizations in Adults Ages 18–49 Years


resize iconView Larger
The Coronavirus Disease 2019 (COVID-19)-Associate¬¬d Hospitalization Surveillance Network (COVID-NET) is an additional source for hospitalization data collected through a network of more than 250 acute-care hospitals in 14 states (representing ~10% of the U.S. population). Detailed data on patient demographics, including race/ethnicity, underlying medical conditions, medical interventions, and clinical outcomes, are standardized case reporting form.
More COVID-NET Data

Deaths


The current 7-day moving average of new deaths (296) has increased 33.3% compared with the previous 7-day moving average (222). The current 7-day moving average is 91.8% lower than the peak observed on January 13, 2021 (3,625) and is 77.1% higher than the lowest value observed on July 10, 2021 (167). As of July 28, a total of 609,853 COVID-19 deaths have been reported.

609,853
Total Deaths Reported

296
Current 7-Day Average*

222
Prior 7-Day Average

+33.3%
Change in 7-Day Average Since Prior Week

*Historical deaths are excluded from the daily new deaths and 7-day average calculations until they are incorporated into the dataset by their applicable date. Of 6,143 historical deaths reported retroactively, 26 were reported in the current week and 8 were reported in the prior week.

Daily Trends in Number of COVID-19 Deaths in the United States Reported to CDC
red-line.jpg

7-Day moving average

resize iconView Larger
More Death Data


Recent CDC COVID-19 Publications
  1. Guidance for Implementing COVID-19 Prevention Strategies in the Context of Varying Community Transmission Levels and Vaccination Coverage
  2. SARS-CoV-2 Infection in Public School District Employees Following a District-Wide Vaccination Program — Philadelphia County, Pennsylvania, March 21–April 23, 2021
  3. Disparities in COVID-19 Vaccination Coverage Among Health Care Personnel Working in Long-Term Care Facilities, by Job Category, National Healthcare Safety Network — United States, March 2021
  4. Outbreak of SARS-CoV-2 Infections, including COVID-19 Vaccine Breakthrough Infections, Associated with Large Public Gatherings — Barnstable County, Massachusetts, July 2021
https://www.cdc.gov/coronavirus/2019-ncov/covid-data/covidview/index.html
 
covid-tracker-header-lrg.jpg
COVID Data Tracker Weekly Review


Print
Subscribe to the Weekly Review


Interpretive Summary for August 6, 2021
We Were on a Break!


Most U.S. states and jurisdictions are experiencing substantial or high levels of community transmission fueled by the spread of the highly contagious B.1.617.2 (Delta) variant. COVID-19 cases, hospitalizations, and deaths continue to increase, especially in communities with lower vaccination coverage. While the number of people getting vaccinated also continues to increase, many people remain unsure about getting vaccinated, and others do not plan to do so.

On July 27, 2021, CDC announced updated Guidance for COVID-19 Prevention Strategies based on emerging evidence of the B.1.617.2 (Delta) variant. CDC recommends that all people, regardless of vaccination status, wear masks in public indoor settings in areas of substantial or high transmission. A new CDC study supports previous findings that B.1.617.2 (Delta) is highly contagious, and is contributing to an increase in cases, including those with severe outcomes and those due to vaccine breakthrough infections. While vaccinated people can still develop COVID-19, they are far less likely to get severely sick or die than people who are unvaccinated.

United States Levels of Community Transmission

resize iconView Larger
Vaccination is the best tool we have for protecting ourselves and our loved ones against COVID-19. The COVID-19 vaccines authorized for use in the United States continue to protect against severe illness, hospitalizations, and death. To find a vaccine provider near you, visit Vaccines.gov or your state or local public health department website. If you or someone you know is hesitant about COVID-19 vaccination, CDC has information and answers to frequently asked questions to help make informed decisions.

Note to readers: The latest county-level data for each state (including cases, deaths and level of community transmission) can be downloaded from COVID Data Tracker’s County View page by following the steps below:
  1. Select your state and county of interest using the dropdowns.
  2. Scroll down past the maps, figures, and community characteristics table to the county level data tables.
  3. Click on “County Level Latest Data for [State]” to expand and view the data table.
  4. Click on the “Download Data” button in the top right to download the csv.
  5. The downloaded file contains county level data for the selected state. These data include counts, rates, and percent change for cases, deaths, testing, and hospitalizations, as well as level of community transmission, among other metrics.

Reported Cases


The current 7-day moving average of daily new cases (89,977) increased 33.7% compared with the previous 7-day moving average (67,274). The current 7-day moving average is 30.9% higher compared to the peak observed on July 20, 2020 (68,717). The current 7-day moving average is 64.6% lower than the peak observed on January 10, 2021 (254,060) and is 682.9% higher than the lowest value observed on June 19, 2021 (11,493). A total of 35,392,284 COVID-19 cases have been reported as of August 4.

35,392,284
Total Cases Reported

89,977
Current 7-Day Average*

67,274
Prior 7-Day Average

+33.7%
Change in 7-Day Average since Prior Week

*Historical cases are excluded from daily new cases and 7-day average calculations until they are incorporated into the dataset for the applicable date. Of 80,589 historical cases reported retroactively, 2,809 were reported in the current week and 2,086 were reported in the prior week.

Daily Trends in COVID-19 Cases in the United States Reported to CDC
red-line.jpg

7-Day moving average

resize iconView Larger
More Case Data


SARS-CoV-2 Variants


Multiple variants of the virus that causes COVID-19 are circulating globally, including within the United States. Currently, four variants are classified as a variant of concern (VOC). Nowcast estimates* of SARS-CoV-2 cases caused by these VOCs for the two weeks ending July 31 are summarized here. Nationally, the combined proportion of cases attributed to Delta (B.1.617.2, AY.1, AY.2, AY.3) is predicted to increase to 93%; Alpha (B.1.1.7) proportion is predicted to decrease to 2.9%; Gamma (P.1) proportion is predicted to decrease to 1.3%; and Beta (B.1.351) is predicted to be less than 0.1%. Nowcast estimates predict that Delta (B.1.617.2, AY.1, AY.2, and AY.3) will continue to be the predominant lineage circulating in all 10 HHS regions. Alpha (B.1.1.7) is predicted to be less than 7% in all HHS regions. Gamma (P.1) is predicted to be 3.1% or less in all HHS regions; and Beta (B.1.351) is predicted to be less than 0.2% in all HHS regions.

*The median time from specimen collection to sequence data reporting is about 3 weeks. As a result, weighted estimates for the most recent few weeks may be unstable or unavailable. CDC’s Nowcast is a data projection tool that helps fill this gap by generating timely estimates of variant proportions for variants that are circulating in the United States. View Nowcast estimates on CDC’s COVID Data Tracker website Variant Proportions page.

SARS-CoV-2 Variants Circulating in the United States

resize iconView Larger

resize iconView Larger
More Variants Data


Testing


The percentage of COVID-19 NAATs (nucleic acid amplification tests) that are positive (percent positivity) has increased from the previous week. The 7-day average of percent positivity from tests is now 9.5%. The 7-day average number of tests reported for Jul 23 – Jul 29 was 816,672 up 15.4% from 707,631 for the prior 7 days.

492,285,922
Total Tests Reported

816,672
7-Day Average Tests Reported

9.5%
7-Day Average % Positivity

8.2%
Previous 7-Day Average % Positivity


+15.7%
Change in 7-Day Average % Positivity since Prior Week

COVID-19 NAAT Laboratory Test 7-day Percent Positivity by State/Territory

resize iconView Larger
More Testing Dataexternal icon


Vaccinations


The U.S. COVID-19 Vaccination Program began December 14, 2020. As of August 5, 348.9 million vaccine doses have been administered. Overall, about 193.2 million people, or 58.2% of the total U.S. population, have received at least one dose of vaccine. About 165.6 million people, or 49.9% of the total U.S. population, have been fully vaccinated.* As of August 5, the 7-day average number of administered vaccine doses reported (by date of CDC report) to CDC per day was 699,261, a 13.63% increase from the previous week.

CDC’s COVID Data Tracker Vaccination Demographic Trends tab shows vaccination trends by age group. As of August 5, 90.2% of people ages 65 or older have received at least one dose of vaccine and 80.3% are fully vaccinated. Over two-thirds (70.4%) of people ages 18 or older have received at least one dose of vaccine and 60.8% are fully vaccinated. For people ages 12 or older, 68.1% have received at least one dose of vaccine and 58.4% are fully vaccinated.

348,966,419
Vaccines Administered

193,199,353
People who received at least one dose

165,637,566
People who are fully vaccinated*

58.2%
Percentage of the US population that has received at least one dose

49.9%
Percentage of the US population that has been fully vaccinated*

+1
Percentage point increase from last week

+0.5
Percentage point increase from last week

*People are considered fully vaccinated 2 weeks after their second dose in a 2-dose series (such as the Pfizer or Moderna vaccines), or 2 weeks after a single-dose vaccine (such as Johnson & Johnson’s Janssen vaccine).


Daily Change in the Total Number of Administered Doses Reported to CDC by the date of CDC Report, United States


red-line.jpg

7-Day moving average

resize iconView Larger
More Vaccination Data


Hospitalizations

New Hospital Admissions


The current 7-day average for July 28–August 3 was 7,707. This is a 40.0% increase from the prior 7-day average (5,506) from July 21–July 27. The 7-day moving average for new admissions has consistently increased since June 25, 2021.

2,436,010
Total New Admissions

7,707
Current 7-Day Average

5,506
Prior 7-Day Average

+40.0%
Change in 7-Day Average

The start of consistent reporting of hospital admissions data was August 1, 2020.

Daily Trends in Number of New COVID-19 Hospital Admissions in the United States

resize iconView Larger
New admissions are pulled from a 10 am EST snapshot of the HHS Unified Hospital Timeseries Dataset. Due to potential reporting delays, data from the most recent 7 days, as noted in the figure above with the grey bar, should be interpreted with caution. Small shifts in historic data may also occur due to changes in the CMS Provider of Services file, which is used to identify the cohort of included hospitals.

More Hospital Data


COVID-NET: Trends in Hospitalizations in Children Ages 4 Years and Younger


CDC’s Coronavirus Disease 2019-Associated Hospitalization Surveillance Network (COVID-NET) shows that hospitalization rates are increasing, including rates in children. Compared to June 26, 2021, weekly rates in children ages 4 years and younger for the week ending July 17, 2021 have tripled from 0.2 to 0.6 per 100,000 population. While rates are higher in adults, children—including very young children—are also at risk for COVID-19-associated hospitalizations. Unlike adults, children younger than 12 years of age are not yet eligible for any of the available COVID-19 vaccines.

Trends in Hospitalizations in Children Ages 4 Years and Younger


resize iconView Larger
The Coronavirus Disease 2019 (COVID-19)-Associate­­d Hospitalization Surveillance Network (COVID-NET) is an additional source for hospitalization data collected through a network of more than 250 acute-care hospitals in 14 states (representing ~10% of the U.S. population). Detailed data on patient demographics, including race/ethnicity, underlying medical conditions, medical interventions, and clinical outcomes, are standardized case reporting form.
More COVID-NET Data

Deaths


The current 7-day moving average of new deaths (377) has increased 34.8% compared with the previous 7-day moving average (280). The current 7-day moving average is 67.6% lower compared to the peak observed on August 1, 2020 (1,164). The current 7-day moving average is 89.6% lower than the peak observed on January 13, 2021 (3,625) and is 116.3% higher than the lowest value observed on July 10, 2021 (174). As of August 4, a total of 612,958 COVID-19 deaths have been reported.

612,958
Total Deaths Reported

377
Current 7-Day Average*

280
Prior 7-Day Average

+34.8%
Change in 7-Day Average Since Prior Week

*Historical deaths are excluded from the daily new deaths and 7-day average calculations until they are incorporated into the dataset by their applicable date. Of 6,310 historical deaths reported retroactively, 166 were reported in the current week and 26 were reported in the prior week.

Daily Trends in Number of COVID-19 Deaths in the United States Reported to CDC
red-line.jpg

7-Day moving average

resize iconView Larger
More Death Data


Recent CDC COVID-19 Publications
  1. COVID-19 Vaccine Safety in Adolescents Aged 12–17 Years — United States, December 14, 2020–July 16, 2021
  2. Outbreak of SARS-CoV-2 Infections, Including COVID-19 Vaccine Breakthrough Infections, Associated with Large Public Gatherings — Barnstable County, Massachusetts, July 2021
  3. Guidance for Implementing COVID-19 Prevention Strategies in the Context of Varying Community Transmission Levels and Vaccination Coverage
  4. Rapid Increase in SARS-CoV-2 B.1.617.2 (Delta) Variant Circulation — Mesa County, Colorado, April–June 2021
  5. Effectiveness of COVID-19 Vaccines in Preventing Hospitalization Among Adults Aged ≥65 Years — 13 states, COVID-NET, February–April 2021
  6. Reduced Risk of Reinfection with SARS-CoV-2 After COVID-19 Vaccination — Kentucky, May–June 2021
Recent COVID Data Tracker Updates
  • The Vaccination Among People with Disabilities tab displays information on the number of vaccinated adults with disabilities in the United States
  • 2020 county-level timeseries data are now available on the County View tab, allowing users to examine key COVID-19 metrics across the entirety of the pandemic
https://www.cdc.gov/coronavirus/2019-ncov/covid-data/covidview/index.html
 
covid-tracker-header-lrg.jpg
Put on Your Masks and Thinking Caps


Print
Subscribe to the Weekly Review


Interpretive Summary for August 13, 2021
Put on Your Masks and Thinking Caps


COVID-19 cases, hospitalizations, and deaths continue to increase, especially in areas with higher levels of community transmission and lower vaccination coverage. Pediatric cases and hospitalizations have also increased in recent weeks. Rates of COVID-19-associated hospitalizations are lower in children of all ages compared to adults, but some children develop acute COVID-19 requiring hospitalization.[SUP]1[/SUP] In addition, some children who have had COVID-19 may later develop Multisystem Inflammatory Syndrome in Children (MIS-C), a rare but serious condition associated with COVID-19. As of July 30, 2021, CDC has received reports of more than 4,400 children in the United States who have been diagnosed with COVID-19-associated MIS-C.

Because children can be affected by COVID-19 and severe complications can occur, schools are encouraged to implement CDC’s updated Guidance for COVID-19 Prevention in K – 12 Schools to keep children safe. CDC’s updated guidance recommends that schools implement layered prevention strategies, including universal masking by all students ages 2 years and older, staff, teachers, and visitors, regardless of vaccination status. CDC also recommends eligible students, parents, teachers, and staff get vaccinated as soon as possible. Vaccination among eligible populations is critical to stopping the spread of COVID-19, especially to children under the age of 12 who are not yet eligible for vaccination.

Trends in New Hospital Admissions in Children Ages 0–17 Years


resize iconView Larger
Schools can safely reopen by implementing safety precautions. During previous COVID-19-related school closures, many children lost access to important services, including school-based healthcare services, special services for students with disabilities, physical education, and nutrition programs. School closures also contributed to increased anxiety and loneliness in many children and teens.[SUP]2,[/SUP][SUP]3,[/SUP][SUP]4[/SUP] Schools provide safe environments for learning and support healthy peer interaction important for social and emotional development. Children benefit from in-person learning, and safely returning to in-person instruction in the fall 2021 is a priority.

Note to readers: The COVID-19 pandemic has had a major effect on our lives. Many of us are facing challenges that can be stressful and overwhelming, and that can cause strong emotions in adults and children. Learning to cope with stress in a healthy way will make you, the people you care about, and those around you become more resilient. CDC has resources to help children, teens and young adults cope with stress. The CDC Parental Resources Kit helps support parents, caregivers, and other adults serving children and young people in recognizing children and young people’s social, emotional, and mental health challenges and helping to ensure their well-being.


Reported Cases


The current 7-day moving average of daily new cases (114,190) increased 18.4% compared with the previous 7-day moving average (96,454). The current 7-day moving average is 66.3% higher compared to the peak observed on July 20, 2020 (68,685). The current 7-day moving average is 65.0% lower than the peak observed on January 10, 2021 (254,023) and is 882.8% higher than the lowest value observed on June 19, 2021 (11,619). A total of 36,268,057 COVID-19 cases have been reported as of August 11.

36,268,057
Total Cases Reported

114,190
Current 7-Day Average*

96,454
Prior 7-Day Average

+18.4%
Change in 7-Day Average since Prior Week

*Historical cases are excluded from daily new cases and 7-day average calculations until they are incorporated into the dataset for the applicable date. Of 90,975 historical cases reported retroactively, 10,385 were reported in the current week and 2,809 were reported in the prior week.

Daily Trends in COVID-19 Cases in the United States Reported to CDC
red-line.jpg

7-Day moving average

resize iconView Larger
More Case Data


SARS-CoV-2 Variants


Multiple variants of the virus that causes COVID-19 are circulating globally, including within the United States. Currently, four variants are classified as a variant of concern (VOC). Nowcast estimates* of COVID-19 cases caused by these VOCs for the week ending August 7 are summarized here. Nationally, the combined proportion of cases attributed to Delta (B.1.617.2, AY.1, AY.2, AY.3) is estimated to increase to 97.4%; Alpha (B.1.1.7) proportion is estimated to decrease to 0.9%; Gamma (P.1) proportion is estimated to decrease to 0.5%; and Beta (B.1.351) is estimated to be less than 0.1%. Nowcast estimates that Delta (B.1.617.2, AY.1, AY.2, and AY.3) will continue to be the predominant variant circulating in all 10 HHS regions. Alpha (B.1.1.7) is estimated to be 1.6% or less in all HHS regions. Gamma (P.1) is estimated to be 1.2% or less in all HHS regions; and Beta (B.1.351) is estimated to be less than 0.1% in all HHS regions.

*The median time from specimen collection to sequence data reporting is about 3 weeks. As a result, weighted estimates for the most recent few weeks may be unstable or unavailable. CDC’s Nowcast is a data projection tool that helps fill this gap by generating timely estimates of variant proportions for variants that are circulating in the United States. View Nowcast estimates on CDC’s COVID Data Tracker website on the Variant Proportions page.

SARS-CoV-2 Variants Circulating in the United States

resize iconView Larger

resize iconView Larger
More Variants Data


Testing


The percentage of COVID-19 NAATs (nucleic acid amplification tests)* that are positive (percent positivity) has decreased from the previous week. The 7-day average of percent positivity from tests is now 9.7%. The 7-day average number of tests reported for Jul 30 – Aug 05 was 957,470, up 13.0% from 847,621 for the prior 7 days.

499,711,732
Total Tests Reported

957,470
7-Day Average Tests Reported

9.7%
7-Day Average % Positivity

10.0%
Previous 7-Day Average % Positivity


-3.2%
Change in 7-Day Average % Positivity since Prior Week

*Test for SARS-CoV-2, the virus that causes COVID-19

COVID-19 NAAT Laboratory Test 7-day Percent Positivity by State/Territory

resize iconView Larger
More Testing Dataexternal icon


Vaccinations


The U.S. COVID-19 Vaccination Program began December 14, 2020. As of August 12, 353.9 million vaccine doses have been administered. Overall, about 196.5 million people, or 59.2% of the total U.S. population, have received at least one dose of vaccine. About 167.4 million people, or 50.4% of the total U.S. population, have been fully vaccinated.* As of August 12, the 7-day average number of administered vaccine doses reported (by date of CDC report) to CDC per day was 699,068, a 0.03% decrease from the previous week.

CDC’s COVID Data Tracker Vaccination Demographic Trends tab shows vaccination trends by age group. As of August 12, 90.6% of people ages 65 or older have received at least one dose of vaccine and 80.6% are fully vaccinated. Over two-thirds (71.5%) of people ages 18 or older have received at least one dose of vaccine and 61.3% are fully vaccinated. For people ages 12 or older, 69.2% have received at least one dose of vaccine and 59% are fully vaccinated.

353,859,894
Vaccines Administered

196,505,543
People who received at least one dose

167,354,729
People who are fully vaccinated*

59.2%
Percentage of the US population that has received at least one dose

50.4%
Percentage of the US population that has been fully vaccinated*

+1.0%
Percentage point increase from last week

+0.5%
Percentage point increase from last week

*People are considered fully vaccinated 2 weeks after their second dose in a 2-dose series (such as the Pfizer or Moderna vaccines), or 2 weeks after a single-dose vaccine (such as Johnson & Johnson’s Janssen vaccine).


Daily Change in the Total Number of Administered Doses Reported to CDC by the date of CDC Report, United States


red-line.jpg

7-Day moving average

resize iconView Larger
More Vaccination Data


Hospitalizations

New Hospital Admissions


The current 7-day average for August 4–August 10 was 10,072. This is a 29.6% increase from the prior 7-day average (7,771) from July 28–August 3. The 7-day moving average for new admissions has consistently increased since June 25, 2021. New admissions of patients with confirmed COVID-19 are currently at their highest levels since the start of the pandemic in Florida, Louisiana, and Oregon.

2,507,105
Total New Admissions

10,072
Current 7-Day Average

7,771
Prior 7-Day Average

+29.6%
Change in 7-Day Average

The start of consistent reporting of hospital admissions data was August 1, 2020.

Daily Trends in Number of New COVID-19 Hospital Admissions in the United States

resize iconView Larger
New admissions are pulled from a 10 am EST snapshot of the HHS Unified Hospital Timeseries Dataset. Due to potential reporting delays, data from the most recent 7 days, as noted in the figure above with the grey bar, should be interpreted with caution. Small shifts in historic data may also occur due to changes in the CMS Provider of Services file, which is used to identify the cohort of included hospitals.

More Hospital Data


COVID-NET: Trends in Hospitalizations in Children Ages 5–17 Years


CDC’s Coronavirus Disease 2019-Associated Hospitalization Surveillance Network (COVID-NET) shows that hospitalization rates are increasing, including rates in school-aged children ages 5 to 17 years. While rates are higher in adults, children are also at risk for COVID-19-associated hospitalizations. Rates in both children ages 5 to 11 and 12 to 17 years increased over the past several weeks. Weekly rates in children ages 5 to 11 years, who are not eligible for available COVID-19 vaccines, increased from 0.2 per 100,000 population for the week ending June 19, 2021, to 0.4 per 100,000 for the week ending July 24, 2021. Rates in children 12–17 years, who are eligible for vaccination, have also increased in recent weeks.

Trends in Rates of COVID-19-Associated Hospitalizations in Children Ages 5–11 and 12–17 Years


resize iconView Larger
The Coronavirus Disease 2019 (COVID-19)-Associate­­d Hospitalization Surveillance Network (COVID-NET) is an additional source for hospitalization data collected through a network of more than 250 acute-care hospitals in 14 states (representing ~10% of the U.S. population). Detailed data on patient demographics, including race/ethnicity, underlying medical conditions, medical interventions, and clinical outcomes, are standardized case reporting form.
More COVID-NET Data

Deaths


The current 7-day moving average of new deaths (492) has increased 21.0% compared with the previous 7-day moving average (407). The current 7-day moving average is 59.3% lower compared to the peak observed on August 2, 2020 (1,210). The current 7-day moving average is 86.5% lower than the peak observed on January 13, 2021 (3,640) and is 170.4% higher than the lowest value observed on July 10, 2021 (182). As of August 11, a total of 617,096 COVID-19 deaths have been reported in the United States.

617,096
Total Deaths Reported

492
Current 7-Day Average*

407
Prior 7-Day Average

+21.0%
Change in 7-Day Average Since Prior Week

*Historical deaths are excluded from the daily new deaths and 7-day average calculations until they are incorporated into the dataset by their applicable date. Of 6,338 historical deaths reported retroactively, 44 were reported in the current week and 147 were reported in the prior week.

Daily Trends in Number of COVID-19 Deaths in the United States Reported to CDC
red-line.jpg

7-Day moving average

resize iconView Larger
More Death Data


References
  1. Hospitalization Rates and Characteristics of Children Aged <18 Years Hospitalized with Laboratory-Confirmed COVID-19 — COVID-NET, 14 States, March 1–July 25, 2020
  2. Emergency Department Visits for Suspected Suicide Attempts Among Persons Aged 12–25 Years Before and During the COVID-19 Pandemic — United States, January 2019–May 2021 | MMWR (cdc.gov)
  3. Mental Health, Substance Use, and Suicidal Ideation During the COVID-19 Pandemic — United States, June 24–30, 2020 | MMWR (cdc.gov)
  4. Mental Health–Related Emergency Department Visits Among Children Aged 18 Years During the COVID-19 Pandemic — United States, January 1–October 17, 2020 | MMWR (cdc.gov)

Recent CDC COVID-19 Publications
  1. Use of COVID-19 Vaccines After Reports of Adverse Events Among Adult Recipients of Janssen (Johnson & Johnson) and mRNA COVID-19 Vaccines (Pfizer-BioNTech and Moderna): Update from the Advisory Committee on Immunization Practices — United States, July 2021
  2. Effectiveness of COVID-19 Vaccines in Preventing Hospitalization Among Adults Aged ≥65 Years — 13 states, COVID-NET, February–April 2021
  3. Reduced Risk of Reinfection with SARS-CoV-2 After COVID-19 Vaccination — Kentucky, May–June 2021
  4. Rapid Increase in Circulation of the SARS-CoV-2 B.1.617.2 (Delta) Variant — Mesa County, Colorado, April–June 2021
  5. Alternative Methods for Grouping Race and Ethnicity to Monitor COVID-19 Outcomes and Vaccination Coverage
Recent COVID Data Tracker Updates
 
covid-tracker-header-lrg.jpg
COVID Data Tracker Weekly Review


Print
Subscribe to the Weekly Review


Interpretive Summary for August 20, 2021
Baby on Board


As of August 19, 2021, nearly 200 million people in the United States have received at least one dose of a COVID-19 vaccine. However, vaccination among pregnant people remains low. Data show that only about 1 in every 4 pregnant people report vaccination, and certain groups have much lower uptake.[SUP]*1 [/SUP]This low uptake persists despite recent increases in COVID-19 cases in pregnant people. CDC recommends all people 12 years and older – including people who are pregnant, breastfeeding, trying to get pregnant now, or who might become pregnant in the future – get vaccinated against COVID-19.

Compared to non-pregnant people, pregnant and recently pregnant people are at increased risk for severe illness from COVID-19, including illness that requires hospitalization, intensive care, a ventilator or special equipment to breathe, or illness that results in death.[SUP]2-5[/SUP] Having certain underlying medical conditions and other factors, including age, can further increase a pregnant person’s risk for developing severe COVID-19.[SUP]4[/SUP] Additionally, changes that occur in the body during pregnancy that increase the risk for severe illness can continue after pregnancy. Pregnant people with COVID-19 are also at increased risk for preterm birth and might be at increased risk for other poor pregnancy outcomes.[SUP]3[/SUP]


resize iconView Larger
Vaccines provide the best protection against COVID-19. It is important for pregnant people and those who live with or visit them to take steps to protect themselves. New CDC data provide further evidence that COVID-19 vaccines are safe for people who are pregnant, including those early in pregnancy. Additionally, there is currently no evidence that any vaccines, including COVID-19 vaccines, cause fertility problems in women or men. Many people have become pregnant after receiving a COVID-19 vaccine, including some who got vaccinated during COVID-19 vaccine clinical trials.[SUP]6–8[/SUP] If you have questions about getting vaccinated, talking with your healthcare professional may help, but is not required before vaccination. To find a vaccine provider near you, visit Vaccines.gov or your state or local public health department website.

*A recent CDC study shows that, even though COVID-19 vaccination coverage among pregnant people has been increasing, Black and Hispanic women have the lowest vaccination coverage among all racial and ethnic groups. Similar results have been reported with other vaccinations during pregnancy. These findings highlight racial and ethnic disparities in COVID-19 vaccination coverage among pregnant people, indicating a need to prioritize vaccine equity for racial and ethnic minority groups by addressing potential barriers and access issues. To learn more about what CDC is doing to address health equity, visit Health Equity in Action.

Note to readers: If you or someone you know is pregnant or thinking about becoming pregnant, CDC has several COVID-19 and pregnancy resources available.

Reported Cases


The current 7-day moving average of daily new cases (133,056) increased 14.0% compared with the previous 7-day moving average (116,740). The current 7-day moving average is 93.9% higher compared to the peak observed on July 20, 2020 (68,636). The current 7-day moving average is 47.6% lower than the peak observed on January 10, 2021 (254,108) and is 1042.0% higher than the lowest value observed on June 18, 2021 (11,651). A total of 37,259,886 COVID-19 cases have been reported as of August 18.

37,259,886
Total Cases Reported

133,056
Current 7-Day Average*

116,740
Prior 7-Day Average

+14.0%
Change in 7-Day Average since Prior Week

*Historical cases are excluded from daily new cases and 7-day average calculations until they are incorporated into the dataset for the applicable date. Of 94,471 historical cases reported retroactively, 3,546 were reported in the current week and 10,340 were reported in the prior week.

Daily Trends in COVID-19 Cases in the United States Reported to CDC
red-line.jpg

7-Day moving average

resize iconView Larger
More Case Data


SARS-CoV-2 Variants


Multiple variants of the virus that causes COVID-19 are circulating globally, including within the United States. Currently, four variants are classified as a variant of concern (VOC). Nowcast estimates* of COVID-19 cases caused by these VOCs for the week ending August 14 are summarized here. Nationally, the combined proportion of cases attributed to Delta is estimated to increase to 98.8%; Alpha proportion is estimated to decrease to 0.3%; Gamma proportion is estimated to decrease to 0.2%; and Beta is estimated to be less than 0.1%. Nowcast estimates that Delta will continue to be the predominant variant circulating in all 10 U.S. Department of Health and Human Services (HHS) regions. Alpha is estimated to be 0.6% or less in all HHS regions. Gamma is estimated to be 0.5% or less in all HHS regions; and Beta is estimated to be less than 0.1% in all HHS regions.

*The median time from specimen collection to sequence data reporting is about 3 weeks. As a result, weighted estimates for the most recent few weeks may be unstable or unavailable. CDC’s Nowcast is a data projection tool that helps fill this gap by generating timely estimates of variant proportions for variants that are circulating in the United States. View Nowcast estimates on CDC’s COVID Data Tracker website on the Variant Proportions page.

SARS-CoV-2 Variants Circulating in the United States

resize iconView Larger

resize iconView Larger
More Variants Data


Testing


The percentage of COVID-19 NAATs (nucleic acid amplification tests)* that are positive (percent positivity) has decreased from the previous week. The 7-day average of percent positivity from tests is now 9.7%. The 7-day average number of tests reported for August 06 – August 12 was 1,067,160, up 9.1% from 978,584 for the prior 7 days.

507,583,701
Total Tests Reported

1,067,160
7-Day Average Tests Reported

9.7%
7-Day Average % Positivity

9.8%
Previous 7-Day Average % Positivity


-1.4%
Change in 7-Day Average % Positivity since Prior Week

*Test for SARS-CoV-2, the virus that causes COVID-19

COVID-19 NAAT Laboratory Test 7-day Percent Positivity by State/Territory

resize iconView Larger
More Testing Dataexternal icon


Vaccinations


The U.S. COVID-19 Vaccination Program began December 14, 2020. As of August 19, 359.6 million vaccine doses have been administered. Overall, about 199.9 million people, or 60.2% of the total U.S. population, have received at least one dose of vaccine. About 169.6 million people, or 51.1% of the total U.S. population, have been fully vaccinated.* As of August 19, the 7-day average number of administered vaccine doses reported (by date of CDC report) to CDC per day was 823,355, a 17.78% increase from the previous week.

CDC’s COVID Data Tracker Vaccination Demographic Trends tab shows vaccination trends by age group. As of August 19, 91.1% of people ages 65 years or older have received at least one dose of vaccine and 81% are fully vaccinated. Over two-thirds (72.5%) of people ages 18 years or older have received at least one dose of vaccine and 62% are fully vaccinated. For people ages 12 years or older, 70.4% have received at least one dose of vaccine and 59.8% are fully vaccinated.

359,623,380
Vaccines Administered

199,887,548
People who received at least one dose

169,592,873
People who are fully vaccinated*

60.2%
Percentage of the US population that has received at least one dose

51.1%
Percentage of the US population that has been fully vaccinated*

+1.0%
Percentage point increase from last week

+0.7%
Percentage point increase from last week

*Represents the number of people who have received the second dose in a two-dose COVID-19 vaccine series (such as the Pfizer or Moderna vaccines),) or one dose of the single-shot Johnson & Johnson’s Janssen vaccine.

Daily Change in the Total Number of Administered Doses Reported to CDC by the date of CDC Report, United States


red-line.jpg

7-Day moving average

resize iconView Larger
More Vaccination Data


Hospitalizations

New Hospital Admissions


The current 7-day average for August 11–August 17 was 11,521. This is a 14.2% increase from the prior 7-day average (10,088) from August 4–August 10. New admissions of patients with confirmed COVID-19 are currently at their highest levels since the start of the pandemic in Alabama, Florida, Louisiana, Mississippi, Oregon, and Washington.

2,587,871
Total New Admissions

11,521
Current 7-Day Average

10,088
Prior 7-Day Average

+14.2%
Change in 7-Day Average

The start of consistent reporting of hospital admissions data was August 1, 2020.

Daily Trends in Number of New COVID-19 Hospital Admissions in the United States

resize iconView Larger
New admissions are pulled from a 10 am EST snapshot of the HHS Unified Hospital Timeseries Dataset. Due to potential reporting delays, data from the most recent 7 days, as noted in the figure above with the grey bar, should be interpreted with caution. Small shifts in historic data may also occur due to changes in the Centers for Medicare and Medicaid Services (CMS) Provider of Services file, which is used to identify the cohort of included hospitals.

More Hospital Data


COVID-NET: Trends in Hospitalizations in Non-Hispanic Black People


CDC’s Coronavirus Disease 2019-Associated Hospitalization Surveillance Network (COVID-NET) shows that since the start of the pandemic, people from racial and ethnic minority groups have been at increased risk for COVID-19-associated hospitalizations compared to non-Hispanic White people. While rates of hospitalizations have started to increase in all race and ethnicity groups since June 2021, the hospitalization rate for non-Hispanic Black people increased faster and has risen higher than other groups. For the week ending July 31, 2021, preliminary data show rates of COVID-19-associated hospitalizations in non-Hispanic Black people were 11.5 per 100,000 population—more than twice as high as rates in non-Hispanic White people (4.2 per 100.000). For the week ending July 31, 2021, the rate of COVID-19-associated hospitalizations in non-Hispanic Black people are the highest of any race and ethnicity group.

Trends in Rates of COVID-19-Associated Hospitalizations in Non-Hispanic Black People


resize iconView Larger
The Coronavirus Disease 2019 (COVID-19)-Associate­­d Hospitalization Surveillance Network (COVID-NET) is an additional source for hospitalization data collected through a network of more than 250 acute-care hospitals in 14 states (representing ~10% of the U.S. population). Detailed data on patient demographics, including race/ethnicity, underlying medical conditions, medical interventions, and clinical outcomes, are standardized case reporting form.
More COVID-NET Data

Deaths


The current 7-day moving average of new deaths (641) has increased 10.8% compared with the previous 7-day moving average (578). The current 7-day moving average is 47.1% lower compared to the peak observed on July 30, 2020 (1,211). The current 7-day moving average is 82.4% lower than the peak observed on January 13, 2021 (3,644) and is 237.4% higher than the lowest value observed on July 10, 2021 (190). As of August 18, a total of 623,244 COVID-19 deaths have been reported in the United States.

623,244
Total Deaths Reported

641
Current 7-Day Average*

578
Prior 7-Day Average

+10.8%
Change in 7-Day Average Since Prior Week

*Historical deaths are excluded from the daily new deaths and 7-day average calculations until they are incorporated into the dataset by their applicable date. Of 6,287 historical deaths reported retroactively, 37 were reported in the current week and 13 were reported in the prior week.

Daily Trends in Number of COVID-19 Deaths in the United States Reported to CDC
red-line.jpg

7-Day moving average

resize iconView Larger
More Death Data


References
  1. CDC. COVID Data Tracker: Percent of Pregnant People aged 18-49 years receiving at least one dose of a COVID-19 vaccine during pregnancy overall, by race/ethnicity, and date reported to CDC – Vaccine Safety Datalink*, United States. Atlanta, GA: US Department of Health and Human Services, CDC; 2021.https://covid.cdc.gov/covid-data-tra...pregnant-women
  2. Zambrano LD, Ellington S, Strid P, et al. Update: Characteristics of Symptomatic Women of Reproductive Age with Laboratory-Confirmed SARS-CoV-2 Infection by Pregnancy Status — United States, January 22–October 3, 2020. MMWR Morb Mortal Wkly Rep 2020;69:1641–1647. DOI: 10.15585/mmwr.mm6944e3.
  3. Allotey, J., et al., Clinical manifestations, risk factors, and maternal and perinatal outcomes of coronavirus disease 2019 in pregnancy: living systematic review and meta-analysis. BMJ, 2020. 370: p. m3320. doi: 10.1136/bmj.m3320external icon
  4. Galang RR, Newton SM, Woodworth KR, et al. Risk factors for illness severity among pregnant women with confirmed SARS-CoV-2 infection – Surveillance for Emerging Threats to Mothers and Babies Network, 22 state, local, and territorial health departments, March 29, 2020 -January 8, 2021. Clinical Infectious Diseases, 2021; ciab432. doi:1093/cid/ciab432external icon
  5. Ko JY, DeSisto CL, Simeone RM, et al. Adverse pregnancy outcomes, maternal complications, and severe illness among U.S. delivery hospitalizations with and without a COVID-19 diagnosis [published online ahead of print, 2021 May 12]. Clin Infect Dis. 2021;ciab344. doi:10.1093/cid/ciab344external icon
  6. Vaccines and Related Biological Products Advisory Committee Meeting. FDA Briefing Document. Janssen Ad26.COV2.S Vaccine for the Prevention of COVID-19. February 26, 2021. Available at: https://www.fda.gov/media/146217/downloadexternal icon. Accessed August 18, 2021.
  7. Vaccines and Related Biological Products Advisory Committee Meeting. FDA Briefing Document. Pfizer-BioNTech COVID-19 Vaccine. December 10, 2020. Available at: https://www.fda.gov/media/144245/downloadexternal icon. Accessed August 18, 2021.
  8. Vaccines and Related Biological Products Advisory Committee Meeting. FDA Briefing Document. Moderna COVID-19 Vaccine. December 17, 2020. Available at: Vaccines and Related Biological Products Advisory Committee December 17, 2020 Meeting Briefing Document – FDAexternal icon. Accessed August 18, 2021.

Recent CDC COVID-19 Publications
  1. Effectiveness of Pfizer-BioNTech and Moderna Vaccines in Preventing SARS-CoV-2 Infection Among Nursing Home Residents Before and During Widespread Circulation of the SARS-CoV-2 B.1.617.2 (Delta) Variant — National Healthcare Safety Network, March 1–August 1, 2021
  2. New COVID-19 Cases and Hospitalizations Among Adults, by Vaccination Status — New York, May 3–July 25, 2021
  3. Sustained Effectiveness of Pfizer-BioNTech and Moderna Vaccines Against COVID-19 Associated Hospitalizations Among Adults — United States, March–July 2021
  4. Use of Rapid Antigen Testing for SARS-CoV-2 in Remote Communities — Yukon-Kuskokwim Delta, Alaska, September 15, 2020–March 1, 2021
  5. Disparities in Excess Mortality Associated with COVID-19 — United States, 2020
Recent COVID Data Tracker Updates
  • Hospitalization data were added to the Daily and Total Trends tab to provide comparisons with key COVID-19 metrics
  • County progress summary tables were added below each US-level map on the County View tab
  • Summary tables were added to the Vaccination Equity tab to provide a count of counties that fall into each Vaccination Coverage/Social Vulnerability Index category
https://www.cdc.gov/coronavirus/2019-ncov/covid-data/covidview/index.html
 
covid-tracker-header-lrg.jpg
COVID Data Tracker Weekly Review


Print
Subscribe to the Weekly Review


Interpretive Summary for August 27, 2021
Easy as 1-2-3


resize iconView Larger
On August 23, 2021, the U.S. Food and Drug Administration (FDA) granted full approvalexternal icon of the Comirnaty/Pfizer-BioNTech COVID-19 vaccine for the prevention of COVID-19 disease in people ages 16 years and older. The vaccine continues to be available under emergency use authorization for adolescents ages 12 to 15 years, and for the administration of a third dose in some immunocompromised people. As of August 26, 2021, 203 million people in the United States have received at least one dose of a COVID-19 vaccine. 172 million people, or about 52% of the U.S. population, are fully vaccinated.

Studies show some immunocompromised people don’t always build the same level of immunity after vaccination the way non-immunocompromised people do. When this happens, getting another dose of the vaccine can sometimes help them build more protection against the disease. CDC recommends that people with moderately to severely compromised immune systems receive an additional (third) dose of a COVID-19 mRNA (Pfizer-BioNTech or Moderna) vaccine after the initial 2-doses. People who are moderately to severely immunocompromised are at increased risk of serious, prolonged illness due to COVID-19. In small studies pdf icon[36 pages, 2 MB], fully vaccinated immunocompromised people have made up a large proportion of hospitalized “breakthrough infections.”

A new CDC study shows the COVID-19 vaccines authorized in the United States continue to be highly effective at reducing the risk of severe COVID-19 illness, hospitalization, and death. However, recent data show that protection against asymptomatic, mild, and moderate disease may decrease over time. This does not mean that COVID-19 vaccines are no longer working. The reduced protection may be due to both decreasing immunity over time and the highly contagious Delta variant. On August 18, 2021, U.S. Health and Human Services public health and medical experts announced a plan to begin offering COVID-19 mRNA vaccine booster shots this fall. Booster shots are doses of vaccine that are given when the initial immune response to a vaccine is likely to have decreased over time.

COVID-19 vaccines remain the most powerful tool we have against COVID-19, making it critical that all people get vaccinated as soon as they are eligible. To find a vaccine provider near you, visit vaccines.gov or your state or local public health department. If you are immunocompromised and have questions, talk with your healthcare professional about your medical condition and whether an additional dose of a COVID-19 vaccine is right for you.

Note to readers: COVID-19 vaccine boosters may be available starting this fall with people being eligible starting 8 months after they received their second dose of an mRNA vaccine (either Pfizer-BioNTech or Moderna). This is subject to authorization by the FDA and recommendation by CDC’s Advisory Committee on Immunization Practices (ACIP). It is likely that people who received a Johnson & Johnson/Janssen (J&J) COVID-19 vaccine will also need a booster dose. Because the J&J vaccine wasn’t given in the United States until 70 days after the first mRNA vaccine doses, the data are not yet available but are expected in the coming weeks. With those data in hand, CDC will keep the public informed with a timely plan for J&J booster shots.


Reported Cases


The current 7-day moving average of daily new cases (142,006) increased 2.8% compared with the previous 7-day moving average (138,087). The current 7-day moving average is 107.2% higher compared to the peak observed on July 20, 2020 (68,522). The current 7-day moving average is 44.1% lower than the peak observed on January 10, 2021 (253,932) and is 1,117.9% higher than the lowest value observed on June 18, 2021 (11,660). A total of 38,341,339 COVID-19 cases have been reported as of August 25, 2021.

38,341,339
Total Cases Reported

142,006
Current 7-Day Average*

138,087
Prior 7-Day Average

+2.8%
Change in 7-Day Average since Prior Week

*Historical cases are excluded from daily new cases and 7-day average calculations until they are incorporated into the dataset for the applicable date. Of 104,743 historical cases reported retroactively, 10,269 were reported in the current week and 3,546 were reported in the prior week.

Daily Trends in COVID-19 Cases in the United States Reported to CDC
red-line.jpg

7-Day moving average

resize iconView Larger
More Case Data


SARS-CoV-2 Variants


Multiple variants of the virus that causes COVID-19 are circulating globally, including within the United States. Currently, four variants are classified as a variant of concern (VOC). Nowcast estimates* of COVID-19 cases caused by these VOCs for the week ending August 21, 2021, are summarized here. Nationally, the combined proportion of cases attributed to Delta is estimated to be greater than 99%; Alpha proportion is estimated to decrease to 0.2%; Gamma proportion is estimated to decrease to 0.1%; and Beta is estimated to be less than 0.1%. Nowcast estimates that Delta will continue to be the predominant variant circulating in all 10 U.S. Department of Health and Human Services (HHS) regions. Alpha is estimated to be 0.3% or less in all HHS regions. Gamma is estimated to be 0.3% or less in all HHS regions; and Beta is estimated to be less than 0.1% in all HHS regions.

*The median time from specimen collection to sequence data reporting is about 3 weeks. As a result, weighted estimates for the most recent few weeks may be unstable or unavailable. CDC’s Nowcast is a data projection tool that helps fill this gap by generating timely estimates of variant proportions for variants that are circulating in the United States. View Nowcast estimates on CDC’s COVID Data Tracker website on the Variant Proportions page.

SARS-CoV-2 Variants Circulating in the United States

resize iconView Larger

resize iconView Larger
More Variants Data


Testing


The percentage of COVID-19 NAATs (nucleic acid amplification tests)* that are positive (percent positivity) has decreased from the previous week. The 7-day average of percent positivity from tests is now 10.1%. The 7-day average number of tests reported for August 13–August 19, 2021, was 1,313,164, up 9.8% from 1,195,677 for the prior 7 days.

518,701,870
Total Tests Reported

1,313,164
7-Day Average Tests Reported

10.1%
7-Day Average % Positivity

10.4%
Previous 7-Day Average % Positivity


-3.1%
Change in 7-Day Average % Positivity since Prior Week

*Test for SARS-CoV-2, the virus that causes COVID-19

COVID-19 NAAT Laboratory Test 7-day Percent Positivity by State/Territory

resize iconView Larger
More Testing Dataexternal icon


Vaccinations


The U.S. COVID-19 Vaccination Program began December 14, 2020. As of August 26, 2021, 365.8 million vaccine doses have been administered. Overall, about 203 million people, or 61.1% of the total U.S. population, have received at least one dose of vaccine. About 172.2 million people, or 51.9% of the total U.S. population, have been fully vaccinated.* As of August 26, the 7-day average number of administered vaccine doses reported (by date of CDC report) to CDC per day was 877,756, a 6.61% increase from the previous week.

CDC’s COVID Data Tracker Vaccination Demographic Trends tab shows vaccination trends by age group. As of August 26, 2021, 91.7% of people ages 65 years or older have received at least one dose of vaccine and 81.4% are fully vaccinated. Over two-thirds (73.5%) of people ages 18 years or older have received at least one dose of vaccine and 62.8% are fully vaccinated. For people ages 12 years or older, 71.5% have received at least one dose of vaccine and 60.7% are fully vaccinated.

365,767,674
Vaccines Administered

202,961,676
People who received at least one dose

172,171,009
People who are fully vaccinated*

61.1%
Percentage of the US population that has received at least one dose

51.9%
Percentage of the US population that has been fully vaccinated*

+0.9
Percentage point increase from last week

+0.8
Percentage point increase from last week

*Represents the number of people who have received the second dose in a two-dose COVID-19 vaccine series (such as the Pfizer or Moderna vaccines),) or one dose of the single-shot Johnson & Johnson’s Janssen vaccine.

Daily Change in the Total Number of Administered Doses Reported to CDC by the date of CDC Report, United States


red-line.jpg

7-Day moving average

resize iconView Larger
More Vaccination Data


Hospitalizations

New Hospital Admissions


The current 7-day daily average for August 18–August 24, 2021 was 12,297. This is a 5.7% increase from the prior 7-day average (11,637) from August 11–August 17, 2021. Nationally, new admissions of patients with confirmed COVID-19 are currently at their highest levels since the start of the pandemic for all age groups under 50 years old.

New admissions of patients with confirmed COVID-19 are currently at their highest levels since the start of the pandemic in Hawaii, Kentucky, Oregon, Washington, and Wyoming.

2,674,920
Total New Admissions

12,297
Current 7-Day Average

11,637
Prior 7-Day Average

+5.7%
Change in 7-Day Average

The start of consistent reporting of hospital admissions data was August 1, 2020.

Daily Trends in Number of New COVID-19 Hospital Admissions in the United States

resize iconView Larger
New admissions are pulled from a 10 am EST snapshot of the HHS Unified Hospital Timeseries Dataset. Due to potential reporting delays, data from the most recent 7 days, as noted in the figure above with the grey bar, should be interpreted with caution. Small shifts in historic data may also occur due to changes in the Centers for Medicare and Medicaid Services (CMS) Provider of Services file, which is used to identify the cohort of included hospitals.

More Hospital Data


COVID-NET: Trends in Rates of Hospitalizations in Adults Ages 18 Years and Older


CDC’s Coronavirus Disease 2019-Associated Hospitalization Surveillance Network (COVID-NET) shows that rates of COVID-19-associated hospitalizations are increasing for people of all ages. Rates of COVID-19-associated hospitalizations in adults 18 years and older have steadily increased over recent weeks, from 2.0 hospitalizations per 100,000 population for the week ending July 3, 2021, to 10.2 per 100,000 for the week ending August 7, 2021, a dramatic increase over a five-week period.

Trends in Rates of Hospitalizations in Adults Ages 18 Years and Older


resize iconView Larger
The Coronavirus Disease 2019 (COVID-19)-Associate­­d Hospitalization Surveillance Network (COVID-NET) is an additional source for hospitalization data collected through a network of more than 250 acute-care hospitals in 14 states (representing ~10% of the U.S. population). Detailed data on patient demographics, including race/ethnicity, underlying medical conditions, medical interventions, and clinical outcomes, are standardized case reporting form.
More COVID-NET Data

Deaths


The current 7-day moving average of new deaths (864) has increased 11.0% compared with the previous 7-day moving average (779). The current 7-day moving average is 28.8% lower compared to the peak observed on July 31, 2020 (1,214). The current 7-day moving average is 76.3% lower than the peak observed on January 13, 2021 (3,643) and is 354.5% higher than the lowest value observed on July 10, 2021 (190). As of August 25, 2021, a total of 631,440 COVID-19 deaths have been reported in the United States.

631,440
Total Deaths Reported

864
Current 7-Day Average*

779
Prior 7-Day Average

+11.0%
Change in 7-Day Average Since Prior Week

*Historical deaths are excluded from the daily new deaths and 7-day average calculations until they are incorporated into the dataset by their applicable date. Of 6,955 historical deaths reported retroactively, 181 were reported in the current week and 37 were reported in the prior week.

Daily Trends in Number of COVID-19 Deaths in the United States Reported to CDC
red-line.jpg

7-Day moving average

resize iconView Larger
More Death Data


Recent CDC COVID-19 Publications
  1. Effectiveness of COVID-19 Vaccines in Preventing SARS-CoV-2 Infection Among Frontline Workers Before and During B.1.617.2 (Delta) Variant Predominance — Eight U.S. Locations, December 2020–August 2021
  2. SARS-CoV-2 Infections and Hospitalizations Among Persons Aged ≥16 Years, by Vaccination Status — Los Angeles County, California, May 1–July 25, 2021
  3. Mental Health and Substance Use Among Adults with Disabilities During the COVID-19 Pandemic — United States, February–March 2021
  4. New COVID-19 Cases and Hospitalizations Among Adults, by Vaccination Status — New York, May 3–July 25, 2021
  5. Sustained Effectiveness of Pfizer-BioNTech and Moderna Vaccines Against COVID-19 Associated Hospitalizations Among Adults — United States, March–July 2021
  6. Effectiveness of Pfizer-BioNTech and Moderna Vaccines in Preventing SARS-CoV-2 Infection Among Nursing Home Residents Before and During Widespread Circulation of the SARS-CoV-2 B.1.617.2 (Delta) Variant — National Healthcare Safety Network, March 1–August 1, 2021
https://www.cdc.gov/coronavirus/2019-ncov/covid-data/covidview/index.html
 
covid-tracker-header-lrg.jpg
Testing, Testing: School Edition


Print
Subscribe to the Weekly Review


Interpretive Summary for September 3, 2021
Testing, Testing: School Edition


A recent CDC study shows that the Delta variant can spread rapidly in schools when unvaccinated teachers and staff have close, indoor contact with unvaccinated children. While children have been less affected by COVID-19 compared with adults, they can get sick with COVID-19 and can spread it to others. A second CDC study shows that rates of COVID-19-associated hospitalizations in children and adolescents increased following the rise of the Delta variant in the United States. Prevention strategies, including vaccination of school staff and eligible students, universal indoor masking, staying home when sick, and routine testing, are critical to schools reopening and operating safely.

Many people with COVID-19 don’t have symptoms but can still spread the virus. With regular testing, people can learn their COVID-19 status and use prevention measures before they spread the virus to others. This is especially important for children under 12 years old who are not yet eligible for vaccination. Finding out who has the virus early means that steps can be taken to prevent COVID-19 from spreading and causing an outbreak, which helps schools stay open. Regular testing also means parents or guardians get notified if their child tests positive, allowing them to plan for treatment and to quarantine or isolate as needed.

Safely returning to in-person instruction this fall is a priority because students benefit from learning in the classroom. Vaccination is the leading public health prevention strategy to end the COVID-19 pandemic, but children under 12 years are not yet eligible for COVID-19 vaccination. To keep school communities safe and to maintain in-person instruction, CDC recommends schools layer multiple prevention strategies. These include universal indoor masking, physical distancing, hand washing, and vaccination for all eligible people. Regular testing, in addition to other important prevention measures, will help keep students in the classroom and will allow them to participate in the other activities they enjoy.

Note to readers: CDC’s COVID Data Tracker’s new Pediatric Data page shows data and visualizations for children at the national, state, and community level. Data and maps highlighting COVID-19 trends in children ages 0-17 years can help demonstrate the impact of the pandemic on this age group. These data are important for understanding how children are affected by COVID-19. Data can also inform the actions needed to prevent the spread of COVID-19 among children and those who interact with them.


Reported Cases


The current 7-day moving average of daily new cases (153,246) increased 4.9% compared with the previous 7-day moving average (146,087). The current 7-day moving average is 123.6% higher than the value observed approximately one year ago (68,533 new cases on July 20, 2020). The current 7-day moving average is 39.7% lower than the peak observed on January 10, 2021 (253,948) and is 1,217.0% higher than the lowest value observed on June 18, 2021 (11,636). A total of 39,488,866 COVID-19 cases have been reported as of September 1, 2021.

39,488,866
Total Cases Reported

153,246
Current 7-Day Average*

146,087
Prior 7-Day Average

+4.9%
Change in 7-Day Average since Prior Week

*Historical cases are excluded from daily new cases and 7-day average calculations until they are incorporated into the dataset for the applicable date. Of 104,097 historical cases reported retroactively, 4,575 were reported in the current week and 5,042 were reported in the prior week.

Daily Trends in COVID-19 Cases in the United States Reported to CDC
red-line.jpg

7-Day moving average

resize iconView Larger
More Case Data


SARS-CoV-2 Variants


Multiple variants of the virus that causes COVID-19 are circulating globally, including within the United States. Currently, four variants are classified as a variant of concern (VOC). Nowcast estimates* of COVID-19 cases caused by these VOCs for the week ending August 28, 2021, are summarized here. Nationally, the combined proportion of cases attributed to Delta is estimated to be greater than 99%. The national proportions of Alpha, Beta, and Gamma are estimated to be well below 0.5%. Nowcast estimates that Delta will continue to be the predominant variant circulating in all 10 U.S. Department of Health and Human Services (HHS) regions, circulating at greater than 99%. The proportions of Alpha, Beta, and Gamma are estimated to be well below 0.5% in all HHS regions.

*The median time from specimen collection to sequence data reporting is about 3 weeks. As a result, weighted estimates for the most recent few weeks may be unstable or unavailable. CDC’s Nowcast is a data projection tool that helps fill this gap by generating timely estimates of variant proportions for variants that are circulating in the United States. View Nowcast estimates on CDC’s COVID Data Tracker website on the Variant Proportions page.

*Note: Scientists monitor but may classify certain ones as variants of interest, concern, or high consequence based on how easily they spread, how severe their symptoms are, and how they are treated.

SARS-CoV-2 Variants Circulating in the United States

resize iconView Larger

resize iconView Larger
More Variants Data


Testing


The percentage of COVID-19 NAATs (nucleic acid amplification tests)* that are positive (percent positivity) has decreased from the previous week. The 7-day average of percent positivity from NAATs is now 9.6%. The 7-day average number of tests reported for August 20 –August 26, 2021, was 1,391,645, up 4.1% from 1,336,203 for the prior 7 days.

528,875,293
Total Tests Reported

1,391,645
7-Day Average Tests Reported

9.6%
7-Day Average % Positivity

10.4%
Previous 7-Day Average % Positivity

-7.7%
Change in 7-Day Average % Positivity since Prior Week

*Test for SARS-CoV-2, the virus that causes COVID-19

COVID-19 NAAT Laboratory Test 7-day Percent Positivity by State/Territory

resize iconView Larger
More Testing Dataexternal icon


Vaccinations


The U.S. COVID-19 Vaccination Program began December 14, 2020. As of September 2, 2021, 372.1 million vaccine doses have been administered. Overall, about 205.9 million people, or 62% of the total U.S. population, have received at least one dose of vaccine. About 175 million people, or 52.7% of the total U.S. population, have been fully vaccinated.* As of September 2, 2021, the 7-day average number of administered vaccine doses reported (by date of CDC report) to CDC per day was 906,992, a 3.33% increase from the previous week.

CDC’s COVID Data Tracker Vaccination Demographic Trends tab shows vaccination trends by age group. As of September 2, 2021, 92.2% of people ages 65 years or older have received at least one dose of vaccine and 81.9% are fully vaccinated. Over two-thirds (74.5%) of people ages 18 years or older have received at least one dose of vaccine and 63.7% are fully vaccinated. For people ages 12 years or older, 72.5% have received at least one dose of vaccine and 61.7% are fully vaccinated.

372,116,617
Vaccines Administered

205,911,640
People who received at least one dose

174,973,937
People who are fully vaccinated*

62%
Percentage of the US population that has received at least one dose

52.7%
Percentage of the US population that has been fully vaccinated*

+0.9
Percentage point increase from last week

+0.8
Percentage point increase from last week

*Represents the number of people who have received the second dose in a two-dose COVID-19 vaccine series (such as the Pfizer or Moderna vaccines),) or one dose of the single-shot Johnson & Johnson’s Janssen vaccine.

Daily Change in the Total Number of Administered COVID-19 Vaccine Doses Reported to CDC by the Date of CDC Report, United States


red-line.jpg

7-Day moving average

resize iconView Larger
More Vaccination Data


Hospitalizations

New Hospital Admissions


The current 7-day daily average for August 25–August 31, 2021, was 12,156. This is a 1.7% decrease from the prior 7-day average (12,367) from August 18–August 24, 2021.

2,759,911
Total New Admissions

12,156
Current 7-Day Average

12,367
Prior 7-Day Average

-1.7%
Change in 7-Day Average

The start of consistent reporting of hospital admissions data was August 1, 2020.

Daily Trends in Number of New COVID-19 Hospital Admissions in the United States

resize iconView Larger
New admissions are pulled from a 10 am EST snapshot of the HHS Unified Hospital Timeseries Dataset. Due to potential reporting delays, data from the most recent 7 days, as noted in the figure above with the grey bar, should be interpreted with caution. Small shifts in historic data may also occur due to changes in the Centers for Medicare and Medicaid Services (CMS) Provider of Services file, which is used to identify the cohort of included hospitals.

More Hospital Data


COVID-NET: Trends in Hospitalization Rates in Children and Adolescents Aged <18 Years


CDC’s Coronavirus Disease 2019-Associated Hospitalization Surveillance Network (COVID-NET) shows that rates of COVID-19-associated hospitalizations have risen rapidly for children and adolescents younger than 18 years old. Weekly rates of COVID-19-associated hospitalizations per 100,000 children and adolescents younger than 18 years old increased nearly five-fold, from 0.3 during the week ending June 26, 2021, to 1.4 during the week ending August 14, 2021. The sharpest increase during this period occurred among children aged 0-4 years, for whom the rate per 100,000 children during the week ending August 14, 2021 (1.9) was nearly 10 times that during the week ending June 26, 2021 (0.2).

Additional information on COVID-19-associated hospitalizations in children and adolescents younger than 18 years old can be found in a new report using COVID-NET data here.

Trends in Hospitalization Rates in Children and Adolescents Aged <18 Years


resize iconView Larger
The Coronavirus Disease 2019 (COVID-19)-Associate­­d Hospitalization Surveillance Network (COVID-NET) is an additional source for hospitalization data collected through a network of more than 250 acute-care hospitals in 14 states (representing ~10% of the U.S. population). Detailed data on patient demographics, including race/ethnicity, underlying medical conditions, medical interventions, and clinical outcomes, are standardized case reporting form.
More COVID-NET Data

Deaths


The current 7-day moving average of new deaths (1,047) has increased 3.7% compared with the previous 7-day moving average (1,010). The current 7-day moving average is 13.8% lower compared to the peak observed on July 31, 2020 (1,214). The current 7-day moving average is 71.3% lower than the peak observed on January 13, 2021 (3,644) and is 449.7% higher than the lowest value observed on July 10, 2021 (190). As of September 1, 2021, a total of 641,725 COVID-19 deaths have been reported in the United States.

641,725
Total Deaths Reported

1,047
Current 7-Day Average*

1,010
Prior 7-Day Average

+3.7%
Change in 7-Day Average Since Prior Week

*Historical deaths are excluded from the daily new deaths and 7-day average calculations until they are incorporated into the dataset by their applicable date. Of 7,169 historical deaths reported retroactively, 227 were reported in the current week and 154 were reported in the prior week.

Daily Trends in Number of COVID-19 Deaths in the United States Reported to CDC
red-line.jpg

7-Day moving average

resize iconView Larger
More Death Data


Recent CDC COVID-19 Publications
  1. Epidemiologically Linked COVID-19 Outbreaks at a Youth Camp and Men’s Conference — Illinois, June–July 2021
  2. Association Between COVID-19 and Myocarditis Using Hospital-Based Administrative Data — United States, March 2020–January 2021
  3. COVID-19 Vaccination Coverage Among Adolescents Aged 12–17 Years — United States, December 14, 2020–July 31, 2021
  4. Outbreak Associated with SARS-CoV-2 B.1.617.2 (Delta) Variant in an Elementary School — Marin County, California, May–June 2021
  5. COVID-19 Case Rates in Transitional Kindergarten Through Grade 12 Schools and in the Community — Los Angeles County, California, September 2020–March 2021
  6. Multiple Variants of SARS-CoV-2 in a University Outbreak After Spring Break — Chicago, Illinois, March–May 2021
  7. National, Regional, State, and Selected Local Area Vaccination Coverage Among Adolescents Aged 13–17 Years — United States, 2020
  8. Screening Programs for SARS-CoV-2 Infections on a University Campus — Austin, Texas, September 30–November 30, 2020
  9. Hospitalizations Associated with COVID-19 Among Children and Adolescents — COVID-NET, 14 States, March 1, 2020–August 14, 2021
  10. Trends in COVID-19 cases, emergency department visits, and hospital admissions among children and adolescents aged 0-17 years — United States, August 2020–August 2021
Recent COVID Data Tracker Updates
Content source: National Center for Immunization and Respiratory Diseases


https://www.cdc.gov/coronavirus/2019-ncov/covid-data/covidview/past-reports/09032021.html
 
covid-tracker-header-lrg.jpg
COVID Data Tracker Weekly Review


Print
Subscribe to the Weekly Review


Interpretive Summary for September 10, 2021
An Ounce of Prevention


resize iconView Larger
The United States recently surpassed 40 million COVID-19 cases since the start of the pandemic, with more than 4 million of these cases reported in the past few weeks. COVID-19 cases, hospitalizations, and deaths have generally increased throughout most of the country since the beginning of summer, fueled by the spread of the highly contagious Delta variant. Low vaccination coverage in many communities is driving these increases.

Although most people with COVID-19 get better within the weeks following illness, some people experience post-COVID conditions. A recent CDC study shows that adults who had COVID-19 may experience ongoing health problems that can last four or more weeks after COVID-19 infection. Health problems may include shortness of breath, fatigue, difficulty concentrating (“brain-fog”), headache, fast-beating or pounding heart, cough, joint or muscle pain, dizziness/lightheadedness, or mood changes, among other symptoms. Even people who did not have significant COVID-19 symptoms in the days or weeks after they were infected can have post-COVID conditions.

The best way to prevent post-COVID conditions is by getting vaccinated against COVID-19 as soon as you can. CDC recommends all people ages 12 years and older get vaccinated, including people who have had COVID-19 or a post-COVID condition. The COVID-19 vaccines recommended for use in the United States continue to offer protection against severe illness, hospitalization, and death. If you are not yet fully vaccinated, you can reduce the risk of long-term complications by taking steps to protect yourself and others from getting COVID-19. To find a vaccine provider near you, visit Vaccines.gov or your state or local public health department website.

Note to readers: If you think you or someone you know may have a post-COVID condition, CDC has resources to help you prepare for a visit with your healthcare provider. CDC also has resources for people who are supporting a person with a post-COVID condition.


Reported Cases


The current 7-day moving average of daily new cases (136,558) decreased 12.7% compared with the previous 7-day moving average (156,341). The current 7-day moving average is 99.3% higher than the value observed approximately one year ago (68,527 new cases on July 20, 2020). The current 7-day moving average is 46.2% lower than the peak observed on January 10, 2021 (254,016) and is 1,076.0% higher than the lowest value observed on June 18, 2021 (11,613). A total of 40,523,954 COVID-19 cases have been reported as of September 8, 2021.

40,523,954
Total Cases Reported

136,558
Current 7-Day Average*

156,341
Prior 7-Day Average

-12.7%
Change in 7-Day Average since Prior Week

*Historical cases are excluded from daily new cases and 7-day average calculations until they are incorporated into the dataset for the applicable date. Of 110,609 historical cases reported retroactively, 6,516 were reported in the current week and 4,575 were reported in the prior week.

Daily Trends in COVID-19 Cases in the United States Reported to CDC
red-line.jpg

7-Day moving average

resize iconView Larger
More Case Data


SARS-CoV-2 Variants


Multiple variants of the virus that causes COVID-19 are circulating globally, including within the United States. Currently, four variants are classified as a variant of concern (VOC). Nowcast estimates* of COVID-19 cases caused by these VOCs for the week ending September 4, 2021, are summarized here. Nationally, the combined proportion of cases attributed to Delta is estimated to be greater than 99%. The national proportions of Alpha, Beta, and Gamma are estimated to be well below 0.5%. Nowcast estimates indicate that Delta will continue to be the predominant variant circulating in all 10 U.S. Department of Health and Human Services (HHS) regions, circulating at greater than 99%. The proportions of Alpha, Beta, and Gamma are estimated to be well below 0.5% in all HHS regions.

On August 30, 2021, the Mu (B.1.621) variant of the virus that causes COVID-19 was classified as a Variant of Interest (VOI) by the World Health Organization (WHO). CDC has not escalated this variant to a VOI in the United States, where the Mu variant reached its peak in late June (<5% of circulating variants) and has steadily decreased since. CDC scientists continue to study and monitor all variants and will continue to provide information when variants change classification in the United States. Sign up here to stay informed on updates to the Variant Classification and Definitions webpage.

*The median time from specimen collection to sequence data reporting is about 3 weeks. As a result, weighted estimates for the most recent few weeks may be unstable or unavailable. CDC’s Nowcast is a data projection tool that helps fill this gap by generating timely estimates of variant proportions for variants that are circulating in the United States. View Nowcast estimates on CDC’s COVID Data Tracker website on the Variant Proportions page.

SARS-CoV-2 Variants Circulating in the United States

resize iconView Larger

resize iconView Larger
More Variants Data


Testing


The percentage of COVID-19 NAATs (nucleic acid amplification tests)* that are positive (percent positivity) has decreased from the previous week. The 7-day average of percent positivity from NAATs is now 9.1%. The 7-day average number of tests reported for August 27-September 02, 2021, was 1,539,747, up 6.3% from 1,448,837 for the prior 7 days.

540,251,778
Total Tests Reported

1,539,747
7-Day Average Tests Reported

9.1%
7-Day Average % Positivity

9.7%
Previous 7-Day Average % Positivity

-5.5%
Change in 7-Day Average % Positivity since Prior Week

*Test for SARS-CoV-2, the virus that causes COVID-19

COVID-19 NAAT Laboratory Test 7-day Percent Positivity by State/Territory

resize iconView Larger
More Testing Dataexternal icon


Vaccinations


The U.S. COVID-19 Vaccination Program began December 14, 2020. As of September 9, 2021, 377.6 million vaccine doses have been administered. Overall, about 208.3 million people, or 62.7% of the total U.S. population, have received at least one dose of vaccine. About 177.4 million people, or 53.4% of the total U.S. population, have been fully vaccinated.* As of September 9, 2021, the 7-day average number of administered vaccine doses reported (by date of CDC report) to CDC per day was 786,493, a 13.3% decrease from the previous week.

CDC’s COVID Data Tracker Vaccination Demographic Trends tab shows vaccination trends by age group. As of September 9, 2021, 92.6% of people ages 65 years or older have received at least one dose of vaccine and 82.2% are fully vaccinated. Over three-quarters (75.3%) of people ages 18 years or older have received at least one dose of vaccine and 64.5% are fully vaccinated. For people ages 12 years or older, 73.4% have received at least one dose of vaccine and 62.5% are fully vaccinated.

377,622,065
Vaccines Administered

208,305,270
People who received at least one dose

177,433,044
People who are fully vaccinated*

62.7%
Percentage of the US population that has received at least one dose

53.4%
Percentage of the US population that has been fully vaccinated*

+0.7
Percentage point increase from last week

+0.7
Percentage point increase from last week

*Represents the number of people who have received the second dose in a two-dose COVID-19 vaccine series (such as the Pfizer or Moderna vaccines),) or one dose of the single-shot Johnson & Johnson’s Janssen vaccine.

Daily Change in the Total Number of Administered COVID-19 Vaccine Doses Reported to CDC by the Date of CDC Report, United States


red-line.jpg

7-Day moving average

resize iconView Larger
More Vaccination Data


Hospitalizations

New Hospital Admissions


The current 7-day daily average for September 1–September7, 2021, was 11,754 This is a 4.1% decrease from the prior 7-day average (12,251) from August 25–August 31, 2021.

2,842,496
Total New Admissions

11,754
Current 7-Day Average

12,251
Prior 7-Day Average

-4.1%
Change in 7-Day Average

The start of consistent reporting of hospital admissions data was August 1, 2020.

Daily Trends in Number of New COVID-19 Hospital Admissions in the United States

resize iconView Larger
New admissions are pulled from a 10 am EST snapshot of the HHS Unified Hospital Timeseries Dataset. Due to potential reporting delays, data from the most recent 7 days, as noted in the figure above with the grey bar, should be interpreted with caution. Small shifts in historic data may also occur due to changes in the Centers for Medicare and Medicaid Services (CMS) Provider of Services file, which is used to identify the cohort of included hospitals.

More Hospital Data


COVID-NET: Trends in Hospitalization Rates in Children and Adolescents Aged 5–11 Years


CDC’s Coronavirus Disease 2019-Associated Hospitalization Surveillance Network (COVID-NET) shows that rates of COVID-19-associated hospitalizations have risen rapidly for children and adolescents younger than 18 years old. Weekly rates of COVID-19-associated hospitalizations per 100,000 children ages 5 to 11 years have tripled over a recent 8-week period, from 0.3 per 100,000 children during the week ending June 26, 2021, to 0.9 per 100,000 children during the week ending August 21, 2021. These recent rates of COVID-19-associated hospitalization are the highest seen for this age group during the pandemic.

Additional information on COVID-19-associated hospitalizations in children and adolescents younger than 18 years old can be found in a new report using COVID-NET data here.

Trends in Hospitalization Rates in Children and Adolescents Aged 5–11 Years


resize iconView Larger
The Coronavirus Disease 2019 (COVID-19)-Associate­­d Hospitalization Surveillance Network (COVID-NET) is an additional source for hospitalization data collected through a network of more than 250 acute-care hospitals in 14 states (representing ~10% of the U.S. population). Detailed data on patient demographics, including race/ethnicity, underlying medical conditions, medical interventions, and clinical outcomes, are standardized case reporting form.
More COVID-NET Data

Deaths


The current 7-day moving average of new deaths (1,077) has decreased 11.3% compared with the previous 7-day moving average (1,214). The current 7-day moving average is 11.1% lower compared to the peak observed on July 31, 2020 (1,211). The current 7-day moving average is 70.5% lower than the peak observed on January 13, 2021 (3,644) and is 463.4% higher than the lowest value observed on July 10, 2021 (191). As of September 8, 2021, a total of 652,480 COVID-19 deaths have been reported in the United States.

652,480
Total Deaths Reported

1,077
Current 7-Day Average*

1,214
Prior 7-Day Average

-11.3%
Change in 7-Day Average Since Prior Week

*Historical deaths are excluded from the daily new deaths and 7-day average calculations until they are incorporated into the dataset by their applicable date. Of 7,391 historical deaths reported retroactively, 229 were reported in the current week and 227 were reported in the prior week.

Daily Trends in Number of COVID-19 Deaths in the United States Reported to CDC
red-line.jpg

7-Day moving average

resize iconView Larger
More Death Data


Recent CDC COVID-19 Publications
  1. Long-Term Symptoms Among Adults Tested for SARS-CoV-2 — United States, January 2020–April 2021
  2. Using Wastewater Surveillance Data to Support the COVID-19 Response — United States, 2020–2021
  3. SARS-CoV-2 Transmission to Masked and Unmasked Close Contacts of University Students with COVID-19 — St. Louis, Missouri, January–May 2021
  4. Trends in COVID-19 Cases, Emergency Department Visits, and Hospital Admissions Among Children and Adolescents Aged 0–17 Years — United States, August 2020–August 2021
  5. Hospitalizations Associated with COVID-19 Among Children and Adolescents — COVID-NET, 14 States, March 1, 2020–August 14, 2021
Recent COVID Data Tracker Updates
  • A new Pediatric Data page catalogs all pediatric data available on COVID Data Tracker and provides cross-links to additional resources and recommendations
  • Updated text and visualizations on the Vaccination among People with Disabilities tab
  • Updated data and text on the Birth and Infant Outcomes tab
  • Addition of the National Post-acute and Long-term Care Study (NPALS): Preliminary data from the Adult Day Services Centers (ADSC) and Residential Care Communities (RCC) components to the About Healthcare Data Page
https://www.cdc.gov/coronavirus/2019-ncov/covid-data/covidview/index.html
 
covid-tracker-header-lrg.jpg
COVID Data Tracker Weekly Review


Print
Subscribe to the Weekly Review


Interpretive Summary for September 17, 2021
Vaccinations > Variants


SARS-CoV-2 Variants Circulating in the United States

resize iconView Larger
After experiencing a brief decline in COVID-19 cases, the United States is once again seeing an increase in cases in most of the country. This recent increase follows a previous summer surge that was fueled by the highly contagious Delta (B.1.617.2) variant and low vaccination coverage in many communities. COVID-19 vaccines offer strong protection against serious illness and death. High vaccination coverage is proven to reduce the spread of the virus. The less a virus spreads, the less opportunity there is for new variants to emerge.

The virus that causes COVID-19 constantly changes, or mutates, producing new variants of the virus. The Delta variant continues to be the predominant strain in the United States, making up more than 99% of cases. On August 30, 2021, the World Health Organizationexternal icon classified the Mu (B.1.621) variant as a Variant of Interest (VOI). CDC has not designated Mu as a VOI at this time. The Mu variant reached a peak in the United States in late June 2021 and has steadily declined since then.* CDC continues to study and monitor all known variants and will continue to provide information when variants change classification in the United States.

Getting vaccinated is the best way to protect yourself, your family, and your community. It is also the best way to prevent new variants from emerging. A recent CDC study found that people who were not fully vaccinated had about 10 times the risk of being hospitalized with or dying from COVID-19 compared with people who were fully vaccinated. CDC recommends that everyone in the United States 12 years and older get vaccinated as soon as possible. To find a vaccine provider near you, visit Vaccines.gov or your state or local public health department website.

*At its peak, Mu made up less than 5% of all variants circulating in the United States. Currently, Mu makes up less than 1% of all COVID-19 cases in the United States.

Note to readers: CDC scientists continue to study and monitor the Mu variant and will continue to provide information when variants change classification in the United States. Sign up here to stay informed on updates to the Variant Classification and Definitions webpage.


Reported Cases


The current 7-day moving average of daily new cases (146,182) increased 6.1% compared with the previous 7-day moving average (137,783). A total of 41,593,179 COVID-19 cases have been reported as of September 15, 2021.

41,593,179
Total Cases Reported

146,182
Current 7-Day Average*

137,783
Prior 7-Day Average

6.1%
Change in 7-Day Average since Prior Week

*Historical cases are excluded from daily new cases and 7-day average calculations until they are incorporated into the dataset for the applicable date. Of 116,408 historical cases reported retroactively, 5,796 were reported in the current week and 6,516 were reported in the prior week.

Daily Trends in COVID-19 Cases in the United States Reported to CDC
red-line.jpg

7-Day moving average

resize iconView Larger
More Case Data


SARS-CoV-2 Variants


Multiple variants of the virus that causes COVID-19 are circulating globally, including within the United States. Currently, four variants are classified as a variant of concern (VOC). Nowcast estimates*of COVID-19 cases caused by these VOCs for the week ending September 11, 2021, are summarized here. Nationally, the combined proportion of cases attributed to Delta is estimated to be greater than 99%. The national proportions of Alpha, Beta, and Gamma are estimated to be less than 0.1%. Nowcast estimates indicate that Delta will continue to be the predominant variant circulating in all 10 U.S. Department of Health and Human Services (HHS) regions, circulating at greater than 99%. The proportions of Alpha, Beta, and Gamma are estimated to be less than or equal to 0.1% in all HHS regions.

*The median time from specimen collection to sequence data reporting is about 3 weeks. As a result, weighted estimates for the most recent few weeks may be unstable or unavailable. CDC’s Nowcast is a data projection tool that helps fill this gap by generating timely estimates of variant proportions for variants that are circulating in the United States. View Nowcast estimates on CDC’s COVID Data Tracker website on the Variant Proportions page.

SARS-CoV-2 Variants Circulating in the United States

resize iconView Larger

resize iconView Larger
More Variants Data


Testing


The percentage of COVID-19 NAATs (nucleic acid amplification tests)* that are positive (percent positivity) has decreased from the previous week. The 7-day average of percent positivity from NAATs is now 8.9%. The 7-day average number of tests reported for September 3–September 9, 2021, was 1,394,082, down 14.1% from 1,623,346 for the prior 7 days.

551,805,555
Total Tests Reported

1,394,082
7-Day Average Tests Reported

8.9%
7-Day Averae % Positivity

9.1%
Previous 7-Day Average % Positivity

-1.8%
Change in 7-Day Average % Positivity since Prior Week

*Test for SARS-CoV-2, the virus that causes COVID-19

COVID-19 NAAT Laboratory Test 7-day Percent Positivity by State/Territory

resize iconView Larger
More Testing Dataexternal icon


Vaccinations


The U.S. COVID-19 Vaccination Program began December 14, 2020. As of September 16, 2021, 383 million vaccine doses have been administered. Overall, about 210.7 million people, or 63.5% of the total U.S. population, have received at least one dose of vaccine. About 180.1 million people, or 54.2% of the total U.S. population, have been fully vaccinated.* As of September 16, 2021, the 7-day average number of administered vaccine doses reported (by date of CDC report) to CDC per day was 773,763, a 1.6% decrease from the previous week.

CDC’s COVID Data Tracker Vaccination Demographic Trends tab shows vaccination trends by age group. As of September 16, 2021, 93% of people ages 65 years or older have received at least one dose of vaccine and 82.7% are fully vaccinated. Over three-quarters (76.1%) of people ages 18 years or older have received at least one dose of vaccine and 65.4% are fully vaccinated. For people ages 12 years or older, 74.2% have received at least one dose of vaccine and 63.5% are fully vaccinated.

383,038,403
Vaccines Administered

210,700,361
People who received at least one dose

180,086,143
People who are fully vaccinated*

63.5%
Percentage of the US population that has received at least one dose

54.2%
Percentage of the US population that has been fully vaccinated*

+0.8
Percentage point increase from last week

+0.8
Percentage point increase from last week

*Represents the number of people who have received the second dose in a two-dose COVID-19 vaccine series (such as the Pfizer or Moderna vaccines),) or one dose of the single-shot Johnson & Johnson’s Janssen vaccine.

Daily Change in the Total Number of Administered COVID-19 Vaccine Doses Reported to CDC by the Date of CDC Report, United States
red-line.jpg

7-Day moving average

resize iconView Larger
More Vaccination Data


Hospitalizations

New Hospital Admissions


The current 7-day daily average for September 8–September 14, 2021, was 11,165. This is a 5.7% decrease from the prior 7-day average (11,836) from September 1–September 7, 2021.

2,920,532
Total New Admissions

11,165
Current 7-Day Average

11,836
Prior 7-Day Average

-5.7%
Change in 7-Day Average

The start of consistent reporting of hospital admissions data was August 1, 2020.

Daily Trends in Number of New COVID-19 Hospital Admissions in the United States

resize iconView Larger
New admissions are pulled from a 10 am EST snapshot of the HHS Unified Hospital Timeseries Dataset. Due to potential reporting delays, data from the most recent 7 days, as noted in the figure above with the grey bar, should be interpreted with caution. Small shifts in historic data may also occur due to changes in the Centers for Medicare and Medicaid Services (CMS) Provider of Services file, which is used to identify the cohort of included hospitals.

More Hospital Data


COVID-NET: Trends in Hospitalization Rates in Children Ages 11 Years and Younger Not Eligible for Vaccination


CDC’s Coronavirus Disease 2019-Associated Hospitalization Surveillance Network (COVID-NET) shows that hospitalization rates are increasing, including rates in children ages 11 years and younger. Recent weekly rates of COVID-19-associated hospitalizations for these children are the highest they have ever been. Weekly rates in children ages 4 years and younger for the week ending August 28, 2021, are 2.4 per 100,000. Rates in children ages 5–11 years are 0.9 per 100,000 for weeks ending August 9 and August 21, 2021. Unlike adults, children younger than 12 years of age are not yet eligible for any of the available COVID-19 vaccines.

Trends in Hospitalization Rates in Children Ages 11 Years and Younger Not Eligible for Vaccination


resize iconView Larger
The Coronavirus Disease 2019 (COVID-19)-Associate­­d Hospitalization Surveillance Network (COVID-NET) is an additional source for hospitalization data collected through a network of more than 250 acute-care hospitals in 14 states (representing ~10% of the U.S. population). Detailed data on patient demographics, including race/ethnicity, underlying medical conditions, medical interventions, and clinical outcomes, are standardized case reporting form.
More COVID-NET Data

Deaths


The current 7-day moving average of new deaths (1,448) has increased 17.4% compared with the previous 7-day moving average (1,233). As of September 15, 2021, a total of 666,440 COVID-19 deaths have been reported in the United States.

666,440
Total Deaths Reported

1,448
Current 7-Day Average*

1,233
Prior 7-Day Average

17.4%
Change in 7-Day Average Since Prior Week

*Historical deaths are excluded from the daily new deaths and 7-day average calculations until they are incorporated into the dataset by their applicable date. Of 7,633 historical deaths reported retroactively, 202 were reported in the current week and 253 were reported in the prior week.

Daily Trends in Number of COVID-19 Deaths in the United States Reported to CDC
red-line.jpg

7-Day moving average

resize iconView Larger
More Death Data


Recent CDC COVID-19 Publications
  1. Monitoring Incidence of COVID-19 Cases, Hospitalizations, and Deaths, by Vaccination Status — 13 U.S. Jurisdictions, April 4–July 17, 2021
  2. Interim Estimates of COVID-19 Vaccine Effectiveness Against COVID-19–Associated Emergency Department or Urgent Care Clinic Encounters and Hospitalizations Among Adults During SARS-CoV-2 B.1.617.2 (Delta) Variant Predominance — Nine States, June–August 2021
  3. Effectiveness of COVID-19 mRNA Vaccines Against COVID-19–Associated Hospitalization — Five Veterans Affairs Medical Centers, United States, February 1–August 6, 2021
  4. Disaggregating Data to Measure Racial Disparities in COVID-19 Outcomes and Guide Community Response — Hawaii, March 1, 2020–February 28, 2021
  5. Post-Acute Sequelae of SARS-CoV-2 Infection Among Adults Aged ≥18 Years — Long Beach, California, April 1–December 10, 2020
  6. Longitudinal Trends in Body Mass Index Before and During the COVID-19 Pandemic Among Persons Aged 2–19 Years — United States, 2018–2020
  7. Comparative Effectiveness of Moderna, Pfizer-BioNTech, and Janssen (Johnson & Johnson) Vaccines in Preventing COVID-19 Hospitalizations Among Adults Without Immunocompromising Conditions — United States, March–August 2021
Recent COVID Data Tracker Updates
https://www.cdc.gov/coronavirus/2019-ncov/covid-data/covidview/index.html
 
covid-tracker-header-lrg.jpg
COVID Data Tracker Weekly Review


Print
Subscribe to the Weekly Review


Interpretive Summary for September 24, 2021
Healthy Habits, Healthy Kids


resize iconView Larger


Fewer cases of COVID-19 have been reported in children (ages 0-17 years) compared with adults.[SUP]13[/SUP] Rates of COVID-19-associated hospitalizations are also lower in children than in adults. However, weekly rates of hospitalizations due to COVID-19 have recently increased in children ages 11 years and younger. In fact, these hospitalization rates are the highest they have been since the start of the pandemic. The increases come as many schools across the country have resumed in-person learning.

Because children can be affected by COVID-19 and have severe complications, schools are encouraged to implement CDC’s Guidance for COVID-19 Prevention in K-12 Schools to keep children safe. Consistent and correct mask use is a critical strategy to reduce the spread of COVID-19 among children in K-12 school settings. Two recent CDC studies found that counties without school mask requirements had higher increases in rates of COVID-19 cases in children than schools with mask requirements.[SUP]4,5[/SUP]

To prevent COVID-19 outbreaks in schools, CDC recommends layered prevention strategies, including universal indoor masking, screening testing, physical distancing, and vaccination. Everyone in the United States 12 years and older is eligible to receive a COVID-19 vaccine, yet vaccination coverage among children ages 12-17 years is lower than in older groups.[SUP]6 [/SUP]If you have questions about COVID-19 vaccines for children and teens, talk with your child’s doctor or preferred healthcare provider. In addition, children are better protected when the adults around them are vaccinated. To find a vaccine provider near you, visit Vaccines.gov or your state or local public health department website.

Note to readers: CDC’s COVID Data Tracker’s new Pediatric Data page shows data and visualizations for children at the national, state, and community level. Data and maps highlighting COVID-19 trends in children ages 0-17 years can help demonstrate the impact of the pandemic on this age group. These data are important for understanding how children are affected by COVID-19. Data can also inform the actions needed to prevent the spread of COVID-19 among children and those who interact with them.


Reported Cases


The current 7-day moving average of daily new cases (121,533) decreased 17.1% compared with the previous 7-day moving average (146,684). A total of 42,501,643 COVID-19 cases have been reported as of September 22, 2021.

42,501,643
Total Cases Reported

121,533
Current 7-Day Average*

146,684
Prior 7-Day Average

-17.1%
Change in 7-Day Average since Prior Week

*Historical cases are excluded from daily new cases and 7-day average calculations until they are incorporated into the dataset for the applicable date. Of 121,817 historical cases reported retroactively, 5,404 were reported in the current week and 5,796 were reported in the prior week.

Daily Trends in COVID-19 Cases in the United States Reported to CDC
red-line.jpg

7-Day moving average

resize iconView Larger
More Case Data


SARS-CoV-2 Variants


Currently, the Delta variant is the only variant classified as a variant of concern (VOC) in the United States. The U.S. Government SARS-CoV-2 Interagency Group recently downgraded the Alpha, Beta, and Gamma variants to Variants Being Monitored (VBM). These variants do not pose a significant and imminent risk to public health in the United States due to their very low prevalence, which is currently estimated to be less than 0.1%.

Nowcast projections* for the week ending September 18, 2021, estimate the national proportion of cases attributed to the Delta variant to be greater than 98%. Nowcast estimates indicate that Delta will continue to be the predominant variant circulating in all 10 U.S. Department of Health and Human Services (HHS) regions, circulating at greater than 98%.

*The median time from specimen collection to sequence data reporting is about 3 weeks. As a result, weighted estimates for the most recent few weeks may be unstable or unavailable. CDC’s Nowcast is a data projection tool that helps fill this gap by generating timely estimates of variant proportions for variants that are circulating in the United States. View Nowcast estimates on Variant Proportions page.

SARS-CoV-2 Variants Circulating in the United States

resize iconView Larger

resize iconView Larger
More Variants Data


Testing


The percentage of COVID-19 NAATs (nucleic acid amplification tests)* that are positive (percent positivity) has decreased from the previous week. The 7-day average of percent positivity from NAATs is now 7.6%. The 7-day average number of tests reported for September 10 –September 16, 2021, was 1,649,785, up 11.9% from 1,474,550 for the prior 7 days.

564,226,284
Total Tests Reported

1,649,785
7-Day Average Tests Reported

7.6%
7-Day Average % Positivity

8.5%
Previous 7-Day Average % Positivity

-10.8%
Change in 7-Day Average % Positivity since Prior Week

*Test for SARS-CoV-2, the virus that causes COVID-19

COVID-19 NAAT Laboratory Test 7-day Percent Positivity by State/Territory

resize iconView Larger
More Testing Dataexternal icon


Vaccinations


The U.S. COVID-19 Vaccination Program began December 14, 2020. As of September 23, 2021, 387.8 million vaccine doses have been administered. Overall, about 212.6 million people, or 64% of the total U.S. population, have received at least one dose of vaccine. About 182.6 million people, or 55% of the total U.S. population, have been fully vaccinated.* As of September 23, 2021, the 7-day average number of administered vaccine doses reported (by date of CDC report) to CDC per day was 683,329, a 11.7% decrease from the previous week.

CDC’s COVID Data Tracker Vaccination Demographic Trends tab shows vaccination trends by age group. As of September 23, 2021, 93.3% of people ages 65 years or older have received at least one dose of vaccine and 83% are fully vaccinated. Over three-quarters (76.7%) of people ages 18 years or older have received at least one dose of vaccine and 66.2% are fully vaccinated. For people ages 12 years or older, 74.9% have received at least one dose of vaccine and 64.3% are fully vaccinated.

387,821,704
Vaccines Administered

212,564,346
People who received at least one dose

182,587,334
People who are fully vaccinated*

64%
Percentage of the US population that has received at least one dose

55%
Percentage of the US population that has been fully vaccinated*

+0.5
Percentage point increase from last week

+0.8
Percentage point increase from last week

*Represents the number of people who have received the second dose in a two-dose COVID-19 vaccine series (such as the Pfizer or Moderna vaccines) or one dose of the single-shot Johnson & Johnson’s Janssen vaccine.

Daily Change in the Total Number of Administered COVID-19 Vaccine Doses Reported to CDC by the Date of CDC Report, United States
red-line.jpg

7-Day moving average

resize iconView Larger
More Vaccination Data


Hospitalizations

New Hospital Admissions


The current 7-day daily average for September 15–September 21, 2021, was 9,636. This is a 14.4% decrease from the prior 7-day average (11,255) from September 8–September 14, 2021.

2,988,684
Total New Admissions

9,636
Current 7-Day Average

11,255
Prior 7-Day Average

-14.4%
Change in 7-Day Average

The start of consistent reporting of hospital admissions data was August 1, 2020.

Daily Trends in Number of New COVID-19 Hospital Admissions in the United States

resize iconView Larger
New admissions are pulled from a 10 am EST snapshot of the HHS Unified Hospital Timeseries Dataset. Due to potential reporting delays, data from the most recent 7 days, as noted in the figure above with the grey bar, should be interpreted with caution. Small shifts in historic data may also occur due to changes in the Centers for Medicare and Medicaid Services (CMS) Provider of Services file, which is used to identify the cohort of included hospitals.

More Hospital Data


COVID-NET: Trends in Hospitalization Rates in Children Ages 5–11 Years Not Eligible for Vaccination


CDC’s Coronavirus Disease 2019-Associated Hospitalization Surveillance Network (COVID-NET) shows that hospitalization rates are increasing, including rates in school-aged children ages 5–11 years. Recent weekly rates of COVID-19-associated hospitalizations for these children are the highest they have ever been. Rates in children ages 5–11 years are 1.0 per 100,000 for the week ending September 4, 2021. Unlike adolescents ages 12–17 years, children ages 5–11 years are not yet eligible for any of the available COVID-19 vaccines.

Trends in Hospitalization Rates in Children Ages 5–11 Years Not Eligible for Vaccination


resize iconView Larger
The Coronavirus Disease 2019 (COVID-19)-Associate­­d Hospitalization Surveillance Network (COVID-NET) is an additional source for hospitalization data collected through a network of more than 250 acute-care hospitals in 14 states (representing ~10% of the U.S. population). Detailed data on patient demographics, including race/ethnicity, underlying medical conditions, medical interventions, and clinical outcomes, are standardized case reporting form.
More COVID-NET Data

Deaths


The current 7-day moving average of new deaths (1,557) has increased 0.7% compared with the previous 7-day moving average (1,545). As of September 22, 2021, a total of 680,688 COVID-19 deaths have been reported in the United States.

680,688
Total Deaths Reported

1,557
Current 7-Day Average*

1,545
Prior 7-Day Average

0.7%
Change in 7-Day Average Since Prior Week

*Historical deaths are excluded from the daily new deaths and 7-day average calculations until they are incorporated into the dataset by their applicable date. Of 7,899 historical deaths reported retroactively, 208 were reported in the current week; and 240 were reported in the prior week.

Daily Trends in Number of COVID-19 Deaths in the United States Reported to CDC
red-line.jpg

7-Day moving average

resize iconView Larger
More Death Data


References
  1. CDC. COVID Data Tracker: Demographic Trends of COVID-19 cases and deaths in the US reported to CDC. Atlanta, GA: US Department of Health and Human Services, CDC; 2021. https://covid.cdc.gov/covid-data-tracker/#demographics.
  2. Stokes EK, Zambrano LD, Anderson KN, et al. Coronavirus Disease 2019 Case Surveillance – United States, January 22-May 30, 2020. MMWR. 2020;69:759-765. doi:10.15585/mmwr.mm6924e2.
  3. Williams N, Radia T, Harman K, et al. COVID-19 Severe Acute Respiratory Syndrome Coronavirus 2 (SARS-CoV-2) Infection in Children and Adolescents: A Systematic Review of Critically Unwell Children and the Association With Underlying Comorbidities. Eur J Pediatr. 2020;10:1-9. doi:10.1007/s00431-020-03801-6external icon
  4. COVID-19 Pediatric Cases in Counties with and without School Mask Requirements — United States, July 1, 2021 to September 4, 2021
  5. Association Between K–12 School Mask Policies and School-Associated COVID-19 Outbreaks — Maricopa and Pima Counties, Arizona, July–August 2021
  6. CDC. COVID Data Tracker: Percent of People Receiving COVID-19 Vaccine by Age and Date Reported to CDC, United States. Atlanta, GA: US Department of Health and Human Services, CDC; 2021. https://covid.cdc.gov/covid-data-tra...raphics-trends.

Recent CDC COVID-19 Publications
  1. Use of Pfizer-BioNTech COVID-19 Vaccine in Persons Aged ≥16 Years: Recommendations of the Advisory Committee on Immunization Practices — United States, September 2021
  2. Outbreak of SARS-CoV-2 B.1.617.2 (Delta) Variant Infections Among Incarcerated Persons in a Federal Prison — Texas, July–August 2021
  3. COVID-19–Related School Closures and Learning Modality Changes — United States, August 1–September 17, 2021
  4. COVID-19 Pediatric Cases in Counties with and without School Mask Requirements — United States, July 1, 2021 to September 4, 2021
  5. Association Between K–12 School Mask Policies and School-Associated COVID-19 Outbreaks — Maricopa and Pima Counties, Arizona, July–August 2021
  6. Decreased Incidence of Infections Caused by Pathogens Transmitted Commonly Through Food During the COVID-19 Pandemic — Foodborne Diseases Active Surveillance Network, 10 U.S. Sites, 2017–2020
Recent COVID Data Tracker Updates
  • State-level metrics and links to new county datasets available on data.cdc.gov have been added to the County View tab
  • The Vaccination Among Pregnant People tab now shows the percent of people fully vaccinated prior to and during pregnancy, over time and by race/ethnicity
  • New bivariate map on the Vaccination Equity tab displays vaccination coverage by metro/non-metro status, by county
https://www.cdc.gov/coronavirus/2019-ncov/covid-data/covidview/index.html
 
Back
Top Bottom