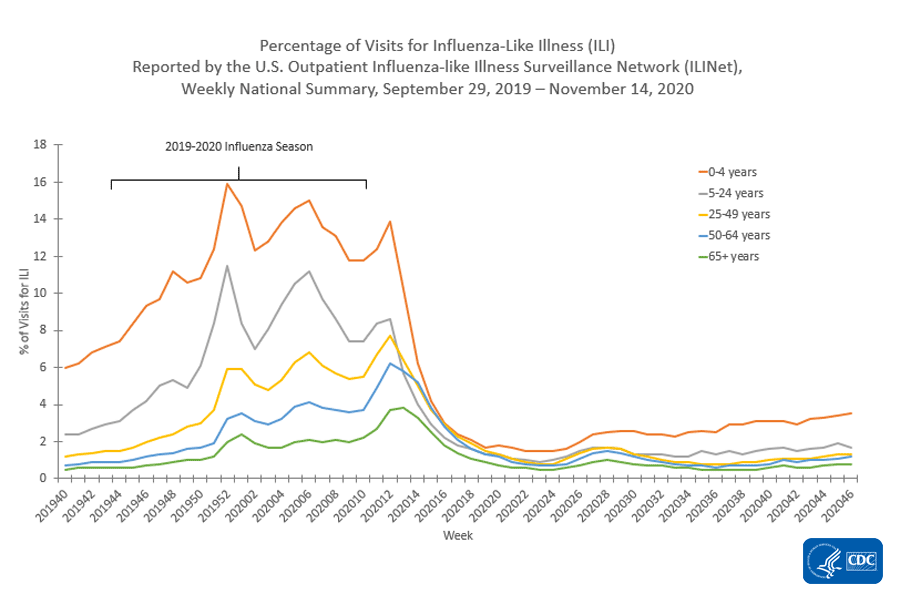
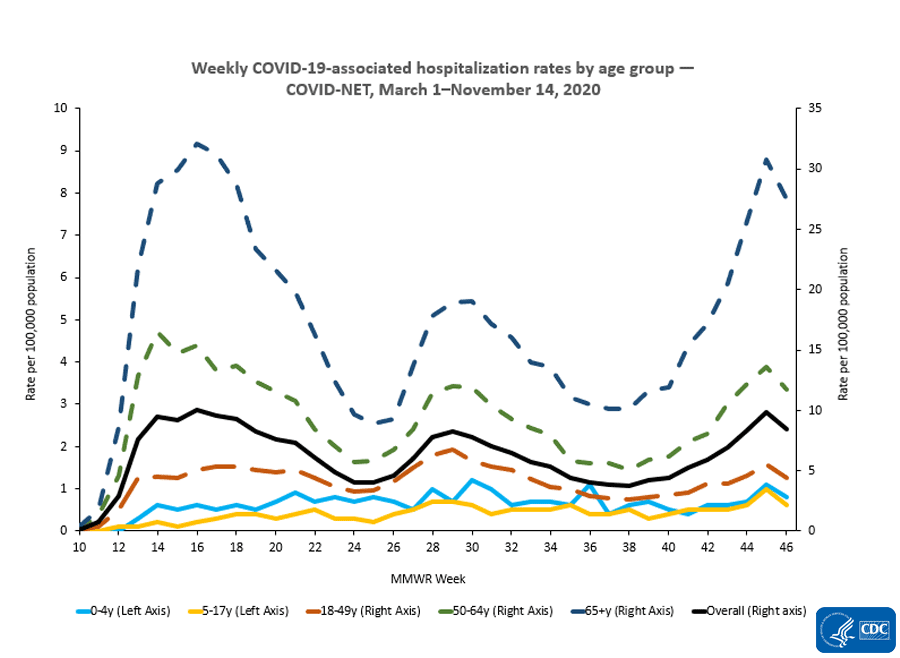
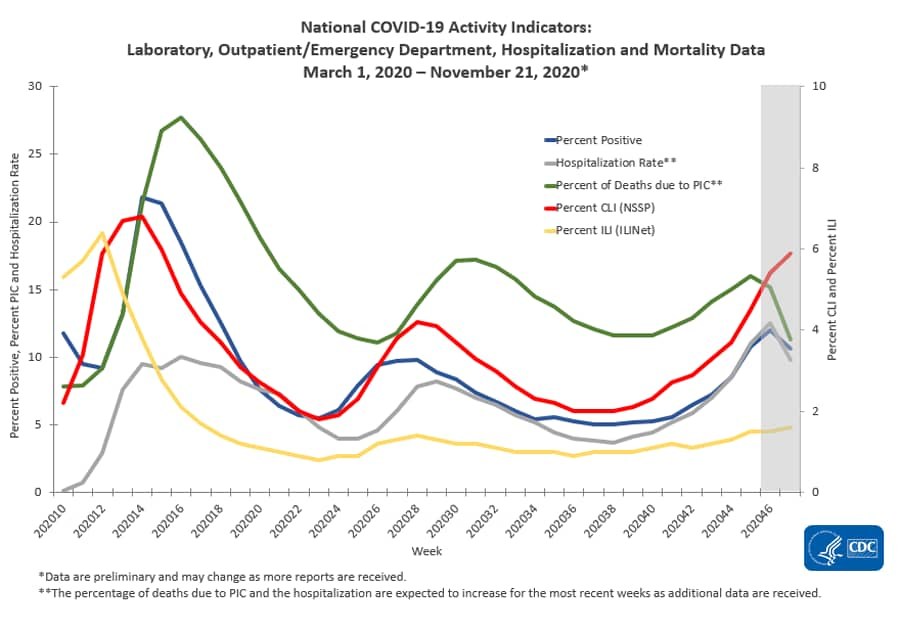
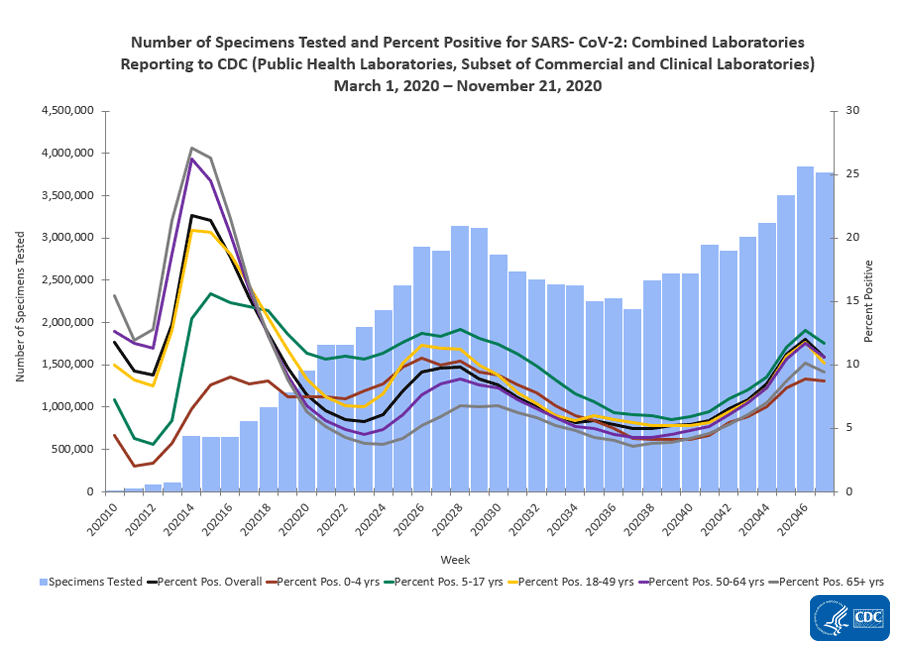
• FluTrackers.com Inc. does not provide medical advice. Information on this web site is collected from various internet resources, and the FluTrackers board of directors makes no warranty to the safety, efficacy, correctness or completeness of the information posted on this site by any author or poster. The information collated here is for instructional and/or discussion purposes only and is NOT intended to diagnose or treat any disease, illness, or other medical condition. Every individual reader or poster should seek advice from their personal physician/healthcare practitioner before considering or using any interventions that are discussed on this website. By continuing to access this website you agree to consult your personal physican before using any interventions posted on this website, and you agree to hold harmless FluTrackers.com Inc., the board of directors, the members, and all authors and posters for any effects from use of any medication, supplement, vitamin or other substance, device, intervention, etc. mentioned in posts on this website, or other internet venues referenced in posts on this website.
  • We are not asking for any donations. Do not donate to any entity who says they are raising funds for us.

US - CDC: COVIDView 2020/2021 - Not offered for exactness - Offered for trend analysis only

  1. CASES, DATA & SURVEILLANCE
COVIDView Summary ending on August 8, 2020


Updated Aug. 14, 2020
Print
Download Weekly Summary pdf icon[14 Pages, 1 MB]
Key Updates for Week 32, ending August 8, 2020


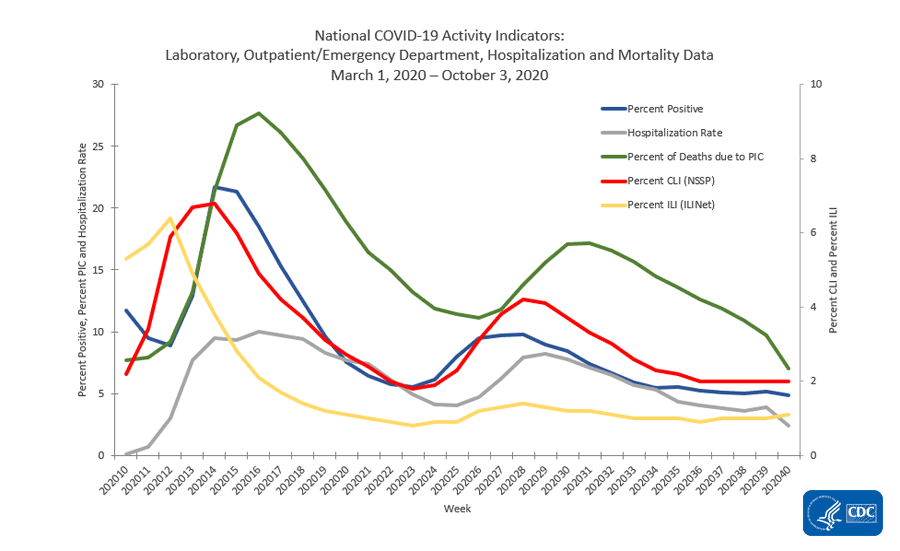
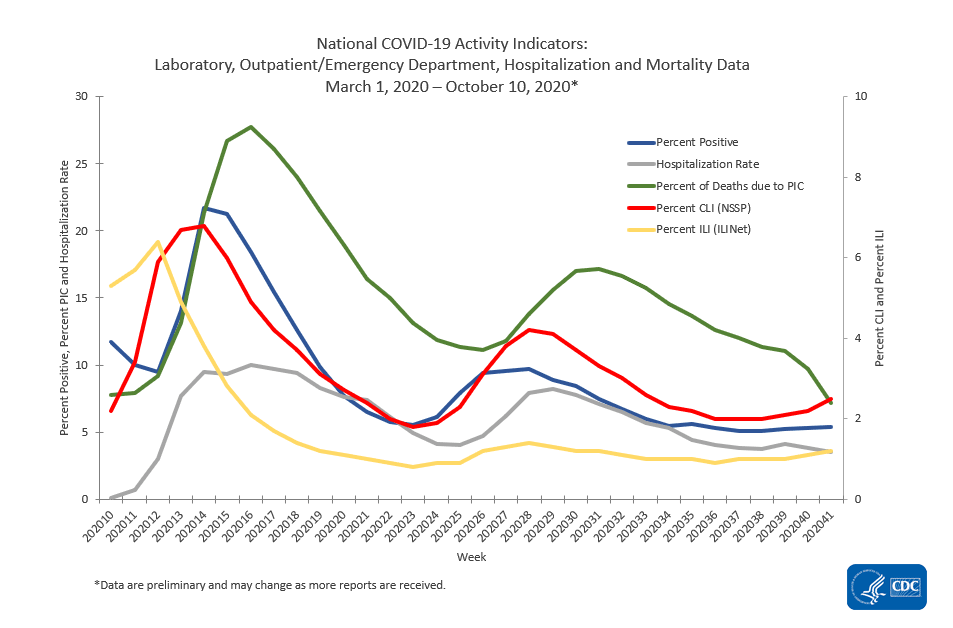
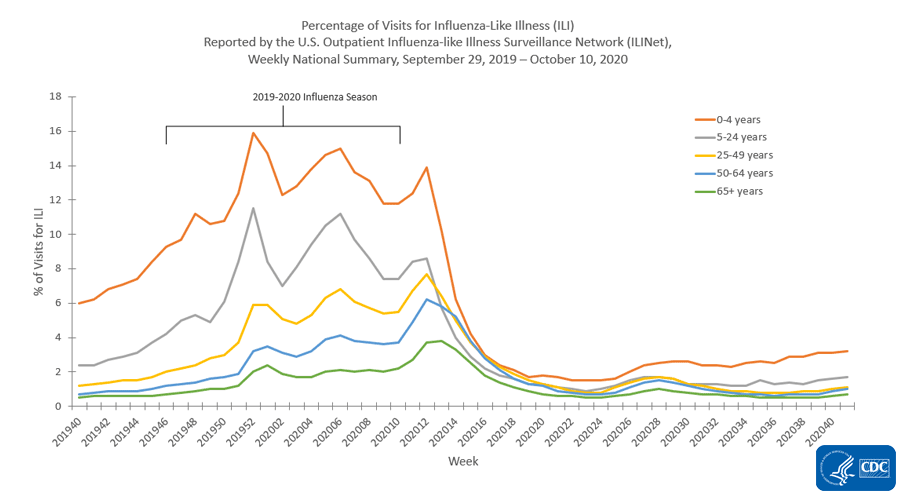
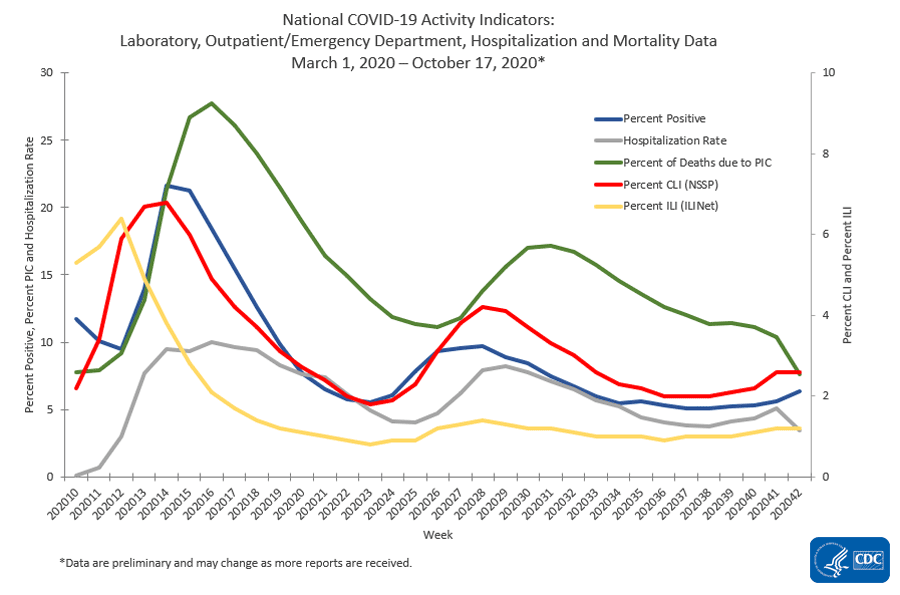
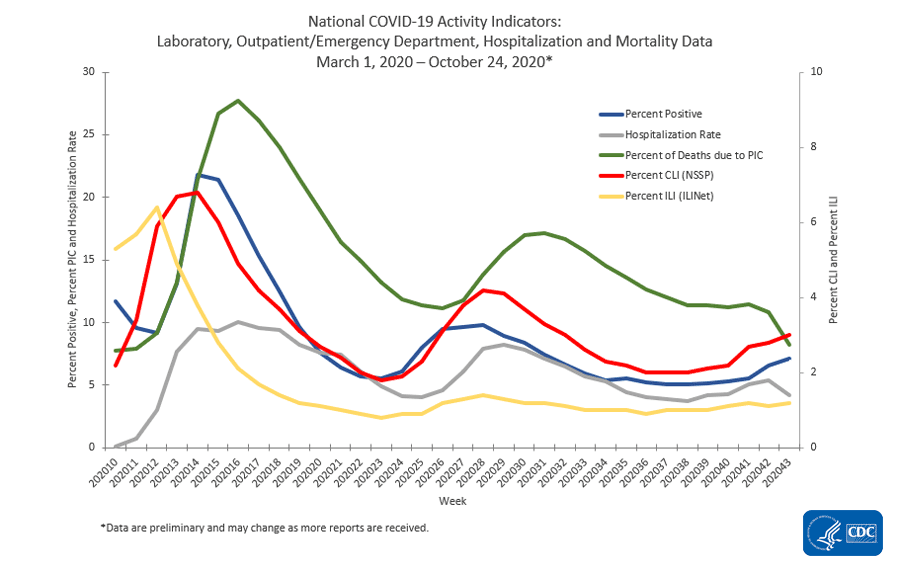
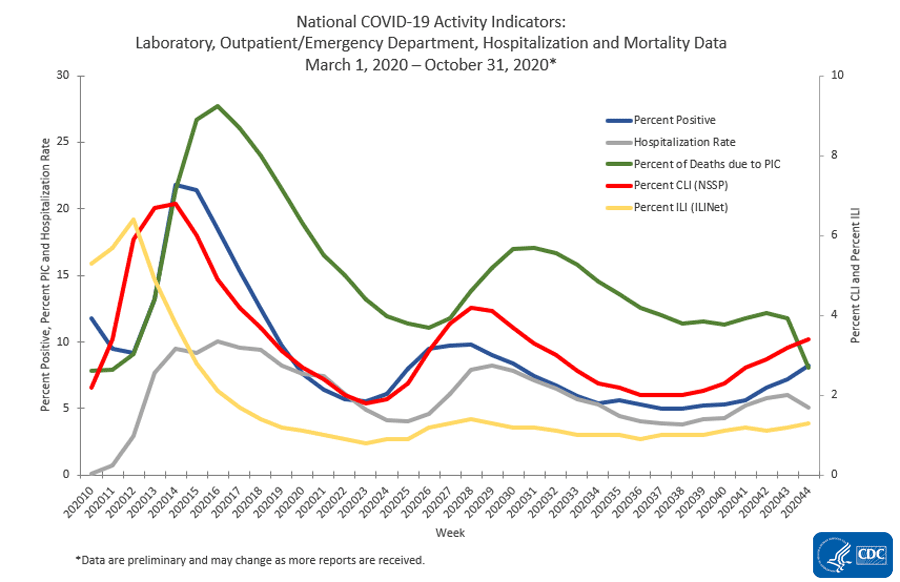
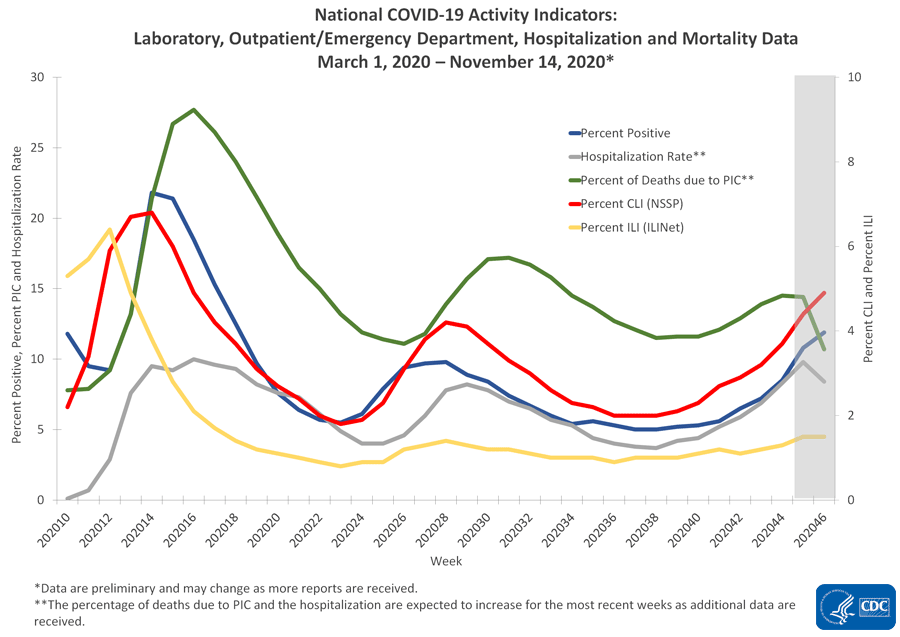
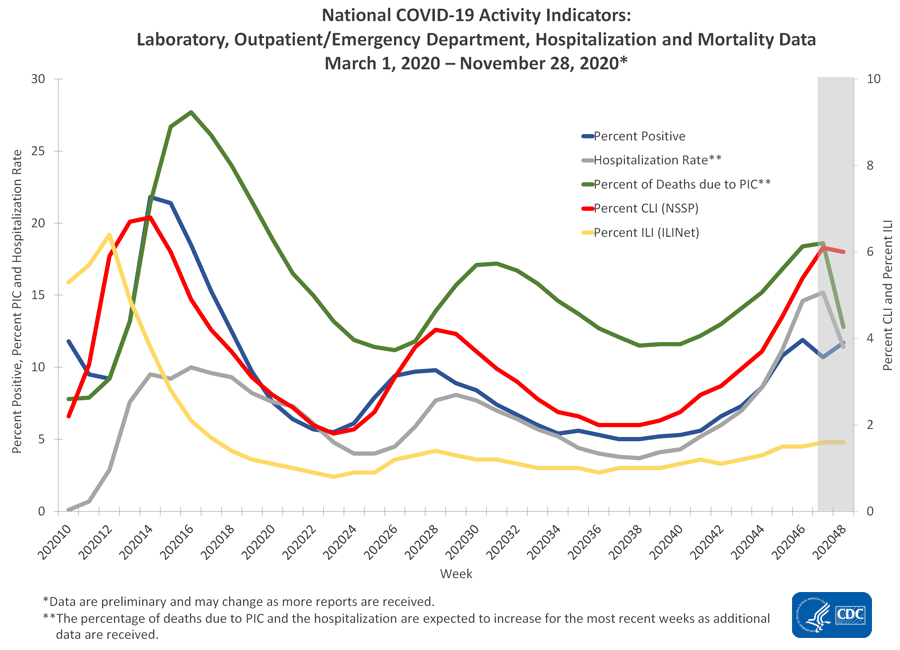
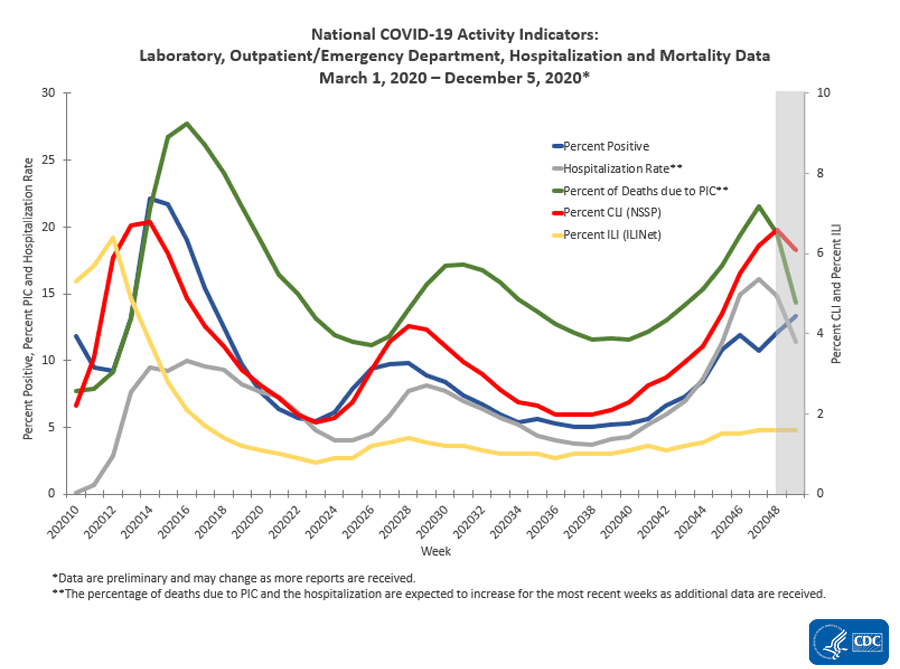
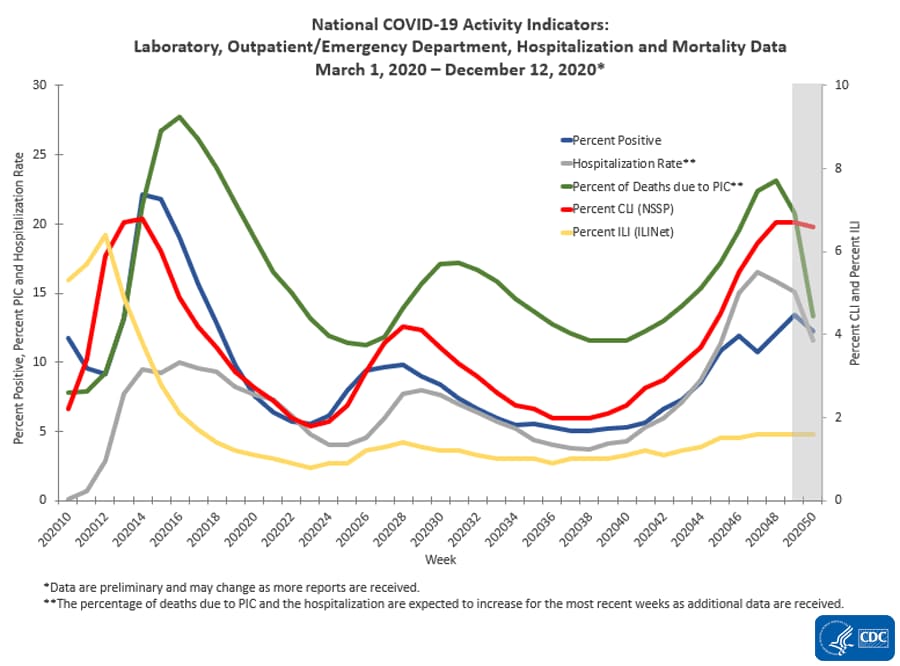
Nationally, levels of influenza-like illness (ILI) are below baseline but higher than typically seen at this time of year. Indicators that track ILI and COVID-19-like illness (CLI) and the percentage of laboratory tests positive for SARS-CoV-2 have continued to decrease nationally since mid-July. Regionally, from week 31 to week 32, indicators that track ILI and COVID-19-like illness (CLI) were decreasing or stable (change of ≤ 0.1%) in all regions of the country, and the percentage of laboratory tests positive for SARS-CoV-2 decreased or remained the same in nine of ten HHS regions. Weekly hospitalization rates and mortality attributed to COVID-19 declined during week 32 but may change as more data for admissions and deaths occurring during recent weeks are received. Mortality attributed to COVID-19 remains above the epidemic threshold.
Virus

Public Health, Commercial and Clinical Laboratories


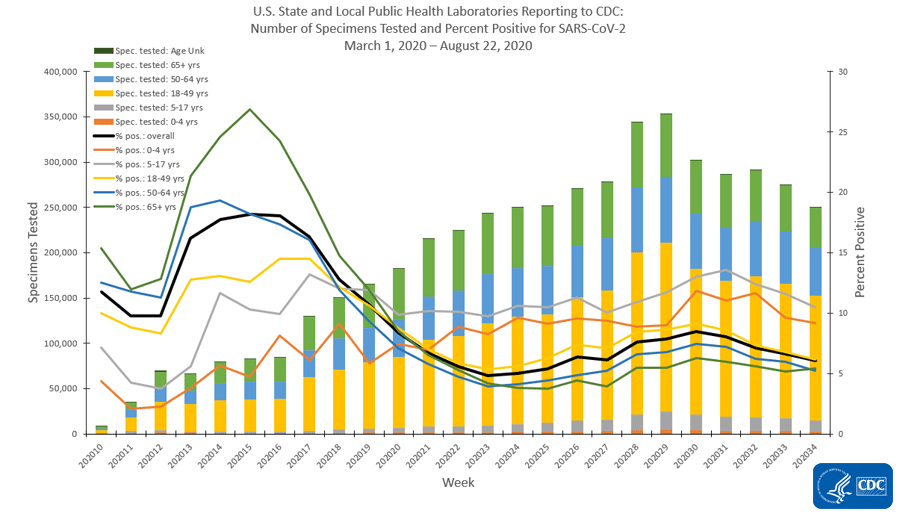
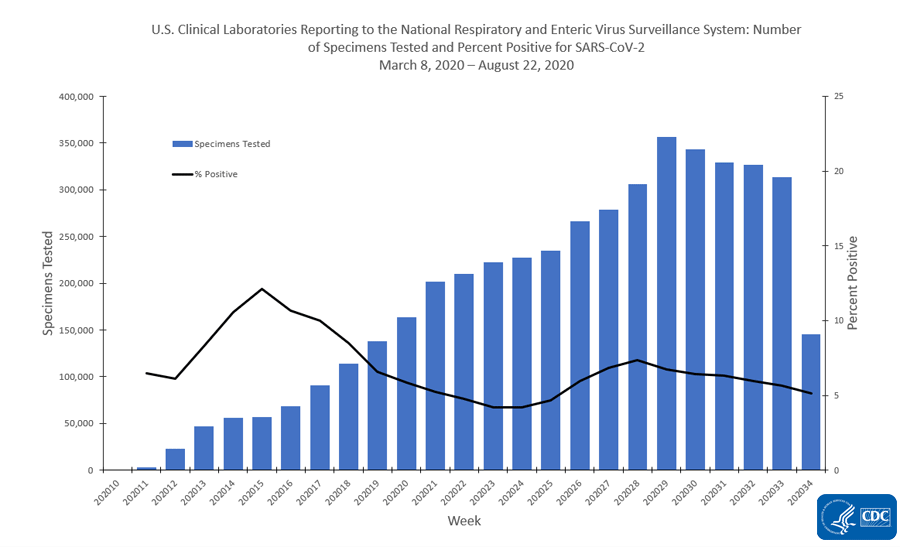
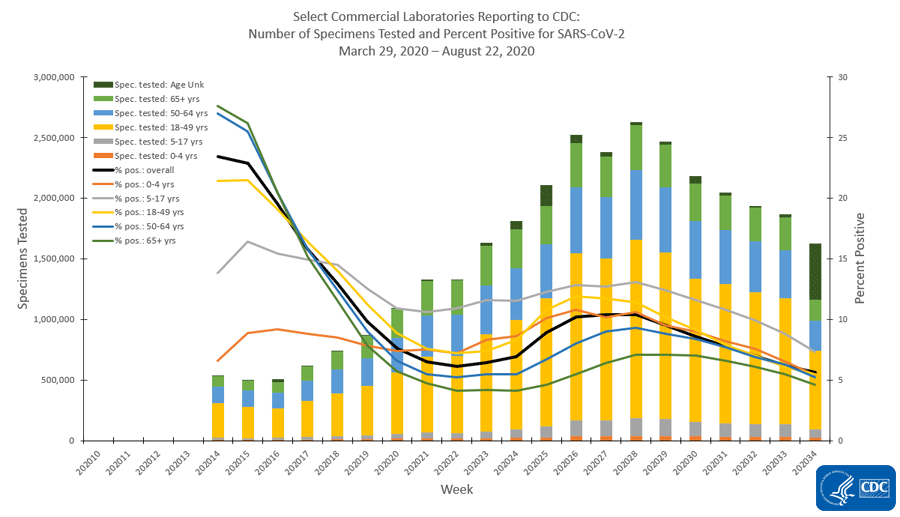
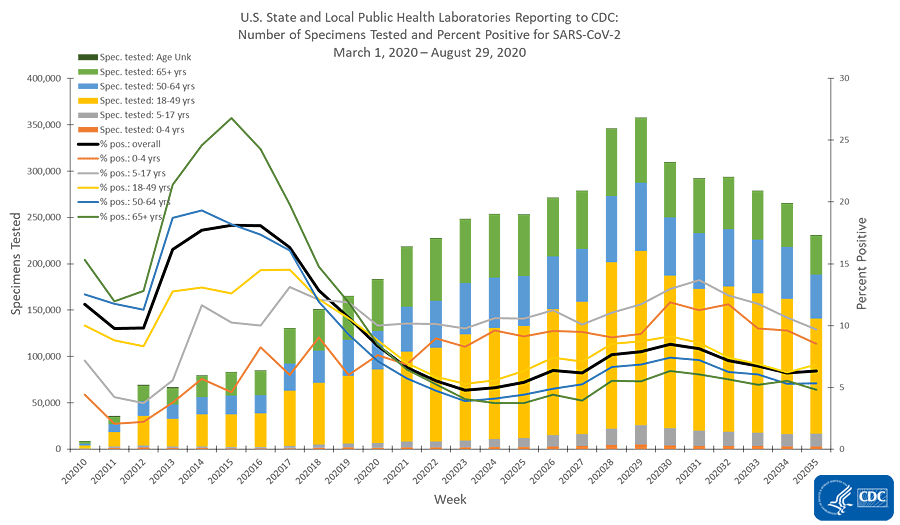
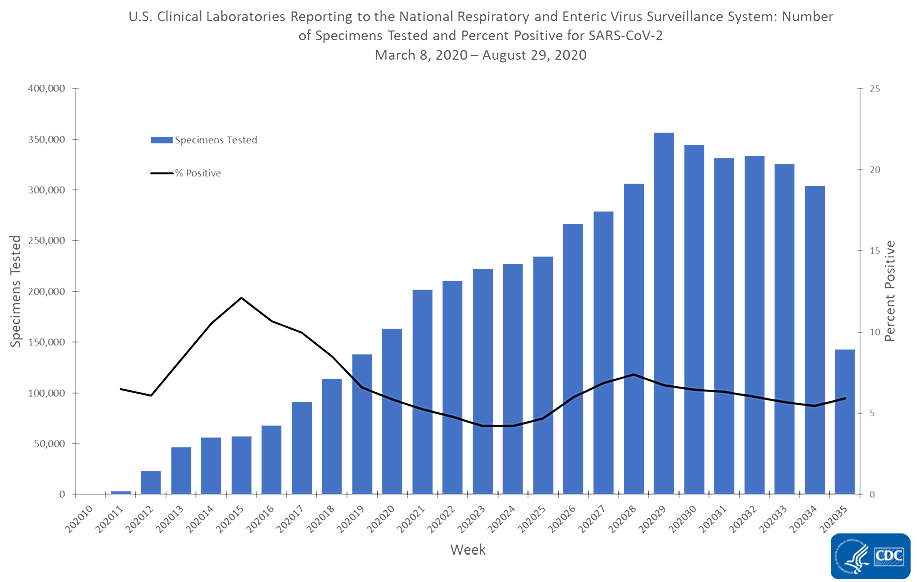
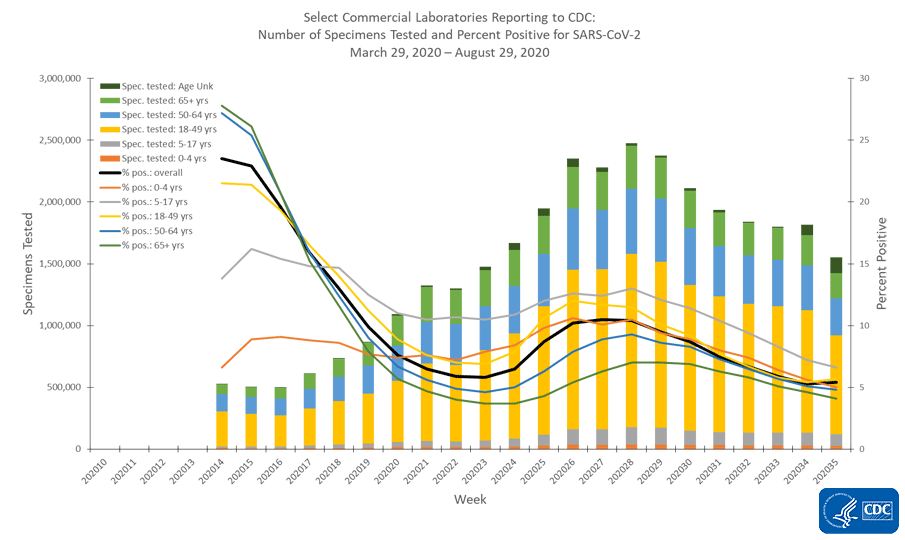
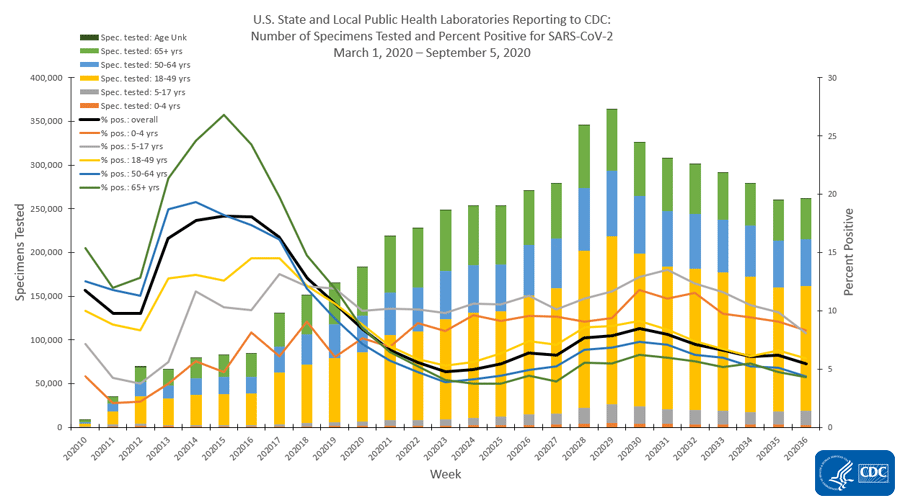
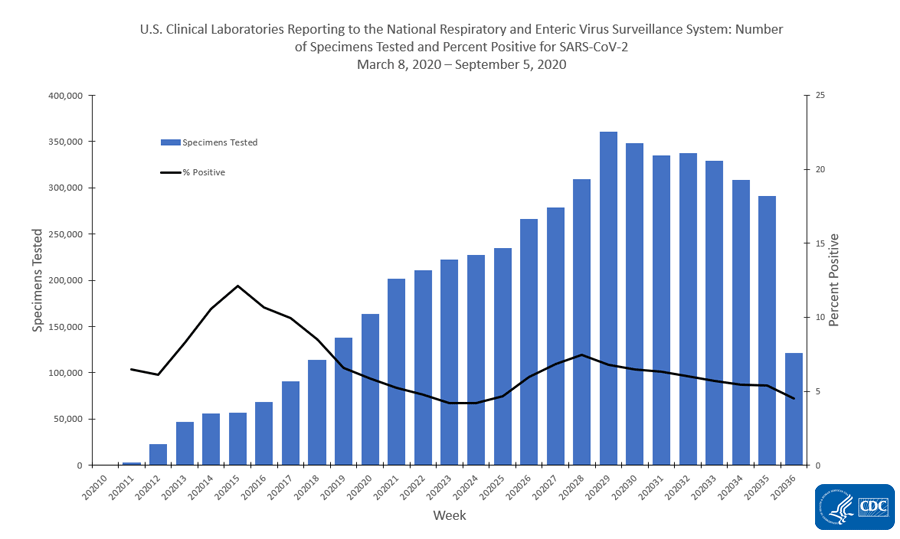
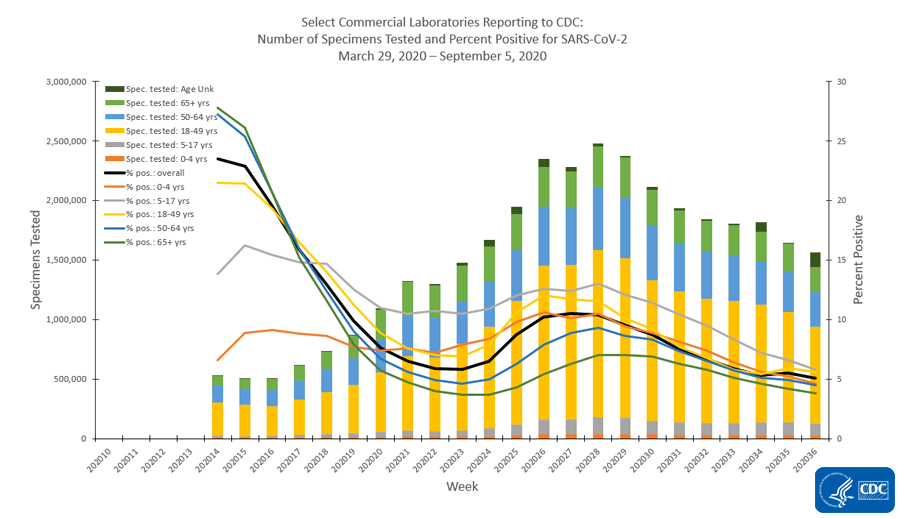
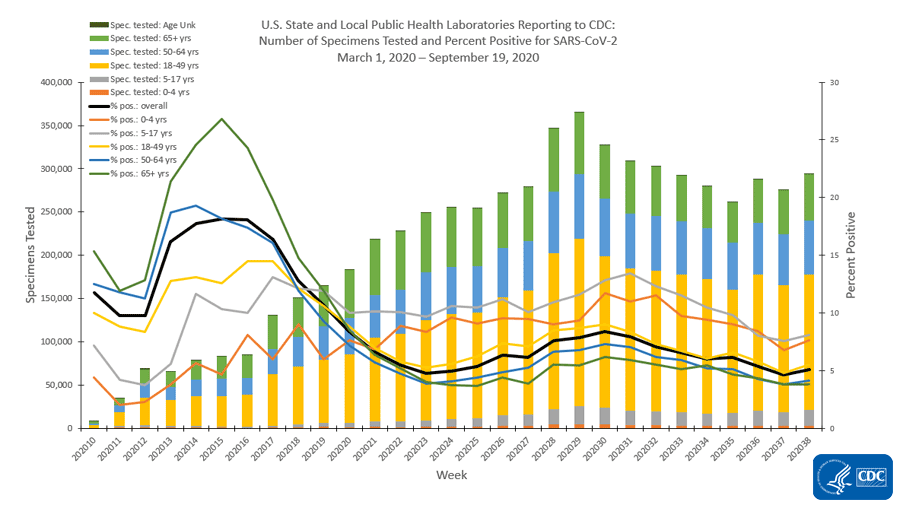
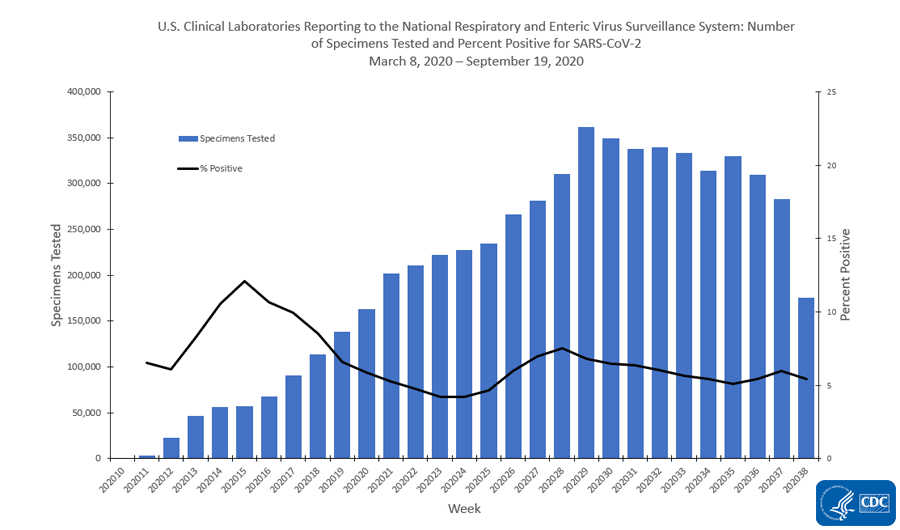
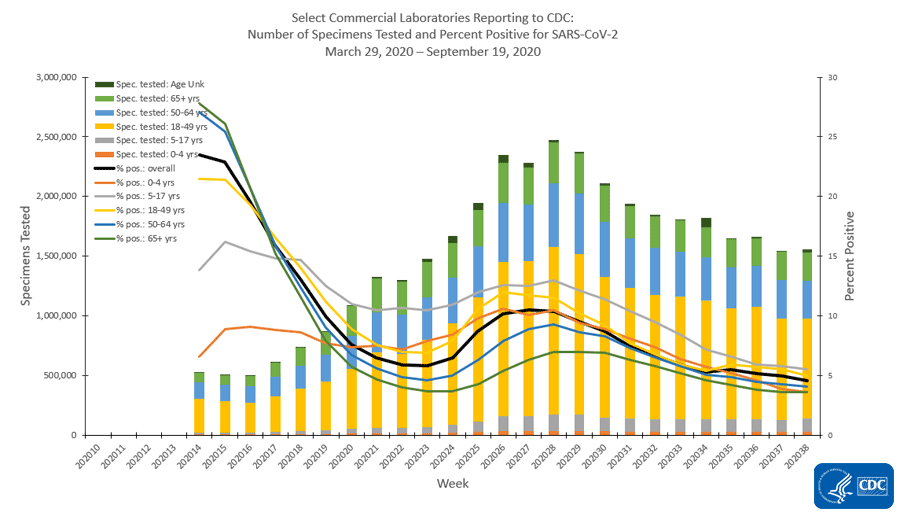
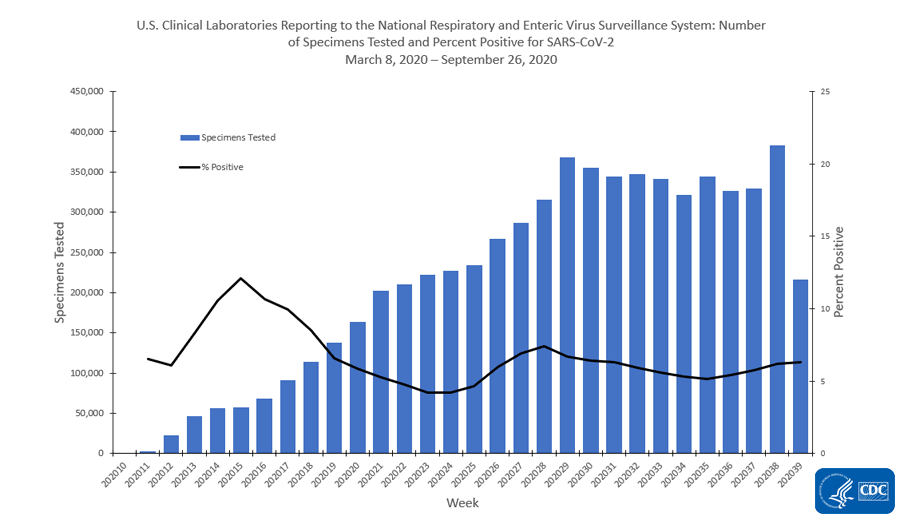
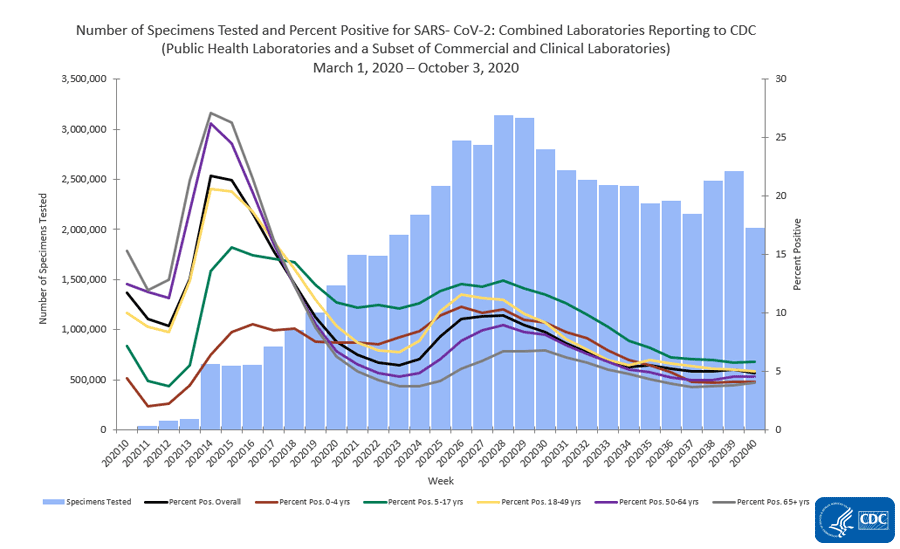
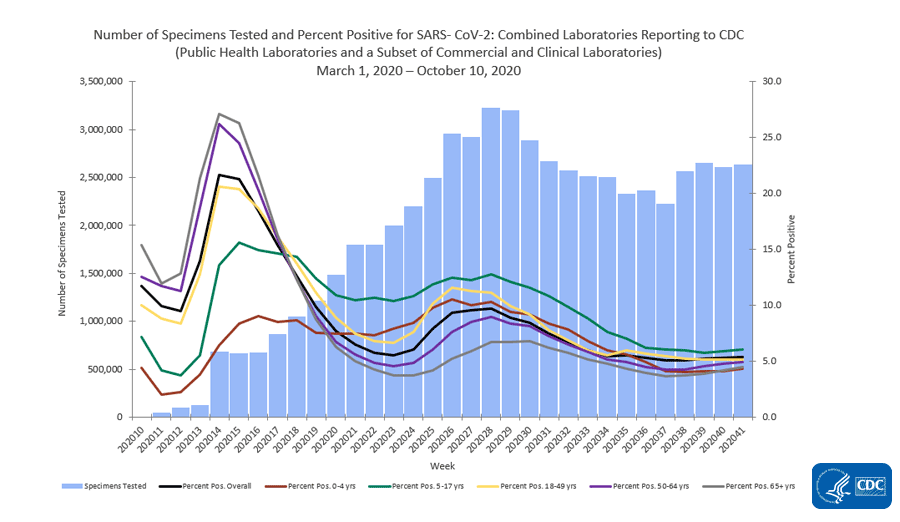
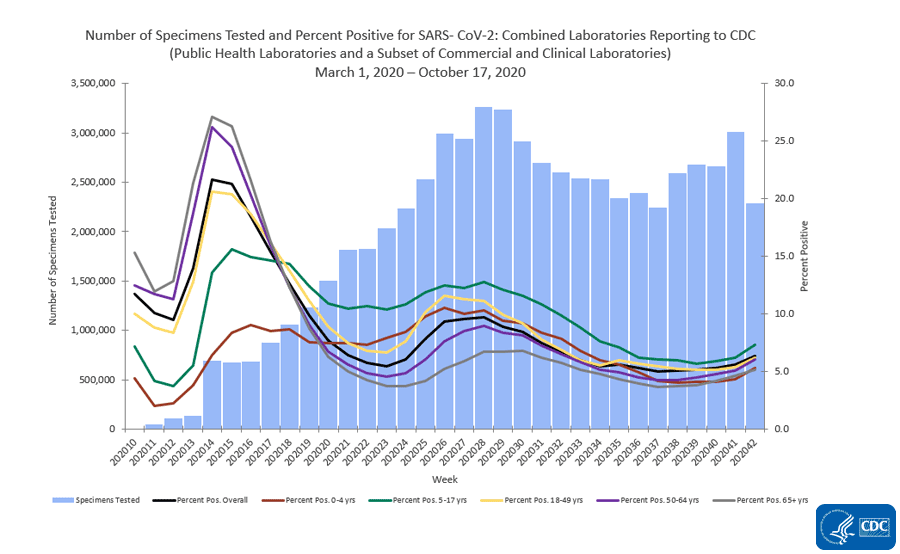
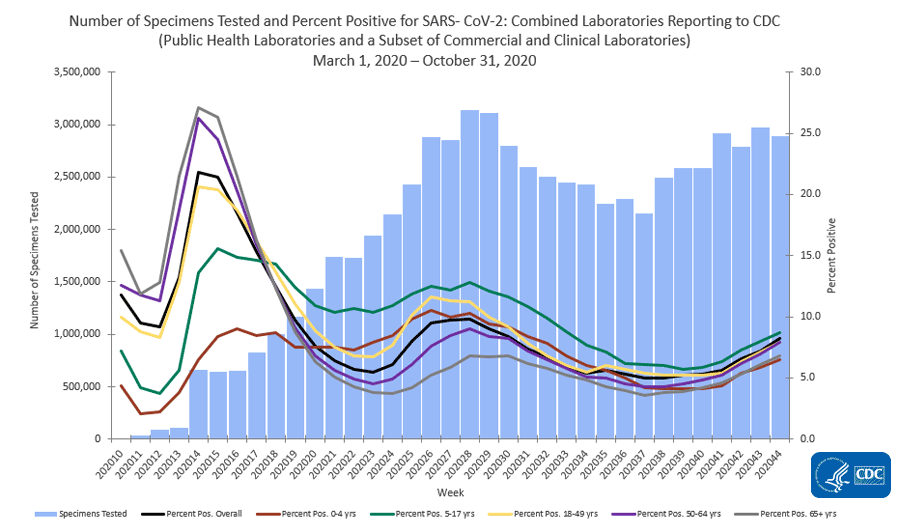
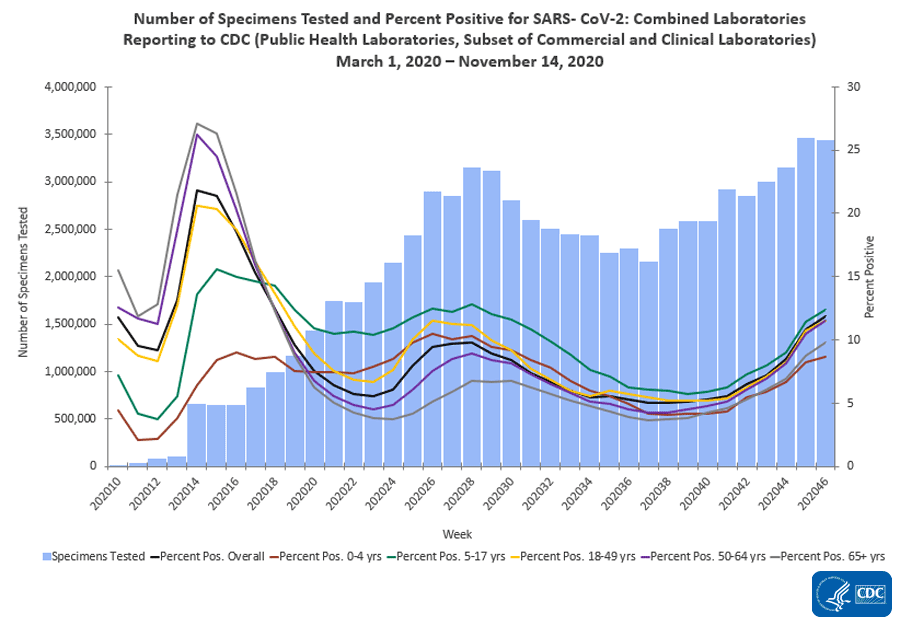
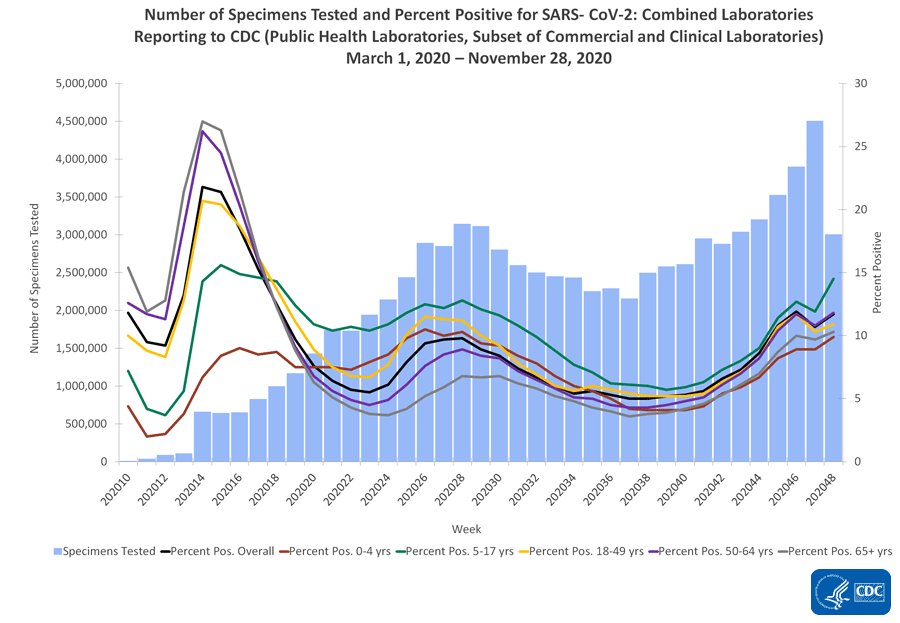
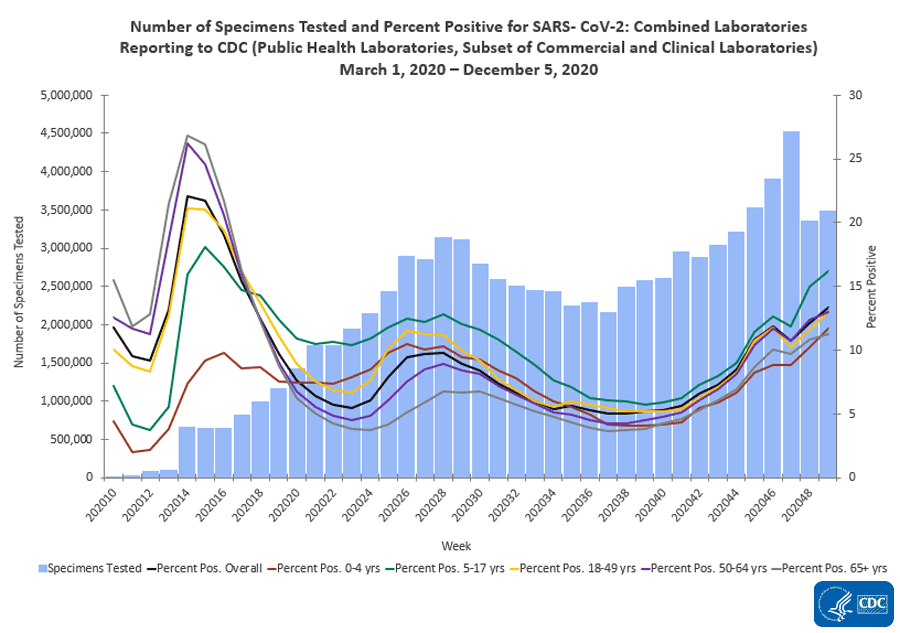
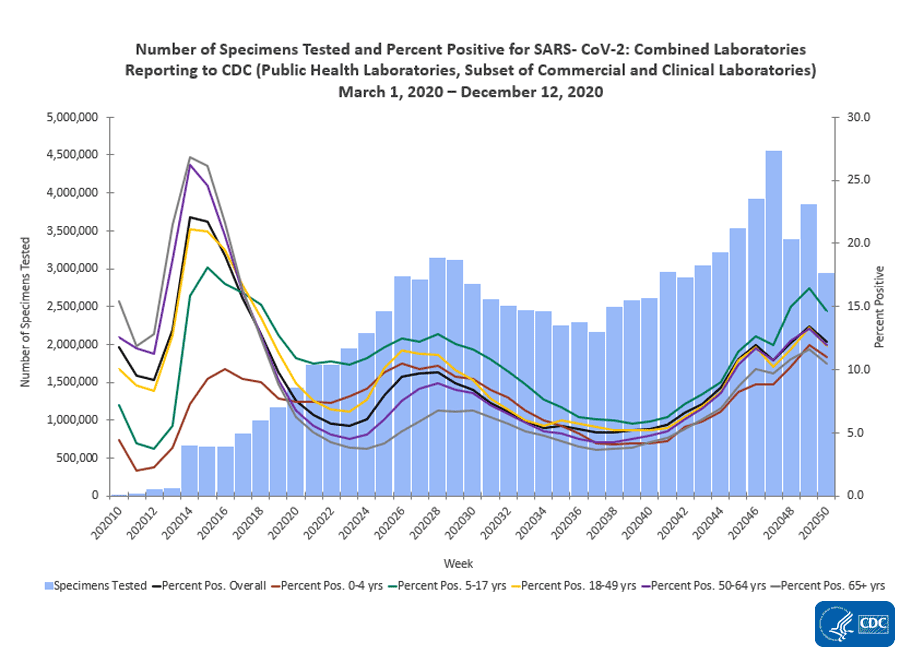
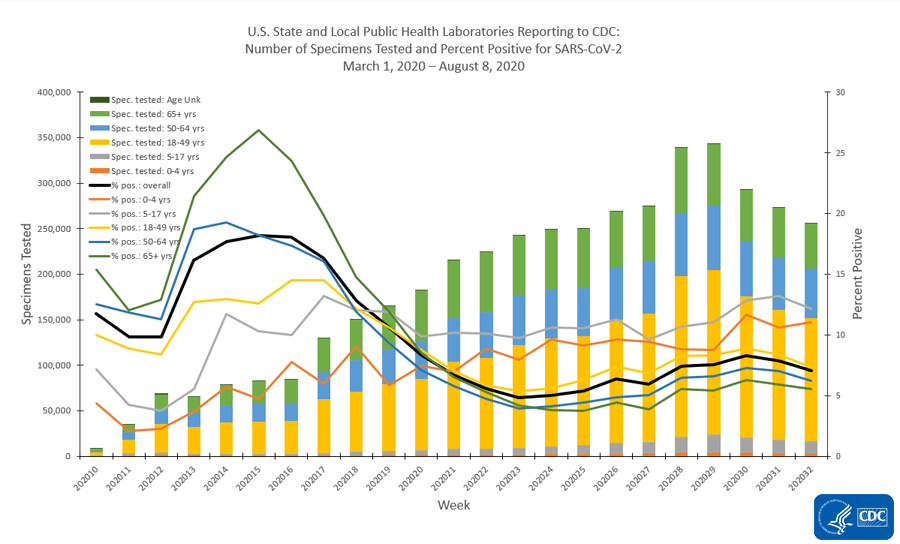
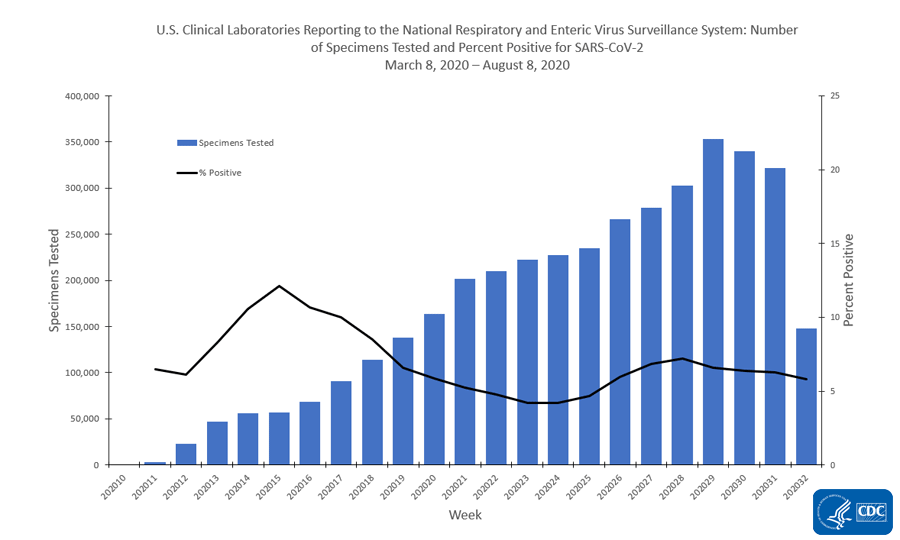
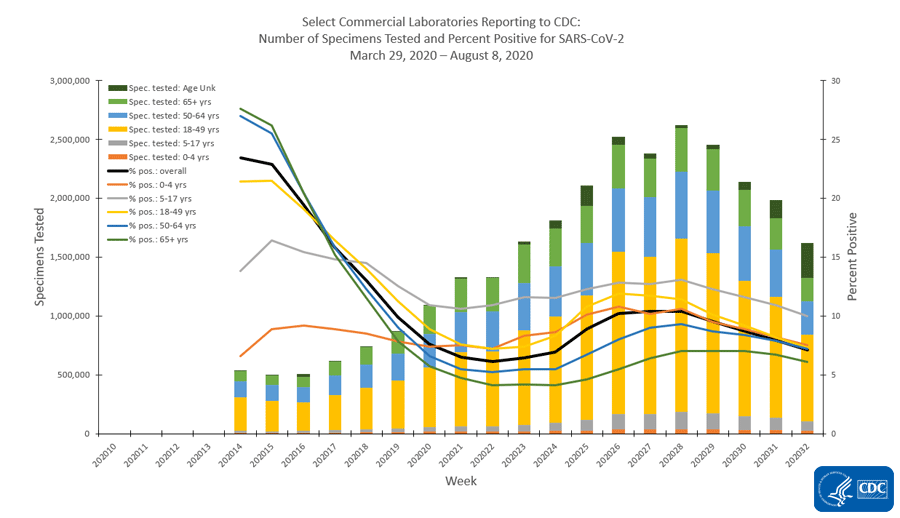
Nationally, the percentage of respiratory specimens testing positive for SARS-CoV-2 decreased from 7.7% during week 31 to 7.0% during week 32 and decreased or remained the same in nine of ten HHS regions. National percentages of specimens testing positive for SARS-CoV-2 by type of laboratory are listed as follows:
  • Public health laboratories – decreased from 7.9% during week 31 to 7.0% during week 32;
  • Clinical laboratories – decreased from 6.3% during week 31 to 5.8% during week 32;
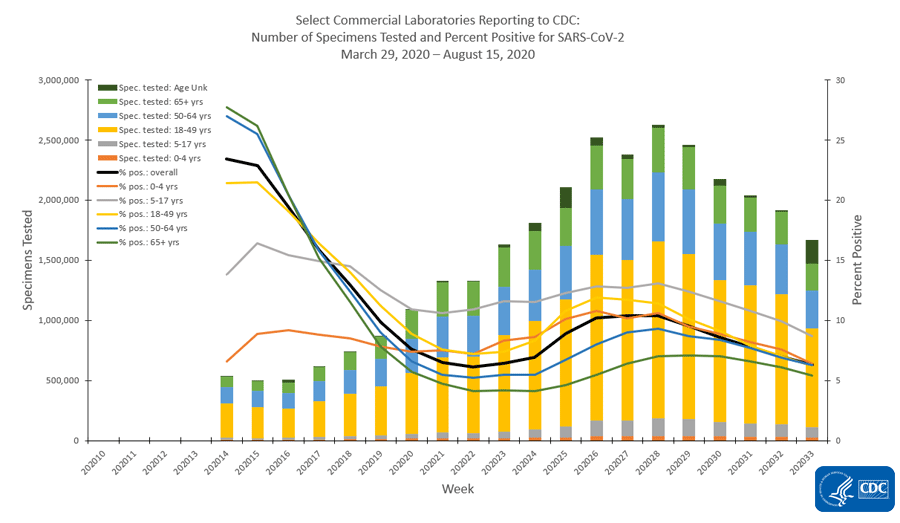
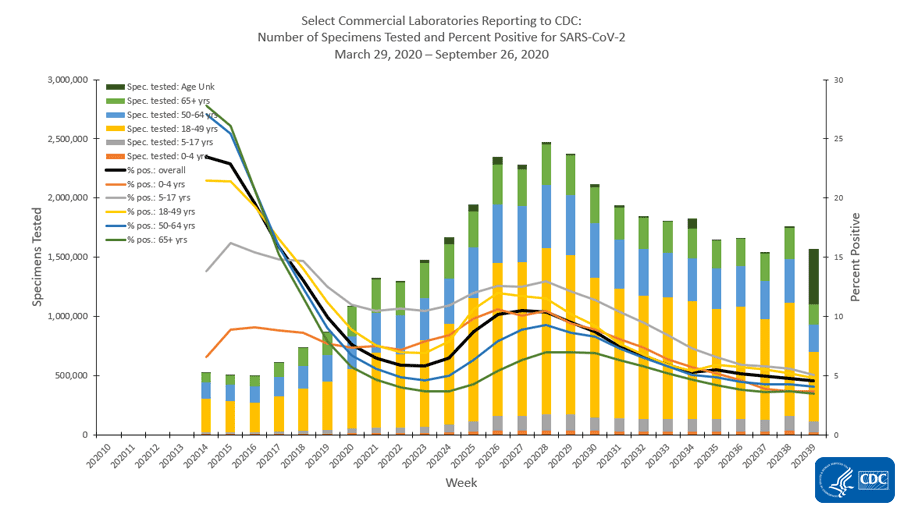
  • Commercial laboratories – decreased from 7.9% during week 31 to 7.1% during week 32.
Outpatient and Emergency Department Visits

Outpatient Influenza-Like Illness Network (ILINet) and National Syndromic Surveillance Program (NSSP)


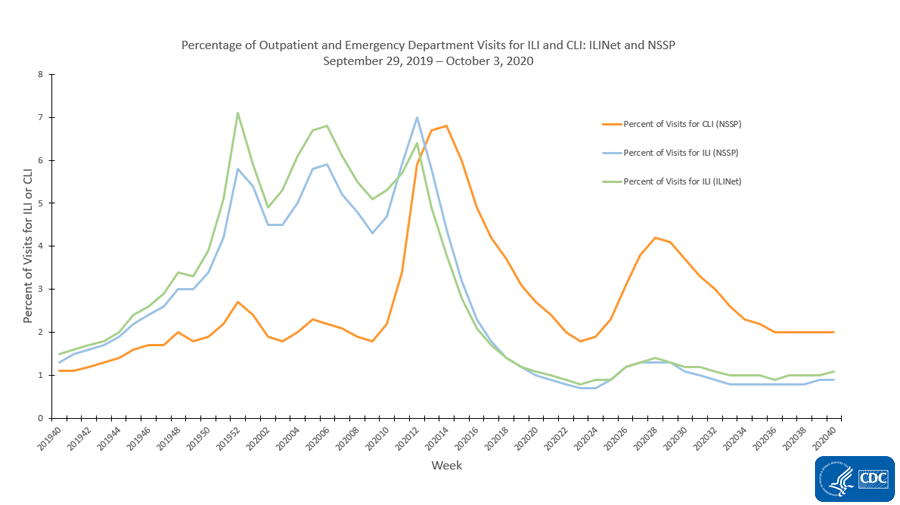
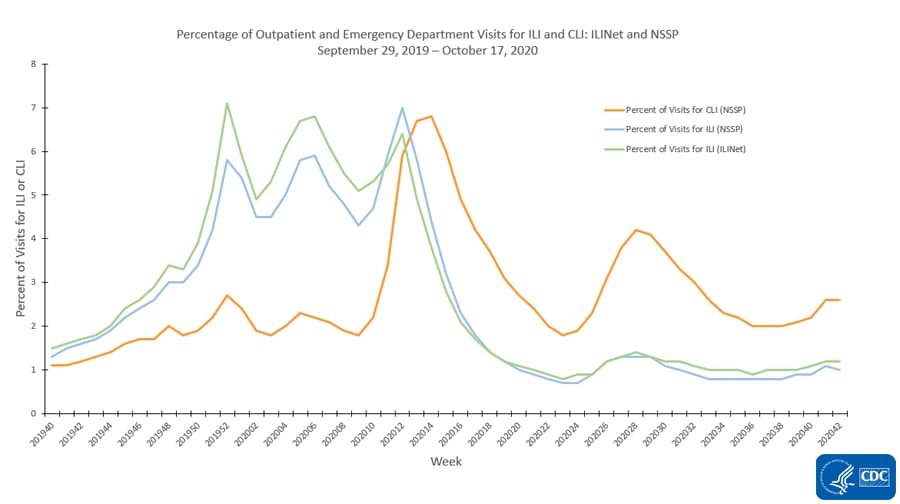
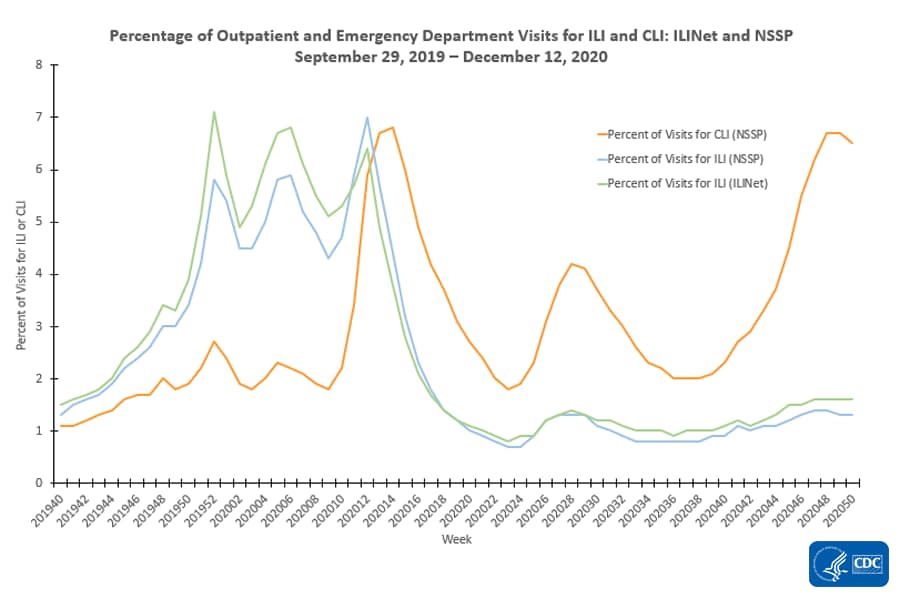
Two surveillance networks are being used to track outpatient or emergency department (ED) visits for illness with symptoms compatible with COVID-19.
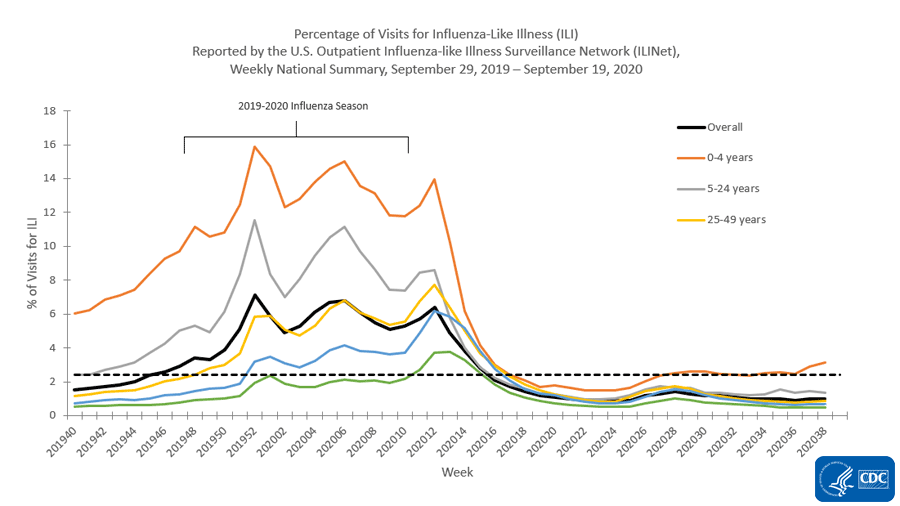
  • Nationally, ILI activity remains below baseline for the seventeenth week but is higher than typically seen at this time of year.
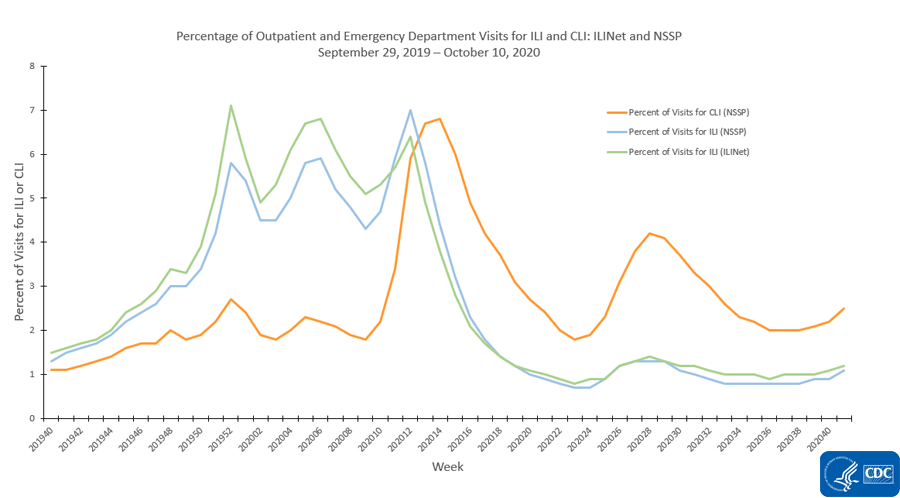
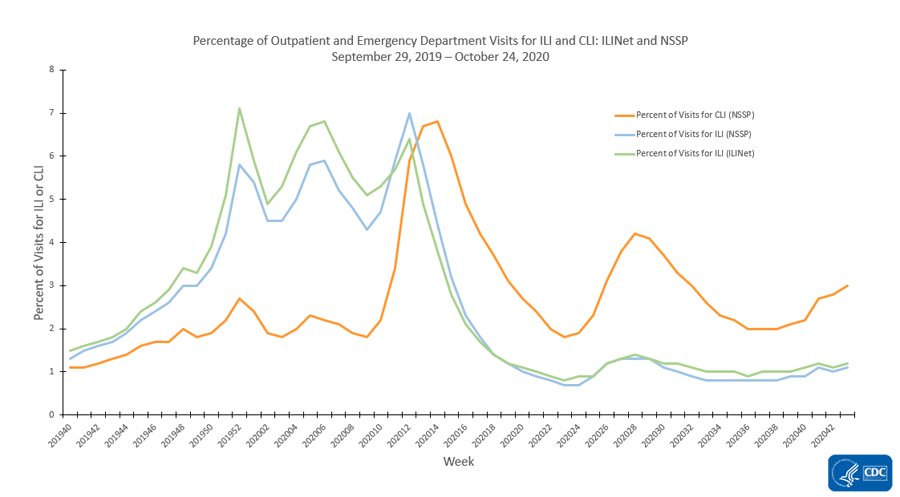
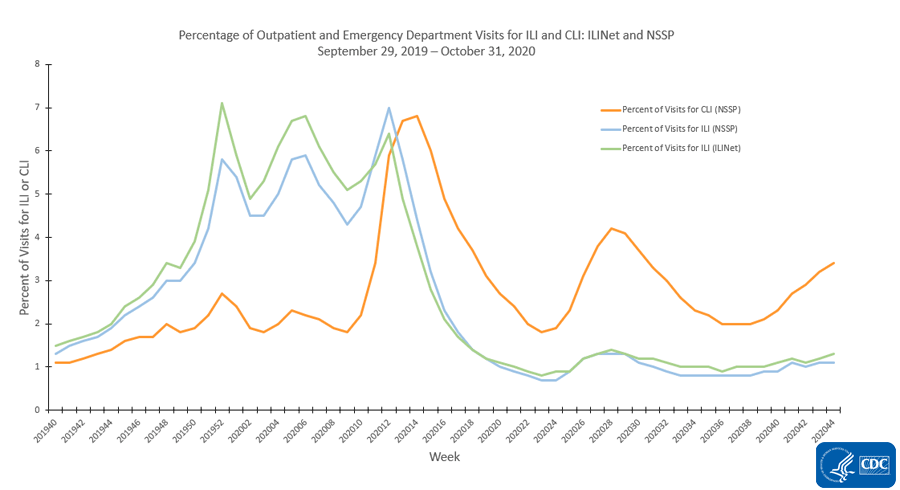
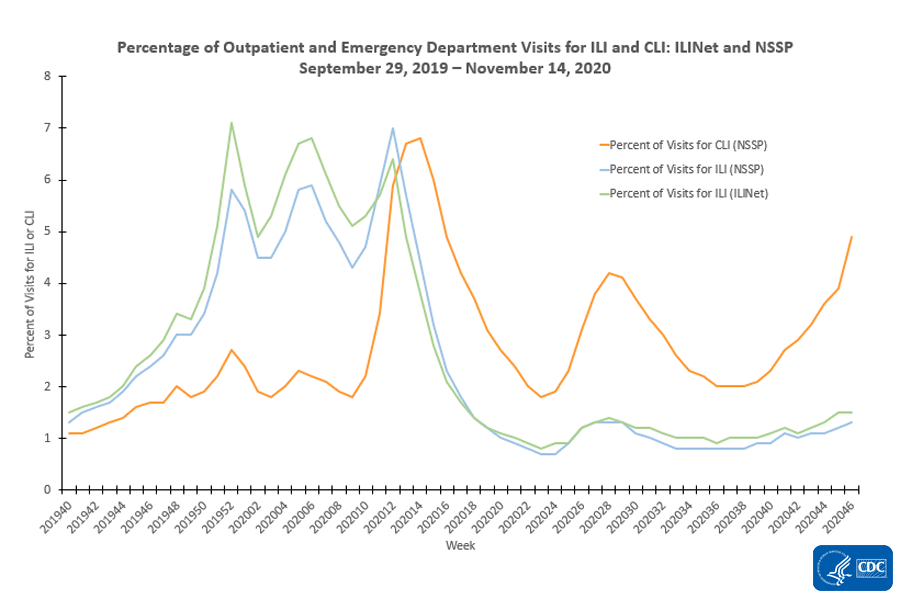
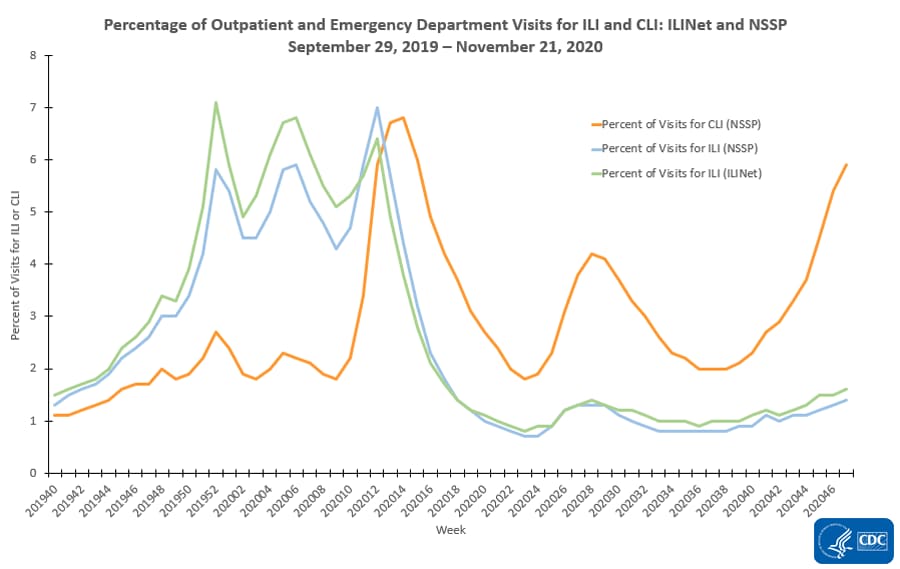
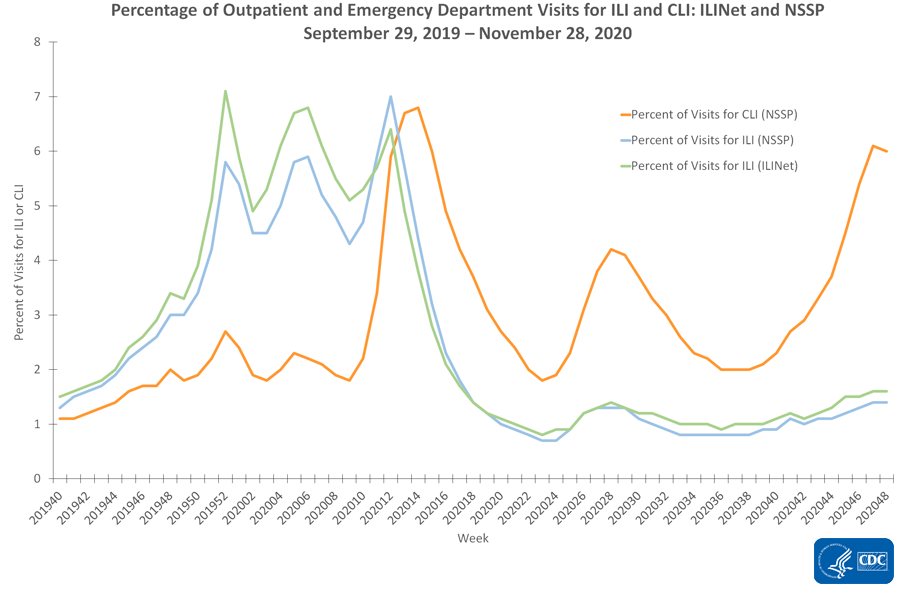
  • Nationally, during week 32, the percentage of visits reported by ILINet participants for ILI was 1.1% and has declined for three consecutive week; the percentage of visits for CLI reported to NSSP was 2.6% and has declined for four consecutive weeks.
  • Recent changes in health care seeking behavior, including increasing use of telemedicine, recommendations to limit emergency department (ED) visits to severe illnesses, and increased social distancing, are likely affecting data reported from both networks, making it difficult to draw conclusions at this time. Tracking these systems moving forward will give additional insight into illness related to COVID-19.
Severe Disease

Hospitalizations


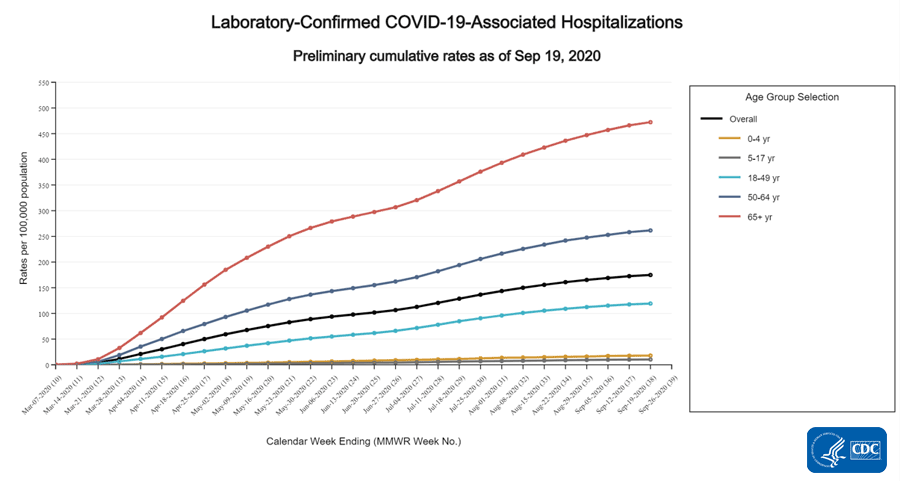
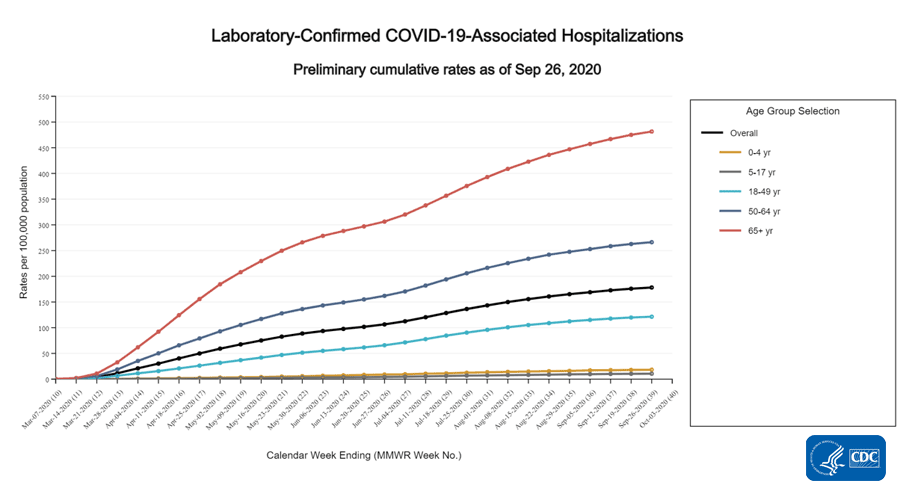
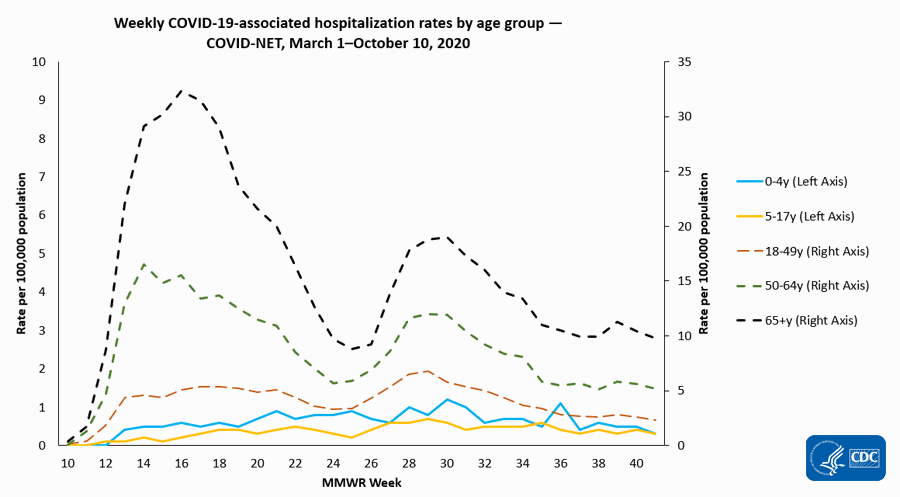
Cumulative COVID-19-associated hospitalization rates since March 1, 2020, are updated weekly. The overall cumulative COVID-19 hospitalization rate is 144.1 per 100,000, with the highest rates in people aged 65 years and older (394.2 per 100,000) and 50-64 years (217.0 per 100,000).
Mortality


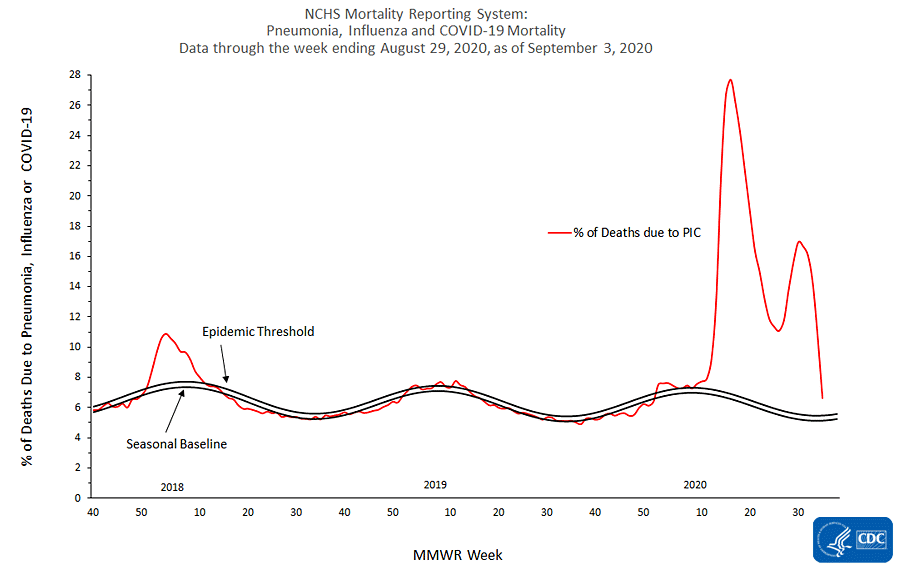
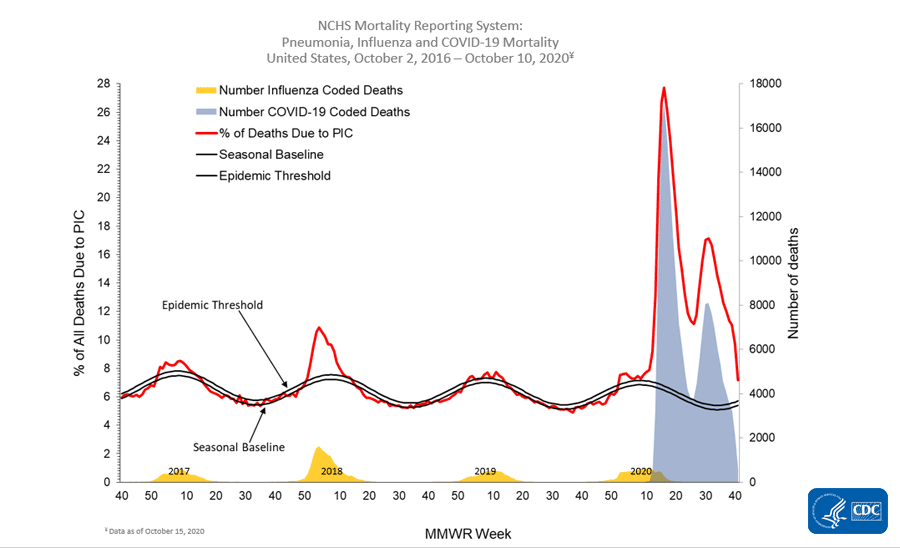
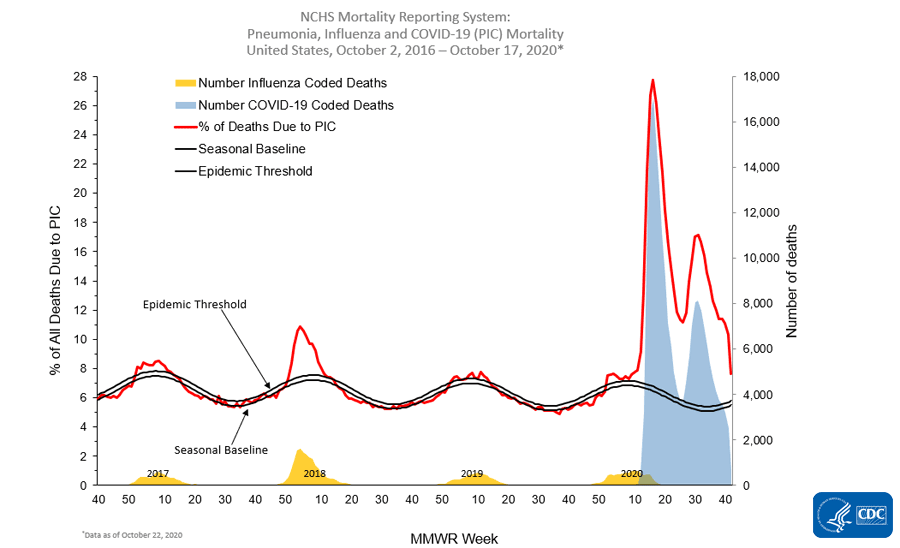
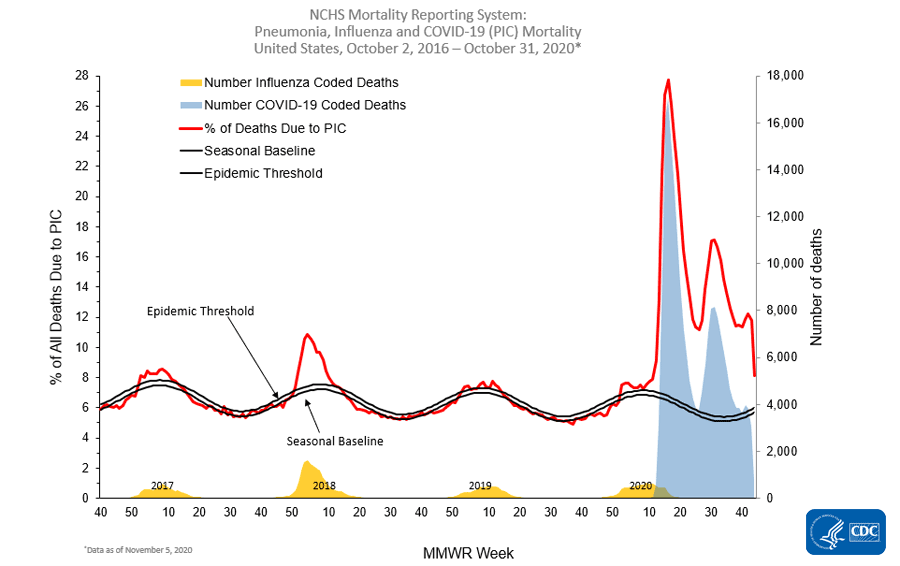
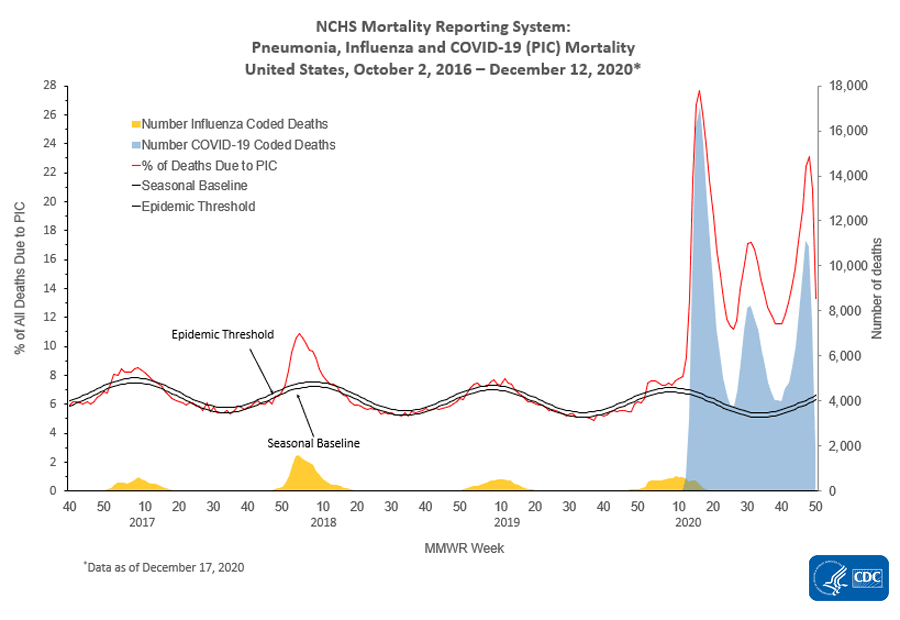
Based on death certificate data, the percentage of deaths attributed to pneumonia, influenza or COVID-19 (PIC) increased from week 26 – week 30 (June 27 – July 25) for the first time since mid-April. The percentage for week 32 is 8.1% and currently lower than the percentage during week 31 (12.5%); however, the percentage remains above the epidemic threshold. Percentages for recent weeks will likely increase as more death certificates are processed.

All data are preliminary and may change as more reports are received.

A description of the surveillance systems summarized in COVIDView, including methodology and detailed descriptions of each data component, is available on the surveillance methods page.
Key Points
  • Nationally, the percentage of specimens testing positive for SARS-CoV-2 and the percentages of visits for ILI and CLI have continued to decrease since mid-July.
  • Using combined data from the three laboratory types, the national percentage of respiratory specimens testing positive for SARS-CoV-2 with a molecular assay decreased from 7.7% during week 31 to 7.0% during week 32.
    • Regionally, the percentage of respiratory specimens testing positive for SARS-CoV-2 also declined or remained the same in nine of ten HHS regions. A small increase of 0.2% was seen in Region 2 (NY/NJ/Puerto Rico).
    • The highest percentages of specimens testing positive for SARS-CoV-2 were seen in Regions 4 (South East, 11.5%) and 6 (South Central, 12.6%). The percentage is declining in both regions following peaks seen in week 28 and 27, respectively.
  • The percentage of outpatient and ED visits for ILI are below baseline nationally and in all regions of the country; however, ILI activity is above what is typical for this time of year. The percentage of visits to EDs for CLI decreased nationally for the fourth consecutive week and, compared to the previous week, decreased in all ten HHS regions.
    • Systems monitoring ILI and CLI may be influenced by recent changes in health care seeking behavior, including increasing use of telemedicine, recommendations to limit emergency department (ED) visits to severe illnesses, and increased social distancing.
  • The overall cumulative COVID-19-associated hospitalization rate was 144.1 per 100,000; rates were highest in people 65 years of age and older (394.2 per 100,000) followed by people 50-64 years (217.0 per 100,000). Cumulative hospitalization rates will increase as the pandemic continues.
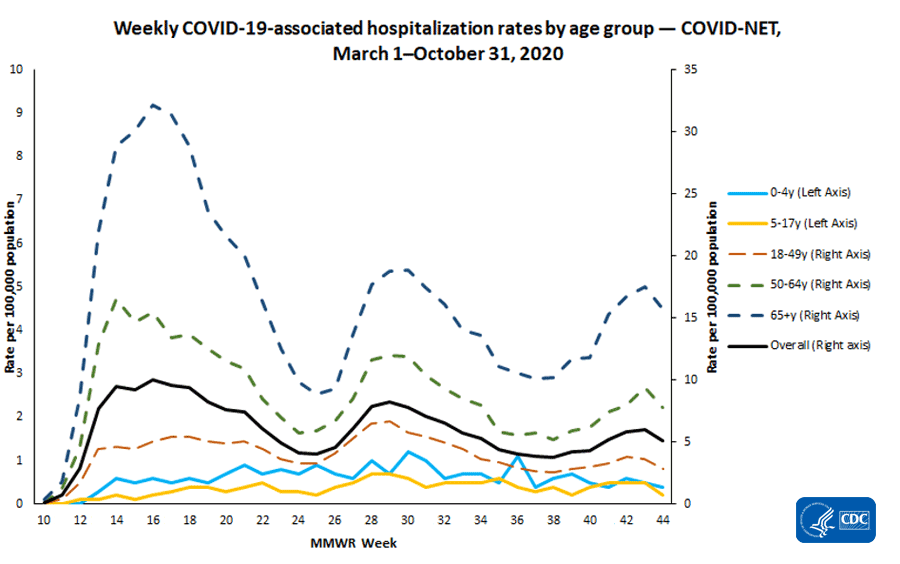
    • From week 25 – week 29 (weeks ending June 20 – July 18), overall weekly hospitalization rates increased for four consecutive weeks. Weekly rates have declined during the most recent three weeks but may increase as more data are received.
    • Non-Hispanic American Indian or Alaska Native persons had an age-adjusted hospitalization rate approximately 5 times that of non-Hispanic White persons. Rates among non-Hispanic Black persons and Hispanic or Latino persons were both approximately 4.7 times the rate among non-Hispanic White persons.
  • Based on death certificate data, the percentage of deaths attributed to pneumonia, influenza or COVID-19 (PIC) increased from week 26 – week 30 (weeks ending June 27 – July 25) after declining for 11 weeks since mid-April. The percentage of deaths due to PIC for week 32 is 8.1%, lower than the percentage during week 31 (12.5%), but above the epidemic threshold. These percentages will likely increase as more death certificates are processed.
  • All surveillance systems aim to provide the most complete data available. Estimates from previous weeks are subject to change as data are updated with the most complete data available.
U.S. Virologic Surveillance


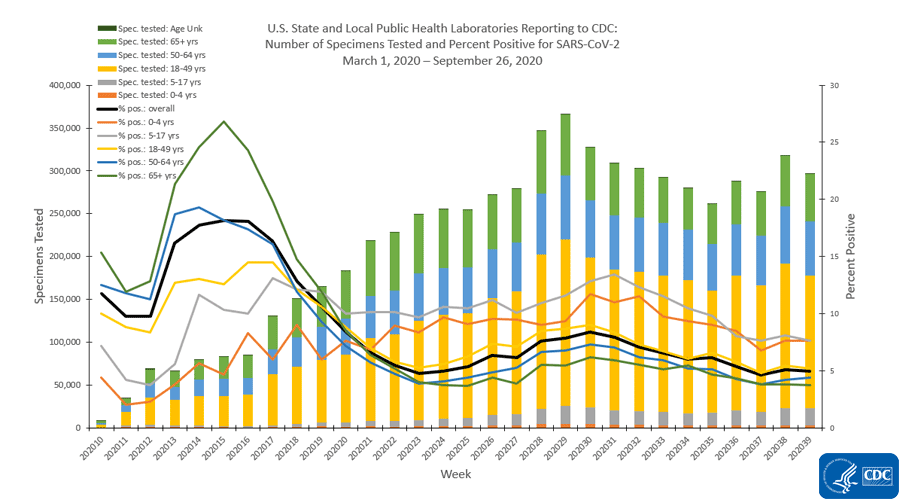
The number of specimens tested for SARS-CoV-2 using a molecular assay and reported to CDC by public health laboratories and a subset of clinical and commercial laboratories in the United States are summarized below. All laboratories are performing primary diagnostic functions; therefore, the percentage of specimens testing positive across laboratory types can be used to monitor overall trends in COVID-19 activity. As the outbreak progresses, it is possible that different types of laboratories will take on different roles, and the data interpretation may need to change.
2,020,77138,026,858
256,0424,286,454
147,8623,868,206
1,616,86729,872,198
141,923 (7.0%)3,522,138 (9.3%)
18,010 (7.0%)352,735 (8.2%)
8,609 (5.8%)244,094 (6.3%)
115,304 (7.1%)2,925,309 (9.8%)
* Commercial and clinical laboratory data represent select laboratories and do not capture all tests performed in the United States.
Public Health Laboratories

resize iconView LargerView Data Table

Clinical Laboratories

resize iconView LargerView Data Table

Commercial Laboratories

resize iconView Larger


* Commercial laboratories began testing for SARS-CoV-2 in early March, but the number and geographic distribution of reporting commercial laboratories became stable enough to calculate a weekly percentage of specimens testing positive as of March 29, 2020.
View Data Table


Additional virologic surveillance information: Surveillance Methods


Outpatient/Emergency Department Illness


Two syndromic surveillance systems are being used to monitor trends in outpatient and emergency department (ED) visits that may be associated with COVID-19 illness. Each system monitors a slightly different syndrome, and together, these systems provide a more comprehensive picture of mild-to-moderate COVID-19 illness than either would individually. Both systems are currently being affected by changes in health care seeking behavior, including increased use of telemedicine, compliance with recommendations to limit ED visits to severe illnesses, and increased social distancing. These changes affect the numbers of people seeking care in the outpatient and ED settings and their reasons for doing so.
ILINet


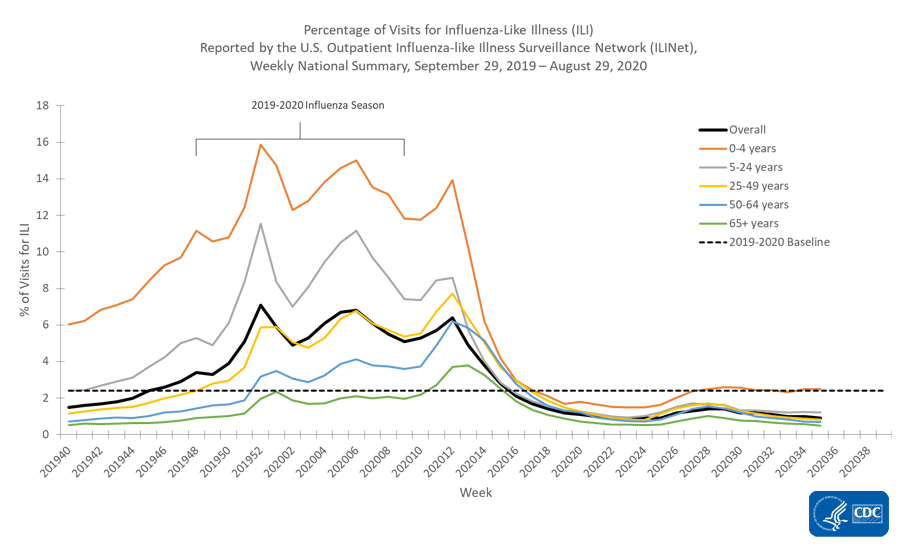
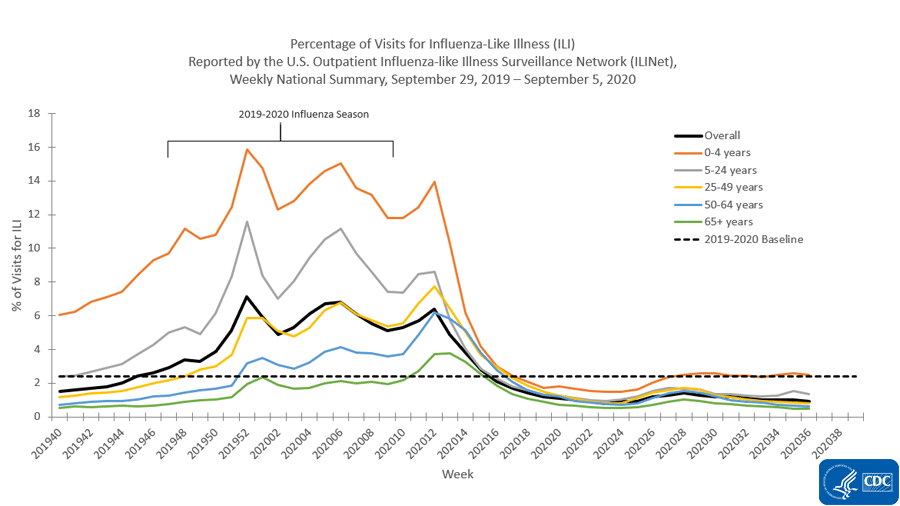
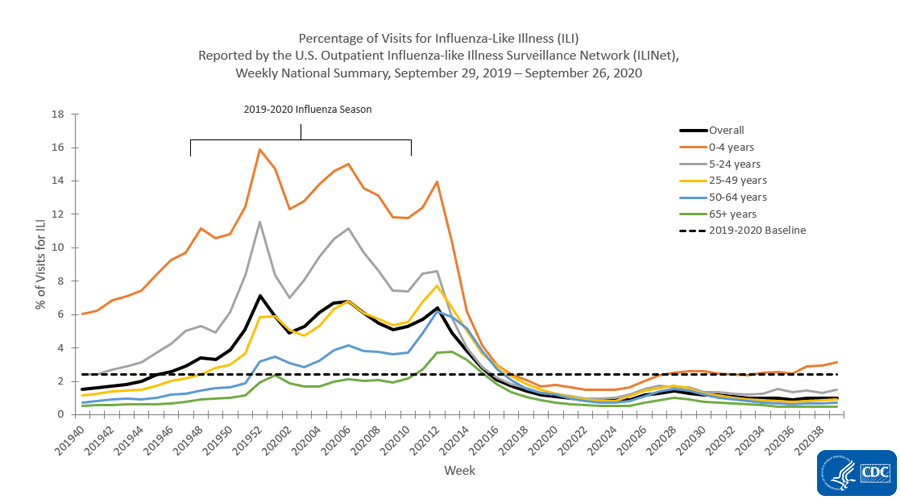
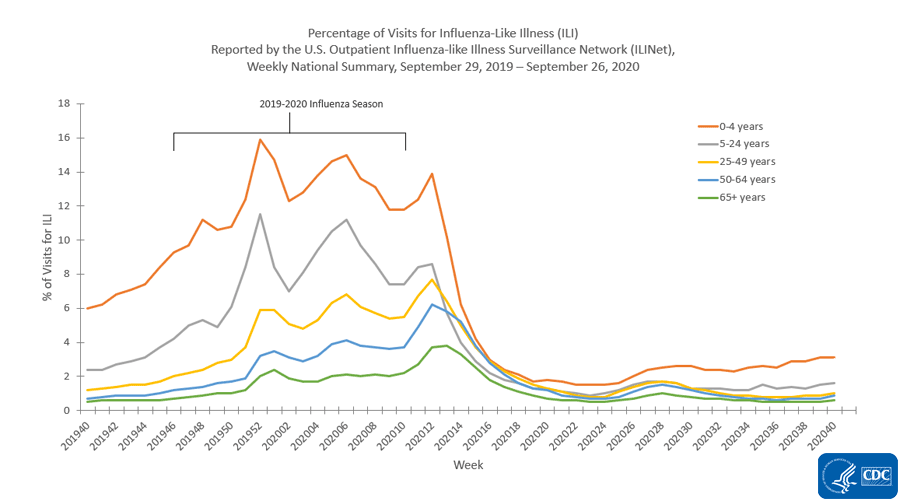
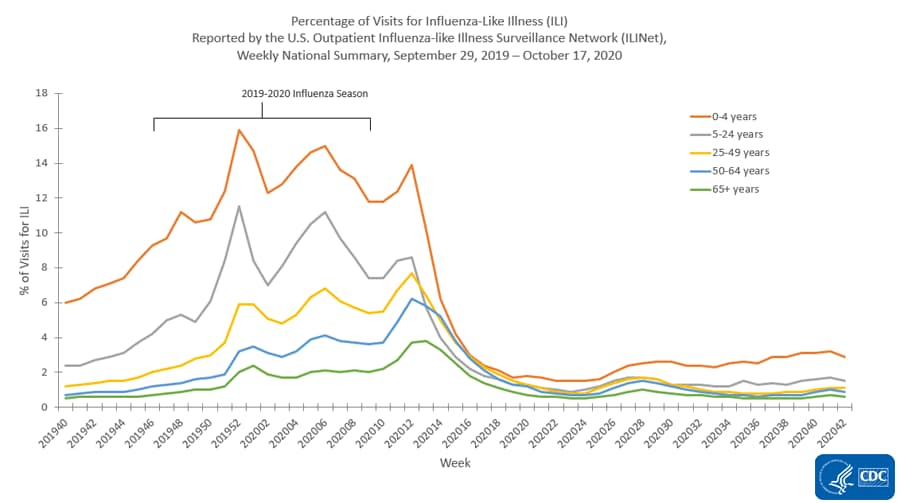
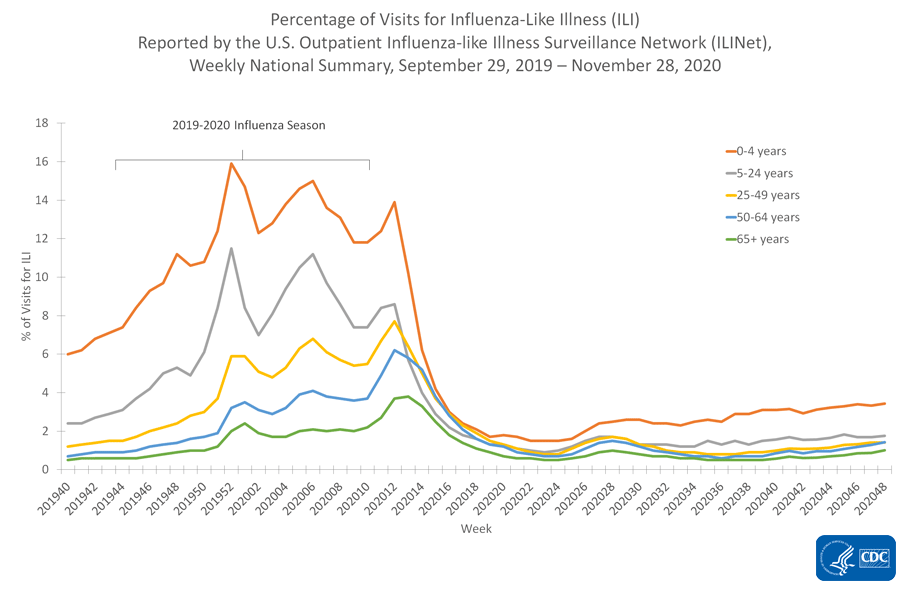
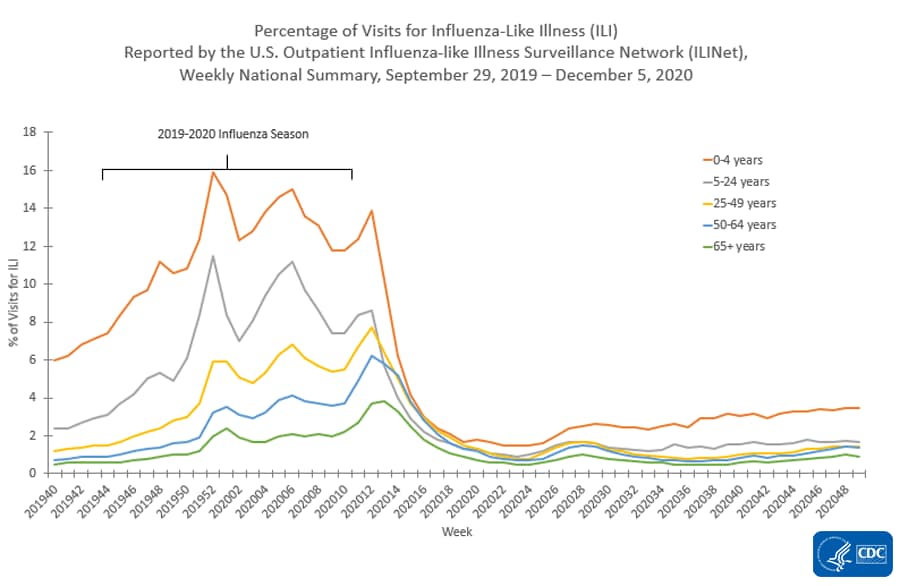
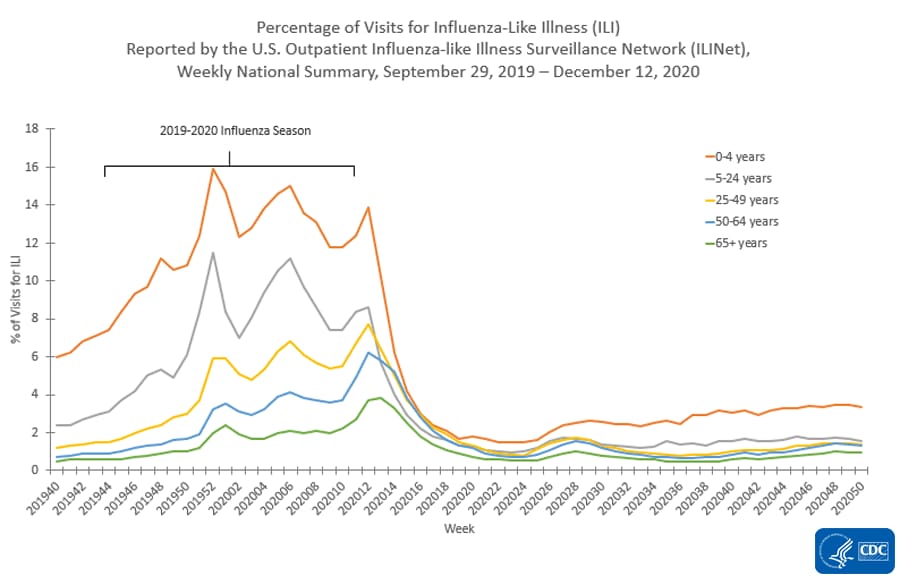
The U.S. Outpatient Influenza-like Illness Surveillance Network (ILINet) provides data on visits for influenza-like illness (ILI) (fever [≥ 100[SUP]○[/SUP]F] and cough and/or sore throat) to approximately 2,600 primary care providers, emergency departments, and urgent care centers in all 50 states, Puerto Rico, the District of Columbia, and the U.S. Virgin Islands. Mild COVID-19 illness presents with symptoms similar to ILI, so ILINet is being used to track trends of mild-to-moderate COVID-19 illness and allows for comparison with prior influenza seasons.

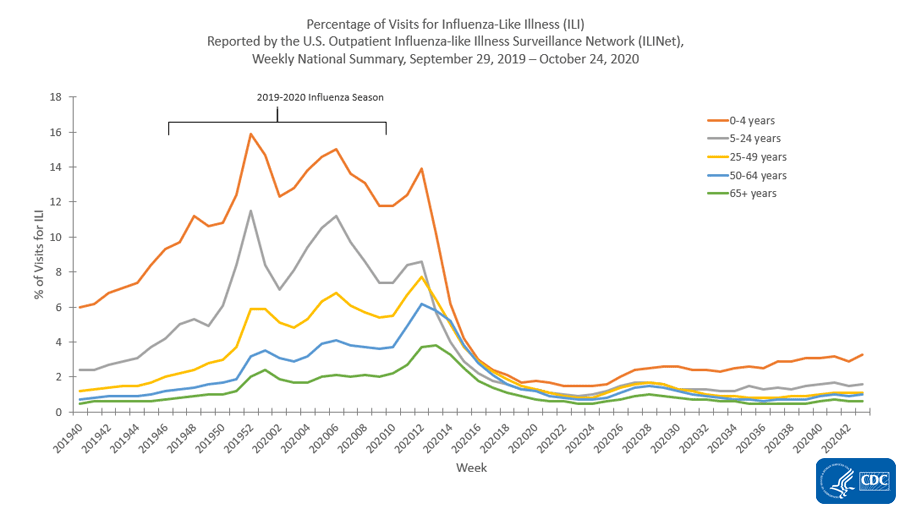
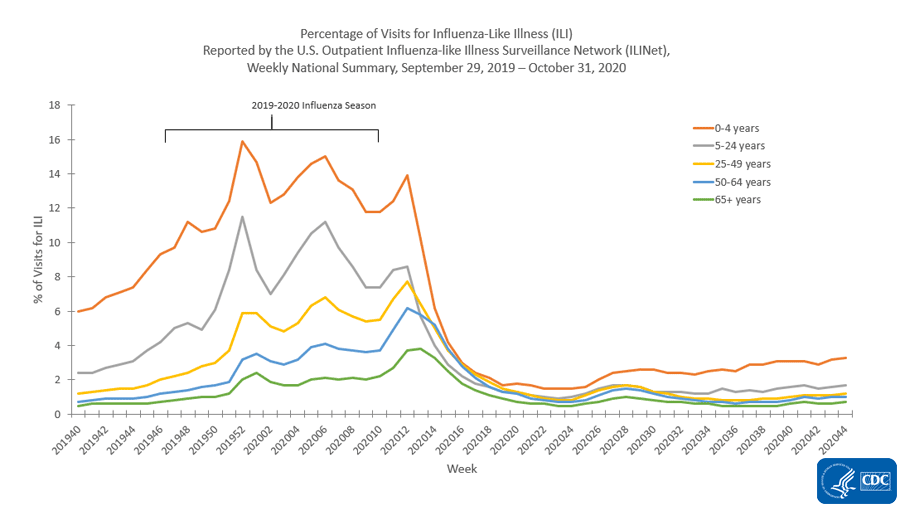
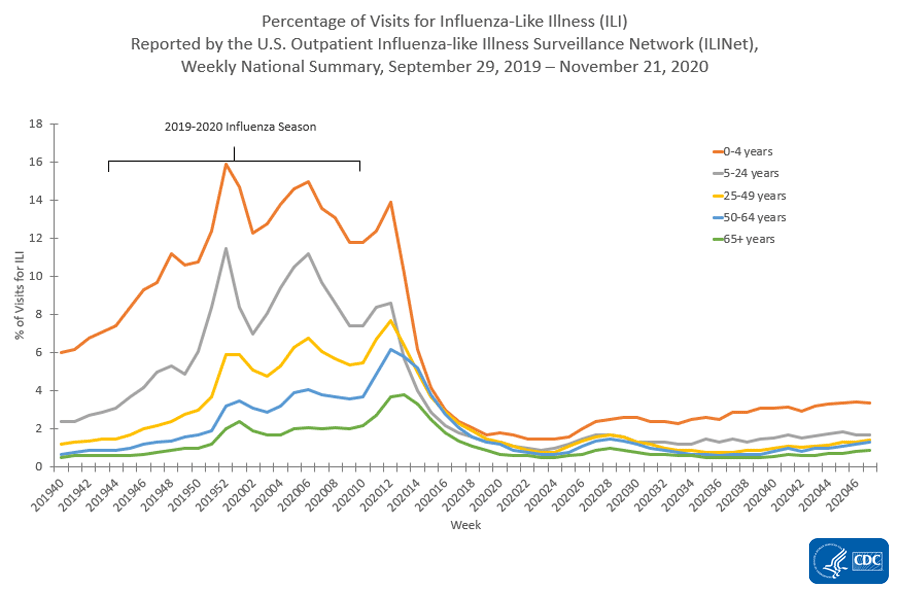
Nationwide during week 32, 1.1% of patient visits reported through ILINet were due to ILI. This percentage is well below the national baseline of 2.4% but, while low overall, is higher than what is typical for this time of year compared to previous influenza seasons. Compared to week 31, the percentage of visits for ILI during week 32 was slightly lower overall. The percentage was slightly higher among those aged 0-4 years during week 32 compared to week 31, while the percentage in all other age groups was lower or the same.
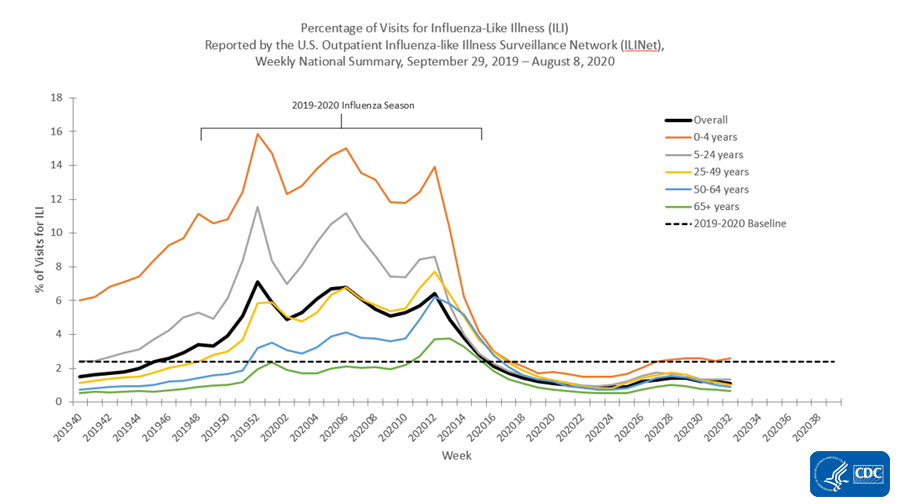
resize iconView Larger


* Age-group specific percentages should not be compared to the national baseline.

On a regional levelexternal icon, the percentage of outpatient visits for ILI ranged from 0.5% to 1.4% during week 32. In all ten regions, the percentage of outpatient visits for ILI is below the region-specific baseline and has either declined or remained stable (changes ≤ 0.1%) over the most recent three weeks.

Note: In response to the COVID-19 pandemic, new data sources will be incorporated into ILINet as we move into summer weeks, when lower levels of influenza and other respiratory virus circulation are typical. Starting in week 21, increases in the number of patient visits will be seen as new sites are enrolled and the percentage of visits for ILI may change in comparison to previous weeks. While all regions remain below baseline levels for ILI, these system changes should be considered when drawing conclusions from these data. Any changes in ILI due to changes in respiratory virus circulation will be highlighted here.
Overall Percentage of Visits for ILI | Age Group ILI Data

ILI Activity Levels


Data collected in ILINet are used to produce a measure of ILI activity for all 50 states, Puerto Rico, the District of Columbia, and New York City. The mean reported percentage of visits due to ILI for the current week is compared to the mean reported during non-influenza weeks, and the activity levels correspond to the number of standard deviations below, at, or above the mean.

The number of jurisdictions at each activity level during week 32 and changes compared to the previous week are summarized in the table below and shown in the following maps.
Activity Level
Week 32
(Week ending
August 8, 2020)
Compared to Previous Week
Very High0No change
High0No change
Moderate1No change
Low0-1
Minimal50+1
Insufficient Data3No change

[TD="colspan: 2"] Number of Jurisdictions [/TD]

*Data collected in ILINet may disproportionally represent certain populations within a state and may not accurately depict the full picture of influenza activity for the whole state. Differences in the data presented here by CDC and independently by some state health departments likely represent differing levels of data completeness with data presented by the state likely being the more complete.
National Syndromic Surveillance Program (NSSP): Emergency Department (ED) Visits


NSSP is a collaboration among CDC, federal partners, local, and state health departments and academic and private sector partners to collect, analyze, and share electronic patient encounter data received from multiple health care settings. To track trends of potential COVID-19 visits, visits for COVID-19-like illness (CLI) (fever and cough or shortness of breath or difficulty breathing or presence of a coronavirus diagnosis code) and ILI to a subset of emergency departments in 47 states are being monitored.

Nationwide during week 32, 2.6% of emergency department visits captured in NSSP were due to CLI and 0.7% were due to ILI. Compared to week 31, this week there was a decrease in both percentages of visits for CLI and ILI. This was the fourth consecutive week the percentages of visits for CLI and ILI decreased. For the past three weeks, the percentages of visits for CLI and ILI decreased or remained stable (changes of ≤ 0.1%) in all ten HHS regionsexternal icon.


Additional information about medically attended outpatient and emergency department visits for ILI and CLI: Surveillance Methods


Hospitalizations


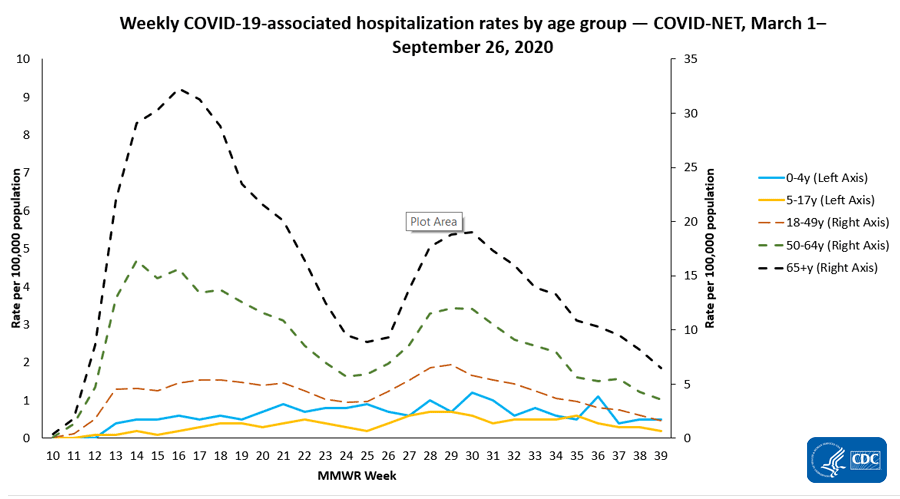
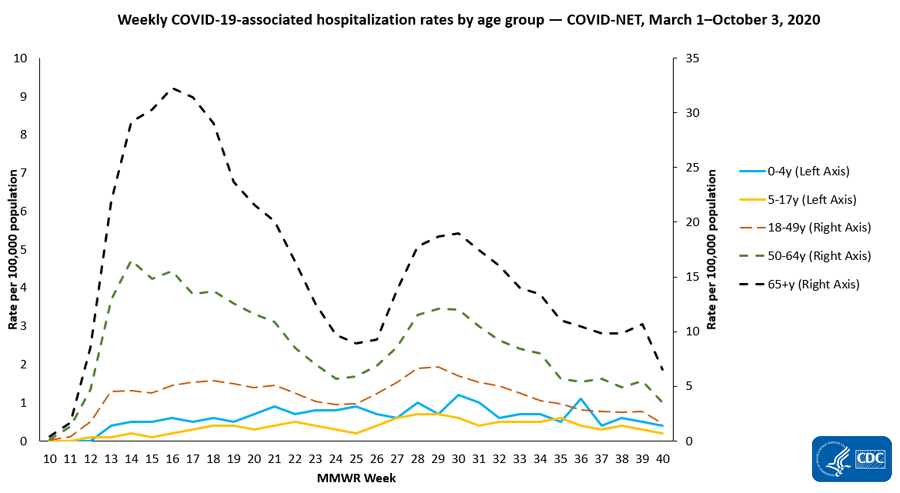
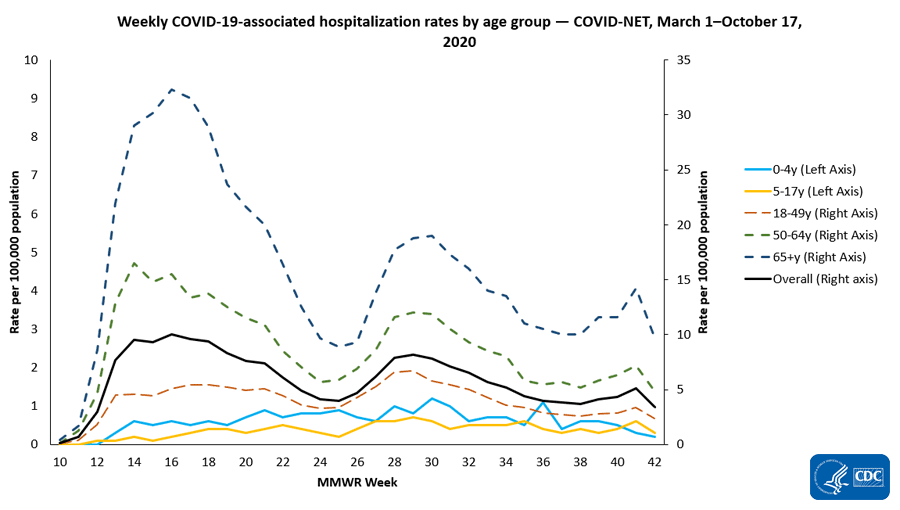
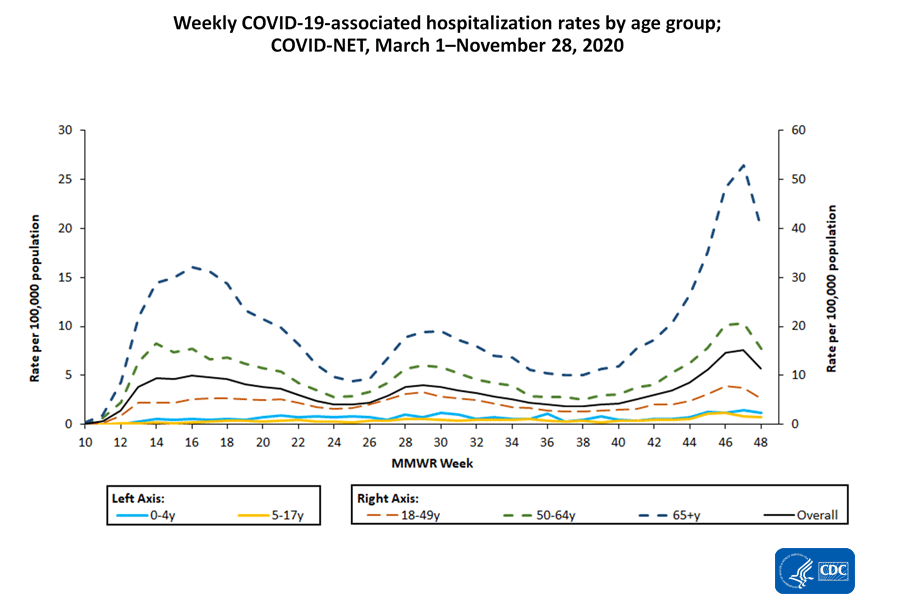
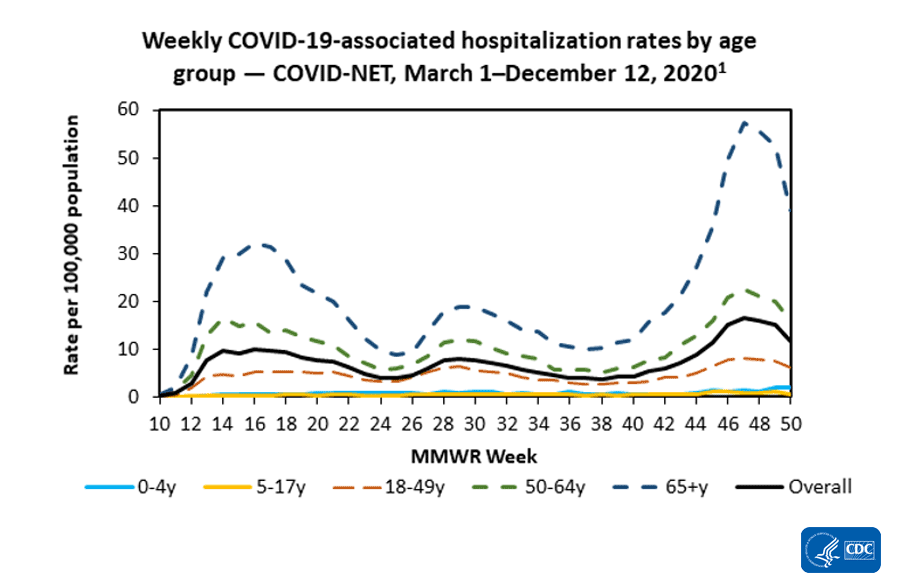
The COVID-19-Associated Hospitalization Surveillance Network (COVID-NET) conducts population-based surveillance for laboratory-confirmed COVID-19-associated hospitalizations in select counties participating in the Emerging Infections Program (EIP) and the Influenza Hospitalization Surveillance Project (IHSP).

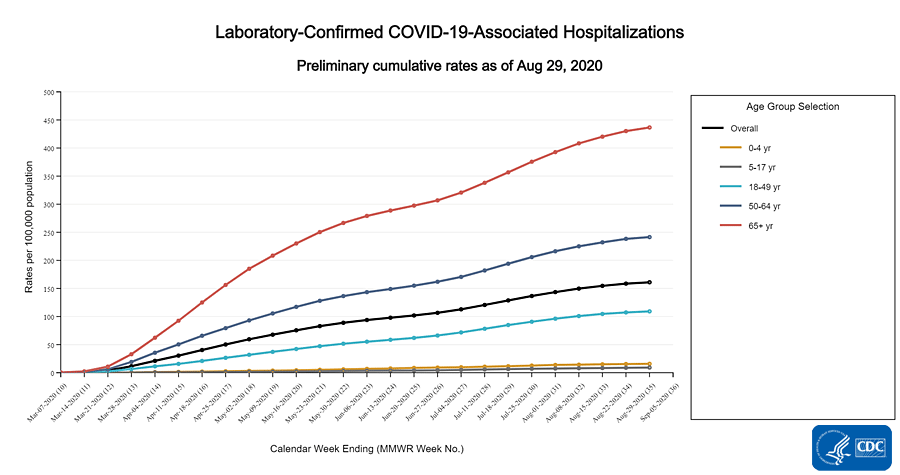
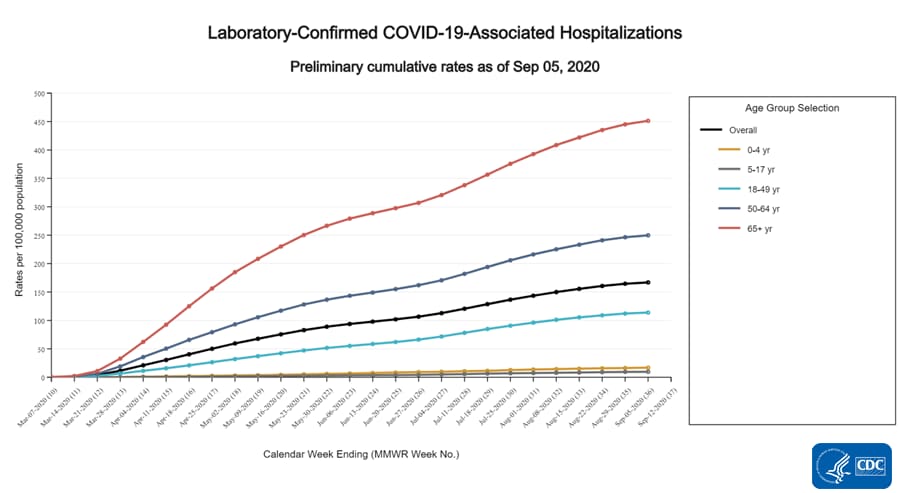
A total of 46,986 laboratory-confirmed COVID-19-associated hospitalizations were reported by sites between March 1, 2020, and August 8, 2020. The overall cumulative hospitalization rate was 144.1 per 100,000 population. Among the 0-4 year, 5-17 year, 18-49 year, 50-64 year, and ≥ 65 year age groups, the highest rate of hospitalization was among adults aged ≥ 65 years, followed by adults aged 50-64 years and adults aged 18-49 years.
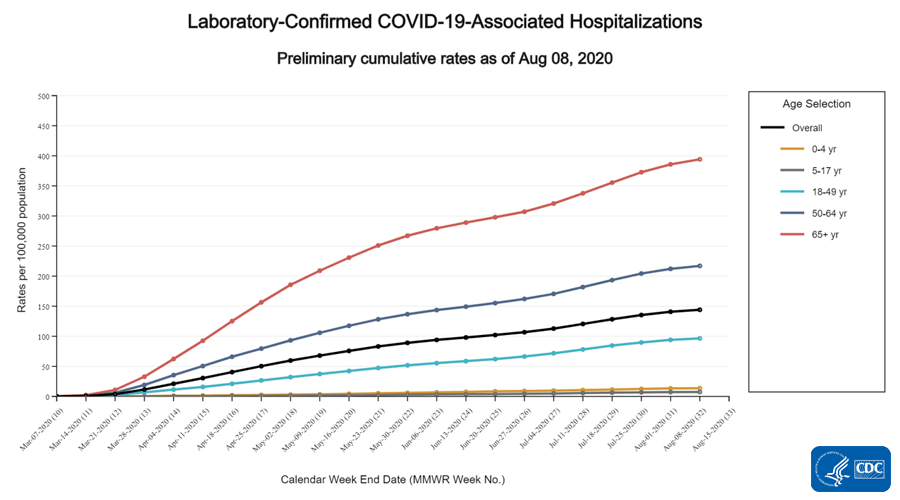
lab-confirmed-hospitalizations.gif

resize iconView Larger
Overall144.1
0-4 years13.6
5-17 years7.4
18-49 years96.5
18-29 years59.5
30-39 years95.5
40-49 years145.5
50-64 years217.0
65+ years394.2
65-74 years294.0
75-84 years467.9
85+ years720.8
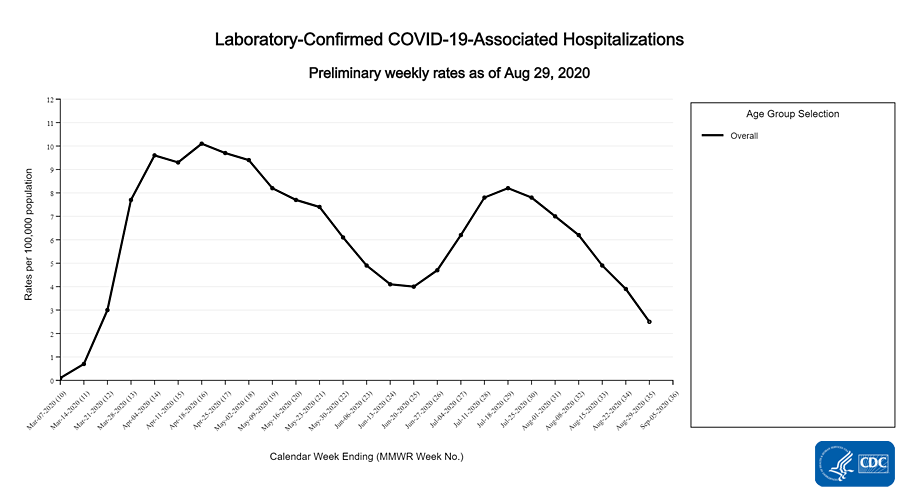
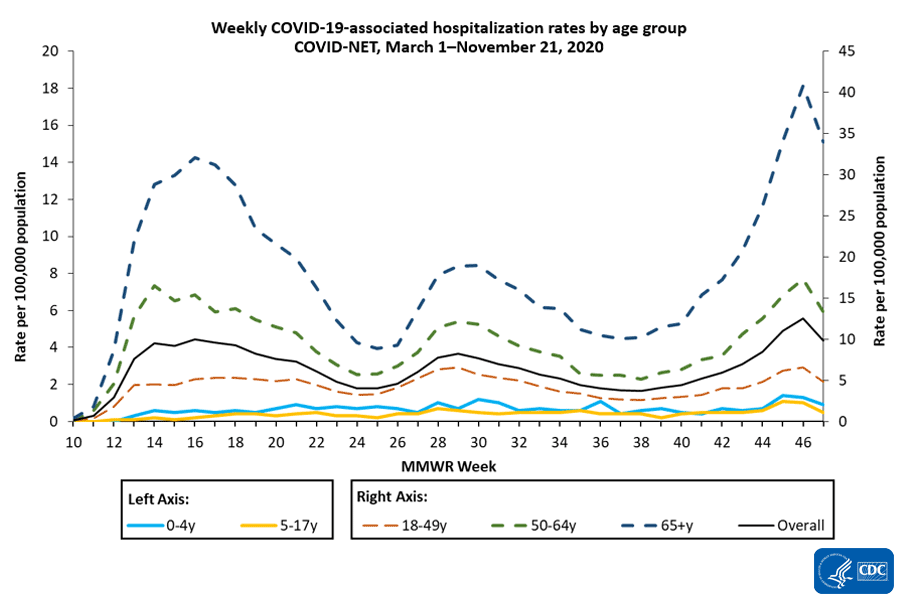
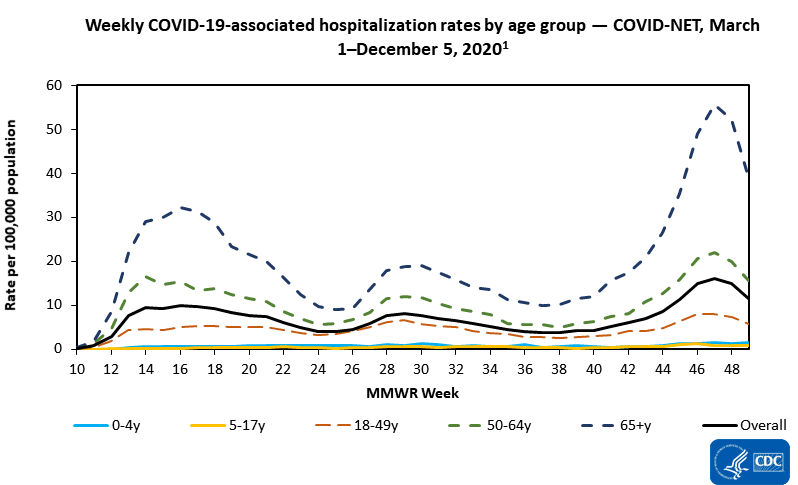
From June 20 (MMWR week 25)–July 18 (MMWR week 29), there was an increase in overall weekly hospitalization rates for four consecutive weeks. Data for the weeks ending July 25, August 1, and August 8 (MMWR weeks 30, 31, and 32) currently show a decline; however, this trend may change as more data for admissions occurring during those weeks are received.
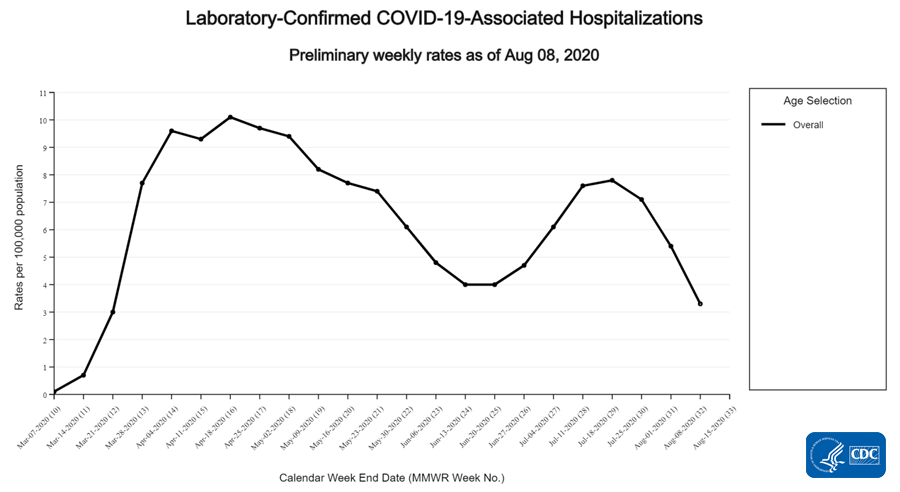
lab-confirmed-hospitalizations-weekly.gif

resize iconView Larger
Among the 46,986 laboratory-confirmed COVID-19-associated hospitalized cases, 44,304 (94.3%) had information on race and ethnicity, while collection of race and ethnicity was still pending for 2,682 (5.7%) cases. When examining overall age-adjusted rates by race/ethnicity, non-Hispanic American Indian or Alaska Native persons had an age-adjusted hospitalization rate approximately 5 times that of non-Hispanic White persons. Rates for non-Hispanic Black persons and Hispanic or Latino persons were both approximately 4.7 times the rate among non-Hispanic White persons.


When examining age-stratified crude hospitalization rates by race and ethnicity, compared with non-Hispanic White persons in the same age group, crude hospitalization rates were 8.3 times higher among Hispanic or Latino persons aged 0-17 years; 9 times higher among both Hispanic or Latino and non-Hispanic American Indian or Alaska Native persons aged 18-49 years; 6.8 times higher among non-Hispanic American Indian or Alaska Native persons aged 50-64 years; and 3.8 times higher among non-Hispanic Black persons aged ≥ 65 years.
Age Category
Rate[SUP]1[/SUP]Rate Ratio[SUP]2,3[/SUP]Rate[SUP]1[/SUP]Rate Ratio[SUP]2,3[/SUP]Rate[SUP]1[/SUP]Rate Ratio[SUP]2,3[/SUP]Rate[SUP]1[/SUP]Rate Ratio[SUP]2,3[/SUP]Rate[SUP]1[/SUP]Rate Ratio[SUP]2,3[/SUP]
0-17y9.74.413.56.118.28.34.52.02.21.0
18-49y231.29.0154.56.0229.29.044.71.725.61.0
50-64y563.66.8451.35.5494.96.0132.01.682.71.0
65+y651.92.7909.43.8634.82.7243.91.0238.61.0
Overall rate[SUP]4[/SUP] (age-adjusted)311.25.0295.24.7293.54.781.81.362.31.0

[TD="colspan: 2"] Non-Hispanic
American Indian or Alaska Native
[/TD]
[TD="colspan: 2"] Non-Hispanic Black [/TD]
[TD="colspan: 2"] Hispanic or Latino [/TD]
[TD="colspan: 2"] Non-Hispanic Asian or Pacific Islander [/TD]
[TD="colspan: 2"] Non-Hispanic White [/TD]
[SUP]1[/SUP] COVID-19-associated hospitalization rates by race/ethnicity are calculated using hospitalized COVID-NET cases with known race and ethnicity for the numerator and NCHS bridged-race population estimates for the denominator.
[SUP]2[/SUP] For each age category, rate ratios are the ratios between crude hospitalization rates within each racial/ethnic group and the crude hospitalization rate among non-Hispanic white persons in the same age category.
[SUP]3[/SUP] The highest rate ratio in each age category is presented in bold.
[SUP]4[/SUP] Overall rates are adjusted to account for differences in age distributions within race/ethnicity strata in the COVID-NET catchment area; the age strata used for the adjustment include 0-17, 18-49, 50-64 and 65+ years.

Non-Hispanic Black persons and non-Hispanic White persons represented the highest proportions of hospitalized cases reported to COVID-NET, followed by Hispanic or Latino, non-Hispanic Asian or Pacific Islander, and non-Hispanic American Indian or Alaska Native persons. However, some racial and ethnic groups are disproportionately represented among hospitalized cases as compared with the overall population of the catchment area. Prevalence ratios show a similar pattern to that of the age-adjusted hospitalization rates: non-Hispanic American Indian or Alaska Native persons have the highest prevalence ratio, followed by non-Hispanic Black, and Hispanic or Latino persons.
1.4%33.2%23.1%4.9%31.3%
0.7%17.9%14.1%8.9%58.5%
2.01.91.60.60.5
[SUP]1[/SUP] Persons of multiple races (0.2%) or unknown race and ethnicity (6%) are not represented in the table but are included as part of the denominator.
[SUP]2[/SUP] Prevalence ratio is calculated as the ratio of the proportion of hospitalized COVID-NET cases over the proportion of population in COVID-NET catchment area.

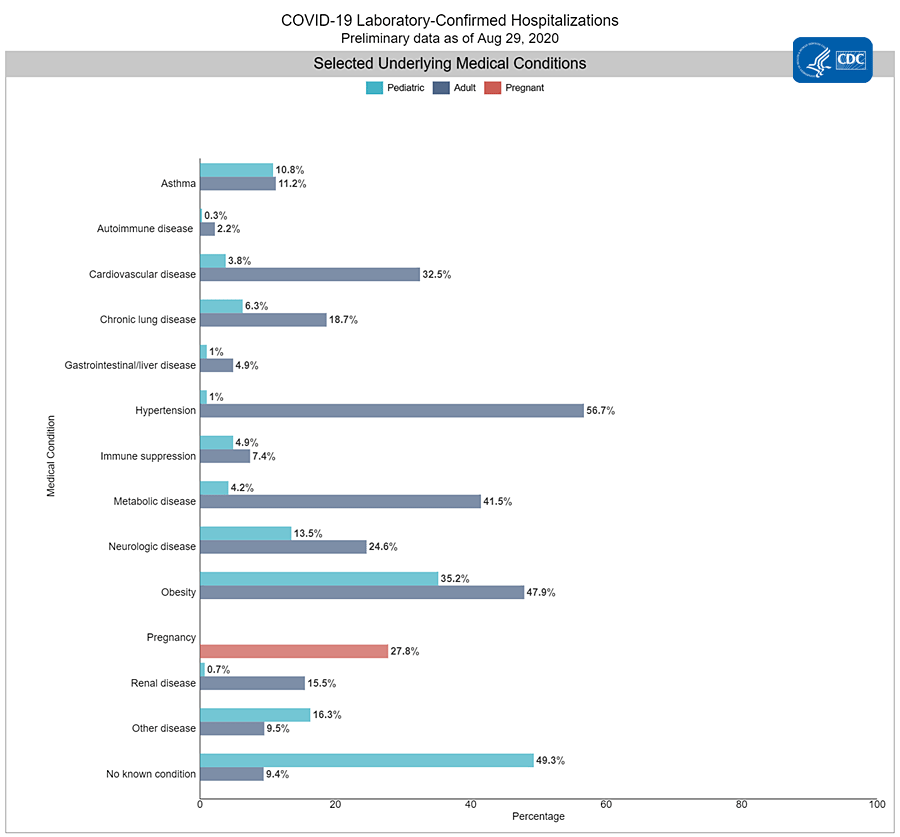
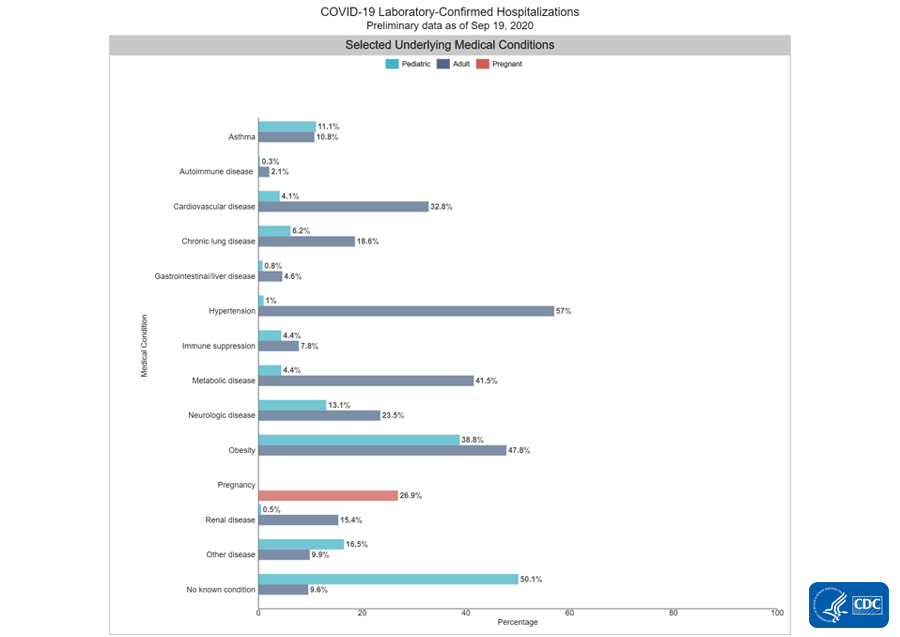
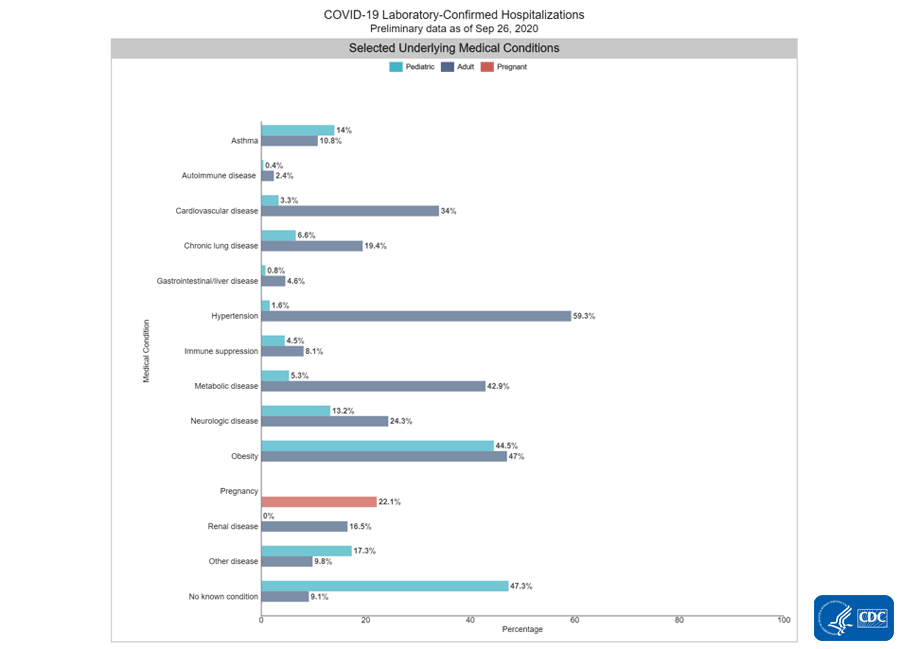
Among 8,777 hospitalized adults with information on underlying medical conditions, 91.5% had at least one reported underlying medical condition. The most commonly reported were hypertension, obesity, metabolic disease, and cardiovascular disease. Among 246 hospitalized children with information on underlying conditions, 50.8% had at least one reported underlying medical condition. The most commonly reported were obesity, neurologic disease, and asthma.
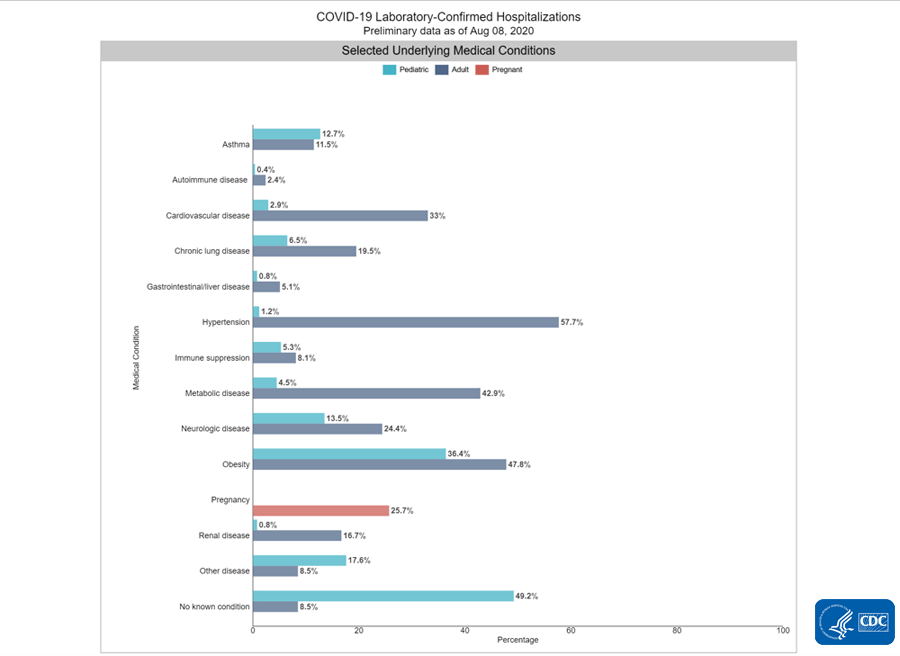
lab-confirmed-hospitalizations-underlying.gif

resize iconView Larger


Additional data on demographics, signs and symptoms at admission, underlying conditions, interventions, outcomes and discharge diagnoses, stratified by age, sex and race and ethnicity, are available.

Additional hospitalization surveillance information: Surveillance Methods | Additional rate data | Additional demographic and clinical data


Mortality Surveillance


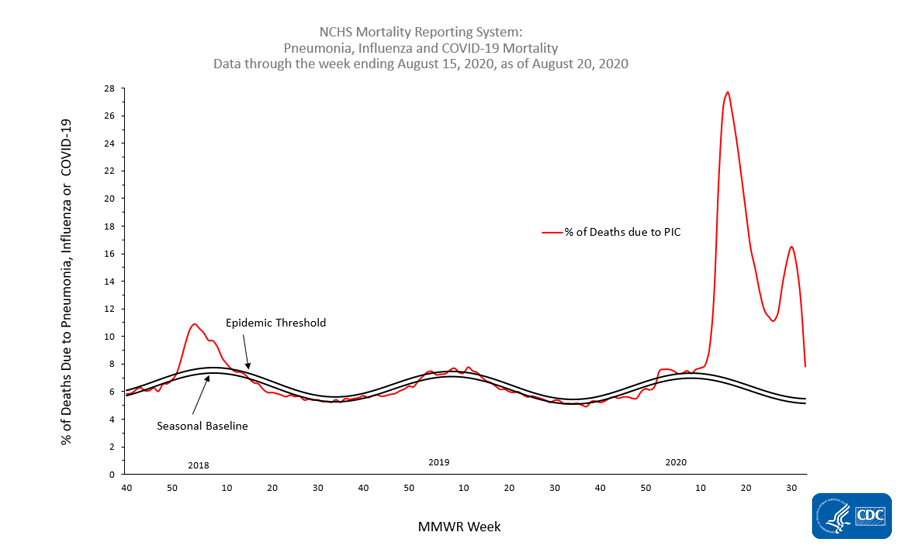
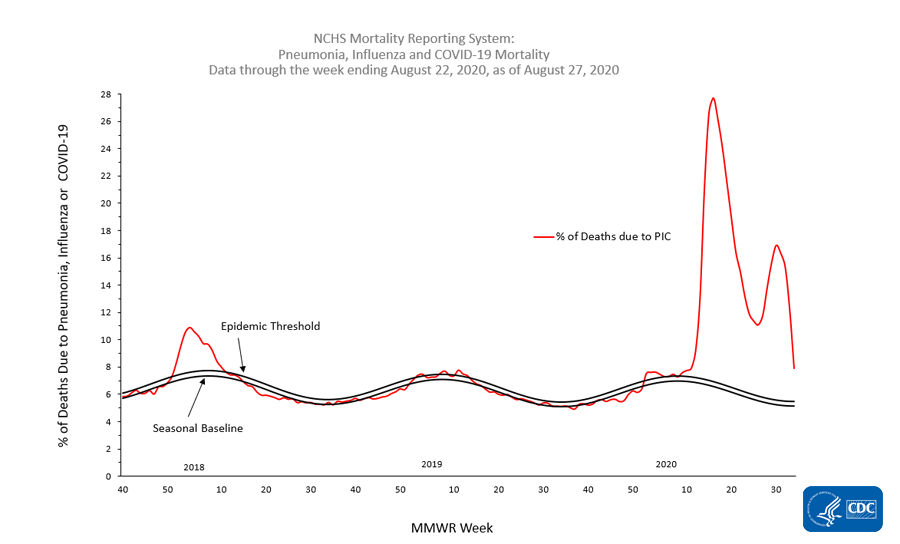
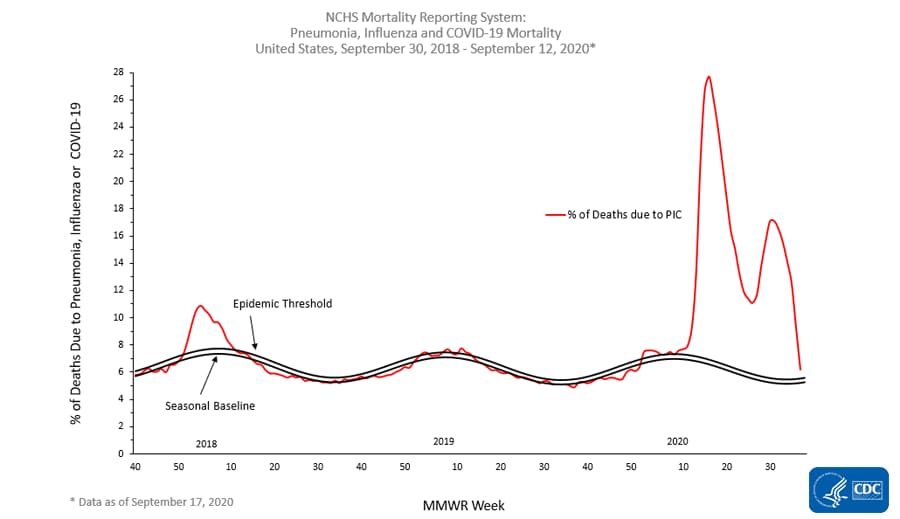
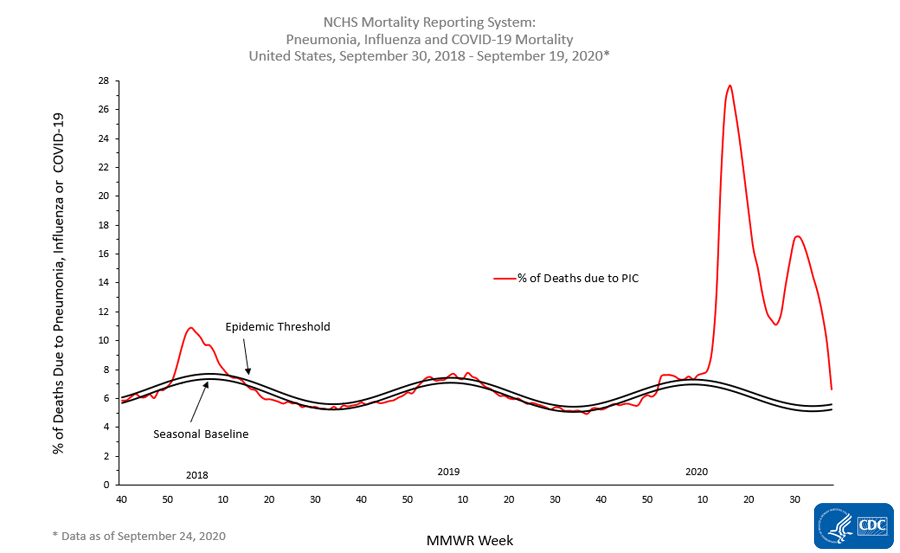
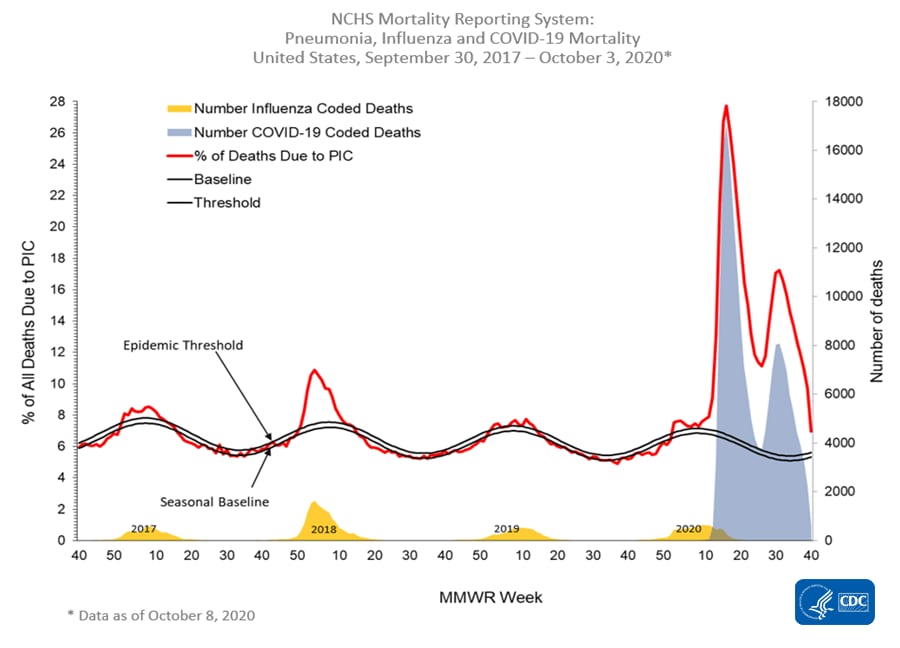
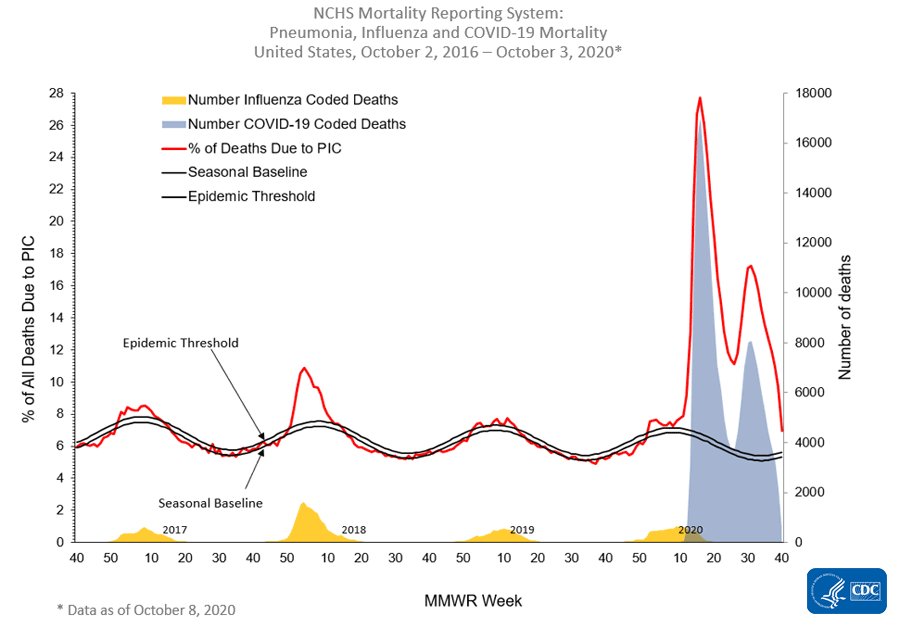
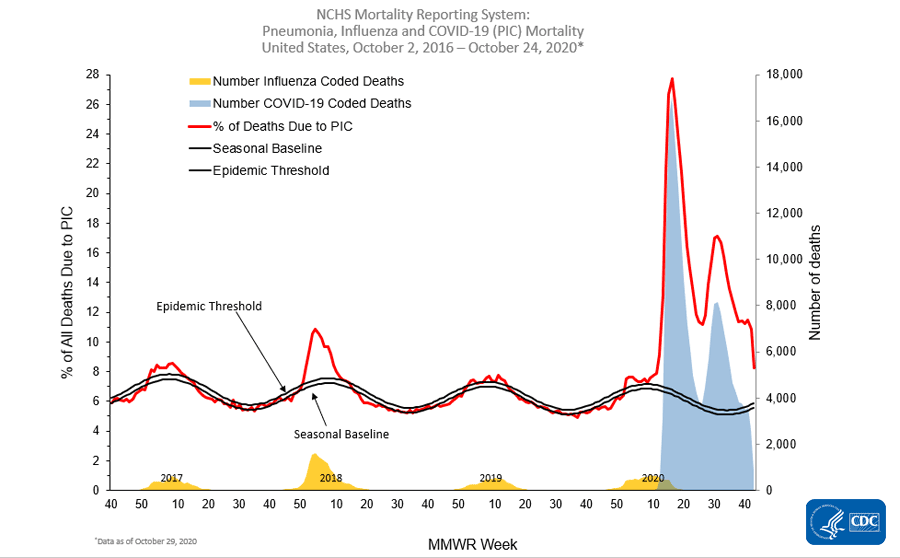
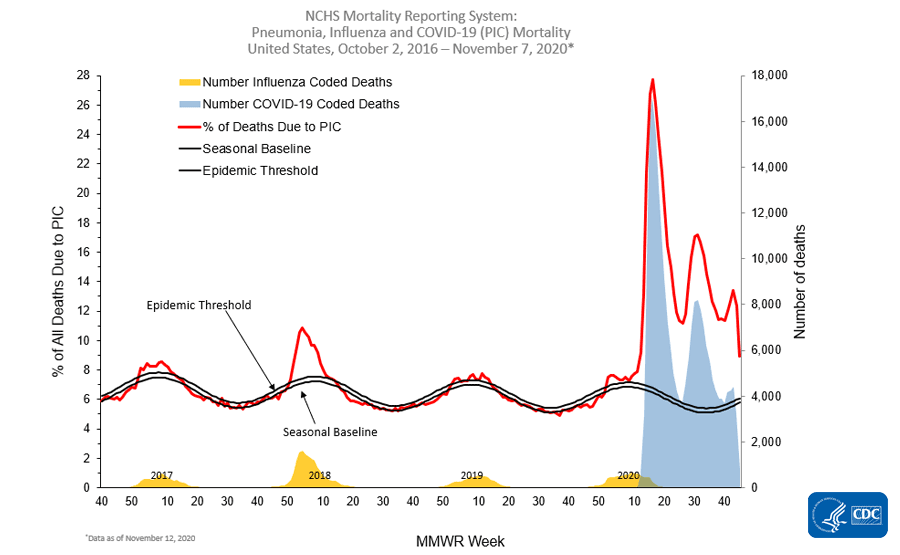
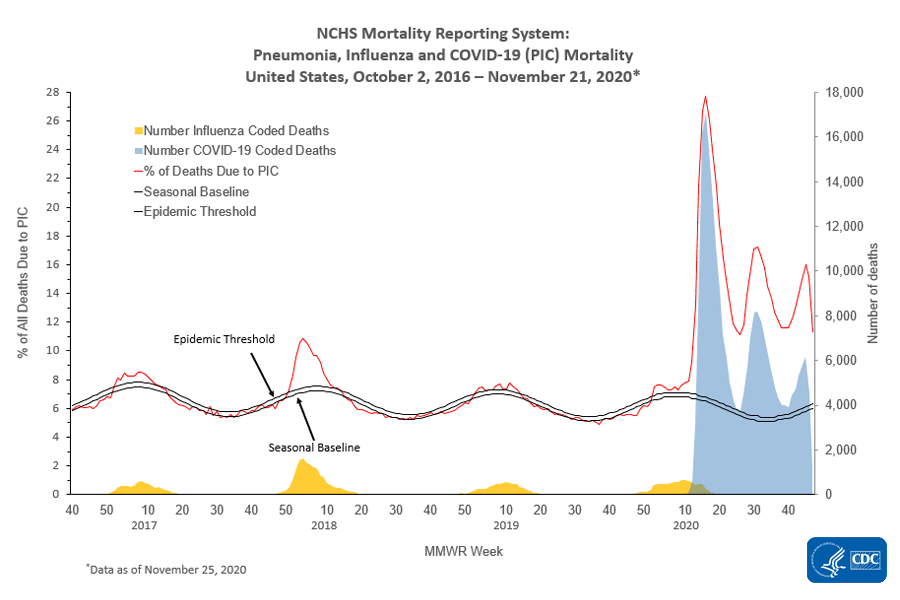
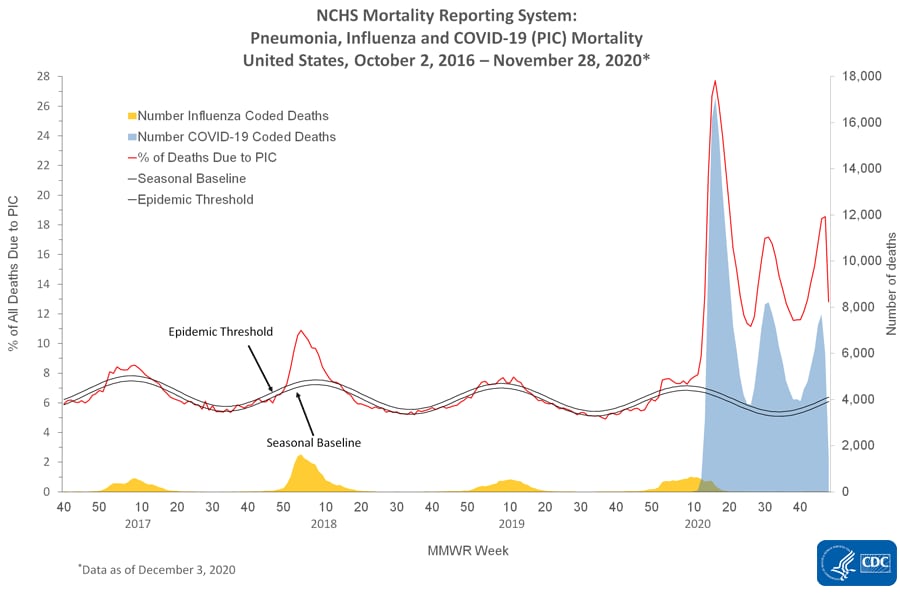
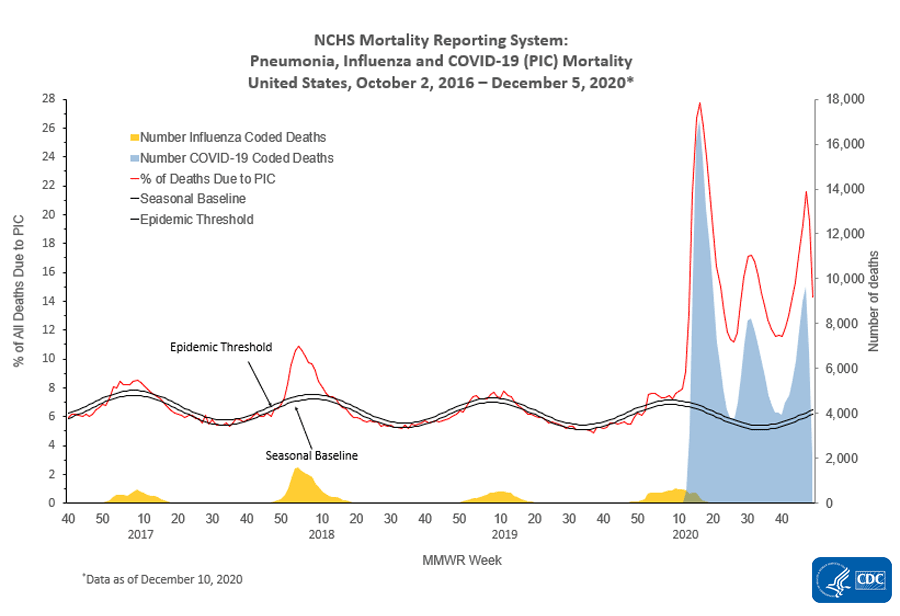
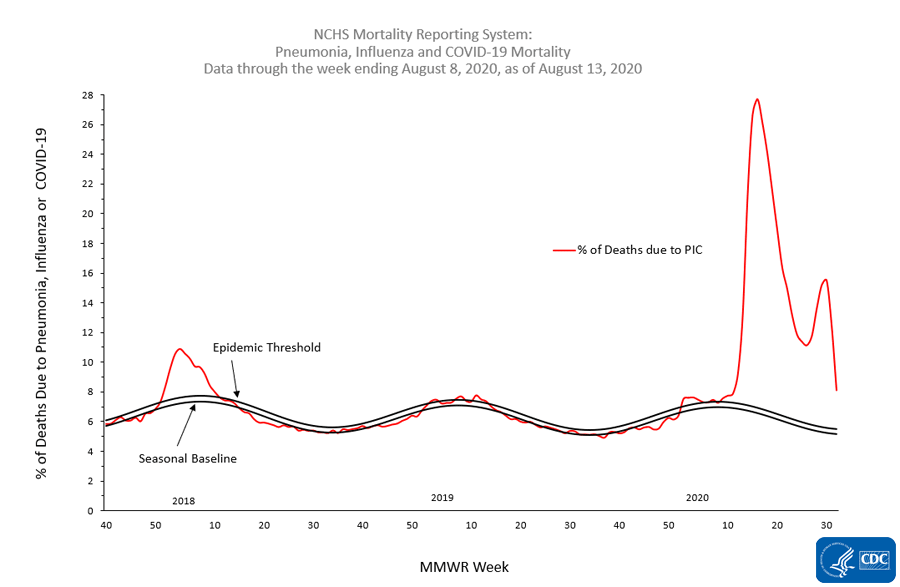
The National Center for Health Statistics (NCHS) collects death certificate data from vital statistics offices for all deaths occurring in the United States. Based on death certificate data available on August 6, 2020, the percentage of deaths attributed to pneumonia, influenza, or COVID-19 (PIC) increased from week 26 – week 30 (June 27 – July 25) after declining for 11 weeks since mid-April. The percentage of deaths due to PIC for week 32 is 8.1% and, while lower than the percentage during week 31 (12.5%), remains above the epidemic threshold. Percentages for recent weeks will likely increase as more death certificates are processed.

Weekly mortality surveillance data include a combination of machine coded and manually coded causes of death collected from death certificates. Percentages of deaths due to PIC are higher among manually coded records than more rapidly available machine coded records. Due to the additional time needed for manual coding, the initially reported PIC percentages may be lower than percentages calculated from final data.
nchs-mortality-report.gif

resize iconView Larger


*Data during recent weeks are incomplete because of the lag in time between when the death occurred and when the death certificate is completed, submitted to NCHS and processed for reporting purposes.
View Data Table


Additional NCHS mortality surveillance information: Surveillance Methods | Provisional Death Counts for COVID-19

More Information
View Page In:pdf icon 14 Pages, 1 MB
Last Updated Aug. 14, 2020

https://www.cdc.gov/coronavirus/2019-ncov/covid-data/covidview/past-reports/08142020.html
 
  1. CASES, DATA & SURVEILLANCE
COVIDView Summary ending on August 15, 2020


Updated Aug. 21, 2020
Print
Download Weekly Summary pdf icon[14 Pages, 1 MB]
Key Updates for Week 33, ending August 15, 2020


Nationally, levels of influenza-like illness (ILI) are below baseline but higher than typically seen at this time of year. Indicators that track ILI and COVID-19-like illness (CLI) and the percentage of laboratory tests positive for SARS-CoV-2 have continued to decrease nationally since mid-July. Regionally, from week 32 to week 33, indicators that track ILI were decreasing or stable (change of ≤0.1%) in nine of ten regions of the country, an indicator that tracks CLI decreased in all regions, and the percentage of laboratory tests positive for SARS-CoV-2 decreased or remained the same in nine of ten regions. Weekly hospitalization rates and mortality attributed to COVID-19 declined during week 33 but may change as more data for admissions and deaths occurring during recent weeks are received. Mortality attributed to COVID-19 remains above the epidemic threshold.
Virus

Public Health, Commercial and Clinical Laboratories


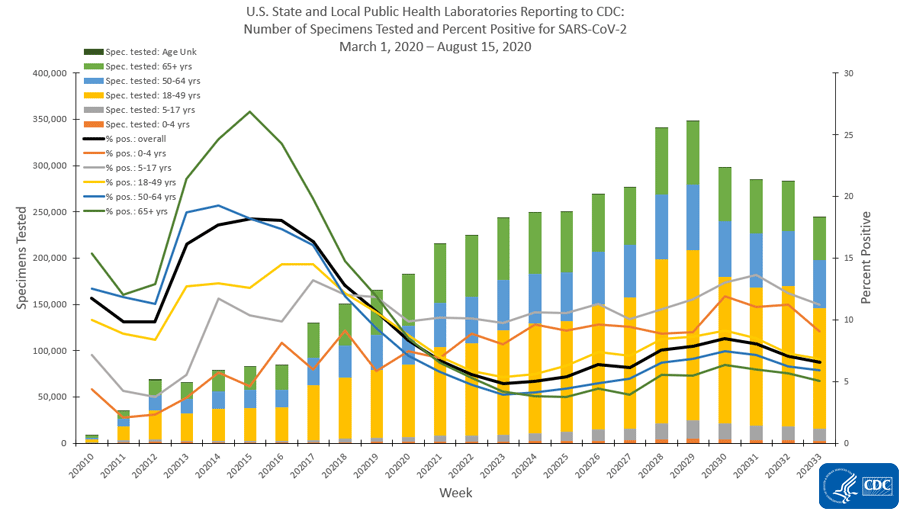
Nationally, the percentage of respiratory specimens testing positive for SARS-CoV-2 decreased from 6.9% during week 32 to 6.3% during week 33 and decreased or remained the same in nine of ten HHS regions. National percentages of specimens testing positive for SARS-CoV-2 by type of laboratory are listed as follows:
  • Public health laboratories – decreased from 7.1% during week 32 to 6.6% during week 33;
  • Clinical laboratories – decreased from 5.9% during week 32 to 5.7% during week 33;
  • Commercial laboratories – decreased from 7.0% during week 32 to 6.3% during week 33.
Outpatient and Emergency Department Visits

Outpatient Influenza-Like Illness Network (ILINet) and National Syndromic Surveillance Program (NSSP)


Two surveillance networks are being used to track outpatient or emergency department (ED) visits for illness with symptoms compatible with COVID-19.
  • Nationally, ILI activity remains below baseline for the eighteenth week but is higher than typically seen at this time of year.
  • Nationally, during week 33, the percentage of visits reported by ILINet participants for ILI was 1.0% and has declined for four consecutive weeks; the percentage of visits for CLI reported to NSSP was 2.3% and has declined for five consecutive weeks.
  • Recent changes in health care seeking behavior, including increasing use of telemedicine, recommendations to limit emergency department (ED) visits to severe illnesses, and increased social distancing, are likely affecting data reported from both networks, making it difficult to draw conclusions at this time. Tracking these systems moving forward will give additional insight into illness related to COVID-19.
Severe Disease

Hospitalizations


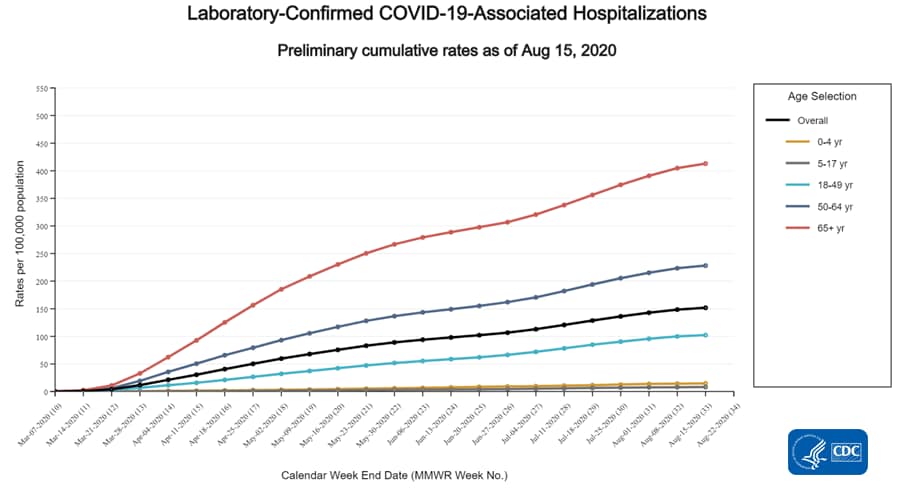
Cumulative COVID-19-associated hospitalization rates since March 1, 2020, are updated weekly. The overall cumulative COVID-19 hospitalization rate is 151.7 per 100,000, with the highest rates in people aged 65 years and older (412.9 per 100,000) and 50-64 years (228.1 per 100,000).
Mortality


Based on death certificate data, the percentage of deaths attributed to pneumonia, influenza, or COVID-19 (PIC) for week 33 is 7.8%. This is currently lower than the percentage during week 32 (12.6%); however, the percentage remains above the epidemic threshold and will likely increase as more death certificates are processed.

All data are preliminary and may change as more reports are received.

A description of the surveillance systems summarized in COVIDView, including methodology and detailed descriptions of each data component, is available on the surveillance methods page.
Key Points
  • Nationally, the percentage of specimens testing positive for SARS-CoV-2 and the percentages of visits for ILI and CLI have continued to decrease since mid-July.
  • Using combined data from the three laboratory types, the national percentage of respiratory specimens testing positive for SARS-CoV-2 with a molecular assay decreased from 6.9% during week 32 to 6.3% during week 33.
    • Regionally, the percentage of respiratory specimens testing positive for SARS-CoV-2 also declined or remained the same in nine of ten HHS regions. In Region 7 (Central), the percentage of respiratory specimens testing positive for SARS-CoV-2 has been increasing for 10 weeks.
    • The highest percentages of specimens testing positive for SARS-CoV-2 were seen in Regions 4 (South East, 10.3%), 6 (South Central, 11.7%), and 7 (Central, 9.2%). The percentage is decreasing in Regions 4 (South East) and 6 (South Central) and increasing in Region 7 (Central).
  • The percentage of outpatient and ED visits for ILI are below baseline nationally and in all regions of the country; however, ILI activity is above what is typical for this time of year. The percentage of visits to EDs for CLI decreased nationally for the fifth consecutive week and, compared to the previous week, decreased in all ten HHS regions.
    • Systems monitoring ILI and CLI may be influenced by recent changes in health care seeking behavior, including increasing use of telemedicine, recommendations to limit emergency department (ED) visits to severe illnesses, and increased social distancing.
  • The overall cumulative COVID-19-associated hospitalization rate was 151.7 per 100,000; rates were highest in people 65 years of age and older (412.9 per 100,000) followed by people 50-64 years (228.1 per 100,000).
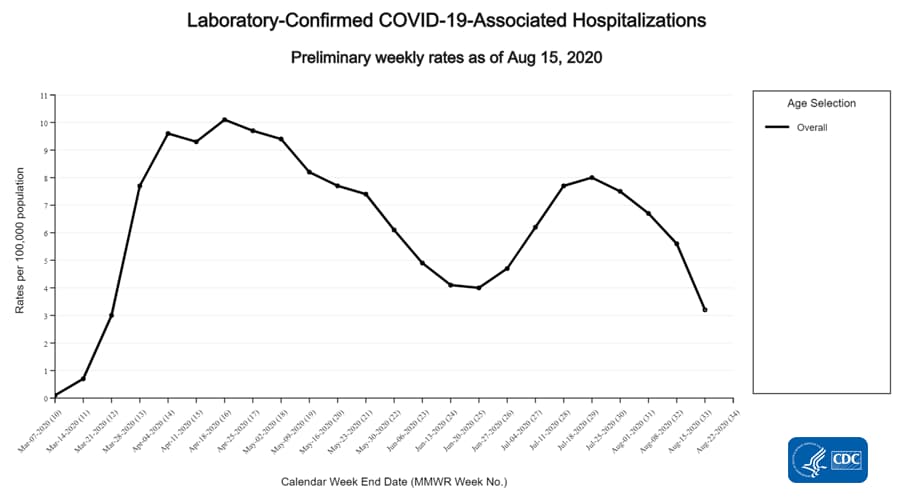
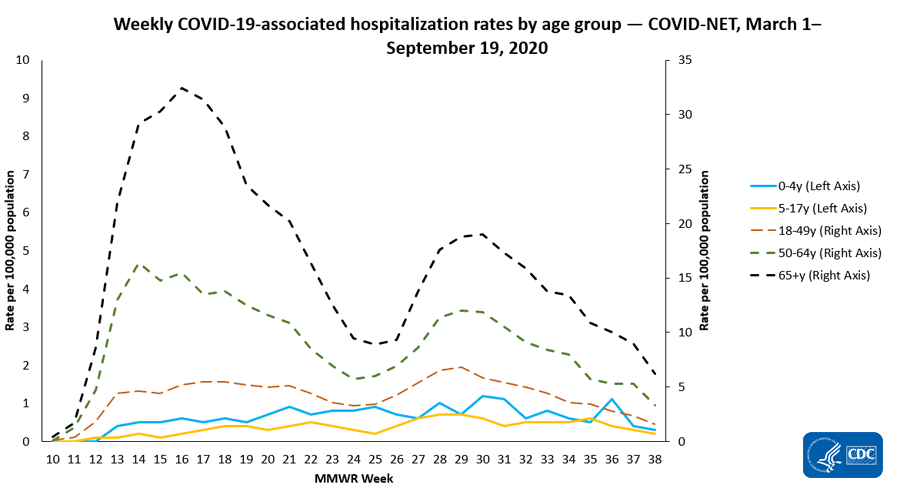
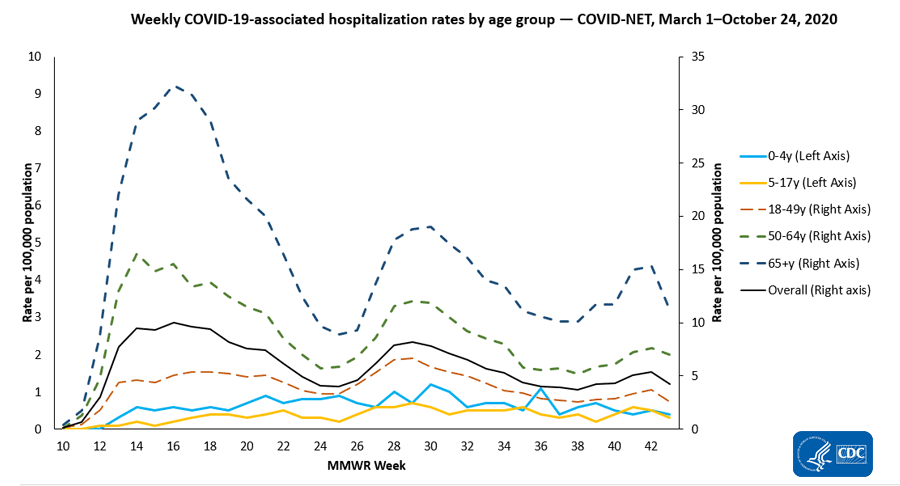
    • Weekly hospitalization rates among all ages first peaked during the week ending April 18 (MMWR week 16) at 10.1 per 100,000 population, followed by a second peak during the week ending July 18 (MMWR week 29) at 8.0 per 100,000 population. Data for the most recent weeks may change as additional admissions occurring during those weeks are reported.
    • Non-Hispanic American Indian or Alaska Native persons had an age-adjusted hospitalization rate approximately 4.9 times that of non-Hispanic White persons. Rates among non-Hispanic Black persons and Hispanic or Latino persons were both approximately 4.7 times the rate among non-Hispanic White persons.
  • Based on death certificate data, the percentage of deaths attributed to pneumonia, influenza or COVID-19 (PIC) increased from week 26 – week 30 (weeks ending June 27 – July 25) after declining for 11 weeks since mid-April. The percentage of deaths due to PIC for week 33 is 7.8%, lower than the percentage during week 32 (12.6%), but above the epidemic threshold. These percentages will likely increase as more death certificates are processed.
  • All surveillance systems aim to provide the most complete data available. Estimates from previous weeks are subject to change as data are updated with the most complete data available.
U.S. Virologic Surveillance


The number of specimens tested for SARS-CoV-2 using a molecular assay and reported to CDC by public health laboratories and a subset of clinical and commercial laboratories in the United States are summarized below. All laboratories are performing primary diagnostic functions; therefore, the percentage of specimens testing positive across laboratory types can be used to monitor overall trends in COVID-19 activity. As the outbreak progresses, it is possible that different types of laboratories will take on different roles, and the data interpretation may need to change.
2,048,39840,713,070
244,0454,581,562
136,7444,183,719
1,667,60931,947,789
128,555 (6.3%)3,692,858 (9.1%)
16,041 (6.6%)375,567 (8.2%)
7,757 (5.7%)262,436 (6.3%)
104,757 (6.3%)3,054,855 (9.6%)
* Commercial and clinical laboratory data represent select laboratories and do not capture all tests performed in the United States.
Public Health Laboratories


resize iconView LargerView Data Table

Clinical Laboratories


resize iconView LargerView Data Table

Commercial Laboratories


resize iconView Larger


* Commercial laboratories began testing for SARS-CoV-2 in early March, but the number and geographic distribution of reporting commercial laboratories became stable enough to calculate a weekly percentage of specimens testing positive as of March 29, 2020.
View Data Table


Additional virologic surveillance information: Surveillance Methods


Outpatient/Emergency Department Illness


Two syndromic surveillance systems are being used to monitor trends in outpatient and emergency department (ED) visits that may be associated with COVID-19 illness. Each system monitors a slightly different syndrome, and together, these systems provide a more comprehensive picture of mild-to-moderate COVID-19 illness than either would individually. Both systems are currently being affected by changes in health care seeking behavior, including increased use of telemedicine, compliance with recommendations to limit ED visits to severe illnesses, and increased social distancing. These changes affect the numbers of people seeking care in the outpatient and ED settings and their reasons for doing so.
ILINet


The U.S. Outpatient Influenza-like Illness Surveillance Network (ILINet) provides data on visits for influenza-like illness (ILI) (fever [≥100[SUP]○[/SUP]F] and cough and/or sore throat) to approximately 2,600 primary care providers, emergency departments, and urgent care centers in all 50 states, Puerto Rico, the District of Columbia, and the U.S. Virgin Islands. Mild COVID-19 illness presents with symptoms similar to ILI, so ILINet is being used to track trends of mild-to-moderate COVID-19 illness and allows for comparison with prior influenza seasons.

Nationwide during week 33, 1.0% of patient visits reported through ILINet were due to ILI. This percentage is well below the national baseline of 2.4% but, while low overall, is higher than what is typical for this time of year compared to previous influenza seasons. Compared to week 32, the percentage of visits for ILI during week 33 was slightly lower overall and lower or the same in all age groups.

resize iconView Larger


* Age-group specific percentages should not be compared to the national baseline.

On a regional levelexternal icon, the percentage of outpatient visits for ILI ranged from 0.6% to 1.4% during week 33. In all ten regions, the percentage of outpatient visits for ILI is below the region-specific baseline. Compared to week 32, the percentage in week 33 was lower or stable (changes ≤0.1%) in nine of ten HHS regions; a slight increase was seen in Region 3 (Mid-Atlantic).

Note: In response to the COVID-19 pandemic, new data sources are being incorporated into ILINet through the summer weeks, when lower levels of influenza and other respiratory virus circulation are typical. Starting in week 21, enrollment of new sites began, leading to increases in the number of patient visits. While all regions remain below baseline levels for ILI, these system changes should be considered when drawing conclusions from these data. Any changes in ILI due to changes in respiratory virus circulation will be highlighted here.
Overall Percentage of Visits for ILI | Age Group ILI Data

ILI Activity Levels


Data collected in ILINet are used to produce a measure of ILI activity for all 50 states, Puerto Rico, the District of Columbia, and New York City. The mean reported percentage of visits due to ILI for the current week is compared to the mean reported during non-influenza weeks, and the activity levels correspond to the number of standard deviations below, at, or above the mean.

The number of jurisdictions at each activity level during week 33 and changes compared to the previous week are summarized in the table below and shown in the following maps.
Activity Level
Week 33
(Week ending
August 15, 2020)
Compared to Previous Week
Very High0No change
High0No change
Moderate1No change
Low0No change
Minimal50No change
Insufficient Data3No change

[TD="colspan: 2"] Number of Jurisdictions [/TD]

*Data collected in ILINet may disproportionally represent certain populations within a state and may not accurately depict the full picture of influenza activity for the whole state. Differences in the data presented here by CDC and independently by some state health departments likely represent differing levels of data completeness with data presented by the state likely being the more complete.
National Syndromic Surveillance Program (NSSP): Emergency Department (ED) Visits


NSSP is a collaboration among CDC, federal partners, local, and state health departments and academic and private sector partners to collect, analyze, and share electronic patient encounter data received from multiple health care settings. To track trends of potential COVID-19 visits, visits for COVID-19-like illness (CLI) (fever and cough or shortness of breath or difficulty breathing or presence of a coronavirus diagnosis code) and ILI to a subset of emergency departments in 47 states are being monitored.

Nationwide during week 33, 2.3% of emergency department visits captured in NSSP were due to CLI and 0.7% were due to ILI. Compared to week 32, this week there was a decrease in the percentage of visits for CLI whereas the percentage of visits for ILI remained stable. This was the fifth consecutive week the percentages of visits for CLI and ILI decreased or remained stable. For the past four weeks, the percentages of visits for CLI and ILI decreased or remained stable (changes of ≤0.1%) in all 10 HHS regionsexternal icon.


Additional information about medically attended outpatient and emergency department visits for ILI and CLI: Surveillance Methods


Hospitalizations


The COVID-19-Associated Hospitalization Surveillance Network (COVID-NET) conducts population-based surveillance for laboratory-confirmed COVID-19-associated hospitalizations in select counties participating in the Emerging Infections Program (EIP) and the Influenza Hospitalization Surveillance Project (IHSP).

A total of 49,451 laboratory-confirmed COVID-19-associated hospitalizations were reported by sites between March 1, 2020, and August 15, 2020. The overall cumulative hospitalization rate was 151.7 per 100,000 population. Among the 0-4 year, 5-17 year, 18-49 year, 50-64 year, and ≥65 year age groups, the highest rate of hospitalization was among adults aged ≥65 years, followed by adults aged 50-64 years and adults aged 18-49 years.
lab-confirmed-hospitalizations.gif

resize iconView Larger
Overall151.7
0-4 years14.7
5-17 years8.1
18-49 years102.2
18-29 years64.1
30-39 years100.9
40-49 years152.9
50-64 years228.1
65+ years412.9
65-74 years308.6
75-84 years490.4
85+ years751.2
Weekly hospitalization rates among all ages first peaked during the week ending April 18 (MMWR week 16) at 10.1 per 100,000 population, followed by a second peak during the week ending July 18 (MMWR week 29) at 8.0 per 100,000 population. Data for the most recent weeks may change as additional admissions occurring during those weeks are reported.
lab-confirmed-hospitalizations-weekly.gif

resize iconView Larger


Among the 49,451 laboratory-confirmed COVID-19-associated hospitalized cases, 46,026 (93.1%) had information on race and ethnicity, while collection of race and ethnicity was still pending for 3,425 (6.9%) cases. When examining overall age-adjusted rates by race/ethnicity, non-Hispanic American Indian or Alaska Native persons had an age-adjusted hospitalization rate approximately 4.9 times that of non-Hispanic White persons. Rates for non-Hispanic Black persons and Hispanic or Latino persons were both approximately 4.7 times the rate among non-Hispanic White persons.


When examining age-stratified crude hospitalization rates by race and ethnicity, compared with non-Hispanic White persons in the same age group, crude hospitalization rates were 8.1 times higher among Hispanic or Latino persons aged 0-17 years; 8.8 times higher among both non-Hispanic American Indian or Alaska Native persons and Hispanic or Latino persons aged 18-49 years; 6.6 times higher among non-Hispanic American Indian or Alaska Native persons aged 50-64 years; and 3.8 times higher among non-Hispanic Black persons aged ≥65 years.
Age Category
Rate[SUP]1[/SUP]Rate Ratio[SUP]2,3[/SUP]Rate[SUP]1[/SUP]Rate Ratio[SUP]2,3[/SUP]Rate[SUP]1[/SUP]Rate Ratio[SUP]2,3[/SUP]Rate[SUP]1[/SUP]Rate Ratio[SUP]2,3[/SUP]Rate[SUP]1[/SUP]Rate Ratio[SUP]2,3[/SUP]
0-17y9.74.014.15.919.48.15.02.12.41.0
18-49y237.08.8160.76.0237.98.847.41.826.91.0
50-64y568.96.6466.25.4514.55.9138.01.686.81.0
65+y660.32.7936.73.8665.82.7257.51.0247.21.0
Overall rate[SUP]4[/SUP] (age-adjusted)316.54.9304.94.7305.84.786.21.365.01.0

[TD="colspan: 2"] Non-Hispanic
American Indian or Alaska Native
[/TD]
[TD="colspan: 2"] Non-Hispanic Black [/TD]
[TD="colspan: 2"] Hispanic or Latino [/TD]
[TD="colspan: 2"] Non-Hispanic Asian or Pacific Islander [/TD]
[TD="colspan: 2"] Non-Hispanic White [/TD]
[SUP]1[/SUP] COVID-19-associated hospitalization rates by race/ethnicity are calculated using hospitalized COVID-NET cases with known race and ethnicity for the numerator and NCHS bridged-race population estimates for the denominator.
[SUP]2[/SUP] For each age category, rate ratios are the ratios between crude hospitalization rates within each racial/ethnic group and the crude hospitalization rate among non-Hispanic white persons in the same age category.
[SUP]3[/SUP] The highest rate ratio in each age category is presented in bold.
[SUP]4[/SUP] Overall rates are adjusted to account for differences in age distributions within race/ethnicity strata in the COVID-NET catchment area; the age strata used for the adjustment include 0-17, 18-49, 50-64, and 65+ years.

Non-Hispanic Black persons and non-Hispanic White persons represented the highest proportions of hospitalized cases reported to COVID-NET, followed by Hispanic or Latino, non-Hispanic Asian or Pacific Islander, and non-Hispanic American Indian or Alaska Native persons. However, some racial and ethnic groups are disproportionately represented among hospitalized cases as compared with the overall population of the catchment area. Prevalence ratios showed a similar pattern to that of the age-adjusted hospitalization rates: non-Hispanic American Indian or Alaska Native persons had the highest prevalence ratio, followed by non-Hispanic Black and Hispanic or Latino persons.
1.3%33.0%23.1%5.0%31.4%
0.7%17.9%14.1%8.9%58.5%
1.91.81.60.60.5
[SUP]1[/SUP] Persons of multiple races (0.2%) or unknown race and ethnicity (6%) are not represented in the table but are included as part of the denominator.
[SUP]2[/SUP] Prevalence ratio is calculated as the ratio of the proportion of hospitalized COVID-NET cases over the proportion of population in COVID-NET catchment area.

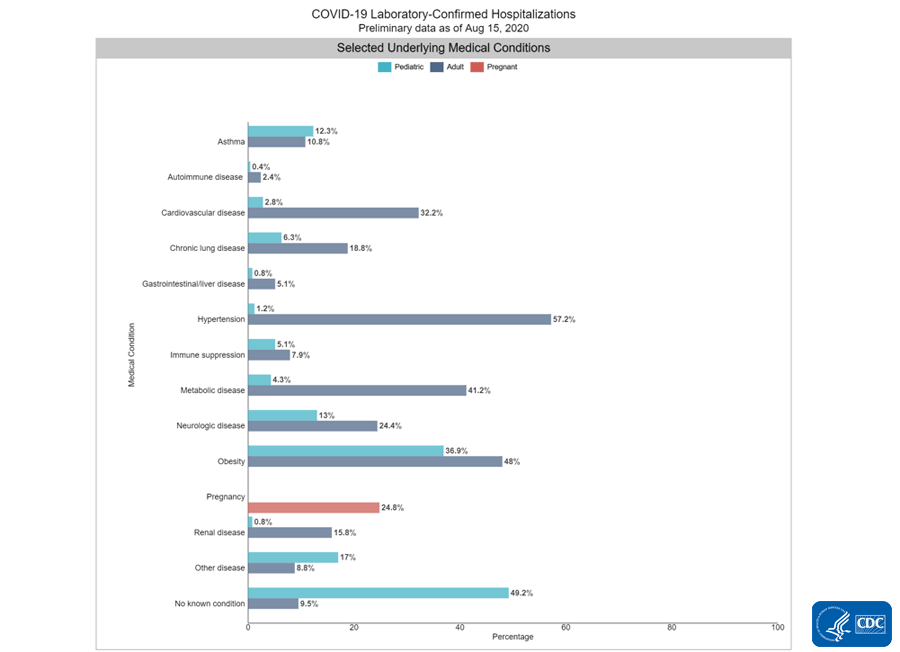
Among 9,400 hospitalized adults with information on underlying medical conditions, 90.5% had at least one reported underlying medical condition. The most commonly reported were hypertension, obesity, metabolic disease, and cardiovascular disease. Among 254 hospitalized children with information on underlying conditions, 50.8% had at least one reported underlying medical condition. The most commonly reported were obesity, neurologic disease, and asthma.
lab-confirmed-hospitalizations-underlying.gif

resize iconView Larger


Additional data on demographics, signs and symptoms at admission, underlying conditions, interventions, outcomes and discharge diagnoses, stratified by age, sex and race and ethnicity, are available.

Additional hospitalization surveillance information: Surveillance Methods | Additional rate data | Additional demographic and clinical data


Mortality Surveillance


The National Center for Health Statistics (NCHS) collects death certificate data from vital statistics offices for all deaths occurring in the United States. Based on death certificate data available on August 20, 2020, the percentage of deaths attributed to pneumonia, influenza, or COVID-19 (PIC) increased from week 26 – week 30 (June 27 – July 25) after declining for 11 weeks since mid-April. The percentage of deaths due to PIC for week 33 is 7.8% and, while lower than the percentage during week 32 (12.6%), remains above the epidemic threshold. Percentages for recent weeks will likely increase as more death certificates are processed.

Weekly mortality surveillance data include a combination of machine coded and manually coded causes of death collected from death certificates. Percentages of deaths due to PIC are higher among manually coded records than more rapidly available machine coded records. Due to the additional time needed for manual coding, the initially reported PIC percentages may be lower than percentages calculated from final data.
nchs-mortality-report.gif

resize iconView Larger


*Data during recent weeks are incomplete because of the lag in time between when the death occurred and when the death certificate is completed, submitted to NCHS and processed for reporting purposes.
View Data Table


Additional NCHS mortality surveillance information: Surveillance Methods | Provisional Death Counts for COVID-19

More Information
View Page In:pdf icon 14 Pages, 1 MB
Last Updated Aug. 21, 2020
Content source: National Center for Immunization and Respiratory Diseases (NCIRD), Division of Viral DiseaseshomeCases, Data & Surveillance
https://www.cdc.gov/coronavirus/2019-ncov/covid-data/covidview/past-reports/08212020.html
 
  1. CASES, DATA & SURVEILLANCE
COVIDView Summary ending on August 22, 2020


Updated Aug. 28, 2020
Print
Download Weekly Summary pdf icon[14 Pages, 1 MB]
Key Updates for Week 34, ending August 22, 2020


Indicators that track influenza-like illness (ILI) and COVID-19-like illness (CLI) and the percentage of laboratory tests positive for SARS-CoV-2 have continued to decrease nationally since mid-July. Regionally, from week 33 to week 34, six of ten regions reported decreasing or stable (change of ≤0.1%) ILI, CLI, and percentage of laboratory tests positive for SARS-CoV-2; however, two regions reported an increase in the percentage of specimens testing positive for SARS-CoV-2, and two regions reported an increase in ILI visits. Weekly hospitalization rates and mortality attributed to COVID-19 declined during week 34. Mortality attributed to COVID-19 remains above the epidemic threshold.
Virus

Public Health, Commercial and Clinical Laboratories


Nationally, the percentage of respiratory specimens testing positive for SARS-CoV-2 decreased from 6.2% during week 33 to 5.7% during week 34 and decreased or remained the same in eight of ten HHS regions. National percentages of specimens testing positive for SARS-CoV-2 by type of laboratory are listed as follows:
  • Public health laboratories – decreased from 6.6% during week 33 to 6.1% during week 34;
  • Clinical laboratories – decreased from 5.7% during week 33 to 5.1% during week 34;
  • Commercial laboratories – decreased from 6.2% during week 33 to 5.6% during week 34.
Outpatient and Emergency Department Visits

Outpatient Influenza-Like Illness Network (ILINet) and National Syndromic Surveillance Program (NSSP)


Two surveillance networks are being used to track outpatient or emergency department (ED) visits for illness with symptoms compatible with COVID-19.
  • Nationally, ILI activity remains below baseline for the nineteenth week but is higher than typically seen at this time of year.
  • Nationally, during week 34, the percentage of visits reported for ILI by ILINet participants was 1.0%, the same as week 33. The percentage of visits for CLI reported to NSSP decreased from 2.6% during week 33 to 2.2% during week 34, the sixth consecutive week of decline.
  • Recent changes in health care seeking behavior, including increasing use of telemedicine, recommendations to limit ED visits to severe illnesses, and increased social distancing, are likely affecting data reported from both networks, making it difficult to draw conclusions at this time. Tracking these systems moving forward will give additional insight into illness related to COVID-19.
Severe Disease

Hospitalizations


Cumulative COVID-19-associated hospitalization rates since March 1, 2020, are updated weekly. The overall cumulative COVID-19 hospitalization rate is 156.8 per 100,000, with the highest rates in people aged 65 years and older (425.7 per 100,000) and 50-64 years (235.7 per 100,000).
Mortality


Based on death certificate data, the percentage of deaths attributed to pneumonia, influenza, or COVID-19 (PIC) for week 34 is 7.9%. This is currently lower than the percentage during week 33 (12.3%); however, the percentage remains above the epidemic threshold and will likely increase as more death certificates are processed.

All data are preliminary and may change as more reports are received.

A description of the surveillance systems summarized in COVIDView, including methodology and detailed descriptions of each data component, is available on the surveillance methods page.
Key Points
  • Nationally, the percentage of specimens testing positive for SARS-CoV-2 and the percentage of visits for ILI and CLI have continued to decrease since mid-July; however, there was some regional variation.
  • Using combined data from the three laboratory types, the national percentage of respiratory specimens testing positive for SARS-CoV-2 with a molecular assay decreased from 6.2% during week 33 to 5.7% during week 34.
    • Regionally, the percentage of respiratory specimens testing positive for SARS-CoV-2 declined or remained the same in eight of ten HHS regions but increased in Regions 7 (Central) and 8 (Mountain).
    • The highest percentages of specimens testing positive for SARS-CoV-2 were seen in Regions 4 (South East, 9.3%), 6 (South Central, 10.2%), and 7 (Central, 10.0%). The percentage is decreasing in Regions 4 (South East) and 6 (South Central) and increasing in Region 7 (Central).
  • The percentage of outpatient visits for ILI is below baseline nationally and in all regions of the country. During week 34, the percentage decreased or was stable in eight of ten regions but increased slightly in Regions 2 (NY/NJ/Puerto Rico) and 5 (Midwest).
  • The percentage of visits to EDs for CLI decreased nationally for the sixth consecutive week and, compared to the previous week, decreased or was stable (changes ≤1%) in all ten HHS regions. The percent of visits to EDs for ILI was stable nationally and in all ten regions.
  • The overall cumulative COVID-19-associated hospitalization rate was 156.8 per 100,000; rates were highest in people 65 years of age and older (425.7 per 100,000) followed by people 50-64 years (235.7 per 100,000).
    • Weekly hospitalization rates among all ages first peaked during the week ending April 18 (MMWR week 16) at 10.1 per 100,000 population, followed by a second peak during the week ending July 18 (MMWR week 29) at 8.1 per 100,000 population. Data for the most recent weeks may change as additional admissions occurring during those weeks are reported.
    • Non-Hispanic American Indian or Alaska Native persons and non-Hispanic Black persons had age-adjusted hospitalization rates approximately 4.7 times that of non-Hispanic White persons. The rate for Hispanic or Latino persons was approximately 4.6 times the rate among non-Hispanic White persons.
  • Based on death certificate data, the percentage of deaths attributed to pneumonia, influenza or COVID-19 (PIC) for week 34 was 7.9%, lower than the percentage during week 33 (12.3%), but above the epidemic threshold. These percentages will likely increase as more death certificates are processed.
  • All surveillance systems aim to provide the most complete data available. Estimates from previous weeks are subject to change as data are updated with the most complete data available.
U.S. Virologic Surveillance


The number of specimens tested for SARS-CoV-2 using a molecular assay and reported to CDC by public health laboratories and a subset of clinical and commercial laboratories in the United States are summarized below. All laboratories are performing primary diagnostic functions; therefore, the percentage of specimens testing positive across laboratory types can be used to monitor overall trends in COVID-19 activity. As the outbreak progresses, it is possible that different types of laboratories will take on different roles, and the data interpretation may need to change.
2,021,40943,204,184
249,7704,890,334
145,3744,522,686
1,626,26533,791,164
114,199 (5.6%)3,836,639 (8.9%)
15,185 (6.1%)395,267 (8.1%)
7,459 (5.1%)282,545 (6.3%)
91,555 (5.6%)3,158,827 (9.3%)
* Commercial and clinical laboratory data represent select laboratories and do not capture all tests performed in the United States.
Public Health Laboratories


resize iconView LargerView Data Table

Clinical Laboratories


resize iconView LargerView Data Table

Commercial Laboratories


resize iconView Larger


* Commercial laboratories began testing for SARS-CoV-2 in early March, but the number and geographic distribution of reporting commercial laboratories became stable enough to calculate a weekly percentage of specimens testing positive as of March 29, 2020.
View Data Table


Additional virologic surveillance information: Surveillance Methods


Outpatient/Emergency Department Illness


Two syndromic surveillance systems are being used to monitor trends in outpatient and emergency department (ED) visits that may be associated with COVID-19 illness. Each system monitors a slightly different syndrome, and together, these systems provide a more comprehensive picture of mild-to-moderate COVID-19 illness than either would individually. Both systems are currently being affected by changes in health care seeking behavior, including increased use of telemedicine, compliance with recommendations to limit ED visits to severe illnesses, and increased social distancing. These changes affect the numbers of people seeking care in the outpatient and ED settings and their reasons for doing so.
ILINet


The U.S. Outpatient Influenza-like Illness Surveillance Network (ILINet) provides data on visits for influenza-like illness (ILI) (fever [≥100[SUP]○[/SUP]F] and cough and/or sore throat) to approximately 2,600 primary care providers, emergency departments, and urgent care centers in all 50 states, Puerto Rico, the District of Columbia, and the U.S. Virgin Islands. Mild COVID-19 illness presents with symptoms similar to ILI, so ILINet is being used to track trends of mild-to-moderate COVID-19 illness and allows for comparison with prior influenza seasons.

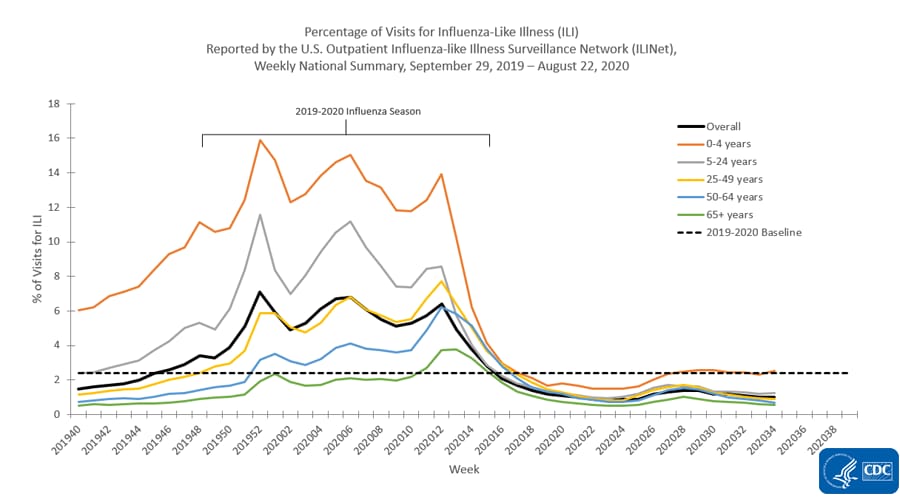
Nationwide during week 34, 1.0% of patient visits reported through ILINet were due to ILI. This percentage is well below the national baseline of 2.4% but, while low overall, is higher than what is typical for this time of year compared to previous influenza seasons. Compared to week 33, the percentage of visits for ILI during week 34 was the same or lower overall and among all age groups except the 0-4 year age group which saw a slight increase from 2.3% in week 33 to 2.5% during week 34.

resize iconView Larger


* Age-group specific percentages should not be compared to the national baseline.

On a regional levelexternal icon, the percentage of outpatient visits for ILI ranged from 0.6% to 1.5% during week 34. In all ten regions, the percentage of outpatient visits for ILI is below the region-specific baseline. Compared to week 33, the percentage in week 34 was lower or stable (changes ≤0.1%) in eight of ten HHS regions; slight increases were seen in Regions 2 (NY/NJ/Puerto Rico) and 5 (Central).

Note: In response to the COVID-19 pandemic, new data sources are being incorporated into ILINet through the summer weeks, when lower levels of influenza and other respiratory virus circulation are typical. Starting in week 21, enrollment of new sites began, leading to increases in the number of patient visits. While all regions remain below baseline levels for ILI, these system changes should be considered when drawing conclusions from these data. Any changes in ILI due to changes in respiratory virus circulation will be highlighted here.
Overall Percentage of Visits for ILI | Age Group ILI Data

ILI Activity Levels


Data collected in ILINet are used to produce a measure of ILI activity for all 50 states, Puerto Rico, the District of Columbia, and New York City. The mean reported percentage of visits due to ILI for the current week is compared to the mean reported during non-influenza weeks, and the activity levels correspond to the number of standard deviations below, at, or above the mean.

The number of jurisdictions at each activity level during week 34 and changes compared to the previous week are summarized in the table below and shown in the following maps.
Activity Level
Week 34
(Week ending
August 22, 2020)
Compared to Previous Week
Very High0No change
High0No change
Moderate1No change
Low2+2
Minimal49-1
Insufficient Data2-1

[TD="colspan: 2"] Number of Jurisdictions [/TD]

*Data collected in ILINet may disproportionally represent certain populations within a state and may not accurately depict the full picture of influenza activity for the whole state. Differences in the data presented here by CDC and independently by some state health departments likely represent differing levels of data completeness with data presented by the state likely being the more complete.
National Syndromic Surveillance Program (NSSP): Emergency Department (ED) Visits


NSSP is a collaboration among CDC, federal partners, local, and state health departments and academic and private sector partners to collect, analyze, and share electronic patient encounter data received from multiple health care settings. To track trends of potential COVID-19 visits, visits for COVID-19-like illness (CLI) (fever and cough or shortness of breath or difficulty breathing or presence of a coronavirus diagnosis code) and ILI to a subset of emergency departments in 47 states are being monitored.

Nationwide during week 34, 2.2% of ED visits captured in NSSP were due to CLI and 0.7% were due to ILI. Compared to week 33, this week there was a decrease in the percentage of visits for CLI whereas the percentage of visits for ILI remained stable. This was the sixth consecutive week the percentages of visits for CLI and ILI decreased or remained stable. For the past three weeks, the percentages of visits for CLI and ILI decreased or remained stable (changes of ≤0.1%) in all 10 HHS regionsexternal icon.


Additional information about medically attended outpatient and emergency department visits for ILI and CLI: Surveillance Methods


Hospitalizations


The COVID-19-Associated Hospitalization Surveillance Network (COVID-NET) conducts population-based surveillance for laboratory-confirmed COVID-19-associated hospitalizations in select counties participating in the Emerging Infections Program (EIP) and the Influenza Hospitalization Surveillance Project (IHSP).

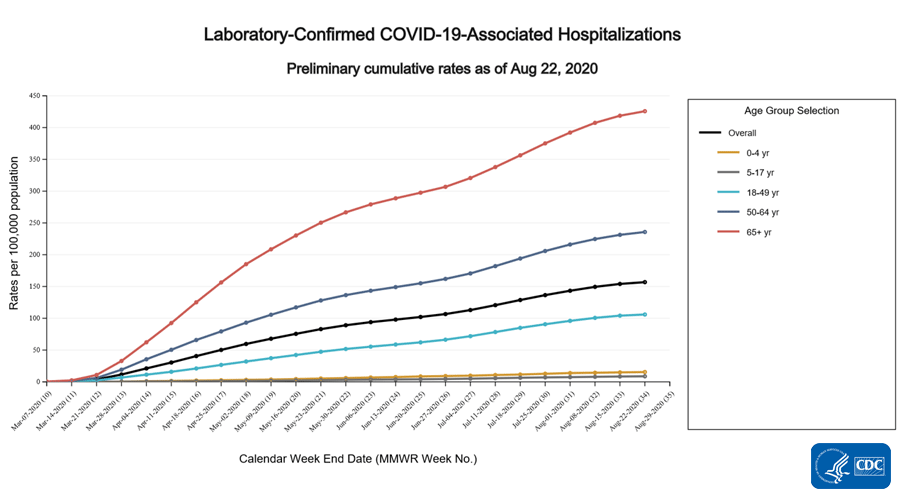
A total of 51,114 laboratory-confirmed COVID-19-associated hospitalizations were reported by sites between March 1, 2020 and August 22, 2020. The overall cumulative hospitalization rate was 156.8 per 100,000 population. Among the 0-4 year, 5-17 year, 18-49 year, 50-64 year, and ≥65 year age groups, the highest rate of hospitalization was among adults aged ≥65 years, followed by adults aged 50-64 years and adults aged 18-49 years.
lab-confirmed-hospitalizations.gif

resize iconView Larger
Overall156.8
0-4 years15.4
5-17 years8.7
18-49 years105.9
18-29 years66.6
30-39 years105.0
40-49 years157.8
50-64 years235.7
65+ years425.7
65-74 years318.5
75-84 years504.6
85+ years775.0
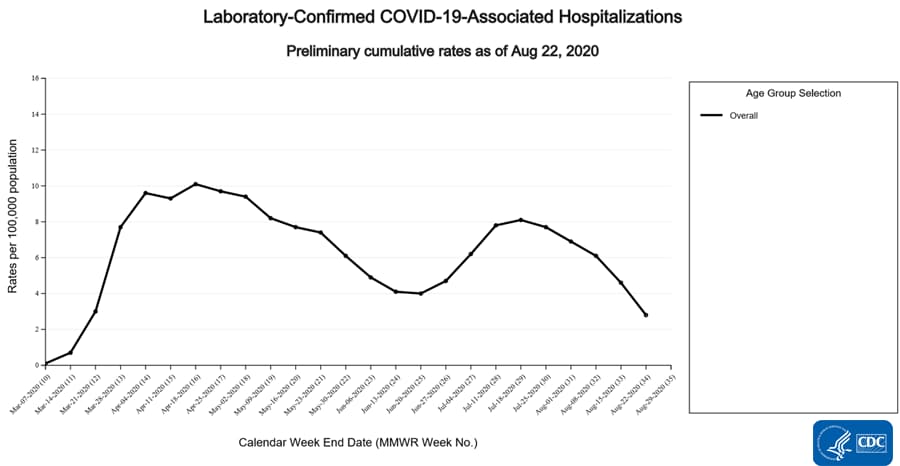
Weekly hospitalization rates among all ages first peaked during the week ending April 18 (MMWR week 16) at 10.1 per 100,000 population, followed by a second peak during the week ending July 18 (MMWR week 29) at 8.1 per 100,000 population. Data for the most recent weeks may change as additional admissions occurring during those weeks are reported.
lab-confirmed-hospitalizations-weekly.gif

resize iconView Larger


Among the 51,114 laboratory-confirmed COVID-19-associated hospitalized cases, 48,921 (95.7%) had information on race and ethnicity, while collection of race and ethnicity was still pending for 2,193 (4.3%) cases. When examining overall age-adjusted rates by race/ethnicity, non-Hispanic American Indian or Alaska Native persons and non-Hispanic Black persons had age-adjusted hospitalization rates approximately 4.7 times that of non-Hispanic White persons. The rate for Hispanic or Latino persons was approximately 4.6 times the rate among non-Hispanic White persons.


When examining age-stratified crude hospitalization rates by race and ethnicity, compared with non-Hispanic White persons in the same age group, crude hospitalization rates were 8.6 times higher among Hispanic or Latino persons aged 0-17 years; 8.6 times higher among Hispanic or Latino persons aged 18-49 years; 6.3 times higher among non-Hispanic American Indian or Alaska Native persons aged 50-64 years; and 3.8 times higher among non-Hispanic Black persons aged ≥65 years.
Age Category
Rate[SUP]1[/SUP]Rate Ratio[SUP]2,3[/SUP]Rate[SUP]1[/SUP]Rate Ratio[SUP]2,3[/SUP]Rate[SUP]1[/SUP]Rate Ratio[SUP]2,3[/SUP]Rate[SUP]1[/SUP]Rate Ratio[SUP]2,3[/SUP]Rate[SUP]1[/SUP]Rate Ratio[SUP]2,3[/SUP]
0-17y11.74.716.06.421.58.65.62.22.51.0
18-49y240.98.3175.56.0250.58.650.81.729.21.0
50-64y590.26.3496.15.3540.05.8146.31.693.01.0
65+y668.72.6996.33.8700.62.7273.71.0261.81.0
Overall rate[SUP]4[/SUP] (age-adjusted)323.64.7326.74.7322.04.691.91.369.31.0

[TD="colspan: 2"] Non-Hispanic
American Indian or Alaska Native
[/TD]
[TD="colspan: 2"] Non-Hispanic Black [/TD]
[TD="colspan: 2"] Hispanic or Latino [/TD]
[TD="colspan: 2"] Non-Hispanic Asian or Pacific Islander [/TD]
[TD="colspan: 2"] Non-Hispanic White [/TD]
[SUP]1[/SUP] COVID-19-associated hospitalization rates by race/ethnicity are calculated using hospitalized COVID-NET cases with known race and ethnicity for the numerator and NCHS bridged-race population estimates for the denominator.
[SUP]2[/SUP] For each age category, rate ratios are the ratios between crude hospitalization rates within each racial/ethnic group and the crude hospitalization rate among non-Hispanic white persons in the same age category.
[SUP]3[/SUP] The highest rate ratio in each age category is presented in bold.
[SUP]4[/SUP] Overall rates are adjusted to account for differences in age distributions within race/ethnicity strata in the COVID-NET catchment area; the age strata used for the adjustment include 0-17, 18-49, 50-64, and 65+ years.

Non-Hispanic Black persons and non-Hispanic White persons represented the highest proportions of hospitalized cases reported to COVID-NET, followed by Hispanic or Latino, non-Hispanic Asian or Pacific Islander, and non-Hispanic American Indian or Alaska Native persons. However, some racial and ethnic groups are disproportionately represented among hospitalized cases as compared with the overall population of the catchment area. Prevalence ratios showed a similar pattern to that of the age-adjusted hospitalization rates: non-Hispanic American Indian or Alaska Native persons and non-Hispanic Black persons had the highest prevalence ratios, followed by Hispanic or Latino persons.
1.3%33.3%22.9%5.0%31.5%
0.7%17.9%14.1%8.9%58.5%
1.91.91.60.60.5
[SUP]1[/SUP] Persons of multiple races (0.2%) or unknown race and ethnicity (5.8%) are not represented in the table but are included as part of the denominator.
[SUP]2[/SUP] Prevalence ratio is calculated as the ratio of the proportion of hospitalized COVID-NET cases over the proportion of population in COVID-NET catchment area.

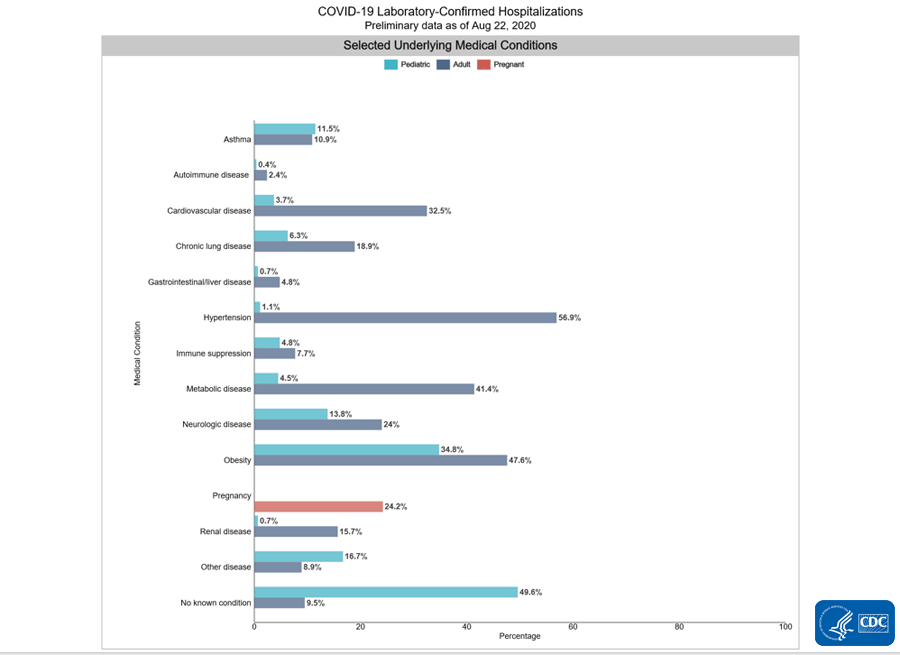
Among 9,943 hospitalized adults with information on underlying medical conditions, 90.5% had at least one reported underlying medical condition. The most commonly reported were hypertension, obesity, metabolic disease, and cardiovascular disease. Among 270 hospitalized children with information on underlying conditions, 50.4% had at least one reported underlying medical condition. The most commonly reported were obesity, neurologic disease, and asthma.
lab-confirmed-hospitalizations-underlying.gif

resize iconView Larger


Additional data on demographics, signs and symptoms at admission, underlying conditions, interventions, outcomes and discharge diagnoses, stratified by age, sex and race and ethnicity, are available.

Additional hospitalization surveillance information: Surveillance Methods | Additional rate data | Additional demographic and clinical data


Mortality Surveillance


The National Center for Health Statistics (NCHS) collects death certificate data from vital statistics offices for all deaths occurring in the United States. Based on death certificate data available on August 27, 2020, the percentage of deaths attributed to pneumonia, influenza, or COVID-19 (PIC) for week 34 is 7.9% and, while lower than the percentage during week 33 (12.3%), remains above the epidemic threshold. Percentages for recent weeks will likely increase as more death certificates are processed.

Weekly mortality surveillance data include a combination of machine coded and manually coded causes of death collected from death certificates. Percentages of deaths due to PIC are higher among manually coded records than more rapidly available machine coded records. Due to the additional time needed for manual coding, the initially reported PIC percentages may be lower than percentages calculated from final data.
nchs-mortality-report.gif

resize iconView Larger


*Data during recent weeks are incomplete because of the lag in time between when the death occurred and when the death certificate is completed, submitted to NCHS and processed for reporting purposes.
View Data Table


Additional NCHS mortality surveillance information: Surveillance Methods | Provisional Death Counts for COVID-19

More Information
View Page In:pdf icon 14 Pages, 1 MB
Last Updated Aug. 28, 2020
Content source: National Center for Immunization and Respiratory Diseases (NCIRD), Division of Viral DiseaseshomeCases, Data & Surveillance
https://www.cdc.gov/coronavirus/2019-ncov/covid-data/covidview/past-reports/08282020.html
 
  1. CASES, DATA & SURVEILLANCE
COVIDView Summary ending on August 29, 2020


Updated Sept. 4, 2020
Print
Download Weekly Summary pdf icon[14 Pages, 1.5 MB]
Key Updates for Week 35, ending August 29, 2020


After declining since mid-July, the percentage of laboratory tests positive for SARS-CoV-2 nationally increased slightly from week 34 to week 35; seven of ten regions also reported increases in the percentage of laboratory tests positive for SARS-CoV-2 during week 35. Indicators that track influenza-like illness (ILI) and COVID-19-like illness (CLI) continued to decrease or remain stable (change of ≤0.1%) nationally and in all ten regions. Weekly hospitalization rates and mortality attributed to COVID-19 declined during week 35. Mortality attributed to COVID-19 remains above the epidemic threshold.
Virus

Public Health, Commercial and Clinical Laboratories


Nationally, the percentage of respiratory specimens testing positive for SARS-CoV-2 increased slightly from 5.4% during week 34 to 5.5% during week 35. National percentages of specimens testing positive for SARS-CoV-2 by type of laboratory are listed as follows:
  • Public health laboratories – increased from 6.2% during week 34 to 6.3% during week 35;
  • Clinical laboratories – increased from 5.5% during week 34 to 5.9% during week 35;
  • Commercial laboratories – increased from 5.3% during week 34 to 5.4% during week 35.
Outpatient and Emergency Department Visits

Outpatient Influenza-Like Illness Network (ILINet) and National Syndromic Surveillance Program (NSSP)


Two surveillance networks are being used to track outpatient or emergency department (ED) visits for illness with symptoms compatible with COVID-19.
  • Nationally, ILI activity remains below baseline for the twentieth week and is at levels typically seen at this time of year.
  • Nationally, the percentage of visits reported for ILI by ILINet participants decreased from 1.0% during week 34 to 0.9% during week 35. The percentage of visits for CLI reported to NSSP decreased for the seventh consecutive week, from 2.3% during week 34 to 2.0% during week 35.
  • Recent changes in health care seeking behavior, including increasing use of telemedicine, recommendations to limit ED visits to severe illnesses, and increased social distancing, are likely affecting both networks, making it difficult to draw conclusions at this time. Tracking these systems moving forward will give additional insight into illness related to COVID-19.
Severe Disease

Hospitalizations


Cumulative COVID-19-associated hospitalization rates since March 1, 2020, are updated weekly. The overall cumulative COVID-19 hospitalization rate is 161.0 per 100,000, with the highest rates in people aged 65 years and older (436.6 per 100,000) and 50–64 years (241.4 per 100,000).
Mortality


Based on death certificate data, the percentage of deaths attributed to pneumonia, influenza, or COVID-19 (PIC) for week 35 is 6.6%. This is currently lower than the percentage during week 34 (10.7%); however, the percentage remains above the epidemic threshold and will likely increase as more death certificates are processed.

All data are preliminary and may change as more reports are received.

A description of the surveillance systems summarized in COVIDView, including methodology and detailed descriptions of each data component, is available on the surveillance methods page.
Key Points
  • Nationally, the percentage of specimens testing positive for SARS-CoV-2 increased slightly while the percentage of visits for ILI and CLI have continued to decrease or remain stable (change of ≤0.1%) since mid-July; however, there was some regional variation.
  • Using combined data from the three laboratory types, the national percentage of respiratory specimens testing positive for SARS-CoV-2 with a molecular assay increased slightly from 5.4% during week 34 to 5.5% during week 35. This is the first week of an increase in the percentage of tests positive for SARS-CoV-2 since mid-July.
    • Regionally, the percentage of respiratory specimens testing positive for SARS-CoV-2 increased in seven of ten HHS regions but decreased in Regions 4 (South East), 9 (South West/Coast) and 10 (Pacific Northwest).
    • The highest percentages of specimens testing positive for SARS-CoV-2 were seen in Regions 4 (South East, 8.8%), 6 (South Central, 10.6%), and 7 (Central, 10.4%). The percentage is decreasing in Region 4 (South East) and increasing in Regions 6 (South Central) and 7 (Central).
    • Among persons age 18–49 years, the percentage of specimens testing positive for SARS-CoV-2 increased from 5.5% during week 34 to 5.9% during week 35. The percentage positive decreased for all other age groups.
  • The percentage of outpatient or ED visits to ILINet providers for ILI is below baseline nationally and in all regions of the country. During week 35, the percentage decreased nationally and decreased or was stable (change of ≤0.1%) in all ten regions.
  • The percentage of visits to EDs for CLI decreased nationally for the seventh consecutive week and, compared to the previous week, decreased in all ten HHS regions. The percentage of visits to EDs for ILI was stable (change of ≤0.1%) nationally and decreasing or stable in all ten regions.
  • The overall cumulative COVID-19-associated hospitalization rate was 161.0 per 100,000; rates were highest in people 65 years of age and older (436.6 per 100,000) followed by people 50–64 years (241.4 per 100,000).
    • Weekly hospitalization rates among all ages first peaked during the week ending April 18 (MMWR week 16) at 10.1 per 100,000 population, followed by a second peak during the week ending July 18 (MMWR week 29) at 8.2 per 100,000 population. Data for the most recent weeks may change as additional admissions occurring during those weeks are reported.
    • Non-Hispanic Black persons and Hispanic or Latino persons had age-adjusted hospitalization rates approximately 4.7 times that of non-Hispanic White persons. The rate for non-Hispanic American Indian or Alaska Native persons was approximately 4.6 times the rate among non-Hispanic White persons.
  • Based on death certificate data, the percentage of deaths attributed to pneumonia, influenza, or COVID-19 (PIC) for week 35 was 6.6%, lower than the percentage during week 34 (10.7%), but above the epidemic threshold. These percentages will likely increase as more death certificates are processed.
  • All surveillance systems aim to provide the most complete data available. Estimates from previous weeks are subject to change as data are updated with the most complete data available.
U.S. Virologic Surveillance


The number of specimens tested for SARS-CoV-2 using a molecular assay and reported to CDC by public health laboratories and a subset of clinical and commercial laboratories in the United States are summarized below. All laboratories are performing primary diagnostic functions; therefore, the percentage of specimens testing positive across laboratory types can be used to monitor overall trends in COVID-19 activity. As the outbreak progresses, it is possible that different types of laboratories will take on different roles, and the data interpretation may need to change.
1,927,52544,203,187
230,6275,183,227
142,9854,846,538
1,553,91334,173,422
106,909 (5.5%)3,814,056 (8.6%)
14,628 (6.3%)415,419 (8.0%)
8,476 (5.9%)301,828 (6.2%)
83,805 (5.4%)3,096,809 (9.1%)
* Commercial and clinical laboratory data represent select laboratories and do not capture all tests performed in the United States.
Public Health Laboratories


resize iconView LargerView Data Table

Clinical Laboratories


resize iconView LargerView Data Table

Commercial Laboratories


resize iconView Larger


* Commercial laboratories began testing for SARS-CoV-2 in early March, but the number and geographic distribution of reporting commercial laboratories became stable enough to calculate a weekly percentage of specimens testing positive as of March 29, 2020.
View Data Table


Additional virologic surveillance information: Surveillance Methods


Outpatient/Emergency Department Illness


Two syndromic surveillance systems are being used to monitor trends in outpatient and emergency department (ED) visits that may be associated with COVID-19 illness. Each system monitors a slightly different syndrome, and together, these systems provide a more comprehensive picture of mild-to-moderate COVID-19 illness than either would individually. Both systems are currently being affected by changes in health care seeking behavior, including increased use of telemedicine, compliance with recommendations to limit ED visits to severe illnesses, and increased social distancing. These changes affect the numbers of people seeking care in the outpatient and ED settings and their reasons for doing so.
ILINet


The U.S. Outpatient Influenza-like Illness Surveillance Network (ILINet) provides data on visits for influenza-like illness (ILI) (fever [≥100[SUP]○[/SUP]F] and cough and/or sore throat) to approximately 2,600 primary care providers, emergency departments, and urgent care centers in all 50 states, Puerto Rico, the District of Columbia, and the U.S. Virgin Islands. Mild COVID-19 illness presents with symptoms similar to ILI, so ILINet is being used to track trends of mild-to-moderate COVID-19 illness and allows for comparison with prior influenza seasons.

Nationwide during week 35, 0.9% of patient visits reported through ILINet were due to ILI. This percentage is well below the national baseline of 2.4% and is typical for this time of year compared to previous influenza seasons. Compared to week 34, the percentage of visits for ILI during week 35 was the same or lower overall and among all age groups except the 0–4 year age group which increased slightly for the second consecutive week.

resize iconView Larger


* Age-group specific percentages should not be compared to the national baseline.

On a regional levelexternal icon, the percentage of outpatient visits for ILI ranged from 0.6% to 1.3% during week 35. In all ten regions, the percentage of outpatient visits for ILI is below the region-specific baseline. Compared to week 34, the percentage in week 35 was lower or stable (changes ≤0.1%) in all ten surveillance regions.

Note: In response to the COVID-19 pandemic, new data sources are being incorporated into ILINet through the summer weeks, when lower levels of influenza and other respiratory virus circulation are typical. Starting in week 21, enrollment of new sites began, leading to increases in the number of patient visits. While all regions remain below baseline levels for ILI, these system changes should be considered when drawing conclusions from these data. Any changes in ILI due to changes in respiratory virus circulation will be highlighted here.
Overall Percentage of Visits for ILI | Age Group ILI Data

ILI Activity Levels


Data collected in ILINet are used to produce a measure of ILI activity for all 50 states, Puerto Rico, the District of Columbia, and New York City. The mean reported percentage of visits due to ILI for the current week is compared to the mean reported during non-influenza weeks, and the activity levels correspond to the number of standard deviations below, at, or above the mean.

The number of jurisdictions at each activity level during week 35 and changes compared to the previous week are summarized in the table below and shown in the following maps.
Activity Level
Week 35
(Week ending
August 29, 2020)
Compared to Previous Week
Very High0No change
High0No change
Moderate0-1
Low1-1
Minimal51+2
Insufficient Data2No change

[TD="colspan: 2"] Number of Jurisdictions [/TD]

*Data collected in ILINet may disproportionally represent certain populations within a state and may not accurately depict the full picture of influenza activity for the whole state. Differences in the data presented here by CDC and independently by some state health departments likely represent differing levels of data completeness with data presented by the state likely being the more complete.
National Syndromic Surveillance Program (NSSP): Emergency Department (ED) Visits


NSSP is a collaboration among CDC, federal partners, local, and state health departments and academic and private sector partners to collect, analyze, and share electronic patient encounter data received from multiple health care settings. To track trends of potential COVID-19 visits, visits for COVID-19-like illness (CLI) (fever and cough or shortness of breath or difficulty breathing or presence of a coronavirus diagnosis code) and ILI to a subset of emergency departments in 47 states are being monitored.

Nationwide during week 35, 2.0% of ED visits captured in NSSP were due to CLI and 0.7% were due to ILI. Compared to week 34, this week the percentage of visits for CLI and the percentage of visits for ILI decreased or remained stable (changes of ≤0.1%) nationally and in in all 10 HHS regionsexternal icon.


Additional information about medically attended outpatient and emergency department visits for ILI and CLI: Surveillance Methods


Hospitalizations


The COVID-19-Associated Hospitalization Surveillance Network (COVID-NET) conducts population-based surveillance for laboratory-confirmed COVID-19-associated hospitalizations in select counties participating in the Emerging Infections Program (EIP) and the Influenza Hospitalization Surveillance Project (IHSP).

A total of 52,503 laboratory-confirmed COVID-19-associated hospitalizations were reported by sites between March 1, 2020, and August 29, 2020. The overall cumulative hospitalization rate was 161.0 per 100,000 population. Among the 0–4 year, 5–17 year, 18–49 year, 50–64 year, and ≥65 year age groups, the highest rate of hospitalization was among adults aged ≥65 years, followed by adults aged 50–64 years and adults aged 18–49 years.
lab-confirmed-hospitalizations.gif

resize iconView Larger
Overall161.0
0-4 years15.8
5-17 years9.2
18-49 years109.2
18-29 years68.8
30-39 years108.4
40-49 years162.4
50-64 years241.4
65+ years436.6
65-74 years327.8
75-84 years515.9
85+ years793.2
Weekly hospitalization rates among all ages first peaked during the week ending April 18 (MMWR week 16) at 10.1 per 100,000 population, followed by a second peak during the week ending July 18 (MMWR week 29) at 8.2 per 100,000 population. Data for the most recent weeks may change as additional admissions occurring during those weeks are reported.
lab-confirmed-hospitalizations-weekly.gif

resize iconView Larger


Among the 52,503 laboratory-confirmed COVID-19-associated hospitalized cases, 50,158 (95.5%) had information on race and ethnicity, while collection of race and ethnicity was still pending for 2,345 (4.5%) cases. When examining overall age-adjusted rates by race/ethnicity, both non-Hispanic Black persons and Hispanic or Latino persons had age-adjusted hospitalization rates approximately 4.7 times that of non-Hispanic White persons. The rate for non-Hispanic American Indian or Alaska Native persons was approximately 4.6 times the rate among non-Hispanic White persons.


When examining age-stratified crude hospitalization rates by race and ethnicity, compared with non-Hispanic White persons in the same age group, crude hospitalization rates were 8.3 times higher among Hispanic or Latino persons aged 0–17 years; 8.6 times higher among Hispanic or Latino persons aged 18–49 years; 6.3 times higher among non-Hispanic American Indian or Alaska Native persons aged 50–64 years; and 3.8 times higher among non-Hispanic Black persons aged ≥65 years.
Age Category
Rate[SUP]1[/SUP]Rate Ratio[SUP]2,3[/SUP]Rate[SUP]1[/SUP]Rate Ratio[SUP]2,3[/SUP]Rate[SUP]1[/SUP]Rate Ratio[SUP]2,3[/SUP]Rate[SUP]1[/SUP]Rate Ratio[SUP]2,3[/SUP]Rate[SUP]1[/SUP]Rate Ratio[SUP]2,3[/SUP]
0-17 years13.65.016.76.222.38.35.52.02.71
18-49 years243.98.1180.36.0258.08.651.61.730.11
50-64 years598.26.3505.15.3555.95.8151.01.695.41
65+ years677.12.51013.13.8720.72.7285.91.1267.91
Overall rate[SUP]4[/SUP] (age-adjusted)328.04.6333.14.7331.44.794.91.371.11

[TD="colspan: 2"] Non-Hispanic
American Indian or Alaska Native
[/TD]
[TD="colspan: 2"] Non-Hispanic Black [/TD]
[TD="colspan: 2"] Hispanic or Latino [/TD]
[TD="colspan: 2"] Non-Hispanic Asian or Pacific Islander [/TD]
[TD="colspan: 2"] Non-Hispanic White [/TD]
[SUP]1[/SUP] COVID-19-associated hospitalization rates by race/ethnicity are calculated using hospitalized COVID-NET cases with known race and ethnicity for the numerator and NCHS bridged-race population estimates for the denominator.
[SUP]2[/SUP] For each age category, rate ratios are the ratios between crude hospitalization rates within each racial/ethnic group and the crude hospitalization rate among non-Hispanic white persons in the same age category.
[SUP]3[/SUP] The highest rate ratio in each age category is presented in bold.
[SUP]4[/SUP] Overall rates are adjusted to account for differences in age distributions within race/ethnicity strata in the COVID-NET catchment area; the age strata used for the adjustment include 0-17, 18-49, 50-64, and 65+ years.

Non-Hispanic Black persons and non-Hispanic White persons represented the highest proportions of hospitalized cases reported to COVID-NET, followed by Hispanic or Latino, non-Hispanic Asian or Pacific Islander, and non-Hispanic American Indian or Alaska Native persons. However, some racial and ethnic groups are disproportionately represented among hospitalized cases as compared with the overall population of the catchment area. Prevalence ratios were highest among non-Hispanic American Indian or Alaska Native persons and non-Hispanic Black persons, followed by Hispanic or Latino persons.
1.3%33.2%23.0%5.0%31.5%
0.7%17.9%14.1%8.9%58.5%
1.91.91.60.60.5
[SUP]1[/SUP] Persons of multiple races (0.3%) or unknown race and ethnicity (5.8%) are not represented in the table but are included as part of the denominator.
[SUP]2[/SUP] Prevalence ratio is calculated as the ratio of the proportion of hospitalized COVID-NET cases over the proportion of population in COVID-NET catchment area.

Among 10,432 hospitalized adults with information on underlying medical conditions, 90.6% had at least one reported underlying medical condition. The most commonly reported were hypertension, obesity, metabolic disease, and cardiovascular disease. Among 288 hospitalized children with information on underlying conditions, 50.7% had at least one reported underlying medical condition. The most commonly reported were obesity, neurologic disease, and asthma.
lab-confirmed-hospitalizations-underlying.gif

resize iconView Larger


Additional data on demographics, signs and symptoms at admission, underlying conditions, interventions, outcomes and discharge diagnoses, stratified by age, sex and race and ethnicity, are available.

Additional hospitalization surveillance information: Surveillance Methods | Additional rate data | Additional demographic and clinical data


Mortality Surveillance


The National Center for Health Statistics (NCHS) collects death certificate data from vital statistics offices for all deaths occurring in the United States. Based on death certificate data available on September 3, 2020, the percentage of deaths attributed to pneumonia, influenza, or COVID-19 (PIC) for week 35 is 6.6% and, while lower than the percentage during week 34 (10.7%), remains above the epidemic threshold. Percentages for recent weeks will likely increase as more death certificates are processed.

Weekly mortality surveillance data include a combination of machine coded and manually coded causes of death collected from death certificates. Percentages of deaths due to PIC are higher among manually coded records than more rapidly available machine coded records. Due to the additional time needed for manual coding, the initially reported PIC percentages may be lower than percentages calculated from final data.
nchs-mortality-report.gif

resize iconView Larger


*Data during recent weeks are incomplete because of the lag in time between when the death occurred and when the death certificate is completed, submitted to NCHS and processed for reporting purposes.
View Data Table


Additional NCHS mortality surveillance information: Surveillance Methods | Provisional Death Counts for COVID-19

More Information
View Page In:pdf icon 14 Pages, 1.5 MB
Last Updated Sept. 4, 2020
Content source: National Center for Immunization and Respiratory Diseases (NCIRD), Division of Viral DiseaseshomeCases, Data & Surveillance
https://www.cdc.gov/coronavirus/2019-ncov/covid-data/covidview/past-reports/09042020.html
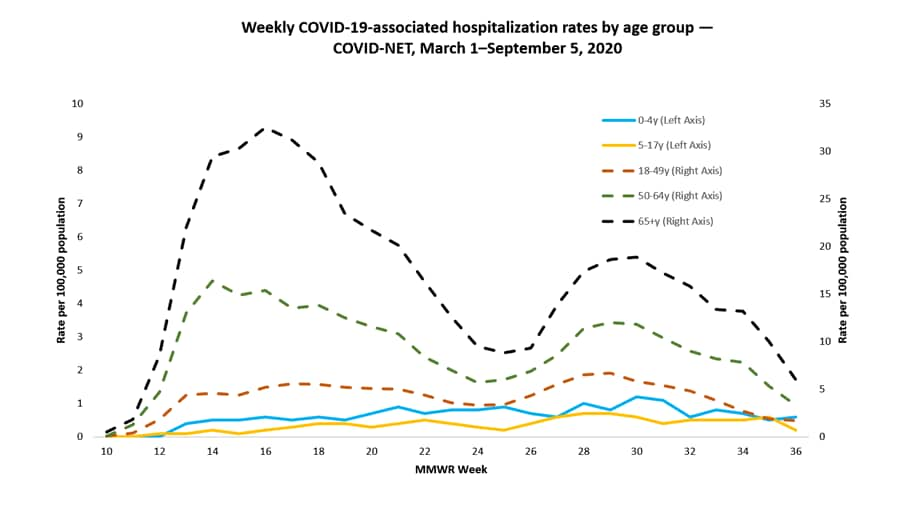
 
  1. CASES, DATA & SURVEILLANCE
COVIDView Summary ending on September 5, 2020


Updated Sept. 11, 2020
Print
Download Weekly Summary pdf icon[13 Pages, 1.4 MB]
Key Updates for Week 36, ending September 5, 2020


After declining since mid-July, the percentage of laboratory specimens testing positive for SARS-CoV-2 nationally increased slightly during week 35 but then decreased during week 36. Indicators that track influenza-like illness (ILI) and COVID-19-like illness (CLI) continued to decrease or remain stable (change of ≤0.1%) nationally and in all 10 regions; however, due to COVID-19 activity, one region reported levels of ILI above the region-specific baseline. Weekly hospitalization rates and mortality attributed to COVID-19 declined during week 36. Mortality attributed to COVID-19 remains above the epidemic threshold.
Virus

Public Health, Commercial and Clinical Laboratories


Nationally, the percentage of respiratory specimens testing positive for SARS-CoV-2 decreased from 5.5% during week 35 to 5.1% during week 36. National percentages of specimens testing positive for SARS-CoV-2 by type of laboratory are listed as follows:
  • Public health laboratories – decreased from 6.2% during week 35 to 5.4% during week 36;
  • Clinical laboratories – decreased from 5.4% during week 35 to 4.5% during week 36;
  • Commercial laboratories – decreased from 5.5% during week 35 to 5.1% during week 36.
Outpatient and Emergency Department Visits

Outpatient Influenza-Like Illness Network (ILINet) and National Syndromic Surveillance Program (NSSP)


Two surveillance networks are being used to track outpatient or emergency department (ED) visits for illness with symptoms compatible with COVID-19.
  • Nationally, ILI activity remains below baseline for the 21st consecutive week and is at levels that are typicalfor this time of year.
  • Nationally, the percentage of visits reported for ILI by ILINet participants decreased from 1.0% during week 35 to 0.9% during week 36. The percentage of visits for CLI reported to NSSP decreased for the eighth consecutive week, from 2.1% during week 35 to 1.8% during week 36.
  • Recent changes in health care seeking behavior, including increasing use of telemedicine, recommendations to limit ED visits to severe illnesses, and increased social distancing, are likely affecting both networks, making it difficult to draw conclusions at this time. Tracking these systems moving forward will give additional insight into illness related to COVID-19.
Severe Disease

Hospitalizations


Cumulative COVID-19-associated hospitalization rates since March 1, 2020, are updated weekly. The overall cumulative COVID-19 hospitalization rate is 166.9 per 100,000, with the highest rates in people aged 65 years and older (451.2 per 100,000) and 50–64 years (249.8 per 100,000).
Mortality


Based on death certificate data, the percentage of deaths attributed to pneumonia, influenza, or COVID-19 (PIC) for week 36 is 6.3%. This is currently lower than the percentage during week 35 (9.5%); however, the percentage remains above the epidemic threshold and will likely increase as more death certificates are processed.

All data are preliminary and may change as more reports are received.

A description of the surveillance systems summarized in COVIDView, including methodology and detailed descriptions of each data component, is available on the surveillance methods page.
Key Points
  • Nationally, since mid-July, there has been an overall decreasing trend in the percentage of specimens testing positive for SARS-CoV-2 and a decreasing or stable (change of ≤0.1%) trend in the percentage of visits for ILI and CLI; however, there has been some regional variation.
  • Using combined data from the three laboratory types, the national percentage of respiratory specimens testing positive for SARS-CoV-2 with a molecular assay decreased from 5.8% during week 35 to 5.2% during week 36.
    • Regionally, the percentage of respiratory specimens testing positive for SARS-CoV-2 increased slightly in Regions 1 (New England) and 3 (Mid-Atlantic) and decreased or remained stable in the remaining seven regions.
    • The highest percentages of specimens testing positive for SARS-CoV-2 were seen in Regions 4 (South East, 8.1%), 6 (South Central, 9.3%), and 7 (Central, 9.5%), but the percentage is decreasing in all three regions.
  • The percentage of outpatient or ED visits to ILINet providers for ILI is below baseline nationally and in nine of the 10 regions of the country. Region 7 (Central) reported ILI above the region-specific baseline. This increase is due to visits for ILI associated with COVID-19 activity in Iowa, which resulted in Iowa experiencing “very high” ILI activity.
    • Compared with week 35, the percentage of visits for ILI during week 36 decreased nationally and decreased or was stable (change of ≤0.1%) in all 10 regions.
  • The percentage of visits to EDs for CLI decreased nationally for the eighth consecutive week and, compared with the previous week, decreased in all 10 HHS regions. The percentage of visits to EDs for ILI was stable (change of ≤0.1%) nationally and decreasing or stable in all 10 regions.
  • The overall cumulative COVID-19-associated hospitalization rate was 166.9 per 100,000; rates were highest in people 65 years of age and older (451.2 per 100,000) followed by people 50–64 years (249.8 per 100,000).
    • Although SARS-CoV-2 viruses have been circulating in the U.S. for slightly longer than a typical influenza season, the cumulative hospitalization rate for COVID-19 among adults 65 years and older is now higher than the end-of-season influenza hospitalization rates for recent influenza seasons, including the high severity 2017?–2018 season. Since early in the pandemic, cumulative COVID-19 hospitalization rates for younger adult age groups (18-49 year olds and 50-64 year olds) have been higher than recent end-of-season hospitalization rates for influenza.
    • From the week ending August 1 (week 31) to the week ending August 29 (week 35), weekly hospitalization rates declined for all adult age groups. However, over this same time period, weekly rates initially remained constant for children in the 5–17 year age group and then increased during the week ending August 29 (week 35). Data for the most recent weeks may change as additional admissions occurring during those weeks are reported.
    • Hispanic or Latino persons and Non-Hispanic Black persons had age-adjusted hospitalization rates approximately 4.7 times that of non-Hispanic White persons. The rate for non-Hispanic American Indian or Alaska Native persons was approximately 4.6 times the rate among non-Hispanic White persons.
  • Based on death certificate data, the percentage of deaths attributed to pneumonia, influenza, or COVID-19 (PIC) for week 36 was 6.3%, lower than the percentage during week 35 (9.5%), but above the epidemic threshold. These percentages will likely increase as more death certificates are processed.
  • All surveillance systems aim to provide the most complete data available. Estimates from previous weeks are subject to change as data are updated with the most complete data available.
U.S. Virologic Surveillance


The number of specimens tested for SARS-CoV-2 using a molecular assay and reported to CDC by public health laboratories and a subset of clinical and commercial laboratories in the United States are summarized below. All laboratories are performing primary diagnostic functions; therefore, the percentage of specimens testing positive across laboratory types can be used to monitor overall trends in COVID-19 activity. As the outbreak progresses, it is possible that different types of laboratories will take on different roles, and the data interpretation may need to change.
1,949,22646,481,561
261,2825,545,867
121,6545,143,112
1,566,29035,792,582
99,799 (5.1%)3,934,090 (8.5%)
14,238 (5.4%)435,007 (7.8%)
5,494 (4.5%)316,682 (6.2%)
80,067 (5.1%)3,182,401 (8.9%)
* Commercial and clinical laboratory data represent select laboratories and do not capture all tests performed in the United States.
Public Health Laboratories


resize iconView LargerView Data Table

Clinical Laboratories


resize iconView LargerView Data Table

Commercial Laboratories


resize iconView Larger


* Commercial laboratories began testing for SARS-CoV-2 in early March, but the number and geographic distribution of reporting commercial laboratories became stable enough to calculate a weekly percentage of specimens testing positive as of March 29, 2020.
View Data Table


Additional virologic surveillance information: Surveillance Methods


Outpatient/Emergency Department Illness


Two syndromic surveillance systems are being used to monitor trends in outpatient and emergency department (ED) visits that may be associated with COVID-19 illness. Each system monitors a slightly different syndrome, and together, these systems provide a more comprehensive picture of mild-to-moderate COVID-19 illness than either would individually. Both systems are currently being affected by changes in health care seeking behavior, including increased use of telemedicine, compliance with recommendations to limit ED visits to severe illnesses, and increased social distancing. These changes affect the numbers of people seeking care in the outpatient and ED settings and their reasons for doing so.
ILINet


The U.S. Outpatient Influenza-like Illness Surveillance Network (ILINet) provides data on visits for influenza-like illness (ILI) (fever [≥100[SUP]○[/SUP]F] and cough and/or sore throat) to approximately 2,600 primary care providers, emergency departments, and urgent care centers in all 50 states, Puerto Rico, the District of Columbia, and the U.S. Virgin Islands. Mild COVID-19 illness presents with symptoms similar to ILI, so ILINet is being used to track trends of mild-to-moderate COVID-19 illness and allows for comparison with prior influenza seasons.

Nationwide during week 36, 0.9% of patient visits reported through ILINet were due to ILI. This percentage is well below the national baseline of 2.4% and is typical for this time of year compared to previous influenza seasons. Compared with week 35, the percentage of visits for ILI during week 36 was the same or lower overall and among all age groups.

resize iconView Larger


* Age-group specific percentages should not be compared with the national baseline.

On a regional levelexternal icon, the percentage of outpatient visits for ILI ranged from 0.4% to 2.1% during week 36. Compared with week 35 the percentage was declining or stable (changes of ≤0.1%) in all ten regions. The percentage of outpatient visits for ILI was below the region-specific baseline in nine regions; however, Region 7 (Central) reported ILI above the region-specific baseline for the past two weeks. This increase is due to increased ILI activity in Iowa and is associated with COVID-19 activity.

Note: In response to the COVID-19 pandemic, new data sources are being incorporated into ILINet through the summer weeks, when lower levels of influenza and other respiratory virus circulation are typical. Starting in week 21, enrollment of new sites began, leading to increases in the number of patient visits. While all regions remain below baseline levels for ILI, these system changes should be considered when drawing conclusions from these data. Any changes in ILI due to changes in respiratory virus circulation will be highlighted here.
Overall Percentage of Visits for ILI | Age Group ILI Data

ILI Activity Levels


Data collected in ILINet are used to produce a measure of ILI activity for all 50 states, Puerto Rico, the U.S. Virgin Islands, the District of Columbia, and New York City. The mean reported percentage of visits due to ILI for the current week is compared with the mean reported during non-influenza weeks, and the activity levels correspond to the number of standard deviations below, at, or above the mean.

The number of jurisdictions at each activity level during week 36 and changes compared with the previous week are summarized in the table below and shown in the following maps.
Activity Level
Week 36
(Week ending
September 5, 2020)
Compared with Previous Week
Very High1+1
High0No change
Moderate0No change
Low1No change
Minimal50-1
Insufficient Data2No change

[TD="colspan: 2"] Number of Jurisdictions [/TD]

*Data collected in ILINet may disproportionally represent certain populations within a state and may not accurately depict the full picture of influenza activity for the whole state. Differences in the data presented here by CDC and independently by some state health departments likely represent differing levels of data completeness with data presented by the state likely being the more complete.
National Syndromic Surveillance Program (NSSP): Emergency Department (ED) Visits


NSSP is a collaboration among CDC, federal partners, local, and state health departments and academic and private sector partners to collect, analyze, and share electronic patient encounter data received from multiple health care settings. To track trends of potential COVID-19 visits, visits for COVID-19-like illness (CLI) (fever and cough or shortness of breath or difficulty breathing or presence of a coronavirus diagnosis code) and ILI to a subset of emergency departments in 47 states are being monitored.

Nationwide during week 36, 1.8% of ED visits captured in NSSP were due to CLI and 0.7% were due to ILI. Compared with week 35, this week the percentage of visits for CLI and the percentage of visits for ILI decreased or remained stable (changes of ≤0.1%) nationally and in all 10 HHS regionsexternal icon.


Additional information about medically attended outpatient and emergency department visits for ILI and CLI: Surveillance Methods


Hospitalizations


The COVID-19-Associated Hospitalization Surveillance Network (COVID-NET) conducts population-based surveillance for laboratory-confirmed COVID-19-associated hospitalizations in select counties participating in the Emerging Infections Program (EIP) and the Influenza Hospitalization Surveillance Project (IHSP).

A total of 54,425 laboratory-confirmed COVID-19-associated hospitalizations were reported by sites between March 1, 2020 and September 5, 2020. The overall cumulative hospitalization rate was 166.9 per 100,000 population. Among the 0–4 year, 5–17 year, 18–49 year, 50–64 year, and ≥65 year age groups, the highest rate of hospitalization was among adults aged ≥65 years, followed by adults aged 50–64 years and adults aged 18–49 years.
lab-confirmed-hospitalizations.gif

resize iconView Larger
Overall166.9
0-4 years16.8
5-17 years9.7
18-49 years113.8
18-29 years72.5
30-39 years113.4
40-49 years167.5
50-64 years249.8
65+ years451.2
65-74 years338.9
75-84 years534.9
85+ years814.6
Weekly hospitalization rates among all ages first peaked during the week ending April 18 (MMWR week 16), followed by a second peak during the week ending July 18 (MMWR week 29). From the week ending August 1 (MMWR week 31) to the week ending August 29 (MMWR week 35), weekly hospitalization rates declined for all adult age groups. However, over this same time period, weekly rates initially remained constant in the 5–17 year age group and increased during the week ending August 29 (MMWR week 35). Data for the most recent weeks may change as additional admissions occurring during those weeks are reported.
lab-confirmed-hospitalizations-weekly.png

resize iconView Larger


Among the 54,425 laboratory-confirmed COVID-19-associated hospitalizations, 51,286 (94.2%) had information on race and ethnicity; collection of race and ethnicity was still pending for 3,139 (5.8%) hospitalizations. When examining overall age-adjusted rates by race/ethnicity, both Hispanic or Latino persons and non-Hispanic Black persons had age-adjusted hospitalization rates approximately 4.7 times that of non-Hispanic White persons. The rate for non-Hispanic American Indian or Alaska Native persons was approximately 4.6 times the rate among non-Hispanic White persons.


When examining age-stratified crude hospitalization rates by race and ethnicity, compared with non-Hispanic White persons in the same age group, crude hospitalization rates were 8.0 times higher among Hispanic or Latino persons aged 0–17 years; 8.6 times higher among Hispanic or Latino persons aged 18–49 years; 6.2 times higher among non-Hispanic American Indian or Alaska Native persons aged 50–64 years; and 3.8 times higher among non-Hispanic Black persons aged ≥65 years.
Age Category
Rate[SUP]1[/SUP]Rate Ratio[SUP]2,3[/SUP]Rate[SUP]1[/SUP]Rate Ratio[SUP]2,3[/SUP]Rate[SUP]1[/SUP]Rate Ratio[SUP]2,3[/SUP]Rate[SUP]1[/SUP]Rate Ratio[SUP]2,3[/SUP]Rate[SUP]1[/SUP]Rate Ratio[SUP]2,3[/SUP]
0—17 years13.64.717.25.922.38.06.02.12.91
18—49 years247.88.0184.35.9265.68.653.11.731.01
50—64 years603.56.2513.65.3570.05.8156.01.697.71
65+ years685.52.51028.83.8743.42.7293.71.1273.61
Overall rate[SUP]4[/SUP] (age-adjusted)332.34.6339.04.7341.14.797.71.372.81

[TD="colspan: 2"] Non-Hispanic
American Indian or Alaska Native
[/TD]
[TD="colspan: 2"] Non-Hispanic Black [/TD]
[TD="colspan: 2"] Hispanic or Latino [/TD]
[TD="colspan: 2"] Non-Hispanic Asian or Pacific Islander [/TD]
[TD="colspan: 2"] Non-Hispanic White [/TD]
[SUP]1[/SUP] COVID-19-associated hospitalization rates by race/ethnicity are calculated using COVID-NET hospitalizations with known race and ethnicity for the numerator and NCHS bridged-race population estimates for the denominator.
[SUP]2[/SUP] For each age category, rate ratios are the ratios between crude hospitalization rates within each racial/ethnic group and the crude hospitalization rate among non-Hispanic white persons in the same age category.
[SUP]3[/SUP] The highest rate ratio in each age category is presented in bold.
[SUP]4[/SUP] Overall rates are adjusted to account for differences in age distributions within race/ethnicity strata in the COVID-NET catchment area; the age strata used for the adjustment include 0-17, 18-49, 50-64, and 65+ years.

Non-Hispanic Black persons and non-Hispanic White persons represented the highest proportions of hospitalizations reported to COVID-NET, followed by Hispanic or Latino, non-Hispanic Asian or Pacific Islander, and non-Hispanic American Indian or Alaska Native persons. However, some racial and ethnic groups are disproportionately represented among hospitalizations as compared with the overall population of the catchment area. Prevalence ratios were highest among non-Hispanic American Indian or Alaska Native persons, followed by non-Hispanic Black persons and Hispanic or Latino persons.
1.3%33.0%23.1%5.0%31.5%
0.7%17.9%14.1%8.9%58.5%
1.91.81.60.60.5
[SUP]1[/SUP] Persons of multiple races (0.3%) or unknown race and ethnicity (5.8%) are not represented in the table but are included as part of the denominator.
[SUP]2[/SUP] Prevalence ratio is calculated as the ratio of the proportion of COVID-NET hospitalizations over the proportion of population in COVID-NET catchment area.

Among 10,824 hospitalized adults with information on underlying medical conditions, 90.3% had at least one reported underlying medical condition. The most commonly reported underlying medical conditions were hypertension, obesity, metabolic disease, and cardiovascular disease. Among 344 hospitalized children with information on underlying conditions, 50.3% had at least one reported underlying medical condition. The most commonly reported underlying medical conditions were obesity, neurologic disease, and asthma.
lab-confirmed-hospitalizations-underlying.gif

resize iconView Larger


Additional data on demographics, signs and symptoms at admission, underlying conditions, interventions, outcomes and discharge diagnoses, stratified by age, sex and race and ethnicity, are available.

Additional hospitalization surveillance information: Surveillance Methods | Additional rate data | Additional demographic and clinical data


Mortality Surveillance


The National Center for Health Statistics (NCHS) collects death certificate data from vital statistics offices for all deaths occurring in the United States. Based on death certificate data available on September 10, 2020, the percentage of deaths attributed to pneumonia, influenza, or COVID-19 (PIC) for week 36 is 6.3% and, while lower than the percentage during week 35 (9.5%), remains above the epidemic threshold. Percentages for recent weeks will likely increase as more death certificates are processed.

Weekly mortality surveillance data include a combination of machine coded and manually coded causes of death collected from death certificates. Percentages of deaths due to PIC are higher among manually coded records than more rapidly available machine coded records. Due to the additional time needed for manual coding, the initially reported PIC percentages may be lower than percentages calculated from final data.
nchs-mortality-report.gif

resize iconView Larger


*Data during recent weeks are incomplete because of the lag in time between when the death occurred and when the death certificate is completed, submitted to NCHS and processed for reporting purposes.
View Data Table


Additional NCHS mortality surveillance information: Surveillance Methods | Provisional Death Counts for COVID-19

More Information
View Page In:pdf icon 14 Pages, 1.5 MB
Last Updated Sept. 11, 2020
Content source: National Center for Immunization and Respiratory Diseases (NCIRD), Division of Viral DiseaseshomeCases, Data & Surveillance
https://www.cdc.gov/coronavirus/2019-ncov/covid-data/covidview/past-reports/09112020.html
 
  1. CASES, DATA & SURVEILLANCE
COVIDView Summary ending on September 12, 2020


Updated Sept. 18, 2020
Print
Download Weekly Summary pdf icon[13 Pages, 1.4 MB]
Key Updates for Week 37, ending September 12, 2020


Nationally, indicators that track COVID-19 activity continued to decline or remain stable (change of ≤0.1%); however, two regions reported a slight increase in the percentage of specimens testing positive for SARS-CoV-2, the virus causing COVID-19, and four regions reported a slight increase in the percent of visits for influenza-like illness (ILI) to outpatient providers or emergency departments (EDs). Mortality attributed to COVID-19 declined but remains above the epidemic threshold.
Virus

Public Health, Commercial and Clinical Laboratories


Nationally, the percentage of respiratory specimens testing positive for SARS-CoV-2 decreased from 5.2% during week 36 to 4.8% during week 37. National percentages of specimens testing positive for SARS-CoV-2 by type of laboratory are listed.
  • Public health laboratories – decreased from 5.4% during week 36 to 4.5% during week 37
  • Clinical laboratories – increased from 5.2% during week 36 to 5.4% during week 37
  • Commercial laboratories – decreased from 5.2% during week 36 to 4.8% during week 37
Outpatient and Emergency Department Visits

Outpatient Influenza-Like Illness Network (ILINet) and National Syndromic Surveillance Program (NSSP)


Two surveillance networks are being used to track outpatient or emergency department (ED) visits for illness with symptoms compatible with COVID-19.
  • Nationally, ILI activity remains below baseline for the 22nd consecutive week and is at levels that are typical for this time of year.
  • Nationally, the percentage of visits reported for ILI by ILINet participants remained stable (change of ≤0.1%) in week 37 compared with week 36. The percentage of visits for COVID-like illness (CLI) reported to NSSP decreased for the ninth consecutive week, from 2.0% during week 36 to 1.8% during week 37.
  • Recent changes in health care seeking behavior, including increasing use of telemedicine, recommendations to limit ED visits to severe illnesses, and increased social distancing, are likely affecting both networks, making it difficult to draw conclusions at this time. Tracking these systems moving forward will give additional insight into illness related to COVID-19.
Severe Disease

Hospitalizations


Cumulative COVID-19-associated hospitalization rates since March 1, 2020, are updated weekly. The overall cumulative COVID-19 hospitalization rate is 170.4 per 100,000, with the highest rates in people aged 65 years and older (460.7 per 100,000) and 50–64 years (255.1 per 100,000).
Mortality


Based on death certificate data, the percentage of deaths attributed to pneumonia, influenza, or COVID-19 (PIC) for week 37 is 6.2%. This is currently lower than the percentage during week 36 (9.3%); however, the percentage remains above the epidemic threshold and will likely increase as more death certificates are processed.

All data are preliminary and may change as more reports are received.

A description of the surveillance systems summarized in COVIDView, including methodology and detailed descriptions of each data component, is available on the surveillance methods page.
Key Points
  • Nationally, since mid-July, there has been an overall decreasing trend in the percentage of specimens testing positive for SARS-CoV-2 and a decreasing or stable (change of ≤0.1%) trend in the percentage of visits for ILI and CLI; however, there has been some regional variation.
  • Using combined data from the three laboratory types, the national percentage of respiratory specimens testing positive for SARS-CoV-2 with a molecular assay decreased from 5.2% during week 36 to 4.8% during week 37.
    • Regionally, the percentage of respiratory specimens testing positive for SARS-CoV-2 increased slightly in Regions 2 (New Jersey/New York/Puerto Rico) and 8 (Mountain) and decreased or remained stable in the remaining eight regions.
    • The highest percentage of specimens testing positive for SARS-CoV-2 were seen in Regions 4 (South East, 7.5%), 6 (South Central, 8.3%), and 7 (Central, 8.9%), but the percentage is decreasing in all three regions.
  • The percentage of outpatient or ED visits to ILINet providers for ILI is below baseline nationally and in all 10 regions of the country.
    • Compared with week 36, the percentage of visits for ILI during week 37 remained stable (change of ≤0.1%) nationally and decreased or was stable in seven of 10 regions. Regions 2 (New Jersey/New York/Puerto Rico), 5 (Midwest), and 6 (South Central) reported a slight increase in the percentage of visits for ILI.
  • The percentage of visits to EDs for CLI decreased nationally for the ninth consecutive week and, compared with the previous week, decreased or remained stable (change of ≤0.1%) in all 10 HHS regions. The percentage of visits to EDs for ILI was stable nationally and decreasing or stable in nine of the 10 regions. Region 7 (Central) reported a slight increase in the percentage of visits to EDs for ILI.
  • The overall cumulative COVID-19-associated hospitalization rate was 170.4 per 100,000; rates were highest in people 65 years of age and older (460.7 per 100,000) followed by people 50–64 years (255.1 per 100,000).
    • From the week ending August 1 (MMWR week 31) to the week ending September 12 (MMWR week 37), weekly hospitalization rates declined for all adult age groups. However, over this same time period, weekly rates remained steady for the pediatric age groups. Data for the most recent weeks may change as additional admissions occurring during those weeks are reported.
    • Hispanic or Latino persons, non-Hispanic American Indian or Alaska Native persons, and non-Hispanic Black persons all had age-adjusted hospitalization rates approximately 4.6 times that of non-Hispanic White persons.
  • Based on death certificate data, the percentage of deaths attributed to pneumonia, influenza, or COVID-19 (PIC) for week 37 was 6.2%, lower than the percentage during week 36 (9.3%), but above the epidemic threshold. These percentages will likely increase as more death certificates are processed.
  • All surveillance systems aim to provide the most complete data available. Estimates from previous weeks are subject to change as data are updated with the most complete data available.
U.S. Virologic Surveillance


The number of specimens tested for SARS-CoV-2 using a molecular assay and reported to CDC by public health laboratories and a subset of clinical and commercial laboratories in the United States are summarized below. All laboratories are performing primary diagnostic functions; therefore, the percentage of specimens testing positive across laboratory types can be used to monitor overall trends in COVID-19 activity. As the outbreak progresses, it is possible that different types of laboratories will take on different roles, and the data interpretation may need to change.
1,831,88048,727,297
234,5835,818,198
129,5865,488,128
1,467,71137,420,971
88,565 (4.8%)4,045,085 (8.3%)
10,634 (4.5%)446,780 (7.7%)
6,993 (5.4%)335,696 (6.1%)
70,938 (4.8%)3,262,609 (8.7%)
* Commercial and clinical laboratory data represent select laboratories and do not capture all tests performed in the United States.
Public Health Laboratories


resize iconView LargerView Data Table

Clinical Laboratories


resize iconView LargerView Data Table

Commercial Laboratories


resize iconView Larger


* Commercial laboratories began testing for SARS-CoV-2 in early March, but the number and geographic distribution of reporting commercial laboratories became stable enough to calculate a weekly percentage of specimens testing positive as of March 29, 2020.
View Data Table


Additional virologic surveillance information: Surveillance Methods


Outpatient/Emergency Department Illness


Two syndromic surveillance systems are being used to monitor trends in outpatient and emergency department (ED) visits that may be associated with COVID-19 illness. Each system monitors a slightly different syndrome, and together, these systems provide a more comprehensive picture of mild-to-moderate COVID-19 illness than either would individually. Both systems are currently being affected by changes in health care seeking behavior, including increased use of telemedicine, compliance with recommendations to limit ED visits to severe illnesses, and increased social distancing. These changes affect the numbers of people seeking care in the outpatient and ED settings and their reasons for doing so.
ILINet


The U.S. Outpatient Influenza-like Illness Surveillance Network (ILINet) provides data on visits for influenza-like illness (ILI) (fever [≥100[SUP]○[/SUP]F] and cough and/or sore throat) to approximately 2,600 primary care providers, emergency departments, and urgent care centers in all 50 states, Puerto Rico, the District of Columbia, and the U.S. Virgin Islands. Mild COVID-19 illness presents with symptoms similar to ILI, so ILINet is being used to track trends of mild-to-moderate COVID-19 illness and allows for comparison with prior influenza seasons.

Nationwide during week 37, 1.0% of patient visits reported through ILINet were due to ILI. This percentage is well below the national baseline of 2.4% and is typical for this time of year compared to previous influenza seasons. Compared with week 36, the percentage of visits for ILI during week 37 slightly increased overall and among the pediatric age groups (0-4 years and 5-24 years) and the 50-64 year olds.

resize iconView Larger


* Age-group specific percentages should not be compared with the national baseline.

On a regional levelexternal icon, the percentage of outpatient visits for ILI ranged from 0.6% to 1.6% during week 37 and was below the region-specific baseline in all regions. Compared with week 36, the percentage increased in three of the ten regions: Regions 2 (New Jersey/New York/Puerto Rico), 5 (Midwest), and 6 (South Central).

Note: In response to the COVID-19 pandemic, new data sources are being incorporated into ILINet through the summer weeks, when lower levels of influenza and other respiratory virus circulation are typical. Starting in week 21, enrollment of new sites began, leading to increases in the number of patient visits. While all regions remain below baseline levels for ILI, these system changes should be considered when drawing conclusions from these data. Any changes in ILI due to changes in respiratory virus circulation will be highlighted here.
Overall Percentage of Visits for ILI | Age Group ILI Data

ILI Activity Levels


Data collected in ILINet are used to produce a measure of ILI activity for all 50 states, Puerto Rico, the U.S. Virgin Islands, the District of Columbia, and New York City. The mean reported percentage of visits due to ILI for the current week is compared with the mean reported during non-influenza weeks, and the activity levels correspond to the number of standard deviations below, at, or above the mean.

The number of jurisdictions at each activity level during week 37 and changes compared with the previous week are summarized in the table below and shown in the following maps. The “high” level of activity in Iowa is due to visits for ILI associated with COVID-19 activity.
Activity Level
Week 37
(Week ending
September 12, 2020)
Compared with Previous Week
Very High0-1
High1+1
Moderate1+1
Low0-1
Minimal49-1
Insufficient Data3+1

[TD="colspan: 2"] Number of Jurisdictions [/TD]

*Data collected in ILINet may disproportionally represent certain populations within a state and may not accurately depict the full picture of influenza activity for the whole state. Differences in the data presented here by CDC and independently by some state health departments likely represent differing levels of data completeness with data presented by the state likely being the more complete.
National Syndromic Surveillance Program (NSSP): Emergency Department (ED) Visits


NSSP is a collaboration among CDC, federal partners, local, and state health departments and academic and private sector partners to collect, analyze, and share electronic patient encounter data received from multiple health care settings. To track trends of potential COVID-19 visits, visits for COVID-19-like illness (CLI) (fever and cough or shortness of breath or difficulty breathing or presence of a coronavirus diagnosis code) and ILI to a subset of emergency departments in 47 states are being monitored.

Nationwide during week 37, 1.8% of ED visits captured in NSSP were due to CLI and 0.7% were due to ILI. Compared with week 36, this week the percentage of visits for CLI and the percentage of visits for ILI decreased or remained stable (changes of ≤0.1%) nationally and in 9 of 10 HHS regionsexternal icon. Region 7 (Central) saw a slight increase in ILI compared with week 36.


Additional information about medically attended outpatient and emergency department visits for ILI and CLI: Surveillance Methods


Hospitalizations


The COVID-19-Associated Hospitalization Surveillance Network (COVID-NET) conducts population-based surveillance for laboratory-confirmed COVID-19-associated hospitalizations in select counties participating in the Emerging Infections Program (EIP) and the Influenza Hospitalization Surveillance Project (IHSP).

A total of 55,544 laboratory-confirmed COVID-19-associated hospitalizations were reported by sites between March 1, 2020 and September 12, 2020. The overall cumulative hospitalization rate was 170.4 per 100,000 population. Among those aged 0–4 years, 5–17 years, 18–49 years, 50–64 years, and ≥65 years, the highest rate of hospitalization was among adults aged ≥65 years, followed by adults aged 50–64 years and adults aged 18–49 years.
lab-confirmed-hospitalizations.gif

resize iconView Larger
Overall170.4
0-4 years17.3
5-17 years9.8
18-49 years116.0
18-29 years73.9
30-39 years115.6
40-49 years170.6
50-64 years255.1
65+ years460.7
65-74 years345.8
75-84 years546.3
85+ years833.1
Weekly hospitalization rates among all ages first peaked during the week ending April 18 (MMWR week 16), followed by a second peak during the week ending July 18 (MMWR week 29). From the week ending August 1 (MMWR week 31) to the week ending September 12 (MMWR week 37), weekly hospitalization rates declined for all adult age groups. However, over this same time period, weekly rates remained steady for the pediatric age groups. Data for the most recent weeks may change as additional admissions occurring during those weeks are reported.
lab-confirmed-hospitalizations-weekly.png

resize iconView Larger


Among the 55,544 laboratory-confirmed COVID-19-associated hospitalizations, 52,547 (94.6%) had information on race and ethnicity, while collection of race and ethnicity was still pending for 2,997 (5.4%) cases. When examining overall age-adjusted rates by race and ethnicity, Hispanic or Latino persons, non-Hispanic American Indian or Alaska Native persons, and non-Hispanic Black persons all had age-adjusted hospitalization rates approximately 4.6 times that of non-Hispanic White persons.


When examining age-stratified crude hospitalization rates by race and ethnicity, compared with non-Hispanic White persons in the same age group, crude hospitalization rates were 7.7 times higher among Hispanic or Latino persons aged 0–17 years; 8.5 times higher among Hispanic or Latino persons aged 18–49 years; 6.4 times higher among non-Hispanic American Indian or Alaska Native persons aged 50–64 years; and 3.7 times higher among non-Hispanic Black persons aged ≥65 years.
Age Category
Rate[SUP]1[/SUP]Rate Ratio[SUP]2,3[/SUP]Rate[SUP]1[/SUP]Rate Ratio[SUP]2,3[/SUP]Rate[SUP]1[/SUP]Rate Ratio[SUP]2,3[/SUP]Rate[SUP]1[/SUP]Rate Ratio[SUP]2,3[/SUP]Rate[SUP]1[/SUP]Rate Ratio[SUP]2,3[/SUP]
0—17 years11.73.817.95.823.87.76.01.93.11
18—49 years257.58.0188.35.9271.48.554.21.732.11
50—64 years643.46.4526.15.2584.55.8160.31.6100.81
65+ years710.82.51048.33.7760.12.7306.81.1282.01
Overall rate[SUP]4[/SUP] (age-adjusted)347.74.6346.24.6349.04.6101.01.375.21

[TD="colspan: 2"] Non-Hispanic
American Indian or Alaska Native
[/TD]
[TD="colspan: 2"] Non-Hispanic Black [/TD]
[TD="colspan: 2"] Hispanic or Latino [/TD]
[TD="colspan: 2"] Non-Hispanic Asian or Pacific Islander [/TD]
[TD="colspan: 2"] Non-Hispanic White [/TD]
[SUP]1[/SUP] COVID-19-associated hospitalization rates by race and ethnicity are calculated using COVID-NET hospitalizations with known race and ethnicity for the numerator and NCHS bridged-race population estimates for the denominator.
[SUP]2[/SUP] For each age category, rate ratios are the ratios between crude hospitalization rates within each racial and ethnic group and the crude hospitalization rate among non-Hispanic white persons in the same age category.
[SUP]3[/SUP] The highest rate ratio in each age category is presented in bold.
[SUP]4[/SUP] Overall rates are adjusted to account for differences in age distributions within race and ethnicity strata in the COVID-NET catchment area; the age strata used for the adjustment include 0–17, 18–49, 50–64, and 65+ years.

Non-Hispanic Black persons and non-Hispanic White persons represented the highest proportions of hospitalizations reported to COVID-NET, followed by Hispanic or Latino, non-Hispanic Asian or Pacific Islander, and non-Hispanic American Indian or Alaska Native persons. However, some racial and ethnic groups are disproportionately represented among hospitalizations as compared with the overall population of the catchment area. Prevalence ratios were highest among non-Hispanic American Indian or Alaska Native persons, followed by non-Hispanic Black persons and Hispanic or Latino persons.
1.3%32.9%23.1%5.1%31.7%
0.7%17.9%14.1%8.9%58.5%
1.91.81.60.60.5
[SUP]1[/SUP] Persons of multiple races (0.3%) or unknown race and ethnicity (5.6%) are not represented in the table but are included as part of the denominator.
[SUP]2[/SUP] Prevalence ratio is calculated as the ratio of the proportion of COVID-NET hospitalizations over the proportion of population in COVID-NET catchment area.

Among 11,428 hospitalized adults with information on underlying medical conditions, 90.3% had at least one reported underlying medical condition. The most commonly reported underlying medical conditions were hypertension, obesity, metabolic disease, and cardiovascular disease. Among 371 hospitalized children with information on underlying conditions, 49.1% had at least one reported underlying medical condition. The most commonly reported underlying medical conditions were obesity, neurologic disease, and asthma.
lab-confirmed-hospitalizations-underlying.gif

resize iconView Larger


Additional data on demographics, signs and symptoms at admission, underlying conditions, interventions, outcomes and discharge diagnoses, stratified by age, sex and race and ethnicity, are available.

Additional hospitalization surveillance information: Surveillance Methods | Additional rate data | Additional demographic and clinical data


Mortality Surveillance


The National Center for Health Statistics (NCHS) collects death certificate data from vital statistics offices for all deaths occurring in the United States. Based on death certificate data available on September 17, 2020, the percentage of deaths attributed to pneumonia, influenza, or COVID-19 (PIC) for week 37 is 6.2% and, while lower than the percentage during week 36 (9.3%), remains above the epidemic threshold. Percentages for recent weeks will likely increase as more death certificates are processed.

Weekly mortality surveillance data include a combination of machine coded and manually coded causes of death collected from death certificates. Percentages of deaths due to PIC are higher among manually coded records than more rapidly available machine coded records. Due to the additional time needed for manual coding, the initially reported PIC percentages may be lower than percentages calculated from final data.
nchs-mortality-report.gif

resize iconView Larger


*Data during recent weeks are incomplete because of the lag in time between when the death occurred and when the death certificate is completed, submitted to NCHS and processed for reporting purposes.
View Data Table


Additional NCHS mortality surveillance information: Surveillance Methods | Provisional Death Counts for COVID-19
More Information
View Page In:pdf icon 13 Pages, 1.4 MB
Last Updated Sept. 18, 2020
Content source: National Center for Immunization and Respiratory Diseases (NCIRD), Division of Viral DiseaseshomeCases, Data & Surveillance
https://www.cdc.gov/coronavirus/2019-ncov/covid-data/covidview/past-reports/09182020.html
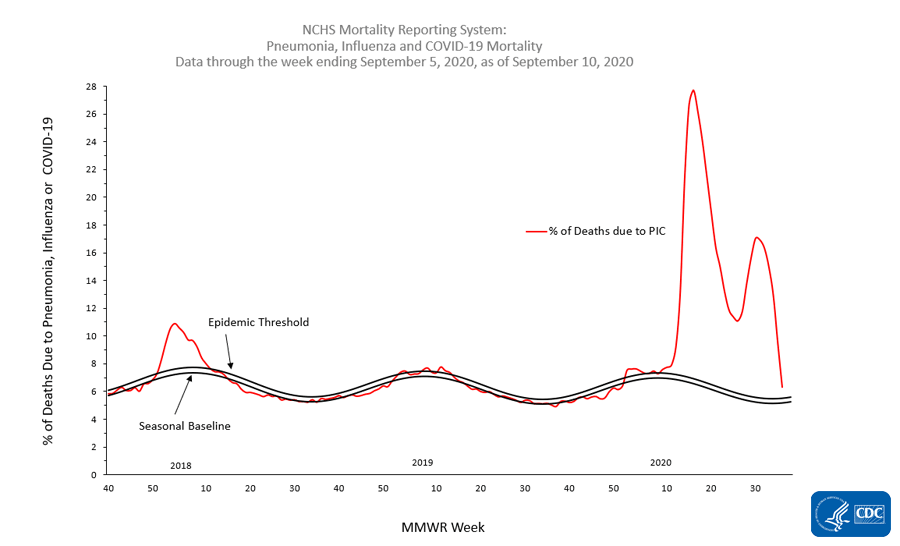
 
  1. CASES, DATA & SURVEILLANCE
COVIDView Summary ending on September 19, 2020


Updated Sept. 25, 2020
Print
Download Weekly Summary pdf icon[13 pages, 1 MB]
Key Updates for Week 38, ending September 19, 2020


Nationally, indicators that track COVID-19 activity continued to decline or remain stable (change of ≤0.1%); however, three regions reported an increase in the percentage of specimens testing positive for SARS-CoV-2, the virus causing COVID-19, and one of those regions also reported an increase in the percentage of visits for influenza-like illness (ILI) and COVID-like illness (CLI) to emergency departments (EDs). Mortality attributed to COVID-19 declined but remains above the epidemic threshold.
Virus

Public Health, Commercial and Clinical Laboratories


Nationally, the percentage of respiratory specimens testing positive for SARS-CoV-2 decreased from 5.1% during week 37 to 4.8% during week 38. National percentages of specimens testing positive for SARS-CoV-2 by type of laboratory are listed.
  • Public health laboratories – increased from 4.6% during week 37 to 5.1% during week 38
  • Clinical laboratories – decreased from 6.0% during week 37 to 5.4% during week 38
  • Commercial laboratories – decreased from 5.0% during week 37 to 4.6% during week 38
Outpatient and Emergency Department Visits

Outpatient Influenza-Like Illness Network (ILINet) and National Syndromic Surveillance Program (NSSP)


Two surveillance networks are being used to track outpatient or emergency department (ED) visits for illness with symptoms compatible with COVID-19.
  • Nationally, ILI activity remains below baseline for the 23rd consecutive week and is at levels that are typical for this time of year.
  • Nationally, the percentage of visits for ILI reported by ILINet participants and the percentage of visits for COVID-like illness (CLI) reported to NSSP remained stable (change of ≤0.1%) in week 38 compared with week 37.
  • Recent changes in health care seeking behavior, including increasing use of telemedicine, recommendations to limit ED visits to severe illnesses, and increased social distancing, are likely affecting both networks, making it difficult to draw conclusions at this time. Tracking these systems moving forward will give additional insight into illness related to COVID-19.
Severe Disease

Hospitalizations


Cumulative COVID-19-associated hospitalization rates since March 1, 2020, are updated weekly. The overall cumulative COVID-19 hospitalization rate is 174.8 per 100,000, with the highest rates in people aged 65 years and older (472.3 per 100,000) and 50–64 years (261.5 per 100,000).
Mortality


Based on death certificate data, the percentage of deaths attributed to pneumonia, influenza, or COVID-19 (PIC) for week 38 is 6.6%. This is currently lower than the percentage during week 37 (9.8%); however, the percentage remains above the epidemic threshold and will likely increase as more death certificates are processed.

All data are preliminary and may change as more reports are received.

A description of the surveillance systems summarized in COVIDView, including methodology and detailed descriptions of each data component, is available on the surveillance methods page.
Key Points
  • Nationally, since mid-July, there has been an overall decreasing trend in the percentage of specimens testing positive for SARS-CoV-2 and a decreasing or stable (change of ≤0.1%) trend in the percentage of visits for ILI and CLI; however, there has been some regional variation.
  • Using combined data from the three laboratory types, the national percentage of respiratory specimens testing positive for SARS-CoV-2 with a molecular assay decreased from 5.1% during week 37 to 4.8% during week 38.
    • Regionally, the percentage of respiratory specimens testing positive for SARS-CoV-2 increased in Regions 7 (Central), 8 (Mountain) and 10 (Pacific Northwest) and decreased or remained stable in the remaining seven regions.
    • The highest percentage of specimens testing positive for SARS-CoV-2 were seen in Regions 6 (South Central, 8.3%) and 7 (Central, 9.0%).
  • The percentage of outpatient or ED visits to ILINet providers for ILI is below baseline nationally and in all 10 regions of the country.
    • Compared with week 37, the percentage of visits for ILI during week 38 remained stable nationally and decreased or was stable (change of ≤0.1%) in all 10 regions.
  • Nationally, the percentage of visits to EDs for CLI and ILI remained stable (change of ≤0.1%) in week 38 compared with week 37. This is the tenth consecutive week of a declining or stable percentage of visits for CLI and ILI.
    • Region 8 (Mountain) reported an increase in the percentage of visits for both CLI and ILI in week 38 compared to week 37. The remaining nine regions reported a stable (change of ≤0.1%) or decreasing percentage.
  • The overall cumulative COVID-19-associated hospitalization rate was 174.8 per 100,000; rates were highest in people 65 years of age and older (472.3 per 100,000) followed by people 50–64 years (261.5 per 100,000).
    • From the week ending August 1 (MMWR week 31) to the week ending September 19 (MMWR week 38), weekly hospitalization rates declined for all adult age groups. However, over this same time period, weekly rates remained steady for the pediatric age groups. Data for the most recent weeks may change as additional admissions occurring during those weeks are reported.
    • Age-adjusted hospitalization rates for Hispanic or Latino persons and non-Hispanic Black persons were both approximately 4.6 times that of non-Hispanic White persons. The age-adjusted hospitalization rate for non-Hispanic American Indian or Alaska Native persons was approximately 4.5 times that of non-Hispanic White persons.
  • Based on death certificate data, the percentage of deaths attributed to pneumonia, influenza, or COVID-19 (PIC) for week 38 was 6.6%, which was lower than the percentage during week 37 (9.8%), but above the epidemic threshold. These percentages will likely increase as more death certificates are processed.
  • All surveillance systems aim to provide the most complete data available. Estimates from previous weeks are subject to change as data are updated with the most complete data available.
U.S. Virologic Surveillance


The number of specimens tested for SARS-CoV-2 using a molecular assay and reported to CDC by public health laboratories and a subset of clinical and commercial laboratories in the United States are summarized below. All laboratories are performing primary diagnostic functions; therefore, the percentage of specimens testing positive across laboratory types can be used to monitor overall trends in COVID-19 activity. As the outbreak progresses, it is possible that different types of laboratories will take on different roles, and the data interpretation may need to change.
2,029,13051,075,554
294,1536,159,942
175,3085,848,708
1,559,66939,066,904
96,477 (4.8%)4,163,115 (8.2%)
15,074 (5.1%)464,343 (7.5%)
9,509 (5.4%)357,369 (6.1%)
71,894 (4.6%)3,341,403 (8.6%)
* Commercial and clinical laboratory data represent select laboratories and do not capture all tests performed in the United States.
Public Health Laboratories


resize iconView LargerView Data Table

Clinical Laboratories


resize iconView LargerView Data Table

Commercial Laboratories


resize iconView Larger


* Commercial laboratories began testing for SARS-CoV-2 in early March, but the number and geographic distribution of reporting commercial laboratories became stable enough to calculate a weekly percentage of specimens testing positive as of March 29, 2020.
View Data Table


Additional virologic surveillance information: Surveillance Methods


Outpatient/Emergency Department Illness


Two syndromic surveillance systems are being used to monitor trends in outpatient and emergency department (ED) visits that may be associated with COVID-19 illness. Each system monitors a slightly different syndrome, and together, these systems provide a more comprehensive picture of mild-to-moderate COVID-19 illness than either would individually. Both systems are currently being affected by changes in health care seeking behavior, including increased use of telemedicine, compliance with recommendations to limit ED visits to severe illnesses, and increased social distancing. These changes affect the numbers of people seeking care in the outpatient and ED settings and their reasons for doing so.
ILINet


The U.S. Outpatient Influenza-like Illness Surveillance Network (ILINet) provides data on visits for influenza-like illness (ILI) (fever [≥100[SUP]○[/SUP]F] and cough and/or sore throat) to approximately 2,600 primary care providers, emergency departments, and urgent care centers in all 50 states, Puerto Rico, the District of Columbia, and the U.S. Virgin Islands. Mild COVID-19 illness presents with symptoms similar to ILI, so ILINet is being used to track trends of mild-to-moderate COVID-19 illness and allows for comparison with prior influenza seasons.

Nationwide during week 38, 1.0% of patient visits reported through ILINet were due to ILI. This percentage is well below the national baseline of 2.4% and is typical for this time of year compared to previous influenza seasons. Compared with week 37, the percentage of visits for ILI during week 38 slightly increased overall and among those aged 0 to 4 years and 25 to 49 years.

resize iconView Larger


* Age-group specific percentages should not be compared with the national baseline.

On a regional levelexternal icon, the percentage of outpatient visits for ILI ranged from 0.6% to 1.4% during week 38 and was below the region-specific baseline in all regions. Compared with week 37, the percentage during week 38 decreased slightly in regions 6 (South Central) and 7 (Central) and remained stable (change of ≤0.1%) in the remaining eight regions.

Note: In response to the COVID-19 pandemic, new data sources are being incorporated into ILINet through the summer weeks, when lower levels of influenza and other respiratory virus circulation are typical. Starting in week 21, enrollment of new sites began, leading to increases in the number of patient visits. While all regions remain below baseline levels for ILI, these system changes should be considered when drawing conclusions from these data. Any changes in ILI due to changes in respiratory virus circulation will be highlighted here.
Overall Percentage of Visits for ILI | Age Group ILI Data

ILI Activity Levels


Data collected in ILINet are used to produce a measure of ILI activity for all 50 states, Puerto Rico, the U.S. Virgin Islands, the District of Columbia, and New York City. The mean reported percentage of visits due to ILI for the current week is compared with the mean reported during non-influenza weeks, and the activity levels correspond to the number of standard deviations below, at, or above the mean.

The number of jurisdictions at each activity level during week 38 and changes compared with the previous week are summarized in the table below and shown in the following maps.
Activity Level
Week 38
(Week ending
September 19, 2020)
Compared with Previous Week
Very High0No Change
High0-1
Moderate1No Change
Low1+1
Minimal49No Change
Insufficient Data3No Change

[TD="colspan: 2"] Number of Jurisdictions [/TD]

*Data collected in ILINet may disproportionally represent certain populations within a state and may not accurately depict the full picture of influenza activity for the whole state. Differences in the data presented here by CDC and independently by some state health departments likely represent differing levels of data completeness with data presented by the state likely being the more complete.
National Syndromic Surveillance Program (NSSP): Emergency Department (ED) Visits


NSSP is a collaboration among CDC, federal partners, local, and state health departments and academic and private sector partners to collect, analyze, and share electronic patient encounter data received from multiple health care settings. To track trends of potential COVID-19 visits, visits for COVID-19-like illness (CLI) (fever and cough or shortness of breath or difficulty breathing or presence of a coronavirus diagnosis code) and ILI to a subset of emergency departments in 47 states are being monitored.

Nationwide during week 38, 1.8% of ED visits captured in NSSP were due to CLI and 0.7% were due to ILI. Compared with week 37, the percentage of visits for CLI and the percentage of visits for ILI this week decreased or remained stable (changes of ≤0.1%) nationally and in 9 of 10 HHS regionsexternal icon. Region 8 (Mountain) saw an increase in both CLI and ILI compared with week 37.


Additional information about medically attended outpatient and emergency department visits for ILI and CLI: Surveillance Methods


Hospitalizations


The COVID-19-Associated Hospitalization Surveillance Network (COVID-NET) conducts population-based surveillance for laboratory-confirmed COVID-19-associated hospitalizations in select counties participating in the Emerging Infections Program (EIP) and the Influenza Hospitalization Surveillance Project (IHSP).

A total of 57,006 laboratory-confirmed COVID-19-associated hospitalizations were reported by sites between March 1, 2020, and September 19, 2020. The overall cumulative hospitalization rate was 174.8 per 100,000 population. Among those aged 0–4 years, 5–17 years, 18–49 years, 50–64 years, and ≥65 years, the highest rate of hospitalization was among adults aged ≥65 years, followed by adults aged 50–64 years and adults aged 18–49 years.
lab-confirmed-hospitalizations.gif

resize iconView Larger
Overall174.8
0-4 years17.9
5-17 years10.3
18-49 years119.2
18-29 years76.6
30-39 years119.1
40-49 years174.4
50-64 years261.5
65+ years472.3
65-74 years354.2
75-84 years562.3
85+ years850.1
Weekly hospitalization rates among all ages first peaked during the week ending April 18 (MMWR week 16), followed by a second peak during the week ending July 18 (MMWR week 29). From the week ending August 1 (MMWR week 31) to the week ending September 19 (MMWR week 38), weekly hospitalization rates declined for all adult age groups. However, over this same time period, weekly rates remained steady for the pediatric age groups. Data for the most recent weeks may change as additional admissions occurring during those weeks are reported.
lab-confirmed-hospitalizations-weekly.png

resize iconView Larger


Among the 57,006 laboratory-confirmed COVID-19-associated hospitalizations, 54,074 (94.9%) had information on race and ethnicity, while collection of race and ethnicity was still pending for 2,932 (5.1%) cases. When examining overall age-adjusted rates by race and ethnicity, rates for Hispanic or Latino persons and non-Hispanic Black persons were both approximately 4.6 times the rate among non-Hispanic White persons. The age-adjusted hospitalization rate for non-Hispanic American Indian or Alaska Native persons was approximately 4.5 times that of non-Hispanic White persons.


When examining age-stratified crude hospitalization rates by race and ethnicity, compared with non-Hispanic White persons in the same age group, crude hospitalization rates were 7.5 times higher among Hispanic or Latino persons aged 0–17 years; 8.4 times higher among Hispanic or Latino persons aged 18–49 years; 6.2 times higher among non-Hispanic American Indian or Alaska Native persons aged 50–64 years; and 3.7 times higher among non-Hispanic Black persons aged ≥65 years.
Age Category
Rate[SUP]1[/SUP]Rate Ratio[SUP]2,3[/SUP]Rate[SUP]1[/SUP]Rate Ratio[SUP]2,3[/SUP]Rate[SUP]1[/SUP]Rate Ratio[SUP]2,3[/SUP]Rate[SUP]1[/SUP]Rate Ratio[SUP]2,3[/SUP]Rate[SUP]1[/SUP]Rate Ratio[SUP]2,3[/SUP]
0—17 years11.73.518.65.624.67.56.31.93.31
18—49 years260.57.8194.75.8279.38.455.41.733.41
50—64 years643.46.2545.05.2595.85.7166.81.6104.41
65+ years715.02.51074.23.7784.52.7319.81.1290.31
Overall rate[SUP]4[/SUP] (age-adjusted)349.94.5356.84.6358.54.6104.71.377.71

[TD="colspan: 2"] Non-Hispanic
American Indian or Alaska Native
[/TD]
[TD="colspan: 2"] Non-Hispanic Black [/TD]
[TD="colspan: 2"] Hispanic or Latino [/TD]
[TD="colspan: 2"] Non-Hispanic Asian or Pacific Islander [/TD]
[TD="colspan: 2"] Non-Hispanic White [/TD]
[SUP]1[/SUP] COVID-19-associated hospitalization rates by race and ethnicity are calculated using COVID-NET hospitalizations with known race and ethnicity for the numerator and NCHS bridged-race population estimates for the denominator.
[SUP]2[/SUP] For each age category, rate ratios are the ratios between crude hospitalization rates within each racial and ethnic group and the crude hospitalization rate among non-Hispanic white persons in the same age category.
[SUP]3[/SUP] The highest rate ratio in each age category is presented in bold.
[SUP]4[/SUP] Overall rates are adjusted to account for differences in age distributions within race and ethnicity strata in the COVID-NET catchment area; the age strata used for the adjustment include 0–17, 18–49, 50–64, and 65+ years.

Non-Hispanic Black persons and non-Hispanic White persons represented the highest proportions of hospitalizations reported to COVID-NET, followed by Hispanic or Latino, non-Hispanic Asian or Pacific Islander, and non-Hispanic American Indian or Alaska Native persons. However, some racial and ethnic groups are disproportionately represented among hospitalizations as compared with the overall population of the catchment area. Prevalence ratios were highest among non-Hispanic American Indian or Alaska Native persons, followed by non-Hispanic Black persons and Hispanic or Latino persons.
1.3%33.0%23.1%5.1%31.8%
0.7%17.9%14.1%8.9%58.5%
1.91.81.60.60.5
[SUP]1[/SUP] Persons of multiple races (0.3%) or unknown race and ethnicity (5.4%) are not represented in the table but are included as part of the denominator.
[SUP]2[/SUP] Prevalence ratio is calculated as the ratio of the proportion of COVID-NET hospitalizations over the proportion of population in COVID-NET catchment area.

Among 12,151 hospitalized adults with information on underlying medical conditions, 90.4% had at least one reported underlying medical condition. The most commonly reported underlying medical conditions were hypertension, obesity, metabolic disease, and cardiovascular disease. Among 393 hospitalized children with information on underlying conditions, 49.9% had at least one reported underlying medical condition. The most commonly reported underlying medical conditions were obesity, neurologic disease, and asthma.
lab-confirmed-hospitalizations-underlying.gif

resize iconView Larger


Additional data on demographics, signs and symptoms at admission, underlying conditions, interventions, outcomes and discharge diagnoses, stratified by age, sex and race and ethnicity, are available.

Additional hospitalization surveillance information: Surveillance Methods | Additional rate data | Additional demographic and clinical data


Mortality Surveillance


The National Center for Health Statistics (NCHS) collects death certificate data from vital statistics offices for all deaths occurring in the United States. Based on death certificate data available on September 24, 2020, the percentage of deaths attributed to pneumonia, influenza, or COVID-19 (PIC) for week 38 is 6.6% and, while lower than the percentage during week 37 (9.8%), remains above the epidemic threshold. Percentages for recent weeks will likely increase as more death certificates are processed.

Weekly mortality surveillance data include a combination of machine coded and manually coded causes of death collected from death certificates. Percentages of deaths due to PIC are higher among manually coded records than more rapidly available machine coded records. Due to the additional time needed for manual coding, the initially reported PIC percentages may be lower than percentages calculated from final data.
nchs-mortality-report.gif

resize iconView Larger


*Data during recent weeks are incomplete because of the lag in time between when the death occurred and when the death certificate is completed, submitted to NCHS and processed for reporting purposes.
View Data Table


Additional NCHS mortality surveillance information: Surveillance Methods | Provisional Death Counts for COVID-19
More Information
View Page In:pdf icon 13 Pages, 1 MB
Last Updated Sept. 25, 2020
Content source: National Center for Immunization and Respiratory Diseases (NCIRD), Division of Viral DiseaseshomeCases, Data & Surveillance
https://www.cdc.gov/coronavirus/2019-ncov/covid-data/covidview/past-reports/09252020.html
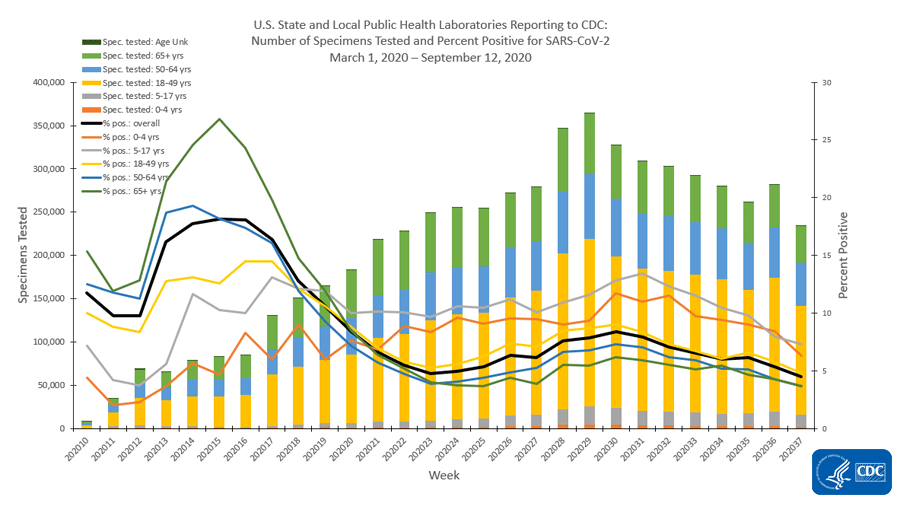
 
  1. CASES, DATA & SURVEILLANCE
COVIDView Summary ending on September 26, 2020


Updated Oct. 2, 2020
Print
Download Weekly Summary pdf icon[13 pages, 1 MB]
Key Updates for Week 39, ending September 26, 2020


Nationally, indicators that track COVID-19 activity continued to decline or remain stable (change of ≤0.1%); however, three regions reported an increase in the percentage of specimens testing positive for SARS-CoV-2, the virus causing COVID-19, and two of those regions also reported an increase in the percentage of visits for influenza-like illness (ILI) or COVID-like illness (CLI) to emergency departments (EDs) or outpatient providers. Mortality attributed to COVID-19 declined but remains above the epidemic threshold.
Virus

Public Health, Commercial and Clinical Laboratories


Nationally, the percentage of respiratory specimens testing positive for SARS-CoV-2 decreased from 5.0% during week 38 to 4.8% during week 39. National percentages of specimens testing positive for SARS-CoV-2 by type of laboratory are listed.
  • Public health laboratories – decreased from 5.1% during week 38 to 4.9% during week 39
  • Clinical laboratories – increased slightly from 6.2% during week 38 to 6.3% during week 39
  • Commercial laboratories – decreased from 4.8% during week 38 to 4.6% during week 39
Outpatient and Emergency Department Visits

Outpatient Influenza-Like Illness Network (ILINet) and National Syndromic Surveillance Program (NSSP)


Two surveillance networks are being used to track outpatient or emergency department (ED) visits for illness with symptoms compatible with COVID-19.
  • Nationally, ILI activity remains below baseline for the 24th consecutive week and is at levels that are typical for this time of year.
  • Nationally, the percentage of visits for ILI reported by ILINet participants and the percentage of visits for COVID-like illness (CLI) reported to NSSP remained stable (change of ≤0.1%) in week 39 compared with week 38.
  • Recent changes in health care seeking behavior, including increasing use of telemedicine, recommendations to limit ED visits to severe illnesses, and increased social distancing, are likely affecting both networks, making it difficult to draw conclusions at this time. Tracking these systems moving forward will give additional insight into illness related to COVID-19.
Severe Disease

Hospitalizations


Cumulative COVID-19-associated hospitalization rates since March 1, 2020, are updated weekly. The overall cumulative COVID-19 hospitalization rate was 178.2 per 100,000, with the highest rates in people aged 65 years and older (481.5 per 100,000) and 50–64 years (266.3 per 100,000).
Mortality


Based on death certificate data, the percentage of deaths attributed to pneumonia, influenza, or COVID-19 (PIC) for week 39 is 6.4%. This is currently lower than the percentage during week 38 (9.5%); however, the percentage remains above the epidemic threshold and will likely increase as more death certificates are processed.

All data are preliminary and may change as more reports are received.

A description of the surveillance systems summarized in COVIDView, including methodology and detailed descriptions of each data component, is available on the surveillance methods page.
Key Points
  • Nationally, since mid-July, there has been an overall decreasing trend in the percentage of specimens testing positive for SARS-CoV-2 and a decreasing or stable (change of ≤0.1%) trend in the percentage of visits for ILI and CLI; however, there has been some regional variation.
  • Using combined data from the three laboratory types, the national percentage of respiratory specimens testing positive for SARS-CoV-2 with a molecular assay decreased from 5.0% during week 38 to 4.8% during week 39.
    • Regionally, the percentage of respiratory specimens testing positive for SARS-CoV-2 increased in Regions 7 (Central), 8 (Mountain), and 10 (Pacific Northwest) and decreased or remained stable in the remaining seven regions.
    • The highest percentage of specimens testing positive for SARS-CoV-2 were seen in Regions 6 (South Central, 8.0%), 7 (Central, 9.1%), and 8 (Mountain, 7.3%). Compared to week 38, the percentage of specimens testing positive during week 39 is increasing in Regions 7 and 8 and decreasing in Region 6.
  • The percentage of outpatient or ED visits to ILINet providers for ILI is below baseline nationally and in all 10 regions of the country.
    • Compared with week 38, the percentage of visits for ILI during week 39 remained stable nationally and decreased or was stable (change of ≤0.1%) in nine of the 10 regions. Region 10 (Pacific Northwest) reported a slight increase.
  • Nationally, the percentage of visits to EDs for CLI and ILI remained stable (change of ≤0.1%) in week 39 compared with week 38. This is the 11th consecutive week of a declining or stable percentage of visits for CLI and ILI.
    • Regions 5 (Midwest) and 8 (Mountain) reported an increase in the percentage of visits for CLI in week 38 compared to week 37, and Region 10 (Pacific Northwest) reported an increase in the percentage of visits for ILI. The remaining regions reported a stable (change of ≤0.1%) or decreasing percentage.
  • The overall cumulative COVID-19-associated hospitalization rate was 178.2 per 100,000; rates were highest in people 65 years of age and older (481.5 per 100,000) followed by people 50–64 years (266.3 per 100,000).
    • From the week ending August 1 (MMWR week 31) to the week ending September 26 (MMWR week 39), weekly hospitalization rates declined for all adult age groups. However, over this same time period, weekly rates remained steady for the pediatric age groups. Data for the most recent weeks may change as additional admissions occurring during those weeks are reported.
    • The age-adjusted hospitalization rate for Hispanic or Latino persons was approximately 4.6 times that of non-Hispanic White persons. Age-adjusted hospitalization rates for both non-Hispanic Black persons and non-Hispanic American Indian or Alaska Native persons were approximately 4.5 times that of non-Hispanic White persons.
  • Based on death certificate data, the percentage of deaths attributed to pneumonia, influenza, or COVID-19 (PIC) for week 39 was 6.4%, which was lower than the percentage during week 38 (9.5%), but above the epidemic threshold. These percentages will likely increase as more death certificates are processed.
  • All surveillance systems aim to provide the most complete data available. Estimates from previous weeks are subject to change as data are updated with the most complete data available.
U.S. Virologic Surveillance


The number of specimens tested for SARS-CoV-2 using a molecular assay and reported to CDC by public health laboratories and a subset of clinical and commercial laboratories in the United States are summarized below. All laboratories are performing primary diagnostic functions; therefore, the percentage of specimens testing positive across laboratory types can be used to monitor overall trends in COVID-19 activity. As the outbreak progresses, it is possible that different types of laboratories will take on different roles, and the data interpretation may need to change.
2,080,26853,644,944
296,3736,481,480
216,0406,403,163
1,567,85540,760,301
99,950 (4.8%)4,292,225 (8.0%)
14,670 (4.9%)480,199 (7.4%)
13,629 (6.3%)390,489 (6.1%)
71,651 (4.6%)3,421,537 (8.4%)
* Commercial and clinical laboratory data represent select laboratories and do not capture all tests performed in the United States.
Public Health Laboratories


resize iconView LargerView Data Table

Clinical Laboratories


resize iconView LargerView Data Table

Commercial Laboratories


resize iconView Larger


* Commercial laboratories began testing for SARS-CoV-2 in early March, but the number and geographic distribution of reporting commercial laboratories became stable enough to calculate a weekly percentage of specimens testing positive as of March 29, 2020.
View Data Table


Additional virologic surveillance information: Surveillance Methods


Outpatient/Emergency Department Illness


Two syndromic surveillance systems are being used to monitor trends in outpatient and emergency department (ED) visits that may be associated with COVID-19 illness. Each system monitors a slightly different syndrome, and together, these systems provide a more comprehensive picture of mild-to-moderate COVID-19 illness than either would individually. Both systems are currently being affected by changes in health care seeking behavior, including increased use of telemedicine, compliance with recommendations to limit ED visits to severe illnesses, and increased social distancing. These changes affect the numbers of people seeking care in the outpatient and ED settings and their reasons for doing so.
ILINet


The U.S. Outpatient Influenza-like Illness Surveillance Network (ILINet) provides data on visits for influenza-like illness (ILI) (fever [≥100[SUP]○[/SUP]F] and cough and/or sore throat) to approximately 2,600 primary care providers, emergency departments, and urgent care centers in all 50 states, Puerto Rico, the District of Columbia, and the U.S. Virgin Islands. Mild COVID-19 illness presents with symptoms similar to ILI, so ILINet is being used to track trends of mild-to-moderate COVID-19 illness and allows for comparison with prior influenza seasons.

Nationwide during week 39, 1.0% of patient visits reported through ILINet were due to ILI. This percentage is below the national baseline of 2.4% and is typical for this time of year compared to previous influenza seasons. Compared with week 38, the percentage of visits for ILI during week 39 remained increased among those aged 0 to 4 years and 5 to 24 years but remained stable overall and among the adult age groups.

resize iconView Larger


* Age-group specific percentages should not be compared with the national baseline.

On a regional levelexternal icon, the percentage of outpatient visits for ILI ranged from 0.7% to 1.4% during week 39 and was below the region-specific baseline in all regions. Compared with week 38, the percentage during week 39 increased in Region 10 (Pacific Northwest) and decreased or remained stable (change of ≤0.1%) in the remaining nine regions.

Note: In response to the COVID-19 pandemic, new data sources are being incorporated into ILINet through the summer weeks, when lower levels of influenza and other respiratory virus circulation are typical. Starting in week 21, enrollment of new sites began, leading to increases in the number of patient visits. While all regions remain below baseline levels for ILI, these system changes should be considered when drawing conclusions from these data. Any changes in ILI due to changes in respiratory virus circulation will be highlighted here.
Overall Percentage of Visits for ILI | Age Group ILI Data

ILI Activity Levels


Data collected in ILINet are used to produce a measure of ILI activity for all 50 states, Puerto Rico, the U.S. Virgin Islands, the District of Columbia, and New York City. The mean reported percentage of visits due to ILI for the current week is compared with the mean reported during non-influenza weeks, and the activity levels correspond to the number of standard deviations below, at, or above the mean.

The number of jurisdictions at each activity level during week 39 and changes compared with the previous week are summarized in the table below and shown in the following maps.
Activity Level
Week 39
(Week ending
September 26, 2020)
Compared with Previous Week
Very High0No Change
High0No Change
Moderate1No Change
Low0-1
Minimal49No Change
Insufficient Data4+1

[TD="colspan: 2"] Number of Jurisdictions [/TD]

*Data collected in ILINet may disproportionally represent certain populations within a state and may not accurately depict the full picture of influenza activity for the whole state. Differences in the data presented here by CDC and independently by some state health departments likely represent differing levels of data completeness with data presented by the state likely being the more complete.
National Syndromic Surveillance Program (NSSP): Emergency Department (ED) Visits


NSSP is a collaboration among CDC, federal partners, local, and state health departments and academic and private sector partners to collect, analyze, and share electronic patient encounter data received from multiple health care settings. To track trends of potential COVID-19 visits, visits for COVID-19-like illness (CLI) (fever and cough or shortness of breath or difficulty breathing or presence of a coronavirus diagnosis code) and ILI to a subset of emergency departments in 47 states are being monitored.

Nationwide during week 39, 1.9% of ED visits captured in NSSP were due to CLI and 0.7% were due to ILI. Compared with week 38, the percentage of visits for CLI and the percentage of visits for ILI this week decreased or remained stable (changes of ≤0.1%) nationally and in eight of 10 HHS regionsexternal icon. Regions 5 (Midwest) and 8 (Mountain) saw an increase in CLI while ILI percentages remained stable compared with week 38.


Additional information about medically attended outpatient and emergency department visits for ILI and CLI: Surveillance Methods


Hospitalizations


The COVID-19-Associated Hospitalization Surveillance Network (COVID-NET) conducts population-based surveillance for laboratory-confirmed COVID-19-associated hospitalizations in select counties participating in the Emerging Infections Program (EIP) and the Influenza Hospitalization Surveillance Project (IHSP).

A total of 58,088 laboratory-confirmed COVID-19-associated hospitalizations were reported by sites between March 1, 2020 and September 26, 2020. The overall cumulative hospitalization rate was 178.2 per 100,000 population. Among those aged 0–4 years, 5–17 years, 18–49 years, 50–64 years, and ≥65 years, the highest rate of hospitalization was among adults aged ≥65 years, followed by adults aged 50–64 years and adults aged 18–49 years.
lab-confirmed-hospitalizations.gif

resize iconView Larger
Overall178.2
0-4 years18.4
5-17 years10.6
18-49 years121.4
18-29 years78.5
30-39 years121.4
40-49 years176.8
50-64 years266.3
65+ years481.5
65-74 years361.5
75-84 years572.6
85+ years865.8
Weekly hospitalization rates among all ages first peaked during the week ending April 18 (MMWR week 16), followed by a second peak during the week ending July 18 (MMWR week 29). From the week ending August 1 (MMWR week 31) to the week ending September 26 (MMWR week 39), weekly hospitalization rates declined for all adult age groups. However, over this same time period, weekly rates remained steady for the pediatric age groups. Data for the most recent weeks may change as additional admissions occurring during those weeks are reported.
lab-confirmed-hospitalizations-weekly.png

resize iconView Larger


Among the 58,088 laboratory-confirmed COVID-19-associated hospitalizations, 55,241 (95.1%) had information on race and ethnicity, while collection of race and ethnicity was still pending for 2,847 (4.9%) cases. When examining overall age-adjusted rates by race and ethnicity, the rate for Hispanic or Latino persons was approximately 4.6 times the rate among non-Hispanic White persons. Age-adjusted hospitalization rates for both non-Hispanic Black persons and non-Hispanic American Indian or Alaska Native persons were approximately 4.5 times that of non-Hispanic White persons.


When examining age-stratified crude hospitalization rates by race and ethnicity, compared with non-Hispanic White persons in the same age group, crude hospitalization rates were 7.5 times higher among Hispanic or Latino persons aged 0–17 years; 8.2 times higher among Hispanic or Latino persons aged 18–49 years; 6.1 times higher among non-Hispanic American Indian or Alaska Native persons aged 50–64 years; and 3.7 times higher among non-Hispanic Black persons aged ≥65 years.
Age Category
Rate[SUP]1[/SUP]Rate Ratio[SUP]2,3[/SUP]Rate[SUP]1[/SUP]Rate Ratio[SUP]2,3[/SUP]Rate[SUP]1[/SUP]Rate Ratio[SUP]2,3[/SUP]Rate[SUP]1[/SUP]Rate Ratio[SUP]2,3[/SUP]Rate[SUP]1[/SUP]Rate Ratio[SUP]2,3[/SUP]
0—17 years11.73.419.25.625.57.56.61.93.41
18—49 years269.27.8198.25.7285.28.257.01.634.71
50—64 years654.06.1553.35.2610.45.7170.31.6107.21
65+ years719.22.41091.03.7807.22.7327.91.1298.21
Overall rate[SUP]4[/SUP] (age-adjusted)356.24.5362.64.5367.44.6107.41.380.01

[TD="colspan: 2"] Non-Hispanic
American Indian or Alaska Native
[/TD]
[TD="colspan: 2"] Non-Hispanic Black [/TD]
[TD="colspan: 2"] Hispanic or Latino [/TD]
[TD="colspan: 2"] Non-Hispanic Asian or Pacific Islander [/TD]
[TD="colspan: 2"] Non-Hispanic White [/TD]
[SUP]1[/SUP] COVID-19-associated hospitalization rates by race and ethnicity are calculated using COVID-NET hospitalizations with known race and ethnicity for the numerator and NCHS bridged-race population estimates for the denominator.
[SUP]2[/SUP] For each age category, rate ratios are the ratios between crude hospitalization rates within each racial and ethnic group and the crude hospitalization rate among non-Hispanic white persons in the same age category.
[SUP]3[/SUP] The highest rate ratio in each age category is presented in bold.
[SUP]4[/SUP] Overall rates are adjusted to account for differences in age distributions within race and ethnicity strata in the COVID-NET catchment area; the age strata used for the adjustment include 0–17, 18–49, 50–64, and 65+ years.

Non-Hispanic Black persons and non-Hispanic White persons represented the highest proportions of hospitalizations reported to COVID-NET, followed by Hispanic or Latino, non-Hispanic Asian or Pacific Islander, and non-Hispanic American Indian or Alaska Native persons. However, some racial and ethnic groups are disproportionately represented among hospitalizations as compared with the overall population of the catchment area. Prevalence ratios were highest among non-Hispanic American Indian or Alaska Native persons, followed by non-Hispanic Black persons and Hispanic or Latino persons.
1.3%32.8%23.1%5.1%32.1%
0.7%17.9%14.1%8.9%58.5%
1.91.81.60.60.5
[SUP]1[/SUP] Persons of multiple races (0.3%) or unknown race and ethnicity (5.3%) are not represented in the table but are included as part of the denominator.
[SUP]2[/SUP] Prevalence ratio is calculated as the ratio of the proportion of COVID-NET hospitalizations over the proportion of population in COVID-NET catchment area.

For underlying medical conditions, data were restricted to cases reported during March 1–May 31, 2020, due to delays in reporting. During this time frame, sampling was conducted among hospitalized adults; therefore, weighted percentages are reported. Among 7,865 sampled adults hospitalized during March 1–May 31, 2020, 90.9% reported at least one underlying medical condition. The most commonly reported were hypertension, obesity, metabolic disease, and cardiovascular disease. No sampling was conducted among hospitalized children. Among 243 children hospitalized during March 1–May 31, 2020, 52.7% reported at least one underlying medical condition. The most commonly reported underlying medical conditions were obesity, asthma, and neurologic disease.
lab-confirmed-hospitalizations-underlying.gif

resize iconView Larger


Additional data on demographics, signs and symptoms at admission, underlying conditions, interventions, outcomes and discharge diagnoses, stratified by age, sex and race and ethnicity, are available.

Additional hospitalization surveillance information: Surveillance Methods | Additional rate data | Additional demographic and clinical data


Mortality Surveillance


The National Center for Health Statistics (NCHS) collects death certificate data from vital statistics offices for all deaths occurring in the United States. Based on death certificate data available on October 1, 2020, the percentage of deaths attributed to pneumonia, influenza, or COVID-19 (PIC) for week 39 is 6.4% and, while lower than the percentage during week 38 (9.5%), remains above the epidemic threshold. Percentages for recent weeks will likely increase as more death certificates are processed.

Weekly mortality surveillance data include a combination of machine coded and manually coded causes of death collected from death certificates. Percentages of deaths due to PIC are higher among manually coded records than more rapidly available machine coded records. Due to the additional time needed for manual coding, the initially reported PIC percentages may be lower than percentages calculated from final data.
nchs-mortality-report.gif

resize iconView Larger


*Data during recent weeks are incomplete because of the lag in time between when the death occurred and when the death certificate is completed, submitted to NCHS and processed for reporting purposes.
View Data Table


Additional NCHS mortality surveillance information: Surveillance Methods | Provisional Death Counts for COVID-19
More Information
View Page In:pdf icon 13 Pages, 1 MB
Last Updated Oct. 2, 2020
Content source: National Center for Immunization and Respiratory Diseases (NCIRD), Division of Viral DiseaseshomeCases, Data & Surveillance
https://www.cdc.gov/coronavirus/2019-ncov/covid-data/covidview/past-reports/10022020.html
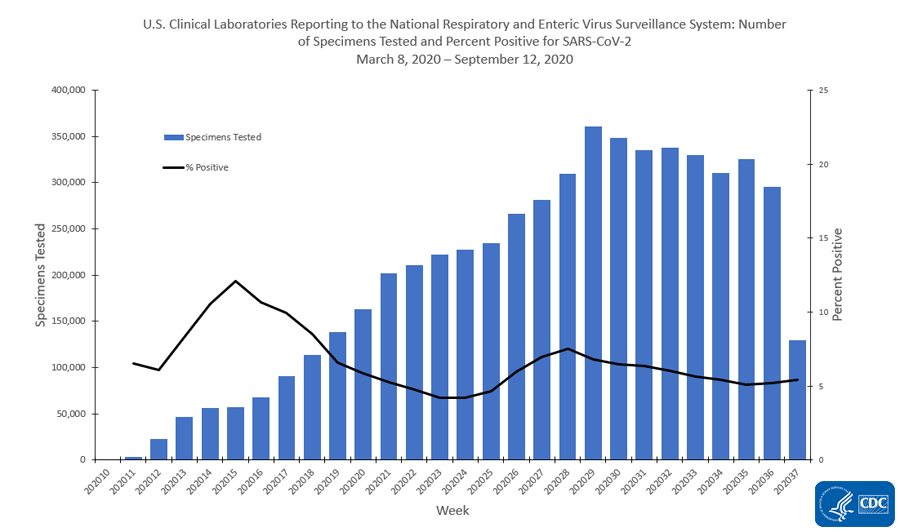
 
  1. CASES, DATA & SURVEILLANCE
COVIDView: A Weekly Surveillance Summary of U.S. COVID-19 Activity


Updated Oct. 9, 2020
Print
Download Weekly Summary pdf icon[846 KB, 10 pages]
Key Updates for Week 40, ending October 3, 2020


Nationally, indicators that track COVID-19 activity continued to decline or remain stable (change of ≤0.1%). However, one region reported a slight increase in the percentage of specimens testing positive for SARS-CoV-2 and four regions reported slight increases in the percentage of visits for influenza-like illness (ILI). Mortality attributed to COVID-19 declined but remains above the epidemic threshold.

national-activity-indicators.gif

Download Chart Data excel icon[XLS – 2 KB]
Virus: Public Health, Commercial and Clinical Laboratories


Nationally, the percentage of respiratory specimens testing positive for SARS-CoV-2, the virus causing COVID-19, decreased from 5.2% during week 39 to 4.9% during week 40. Percent positivity increased slightly among those aged 5-17 years and those 65 years and older; percent positivity in the other age groups remained stable or declined. Regionally, the percentage of respiratory specimens testing positive for SARS-CoV-2 increased slightly in Region 4 (Southeast) and remained stable or decreased in the remaining nine regions.
Mild/Moderate Illness: Outpatient and Emergency Department Visits


Nationally, the overall percentage of visits to outpatient providers or emergency departments (EDs) for ILI or CLI remained stable (change or ≤0.1%) from week 39 to week 40; however, the percentage of visits for ILI to ILINet providers increased in those 50-64 years while remaining stable among the other age groups. Compared to week 39, the percentage of visits to EDs for ILI or CLI remained stable or declined in all ten regions. However, three regions reported slight increases in the percentage of visits for ILI to ILINet providers.
Severe Disease: Hospitalizations and Deaths


The weekly COVID-19-associated hospitalization rate reported through COVID-NET has remained steady among all age groups in recent weeks. Based on death certificate data, the percentage of deaths attributed to pneumonia, influenza, or COVID-19 (PIC) for week 40 is 7.0% and, while declining, remains above the epidemic threshold. Hospitalization and mortality data for the most recent weeks may change as additional data are reported.

All data are preliminary and may change as more reports are received. A description of the surveillance systems summarized in COVIDView, including methodology and detailed descriptions of each data component, is available on the surveillance methods page.
Key Points
  • Nationally, the percentage of deaths due to pneumonia, influenza, or COVID-19 (PIC) has continued to decline since early September; other COVID-19 activity indicators included in this report (the percentage of specimens testing positive for SARS-CoV-2, the percentage of visits to EDs or outpatient providers for ILI and CLI, and COVID-19-associated hospitalization rates) have remained stable during this same period. In contrast, there was a decreasing trend in all these COVID-19 indicators from mid-July through August.
  • Peak COVID-19 activity and trends have varied regionally with three general patterns:
    1. The Northeast (Region 1), New Jersey/New York/Puerto Rico (Region 2), the Mid-Atlantic (Region 3) and the Midwest (Region 5) regions, reported the highest levels of COVID-19 activity in April. Activity declined through June and July and remained stable until recent weeks when some indicators have shown slight increases.
    2. The Central (Region 7), Mountain (Region 8) and Pacific Northwest (Region 10) regions also reported the highest levels of COVID-19 activity in April. After several weeks of decline, these regions reported increases in activity during the summer but relatively stable activity recently. The exception is the Pacific Northwest which reported some recent increases in activity.
    3. The Southeast (Region 4), South Central (Region 6) and the South/West Coast (Region 9) regions experienced a different pattern of COVID-19 activity with the highest levels occurring in July. Activity has declined since the July peak and has been primarily stable for the past several weeks; however, during the most recent weeks, some indicators are showing a slight increase.
  • The overall cumulative COVID-19-associated hospitalization rate through the week ending October 3, 2020 was 183.2 per 100,000 population.
    • Following an initial decline of hospitalization rates between the weeks ending July 25 (MMWR week 30) and August 22 (MMWR week 34), weekly hospitalization rates have remained steady among all age groups. Data for the most recent weeks may change as additional admissions occurring during those weeks are reported.
    • The age-adjusted hospitalization rate for Hispanic or Latino persons was approximately 4.6 times that of non-Hispanic White persons. Age-adjusted hospitalization rates for both non-Hispanic Black persons and non-Hispanic American Indian or Alaska Native persons were approximately 4.5 times that of non-Hispanic White persons.
  • All surveillance systems aim to provide the most complete data available. Estimates from previous weeks are subject to change as data are updated with the most complete data available.
U.S. Virologic Surveillance


Based on data reported to CDC by public health laboratories and a subset of clinical and commercial laboratories in the United States, 56,235,035 specimens have been tested for SARS-CoV-2 using a molecular assay since March 1, 2020. The percentage of specimens testing positive for SARS-CoV-2 each week, based on week of specimen collection, are summarized below.

Nationally, during week 40, 2,014,912 specimens were tested for SARS-CoV-2 for diagnostic purposes and 98,338 (4.9%) were positive. This is decreased compared with week 39, during which 5.2% of specimens tested were positive. The percentage of specimens testing positive increased slightly in those aged 5-17 years and those 65 years and older while remaining stable or decreasing in all other age groups.

combined-lab.gif


*The different laboratory types came on board with testing during different weeks. This graph includes public health laboratory data beginning in week 10, clinical laboratory data beginning in week 11 and commercial laboratory data beginning in week 14.
View Data Table


Despite the overall national decline in percent positivity, the percentage of specimens testing positive increased in Region 4 (Southeast). This increase was reported among those 5-17 years, 50-64 years and 65 years and older. The highest percentage of specimens testing positive for SARS-CoV-2 were seen in Regions 4 (Southeast, 6.7%), 6 (South Central, 7.7%), 7 (Central, 9.0%) and 8 (Mountain, 7.2%) and is decreasing in the latter three regions.

Additional virologic surveillance information: Surveillance Methods


Outpatient/Emergency Department Illness


Two syndromic surveillance systems, the U.S. Outpatient Influenza-like Illness Surveillance Network (ILINet) and the National Syndromic Surveillance Project (NSSP), are being used to monitor trends in outpatient and emergency department (ED) visits that may be associated with COVID-19 illness. Each system monitors activity in a slightly different set of providers/facilities. ILINet provides information about visits to outpatient providers or emergency departments for influenza-like illness (ILI; fever plus cough and/or sore throat) and NSSP provides information about visits to EDs for ILI and COVID-like illness (CLI; fever plus cough and/or shortness of breath or difficulty breathing). Some EDs contribute ILI data to both ILINet and NSSP. Both systems are currently being affected by changes in health care seeking behavior, including increased use of telemedicine, and increased social distancing. These changes affect the numbers of people seeking care in the outpatient and ED settings and their reasons for doing so.

Nationally, the overall percentage of visits to outpatient providers or EDs for ILI or CLI remained stable (change of ≤0.1%) from week 39 to week 40, with 2.0% and 0.9% of ED visits captured in NSSP being for CLI and ILI, respectively and 1.1% of visits reported through ILINet being for ILI. The percentage of ILI visits to ILINet providers remains below the national baseline (2.4% October 2019 through September 2020; 2.6% since October 2020) for the 24[SUP]th[/SUP] consecutive week and is at levels that are typical for this time of year.
ilinet-nssp.gif

resize iconView LargerView Data Table


Compared with week 39, the percentage of ILI visits to ILINet providers increased in those 50-64 years while remaining stable (change of ≤0.1%) among other age groups.

resize iconView LargerView Data Table


On a regional levelexternal icon, the percentage of visits to EDs for ILI or CLI remained stable (change of ≤0.1%) from week 39 to week 40 in all ten regions. The percentage of visits for ILI to ILINet providers increased slightly from week 39 to week 40 in four regions (Regions 2 [New Jersey/New York/Puerto Rico], 6 [South Central], 9 [South/West Coast] and 10 [Pacific Northwest]) but remained below the region-specific baseline in all 10 regions. When compared to the percentage of visits to EDs or outpatient providers two weeks ago, an additional five regions (Regions 1 [New England], 3 [Mid-Atlantic], 4 [Southeast], 7 [Central] and 8 [Mountain]) reported an increase in the percentage of visits for CLI or ILI during week 40.
ILI Activity Levels


Data collected in ILINet are used to produce a measure of ILI activity for all 50 states, Puerto Rico, the U.S. Virgin Islands, the District of Columbia, and New York City and for each core-based statistical area (CBSA) where at least one provider is located. The mean reported percentage of visits due to ILI for the current week is compared with the mean reported during non-influenza weeks, and the activity levels correspond to the number of standard deviations below, at, or above the mean.

The number of jurisdictions at each activity level during week 40 and the previous week are summarized in the table below.
Activity Level
Week 40
(Week ending
Oct. 3, 2020)
Week 39
(Week ending
September 26, 2020)
Week 40
(Week ending
Oct. 3, 2020)
Week 39
(Week ending
September 26, 2020)
Very High0000
High0112
Moderate0143
Low101420
Minimal5249569523
Insufficient Data13341381

[TD="colspan: 2"] Number of Jurisdictions [/TD]
[TD="colspan: 2"] Number of CBSAs [/TD]

*Data collected in ILINet may disproportionally represent certain populations within a state and may not accurately depict the full picture of influenza activity for the whole state. Differences in the data presented here by CDC and independently by some state health departments likely represent differing levels of data completeness with data presented by the state likely being the more complete.

Additional information about medically attended outpatient and emergency department visits for ILI and CLI: Surveillance Methods

Hospitalizations


The COVID-19-Associated Hospitalization Surveillance Network (COVID-NET) conducts population-based surveillance for laboratory-confirmed COVID-19-associated hospitalizations in select counties participating in the Emerging Infections Program (EIP) and the Influenza Hospitalization Surveillance Project (IHSP).

A total of 59,728 laboratory-confirmed COVID-19-associated hospitalizations were reported by sites between March 1, 2020 and October 3, 2020. The overall cumulative hospitalization rate was 183.2 per 100,000 population.

Overall weekly hospitalization rates among all ages first peaked during the week ending April 18 (MMWR week 16), followed by a second peak during the week ending July 18 (MMWR week 29). Following an initial decline in hospitalization rates between the weeks ending July 25 (MMWR week 30) and August 22 (MMWR week 34), weekly hospitalization rates have remained steady for all age groups. Data for the most recent weeks may change as additional admissions occurring during those weeks are reported.
lab-confirmed-hospitalizations-weekly.png

resize iconView Larger
Among the 59,728 laboratory-confirmed COVID-19-associated hospitalizations, 56,327 (94.3%) had information on race and ethnicity, while collection of race and ethnicity was still pending for 3,401 (5.7%) cases. When examining overall age-adjusted rates by race and ethnicity, the rate for Hispanic or Latino persons was approximately 4.6 times the rate among non-Hispanic White persons. Rates for both non-Hispanic Black persons and non-Hispanic American Indian or Alaska Native persons were approximately 4.5 times the rate among non-Hispanic White persons.


When examining age-stratified crude hospitalization rates by race and ethnicity, compared with non-Hispanic White persons in the same age group, crude hospitalization rates were 7.3 times higher among Hispanic or Latino persons aged 0–17 years; 8.2 times higher among Hispanic or Latino persons aged 18–49 years; 6.1 times higher among non-Hispanic American Indian or Alaska Native persons aged 50–64 years; and 3.6 times higher among non-Hispanic Black persons aged ≥65 years.

Age Category
Rate[SUP]1[/SUP]Rate Ratio[SUP]2,3[/SUP]Rate[SUP]1[/SUP]Rate Ratio[SUP]2,3[/SUP]Rate[SUP]1[/SUP]Rate Ratio[SUP]2,3[/SUP]Rate[SUP]1[/SUP]Rate Ratio[SUP]2,3[/SUP]Rate[SUP]1[/SUP]Rate Ratio[SUP]2,3[/SUP]
0—17 years11.73.319.45.426.17.37.01.93.61
18—49 years276.17.8200.95.6290.68.258.81.735.61
50—64 years677.96.1561.05.1623.95.6175.01.6110.61
65+ years740.22.41104.93.6826.32.7338.11.1305.71
Overall rate[SUP]4[/SUP] (age-adjusted)366.84.5367.44.5375.44.6110.61.382.21

[TD="colspan: 2"] Non-Hispanic
American Indian or Alaska Native
[/TD]
[TD="colspan: 2"] Non-Hispanic Black [/TD]
[TD="colspan: 2"] Hispanic or Latino [/TD]
[TD="colspan: 2"] Non-Hispanic Asian or Pacific Islander [/TD]
[TD="colspan: 2"] Non-Hispanic White [/TD]
[SUP]1[/SUP] COVID-19-associated hospitalization rates by race and ethnicity are calculated using COVID-NET hospitalizations with known race and ethnicity for the numerator and NCHS bridged-race population estimates for the denominator.
[SUP]2[/SUP] For each age category, rate ratios are the ratios between crude hospitalization rates within each racial and ethnic group and the crude hospitalization rate among non-Hispanic White persons in the same age category.
[SUP]3[/SUP] The highest rate ratio in each age category is presented in bold.
[SUP]4 [/SUP]Overall rates are adjusted to account for differences in age distributions within race and ethnicity strata in the COVID-NET catchment area; the age strata used for the adjustment include 0–17, 18–49, 50–64, and 65+ years.

Non-Hispanic Black persons and non-Hispanic White persons represented the highest proportions of hospitalizations reported to COVID-NET, followed by Hispanic or Latino, non-Hispanic Asian or Pacific Islander, and non-Hispanic American Indian or Alaska Native persons. However, some racial and ethnic groups are disproportionately represented among hospitalizations as compared with the overall population of the catchment area. Prevalence ratios were highest among non-Hispanic American Indian or Alaska Native persons, followed by non-Hispanic Black persons and Hispanic or Latino persons.
1.3%32.6%23.1%5.2%32.3%
0.7%17.9%14.1%8.9%58.5%
1.91.81.60.60.6
[SUP]1[/SUP] Persons of multiple races (0.3%) or unknown race and ethnicity (5.1%) are not represented in the table but are included as part of the denominator.
[SUP]2[/SUP] Prevalence ratio is calculated as the ratio of the proportion of COVID-NET hospitalizations over the proportion of population in COVID-NET catchment area.

For underlying medical conditions, data were restricted to cases reported during March 1–May 31, 2020, due to delays in reporting. During this time frame, sampling was conducted among hospitalized adults; therefore, weighted percentages are reported. No sampling was conducted among hospitalized children. Among 7,897 sampled adults hospitalized during March 1–May 31 with information on underlying medical conditions, 91.0% reported at least one underlying medical condition. The most reported underlying medical conditions were hypertension, obesity, metabolic disease, and cardiovascular disease. Among 247 children hospitalized during March 1–May 31 with information on underlying conditions, 53.0% reported at least one underlying medical condition. The most reported underlying medical conditions were obesity, asthma, and neurologic disease.

Additional data on demographics, signs and symptoms at admission, underlying conditions, interventions, outcomes and discharge diagnoses, stratified by age, sex and race and ethnicity, are available.

Additional hospitalization surveillance information: Surveillance Methods | Additional rate data | Additional demographic and clinical data


Mortality Surveillance


The National Center for Health Statistics (NCHS) collects death certificate data from vital statistics offices for all deaths occurring in the United States. Based on death certificate data available on October 8, 2020, the percentage of deaths attributed to pneumonia, influenza, or COVID-19 (PIC) for week 40 is 7.0% and, while lower than the percentage during week 39 (9.7%), remains above the epidemic threshold. Percentages for recent weeks will likely increase as more death certificates are processed.

Weekly mortality surveillance data include a combination of machine coded and manually coded causes of death collected from death certificates. Percentages of deaths due to PIC are higher among manually coded records than more rapidly available machine coded records. Due to the additional time needed for manual coding, the initially reported PIC percentages may be lower than percentages calculated from final data.
nchs-mortality-report.gif

resize iconView Larger


*Data during recent weeks are incomplete because of the lag in time between when the death occurred and when the death certificate is completed, submitted to NCHS and processed for reporting purposes. It is possible that a death certificate includes both influenza and COVID as a cause of death therefore, the number of influenza and COVID coded deaths may not be mutually exclusive.
View Data Table


Additional NCHS mortality surveillance information: Surveillance Methods | Provisional Death Counts for COVID-19
More Information
View Page In:pdf icon 846 KB, 10 pages
Last Updated Oct. 9, 2020
Content source: National Center for Immunization and Respiratory Diseases (NCIRD), Division of Viral DiseaseshomeCases, Data & Surveillance
https://www.cdc.gov/coronavirus/2019-ncov/covid-data/covidview/
 
  1. CASES, DATA & SURVEILLANCE
COVIDView: A Weekly Surveillance Summary of U.S. COVID-19 Activity


Updated Oct. 16, 2020


Download Weekly Summary pdf icon[907 KB, 10 pages]

Key Updates for Week 41, ending October 10, 2020


Nationally, the percentage of specimens testing positive for SARS-CoV-2 and the percentage of visits to emergency departments (ED) or outpatient providers for COVID-like illness (CLI) and influenza-like illness (ILI) have increased slightly in recent weeks. COVID-19 related hospitalizations and mortality attributed to COVID-19 remained stable or declined but this may change as more data are received.

national-activity-indicators.gif

Download Chart Data excel icon[XLS – 2 KB]
Virus: Public Health, Commercial and Clinical Laboratories


Nationally, the overall percentage of respiratory specimens testing positive for SARS-CoV-2, the virus causing COVID-19, increased from 5.3% during week 40 to 5.4% during week 41. Percent positivity decreased slightly among those 18-49 years but increased among the other age groups. Regionally, the percentages of respiratory specimens testing positive for SARS-CoV-2 increased in Regions 5 (Midwest), 6 (South Central), 7 (Central) and 10 (Pacific Northwest) and decreased in the remaining six regions.
Mild/Moderate Illness: Outpatient and Emergency Department Visits


Nationally, the overall percentage of visits to outpatient providers or emergency departments (EDs) for ILI or CLI has been increasing slowly since mid-September. In ILINet, this increase can be seen among all age groups. The percentages of visits to EDs for ILI or CLI have increased in all ten regions in recent weeks. Seven regions have reported increases in the percentages of visits for ILI to ILINet providers in recent weeks; the percentages have remained stable in the remaining three regions.
Severe Disease: Hospitalizations and Deaths


Nationally, weekly COVID-19-associated hospitalization rates reported through COVID-NET have remained steady for all age groups in recent weeks; however, rates have increased in 7 of 14 COVID-NET sites during this time period. Based on death certificate data, the percentage of deaths attributed to pneumonia, influenza, or COVID-19 (PIC) for week 41 was 7.2% and, while declining, remains above the epidemic threshold. Hospitalization and mortality data for the most recent weeks may change as additional data are reported.

All data are preliminary and may change as more reports are received. A description of the surveillance systems summarized in COVIDView, including methodology and detailed descriptions of each data component, is available on the surveillance methods page.
Key Points
  • Nationally, the percentage of deaths due to pneumonia, influenza, or COVID-19 (PIC) have continued to decline since early September; other COVID-19 activity indicators included in this report (the percentage of specimens testing positive for SARS-CoV-2, the percentages of visits to EDs or outpatient providers for ILI and CLI, and COVID-19-associated hospitalization rates) have increased or remained stable in recent weeks.
  • At least one indicator used to monitor COVID-19 activity is increasing in all ten HHS regions and many regions are reporting increases in multiple indicators.
    • The percentages of specimens testing positive for SARS-CoV-2 increased in four regions.
    • The percentages of visits for ILI, CLI or both increased in all ten regions.
    • For some indicators and regions, the increases have been small from week to week but have continued over several weeks while other indicators have increased more sharply in some regions.
  • The overall cumulative COVID-19-associated hospitalization rate through the week ending October 10, 2020 was 188.2 per 100,000 population.
    • Following an initial decline in hospitalization rates between the weeks ending July 25 (MMWR week 30) and August 22 (MMWR week 34), weekly hospitalization rates for all sites combined have remained steady for all age groups. However, since the week ending September 19 (MMWR Week 38), overall weekly hospitalization rates have increased in 7 of 14 COVID-NET sites. Data for the most recent weeks may change as additional admissions occurring during those weeks are reported.
    • The age-adjusted hospitalization rate for Hispanic or Latino persons was approximately 4.5 times that of non-Hispanic White persons. Age-adjusted hospitalization rates for both non-Hispanic Black persons and non-Hispanic American Indian or Alaska Native persons were approximately 4.4 times those of non-Hispanic White persons.
  • All surveillance systems aim to provide the most complete data available. Estimates from previous weeks are subject to change as data are updated with the most complete data available.
U.S. Virologic Surveillance


Based on data reported to CDC by public health laboratories and a subset of clinical and commercial laboratories in the United States, 61,120,152 specimens have been tested for SARS-CoV-2 using a molecular assay since March 1, 2020. The percentages of specimens testing positive for SARS-CoV-2 each week, based on week of specimen collection, are summarized below.

Nationally, during week 41, 2,632,222 specimens were tested for SARS-CoV-2 for diagnostic purposes and 141,317 (5.4%) were positive. This is slightly increased compared with week 40, during which 5.3% of specimens tested were positive. The percentages of specimens testing positive increased slightly in those 0–4 years, 5–17 years, 50-64 years and 65 years and older while remaining stable in those 18–49 years.

specimens-tested.gif


*The different laboratory types came on board with testing during different weeks. This graph includes public health laboratory data beginning in week 10, clinical laboratory data beginning in week 11 and commercial laboratory data beginning in week 14.
View Data Table


The national increase in percent positivity was driven by increases in Regions 5 (Midwest), 6 (South Central), 7 (Central) and 10 (Pacific Northwest). The increase was reported among all age groups in Regions 6, 7, and 10 and among those 5 years of age and older in Region 5. The highest percentages of specimens testing positive for SARS-CoV-2 were seen in Regions 4 (Southeast, 6.5%), 6 (South Central, 8.0%), 7 (Central, 10.1%) and 8 (Mountain, 7.0%).

Additional virologic surveillance information: Surveillance Methods


Outpatient/Emergency Department Illness


Two syndromic surveillance systems, the U.S. Outpatient Influenza-like Illness Surveillance Network (ILINet) and the National Syndromic Surveillance Project (NSSP), are being used to monitor trends in outpatient and emergency department (ED) visits that may be associated with COVID-19 illness. Each system monitors activity in a slightly different set of providers/facilities. ILINet provides information about visits to outpatient providers or emergency departments for influenza-like illness (ILI; fever plus cough and/or sore throat) and NSSP provides information about visits to EDs for ILI and COVID-like illness (CLI; fever plus cough and/or shortness of breath or difficulty breathing). Some EDs contribute ILI data to both ILINet and NSSP. Both systems are currently being affected by changes in health care seeking behavior, including increased use of telemedicine and increased social distancing. These changes affect the numbers of people seeking care in the outpatient and ED settings and their reasons for doing so.

Nationally, the overall percentage of visits to outpatient providers or EDs for ILI or CLI has been increasing since mid-September, with 2.5% and 1.1% of ED visits captured in NSSP being for CLI and ILI, respectively, and 1.2% of visits reported through ILINet being for ILI. The percentage of ILI visits to ILINet providers remains below the national baseline (2.4% October 2019 through September 2020; 2.6% since October 2020) for the 25[SUP]th[/SUP] consecutive week and is at levels that are typical for this time of year.
outpatient-emergency-visits.gif

resize iconView LargerView Data Table


The increase in percentage of ILI visits to ILINet providers in recent weeks has been reported among all age groups.

resize iconView LargerView Data Table


On a regional levelexternal icon, the percentages of visits to EDs for ILI or CLI have been increasing in recent weeks in all ten regions. The largest increases during week 41 compared with week 40 were for CLI in Regions 5 (Midwest, 0.4%) and 8 (Mountain, 0.6%). The percentage of visits for ILI to ILINet providers have been increasing in recent weeks in seven regions (Regions 1 [New England], 2 [New Jersey/New York/Puerto Rico], 3 [Mid-Atlantic], 4 [Southeast], 7 [Central], 8 [Mountain], and 9 [South/West Coast] and stable in Regions 5 (Midwest), 6 (South Central) and 10 (Pacific Northwest). The percentage remained below the region-specific baseline in all 10 regions.
ILI Activity Levels


Data collected in ILINet are used to produce a measure of ILI activity for all 50 states, Puerto Rico, the U.S. Virgin Islands, the District of Columbia, and New York City and for each core-based statistical area (CBSA) where at least one provider is located. The mean reported percentage of visits due to ILI for the current week is compared with the mean reported during non-influenza weeks, and the activity levels correspond to the number of standard deviations below, at, or above the mean.

The number of jurisdictions at each activity level during week 41 and the previous week are summarized in the table below.
Activity Level
Week 41
(Week ending
Oct. 10, 2020)
Week 40
(Week ending
Oct. 3, 2020)
Week 41
(Week ending
Oct. 10, 2020)
Week 40 (Week ending
Oct. 3, 2020)
Very High0000
High0032
Moderate2054
Low013016
Minimal5052534577
Insufficient Data21357330

[TD="colspan: 2"] Number of Jurisdictions [/TD]
[TD="colspan: 2"] Number of CBSAs [/TD]
*Data collected in ILINet may disproportionally represent certain populations within a state and may not accurately depict the full picture of influenza activity for the whole state. Differences in the data presented here by CDC and independently by some state health departments likely represent differing levels of data completeness with data presented by the state likely being the more complete.

Additional information about medically attended outpatient and emergency department visits for ILI and CLI: Surveillance Methods

Hospitalizations


The COVID-19-Associated Hospitalization Surveillance Network (COVID-NET) conducts population-based surveillance for laboratory-confirmed COVID-19-associated hospitalizations in select counties participating in the Emerging Infections Program (EIP) and the Influenza Hospitalization Surveillance Project (IHSP).

A total of 61,364 laboratory-confirmed COVID-19-associated hospitalizations were reported by sites between March 1, 2020 and October 10, 2020. The overall cumulative hospitalization rate was 188.2 per 100,000 population.

Overall weekly hospitalization rates among all ages combined first peaked during the week ending April 18 (MMWR week 16), followed by a second peak during the week ending July 18 (MMWR week 29). Following an initial decline in hospitalization rates between the weeks ending July 25 (MMWR week 30) and August 22 (MMWR week 34), weekly hospitalization rates among all sites combined remained steady for each age group. However, since the week ending September 19 (MMWR Week 38), overall weekly hospitalization rates have increased in 7 of 14 COVID-NET sites (Colorado, Michigan, Minnesota, New Mexico, Oregon, Tennessee and Utah). Data for the most recent weeks may change as additional admissions occurring during those weeks are reported.
lab-confirmed-hospitalizations-weekly.gif

resize iconView Larger
Among the 61,364 laboratory-confirmed COVID-19-associated hospitalizations, 58,134 (94.7%) had information on race and ethnicity, while collection of race and ethnicity was still pending for 3,230 (5.3%) cases. When examining overall age-adjusted rates by race and ethnicity, the rate for Hispanic or Latino persons was approximately 4.5 times the rate among non-Hispanic White persons. Rates for both non-Hispanic American Indian or Alaska Native persons and non-Hispanic Black persons were approximately 4.4 times the rate among non-Hispanic White persons.


When examining age-stratified crude hospitalization rates by race and ethnicity, compared with non-Hispanic White persons in the same age group, crude hospitalization rates were 7.1 times higher among Hispanic or Latino persons aged 0–17 years; 8.0 times higher among Hispanic or Latino persons aged 18–49 years; 6.0 times higher among non-Hispanic American Indian or Alaska Native persons aged 50–64 years; and 3.5 times higher among non-Hispanic Black persons aged ≥65 years.
Age Category
Rate[SUP]1[/SUP]Rate Ratio[SUP]2,3[/SUP]Rate[SUP]1[/SUP]Rate Ratio[SUP]2,3[/SUP]Rate[SUP]1[/SUP]Rate Ratio[SUP]2,3[/SUP]Rate[SUP]1[/SUP]Rate Ratio[SUP]2,3[/SUP]Rate[SUP]1[/SUP]Rate Ratio[SUP]2,3[/SUP]
0—17 years11.73.119.95.227.17.18.12.13.81
18—49 years284.87.6205.85.5299.08.060.71.637.41
50—64 years688.66.0575.55.0643.15.6177.91.5115.31
65+ years769.72.41130.73.5850.32.7348.21.1319.51
Overall rate[SUP]4[/SUP] (age-adjusted)376.94.4376.34.4386.64.5113.81.385.91

[TD="colspan: 2"] Non-Hispanic
American Indian or Alaska Native
[/TD]
[TD="colspan: 2"] Non-Hispanic Black [/TD]
[TD="colspan: 2"] Hispanic or Latino [/TD]
[TD="colspan: 2"] Non-Hispanic Asian or Pacific Islander [/TD]
[TD="colspan: 2"] Non-Hispanic White [/TD]
[SUP]1[/SUP] COVID-19-associated hospitalization rates by race and ethnicity are calculated using COVID-NET hospitalizations with known race and ethnicity for the numerator and NCHS bridged-race population estimates for the denominator.
[SUP]2[/SUP] For each age category, rate ratios are the ratios between crude hospitalization rates within each racial and ethnic group and the crude hospitalization rate among non-Hispanic White persons in the same age category.
[SUP]3[/SUP] The highest rate ratio in each age category is presented in bold.
[SUP]4 [/SUP]Overall rates are adjusted to account for differences in age distributions within race and ethnicity strata in the COVID-NET catchment area; the age strata used for the adjustment include 0–17, 18–49, 50–64, and 65+ years.

Non-Hispanic Black persons and non-Hispanic White persons represented the highest proportions of hospitalizations reported to COVID-NET, followed by Hispanic or Latino, non-Hispanic Asian or Pacific Islander, and non-Hispanic American Indian or Alaska Native persons. However, some racial and ethnic groups are disproportionately represented among hospitalized cases as compared with the overall population of the catchment area. Prevalence ratios were highest among non-Hispanic American Indian or Alaska Native persons, followed by non-Hispanic Black persons and Hispanic or Latino persons.
1.3%32.4%23.1%5.2%32.7%
0.7%17.9%14.1%8.9%58.5%
1.91.81.60.60.6
[SUP]1[/SUP] Persons of multiple races (0.3%) or unknown race and ethnicity (5.0%) are not represented in the table but are included as part of the denominator.
[SUP]2[/SUP] Prevalence ratio is calculated as the ratio of the proportion of COVID-NET hospitalizations over the proportion of population in COVID-NET catchment area.

For underlying medical conditions, data were restricted to cases reported during March 1–May 31, 2020, due to delays in reporting. During this time frame, sampling was conducted among hospitalized adults; therefore, weighted percentages are reported. No sampling was conducted among hospitalized children. Among 7,989 sampled adults hospitalized during March 1–May 31 with information on underlying medical conditions, 90.8% reported at least one underlying medical condition. The most reported underlying medical conditions were hypertension, obesity, metabolic disease, and cardiovascular disease. Among 248 children hospitalized during March 1–May 31 with information on underlying conditions, 50.8% reported at least one underlying medical condition. The most reported underlying medical conditions were obesity, asthma, and neurologic disease.

Additional data on demographics, signs and symptoms at admission, underlying conditions, interventions, outcomes and discharge diagnoses, stratified by age, sex and race and ethnicity, are available.

Additional hospitalization surveillance information: Surveillance Methods | Additional rate data | Additional demographic and clinical data


Mortality Surveillance


The National Center for Health Statistics (NCHS) collects death certificate data from vital statistics offices for all deaths occurring in the United States. Based on death certificate data available on October 15, 2020, the percentage of deaths attributed to pneumonia, influenza, or COVID-19 (PIC) for week 41 was 7.2% and, while lower than the percentage during week 40 (9.7%), remains above the epidemic threshold. Percentages for recent weeks will likely increase as more death certificates are processed.

Weekly mortality surveillance data include a combination of machine coded and manually coded causes of death collected from death certificates. The percentage of deaths due to PIC is higher among manually coded records than more rapidly available machine coded records. Due to the additional time needed for manual coding, the initially reported PIC percentages may be lower than percentages calculated from final data.
nchs-mortality-report.gif

resize iconView Larger


*Data during recent weeks are incomplete because of the lag in time between when the death occurred and when the death certificate is completed, submitted to NCHS and processed for reporting purposes. It is possible that a death certificate includes both influenza and COVID as a cause of death therefore, the number of influenza and COVID coded deaths may not be mutually exclusive.
View Data Table


Additional NCHS mortality surveillance information: Surveillance Methods | Provisional Death Counts for COVID-19
More Information
View Page In:pdf icon 907 KB, 10 pages
Last Updated Oct. 16, 2020
Content source: National Center for Immunization and Respiratory Diseases (NCIRD), Division of Viral DiseaseshomeCases, Data & Surveillance
https://www.cdc.gov/coronavirus/2019...iew/index.html
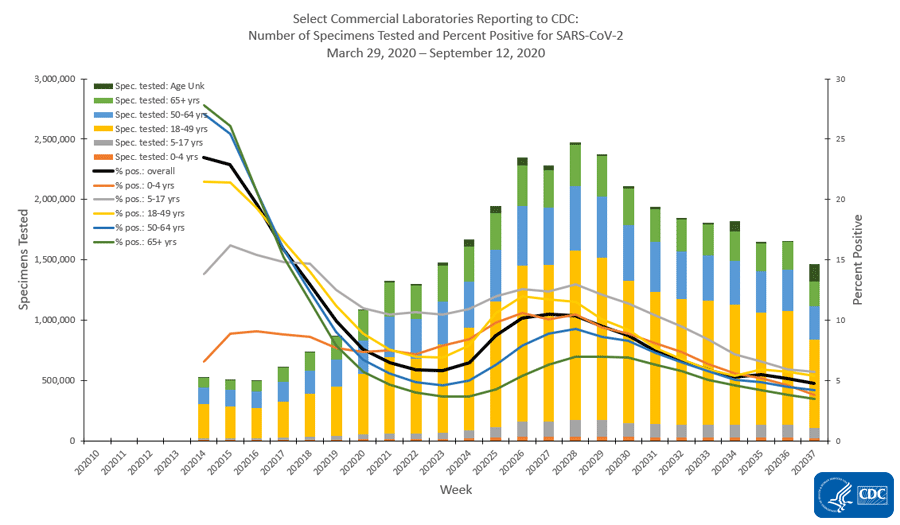
 
  1. CASES, DATA & SURVEILLANCE
COVIDView: A Weekly Surveillance Summary of U.S. COVID-19 Activity


Updated Oct. 23, 2020


Download Weekly Summary pdf icon[907 KB, 10 pages]

Key Updates for Week 42, ending October 17, 2020


Nationally, surveillance indicators tracking levels of SARS-CoV-2 virus circulation and associated illnesses have been increasing since September, driven primarily by activity in the Southeastern and Central parts of the country. COVID-19 related hospitalization rates and pneumonia, influenza and COVID (PIC) mortality for the most recent weeks may increase as more data are received.

national-activity-indicators.gif

Download Chart Data excel icon[XLS – 2 KB]
Virus: Public Health, Commercial and Clinical Laboratories


Nationally, the overall percentage of respiratory specimens testing positive for SARS-CoV-2, the virus causing COVID-19, increased from 5.6% during week 41 to 6.3% during week 42. Percent positivity increased among all age groups. Regionally, the percentages of respiratory specimens testing positive for SARS-CoV-2 increased in most of the country except the Mid-Atlantic (Region 3; stable) and Pacific Northwest (Region 10; slight decrease).
Mild/Moderate Illness: Outpatient and Emergency Department Visits


Nationally, the overall percentage of visits to outpatient providers or emergency departments (EDs) for influenza-like illness (ILI) or COVID-like illness (CLI) has been increasing slowly since mid-September and remained stable (change of ≤0.1%) in week 42 compared with week 41. In ILINet, the percentages of visits for ILI decreased slightly among those less than 25 years of age and remained stable for those 25 years and older. The Midwest (Region 5), South Central (Region 6) and Mountain (Region 8) regions reported an increase in at least one illness indicator during week 42 compared with week 41.
Severe Disease: Hospitalizations and Deaths


Since the week ending September 26 (MMWR week 39), overall weekly hospitalization rates have increased, driven primarily by an increase in rates among adults aged 50 years and older. Based on death certificate data, the percentage of deaths attributed to pneumonia, influenza, or COVID-19 (PIC) for week 42 was 7.6% and, while declining, remains above the epidemic threshold. Hospitalization rates and PIC mortality for the most recent weeks are anticipated to increase as additional data are reported.

All data are preliminary and may change as more reports are received. A description of the surveillance systems summarized in COVIDView, including methodology and detailed descriptions of each data component, is available on the surveillance methods page.
Key Points
  • Nationally, several surveillance indicators of COVID-19 related activity are showing increases in SARS-CoV-2 virus circulation and related illnesses.
    • The percentage of specimens testing positive for SARS-CoV-2, the percentages of visits to EDs or outpatient providers for ILI and CLI, and COVID-19-associated hospitalization rates have increased or remained stable in recent weeks. Hospitalization data for the most recent weeks may change as additional data are reported.
    • The percentage of deaths due to PIC have been declining since late July; however, in mid-September the percentage leveled off. Data for the most recent weeks currently show a decline, but that is likely to change as additional death certificates are processed.
  • At least one indicator used to monitor COVID-19 activity is increasing in eight of the ten HHS regions, and many regions are reporting increases in multiple indicators.
    • The percentages of specimens testing positive for SARS-CoV-2 increased in eight regions.
    • The percentages of visits for ILI, CLI or both increased in three regions.
    • For some indicators and regions, the increases have been small but consistent from week to week over the last several weeks, while other indicators have increased more rapidly in some regions.
  • The overall cumulative COVID-19-associated hospitalization rate through the week ending October 17, 2020 was 193.7 hospitalizations per 100,000 population.
    • Since the week ending September 26 (MMWR week 39), weekly hospitalization rates have increased for all age groups combined, driven primarily by an increase in rates among adults aged 50 years and older. Data for the most recent weeks may change as additional admissions occurring during those weeks are reported.
    • The age-adjusted hospitalization rate for Hispanic or Latino persons was approximately 4.5 times that of non-Hispanic White persons. Age-adjusted hospitalization rates for non-Hispanic American Indian or Alaska Native persons and non-Hispanic Black persons were approximately 4.4 and 4.3 times those of non-Hispanic White persons, respectively.
  • These surveillance systems aim to provide the most complete data available. Estimates from previous weeks are subject to change as data are updated with the most complete data available.
U.S. Virologic Surveillance


Based on data reported to CDC by public health laboratories and a subset of clinical and commercial laboratories in the United States, 64,364,628 specimens were tested for SARS-CoV-2 using a molecular assay since March 1, 2020. The percentages of specimens testing positive for SARS-CoV-2 each week, based on week of specimen collection, are summarized below.

Nationally, during week 42, 2,284,045 specimens were tested for SARS-CoV-2 for diagnostic purposes and 144,789 (6.3%) were positive. This is an increase compared with week 41, during which 5.6% of specimens tested were positive. The percentages of specimens testing positive increased among all age groups.

specimens-tested.gif


*Note: Different laboratory types came on board with testing during different weeks. This graph includes public health laboratory data beginning in week 10, clinical laboratory data beginning in week 11 and commercial laboratory data beginning in week 14.
View Data Table


The national increase in percent positivity was driven primarily by increases in Regions 4 (Southeast), 5 (Midwest), 6 (South Central), 7 (Central) and 8 (Mountain); this increase was reported among all age groups in these regions. Smaller increases were reported in Regions 1 (New England), 2 (New Jersey, New York and Puerto Rico), and 9 (South/West Coast). The highest percentages of specimens testing positive for SARS-CoV-2 were seen in Regions 4 (Southeast, 7.3%), 5 (Midwest, 8.7%), 6 (South Central, 9.8%), 7 (Central, 11.1%) and 8 (Mountain, 9.3%), the same regions reporting the largest increases in percentages of specimens testing positive during week 42 compared with week 41.

Additional virologic surveillance information: Surveillance Methods


Outpatient/Emergency Department Illness


Two syndromic surveillance systems, the U.S. Outpatient Influenza-like Illness Surveillance Network (ILINet) and the National Syndromic Surveillance Project (NSSP), are being used to monitor trends in outpatient and emergency department (ED) visits that may be associated with COVID-19 illness. Each system monitors activity in a slightly different set of providers/facilities. ILINet provides information about visits to outpatient providers or emergency departments for influenza-like illness (ILI; fever plus cough and/or sore throat) and NSSP provides information about visits to EDs for ILI and COVID-like illness (CLI; fever plus cough and/or shortness of breath or difficulty breathing). Some EDs contribute ILI data to both ILINet and NSSP. Both systems are currently being affected by changes in health care seeking behavior, including increased use of telemedicine and increased social distancing. These changes affect the numbers of people seeking care in the outpatient and ED settings and their reasons for doing so.

Nationally, the overall percentage of visits to outpatient providers or EDs for ILI or CLI has been increasing slightly since mid-September but remained stable (change of ≤0.1%) during week 42 compared with week 41. During week 42, the percentages of ED visits captured in NSSP for CLI and ILI, were 2.6% and 1.0%, respectively; 1.2% of visits reported through ILINet were for ILI. The percentage of ILI visits to ILINet providers remains below the national baseline (2.4% October 2019 through September 2020; 2.6% since October 2020) for the 26[SUP]th[/SUP] consecutive week and is slightly lower than typical for this time of year, compared with prior influenza seasons.
outpatient-emergency-visits.gif

resize iconView LargerView Data Table


The percentages of visits for ILI decreased slightly during week 42 compared with week 41 among those 0–4 years and 5–24 years but remained stable (change ≤0.1%) in the adult age groups (25–49 years, 50-64 years and ≥65 years).

resize iconView LargerView Data Table


On a regional levelexternal icon, seven of ten regions reported a stable (change of ≤0.1%) or decreasing percentage of visits to EDs and outpatient providers for ILI and CLI during week 42 compared with week 41. However, two regions (Region 5 [Midwest] and 8 [Mountain]) reported an increase in percentages of visits to EDs for CLI and one region (Region 6 [South Central]) reported an increase in the percentage of visits to outpatient providers or EDs for ILI. The percentage of visits for ILI to ILINet providers remained below the region-specific baseline in all 10 regions.
ILI Activity Levels


Data collected in ILINet are used to produce a measure of ILI activity for all 50 states, Puerto Rico, the U.S. Virgin Islands, the District of Columbia, and New York City and for each core-based statistical area (CBSA) where at least one provider is located. The mean reported percentage of visits due to ILI for the current week is compared with the mean reported during non-influenza weeks, and the activity levels correspond to the number of standard deviations below, at, or above the mean.

The number of jurisdictions at each activity level during week 42 and the previous week are summarized in the table below.
Activity Level
Week 42
(Week ending
Oct. 17, 2020)
Week 41
(Week ending
Oct. 10, 2020)
Week 42
(Week ending
Oct. 17, 2020)
Week 41
(Week ending
Oct. 10, 2020)
Very High0000
High0013
Moderate0146
Low112830
Minimal5352541533
Insufficient Data00355337

[TD="colspan: 2"] Number of Jurisdictions [/TD]
[TD="colspan: 2"] Number of CBSAs [/TD]

*Note: Data collected in ILINet may disproportionally represent certain populations within a state and may not accurately depict the full picture of influenza activity for the whole state. Differences in the data presented here by CDC and independently by some state health departments likely represent differing levels of data completeness with data presented by the state likely being the more complete.

Additional information about medically attended outpatient and emergency department visits for ILI and CLI: Surveillance Methods

Hospitalizations


The COVID-19-Associated Hospitalization Surveillance Network (COVID-NET) conducts population-based surveillance for laboratory-confirmed COVID-19-associated hospitalizations in select counties participating in the Emerging Infections Program (EIP) and the Influenza Hospitalization Surveillance Project (IHSP).

A total of 63,152 laboratory-confirmed COVID-19-associated hospitalizations were reported by sites between March 1, 2020, and October 17, 2020. The overall cumulative hospitalization rate was 193.7 per 100,000 population.

Overall weekly hospitalization rates among all ages combined first peaked during the week ending April 18 (MMWR week 16), followed by a second peak during the week ending July 18 (MMWR week 29). Since the week ending September 26 (MMWR week 39), overall weekly hospitalization rates have increased for all ages combined, driven primarily by an increase in rates among adults aged 50 years and older. Data for the most recent weeks may change as additional admissions occurring during those weeks are reported.
lab-confirmed-hospitalizations-weekly.gif

resize iconView Larger
Among the 63,152 laboratory-confirmed COVID-19-associated hospitalizations, 59,573 (94.3%) had information on race and ethnicity, while collection of race and ethnicity was still pending for 3,579 (5.7%) cases. When examining overall age-adjusted rates by race and ethnicity, the rate for Hispanic or Latino persons was approximately 4.5 times the rate among non-Hispanic White persons. Rates for non-Hispanic American Indian or Alaska Native and non-Hispanic Black persons were approximately 4.4 and 4.3 times the rate among non-Hispanic White persons, respectively.


When examining age-stratified crude hospitalization rates by race and ethnicity, compared with non-Hispanic White persons in the same age group, crude hospitalization rates were 7.1 times higher among Hispanic or Latino persons aged 0–17 years; 7.8 times higher among Hispanic or Latino persons aged 18–49 years; 5.8 times higher among non-Hispanic American Indian or Alaska Native persons aged 50–64 years; and 3.5 times higher among non-Hispanic Black persons aged ≥65 years.

Age Category
Rate[SUP]1[/SUP]Rate Ratio[SUP]2,3[/SUP]Rate[SUP]1[/SUP]Rate Ratio[SUP]2,3[/SUP]Rate[SUP]1[/SUP]Rate Ratio[SUP]2,3[/SUP]Rate[SUP]1[/SUP]Rate Ratio[SUP]2,3[/SUP]Rate[SUP]1[/SUP]Rate Ratio[SUP]2,3[/SUP]
0—17 years13.63.520.25.227.87.18.42.23.91
18—49 years297.57.6209.65.4305.97.861.91.639.01
50—64 years696.55.8581.34.9663.45.6181.01.5119.51
65+ years811.72.51143.63.5884.82.7354.31.1329.41
Overall rate[SUP]4[/SUP] (age-adjusted)390.64.4381.24.3398.84.5115.91.388.91

[TD="colspan: 2"] Non-Hispanic
American Indian or Alaska Native
[/TD]
[TD="colspan: 2"] Non-Hispanic Black [/TD]
[TD="colspan: 2"] Hispanic or Latino [/TD]
[TD="colspan: 2"] Non-Hispanic Asian or Pacific Islander [/TD]
[TD="colspan: 2"] Non-Hispanic White [/TD]
[SUP]1[/SUP] COVID-19-associated hospitalization rates by race and ethnicity are calculated using COVID-NET hospitalizations with known race and ethnicity for the numerator and NCHS bridged-race population estimates for the denominator.
[SUP]2[/SUP] For each age category, rate ratios are the ratios between crude hospitalization rates within each racial and ethnic group and the crude hospitalization rate among non-Hispanic White persons in the same age category.
[SUP]3[/SUP] The highest rate ratio in each age category is presented in bold.
[SUP]4 [/SUP]Overall rates are adjusted to account for differences in age distributions within race and ethnicity strata in the COVID-NET catchment area; the age strata used for the adjustment include 0–17, 18–49, 50–64, and 65+ years.

Non-Hispanic White persons and non-Hispanic Black persons represented the highest proportions of hospitalizations reported to COVID-NET, followed by Hispanic or Latino, non-Hispanic Asian or Pacific Islander, and non-Hispanic American Indian or Alaska Native persons. However, some racial and ethnic groups are disproportionately represented among hospitalizations as compared with the overall population of the catchment area. Prevalence ratios were highest among non-Hispanic American Indian or Alaska Native persons, followed by non-Hispanic Black persons and Hispanic or Latino persons.
1.3%32.0%23.2%5.1%33.0%
0.7%17.9%14.1%8.9%58.5%
1.91.81.60.60.6
[SUP]1[/SUP] Persons of multiple races (0.4%) or unknown race and ethnicity (5.0%) are not represented in the table but are included as part of the denominator.
[SUP]2[/SUP] Prevalence ratio is calculated as the ratio of the proportion of COVID-NET hospitalizations over the proportion of population in COVID-NET catchment area.

For underlying medical conditions, data were restricted to cases reported during March 1–May 31, 2020, due to delays in reporting. During this time frame, sampling was conducted among hospitalized adults for in-depth chart review; therefore, weighted percentages are reported. No sampling was conducted among hospitalized children. Among 8,141 sampled adults hospitalized during March 1–May 31 with information on underlying medical conditions, 90.8% had at least one reported underlying medical condition. The most reported underlying medical conditions were hypertension, obesity, metabolic disease, and cardiovascular disease. Among 256 children hospitalized during March 1–May 31 with information on underlying conditions, 51.1% had at least one reported underlying medical condition. The most reported underlying medical conditions were obesity, asthma, and neurologic disease.

Additional data on demographics, signs and symptoms at admission, underlying conditions, interventions, outcomes, and discharge diagnoses, stratified by age, sex, and race and ethnicity, are available.

Additional hospitalization surveillance information: Surveillance Methods | Additional rate data | Additional demographic and clinical data


Mortality Surveillance


The National Center for Health Statistics (NCHS) collects death certificate data from vital statistics offices for all deaths occurring in the United States. Based on death certificate data available on October 15, 2020, the percentage of deaths attributed to pneumonia, influenza, or COVID-19 (PIC) for week 42 was 7.6% and, while it is declining compared with the percentage during week 41, it remains above the epidemic threshold. Since the second peak at the end of July, the percentage of deaths due to PIC have been declining; however, in mid-September the percentage leveled off for two weeks. Data for the most recent three weeks currently show a decline, but percentages for recent weeks will likely increase as more death certificates are processed.

Weekly mortality surveillance data include a combination of machine coded and manually coded causes of death collected from death certificates. The percentage of deaths due to PIC is higher among manually coded records than more rapidly available machine coded records. Due to the additional time needed for manual coding, the initially reported PIC percentages may be lower than percentages calculated from final data.
nchs-mortality-report.gif

resize iconView Larger


*Data during recent weeks are incomplete because of the lag in time between when the death occurred and when the death certificate is completed, submitted to NCHS and processed for reporting purposes. It is possible that a death certificate includes both influenza and COVID as a cause of death therefore, the number of influenza and COVID coded deaths may not be mutually exclusive.
View Data Table


Additional NCHS mortality surveillance information: Surveillance Methods | Provisional Death Counts for COVID-19
More Information
View Page In:pdf icon 907 KB, 10 pages
Last Updated Oct. 23, 2020

https://www.cdc.gov/coronavirus/2019-ncov/covid-data/covidview/index.html
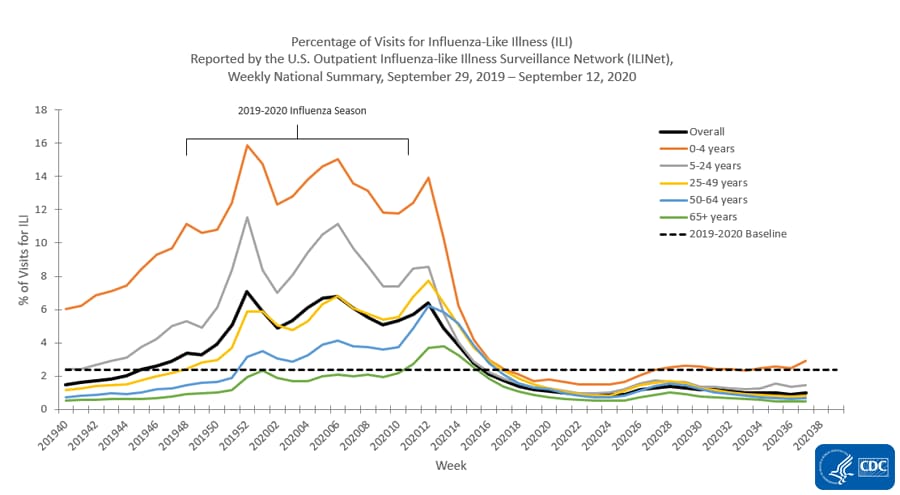
 
  1. CASES, DATA & SURVEILLANCE
COVIDView: A Weekly Surveillance Summary of U.S. COVID-19 Activity


Updated Oct. 30, 2020
Print
Download Weekly Summary pdf icon[953 KB, 11 Pages]
Key Updates for Week 43, ending October 24, 2020


Nationally, surveillance indicators tracking levels of SARS-CoV-2 virus circulation and associated illnesses have been increasing since September. The percentage of deaths due to pneumonia, influenza and COVID-19 (PIC) remained at approximately equal levels from mid-September through mid-October. Both COVID-19 related hospitalizations and PIC mortality for the most recent weeks may increase as more data are received.

national-activity-indicators.gif

Download Chart Data excel icon[XLS – 2 KB]
Virus: Public Health, Commercial and Clinical Laboratories


Nationally, the overall percentage of respiratory specimens testing positive for SARS-CoV-2, the virus causing COVID-19, increased from 6.6% during week 42 to 7.1% during week 43. Percent positivity increased among all age groups. Regionally, the percentages of respiratory specimens testing positive for SARS-CoV-2 increased in all ten HHS regions.
Mild/Moderate Illness: Outpatient and Emergency Department Visits


Nationally, the overall percentage of visits to outpatient providers or emergency departments (EDs) for influenza-like illness (ILI) or COVID-like illness (CLI) has been increasing since mid-September; CLI increased and ILI remained stable (change of ≤0.1%) in week 43 compared with week 42. Five HHS regions (Regions 1 [New England], 2 [New Jersey/New York/Puerto Rico], 5 [Midwest], 7 [Central] and 8 [Mountain]) experienced an increase in at least one indicator of mild/moderate illness in week 43 compared with week 42.
Severe Disease: Hospitalizations and Deaths


Since the week ending September 26 (MMWR week 39), overall weekly hospitalization rates have increased. Overall increases have been driven primarily by an increase in rates among adults aged 18 years and older. Based on death certificate data, the percentage of deaths attributed to PIC for week 43 was 8.2% and, while declining, remains above the epidemic threshold. Hospitalization rates and PIC mortality for the most recent weeks are anticipated to increase as additional data are reported.

All data are preliminary and may change as more reports are received. A description of the surveillance systems summarized in COVIDView, including methodology and detailed descriptions of each data component, is available on the surveillance methods page.
Key Points
  • Nationally, several surveillance indicators of COVID-19 related activity are showing increases in SARS-CoV-2 virus circulation and associated illnesses.
    • The percentage of specimens testing positive for SARS-CoV-2, the percentages of visits to EDs or outpatient providers for ILI and CLI, and COVID-19-associated hospitalization rates have increased since September. Hospitalization data for the most recent weeks may change as additional data are reported.
    • After declining for several weeks during the late summer, the percentage of deaths due to PIC have remained approximately level from the week ending September 19 through the week ending October 10. Data for the most recent two weeks currently show a decline, but that is likely to change as additional death certificates are processed.
  • At least one indicator used to monitor COVID-19 activity is increasing in each of the ten HHS regions, and many regions are reporting increases in multiple indicators.
    • The percentages of specimens testing positive for SARS-CoV-2 increased in all ten regions.
    • The percentages of visits for ILI, CLI or both increased in five of ten regions.
    • For some indicators and regions, the increases have been small but consistent from week to week over the last several weeks; other indicators have increased more rapidly in some regions.
  • The overall cumulative COVID-19-associated hospitalization rate through the week ending October 24, 2020 was 199.8 hospitalizations per 100,000 population.
    • Since the week ending September 26 (MMWR week 39), weekly hospitalization rates have increased. Overall increases have been driven primarily by an increase in rates among adults aged 18 years and older. Data for the most recent weeks may change as additional admissions occurring during those weeks are reported.
    • The age-adjusted hospitalization rate for Hispanic or Latino persons was approximately 4.4 times that of non-Hispanic White persons. Age-adjusted hospitalization rates for non-Hispanic American Indian or Alaska Native persons and non-Hispanic Black persons were approximately 4.3 and 4.2 times those of non-Hispanic White persons, respectively.
  • These surveillance systems aim to provide the most complete data available. Estimates from previous weeks are subject to change as data are updated with the most complete data available.
U.S. Virologic Surveillance


Based on data reported to CDC by public health laboratories and a subset of clinical and commercial laboratories in the United States, 65,014,028 specimens were tested for SARS-CoV-2 using a molecular assay since March 1, 2020. The percentages of specimens testing positive for SARS-CoV-2 each week, based on week of specimen collection, are summarized below.

Nationally, during week 43, 2,646,697 specimens were tested for SARS-CoV-2 for diagnostic purposes and 187,480 (7.1%) were positive. This is an increase compared with week 42, during which 6.6% of specimens tested were positive. The percentages of specimens testing positive increased among all age groups.

specimens-tested.gif


*Note: Different laboratory types came on board with testing during different weeks. This graph includes public health laboratory data beginning in week 10, clinical laboratory data beginning in week 11 and commercial laboratory data beginning in week 14.
View Data Table


The percentages of specimens testing positive for SARS-CoV-2 increased in all ten HHS regionsexternal icon. The regions with the highest percent positivity during week 43 were in the central part of the country, Regions 6 (South Central, 11.3%), 7 (Central, 12.9%) and 8 (Mountain, 10.9%); these three regions also reported the largest increases in percent positivity during week 43 compared with week 42.

Additional virologic surveillance information: Surveillance Methods


Outpatient/Emergency Department Illness


Two syndromic surveillance systems, the U.S. Outpatient Influenza-like Illness Surveillance Network (ILINet) and the National Syndromic Surveillance Project (NSSP), are being used to monitor trends in outpatient and emergency department (ED) visits that may be associated with COVID-19 illness. Each system monitors activity in a slightly different set of providers/facilities. ILINet provides information about visits to outpatient providers or emergency departments for influenza-like illness (ILI; fever plus cough and/or sore throat) and NSSP provides information about visits to EDs for ILI and COVID-like illness (CLI; fever plus cough and/or shortness of breath or difficulty breathing). Some EDs contribute ILI data to both ILINet and NSSP. Both systems are currently being affected by changes in health care seeking behavior, including increased use of telemedicine and increased social distancing. These changes affect the numbers of people seeking care in the outpatient and ED settings and their reasons for doing so.

Nationally, the overall percentage of visits to outpatient providers or EDs for ILI or CLI has been increasing since mid-September and increased (CLI) or remained stable (change of ≤0.1%) during week 43 compared with week 42. During week 43, the percentages of ED visits captured in NSSP for CLI and ILI, were 3.0% and 1.1%, respectively; 1.2% of visits reported through ILINet were for ILI. The percentage of ILI visits to ILINet providers remains below the national baseline (2.4% for October 2019 through September 2020; 2.6% since October 2020) for the 27[SUP]th[/SUP] consecutive week and is slightly lower than typical for this time of year, compared with prior influenza seasons.
outpatient-emergency-visits.gif

resize iconView LargerView Data Table


For those 0–4 years of age, the percentage of visits to ILINet providers for ILI increased during week 43 compared with week 42. For all other age groups (5-24 years, 25–49 years, 50–64 years and 65 years and older), the percentage remained stable (change of ≤0.1%).

resize iconView LargerView Data Table


On a regional levelexternal icon, five regions (Regions 1 [New England], 2 [New Jersey/New York/Puerto Rico], 5 [Midwest], 7 [Central] and 8 [Mountain]) experienced an increase in at least one indicator of mild/moderate CLI or ILI in week 43 compared with week 42. The remaining five regions reported a stable (change of ≤0.1%) percentage of visits to EDs and outpatient providers for ILI and CLI during week 43 compared with week 42. The percentage of visits for ILI to ILINet providers remained below the region-specific baseline in all 10 regions.
ILI Activity Levels


Data collected in ILINet are used to produce a measure of ILI activity for all 50 states, Puerto Rico, the U.S. Virgin Islands, the District of Columbia, and New York City and for each core-based statistical area (CBSA) where at least one provider is located. The mean reported percentage of visits due to ILI for the current week is compared with the mean reported during non-influenza weeks, and the activity levels correspond to the number of standard deviations below, at, or above the mean.

The number of jurisdictions at each activity level during week 43 and the previous week are summarized in the table below.
Activity Level
Week 43
(Week ending
Oct. 24, 2020)
Week 42
(Week ending
Oct. 17, 2020)
Week 43
(Week ending
Oct. 24, 2020)
Week 42
(Week ending
Oct. 17, 2020)
Very High0000
High0011
Moderate0004
Low112628
Minimal5253554568
Insufficient Data10348328

[TD="colspan: 2"] Number of Jurisdictions [/TD]
[TD="colspan: 2"] Number of CBSAs [/TD]

*Note: Data collected in ILINet may disproportionally represent certain populations within a state and may not accurately depict the full picture of influenza activity for the whole state. Differences in the data presented here by CDC and independently by some state health departments likely represent differing levels of data completeness with data presented by the state likely being the more complete.

Additional information about medically attended outpatient and emergency department visits for ILI and CLI: Surveillance Methods

Hospitalizations


The COVID-19-Associated Hospitalization Surveillance Network (COVID-NET) conducts population-based surveillance for laboratory-confirmed COVID-19-associated hospitalizations in select counties participating in the Emerging Infections Program (EIP) and the Influenza Hospitalization Surveillance Project (IHSP).

A total of 65,143 laboratory-confirmed COVID-19-associated hospitalizations were reported by sites between March 1, 2020, and October 24, 2020. The overall cumulative hospitalization rate was 199.8 per 100,000 population.

Overall weekly hospitalization rates among all ages combined first peaked during the week ending April 18 (MMWR week 16), followed by a second peak during the week ending July 18 (MMWR week 29). Since the week ending September 26 (MMWR week 39), overall weekly hospitalization rates have increased, driven primarily by an increase in rates among adults aged 18 and older. Data for the most recent weeks may change as additional admissions occurring during those weeks are reported.
lab-confirmed-hospitalizations-weekly.gif

resize iconView Larger
Among the 65,143 laboratory-confirmed COVID-19-associated hospitalizations, 61,542 (94.5%) had information on race and ethnicity, while collection of race and ethnicity was still pending for 3,601 (5.5%) cases. When examining overall age-adjusted rates by race and ethnicity, the rate for Hispanic or Latino persons was approximately 4.4 times the rate among non-Hispanic White persons. Rates for non-Hispanic American Indian or Alaska Native persons and non-Hispanic Black persons were approximately 4.3 and 4.2 times the rate among non-Hispanic White persons, respectively.


When examining age-stratified crude hospitalization rates by race and ethnicity, compared with non-Hispanic White persons in the same age group, crude hospitalization rates were 7.0 times higher among Hispanic or Latino persons aged 0–17 years; 7.7 times higher among Hispanic or Latino persons aged 18–49 years; 5.6 times higher among non-Hispanic American Indian or Alaska Native persons aged 50–64 years; and 3.4 times higher among non-Hispanic Black persons aged ≥65 years.

Age Category
Rate[SUP]1[/SUP]Rate Ratio[SUP]2,3[/SUP]Rate[SUP]1[/SUP]Rate Ratio[SUP]2,3[/SUP]Rate[SUP]1[/SUP]Rate Ratio[SUP]2,3[/SUP]Rate[SUP]1[/SUP]Rate Ratio[SUP]2,3[/SUP]Rate[SUP]1[/SUP]Rate Ratio[SUP]2,3[/SUP]
0—17 years13.63.320.95.128.67.08.42.04.11
18—49 years307.37.6215.15.3311.87.764.61.640.51
50—64 years704.55.6593.44.7680.45.4189.71.5126.01
65+ years828.52.41168.23.4904.82.6368.51.1347.31
Overall rate[SUP]4[/SUP] (age-adjusted)398.84.3389.84.2407.84.4120.81.393.51

[TD="colspan: 2"] Non-Hispanic
American Indian or Alaska Native
[/TD]
[TD="colspan: 2"] Non-Hispanic Black [/TD]
[TD="colspan: 2"] Hispanic or Latino [/TD]
[TD="colspan: 2"] Non-Hispanic Asian or Pacific Islander [/TD]
[TD="colspan: 2"] Non-Hispanic White [/TD]
[SUP]1[/SUP] COVID-19-associated hospitalization rates by race and ethnicity are calculated using COVID-NET hospitalizations with known race and ethnicity for the numerator and NCHS bridged-race population estimates for the denominator.
[SUP]2[/SUP] For each age category, rate ratios are the ratios between crude hospitalization rates within each racial and ethnic group and the crude hospitalization rate among non-Hispanic White persons in the same age category.
[SUP]3[/SUP] The highest rate ratio in each age category is presented in bold.
[SUP]4 [/SUP]Overall rates are adjusted to account for differences in age distributions within race and ethnicity strata in the COVID-NET catchment area; the age strata used for the adjustment include 0–17, 18–49, 50–64, and 65+ years.

Non-Hispanic White persons and Non-Hispanic Black persons represented the highest proportions of hospitalizations reported to COVID-NET, followed by Hispanic or Latino, non-Hispanic Asian or Pacific Islander, and non-Hispanic American Indian or Alaska Native persons. However, some racial and ethnic groups are disproportionately represented among hospitalizations as compared with the overall population of the catchment area. Prevalence ratios were highest among non-Hispanic American Indian or Alaska Native persons, followed by non-Hispanic Black persons and Hispanic or Latino persons.
1.3%31.7%22.9%5.2%33.6%
0.7%17.9%14.1%8.9%58.5%
1.91.81.60.60.6
[SUP]1[/SUP] Persons of multiple races (0.4%) or unknown race and ethnicity (4.9%) are not represented in the table but are included as part of the denominator.
[SUP]2[/SUP] Prevalence ratio is calculated as the ratio of the proportion of COVID-NET hospitalizations over the proportion of population in COVID-NET catchment area.

For underlying medical conditions, data were restricted to cases reported during March 1–May 31, 2020, due to delays in reporting. During this time frame, sampling was conducted among hospitalized adults for in-depth chart review; therefore, weighted percentages are reported. No sampling was conducted among hospitalized children. Among 8,278 sampled adults hospitalized during March 1–May 31 with information on underlying medical conditions, 90.7% had at least one reported underlying medical condition. The most reported underlying medical conditions were hypertension, obesity, metabolic disease, and cardiovascular disease. Among 264 children hospitalized during March 1–May 31 with information on underlying conditions, 50.8% had at least one reported underlying medical condition. The most reported underlying medical conditions were obesity, asthma, and neurologic disease.

Additional data on demographics, signs and symptoms at admission, underlying conditions, interventions, outcomes, and discharge diagnoses, stratified by age, sex, and race and ethnicity, are available.

Additional hospitalization surveillance information: Surveillance Methods | Additional rate data | Additional demographic and clinical data


Mortality Surveillance


The National Center for Health Statistics (NCHS) collects death certificate data from vital statistics offices for all deaths occurring in the United States. Based on death certificate data available on October 15, 2020, the percentage of deaths attributed to pneumonia, influenza, or COVID-19 (PIC) for week 42 was 7.6% and, while it is declining compared with the percentage during week 41, it remains above the epidemic threshold. Since the second peak at the end of July, the percentage of deaths due to PIC have been declining; however, in mid-September the percentage leveled off for two weeks. Data for the most recent three weeks currently show a decline, but percentages for recent weeks will likely increase as more death certificates are processed.

Weekly mortality surveillance data include a combination of machine coded and manually coded causes of death collected from death certificates. The percentage of deaths due to PIC is higher among manually coded records than more rapidly available machine coded records. Due to the additional time needed for manual coding, the initially reported PIC percentages may be lower than percentages calculated from final data.
nchs-mortality-report.gif

resize iconView Larger


*Data during recent weeks are incomplete because of the lag in time between when the death occurred and when the death certificate is completed, submitted to NCHS and processed for reporting purposes. It is possible that a death certificate includes both influenza and COVID as a cause of death therefore, the number of influenza and COVID coded deaths may not be mutually exclusive.
View Data Table


Additional NCHS mortality surveillance information: Surveillance Methods | Provisional Death Counts for COVID-19
More Information
View Page In:pdf icon 953 KB, 11 Pages
Last Updated Oct. 30, 2020

https://www.cdc.gov/coronavirus/2019-ncov/covid-data/covidview/index.html
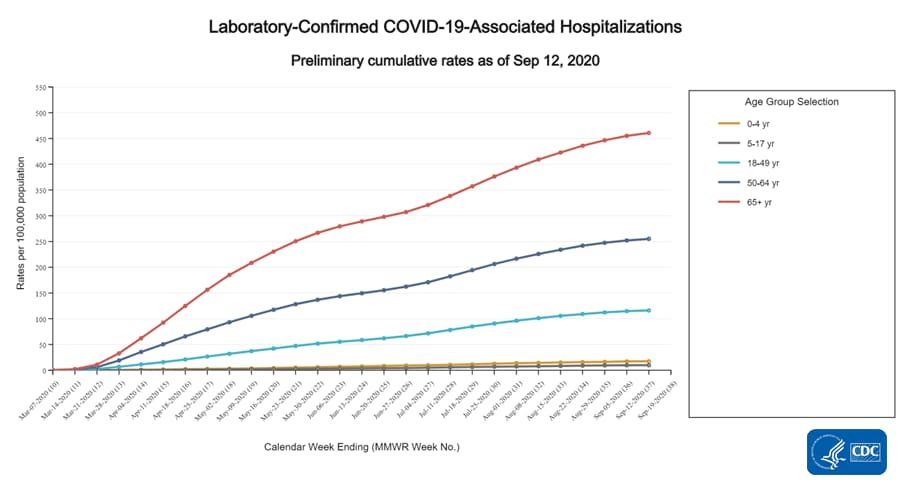
 
COVIDView: A Weekly Surveillance Summary of U.S. COVID-19 Activity


Updated Nov. 6, 2020


Download Weekly Summary pdf icon[887 KB, 11 pages]
Key Updates for Week 44, ending October 31, 2020


Nationally, surveillance indicators tracking levels of SARS-CoV-2 virus circulation and associated illnesses have been increasing since September. The percentage of deaths due to pneumonia, influenza and COVID-19 (PIC) increased during the first two weeks of October. Both COVID-19 related hospitalizations and PIC mortality for the most recent weeks may increase as more data are received.

national-activity-indicators.gif

Download Chart Data excel icon[XLS – 2 KB]
Virus: Public Health, Commercial and Clinical Laboratories


Nationally, the overall percentage of respiratory specimens testing positive for SARS-CoV-2, the virus causing COVID-19, increased from 7.2% during week 43 to 8.2% during week 44. Percent positivity increased among all age groups. Regionally, the percentages of respiratory specimens testing positive for SARS-CoV-2 increased in all ten HHS regions.
Mild/Moderate Illness: Outpatient and Emergency Department Visits


Nationally, the overall percentage of visits to outpatient providers or emergency departments (EDs) for influenza-like illness (ILI) or COVID-like illness (CLI) has been increasing since mid-September; CLI increased and ILI remained stable (change of ≤0.1%) in week 44 compared with week 43. Five regions reported an increase in at least one indicator of mild/moderate illness.
Severe Disease: Hospitalizations and Deaths


Since the week ending September 26 (MMWR week 39), overall weekly hospitalization rates have increased. Overall increases have been driven primarily by an increase in rates among adults aged 18 years and older. Based on death certificate data, the percentage of deaths attributed to PIC for week 44 was 8.1% and, while declining compared to week 43 (11.8%), remains above the epidemic threshold. The weekly percentages of deaths due to PIC increased during the first two weeks of October. Hospitalization rates and PIC mortality for the most recent weeks may increase as additional data are reported.

All data are preliminary and may change as more reports are received. A description of the surveillance systems summarized in COVIDView, including methodology and detailed descriptions of each data component, is available on the surveillance methods page.
Key Points
  • Nationally, several surveillance indicators of COVID-19 related activity are showing increases in SARS-CoV-2 virus circulation and associated illnesses.
    • The percentage of specimens testing positive for SARS-CoV-2, the percentages of visits to EDs or outpatient providers for ILI and CLI, and COVID-19-associated hospitalization rates have increased since September. Hospitalization data for the most recent weeks may change as additional data are reported.
    • After declining for several weeks during the late summer, the percentage of deaths due to PIC remained approximately level from the week ending September 19 through the week ending October 3 and increased for the first two weeks of October. Data for the most recent two weeks currently show a decline, but that is likely to change as additional death certificates are processed.
  • At least one indicator used to monitor COVID-19 activity is increasing in each of the ten HHS regions, and many regions are reporting increases in multiple indicators.
    • The percentages of specimens testing positive for SARS-CoV-2 increased in all ten regions.
    • The percentages of visits for ILI, CLI or both increased in five of ten regions.
    • For some indicators and regions, the increases have been small but consistent from week to week over the last several weeks; other indicators have increased more rapidly in some regions.
  • The overall cumulative COVID-19-associated hospitalization rate through the week ending October 31, 2020 was 207.1 hospitalizations per 100,000 population.
    • Since the week ending September 26 (MMWR week 39), weekly hospitalization rates have increased. Overall increases have been driven primarily by an increase in rates among adults aged 18 years and older. Data for the most recent weeks may change as additional admissions occurring during those weeks are reported.
    • The age-adjusted hospitalization rate for Hispanic or Latino persons was approximately 4.3 times that of non-Hispanic White persons. Age-adjusted hospitalization rates for non-Hispanic American Indian or Alaska Native persons and non-Hispanic Black persons were approximately 4.2 and 4.1 times those of non-Hispanic White persons, respectively.
  • These surveillance systems aim to provide the most complete data available. Estimates from previous weeks are subject to change as data are updated with the most complete data available.
U.S. Virologic Surveillance


Based on data reported to CDC by public health laboratories and a subset of clinical and commercial laboratories in the United States, 68,363,929 specimens were tested for SARS-CoV-2 using a molecular assay since March 1, 2020. The percentages of specimens testing positive for SARS-CoV-2 each week, based on week of specimen collection, are summarized below.

Nationally, during week 44, 2,890,895 specimens were tested for SARS-CoV-2 for diagnostic purposes and 238,214 (8.2%) were positive. This is an increase compared with week 43, during which 7.2% of specimens tested were positive. The percentages of specimens testing positive increased among all age groups.

specimens-tested.gif


*Note: Different laboratory types came on board with testing during different weeks. This graph includes public health laboratory data beginning in week 10, clinical laboratory data beginning in week 11 and commercial laboratory data beginning in week 14.
View Data Table


The percentages of specimens testing positive for SARS-CoV-2 increased in all ten HHS regionsexternal icon. The regions with the highest percent positivity during week 44 were in the central part of the country, Regions 5 (Midwest, 12.3%), 6 (South Central, 11.7%), 7 (Central, 17.6%) and 8 (Mountain, 12.0%). Three of these regions (Regions 5, 7, and 8) also reported the largest increases in percent positivity during week 44 compared with week 43.

Additional virologic surveillance information: Surveillance Methods


Outpatient/Emergency Department Illness


Two syndromic surveillance systems, the U.S. Outpatient Influenza-like Illness Surveillance Network (ILINet) and the National Syndromic Surveillance Project (NSSP), are being used to monitor trends in outpatient and emergency department (ED) visits that may be associated with COVID-19 illness. Each system monitors activity in a slightly different set of providers/facilities. ILINet provides information about visits to outpatient providers or emergency departments for influenza-like illness (ILI; fever plus cough and/or sore throat) and NSSP provides information about visits to EDs for ILI and COVID-like illness (CLI; fever plus cough and/or shortness of breath or difficulty breathing). Some EDs contribute ILI data to both ILINet and NSSP. Both systems are currently being affected by changes in health care seeking behavior, including increased use of telemedicine and increased social distancing. These changes affect the numbers of people seeking care in the outpatient and ED settings and their reasons for doing so.

Nationally, the overall percentage of visits to outpatient providers or EDs for ILI or CLI has been increasing since mid-September and increased (CLI) or remained stable (change of ≤0.1%; ILI) during week 44 compared with week 43. During week 44, the percentages of ED visits captured in NSSP for CLI and ILI were 3.4% and 1.1%, respectively; 1.3% of visits reported through ILINet were for ILI. The percentage of ILI visits to ILINet providers remains below the national baseline (2.4% for October 2019 through September 2020; 2.6% since October 2020) for the 28[SUP]th[/SUP] consecutive week and is slightly lower than typical for this time of year compared with prior influenza seasons.
outpatient-emergency-visits.gif

resize iconView LargerView Data Table


For all age groups, (0–4 years, 5–24 years, 25–49 years, 50–64 years, 65 years and older) the percentage of visits for ILI remained stable (change of ≤0.1%) in week 44 compared to week 43 but has been slowly increasing since mid-August for those 0–4 years and since September for the other age groups.

resize iconView LargerView Data Table


On a regional levelexternal icon, five regions (Regions 1 [New England], 3 [Mid-Atlantic], 5 [Midwest], 7 [Central] and 8 [Mountain]) reported an increase in at least one indicator of mild/moderate CLI or ILI in week 44 compared with week 43. In addition, one region (Region 4 [Southeast]) experienced a decrease in CLI, one region (Region 2 [New Jersey/New York/Puerto Rico]) experienced a decrease in ILI, and the remaining three regions (Regions 6 [South Central], 9 [South West/Coast] and 10 [Pacific Northwest] reported a stable (change of ≤0.1%) percentage of visits to EDs and outpatient providers for ILI and CLI. The percentage of visits for ILI to ILINet providers remained below the region-specific baseline in all 10 regions.

ILI Activity Levels

Data collected in ILINet are used to produce a measure of ILI activity for all 50 states, Puerto Rico, the U.S. Virgin Islands, the District of Columbia, and New York City and for each core-based statistical area (CBSA) where at least one provider is located. The mean reported percentage of visits due to ILI for the current week is compared with the mean reported during non-influenza weeks, and the activity levels correspond to the number of standard deviations below, at, or above the mean.

The number of jurisdictions at each activity level during week 44 and the previous week are summarized in the table below.
Activity Level
Week 44
(Week ending
Oct. 31, 2020)
Week 43
(Week ending
Oct. 24, 2020)
Week 44
(Week ending
Oct. 31, 2020)
Week 43
(Week ending
Oct. 24, 2020)
Very High0000
High0021
Moderate1041
Low113827
Minimal5253544567
Insufficient Data00341333

[TD="colspan: 2"] Number of Jurisdictions [/TD]
[TD="colspan: 2"] Number of CBSAs [/TD]

*Note: Data collected in ILINet may disproportionally represent certain populations within a state and may not accurately depict the full picture of influenza activity for the whole state. Differences in the data presented here by CDC and independently by some state health departments likely represent differing levels of data completeness with data presented by the state likely being the more complete.

Additional information about medically attended outpatient and emergency department visits for ILI and CLI: Surveillance Methods

Hospitalizations


The COVID-19-Associated Hospitalization Surveillance Network (COVID-NET) conducts population-based surveillance for laboratory-confirmed COVID-19-associated hospitalizations in select counties participating in the Emerging Infections Program (EIP) and the Influenza Hospitalization Surveillance Project (IHSP).

A total of 67,508 laboratory-confirmed COVID-19-associated hospitalizations were reported by sites between March 1, 2020, and October 31, 2020. The overall cumulative hospitalization rate was 207.1 per 100,000 population.

Overall weekly hospitalization rates among all ages combined first peaked during the week ending April 18 (MMWR week 16), followed by a second peak during the week ending July 18 (MMWR week 29). Since the week ending September 26 (MMWR week 39), overall weekly hospitalization rates have increased, driven primarily by an increase in rates among adults aged 18 and older. Data for the most recent weeks may change as additional admissions occurring during those weeks are reported.
lab-confirmed-hospitalizations-weekly.gif

resize iconView Larger
Among the 67,508 laboratory-confirmed COVID-19-associated hospitalizations, 64,670 (95.8%) had information on race and ethnicity, while collection of race and ethnicity was still pending for 2,838 (4.2%) cases. When examining overall age-adjusted rates by race and ethnicity, the rate for Hispanic or Latino persons was approximately 4.3 times the rate among non-Hispanic White persons. Rates for non-Hispanic American Indian or Alaska Native persons and non-Hispanic Black persons were approximately 4.2 and 4.1 times the rate among non-Hispanic White persons, respectively.


When examining age-stratified crude hospitalization rates by race and ethnicity, compared with non-Hispanic White persons in the same age group, crude hospitalization rates were 6.6 times higher among Hispanic or Latino persons aged 0–17 years; 7.4 times higher among Hispanic or Latino persons and non-Hispanic American Indian or Alaska Native persons aged 18–49 years; 5.4 times higher among non-Hispanic American Indian or Alaska Native persons aged 50–64 years; and 3.3 times higher among non-Hispanic Black persons aged ≥ 65 years.

Age Category
Rate[SUP]1[/SUP]Rate Ratio[SUP]2,3[/SUP]Rate[SUP]1[/SUP]Rate Ratio[SUP]2,3[/SUP]Rate[SUP]1[/SUP]Rate Ratio[SUP]2,3[/SUP]Rate[SUP]1[/SUP]Rate Ratio[SUP]2,3[/SUP]Rate[SUP]1[/SUP]Rate Ratio[SUP]2,3[/SUP]
0—17 years13.63.022.04.929.96.68.82.04.51
18—49 years320.07.4223.25.1323.37.469.01.643.41
50—64 years725.85.4616.24.6708.75.2199.51.5135.21
65+ years874.82.41214.93.3954.32.6384.11.0371.01
Overall rate[SUP]4[/SUP] (age-adjusted)415.54.2405.14.1425.94.3127.01.3100.01

[TD="colspan: 2"] Non-Hispanic
American Indian or Alaska Native
[/TD]
[TD="colspan: 2"] Non-Hispanic Black [/TD]
[TD="colspan: 2"] Hispanic or Latino [/TD]
[TD="colspan: 2"] Non-Hispanic Asian or Pacific Islander [/TD]
[TD="colspan: 2"] Non-Hispanic White [/TD]
[SUP]1[/SUP] COVID-19-associated hospitalization rates by race and ethnicity are calculated using COVID-NET hospitalizations with known race and ethnicity for the numerator and NCHS bridged-race population estimates for the denominator.
[SUP]2[/SUP] For each age category, rate ratios are the ratios between crude hospitalization rates within each racial and ethnic group and the crude hospitalization rate among non-Hispanic White persons in the same age category.
[SUP]3[/SUP] The highest rate ratio in each age category is presented in bold.
[SUP]4 [/SUP]Overall rates are adjusted to account for differences in age distributions within race and ethnicity strata in the COVID-NET catchment area; the age strata used for the adjustment include 0–17, 18–49, 50–64, and 65+ years.

Non-Hispanic White persons and Non-Hispanic Black persons represented the highest proportions of hospitalizations reported to COVID-NET, followed by Hispanic or Latino, non-Hispanic Asian or Pacific Islander, and non-Hispanic American Indian or Alaska Native persons. However, some racial and ethnic groups are disproportionately represented among hospitalizations as compared with the overall population of the catchment area. Prevalence ratios were highest among non-Hispanic American Indian or Alaska Native persons, followed by non-Hispanic Black persons and Hispanic or Latino persons.
1.3%31.7%22.9%5.2%34.2%
0.7%17.9%14.1%8.9%58.5%
1.91.81.60.60.6
[SUP]1[/SUP] Persons of multiple races (0.3%) or unknown race and ethnicity (4.9%) are not represented in the table but are included as part of the denominator.
[SUP]2[/SUP] Prevalence ratio is calculated as the ratio of the proportion of COVID-NET hospitalizations over the proportion of population in COVID-NET catchment area.

For underlying medical conditions, data were restricted to cases reported during March 1–May 31, 2020, due to delays in reporting. During this time frame, sampling was conducted among hospitalized adults; therefore, weighted percentages are reported. No sampling was conducted among hospitalized children. Among 8,375 sampled adults hospitalized during March 1–May 31 with information on underlying medical conditions, 90.6% had at least one reported underlying medical condition. The most reported underlying medical conditions were hypertension, obesity, metabolic disease, and cardiovascular disease. Among 264 children hospitalized during March 1–May 31 with information on underlying conditions, 50.8% had at least one reported underlying medical condition. The most reported underlying medical conditions were obesity, asthma, and neurologic disease.

Additional data on demographics, signs and symptoms at admission, underlying conditions, interventions, outcomes, and discharge diagnoses, stratified by age, sex, and race and ethnicity, are available.

Additional hospitalization surveillance information: Surveillance Methods | Additional rate data | Additional demographic and clinical data


Mortality Surveillance


The National Center for Health Statistics (NCHS) collects death certificate data from vital statistics offices for all deaths occurring in the United States. Based on death certificate data available on November 5, 2020, the percentage of deaths attributed to pneumonia, influenza, or COVID-19 (PIC) for week 44 was 8.1% and, while it is declining compared with the percentage during week 43, it remains above the epidemic threshold. The weekly percentage of deaths due to PIC declined from a second peak at the end of July through mid- September, remained approximately stable from the week ending September 19 through the week ending October 3, and increased during the first two weeks of October. Data for the most recent two weeks currently show a decline, but percentages for recent weeks will likely increase as more death certificates are processed.

Weekly mortality surveillance data include a combination of machine coded and manually coded causes of death collected from death certificates. The percentage of deaths due to PIC is higher among manually coded records than more rapidly available machine coded records. Due to the additional time needed for manual coding, the initially reported PIC percentages may be lower than percentages calculated from final data.
nchs-mortality-report.gif

resize iconView Larger


*Data during recent weeks are incomplete because of the lag in time between when the death occurred and when the death certificate is completed, submitted to NCHS and processed for reporting purposes. It is possible that a death certificate includes both influenza and COVID as a cause of death therefore, the number of influenza and COVID coded deaths may not be mutually exclusive.
View Data Table


Additional NCHS mortality surveillance information: Surveillance Methods | Provisional Death Counts for COVID-19
More Information
View Page In:pdf icon 887 KB, 11 Pages
Last Updated Nov. 6, 2020

https://www.cdc.gov/coronavirus/2019-ncov/covid-data/covidview/index.html
 
  1. CASES, DATA & SURVEILLANCE
COVIDView: A Weekly Surveillance Summary of U.S. COVID-19 Activity


Updated Nov. 13, 2020
Print
Download Weekly Summary pdf icon[844 KB, 11 pages]
Key Updates for Week 45, ending November 7, 2020


Nationally, surveillance indicators tracking levels of SARS-CoV-2 virus circulation and associated illnesses have been increasing since September. The percentage of deaths due to pneumonia, influenza and COVID-19 (PIC) increased during the first three weeks of October. Both COVID-19 related hospitalizations and PIC mortality for the most recent weeks may increase as more data are received.

national-activity-indicators.gif

Download Chart Data excel icon[XLS – 2 KB]
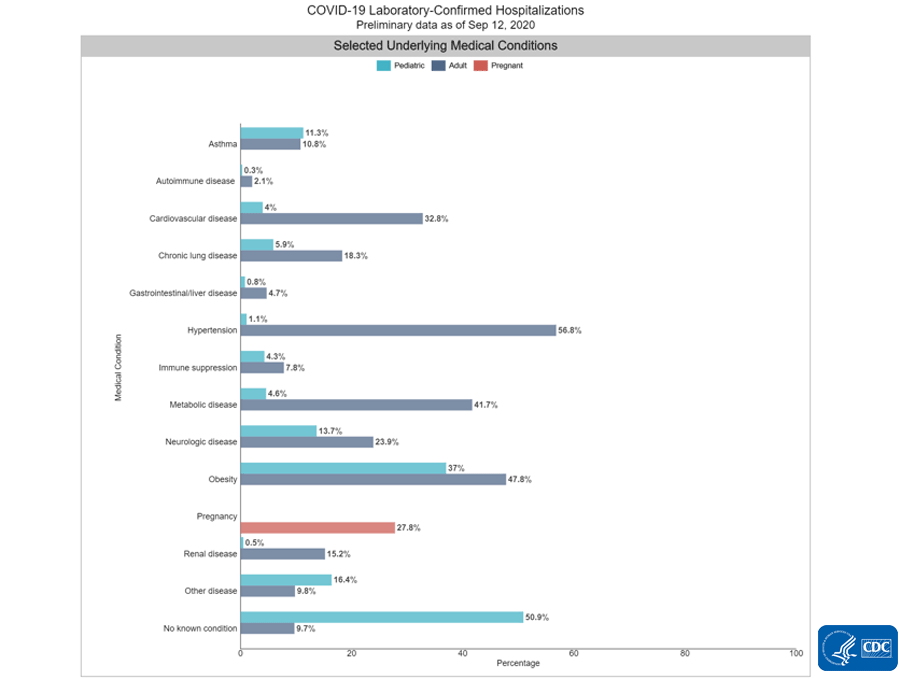
Virus: Public Health, Commercial and Clinical Laboratories
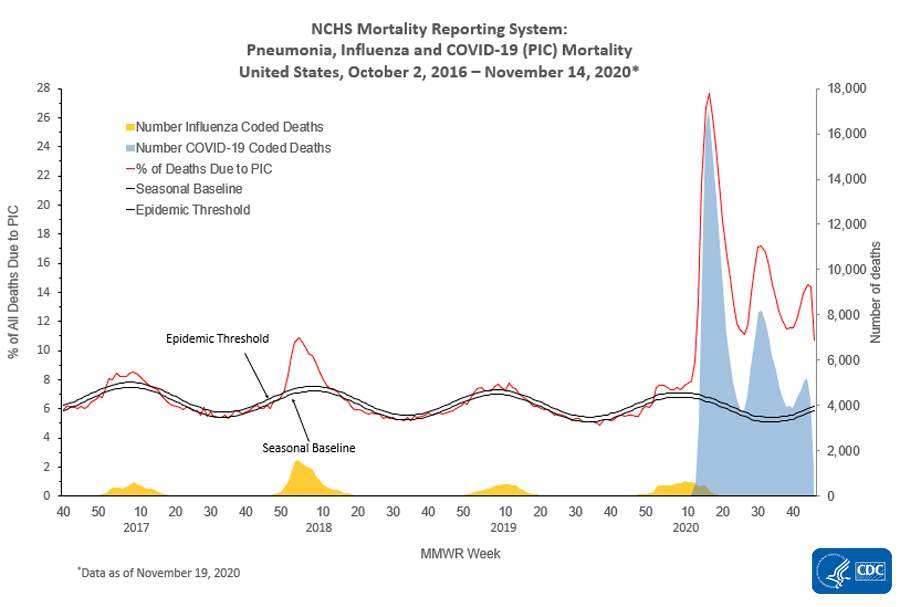

Nationally, the overall percentage of respiratory specimens testing positive for SARS-CoV-2, the virus causing COVID-19, increased from 8.4% during week 44 to 10.5% during week 45. Percent positivity increased among all age groups. Regionally, the percentages of respiratory specimens testing positive for SARS-CoV-2 increased in all ten HHS regions.
Mild/Moderate Illness: Outpatient and Emergency Department Visits


Nationally, the overall percentage of visits to outpatient providers or emergency departments (EDs) for influenza-like illness (ILI) or COVID-like illness (CLI) has been increasing since mid-September; CLI and ILI increased in week 45 compared with week 44. All ten surveillance regions reported an increase in at least one indicator of mild/moderate illness.
Severe Disease: Hospitalizations and Deaths


Since the week ending September 26 (MMWR week 39), overall weekly hospitalization rates have increased. Overall increases have been driven primarily by an increase in rates among adults aged 50 years and older. Based on death certificate data, the percentage of deaths attributed to PIC for week 45 was 8.9% and, while declining compared to week 44 (12.3%), remains above the epidemic threshold. The weekly percentages of deaths due to PIC increased during the first three weeks of October and are expected to increase for the most recent weeks as additional data are reported. The hospitalization rate for the most recent week is expected to be higher as additional data are reported.

All data are preliminary and may change as more reports are received. A description of the surveillance systems summarized in COVIDView, including methodology and detailed descriptions of each data component, is available on the surveillance methods page.
Key Points
  • Nationally, all surveillance indicators included in COVIDView are showing increases in SARS-CoV-2 virus circulation and associated illnesses and deaths.
    • The percentage of specimens testing positive for SARS-CoV-2, the percentages of visits to EDs or outpatient providers for ILI and CLI, and COVID-19-associated hospitalization rates have been increasing since September. The hospitalization rate for the most recent week is expected to be higher as additional data are reported in future weeks.
    • The percentage of deaths due to PIC has been increasing since the beginning of October. Data for the most recent two weeks currently show a decline, but that is likely to change as additional death certificates are processed.
  • At least one indicator used to monitor COVID-19 activity is increasing in each of the ten HHS regions, and many regions are reporting increases in multiple indicators.
    • The percentages of specimens testing positive for SARS-CoV-2 increased in all ten regions.
    • The percentages of visits for ILI, CLI or both increased in all ten regions.
    • For some indicators and regions, the increases have been small but consistent from week to week over the last several weeks; other indicators have increased more rapidly in some regions.
    • Two regions (Regions 7 [Central] and 8 [Mountain]) have a least two surveillance indicators that were higher during week 45 than at any other time during the pandemic.
  • The overall cumulative COVID-19-associated hospitalization rate through the week ending November 7, 2020 was 217.2 hospitalizations per 100,000 population.
    • Since the week ending September 26 (MMWR week 39), weekly hospitalization rates have increased. Overall increases have been driven primarily by an increase in rates among adults aged 50 years and older. Weekly hospitalization rates among children have had a two-week sustained increase from October 24 (MMWR week 43) to November 7 (MMWR week 45). Data for the most recent weeks may change as additional admissions occurring during those weeks are reported.
    • The age-adjusted hospitalization rate for Hispanic or Latino persons was approximately 4.2 times that of non-Hispanic White persons. Age-adjusted hospitalization rates for non-Hispanic American Indian or Alaska Native persons and non-Hispanic Black persons were approximately 4.1 and 3.9 times those of non-Hispanic White persons, respectively.
  • These surveillance systems aim to provide the most complete data available. Estimates from previous weeks are subject to change as data are updated with the most complete data available.
U.S. Virologic Surveillance


Based on data reported to CDC by public health laboratories and a subset of clinical and commercial laboratories in the United States, 71,827,520 specimens were tested for SARS-CoV-2 using a molecular assay since March 1, 2020. The percentages of specimens testing positive for SARS-CoV-2 each week, based on week of specimen collection, are summarized below.

Nationally, during week 45, 3,128,187 specimens were tested for SARS-CoV-2 for diagnostic purposes and 328,119 (10.5%) were positive. This is an increase compared with week 44, during which 8.4% of specimens tested were positive. The percentages of specimens testing positive increased among all age groups.

specimens-tested.gif


*Note: Different laboratory types came on board with testing during different weeks. This graph includes public health laboratory data beginning in week 10, clinical laboratory data beginning in week 11 and commercial laboratory data beginning in week 14.
View Data Table


The percentages of specimens testing positive for SARS-CoV-2 increased in all ten HHS regionsexternal icon. The regions with the highest percent positivity during week 45 were in the central part of the country, Regions 5 (Midwest, 16.2%), 6 (South Central, 13.7%), 7 (Central, 23.5%) and 8 (Mountain, 15.5%). These regions also reported the largest increases in percent positivity during week 45 compared with week 44.

Additional virologic surveillance information: Surveillance Methods


Outpatient/Emergency Department Illness


Two syndromic surveillance systems, the U.S. Outpatient Influenza-like Illness Surveillance Network (ILINet) and the National Syndromic Surveillance Project (NSSP), are being used to monitor trends in outpatient and emergency department (ED) visits that may be associated with COVID-19 illness. Each system monitors activity in a slightly different set of providers/facilities. ILINet provides information about visits to outpatient providers or emergency departments for influenza-like illness (ILI; fever plus cough and/or sore throat) and NSSP provides information about visits to EDs for ILI and COVID-like illness (CLI; fever plus cough and/or shortness of breath or difficulty breathing). Some EDs contribute ILI data to both ILINet and NSSP. Both systems are currently being affected by changes in health care seeking behavior, including increased use of telemedicine and increased social distancing. These changes affect the numbers of people seeking care in the outpatient and ED settings and their reasons for doing so.

Nationally, the overall percentage of visits to outpatient providers or EDs for ILI or CLI has been increasing since mid-September. During week 45, the percentages of ED visits captured in NSSP for CLI and ILI were 3.9% and 1.2%, respectively and, compared to week 44, increased (CLI) or remained stable (change of≤0.1%; ILI). In ILINet, 1.5% of visits reported were for ILI and, while increasing compared with week 44 (1.3%), remains below the national baseline (2.4% for October 2019 through September 2020; 2.6% since October 2020) for the 30[SUP]th[/SUP] consecutive week. This level of ILI is typical for ILINet during this time of year.
outpatient-emergency-visits.gif

resize iconView LargerView Data Table


For those 5–24 years, the percentage of visits for ILI increased during week 45 (1.9%) compared with week 44 (1.7%). For all other age groups, (0–4 years, 25–49 years, 50–64 years, 65 years and older) the percentage of visits for ILI remained stable (change of ≤0.1%). All age groups have experienced an increasing percentage of visits for ILI since September.

resize iconView LargerView Data Table


On a regional levelexternal icon, all ten regions reported an increase in at least one indicator of mild/moderate CLI or ILI in week 45 compared to week 44 and eight regions (Regions 2 [New Jersey/New York/Puerto Rico], 3 [Mid-Atlantic], 5 [Midwest], 6 [Southwest], 7 [Central], 8 [Mountain], 9 [South West/Coast], and 10 [Pacific Northwest]) reported an increase in at least two indicators. The percentage of visits for ILI to ILINet providers remained below the region-specific baseline in 9 regions; however, Region 7 (Central) reported ILI activity above baseline due to increased COVID activity.

ILI Activity Levels

Data collected in ILINet are used to produce a measure of ILI activity for all 50 states, Puerto Rico, the U.S. Virgin Islands, the District of Columbia, and New York City and for each core-based statistical area (CBSA) where at least one provider is located. The mean reported percentage of visits due to ILI for the current week is compared with the mean reported during non-influenza weeks, and the activity levels correspond to the number of standard deviations below, at, or above the mean.

The number of jurisdictions at each activity level during week 45 and the previous week are summarized in the table below.
Activity Level
Week 45
(Week ending
Nov. 7, 2020)
Week 44
(Week ending
Oct. 31, 2020)
Week 45
(Week ending
Nov. 7, 2020)
Week 44
(Week ending
Oct. 31, 2020)
Very High1010
High0012
Moderate0145
Low414038
Minimal4952540556
Insufficient Data10343328

[TD="colspan: 2"] Number of Jurisdictions [/TD]
[TD="colspan: 2"] Number of CBSAs [/TD]

*Note: Data collected in ILINet may disproportionally represent certain populations within a state and may not accurately depict the full picture of influenza activity for the whole state. Differences in the data presented here by CDC and independently by some state health departments likely represent differing levels of data completeness with data presented by the state likely being the more complete.

Additional information about medically attended outpatient and emergency department visits for ILI and CLI: Surveillance Methods

Hospitalizations


The COVID-19-Associated Hospitalization Surveillance Network (COVID-NET) conducts population-based surveillance for laboratory-confirmed COVID-19-associated hospitalizations in select counties participating in the Emerging Infections Program (EIP) and the Influenza Hospitalization Surveillance Project (IHSP).

A total of 70,825 laboratory-confirmed COVID-19-associated hospitalizations were reported by sites between March 1, 2020, and November 7, 2020. The overall cumulative hospitalization rate was 217.2 per 100,000 population.

Since the week ending September 26 (MMWR week 39), overall weekly hospitalization rates have increased, driven primarily by an increase in rates among adults aged 50 and older. Weekly hospitalization rates among children have had a two-week sustained increase from October 24 (MMWR week 43) to November 7 (MMWR week 45). The hospitalization rate for the most recent week is expected to be higher as additional data are reported in future weeks.
lab-confirmed-hospitalizations-weekly.gif

resize iconView Larger
Among the 70,825 laboratory-confirmed COVID-19-associated hospitalizations, 67,259 (95%) had information on race and ethnicity, while collection of race and ethnicity was still pending for 3,566 (5%) cases. When examining overall age-adjusted rates by race and ethnicity, the rate for Hispanic or Latino persons was approximately 4.2 times the rate among non-Hispanic White persons. Rates for non-Hispanic American Indian or Alaska Native persons and non-Hispanic Black persons were approximately 4.1 and 3.9 times the rate among non-Hispanic White persons, respectively.


When examining age-stratified crude hospitalization rates by race and ethnicity, compared with non-Hispanic White persons in the same age group, crude hospitalization rates were 6.5 times higher among Hispanic or Latino persons aged 0–17 years; 7.3 times higher among Hispanic or Latino persons aged 18–49 years; 5.2 times higher among non-Hispanic American Indian or Alaska Native persons aged 50–64 years; and 3.1 times higher among non-Hispanic Black persons aged ≥65 years.

Age Category
Rate[SUP]1[/SUP]Rate Ratio[SUP]2,3[/SUP]Rate[SUP]1[/SUP]Rate Ratio[SUP]2,3[/SUP]Rate[SUP]1[/SUP]Rate Ratio[SUP]2,3[/SUP]Rate[SUP]1[/SUP]Rate Ratio[SUP]2,3[/SUP]Rate[SUP]1[/SUP]Rate Ratio[SUP]2,3[/SUP]
0—17 years19.54.023.34.831.96.59.62.04.91.0
18—49 years329.77.2226.94.9334.67.372.01.646.11.0
50—64 years744.45.2625.74.4735.55.1208.11.4143.71.0
65+ years916.92.31237.33.11009.52.6400.31.0393.11.0
Overall rate[SUP]4[/SUP] (age-adjusted)430.94.1412.23.9444.64.2132.51.2106.21.0

[TD="colspan: 2"] Non-Hispanic
American Indian or Alaska Native
[/TD]
[TD="colspan: 2"] Non-Hispanic Black [/TD]
[TD="colspan: 2"] Hispanic or Latino [/TD]
[TD="colspan: 2"] Non-Hispanic Asian or Pacific Islander [/TD]
[TD="colspan: 2"] Non-Hispanic White [/TD]
[SUP]1[/SUP] COVID-19-associated hospitalization rates by race and ethnicity are calculated using COVID-NET hospitalizations with known race and ethnicity for the numerator and NCHS bridged-race population estimates for the denominator.
[SUP]2[/SUP] For each age category, rate ratios are the ratios between crude hospitalization rates within each racial and ethnic group and the crude hospitalization rate among non-Hispanic White persons in the same age category.
[SUP]3[/SUP] The highest rate ratio in each age category is presented in bold.
[SUP]4[/SUP] Overall rates are adjusted to account for differences in age distributions within race and ethnicity strata in the COVID-NET catchment area; the age strata used for the adjustment include 0–17, 18–49, 50–64, and 65+ years.

Non-Hispanic White persons and non-Hispanic Black persons represented the highest proportions of hospitalizations reported to COVID-NET, followed by Hispanic or Latino, non-Hispanic Asian or Pacific Islander, and non-Hispanic American Indian or Alaska Native persons. However, some racial and ethnic groups are disproportionately represented among hospitalizations compared with the overall population of the catchment area. Prevalence ratios were highest among non-Hispanic American Indian or Alaska Native persons, followed by non-Hispanic Black persons and Hispanic or Latino persons.
1.3%30.7%22.8%5.2%34.9%
0.7%17.9%14.1%8.9%58.5%
1.91.71.60.60.6
[SUP]1[/SUP] Persons of multiple races (0.3%) or unknown race and ethnicity (4.8%) are not represented in the table but are included as part of the denominator.
[SUP]2[/SUP] Prevalence ratio is calculated as the ratio of the proportion of COVID-NET hospitalizations over the proportion of population in COVID-NET catchment area.

For underlying medical conditions, data were restricted to cases reported during March 1–May 31, 2020, due to delays in reporting. During this time frame, sampling was conducted among hospitalized adults; therefore, weighted percentages are reported. No sampling was conducted among hospitalized children. Among 8,426 sampled adults hospitalized during March 1–May 31 with information on underlying medical conditions, 90.6% had at least one reported underlying medical condition. The most reported underlying medical conditions were hypertension, obesity, metabolic disease, and cardiovascular disease. Among 265 children hospitalized during March 1–May 31 with information on underlying conditions, 50.9% had at least one reported underlying medical condition. The most reported underlying medical conditions were obesity, asthma, and neurologic disease.

Additional data on demographics, signs and symptoms at admission, underlying conditions, interventions, outcomes, and discharge diagnoses, stratified by age, sex, and race and ethnicity, are available.

Additional hospitalization surveillance information: Surveillance Methods | Additional rate data | Additional demographic and clinical data


Mortality Surveillance


The National Center for Health Statistics (NCHS) collects death certificate data from vital statistics offices for all deaths occurring in the United States. Based on death certificate data available on November 12, 2020, the percentage of deaths attributed to pneumonia, influenza, or COVID-19 (PIC) for week 45 was 8.9% and, while it is declining compared with the percentage during week 44, it remains above the epidemic threshold. The weekly percentage of deaths due to PIC declined from a second peak at the end of July through mid- September, remained approximately stable from the week ending September 19 through the week ending October 3, and increased during the first three weeks of October. Data for the most recent two weeks currently show a decline, but percentages for recent weeks will likely increase as more death certificates are processed.

Weekly mortality surveillance data include a combination of machine coded and manually coded causes of death collected from death certificates. The percentage of deaths due to PIC is higher among manually coded records than more rapidly available machine coded records. Due to the additional time needed for manual coding, the initially reported PIC percentages may be lower than percentages calculated from final data.
nchs-mortality-report.gif

resize iconView Larger


*Data during recent weeks are incomplete because of the lag in time between when the death occurred and when the death certificate is completed, submitted to NCHS and processed for reporting purposes. It is possible that a death certificate includes both influenza and COVID as a cause of death; therefore, the number of influenza and COVID coded deaths may not be mutually exclusive.
View Data Table


Additional NCHS mortality surveillance information: Surveillance Methods | Provisional Death Counts for COVID-19
More Information
View Page In:pdf icon 844 KB, 11 Pages
Last Updated Nov. 13, 2020
 
COVIDView.jpg
  1. CASES, DATA & SURVEILLANCE
COVIDView: A Weekly Surveillance Summary of U.S. COVID-19 Activity


Updated Nov. 20, 2020


Note: Due to the Thanksgiving holiday, the week 47 COVIDView report will be released on Monday, November 30, instead of Friday, November 27.​

Download Weekly Summary pdf icon[844 KB, 11 pages]

Key Updates for Week 46, ending November 14, 2020


Nationally, surveillance indicators tracking levels of SARS-CoV-2 virus circulation and associated illnesses have been increasing since September. The percentage of deaths due to pneumonia, influenza and COVID-19 (PIC) increased throughout the month of October. Both COVID-19 related hospitalizations and PIC mortality for the most recent weeks are expected to increase as more data are received.

national-activity-indicators.gif

Download Chart Data excel icon[XLS – 2 KB]
Virus: Public Health, Commercial and Clinical Laboratories


Nationally, the overall percentage of respiratory specimens testing positive for SARS-CoV-2, the virus causing COVID-19, increased from 10.8% during week 45 to 11.9% during week 46. Percent positivity increased among all age groups. Regionally, the percentages of respiratory specimens testing positive for SARS-CoV-2 increased in nine of the ten HHS regions.
Mild/Moderate Illness: Outpatient and Emergency Department Visits


Nationally, the overall percentage of visits to outpatient providers or emergency departments (EDs) for influenza-like illness (ILI) and COVID-like illness (CLI) has been increasing since mid-September; CLI increased in week 46 compared with week 45, while ILI remained stable. All ten surveillance regions reported an increase in at least one indicator of mild/moderate illness.
Severe Disease: Hospitalizations and Deaths


Since the week ending September 19 (MMWR week 38), weekly hospitalization rates among all age groups combined are increasing. Based on death certificate data, the percentage of deaths attributed to PIC for week 46 was 10.7% and, while declining compared with week 45 (14.4%), remains above the epidemic threshold. The weekly percentages of deaths due to PIC increased throughout October and are expected to increase for the most recent weeks as additional data are reported. Hospitalization rates for the most recent week are also expected to increase as additional data are reported.

All data are preliminary and may change as more reports are received. A description of the surveillance systems summarized in COVIDView, including methodology and detailed descriptions of each data component, is available on the surveillance methods page.
Key Points
  • Nationally, all surveillance indicators included in COVIDView are showing increases in SARS-CoV-2 virus circulation and associated illnesses and deaths.
    • The percentage of specimens testing positive for SARS-CoV-2, the percentages of visits to EDs or outpatient providers for ILI and CLI, and COVID-19-associated hospitalization rates have been increasing since September. Hospitalization rates for the most recent week are expected to increase as additional data are reported in future weeks.
    • The percentage of deaths due to PIC has been increasing since the beginning of October. Data for the most recent two weeks currently show a decline, but that is likely to change as additional death certificates are processed.
  • At least one indicator used to monitor COVID-19 activity is increasing in each of the ten HHS regions, and many regions are reporting increases in multiple indicators.
    • The percentages of specimens testing positive for SARS-CoV-2 increased in nine of the ten regions. Region 7 (Central) reported a slight decline in percentage of specimens testing positive for SARS-CoV-2 during 46 compared with week 45.
    • The percentages of visits for ILI, CLI or both increased in all ten regions.
    • Three regions (Regions 5 [Midwest], 7 [Central] and 8 [Mountain]) have a least two surveillance indicators that were higher during week 46 than at any other time during the pandemic.
  • The overall cumulative COVID-19-associated hospitalization rate through the week ending November 14, 2020, was 228.7 hospitalizations per 100,000 population.
    • Since the week ending September 19 (MMWR week 38), weekly hospitalization rates among all age groups combined are increasing. The weekly hospitalization rate among adults 65 years and older is approaching the peak weekly rate observed during the week ending April 18 (MMWR week 16). Data for the most recent weeks may change as additional admissions occurring during those weeks are reported.
    • The age-adjusted hospitalization rate for Hispanic or Latino persons was approximately 4.1 times that of non-Hispanic White persons. Age-adjusted hospitalization rates for non-Hispanic American Indian or Alaska Native persons and non-Hispanic Black persons were approximately 4.0 and 3.7 times those of non-Hispanic White persons, respectively.
  • These surveillance systems aim to provide the most complete data available. Estimates from previous weeks are subject to change as data are updated with the most complete data available.
U.S. Virologic Surveillance


Based on data reported to CDC by public health laboratories and a subset of clinical and commercial laboratories in the United States, 75,643,495 specimens were tested for SARS-CoV-2 using a molecular assay since March 1, 2020. The percentages of specimens testing positive for SARS-CoV-2 each week, based on week of specimen collection, are summarized below.

Nationally, during week 46, 3,435,511 specimens were tested for SARS-CoV-2 for diagnostic purposes, and 407,928 (11.9%) were positive. This is an increase compared with week 45, during which 10.8% of specimens tested were positive. The percentages of specimens testing positive increased among all age groups.

specimens-tested.gif


*Note: Different laboratory types came on board with testing during different weeks. This graph includes public health laboratory data beginning in week 10, clinical laboratory data beginning in week 11 and commercial laboratory data beginning in week 14.
View Data Table


The percentages of specimens testing positive for SARS-CoV-2 increased in nine of the ten HHS regionsexternal icon. Region 7 (Central) reported a slight decrease during week 46 compared with week 45. The regions with the highest percent positivity during week 46 were in the central part of the country, Regions 5 (Midwest, 17.4%), 6 (South Central, 14.7%), 7 (Central, 23.5%) and 8 (Mountain, 18.2%).

Additional virologic surveillance information: Surveillance Methods


Outpatient/Emergency Department Illness


Two syndromic surveillance systems, the U.S. Outpatient Influenza-like Illness Surveillance Network (ILINet) and the National Syndromic Surveillance Project (NSSP), are being used to monitor trends in outpatient and emergency department (ED) visits that may be associated with COVID-19 illness. Each system monitors activity in a slightly different set of providers/facilities and uses a slightly different set of symptoms that may be associated with SARS-CoV-2 virus infection. ILINet provides information about visits to outpatient providers or emergency departments for influenza-like illness (ILI; fever plus cough and/or sore throat) and NSSP provides information about visits to EDs for ILI and COVID-like illness (CLI; fever plus cough and/or shortness of breath or difficulty breathing). Some EDs contribute ILI data to both ILINet and NSSP. Both systems are currently being affected by changes in health care seeking behavior, including increased use of telemedicine and increased social distancing. These changes affect the numbers of people seeking care in the outpatient and ED settings and their reasons for doing so. Syndromic data, including CLI and ILI, should be interpreted with caution and should be evaluated in combination with other sources of surveillance data, especially laboratory testing results, to obtain a complete and accurate picture of respiratory illness.

Nationally, the overall percentages of visits to outpatient providers or EDs for ILI and CLI have been increasing since mid-September. During week 46, the percentages of ED visits captured in NSSP for CLI and ILI were 4.9% and 1.3%, respectively and, compared to week 45, increased (CLI) or remained stable (change of≤0.1%; ILI). In ILINet, 1.5% of visits reported were for ILI, remaining stable compared with week 45 and below the national baseline (2.4% for October 2019 through September 2020; 2.6% since October 2020) for the 31[SUP]st[/SUP] consecutive week. This level of ILI is lower than is typical for ILINet during this time of year.
outpatient-emergency-visits.gif

resize iconView LargerView Data Table


For those aged 5–24 years, the percentage of visits for ILI reported in ILINet decreased during week 46 (1.7%) compared with week 45 (1.9%). For all other age groups, (0–4 years, 25–49 years, 50–64 years, 65 years and older) the percentage of visits for ILI remained stable (change of ≤0.1%). All age groups have experienced an increasing percentage of visits for ILI since September.

resize iconView LargerView Data Table


On a regional levelexternal icon, all ten regions reported an increase in the percentage of visits for CLI during week 46 compared to week 45, and four regions (Regions 2 [New Jersey/New York/Puerto Rico], 3 [Mid-Atlantic], 9 [South West/Coast], and 10 [Pacific Northwest]) also reported an increase in percentage of visits for ILI. The remaining six regions reported a stable (change of ≤0.1%) or decreasing percentage of visits for ILI during week 46 compared with week 45 but have had a generally increasing trend in visits for ILI since September. The percentage of visits for ILI to ILINet providers remained below the region-specific baseline in all regions.

ILI Activity Levels

Data collected in ILINet are used to produce a measure of ILI activity for all 50 states, Puerto Rico, the U.S. Virgin Islands, the District of Columbia, New York City and for each core-based statistical area (CBSA) where at least one provider is located. The mean reported percentage of visits due to ILI for the current week is compared with the mean reported during non-influenza weeks, and the activity levels correspond to the number of standard deviations below, at, or above the mean.

The number of jurisdictions at each activity level during week 46 and the previous week are summarized in the table below.
Activity Level
Week 46
(Week ending
Nov. 14, 2020)
Week 45
(Week ending
Nov. 7, 2020)
Week 46
(Week ending
Nov. 14, 2020)
Week 45
(Week ending
Nov. 7, 2020)
Very High0101
High0033
Moderate0065
Low235641
Minimal5251515554
Insufficient Data10349327

[TD="colspan: 2"] Number of Jurisdictions [/TD]
[TD="colspan: 2"] Number of CBSAs [/TD]

*Note: Data collected in ILINet may disproportionally represent certain populations within a state and may not accurately depict the full picture of respiratory disease activity for the whole state. Differences in the data presented here by CDC and independently by some state health departments likely represent differing levels of data completeness with data presented by the state likely being the more complete.

Additional information about medically attended outpatient and emergency department visits for ILI and CLI: Surveillance Methods

Hospitalizations


The COVID-19-Associated Hospitalization Surveillance Network (COVID-NET) conducts population-based surveillance for laboratory-confirmed COVID-19-associated hospitalizations in select counties participating in the Emerging Infections Program (EIP) and the Influenza Hospitalization Surveillance Project (IHSP).

A total of 74,573 laboratory-confirmed COVID-19-associated hospitalizations were reported by sites between March 1, 2020, and November 14, 2020. The overall cumulative hospitalization rate was 228.7 per 100,000 population.

Since the week ending September 19 (MMWR week 38), weekly hospitalization rates among all age groups combined are increasing. The weekly hospitalization rate among adults 65 years and older is approaching the peak weekly rate observed during the week ending April 18 (MMWR week 16). The hospitalization rates for the most recent week are expected to increase as additional data are reported in future weeks.
lab-confirmed-hospitalizations-weekly.gif

resize iconView Larger
Among the 74,573 laboratory-confirmed COVID-19-associated hospitalizations, 71,211 (95.5%) had information on race and ethnicity, while collection of race and ethnicity was still pending for 3,362 (4.5%) cases. When examining overall age-adjusted rates by race and ethnicity, the rate for Hispanic or Latino persons was approximately 4.1 times the rate among non-Hispanic White persons. Rates for non-Hispanic American Indian or Alaska Native persons and non-Hispanic Black persons were approximately 4.0 and 3.7 times the rate among non-Hispanic White persons, respectively.


When examining age-stratified crude hospitalization rates by race and ethnicity, compared with non-Hispanic White persons in the same age group, crude hospitalization rates were 6.0 times higher among Hispanic or Latino persons aged 0–17 years; 7.2 times higher among non-Hispanic American Indian or Alaska Native persons 18–49 years; 5.0 times higher among non-Hispanic American Indian or Alaska Native persons and Hispanic or Latino persons aged 50–64 years; and 3.0 times higher among non-Hispanic Black persons aged ≥ 65 years.

Age Category
Rate[SUP]1[/SUP]Rate Ratio[SUP]2,3[/SUP]Rate[SUP]1[/SUP]Rate Ratio[SUP]2,3[/SUP]Rate[SUP]1[/SUP]Rate Ratio[SUP]2,3[/SUP]Rate[SUP]1[/SUP]Rate Ratio[SUP]2,3[/SUP]Rate[SUP]1[/SUP]Rate Ratio[SUP]2,3[/SUP]
0—17 years21.43.924.34.433.26.010.41.95.51.0
18—49 years358.07.2236.24.8348.87.075.11.549.71.0
50—64 years779.05.0655.54.2767.15.0217.71.4154.71.0
65+ years979.92.31285.33.01064.92.5424.71.0425.11.0
Overall rate[SUP]4[/SUP] (age-adjusted)459.34.0429.33.7465.44.1139.51.2114.61.0

[TD="colspan: 2"] Non-Hispanic
American Indian or Alaska Native
[/TD]
[TD="colspan: 2"] Non-Hispanic Black [/TD]
[TD="colspan: 2"] Hispanic or Latino [/TD]
[TD="colspan: 2"] Non-Hispanic Asian or Pacific Islander [/TD]
[TD="colspan: 2"] Non-Hispanic White [/TD]
[SUP]1[/SUP]COVID-19-associated hospitalization rates by race and ethnicity are calculated using COVID-NET hospitalizations with known race and ethnicity for the numerator and NCHS bridged-race population estimates for the denominator.
[SUP]2[/SUP] For each age category, rate ratios are the ratios between crude hospitalization rates within each racial and ethnic group and the crude hospitalization rate among non-Hispanic White persons in the same age category.
[SUP]3[/SUP] The highest rate ratio in each age category is presented in bold.
[SUP]4[/SUP] Overall rates are adjusted to account for differences in age distributions within race and ethnicity strata in the COVID-NET catchment area; the age strata used for the adjustment include 0–17, 18–49, 50–64, 65-74, 75-84 and 85+ years.

Non-Hispanic White persons and non-Hispanic Black persons represented the highest proportions of hospitalizations reported to COVID-NET, followed by Hispanic or Latino, non-Hispanic Asian or Pacific Islander, and non-Hispanic American Indian or Alaska Native persons. However, some racial and ethnic groups are disproportionately represented among hospitalizations compared with the overall population of the catchment area. Prevalence ratios were highest among non-Hispanic American Indian or Alaska Native persons, followed by non-Hispanic Black persons and Hispanic or Latino persons.
1.3%30.2%22.5%5.2%35.6%
0.7%17.9%14.1%8.9%58.5%
1.91.71.60.60.6
[SUP]1[/SUP]Persons of multiple races (0.3%) or unknown race and ethnicity (4.9%) are not represented in the table but are included as part of the denominator.
[SUP]2[/SUP] Prevalence ratio is calculated as the ratio of the proportion of COVID-NET hospitalizations over the proportion of population in COVID-NET catchment area.

For underlying medical conditions, data were restricted to cases reported during March 1–May 31, 2020, due to delays in reporting. During this time frame, sampling was conducted among hospitalized adults; therefore, weighted percentages are reported. No sampling was conducted among hospitalized children. Among 8,438 sampled adults hospitalized during March 1–May 31 with information on underlying medical conditions, 90.6% had at least one reported underlying medical condition. The most reported underlying medical conditions were hypertension, obesity, metabolic disease, and cardiovascular disease. Among 265 children hospitalized during March 1–May 31 with information on underlying conditions, 50.9% had at least one reported underlying medical condition. The most reported underlying medical conditions were obesity, asthma, and neurologic disease.

Additional data on demographics, signs and symptoms at admission, underlying conditions, interventions, outcomes, and discharge diagnoses, stratified by age, sex, and race and ethnicity, are available.

Additional hospitalization surveillance information: Surveillance Methods | Additional rate data | Additional demographic and clinical data


Mortality Surveillance


The National Center for Health Statistics (NCHS) collects death certificate data from vital statistics offices for all deaths occurring in the United States. Based on death certificate data available on November 19, 2020, the percentage of deaths attributed to pneumonia, influenza, or COVID-19 (PIC) for week 46 was 10.7% and, while it is declining compared with the percentage during week 44, it remains above the epidemic threshold. Among the 2,187 PIC deaths reported for week 46, 1,260 had COVID-19 listed as an underlying or contributing cause of death on the death certificate and two listed influenza, indicating that the current increase in PIC mortality is due primarily to COVID-19 and not influenza.

The weekly percentage of deaths due to PIC declined from a second peak at the end of July through mid- September, remained approximately stable from the week ending September 19 through the week ending October 3, and increased throughout the month of October. Data for the most recent two weeks currently show a decline, but percentages for recent weeks will likely increase as more death certificates are processed. Weekly mortality surveillance data include a combination of machine coded and manually coded causes of death collected from death certificates. The percentage of deaths due to PIC is higher among manually coded records than more rapidly available machine coded records. Due to the additional time needed for manual coding, the initially reported PIC percentages may be lower than percentages calculated from final data.
nchs-mortality-report.gif

resize iconView Larger


*Data during recent weeks are incomplete because of the lag in time between when the death occurred and when the death certificate is completed, submitted to NCHS and processed for reporting purposes. It is possible that a death certificate includes both influenza and COVID as a cause of death; therefore, the number of influenza and COVID coded deaths may not be mutually exclusive.
View Data Table


Additional NCHS mortality surveillance information: Surveillance Methods | Provisional Death Counts for COVID-19
More Information
View Page In:pdf icon 956 KB, 11 Pages
Last Updated Nov. 20, 2020

https://www.cdc.gov/coronavirus/2019-ncov/covid-data/covidview/
 
COVIDView Summary ending November 21, 2020


Updated Nov. 30, 2020


Download Weekly Summary pdf icon[989 KB, 10 pages]
Key Updates for Week 47, ending November 21, 2020


Nationally, surveillance indicators tracking levels of SARS-CoV-2 virus circulation and associated illnesses have been increasing since September; however, the percentage of specimens testing positive for SARS-CoV-2 decreased slightly during week 47. The percentage of deaths due to pneumonia, influenza and COVID-19 (PIC) increased during October and early November. Both COVID-19-associated hospitalizations and PIC mortality for the most recent weeks are expected to increase as more data are received.

national-activity-indicators.gif

Download Chart Data excel icon[XLS – 2 KB]
Virus: Public Health, Commercial and Clinical Laboratories


Nationally, the overall percentage of respiratory specimens testing positive for SARS-CoV-2, the virus causing COVID-19, decreased from 12.0% during week 46 to 10.6% during week 47. Percent positivity decreased among all age groups. Regionally, the percentages of respiratory specimens testing positive for SARS-CoV-2 decreased in eight of the ten HHS regions.
Mild/Moderate Illness: Outpatient and Emergency Department Visits


Nationally, the overall percentage of visits to outpatient providers or emergency departments (EDs) for influenza-like illness (ILI) and COVID-like illness (CLI) has been increasing since mid-September; CLI increased in week 47 compared with week 46, while ILI remained stable (change of ≤0.1%). Eight of ten surveillance regions reported an increase in at least one indicator of mild/moderate illness.
Severe Disease: Hospitalizations and Deaths


The overall weekly hospitalization rate is at its highest point in the pandemic, with steep increases in individuals aged 65 years and older. Based on death certificate data, the percentage of deaths attributed to PIC for week 47 was 11.3% and, while declining compared with week 46 (15.2%), remains above the epidemic threshold. The weekly percentages of deaths due to PIC increased for five weeks from early October through early November and are expected to increase for the most recent weeks as additional data are reported. Hospitalization rates for the most recent week are also expected to increase as additional data are reported.

All data are preliminary and may change as more reports are received. A description of the surveillance systems summarized in COVIDView, including methodology and detailed descriptions of each data component, is available on the surveillance methods page.
Key Points
  • Nationally, the surveillance indicators included in COVIDView have been showing increases in SARS-CoV-2 virus circulation and associated illnesses and deaths in recent months.
    • The percentage of specimens testing positive for SARS-CoV-2 has been increasing since September but decreased slightly during week 47 compared with week 46.
    • The percentages of visits to EDs or outpatient providers for ILI and CLI, and COVID-19-associated hospitalization rates have been increasing since September. Hospitalization rates for the most recent week are expected to increase as additional data are reported in future weeks.
    • The percentage of deaths due to PIC has been increasing since the beginning of October. Data for the most recent two weeks currently show a decline, but that is likely to change as additional death certificates are processed.
  • At least one indicator used to monitor COVID-19 activity is increasing in eight of ten HHS regions, and many regions are reporting increases in multiple indicators.
    • The percentages of specimens testing positive for SARS-CoV-2 increased in two of ten regions – Regions 9 (South West/Coast) and 10 (Pacific Northwest).
    • The percentages of visits for ILI, CLI or both increased in eight of ten regions – Regions 1 (New England), 2 (New Jersey/New York/Puerto Rico), 3 (Mid-Atlantic), 4 (Southeast), 6 (South Central), 8 (Mountain), 9 (South West/Coast) and 10 (Pacific Northwest).
    • During the past 2 weeks, three regions (Regions 5 [Midwest], 7 [Central] and 8 [Mountain]) have had a least one surveillance indicator that was higher than at any other time during the pandemic. However, during week 47 compared with week 46, all three of these regions reported a decline in percentage of specimens testing positive for SARS-CoV-2, and two of these regions (Regions 5 [Midwest] and 7 [Central]) also reported stable or declining indicators for mild to moderate respiratory illness (ILI and CLI).
  • The overall cumulative COVID-19-associated hospitalization rate through the week ending November 21, 2020, was 243.8 hospitalizations per 100,000 population.
    • The overall weekly hospitalization rate is at its highest point in the pandemic, with steep increases in individuals aged 65 years and older. All COVID-NET sites have reported increasing hospitalization rates in recent weeks. Rates for the most recent weeks are expected to increase as additional admissions occurring during those weeks are reported.
    • The age-adjusted hospitalization rates for Hispanic or Latino persons and non-Hispanic American Indian or Alaska Native persons were approximately 3.9 times that of non-Hispanic White persons. Age-adjusted hospitalization rates for non-Hispanic Black persons were approximately 3.6 times those of non-Hispanic White persons.
  • These surveillance systems aim to provide the most complete data available. Estimates from previous weeks are subject to change as data are updated with the most complete data available.
U.S. Virologic Surveillance


Based on data reported to CDC by public health laboratories and a subset of clinical and commercial laboratories in the United States, 79,948,333 specimens were tested for SARS-CoV-2 using a molecular assay since March 1, 2020. The percentages of specimens testing positive for SARS-CoV-2 each week, based on week of specimen collection, are summarized below.

Nationally, during week 47, 3,769,481 specimens were tested for SARS-CoV-2 for diagnostic purposes, and 399,197 (10.6%) were positive. This is a decrease compared with week 46, during which 12.0% of specimens tested were positive. The percentages of specimens testing positive decreased among all age groups.

specimens-tested.gif


*Note: Different laboratory types came on board with testing during different weeks. This graph includes public health laboratory data beginning in week 10, clinical laboratory data beginning in week 11 and commercial laboratory data beginning in week 14.
View Data Table


The percentages of specimens testing positive for SARS-CoV-2 increased in two (Regions 9 [West South/Central] and 10 [Pacific Northwest]) of the ten HHS regionsexternal icon. The regions with the highest percent positivity during week 47 were in the central part of the country, Regions 5 (Midwest, 14.4%), 6 (South Central, 14.2%), 7 (Central, 19.3%) and 8 (Mountain, 16.4%); all reported a decline in percent positivity in week 47 compared with week 46.

Additional virologic surveillance information: Surveillance Methods


Outpatient/Emergency Department Illness


Two syndromic surveillance systems, the U.S. Outpatient Influenza-like Illness Surveillance Network (ILINet) and the National Syndromic Surveillance Project (NSSP), are being used to monitor trends in outpatient and emergency department (ED) visits that may be associated with COVID-19 illness. Each system monitors activity in a slightly different set of providers/facilities and uses a slightly different set of symptoms that may be associated with SARS-CoV-2 virus infection. ILINet provides information about visits to outpatient providers or emergency departments for influenza-like illness (ILI; fever plus cough and/or sore throat) and NSSP provides information about visits to EDs for ILI and COVID-like illness (CLI; fever plus cough and/or shortness of breath or difficulty breathing). Some EDs contribute ILI data to both ILINet and NSSP. Both systems are currently being affected by changes in health care seeking behavior, including increased use of telemedicine and increased social distancing. These changes affect the numbers of people seeking care in the outpatient and ED settings and their reasons for doing so. Syndromic data, including CLI and ILI, should be interpreted with caution and should be evaluated in combination with other sources of surveillance data, especially laboratory testing results, to obtain a complete and accurate picture of respiratory illness.

Nationally, the overall percentages of visits to outpatient providers or EDs for ILI and CLI have been increasing since mid-September. During week 47, the percentages of ED visits captured in NSSP for CLI and ILI were 5.9% and 1.4%, respectively and, compared to week 46, increased (CLI) or remained stable (change of ≤0.1%; ILI). In ILINet, 1.6% of visits reported were for ILI, remaining stable (change of ≤0.1%) compared with week 46 and below the national baseline (2.4% for October 2019 through September 2020; 2.6% since October 2020) for the 32[SUP]nd[/SUP] consecutive week. This level of ILI is lower than is typical for ILINet during this time of year.
outpatient-emergency-visits.gif

resize iconView LargerView Data Table


The percentage of visits for ILI reported in ILINet during week 47 remained stable (change of ≤0.1%) compared with week 46 for all age groups (0–4 years, 5–24 years, 25–49 years, 50–64 years, 65 years and older). All age groups have experienced an increasing percentage of visits for ILI since September.

resize iconView LargerView Data Table


On a regional levelexternal icon, eight regions (Regions 1 [New England], 2 [New Jersey/New York/Puerto Rico], 3 [Mid-Atlantic], 4 [Southeast], 6 [South Central], 8 [Mountain], 9 [South West/Coast], 10 [Pacific Northwest]) reported an increase in the percentage of visits for CLI during week 47 compared to week 46, and three regions (Regions 2 [New Jersey/New York/Puerto Rico], 4 [Southeast], 9 [South West/Coast]) also reported an increase in percentage of visits for ILI. The remaining seven regions reported a stable (change of ≤0.1%) or decreasing percentage of visits for ILI during week 47 compared with week 46 but have had a generally increasing trend in visits for ILI since September. The percentage of visits for ILI to ILINet providers remained below the region-specific baseline in all regions.

ILI Activity Levels

Data collected in ILINet are used to produce a measure of ILI activity for all 50 states, Puerto Rico, the U.S. Virgin Islands, the District of Columbia, New York City and for each core-based statistical area (CBSA) where at least one provider is located. The mean reported percentage of visits due to ILI for the current week is compared with the mean reported during non-influenza weeks, and the activity levels correspond to the number of standard deviations below, at, or above the mean.

The number of jurisdictions at each activity level during week 47 and the previous week are summarized in the table below.
Activity Level
Week 47
(Week ending
Nov. 21, 2020)
Week 46
(Week ending
Nov. 14, 2020)
Week 47
(Week ending
Nov. 21, 2020)
Week 46
(Week ending
Nov. 14, 2020)
Very High0000
High0024
Moderate10156
Low234258
Minimal5152524534
Insufficient Data10346327

[TD="colspan: 2"] Number of Jurisdictions [/TD]
[TD="colspan: 2"] Number of CBSAs [/TD]
*Note: Data collected in ILINet may disproportionally represent certain populations within a state and may not accurately depict the full picture of respiratory disease activity for the whole state. Differences in the data presented here by CDC and independently by some state health departments likely represent differing levels of data completeness with data presented by the state likely being the more complete.

Additional information about medically attended outpatient and emergency department visits for ILI and CLI: Surveillance Methods

Hospitalizations


The COVID-19-Associated Hospitalization Surveillance Network (COVID-NET) conducts population-based surveillance for laboratory-confirmed COVID-19-associated hospitalizations in select counties participating in the Emerging Infections Program (EIP) and the Influenza Hospitalization Surveillance Project (IHSP).

A total of 79,501 laboratory-confirmed COVID-19-associated hospitalizations were reported by sites between March 1, 2020, and November 21, 2020. The overall cumulative hospitalization rate was 243.8 per 100,000 population. The overall weekly hospitalization rate is at its highest point in the pandemic, with steep increases in individuals aged 65 years and older. All COVID-NET sites have reported increasing hospitalization rates in recent weeks. The hospitalization rates for the most recent week are expected to increase as additional data are reported in future weeks.
lab-confirmed-hospitalizations-weekly.gif

resize iconView Larger
Among the 79,501 laboratory-confirmed COVID-19-associated hospitalizations, 76,621 (96.4%) had information on race and ethnicity, while collection of race and ethnicity was still pending for 2,880 (3.6%) cases. When examining overall age-adjusted rates by race and ethnicity, the rates for both Hispanic or Latino persons and American Indian or Alaska Native persons were approximately 3.9 times the rate among non-Hispanic White persons. Rates for non-Hispanic Black persons were approximately 3.6 times the rate among non-Hispanic White persons.


When examining age-stratified crude hospitalization rates by race and ethnicity, compared with non-Hispanic White persons in the same age group, crude hospitalization rates were 5.7 times higher among Hispanic or Latino persons aged 0–17 years; 7.0 times higher among non-Hispanic American Indian or Alaska Native persons aged 18–49 years; 4.9 times higher among non-Hispanic American Indian or Alaska Native persons aged 50–64 years; and 2.9 times higher among non-Hispanic Black persons aged ≥ 65 years.
Age Category
Rate[SUP]1[/SUP]Rate Ratio[SUP]2,3[/SUP]Rate[SUP]1[/SUP]Rate Ratio[SUP]2,3[/SUP]Rate[SUP]1[/SUP]Rate Ratio[SUP]2,3[/SUP]Rate[SUP]1[/SUP]Rate Ratio[SUP]2,3[/SUP]Rate[SUP]1[/SUP]Rate Ratio[SUP]2,3[/SUP]
0—17 years21.43.126.33.836.95.311.11.67.01.0
18—49 years399.96.7259.94.4381.56.484.31.459.31.0
50—64 years869.44.6725.23.9876.44.7244.31.3187.01.0
65+ years1148.22.21430.82.71279.92.4492.70.9525.21.0
Overall rate[SUP]4[/SUP] (age-adjusted)521.03.7475.53.4533.73.8158.81.1140.01.0

[TD="colspan: 2"] Non-Hispanic
American Indian or Alaska Native
[/TD]
[TD="colspan: 2"] Non-Hispanic Black [/TD]
[TD="colspan: 2"] Hispanic or Latino [/TD]
[TD="colspan: 2"] Non-Hispanic Asian or Pacific Islander [/TD]
[TD="colspan: 2"] Non-Hispanic White [/TD]
[SUP]1[/SUP]COVID-19-associated hospitalization rates by race and ethnicity are calculated using COVID-NET hospitalizations with known race and ethnicity for the numerator and NCHS bridged-race population estimates for the denominator.
[SUP]2[/SUP] For each age category, rate ratios are the ratios between crude hospitalization rates within each racial and ethnic group and the crude hospitalization rate among non-Hispanic White persons in the same age category.
[SUP]3[/SUP] The highest rate ratio in each age category is presented in bold.
[SUP]4[/SUP] Overall rates are adjusted to account for differences in age distributions within race and ethnicity strata in the COVID-NET catchment area; the age strata used for the adjustment include 0–17, 18–49, 50–64, 65-74, 75-84 and 85+ years.

Non-Hispanic White persons and non-Hispanic Black persons represented the highest proportions of hospitalizations reported to COVID-NET, followed by Hispanic or Latino, non-Hispanic Asian or Pacific Islander, and non-Hispanic American Indian or Alaska Native persons. However, some racial and ethnic groups are disproportionately represented among hospitalizations compared with the overall population of the catchment area. Prevalence ratios were highest among non-Hispanic American Indian or Alaska Native persons, followed by non-Hispanic Black persons and Hispanic or Latino persons.
1.3%29.7%22.1%5.1%36.4%
0.7%17.9%14.1%8.9%58.5%
1.91.71.60.60.6
[SUP]1[/SUP]Persons of multiple races (0.3%) or unknown race and ethnicity (5.0%) are not represented in the table but are included as part of the denominator.
[SUP]2[/SUP] Prevalence ratio is calculated as the ratio of the proportion of COVID-NET hospitalizations over the proportion of population in COVID-NET catchment area.

For underlying medical conditions, data were restricted to cases reported during March 1–May 31, 2020, due to delays in reporting. During this time frame, sampling was conducted among hospitalized adults; therefore, weighted percentages are reported. No sampling was conducted among hospitalized children. Among 8,441 sampled adults hospitalized during March 1–May 31 with information on underlying medical conditions, 90.6% had at least one reported underlying medical condition. The most reported underlying medical conditions were hypertension (59.0%), obesity (46.2%), metabolic disease (42.9%), and cardiovascular disease (34.2%). Among 265 children hospitalized during March 1–May 31 with information on underlying conditions, 50.9% had at least one reported underlying medical condition. The most reported underlying medical conditions were obesity (43.2%), asthma (13.2%), and neurologic disease (12.8%).

Additional data on demographics, signs and symptoms at admission, underlying conditions, interventions, outcomes, and discharge diagnoses, stratified by age, sex, and race and ethnicity, are available.

Additional hospitalization surveillance information: Surveillance Methods | Additional rate data | Additional demographic and clinical data


Mortality Surveillance


The National Center for Health Statistics (NCHS) collects death certificate data from vital statistics offices for all deaths occurring in the United States. Based on death certificate data available on November 25, 2020, the percentage of deaths attributed to pneumonia, influenza, or COVID-19 (PIC) for week 47 was 11.3% and, while it declined compared with the percentage during week 46 (15.2%), it remains above the epidemic threshold of 6.3%. Among the 2,000 PIC deaths reported for week 47, 1,181 had COVID-19 listed as an underlying or contributing cause of death on the death certificate and five listed influenza, indicating that the current increase in PIC mortality is due primarily to COVID-19 and not influenza.

The weekly percentage of deaths due to PIC declined from a second peak at the end of July through mid- September, remained stable from the week ending September 19 through the week ending October 3, and increased for five weeks from early October through early November. Data for the most recent two weeks currently show a decline, but percentages for recent weeks will likely increase as more death certificates are processed. Weekly mortality surveillance data include a combination of machine coded and manually coded causes of death collected from death certificates. The percentage of deaths due to PIC is higher among manually coded records than more rapidly available machine coded records. Due to the additional time needed for manual coding, the initially reported PIC percentages may be lower than percentages calculated from final data.
nchs-mortality-report.gif

resize iconView Larger


*Data during recent weeks are incomplete because of the lag in time between when the death occurred and when the death certificate is completed, submitted to NCHS and processed for reporting purposes. It is possible that a death certificate includes both influenza and COVID as a cause of death; therefore, the number of influenza and COVID coded deaths may not be mutually exclusive.
View Data Table


Additional NCHS mortality surveillance information: Surveillance Methods | Provisional Death Counts for COVID-19
More Information
View Page In:pdf icon 989 KB, 10 pages
Last Updated Nov. 30, 2020
 
COVIDView Summary ending November 28, 2020


Updated Dec. 4, 2020


Download Weekly Summary pdf icon[896 KB, 10 pages]
Key Updates for Week 48, ending November 28, 2020


Nationally, surveillance indicators tracking levels of SARS-CoV-2 virus circulation and associated illnesses have been increasing since September. The percentage of deaths due to pneumonia, influenza and COVID-19 (PIC) increased during October and through mid-November. Both COVID-19-associated hospitalizations and PIC mortality for the most recent weeks are expected to increase as more data are received.

national-activity-indicators.gif

Download Chart Data excel icon[XLS – 2 KB]
Virus: Public Health, Commercial and Clinical Laboratories


Nationally, the overall percentage of respiratory specimens testing positive for SARS-CoV-2, the virus causing COVID-19, increased from 10.7% during week 47 to 11.7% during week 48. Percent positivity increased among all age groups. Regionally, the percentages of respiratory specimens testing positive for SARS-CoV-2 increased in nine of the ten HHS regions.
Mild/Moderate Illness: Outpatient and Emergency Department Visits


Nationally, the overall percentage of visits to outpatient providers or emergency departments (EDs) for influenza-like illness (ILI) and COVID-like illness (CLI) has been increasing since mid-September; CLI and ILI remained stable (change of ≤0.1%) during week 48 compared with week 47. Four of ten surveillance regions reported an increase in at least one indicator of mild/moderate illness.
Severe Disease: Hospitalizations and Deaths


The overall weekly hospitalization rate is at its highest point since the beginning of the pandemic, with steep increases in adults aged 65 years and older. Based on death certificate data, the percentage of deaths attributed to PIC for week 48 was 12.8% and, while declining compared with week 47 (18.6%), remains above the epidemic threshold. The weekly percentages of deaths due to PIC increased for seven weeks from early October through mid-November and are expected to increase for the most recent weeks as additional data are reported. Hospitalization rates for the most recent week are also expected to increase as additional data are reported.

All data are preliminary and may change as more reports are received. A description of the surveillance systems summarized in COVIDView, including methodology and detailed descriptions of each data component, is available on the surveillance methods page.
Key Points
  • Nationally, the surveillance indicators included in COVIDView have been showing increases in SARS-CoV-2 virus circulation and associated illnesses and deaths in recent months.
    • The percentage of specimens testing positive for SARS-CoV-2 has been increasing since September. While a slight decrease was reported during week 47 compared with week 46, percent positivity has increased among all age groups in week 48 compared with week 47.
    • The percentages of visits to EDs or outpatient providers for ILI and CLI, and COVID-19-associated hospitalization rates have been increasing since September.
    • The percentage of deaths due to PIC has been increasing since the beginning of October. The percentages for 46 and 47 now exceed the percentage of deaths due to PIC observed during the summer peak. Data for the most recent week currently shows a decline, but that is likely to change as additional death certificates are processed.
  • At least one indicator used to monitor COVID-19 activity is increasing in nine of ten HHS regions, and many regions are reporting increases in multiple indicators.
    • The percentages of specimens testing positive for SARS-CoV-2 increased in nine of ten regions – Regions 2 (New Jersey/New York/Puerto Rico), 3 (Mid-Atlantic), 4 (Southeast), 5 (Midwest), 6 (South Central), 7 (Central), 8 (Mountain), 9 (South West/Coast), and 10 (Pacific Northwest).
    • The percentages of visits for ILI, CLI or both increased in four of ten regions – Regions 2 (New Jersey/New York/Puerto Rico), 3 (Mid-Atlantic), 4 (Southeast), and 9 (South West/Coast).
  • The overall cumulative COVID-19-associated hospitalization rate through the week ending November 28, 2020, was 262.8 hospitalizations per 100,000 population.
    • The overall weekly hospitalization rate is at its highest point since the beginning of the pandemic, with steep increases in adults aged 65 years and older. All COVID-NET sites have reported increasing hospitalization rates in recent weeks. Rates for the most recent weeks are expected to increase as additional admissions occurring during those weeks are reported.
    • The rates for Hispanic or Latino persons, non-Hispanic American Indian or Alaska Native persons, and non-Hispanic Black persons were approximately 3.8, 3.7, and 3.4 times the rate among non-Hispanic White persons, respectively.
  • These surveillance systems aim to provide the most complete data available. Estimates from previous weeks are subject to change as data are updated with the most complete data available.
U.S. Virologic Surveillance


Based on data reported to CDC by public health laboratories and a subset of clinical and commercial laboratories in the United States, 83,949,946 specimens were tested for SARS-CoV-2 using a molecular assay since March 1, 2020. The percentages of specimens testing positive for SARS-CoV-2 each week, based on week of specimen collection, are summarized below.

Nationally, during week 48, of 3,005,511 specimens tested for SARS-CoV-2 for diagnostic purposes, 350,378 (11.7%) were positive. This is an increase compared with week 47, during which 10.7% of specimens tested were positive. The percentages of specimens testing positive increased among all age groups.

specimens-tested.gif


*Note: Different laboratory types came on board with testing during different weeks. This graph includes public health laboratory data beginning in week 10, clinical laboratory data beginning in week 11 and commercial laboratory data beginning in week 14.
View Data Table


The percentages of specimens testing positive for SARS-CoV-2 increased in nine of ten HHS regionsexternal icon – Regions 2 (New Jersey/New York/Puerto Rico), 3 (Mid-Atlantic), 4 (Southeast), 5 (Midwest), 6 (South Central), 7 (Central), 8 (Mountain), 9 (South West/Coast), and 10 (Pacific Northwest). The regions with the highest percent positivity during week 48 were in the central part of the country, Regions 5 (Midwest, 14.8%), 6 (South Central, 15.2%), 7 (Central, 19.4%) and 8 (Mountain, 15.6%).

Additional virologic surveillance information: Surveillance Methods


Outpatient/Emergency Department Illness


Two syndromic surveillance systems, the U.S. Outpatient Influenza-like Illness Surveillance Network (ILINet) and the National Syndromic Surveillance Project (NSSP), are being used to monitor trends in outpatient and emergency department (ED) visits that may be associated with COVID-19 illness. Each system monitors activity in a slightly different set of providers/facilities and uses a slightly different set of symptoms that may be associated with SARS-CoV-2 virus infection. ILINet provides information about visits to outpatient providers or emergency departments for influenza-like illness (ILI; fever plus cough and/or sore throat) and NSSP provides information about visits to EDs for ILI and COVID-like illness (CLI; fever plus cough and/or shortness of breath or difficulty breathing). Some EDs contribute ILI data to both ILINet and NSSP. Both systems are currently being affected by changes in health care seeking behavior, including increased use of telemedicine and increased social distancing. These changes affect the numbers of people seeking care in the outpatient and ED settings and their reasons for doing so. Syndromic data, including CLI and ILI, should be interpreted with caution and should be evaluated in combination with other sources of surveillance data, especially laboratory testing results, to obtain a complete and accurate picture of respiratory illness.

Nationally, the overall percentages of visits to outpatient providers or EDs for ILI and CLI have been increasing since mid-September, with the greatest increase occurring for the percentage of visits for CLI. During week 48, the percentages of ED visits captured in NSSP for CLI and ILI were 6.0% and 1.4%, respectively, and both remained stable (change of ≤0.1%) compared with week 47. In ILINet, 1.6% of visits reported were for ILI, remaining stable (change of ≤0.1%) compared with week 47 and below the national baseline (2.4% for October 2019 through September 2020; 2.6% since October 2020) for the 33[SUP]rd[/SUP] consecutive week. This level of ILI is lower than is typical for ILINet during this time of year.
outpatient-emergency-visits.gif

resize iconView LargerView Data Table


The percentage of visits for ILI reported in ILINet during week 48 remained stable (change of ≤0.1%) compared with week 47 for all age groups (0–4 years, 5–24 years, 25–49 years, 50–64 years, 65 years and older). All age groups have experienced an increasing percentage of visits for ILI since September.

resize iconView LargerView Data Table


On a regional levelexternal icon, four regions (Regions 2 [New Jersey/New York/Puerto Rico], 3 [Mid-Atlantic], 4 [Southeast], 9 [South West/Coast]) reported an increase in at least one indicator of mild to moderate illness (CLI and/or ILI) during week 48 compared with week 47, and two of these regions (Region 3 [Mid-Atlantic] and 9 [South West/Coast]) reported an increase in all indicators. Five regions (Regions 5 [Midwest], 6 [South Central], 7[Central], 8 [Mountain] and 10 [Pacific Northwest) reported a decrease in at least one indicator of mild to moderate illness (CLI and/or ILI) Region 1 (Northeast) reported a stable (change of ≤0.1%) level of CLI and ILI during week 48 compared with week 47. The percentage of visits for ILI to ILINet providers remained below the region-specific baseline in all regions.

ILI Activity Levels

Data collected in ILINet are used to produce a measure of ILI activity for all 50 states, Puerto Rico, the U.S. Virgin Islands, the District of Columbia, New York City and for each core-based statistical area (CBSA) where at least one provider is located. The mean reported percentage of visits due to ILI for the current week is compared with the mean reported during non-influenza weeks, and the activity levels correspond to the number of standard deviations below, at, or above the mean.

The number of jurisdictions at each activity level during week 48 and the previous week are summarized in the table below.
Activity Level
Week 48 (Week ending Nov. 28, 2020)Week 47 (Week ending Nov. 21, 2020)Week 48 (Week ending Nov. 28, 2020)Week 47 (Week ending Nov. 21, 2020)
Very High0000
High0035
Moderate001416
Low525640
Minimal4753511551
Insufficient Data30345317

[TD="colspan: 2"] Number of Jurisdictions [/TD]
[TD="colspan: 2"] Number of CBSAs [/TD]

*Note: Data collected in ILINet may disproportionally represent certain populations within a state and may not accurately depict the full picture of respiratory disease activity for the whole state. Differences in the data presented here by CDC and independently by some state health departments likely represent differing levels of data completeness with data presented by the state likely being the more complete.

Additional information about medically attended outpatient and emergency department visits for ILI and CLI: Surveillance Methods

Hospitalizations


The COVID-19-Associated Hospitalization Surveillance Network (COVID-NET) conducts population-based surveillance for laboratory-confirmed COVID-19-associated hospitalizations in select counties participating in the Emerging Infections Program (EIP) and the Influenza Hospitalization Surveillance Project (IHSP).

A total of 85,678 laboratory-confirmed COVID-19-associated hospitalizations were reported by sites between March 1, 2020, and November 28, 2020. The overall cumulative hospitalization rate was 262.8 per 100,000 population. The overall weekly hospitalization rate is at its highest point since the beginning of the pandemic, with steep increases in adults aged 65 years and older. All COVID-NET sites have reported increasing hospitalization rates in recent weeks. The hospitalization rates for the most recent week are expected to increase as additional data are reported in future weeks.
lab-confirmed-hospitalizations-weekly.gif

resize iconView Larger
Among the 85,678 laboratory-confirmed COVID-19-associated hospitalizations, 82,640 (96.5%) had information on race and ethnicity, while collection of race and ethnicity was still pending for 3,038 (3.5%) cases. When examining overall age-adjusted rates by race and ethnicity, the rates for Hispanic or Latino persons, non-Hispanic American Indian or Alaska Native persons, and non-Hispanic Black persons were approximately 3.8, 3.7, and 3.4 times the rate among non-Hispanic White persons, respectively.


When examining age-stratified crude hospitalization rates by race and ethnicity, compared with non-Hispanic White persons in the same age group, the highest crude hospitalization rate ratios for each age group were as follows: 5.3 times higher among Hispanic or Latino persons aged 0–17 years; 6.7 times higher among non-Hispanic American Indian or Alaska Native persons aged 18–49 years; 4.7 times higher among Hispanic or Latino persons aged 50–64 years; and 2.7 times higher among non-Hispanic Black persons aged ≥65 years.

Age Category
Rate[SUP]1[/SUP]Rate Ratio[SUP]2,3[/SUP]Rate[SUP]1[/SUP]Rate Ratio[SUP]2,3[/SUP]Rate[SUP]1[/SUP]Rate Ratio[SUP]2,3[/SUP]Rate[SUP]1[/SUP]Rate Ratio[SUP]2,3[/SUP]Rate[SUP]1[/SUP]Rate Ratio[SUP]2,3[/SUP]
0—17 years25.33.427.33.737.65.111.91.67.41.0
18—49 years424.36.7268.64.3398.76.388.21.463.11.0
50—64 years935.84.7755.33.8920.34.6259.01.3198.61.0
65+ years1,211.32.11,479.62.61,379.52.4528.40.9565.31.0
Overall rate[SUP]4[/SUP] (age-adjusted)554.23.7492.73.3564.63.8168.81.1149.91.0

[TD="colspan: 2"] Non-Hispanic
American Indian or Alaska Native
[/TD]
[TD="colspan: 2"] Non-Hispanic Black [/TD]
[TD="colspan: 2"] Hispanic or Latino [/TD]
[TD="colspan: 2"] Non-Hispanic Asian or Pacific Islander [/TD]
[TD="colspan: 2"] Non-Hispanic White [/TD]
[SUP]1[/SUP]COVID-19-associated hospitalization rates by race and ethnicity are calculated using COVID-NET hospitalizations with known race and ethnicity for the numerator and NCHS bridged-race population estimates for the denominator.
[SUP]2[/SUP] For each age category, rate ratios are the ratios between crude hospitalization rates within each racial and ethnic group and the crude hospitalization rate among non-Hispanic White persons in the same age category.
[SUP]3[/SUP] The highest rate ratio in each age category is presented in bold.
[SUP]4[/SUP] Overall rates are adjusted to account for differences in age distributions within race and ethnicity strata in the COVID-NET catchment area; the age strata used for the adjustment include 0–17, 18–49, 50–64, 65-74, 75-84 and 85+ years.

Non-Hispanic White persons and non-Hispanic Black persons represented the highest proportions of hospitalizations reported to COVID-NET, followed by Hispanic or Latino, non-Hispanic Asian or Pacific Islander, and non-Hispanic American Indian or Alaska Native persons. However, some racial and ethnic groups are disproportionately represented among hospitalizations compared with the overall population of the catchment area. Prevalence ratios were highest among non-Hispanic American Indian or Alaska Native persons, followed by non-Hispanic Black persons and Hispanic or Latino persons.
1.2%28.8%21.9%5.1%37.5%
0.7%17.9%14.1%8.9%58.5%
1.71.61.60.60.6
[SUP]1[/SUP]Persons of multiple races (0.3%) or unknown race and ethnicity (5.2%) are not represented in the table but are included as part of the denominator.
[SUP]2[/SUP] Prevalence ratio is calculated as the ratio of the proportion of COVID-NET hospitalizations over the proportion of population in COVID-NET catchment area.

For underlying medical conditions, data were restricted to cases reported during March 1–May 31, 2020, due to delays in reporting. During this time frame, sampling was conducted among hospitalized adults; therefore, weighted percentages are reported. No sampling was conducted among hospitalized children. Among 8,442 sampled adults hospitalized during March 1–May 31 with information on underlying medical conditions, 90.6% had at least one reported underlying medical condition. The most reported underlying medical conditions were hypertension (58.9%), obesity (46.2%), metabolic disease (42.8%), and cardiovascular disease (34.2%). Among 265 children hospitalized during March 1–May 31 with information on underlying conditions, 50.9% had at least one reported underlying medical condition. The most reported underlying medical conditions were obesity (43.2%), asthma (13.2%), and neurologic disease (12.8%).

Additional data on demographics, signs and symptoms at admission, underlying conditions, interventions, outcomes, and discharge diagnoses, stratified by age, sex, and race and ethnicity, are available.

Additional hospitalization surveillance information:
Surveillance Methods | Additional rate data | Additional demographic and clinical data


Mortality Surveillance


The National Center for Health Statistics (NCHS) collects death certificate data from vital statistics offices for all deaths occurring in the United States. Based on death certificate data available on December 3, 2020, the percentage of deaths attributed to pneumonia, influenza, or COVID-19 (PIC) for week 48 was 12.8% and, while it declined compared with the percentage during week 47 (18.6%), it remains above the epidemic threshold of 6.4%. Among the 2,094 PIC deaths reported for week 48, 1,397 had COVID-19 listed as an underlying or contributing cause of death on the death certificate and three listed influenza, indicating that the current increase in PIC mortality is due primarily to COVID-19 and not influenza.

The weekly percentage of deaths due to PIC declined from a second peak at the end of July through mid- September, remained stable from the week ending September 19 through the week ending October 3, and increased for seven weeks from early October through mid-November to a level that is higher than the July peak. Data for the most recent week currently shows a decline, but percentages for recent weeks will likely increase as more death certificates are processed. Weekly mortality surveillance data include a combination of machine-coded and manually coded causes of death collected from death certificates. The percentage of deaths due to PIC is higher among manually coded records than more rapidly available machine-coded records. Due to the additional time needed for manual coding, the initially reported PIC percentages may be lower than percentages calculated from final data.
nchs-mortality-report.gif

resize iconView Larger


*Data during recent weeks are incomplete because of the lag in time between when the death occurred and when the death certificate is completed, submitted to NCHS and processed for reporting purposes. It is possible that a death certificate includes both influenza and COVID as a cause of death; therefore, the number of influenza and COVID coded deaths may not be mutually exclusive.
View Data Table


Additional NCHS mortality surveillance information: Surveillance Methods | Provisional Death Counts for COVID-19
More Information
View Page In:pdf icon 896 KB, 11 pages
Last Updated Dec. 4, 2020
 
Updated Dec. 11, 2020


Download Weekly Summary pdf icon[889 KB, 11 pages]
Key Updates for Week 49, ending December 5, 2020


Nationally, surveillance indicators tracking levels of SARS-CoV-2 circulation and associated illnesses have been increasing since September; however, the percentage of emergency department (ED) visits for COVID-like illness (CLI) decreased slightly during week 49. The percentage of deaths due to pneumonia, influenza and COVID-19 (PIC) has been increasing since October. Both COVID-19-associated hospitalizations and PIC mortality for the most recent weeks are expected to increase as more data are received.

national-activity-indicators.gif

Download Chart Data excel icon[XLS – 2 KB]
Virus: Public Health, Commercial and Clinical Laboratories


Nationally, the overall percentage of respiratory specimens testing positive for SARS-CoV-2, the virus causing COVID-19, increased from 12.1% during week 48 to 13.3% during week 49. Percent positivity increased among all age groups. Regionally, the percentages of respiratory specimens testing positive for SARS-CoV-2 increased in nine of the ten Health and Human Services (HHS) regionsexternal icon.
Mild/Moderate Illness: Outpatient and Emergency Department Visits


Nationally, the overall percentage of visits to outpatient providers or emergency departments (EDs) for influenza-like illness (ILI) and COVID-like illness (CLI) shows an increasing trend since mid-September; however, CLI decreased slightly during week 49 compared with week 48. Six of ten surveillance regions also reported a decrease in at least one indicator of mild/moderate illness this week; one region reported an increase.
Severe Disease: Hospitalizations and Deaths


Within the past month, all age groups have reached their highest weekly hospitalization rate since the start of the pandemic. Based on death certificate data, the percentage of deaths attributed to PIC for week 49 was 14.3% and remains above the epidemic threshold. The weekly percentages of deaths due to PIC increased for seven weeks from early October through mid-November and are expected to increase for the most recent weeks as additional data are reported. Hospitalization rates for the most recent week are also expected to increase as additional data are reported.

All data are preliminary and may change as more reports are received. A description of the surveillance systems summarized in COVIDView, including methodology and detailed descriptions of each data component, is available on the surveillance methods page.
Key Points
  • Nationally, the surveillance indicators included in COVIDView have been showing increases in SARS-CoV-2 circulation and associated illnesses and deaths in recent months.
    • The percentage of specimens testing positive for SARS-CoV-2, the percentages of visits to EDs or outpatient providers for ILI and CLI, and hospitalization rates have been increasing since September. However, a slight decrease was reported in percentage of visits for CLI during week 49 compared to week 48.
    • The percentage of deaths due to PIC has been increasing since the beginning of October and has exceeded the percentage of deaths due to PIC observed during the summer peak. Data for the most recent week currently show a decline, but that is likely to change as additional death certificates are processed.
  • At least one indicator used to monitor COVID-19 activity is increasing in all ten HHS regions and in seven regions (Regions 3 [Mid-Atlantic], 5 [Midwest], 6 [South Central], 7 [Central], 8 [Mountain], 9 [South West/Coast], and 10 [Pacific Northwest]) at least one indicator is at the highest level since the start of the pandemic.
  • The overall cumulative COVID-19-associated hospitalization rate through the week ending December 5, 2020, was 278.7 hospitalizations per 100,000 population.
    • Within the past month, all age groups have reached their highest weekly hospitalization rate since the start of the pandemic. Rates for the most recent weeks are expected to increase as additional admissions occurring during those weeks are reported.
    • The rates for Hispanic or Latino persons, non-Hispanic American Indian or Alaska Native persons, and non-Hispanic Black persons were approximately 3.8, 3.7, and 3.3 times the rate among non-Hispanic White persons, respectively.
  • Estimates from previous weeks are subject to change as data are updated with the most complete data available.
U.S. Virologic Surveillance


Based on data reported to CDC by public health laboratories and a subset of clinical and commercial laboratories in the United States, 87,861,662 specimens were tested for SARS-CoV-2 using a molecular assay since March 1, 2020. The percentage of specimens testing positive for SARS-CoV-2 each week, based on week of specimen collection, are summarized below.

Nationally, during week 49, of 3,490,096 specimens tested for SARS-CoV-2 for diagnostic purposes, 462,922 (13.3%) were positive. This is an increase compared with week 48, during which 12.1% of specimens tested were positive. The percentage of specimens testing positive increased among all age groups.

specimens-tested.gif


*Note: Different laboratory types came on board with testing during different weeks. This graph includes public health laboratory data beginning in week 10, clinical laboratory data beginning in week 11 and commercial laboratory data beginning in week 14.
View Data Table


The percentage of specimens testing positive for SARS-CoV-2 decreased in one region (Region 7 [Central]) during week 49 compared with week 48; the remaining nine regions reported an increase in percentage of specimens testing positive. The regions with the highest percent positivity during week 49 were in the central part of the country, Regions 5 (Midwest, 15.8%), 6 (South Central, 15.8%), 7 (Central, 18.8%), and 8 (Mountain, 16.6%).

Additional virologic surveillance information: Surveillance Methods


Outpatient/Emergency Department Illness


Two syndromic surveillance systems, the U.S. Outpatient Influenza-like Illness Surveillance Network (ILINet) and the National Syndromic Surveillance Project (NSSP), are being used to monitor trends in outpatient and emergency department (ED) visits that may be associated with COVID-19 illness. Each system monitors activity in a slightly different set of providers/facilities and uses a slightly different set of symptoms that may be associated with SARS-CoV-2 virus infection. ILINet provides information about visits to outpatient providers or emergency departments for influenza-like illness (ILI; fever plus cough and/or sore throat) and NSSP provides information about visits to EDs for ILI and COVID-like illness (CLI; fever plus cough and/or shortness of breath or difficulty breathing). Some EDs contribute ILI data to both ILINet and NSSP. Both systems are currently being affected by changes in health care seeking behavior, including increased use of telemedicine and increased social distancing. These changes affect the numbers of people seeking care in the outpatient and ED settings and their reasons for doing so. Syndromic data, including CLI and ILI, should be interpreted with caution and should be evaluated in combination with other sources of surveillance data, especially laboratory testing results, to obtain a complete and accurate picture of respiratory illness.

Nationally, the overall percentages of visits to outpatient providers or EDs for ILI and CLI have shown increasing trends since mid-September, with the greatest increase occurring for CLI visits. During week 49, the percentages of ED visits captured in NSSP for CLI and ILI were 6.1% and 1.3%, respectively. This represents a decline in CLI compared with week 48 and a stable (change of ≤0.1%) level of ILI. In ILINet, 1.6% of visits reported during week 49 were for ILI, also remaining stable (change of ≤0.1%) compared with week 48 and below the national baseline (2.4% for October 2019 through September 2020; 2.6% since October 2020) for the 34[SUP]th[/SUP] consecutive week. This level of ILI is lower than is typical for ILINet during this time of year.
outpatient-emergency-visits.gif

resize iconView LargerView Data Table


The percentage of visits for ILI reported in ILINet during week 49 remained stable (change of ≤0.1%) compared with week 48 for all age groups (0–4 years, 5–24 years, 25–49 years, 50–64 years, 65 years and older). All age groups have experienced an increasing percentage of visits for ILI since September.

resize iconView LargerView Data Table


On a regional levelexternal icon, one region (Region 2 [New Jersey/New York/Puerto Rico]) reported an increase in two indicators of mild to moderate illness (CLI and/or ILI) during week 49 compared with week 48. Six regions (Regions 4 [Southeast], 5 [Midwest], 6 [South Central], 7[Central], 8 [Mountain], and 10 [Pacific Northwest) reported a decrease in at least one indicator of mild to moderate illness (CLI and/or ILI) and three regions (Regions 1 [(Northeast)], 3 [Mid-Atlantic], and 9 [South West/Coast]) reported a stable (change of ≤0.1%) level of CLI and ILI during week 49 compared with week 48. The percentage of visits for ILI to ILINet providers remained below the region-specific baseline in all regions.

ILI Activity Levels

Data collected in ILINet are used to produce a measure of ILI activity for all 50 states, Puerto Rico, the U.S. Virgin Islands, the District of Columbia, New York City and for each core-based statistical area (CBSA) where at least one provider is located. The mean reported percentage of visits due to ILI for the current week is compared with the mean reported during non-influenza weeks, and the activity levels correspond to the number of standard deviations below, at, or above the mean.

The number of jurisdictions at each activity level during week 49 and the previous week are summarized in the table below.
Activity Level
Week 49 (Week ending Dec. 5, 2020)Week 48 (Week ending Nov. 28, 2020)Week 49 (Week ending Dec. 5, 2020)Week 48 (Week ending Nov. 28, 2020)
Very High0000
High0043
Moderate001315
Low445360
Minimal4950547543
Insufficient Data21312308

[TD="colspan: 2"] Number of Jurisdictions [/TD]
[TD="colspan: 2"] Number of CBSAs [/TD]

*Note: Data collected in ILINet may disproportionally represent certain populations within a state and may not accurately depict the full picture of respiratory disease activity for the whole state. Differences in the data presented here by CDC and independently by some state health departments likely represent differing levels of data completeness with data presented by the state likely being the more complete.

Additional information about medically attended outpatient and emergency department visits for ILI and CLI: Surveillance Methods

Hospitalizations


The COVID-19-Associated Hospitalization Surveillance Network (COVID-NET) conducts population-based surveillance for laboratory-confirmed COVID-19-associated hospitalizations in select counties participating in the Emerging Infections Program (EIP) and the Influenza Hospitalization Surveillance Project (IHSP).

A total of 90,874 laboratory-confirmed COVID-19-associated hospitalizations were reported by sites between March 1, 2020, and December 5, 2020. The overall cumulative hospitalization rate was 278.7 per 100,000 population. Within the past month, all age groups have reached their highest weekly hospitalization rate since the start of the pandemic. The hospitalization rates for the most recent weeks are expected to increase as additional data are reported in future weeks.
lab-confirmed-hospitalizations-weekly.gif

resize iconView Larger


[SUP]1[/SUP]Additional hospitalization rate data by age group are available.

Among the 90,874 laboratory-confirmed COVID-19-associated hospitalizations, 87,303 (96.1%) had information on race and ethnicity, while collection of race and ethnicity was still pending for 3,571 (3.9%) cases. When examining overall age-adjusted rates by race and ethnicity, the rates for Hispanic or Latino persons, non-Hispanic American Indian or Alaska Native persons, and non-Hispanic Black persons were approximately 3.8, 3.7, and 3.3 times the rate among non-Hispanic White persons, respectively.


When examining age-stratified crude hospitalization rates by race and ethnicity, compared with non-Hispanic White persons in the same age group, crude hospitalization rates were 5.1 times higher among Hispanic or Latino persons aged 0–17 years; 6.7 times higher among non-Hispanic American Indian or Alaska Native persons aged 18–49 years; 4.7 times higher among non-Hispanic American Indian or Alaska Native persons aged 50–64 years; and 2.6 times higher among non-Hispanic Black persons aged ≥65 years.

Age Category
Rate[SUP]1[/SUP]Rate Ratio[SUP]2,3[/SUP]Rate[SUP]1[/SUP]Rate Ratio[SUP]2,3[/SUP]Rate[SUP]1[/SUP]Rate Ratio[SUP]2,3[/SUP]Rate[SUP]1[/SUP]Rate Ratio[SUP]2,3[/SUP]Rate[SUP]1[/SUP]Rate Ratio[SUP]2,3[/SUP]
0—17 years25.33.427.33.737.65.111.91.67.41.0
18—49 years424.36.7268.64.3398.76.388.21.463.11.0
50—64 years935.84.7755.33.8920.34.6259.01.3198.61.0
65+ years1,211.32.11,479.62.61,379.52.4528.40.9565.31.0
Overall rate[SUP]4[/SUP] (age-adjusted)554.23.7492.73.3564.63.8168.81.1149.91.0

[TD="colspan: 2"] Non-Hispanic
American Indian or Alaska Native
[/TD]
[TD="colspan: 2"] Non-Hispanic Black [/TD]
[TD="colspan: 2"] Hispanic or Latino [/TD]
[TD="colspan: 2"] Non-Hispanic Asian or Pacific Islander [/TD]
[TD="colspan: 2"] Non-Hispanic White [/TD]
[SUP]1[/SUP]COVID-19-associated hospitalization rates by race and ethnicity are calculated using COVID-NET hospitalizations with known race and ethnicity for the numerator and NCHS bridged-race population estimates for the denominator.
[SUP]2[/SUP] For each age category, rate ratios are the ratios between crude hospitalization rates within each racial and ethnic group and the crude hospitalization rate among non-Hispanic White persons in the same age category.
[SUP]3[/SUP] The highest rate ratio in each age category is presented in bold.
[SUP]4[/SUP] Overall rates are adjusted to account for differences in age distributions within race and ethnicity strata in the COVID-NET catchment area; the age strata used for the adjustment include 0–17, 18–49, 50–64, 65-74, 75-84 and 85+ years.

Non-Hispanic White persons and non-Hispanic Black persons represented the highest proportions of hospitalizations reported to COVID-NET, followed by Hispanic or Latino, non-Hispanic Asian or Pacific Islander, and non-Hispanic American Indian or Alaska Native persons. However, some racial and ethnic groups are disproportionately represented among hospitalizations compared with the overall population of the catchment area. Prevalence ratios were highest among non-Hispanic American Indian or Alaska Native persons, followed by non-Hispanic Black persons and Hispanic or Latino persons.
1.2%28.2%21.8%5.1%38.0%
0.7%17.9%14.1%8.9%58.5%
1.71.61.50.60.6
[SUP]1[/SUP]Persons of multiple races (0.3%) or unknown race and ethnicity (5.3%) are not represented in the table but are included as part of the denominator.
[SUP]2[/SUP] Prevalence ratio is calculated as the ratio of the proportion of COVID-NET hospitalizations over the proportion of population in COVID-NET catchment area.

For underlying medical conditions, data were restricted to cases reported during March 1–May 31, 2020, due to delays in reporting. During this time frame, sampling was conducted among hospitalized adults; therefore, weighted percentages are reported. No sampling was conducted among hospitalized children. Among 8,437 sampled adults hospitalized during March 1–May 31 with information on underlying medical conditions, 90.7% had at least one reported underlying medical condition. The most reported underlying medical conditions were hypertension (58.9%), obesity (46.1%), metabolic disease (42.9%), and cardiovascular disease (34.2%). Among 266 children hospitalized during March 1–May 31 with information on underlying conditions, 51.1% had at least one reported underlying medical condition. The most reported underlying medical conditions were obesity (42.9%), asthma (13.5%), and neurologic disease (13.2%).

Additional hospitalization surveillance information:
Surveillance Methods | Additional rate data | Additional demographic and clinical data


Mortality Surveillance


The National Center for Health Statistics (NCHS) collects death certificate data from vital statistics offices for all deaths occurring in the United States. Based on death certificate data available on December 10, 2020, the percentage of deaths attributed to pneumonia, influenza, or COVID-19 (PIC) for week 49 was 14.3% and, while it declined compared with the percentage during week 48 (19.6%), it remains above the epidemic threshold of 6.5% and is expected to increase as more death certificates are processed. Among the 3,052 PIC deaths reported for week 49, 2,113 had COVID-19 listed as an underlying or contributing cause of death on the death certificate and five listed influenza, indicating that the current increase in PIC mortality is due primarily to COVID-19 and not influenza.

The weekly percentage of deaths due to PIC declined from a second peak at the end of July through mid- September, remained stable from the week ending September 19 through the week ending October 3, and increased for seven weeks from early October through mid-November to a level that is higher than the July peak. Data for the most recent two weeks currently show a decline, but percentages for recent weeks will likely increase as more death certificates are processed. Weekly mortality surveillance data include a combination of machine-coded and manually coded causes of death collected from death certificates. The percentage of deaths due to PIC is higher among manually coded records than more rapidly available machine-coded records. Due to the additional time needed for manual coding, the initially reported PIC percentages may be lower than percentages calculated from final data.
nchs-mortality-report.gif

resize iconView Larger


*Data during recent weeks are incomplete because of the lag in time between when the death occurred and when the death certificate is completed, submitted to NCHS and processed for reporting purposes. It is possible that a death certificate includes both influenza and COVID as a cause of death; therefore, the number of influenza and COVID coded deaths may not be mutually exclusive.
View Data Table


Additional NCHS mortality surveillance information: Surveillance Methods | Provisional Death Counts for COVID-19
More Information
View Page In:pdf icon 896 KB, 11 pages
Last Updated Dec. 11, 2020
 
COVIDView.jpg
  1. CASES, DATA & SURVEILLANCE
COVIDView: A Weekly Surveillance Summary of U.S. COVID-19 Activity


Updated Dec. 18, 2020


Due to the Christmas and New Year’s holidays, the week 51 COVIDView report will be released on Monday, December 28 and the week 52 COVIDView report will be released on Monday, January 4.

Download Weekly Summary pdf icon[878 KB, 11 pages]
Key Updates for Week 50, ending December 12, 2020


Nationally, surveillance indicators tracking levels of SARS-CoV-2 circulation and associated illnesses declined slightly or remained stable during the week ending December 12, 2020. The percentage of deaths due to pneumonia, influenza and COVID-19 (PIC) has been increasing since October. Both COVID-19-associated hospitalizations and PIC mortality for the most recent weeks are expected to increase as more data are received.

national-activity-indicators.gif

Download Chart Data excel icon[XLS – 2 KB]
Virus: Public Health, Commercial and Clinical Laboratories


Nationally, the overall percentage of respiratory specimens testing positive for SARS-CoV-2, the virus causing COVID-19, decreased from 13.4% during week 49 to 12.2% during week 50. Percent positivity decreased among all age groups. Regionally, the percentage of respiratory specimens testing positive for SARS-CoV-2 increased in one of the ten Health and Human Services (HHS) regionsexternal icon.
Mild/Moderate Illness: Outpatient and Emergency Department Visits


Nationally, the percentage of visits to outpatient providers or emergency departments (EDs) for influenza-like illness (ILI) and COVID-like illness (CLI) remained stable (change of ≤0.1%) during week 50 compared with week 49. Three of ten surveillance regions reported an increase in at least one indicator of mild/moderate illness this week; the remaining seven regions reported a stable (change of ≤0.1%) or decreasing percentage of visits for ILI and CLI.
Severe Disease: Hospitalizations and Deaths


During November, the overall weekly hospitalization rates reached their highest point since the beginning of the pandemic. Rates appear to be declining in recent weeks; however, these rates are likely to change as additional data are reported. Based on death certificate data, the percentage of deaths attributed to PIC for week 50 was 13.3% and remains above the epidemic threshold. The weekly percentage of deaths due to PIC increased throughout October and November and is expected to increase for the most recent weeks as additional data are reported.

All data are preliminary and may change as more reports are received. A description of the surveillance systems summarized in COVIDView, including methodology and detailed descriptions of each data component, is available on the surveillance methods page.
Key Points
  • Nationally, surveillance indicators tracking levels of SARS-CoV-2 circulation and associated illnesses increased from September through early December but declined slightly or remained stable during week 50.
    • At least one indicator used to monitor COVID-19 activity is increasing in three HHS regions – Regions 2 [New Jersey/New York/Puerto Rico], 3 [Mid-Atlantic], and 9 [South West/Coast].
  • The overall cumulative COVID-19-associated hospitalization rate through the week ending December 12, 2020, was 295.8 hospitalizations per 100,000 population.
    • While overall weekly hospitalization rates reached their highest point since the beginning of the pandemic within the past month, rates for the most recent weeks appear to be declining. However, hospitalization rates for the most recent weeks are likely to change as additional data are reported for those weeks.
    • The age-adjusted hospitalization rate for Hispanic or Latino persons, non-Hispanic American Indian or Alaska Native persons, and non-Hispanic Black persons were approximately 3.7, 3.5, and 3.2 times those of non-Hispanic White persons, respectively.
  • The percentage of deaths due to PIC has been increasing since the beginning of October and has exceeded the percentage of deaths due to PIC observed during the summer peak. Data for the most recent two weeks currently show a decline, but that is likely to change as additional death certificates are processed.
  • Estimates from previous weeks are subject to change as data are updated with the most complete data available.
U.S. Virologic Surveillance


Based on data reported to CDC by public health laboratories and a subset of clinical and commercial laboratories in the United States, 91,254,070 specimens were tested for SARS-CoV-2 using a molecular assay since March 1, 2020. The percentage of specimens testing positive for SARS-CoV-2 each week, based on week of specimen collection, are summarized below.

Nationally, during week 50, of 2,940,118 specimens tested for SARS-CoV-2 for diagnostic purposes, 359,362 (12.2%) were positive. This is a decrease compared with week 49, during which 13.4% of specimens tested were positive. The percentage of specimens testing positive decreased among all age groups.

specimens-tested.gif


*Note: Different laboratory types came on board with testing during different weeks. This graph includes public health laboratory data beginning in week 10, clinical laboratory data beginning in week 11, and commercial laboratory data beginning in week 14.
View Data Table


The percentage of specimens testing positive for SARS-CoV-2 increased in one region (Region 9 [South West/Coast]) during week 50 compared with week 49; the remaining nine regions reported a decrease in percentage of specimens testing positive.

Additional virologic surveillance information: Surveillance Methods


Outpatient/Emergency Department Illness


Two syndromic surveillance systems, the U.S. Outpatient Influenza-like Illness Surveillance Network (ILINet) and the National Syndromic Surveillance Project (NSSP), are being used to monitor trends in outpatient and emergency department (ED) visits that may be associated with COVID-19 illness. Each system monitors activity in a slightly different set of providers/facilities and uses a slightly different set of symptoms that may be associated with SARS-CoV-2 virus infection. ILINet provides information about visits to outpatient providers or emergency departments for influenza-like illness (ILI; fever plus cough and/or sore throat) and NSSP provides information about visits to EDs for ILI and COVID-like illness (CLI; fever plus cough and/or shortness of breath or difficulty breathing). Some EDs contribute ILI data to both ILINet and NSSP. Both systems are currently being affected by changes in health care seeking behavior, including increased use of telemedicine and increased social distancing. These changes affect the numbers of people seeking care in the outpatient and ED settings and their reasons for doing so. Syndromic data, including CLI and ILI, should be interpreted with caution and should be evaluated in combination with other sources of surveillance data, especially laboratory testing results, to obtain a complete and accurate picture of respiratory illness.

Nationally, the overall percentages of visits to outpatient providers or EDs for ILI and CLI have remained stable or declined slightly since late November. During week 50, the percentages of ED visits captured in NSSP for CLI and ILI were 6.6% and 1.3%, respectively. This represents a stable (change of ≤0.1%) level of CLI and ILI compared with week 49. In ILINet, 1.6% of visits reported during week 50 were for ILI, also remaining stable (change of ≤0.1%) for the fourth consecutive week and below the national baseline (2.4% for October 2019 through September 2020; 2.6% since October 2020) for the 35[SUP]th[/SUP] consecutive week. This level of ILI is lower than is typical for ILINet during this time of year.
outpatient-emergency-visits.gif

resize iconView LargerView Data Table


The percentages of visits for ILI reported in ILINet for all age groups (0–4 years, 5–24 years, 25–49 years, 50–64 years, 65 years and older) have remained stable (change of ≤0.1%) since mid-November.

resize iconView LargerView Data Table


On a regional levelexternal icon, three regions (Region 2 [New Jersey/New York/Puerto Rico], 3 [Mid-Atlantic] and 9 [South West/Coast]) reported an increase in at least one indicator of mild to moderate illness (CLI and/or ILI) during week 50 compared with week 49. The remaining seven regions (1 [New England], 4 [Southeast], 5 [Midwest], 6 [South Central], 7[Central], 8 [Mountain], and 10 [Pacific Northwest) reported a decreasing or stable (change of ≤0.1%) level of mild to moderate illness. The percentage of visits for ILI to ILINet providers remained below the region-specific baseline in all regions.

ILI Activity Levels

Data collected in ILINet are used to produce a measure of ILI activity for all 50 states, Puerto Rico, the U.S. Virgin Islands, the District of Columbia, New York City and for each core-based statistical area (CBSA) where at least one provider is located. The mean reported percentage of visits due to ILI for the current week is compared with the mean reported during non-influenza weeks, and the activity levels correspond to the number of standard deviations below, at, or above the mean.

The number of jurisdictions at each activity level during week 50 and the previous week are summarized in the table below.
Activity Level
Week 50 (Week ending Dec. 12, 2020)Week 49 (Week ending Dec. 5, 2020)Week 50 (Week ending Dec. 12, 2020)Week 49 (Week ending Dec. 5, 2020)
Very High0000
High0045
Moderate10813
Low044359
Minimal5149566556
Insufficient Data32308296

[TD="colspan: 2"] Number of Jurisdictions [/TD]
[TD="colspan: 2"] Number of CBSAs [/TD]

*Note: Data collected in ILINet may disproportionally represent certain populations within a state and may not accurately depict the full picture of respiratory disease activity for the whole state. Differences in the data presented here by CDC and independently by some state health departments likely represent differing levels of data completeness with data presented by the state likely being the more complete.

Additional information about medically attended outpatient and emergency department visits for ILI and CLI: Surveillance Methods

Hospitalizations


The COVID-19-Associated Hospitalization Surveillance Network (COVID-NET) conducts population-based surveillance for laboratory-confirmed COVID-19-associated hospitalizations in select counties participating in the Emerging Infections Program (EIP) and the Influenza Hospitalization Surveillance Project (IHSP).

A total of 96,444 laboratory-confirmed COVID-19-associated hospitalizations were reported by sites between March 1, 2020 and December 12, 2020. The overall cumulative hospitalization rate was 295.8 per 100,000 population. While overall weekly hospitalization rates reached their highest point since the beginning of the pandemic within the past month, rates for the most recent weeks appear to be declining. However, hospitalization rates for the most recent weeks are likely to change as additional data are reported for those weeks.
lab-confirmed-hospitalizations-weekly.gif

resize iconView Larger


[SUP]1[/SUP]Additional hospitalization rate data by age group are available.

Among the 96,444 laboratory-confirmed COVID-19-associated hospitalizations, 94,432 (97.9%) had information on race and ethnicity, while collection of race and ethnicity was still pending for 2,012 (2.1%) cases. When examining overall age-adjusted rates by race and ethnicity, the rate for Hispanic or Latino persons, non-Hispanic American Indian or Alaska Native persons, and non-Hispanic Black persons were approximately 3.7, 3.5, and 3.2 times the rate among non-Hispanic White persons, respectively.


When examining age-stratified crude hospitalization rates by race and ethnicity, compared with non-Hispanic White persons in the same age group, crude hospitalization rates were 5.0 times higher among Hispanic or Latino persons aged 0–17 years; 6.5 times higher among Non-Hispanic American Indian or Alaska Native persons aged 18–49 years; 4.5 times higher among non-Hispanic American Indian or Alaska Native persons and Hispanic or Latino persons aged 50–64 years; and 2.5 times higher among non-Hispanic Black persons aged ≥ 65 years.

Age Category
Rate[SUP]1[/SUP]Rate Ratio[SUP]2,3[/SUP]Rate[SUP]1[/SUP]Rate Ratio[SUP]2,3[/SUP]Rate[SUP]1[/SUP]Rate Ratio[SUP]2,3[/SUP]Rate[SUP]1[/SUP]Rate Ratio[SUP]2,3[/SUP]Rate[SUP]1[/SUP]Rate Ratio[SUP]2,3[/SUP]
0—17 years27.33.429.23.740.15.012.41.68.01.0
18—49 years440.96.5286.24.2420.86.293.61.468.31.0
50—64 years975.74.5807.93.7978.84.5278.11.3216.61.0
65+ years1,308.02.11,588.82.51,497.82.4571.30.9625.71.0
Overall rate[SUP]4[/SUP] (age-adjusted)584.03.5527.43.2603.63.7181.21.1164.61.0

[TD="colspan: 2"] Non-Hispanic
American Indian or Alaska Native
[/TD]
[TD="colspan: 2"] Non-Hispanic Black [/TD]
[TD="colspan: 2"] Hispanic or Latino [/TD]
[TD="colspan: 2"] Non-Hispanic Asian or Pacific Islander [/TD]
[TD="colspan: 2"] Non-Hispanic White [/TD]
[SUP]1[/SUP]COVID-19-associated hospitalization rates by race and ethnicity are calculated using COVID-NET hospitalizations with known race and ethnicity for the numerator and NCHS bridged-race population estimates for the denominator.
[SUP]2[/SUP] For each age category, rate ratios are the ratios between crude hospitalization rates within each racial and ethnic group and the crude hospitalization rate among non-Hispanic White persons in the same age category.
[SUP]3[/SUP] The highest rate ratio in each age category is presented in bold.
[SUP]4[/SUP] Overall rates are adjusted to account for differences in age distributions within race and ethnicity strata in the COVID-NET catchment area; the age strata used for the adjustment include 0–17, 18–49, 50–64, 65-74, 75-84 and 85+ years.

Non-Hispanic White persons and non-Hispanic Black persons represented the highest proportions of hospitalizations reported to COVID-NET, followed by Hispanic or Latino, non-Hispanic Asian or Pacific Islander, and non-Hispanic American Indian or Alaska Native persons. However, some racial and ethnic groups are disproportionately represented among hospitalizations compared with the overall population of the catchment area. Prevalence ratios were highest among non-Hispanic American Indian or Alaska Native persons, followed by non-Hispanic Black persons and Hispanic or Latino persons.
1.2%27.9%21.5%5.1%38.7%
0.7%17.9%14.1%8.9%58.5%
1.71.61.50.60.7
[SUP]1[/SUP]Persons of multiple races (0.3%) or unknown race and ethnicity (5.4%) are not represented in the table but are included as part of the denominator.
[SUP]2[/SUP] Prevalence ratio is calculated as the ratio of the proportion of COVID-NET hospitalizations over the proportion of population in COVID-NET catchment area.

For underlying medical conditions, data were restricted to cases reported during March 1–May 31, 2020, due to delays in reporting. During this time frame, sampling was conducted among hospitalized adults; therefore, weighted percentages are reported. No sampling was conducted among hospitalized children. Among 8,452 sampled adults hospitalized during March 1–May 31 with information on underlying medical conditions, 90.7% had at least one reported underlying medical condition. The most reported underlying medical conditions were hypertension (58.9%), obesity (46.1%), metabolic disease (42.9%), and cardiovascular disease (34.2%). Among 266 children hospitalized during March 1–May 31 with information on underlying conditions, 51.1% had at least one reported underlying medical condition. The most reported underlying medical conditions were obesity (42.9%), asthma (13.5%), and neurologic disease (13.2%).

Additional data on demographics, signs and symptoms at admission, underlying conditions, interventions, outcomes, and discharge diagnoses, stratified by age, sex, and race and ethnicity, are available.

Additional hospitalization surveillance information:
Surveillance Methods | Additional rate data | Additional demographic and clinical data


Mortality Surveillance


The National Center for Health Statistics (NCHS) collects death certificate data from vital statistics offices for all deaths occurring in the United States. Based on death certificate data available on December 17, 2020, the percentage of deaths attributed to pneumonia, influenza, or COVID-19 (PIC) for week 50 was 13.3% and, while it declined compared with the percentage during week 49 (20.8%), it remains above the epidemic threshold of 6.6% and is expected to increase as more death certificates are processed. Among the 2,897 PIC deaths reported for week 50, 1,921 had COVID-19 listed as an underlying or contributing cause of death on the death certificate and two listed influenza, indicating that the current increase in PIC mortality is due primarily to COVID-19 and not influenza.

The weekly percentage of deaths due to PIC increased for eight weeks from early October through the end of November to a level that is higher than the July peak. Data for the most recent two weeks currently show a decline, but percentages for recent weeks will likely increase as more death certificates are processed. Weekly mortality surveillance data include a combination of machine-coded and manually coded causes of death collected from death certificates. The percentage of deaths due to PIC is higher among manually coded records than more rapidly available machine-coded records. Due to the additional time needed for manual coding, the initially reported PIC percentages may be lower than percentages calculated from final data.
nchs-mortality-report.gif

resize iconView Larger


*Data during recent weeks are incomplete because of the lag in time between when the death occurred and when the death certificate is completed, submitted to NCHS and processed for reporting purposes. It is possible that a death certificate includes both influenza and COVID as a cause of death; therefore, the number of influenza and COVID coded deaths may not be mutually exclusive.
View Data Table


Additional NCHS mortality surveillance information: Surveillance Methods | Provisional Death Counts for COVID-19
More Information
View Page In:pdf icon 878 KB, 11 pages
Last Updated Dec. 18, 2020
 
Back
Top Bottom