• FluTrackers.com Inc. does not provide medical advice. Information on this web site is collected from various internet resources, and the FluTrackers board of directors makes no warranty to the safety, efficacy, correctness or completeness of the information posted on this site by any author or poster. The information collated here is for instructional and/or discussion purposes only and is NOT intended to diagnose or treat any disease, illness, or other medical condition. Every individual reader or poster should seek advice from their personal physician/healthcare practitioner before considering or using any interventions that are discussed on this website. By continuing to access this website you agree to consult your personal physican before using any interventions posted on this website, and you agree to hold harmless FluTrackers.com Inc., the board of directors, the members, and all authors and posters for any effects from use of any medication, supplement, vitamin or other substance, device, intervention, etc. mentioned in posts on this website, or other internet venues referenced in posts on this website.
  • We are not asking for any donations. Do not donate to any entity who says they are raising funds for us.

USA FluView Reports - Week 48 (2009) - Week 20 (2010)

Deaths Per Million By Region

Deaths Per Million By Region

Deaths per million based on state's population by region (lowest and highest states are listed...other states within region fall in between these numbers) Of note, MO seems an unrealistic number, and perhaps should be ignored. while NM is highest, and perhaps they have better reporting. Additionally, within Region 8, ND shows 4.7 while SD is 28.6 with that region having highest H1N1 cases in the nation.

........death rate per million......case rate per million
Region 1: ME (4.2-13.7) MA .......446.3
Region 2: NJ (4.8-13.7) PR .........97.3
Region 3: VA (4.9-11) WV .........555.6
Region 4: GA (4.2-10.7) FL ........271.9
Region 5: OH (3.6-10.9) MN .......362.1
Region 6: AR (7.3-25.7) NM .......219.5
Region 7: MO (1.9-13.3) IA ........390.5
Region 8: ND (4.7-28.6) SD ......1160.1
Region 9: HI (8.5-21) AZ ...........352.6
Region10: ID (13.1-19.8) OR ......620.2
USA: 9.7

http://www.flutrackers.com/forum/showthread.php?t=121584
http://topics.gannett.com/h1n1+flu/?template=kthv
 
Re: CDC Week 51 fluview

Re: CDC Week 51 fluview

Yesterday on the radio show I asked Dr. Racaniello if we should watch the fiqure below (0.3%) to increase as a sign that the current vaccine is becoming less effective and he said "yes". He expects slowly over time we will need a new vaccine to replace the current one. He says that from all the data he has seen that the current vaccine is still very effective.

"Two viruses (0.3%) tested showed reduced titers with antiserum produced against A/California/07/2009."


http://www.cdc.gov/flu/weekly/
 
Re: CDC Week 51 fluview

Re: CDC Week 51 fluview

which were those 2 ?


Europe:

Based on the antigenic characterization of 799 influenza viruses reported from week 40/2009 to week 52/2009, 792 were pandemic A(H1N1), A/California/7/2009-like, 3 were A/Perth/16/2009 (H3N2)-like, 2 were A(H3) A/Brisbane/10/2007 (H3N2)-like, 1 was A/Brisbane/59/2007 (H1N1)-like, and 1 was B/Brisbane/60/2008-like. Genetic characterizations were available for 252 isolates; all belonged to the A/California/7/2009 A(H1N1) pandemic influenza lineage.


even if the virus mutates away, the vax would still be effective in the sense, that it
converts pandemic outbreaks into seasonal ones. The 1976-vax is still somehow effective


vaccine is not so often changes, this one may be in use for 5 years or such, since it's a new virus.
Like New Caledonia/1999
 
Re: Deaths Per Million By Region

Re: Deaths Per Million By Region

The age stucture of states will have an effect on infection rates.

Additionally, don't underestimate the effects of variable detection of cases. States vary greatly in resources, capabilities, reporting methods and procedures.
 
Re: CDC Week 52 fluview

Re: CDC Week 52 fluview

During week 52 (December 27, 2009-January 2, 2010), influenza activity decreased slightly in the U.S.

* 161 (3.9%) specimens tested by U.S. World Health Organization (WHO) and National Respiratory and Enteric Virus Surveillance System (NREVSS) collaborating laboratories and reported to CDC/Influenza Division were positive for influenza.
* All subtyped influenza A viruses reported to CDC were 2009 influenza A (H1N1) viruses.
* The proportion of deaths attributed to pneumonia and influenza (P&I) was below the epidemic threshold.
* Four influenza-associated pediatric deaths were reported. All four deaths were associated with 2009 influenza A (H1N1) virus infection.
* The proportion of outpatient visits for influenza-like illness (ILI) was 2.4% which is above the national baseline of 2.3%. Six of the 10 regions (3, 6, 7, 8, 9, and 10) reported ILI below region-specific baseline levels.
* One state reported geographically widespread influenza activity, 12 states reported regional influenza activity, Puerto Rico, the District of Columbia, and 17 states reported local influenza activity, the U.S. Virgin Islands, Guam, 19 states reported sporadic influenza activity, and one state reported no influenza activity

Eight hundred eleven (99.8%) of 813 2009 influenza A (H1N1) viruses tested are related to the A/California/07/2009 (H1N1) reference virus selected by WHO as the 2009 H1N1 vaccine virus. Two viruses (0.3%) tested showed reduced titers with antiserum produced against A/California/07/2009

During week 52, 7.4% of all deaths reported through the 122-Cities Mortality Reporting System were due to P&I. This percentage was below the epidemic threshold of 7.5% for week 52.

Four influenza-associated pediatric deaths were reported to CDC during week 52 (Arizona, Florida, and Ohio [2]). All four deaths were associated with 2009 influenza A (H1N1) virus infection. The deaths reported during week 52 occurred between September 13 and December 19, 2009.

Nationwide during week 52, 2.4% of patient visits reported through the U.S. Outpatient Influenza-like Illness Surveillance Network (ILINet) were due to influenza-like illness (ILI). This percentage is above the national baseline of 2.3%.
http://www.cdc.gov/flu/weekly/
 
Re: CDC Week 52 fluview

Re: CDC Week 52 fluview

cdc52.GIF
 
Re: CDC Week 52 fluview

Re: CDC Week 52 fluview

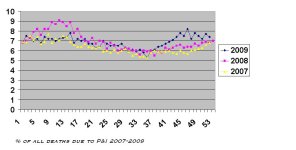
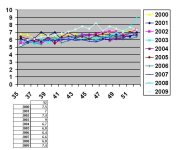
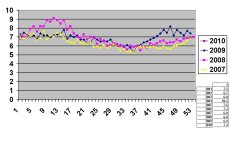
Historical comparison of the % of deaths due to P&I (updated to week 52).

P&I 3 yr.JPG

P&I 10 yr.JPG
 
Re: 7 Pediatric Deaths--Week 1

Re: 7 Pediatric Deaths--Week 1

P&I 4 year.JPG

% P&I for week 1 is 7.3%, down again. Tied for fourth highest week 1 in the last 10 years.
 
Fluview week 2

Fluview week 2

2009-2010 Influenza Season Week 1 ending January 9, 2010All data are preliminary and may change as more reports are received.

Synopsis:
During week 1 (January 3-9, 2010), influenza activity continued to decrease in the U.S.

?139 (3.6%) specimens tested by U.S. World Health Organization (WHO) and National Respiratory and Enteric Virus Surveillance System (NREVSS) collaborating laboratories and reported to CDC/Influenza Division were positive for influenza.
?All subtyped influenza A viruses reported to CDC were 2009 influenza A (H1N1) viruses.
?One human infection with a novel influenza A virus was reported.?The proportion of deaths attributed to pneumonia and influenza (P&I) was below the epidemic threshold.
?Seven influenza-associated pediatric deaths were reported. Six deaths were associated with 2009 influenza A (H1N1) virus infection and one was associated with an influenza A virus for which the subtype was undetermined.
?The proportion of outpatient visits for influenza-like illness (ILI) was 1.9% which is below the national baseline of 2.3%. One of the 10 regions (region 9) reported ILI above their region-specific baseline.
?No states reported widespread influenza activity, nine states reported regional influenza activity, the District of Columbia, Puerto Rico, and 15 states reported local influenza activity, Guam and 24 states reported sporadic influenza activity, and the U.S. Virgin Islands and two states reported no influenza activity.

-snip-

Novel Influenza A Virus:
One case of human infection with a novel influenza A virus was reported by the Iowa Department of Public Health. The case patient had onset of symptoms in September 2009, but did not require hospitalization and has fully recovered. The virus was identified as swine influenza A (H3N2) and investigated in November 2009. No clear exposure to swine was identified, but no evidence of sustained human-to-human transmission with this virus was found. Early identification and investigation of novel influenza A cases is critical to evaluate the extent of the outbreak and possible human-to-human transmission. Surveillance for human infections with novel influenza A viruses is conducted year-round.

-snip-

From August 30, 2009 ? January 9, 2010, 38,454 laboratory-confirmed influenza-associated hospitalizations and 1,779 laboratory-confirmed influenza-associated deaths were reported to CDC.

-snip-

A total of 52 cases of oseltamivir resistant 2009 influenza A (H1N1) viruses have been identified in the United States since April 2009. While the total number of cases has not increased over the previous week, one previously reported case was reclassified and one new case was identified. Forty-two of these specimens were collected after September 1, 2009.

-snip-

During week 1, 7.3% of all deaths reported through the 122-Cities Mortality Reporting System were due to P&I. This percentage was below the epidemic threshold of 7.6% for week 1.

-snip-

Seven influenza-associated pediatric deaths were reported to CDC during week 1 (Illinois, Michigan, New York [2], Oregon, and Texas [2]). Six deaths were associated with 2009 influenza A (H1N1) virus infection and one was associated with an influenza A virus for which the subtype was undetermined.. The deaths reported during week 1 occurred between October 11 and December 19, 2009.

Since August 30, 2009, CDC has received 236 reports of influenza-associated pediatric deaths that occurred during the current influenza season (43 deaths in children less than 2 years old, 26 deaths in children 2-4 years old, 87 deaths in children 5-11 years old, and 80 deaths in children 12-17 years old). One hundred ninety-five (83%) of the 236 deaths were due to 2009 influenza A (H1N1) virus infections, 40 were associated with an influenza A virus for which the subtype is undetermined, and one was associated with an influenza B virus infection. A total of 255 deaths in children associated with 2009 influenza A (H1N1) virus infection have been reported to CDC.

Among the 236 deaths in children, 121 children had specimens collected for bacterial culture from normally sterile sites and 39 (32.2%) of the 121 were positive; Streptococcus pneumoniae was identified in 10 (25.6%) of the 39 children and Staphylococcus aureus was identified in 11 (28.2%) of the 39 children. Two S. aureus isolates were sensitive to methicillin, eight were methicillin resistant, and one did not have sensitivity testing performed. Twenty-six (66.7%) of the 39 children with bacterial coinfections were five years of age or older, and 14 (35.9%) of the 39 children were 12 years of age or older.

-snip-

Rates [EIP (new sites)] for children aged 0-4 years and 5-17 years were 5.9 (9.7) and 2.5 (3.6) per 10,000, respectively. Rates [EIP (new sites)] for adults aged 18-49 years, 50-64 years, and ≥ 65 years were 2.2 (1.7), 2.9 (1.8) and 2.4 (1.7) per 10,000, respectively.

-snip-

Nationwide during week 01, 1.9% of patient visits reported through the U.S. Outpatient Influenza-like Illness Surveillance Network (ILINet) were due to influenza-like illness (ILI). This percentage is above the national baseline of 2.3%.

The increase in the percentage of outpatient visits for ILI during weeks 51 and 52 is likely influenced by a reduction in routine health care visits during the holiday season, as has occurred during previous seasons.

http://www.cdc.gov/flu/weekly/

 
Re: Fluview week 2

Re: Fluview week 2

Week 2:
ILI nationally decreased again this week over last week

Overall cumulative hospitalization rates for the 2009-10 influenza season have leveled off in all age groups and very few 2009 H1N1-laboratory confirmed hospitalizations were reported by states during the week ending January 16.

During week 2, 8.0% of all deaths reported through the 122-Cities Mortality Reporting System were due to P&I. This percentage was above the epidemic threshold of 7.6% for week 2.

Nine influenza-associated pediatric deaths were reported to CDC during week 2 (Arizona, Colorado [3], Illinois [2], Maryland, New York, and Texas). Three deaths were associated with 2009 influenza A (H1N1) virus infection, four were associated with an influenza A virus for which the subtype was undetermined, one was associated with an influenza A (H3) virus infection, and one was associated with an influenza B virus infection. The deaths reported during week 2 occurred between February 22, 2009 and January 2, 2010. (The death associated with influenza A (H3) virus infection occurred in March 2009 and the death associated with influenza B virus occurred in February 2009)
 
Re: Fluview week 2

Re: Fluview week 2

they report deaths from Feb.2009 only now ?

May the same happen with the 122-cities surveillance ?
 
Back
Top