• FluTrackers.com Inc. does not provide medical advice. Information on this web site is collected from various internet resources, and the FluTrackers board of directors makes no warranty to the safety, efficacy, correctness or completeness of the information posted on this site by any author or poster. The information collated here is for instructional and/or discussion purposes only and is NOT intended to diagnose or treat any disease, illness, or other medical condition. Every individual reader or poster should seek advice from their personal physician/healthcare practitioner before considering or using any interventions that are discussed on this website. By continuing to access this website you agree to consult your personal physican before using any interventions posted on this website, and you agree to hold harmless FluTrackers.com Inc., the board of directors, the members, and all authors and posters for any effects from use of any medication, supplement, vitamin or other substance, device, intervention, etc. mentioned in posts on this website, or other internet venues referenced in posts on this website.
  • We are not asking for any donations. Do not donate to any entity who says they are raising funds for us.

USA - Actual ISDS flu trends

Re: USA - Actual ISDS flu trends

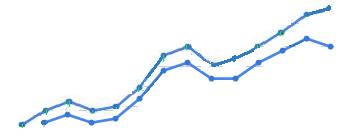
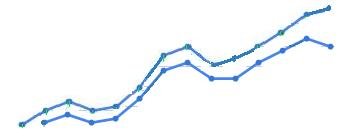
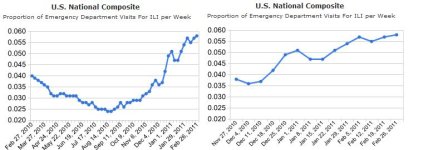
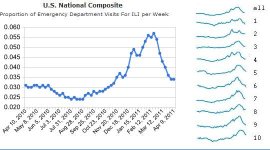
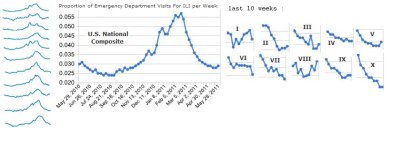
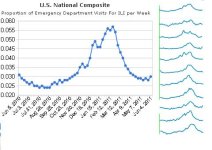
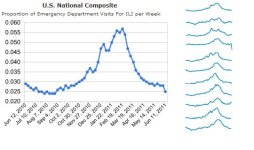
during this week, they changed the chart as shown below.

upper: as it was last Saturday
lower: how it is now, before the new point from this week is added

this could be due to new data from week 6 coming in
but old datapoints also changed slightly


however, it clearly went down during the week without a new
datapoint being added.
And CDC yesterday also showed a small decline


new datapoint expected to be added in some hours


attachment.php
 

Attachments

  • isdse6b.jpg
    isdse6b.jpg
    5 KB · Views: 0
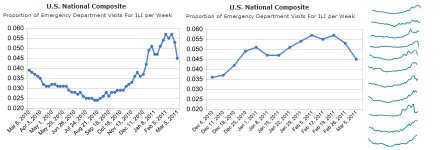
Re: USA - Actual ISDS flu trends

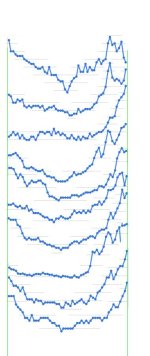
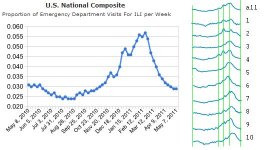
going up again !

10 regions:

attachment.php
 

Attachments

  • isdse7b.jpg
    isdse7b.jpg
    42.5 KB · Views: 0
Re: USA - Actual ISDS flu trends

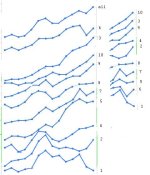
still increasing in week 8 !
But last week's datapoint had been reduced now, so in total we are at the same level which
they showed last week.

attachment.php
 

Attachments

  • use8.jpg
    use8.jpg
    40.6 KB · Views: 1
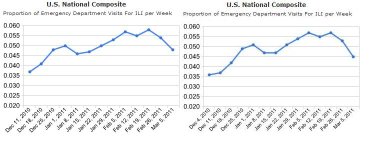
Re: USA - Actual ISDS flu trends

clearly going down now.
Last week's data-point was also corrected downwards


attachment.php


slightly corrected upwards on Friday, new datapoint tomorrow

attachment.php


week 9: decline-speed decreased

isds9.JPG
 

Attachments

  • isds8.jpg
    isds8.jpg
    48.1 KB · Views: 0
  • isdse8c.jpg
    isdse8c.jpg
    38.7 KB · Views: 0
Re: USA - Actual ISDS flu trends

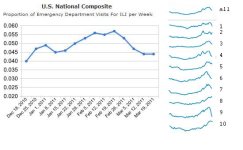
week10:


attachment.php


attachment.php
 

Attachments

  • isds10.jpg
    isds10.jpg
    28.1 KB · Views: 0
  • isds10b.jpg
    isds10b.jpg
    33.4 KB · Views: 0
Re: USA - Actual ISDS flu trends

The latest report from LA County, California makes a good point this week and indicates how unusual this season has been/will be. They indicated that %ILI is going down, and the number of flu casing is decreasing, but percent positives are still high and there are more severe cases and new deaths every week. Of their 17 deaths, only one is from flu B and 100% of the Flu A deaths that were subtyped are pH1N1. If you look at the isolates data, Flu B and H3N2 are decreasing, while pH1N1 is increasing.

http://www.flutrackers.com/forum/showthread.php?t=160981

If you look at the state of Washington, they haven't reached peak with respect to any indicators.

http://www.doh.wa.gov/EHSPHL/Epidemiology/CD/fluupdate.pdf

On the other extreme, Louisiana has had a very active flu season and appears to have peaked when looking at their %ILI.
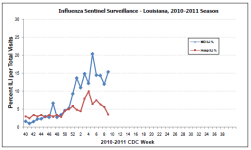
Week 10 LA ILI.png

First, their samples were dominated by Flu B, then H3N2, and only in the past couple of weeks has pH1N1 shown up. Despite the severe flu season to date, they have only reported one pediatric death. I'm not sure if it was the Texas child that died in a Shreveport hospital or a different child. Unfortunately, the graph does not indicate the percent positive or the number of samples taken. But, it's clear that they have had overlapping waves of Flu B and H3N2 that has kept their %ILI over 10% since Week 1. My concern is that pH1N1 will begin to dominate in a few weeks, causing the severe cases and deaths to mount.
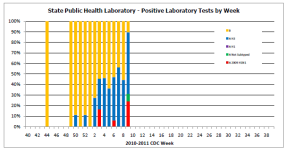
Week 10 LA Isolates.png

Bear with me for one other example. Illinois (who is chronically a week behind in reporting) is showing past peak for %ILI:
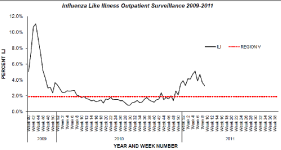
Week 9 IL ILI.png

However, there was very little pH1N1 until Week 9:
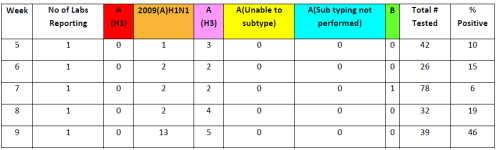
Week 9 IL Isolates.png

Illinois has reported 5 pediatric deaths and 2 adult deaths. The Week 9 report of increased %positives is attributed to an outbreak of pH1N1 in a correctional facility.

My point in all this is that although %ILI data in the U.S. suggests that the flu season is nearly over, I believe that the isolates data indicate a strong potential for a second wave dominated by pH1N1. This might not be evident in the national or even regional %ILI data until it is well under way since different states are at various stages of relative increases or decreases of seasonal flu and pH1N1. And, if another wave is dominated by the mutated pH1N1 strain that has apparently escaped the vaccine, then we could have a spring epidemic in the U.S. comparable to the fall of 2009.

 
Re: USA - Actual ISDS flu trends

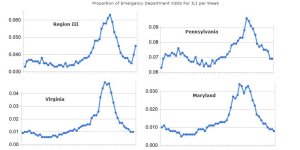
going up in week 19 !
i.e. region 3 (but not PA,VA,MD)

isdne18.JPG
 
Re: USA - Actual ISDS flu trends

can't work. Delaware is too small to make a change.
There seems to be an error.

population of , ILI-sumissions ratio in % weeks 17,19
R3:29.9M,3.5,4.5
DE: 0.9M,
WV:1.9M
DC:0.6M
PA:12.7M,7.5,7.0
VA:8.0M,1.3,1.0
MD:5.8M,0.9,0.8

attachment.php
 

Attachments

  • reg3.jpg
    reg3.jpg
    35.6 KB · Views: 0
Re: USA - Actual ISDS flu trends

........................
attachment.php
 

Attachments

  • isdse21.jpg
    isdse21.jpg
    38.5 KB · Views: 0
Re: USA - Actual ISDS flu trends

..............................
 

Attachments

  • isds21.jpg
    isds21.jpg
    31.5 KB · Views: 0
  • isds22.jpg
    isds22.jpg
    29.1 KB · Views: 0
Re: USA - Actual ISDS flu trends

the first region that goes up a little bit for the 2011/2012 season is region 6

us11a.JPG
 
Re: USA - Actual ISDS flu trends

Wouldn't one expect to see this, considering Region 6 base has the highest baseline at 4.9% and their ILI has been so low?

CDC:
...it is not appropriate to apply the national baseline to regional data; therefore, region specific baselines are calculated..

Regional baselines for the 2010-11 influenza season are:
Region 1 ? 1.4%
Region 2 ? 2.4%
Region 3 ? 3.6%
Region 4 ? 2.3%
Region 5 ? 1.8%
Region 6 ? 4.9%
Region 7 ? 2.3%
Region 8 ? 1.7%
Region 9 ? 4.1%
Region 10? 2.7%
http://www.cdc.gov/flu/weekly/overview.htm#Outpatient
 
Re: USA - Actual ISDS flu trends

why would you expect this ?
I would maybe conclude that fluctuations are bigger in region 6,
when the baseline is higher.
But not, that the minimum is earlier.
(how was it in previous years ?)

Region 6 is southern USA, so warmer, closer to the tropics where#we have flu yearround,
less seasonality.

BTW. in Florida (but not in the rest of USA) we have already RSV starting,
they have a much longer RSV season.

region 6 is close to Mexico, so viruses may enter from Mexico ?
Remember our El-Paso, Mexican border threads
Remember the Arizona dust storm, valley fever
the pediatric flu-death in AZ last week
 
Back
Top