• FluTrackers.com Inc. does not provide medical advice. Information on this web site is collected from various internet resources, and the FluTrackers board of directors makes no warranty to the safety, efficacy, correctness or completeness of the information posted on this site by any author or poster. The information collated here is for instructional and/or discussion purposes only and is NOT intended to diagnose or treat any disease, illness, or other medical condition. Every individual reader or poster should seek advice from their personal physician/healthcare practitioner before considering or using any interventions that are discussed on this website. By continuing to access this website you agree to consult your personal physican before using any interventions posted on this website, and you agree to hold harmless FluTrackers.com Inc., the board of directors, the members, and all authors and posters for any effects from use of any medication, supplement, vitamin or other substance, device, intervention, etc. mentioned in posts on this website, or other internet venues referenced in posts on this website.
  • We are not asking for any donations. Do not donate to any entity who says they are raising funds for us.

US FluView - Weekly Surveillance Flu report 2024/2025 season - for trend analysis

Weekly US Influenza Surveillance Report: Key Updates for Week 13, ending March 29, 2025

What to know


Seasonal influenza activity remains elevated nationally but has decreased for two consecutive weeks.
Summary

Viruses

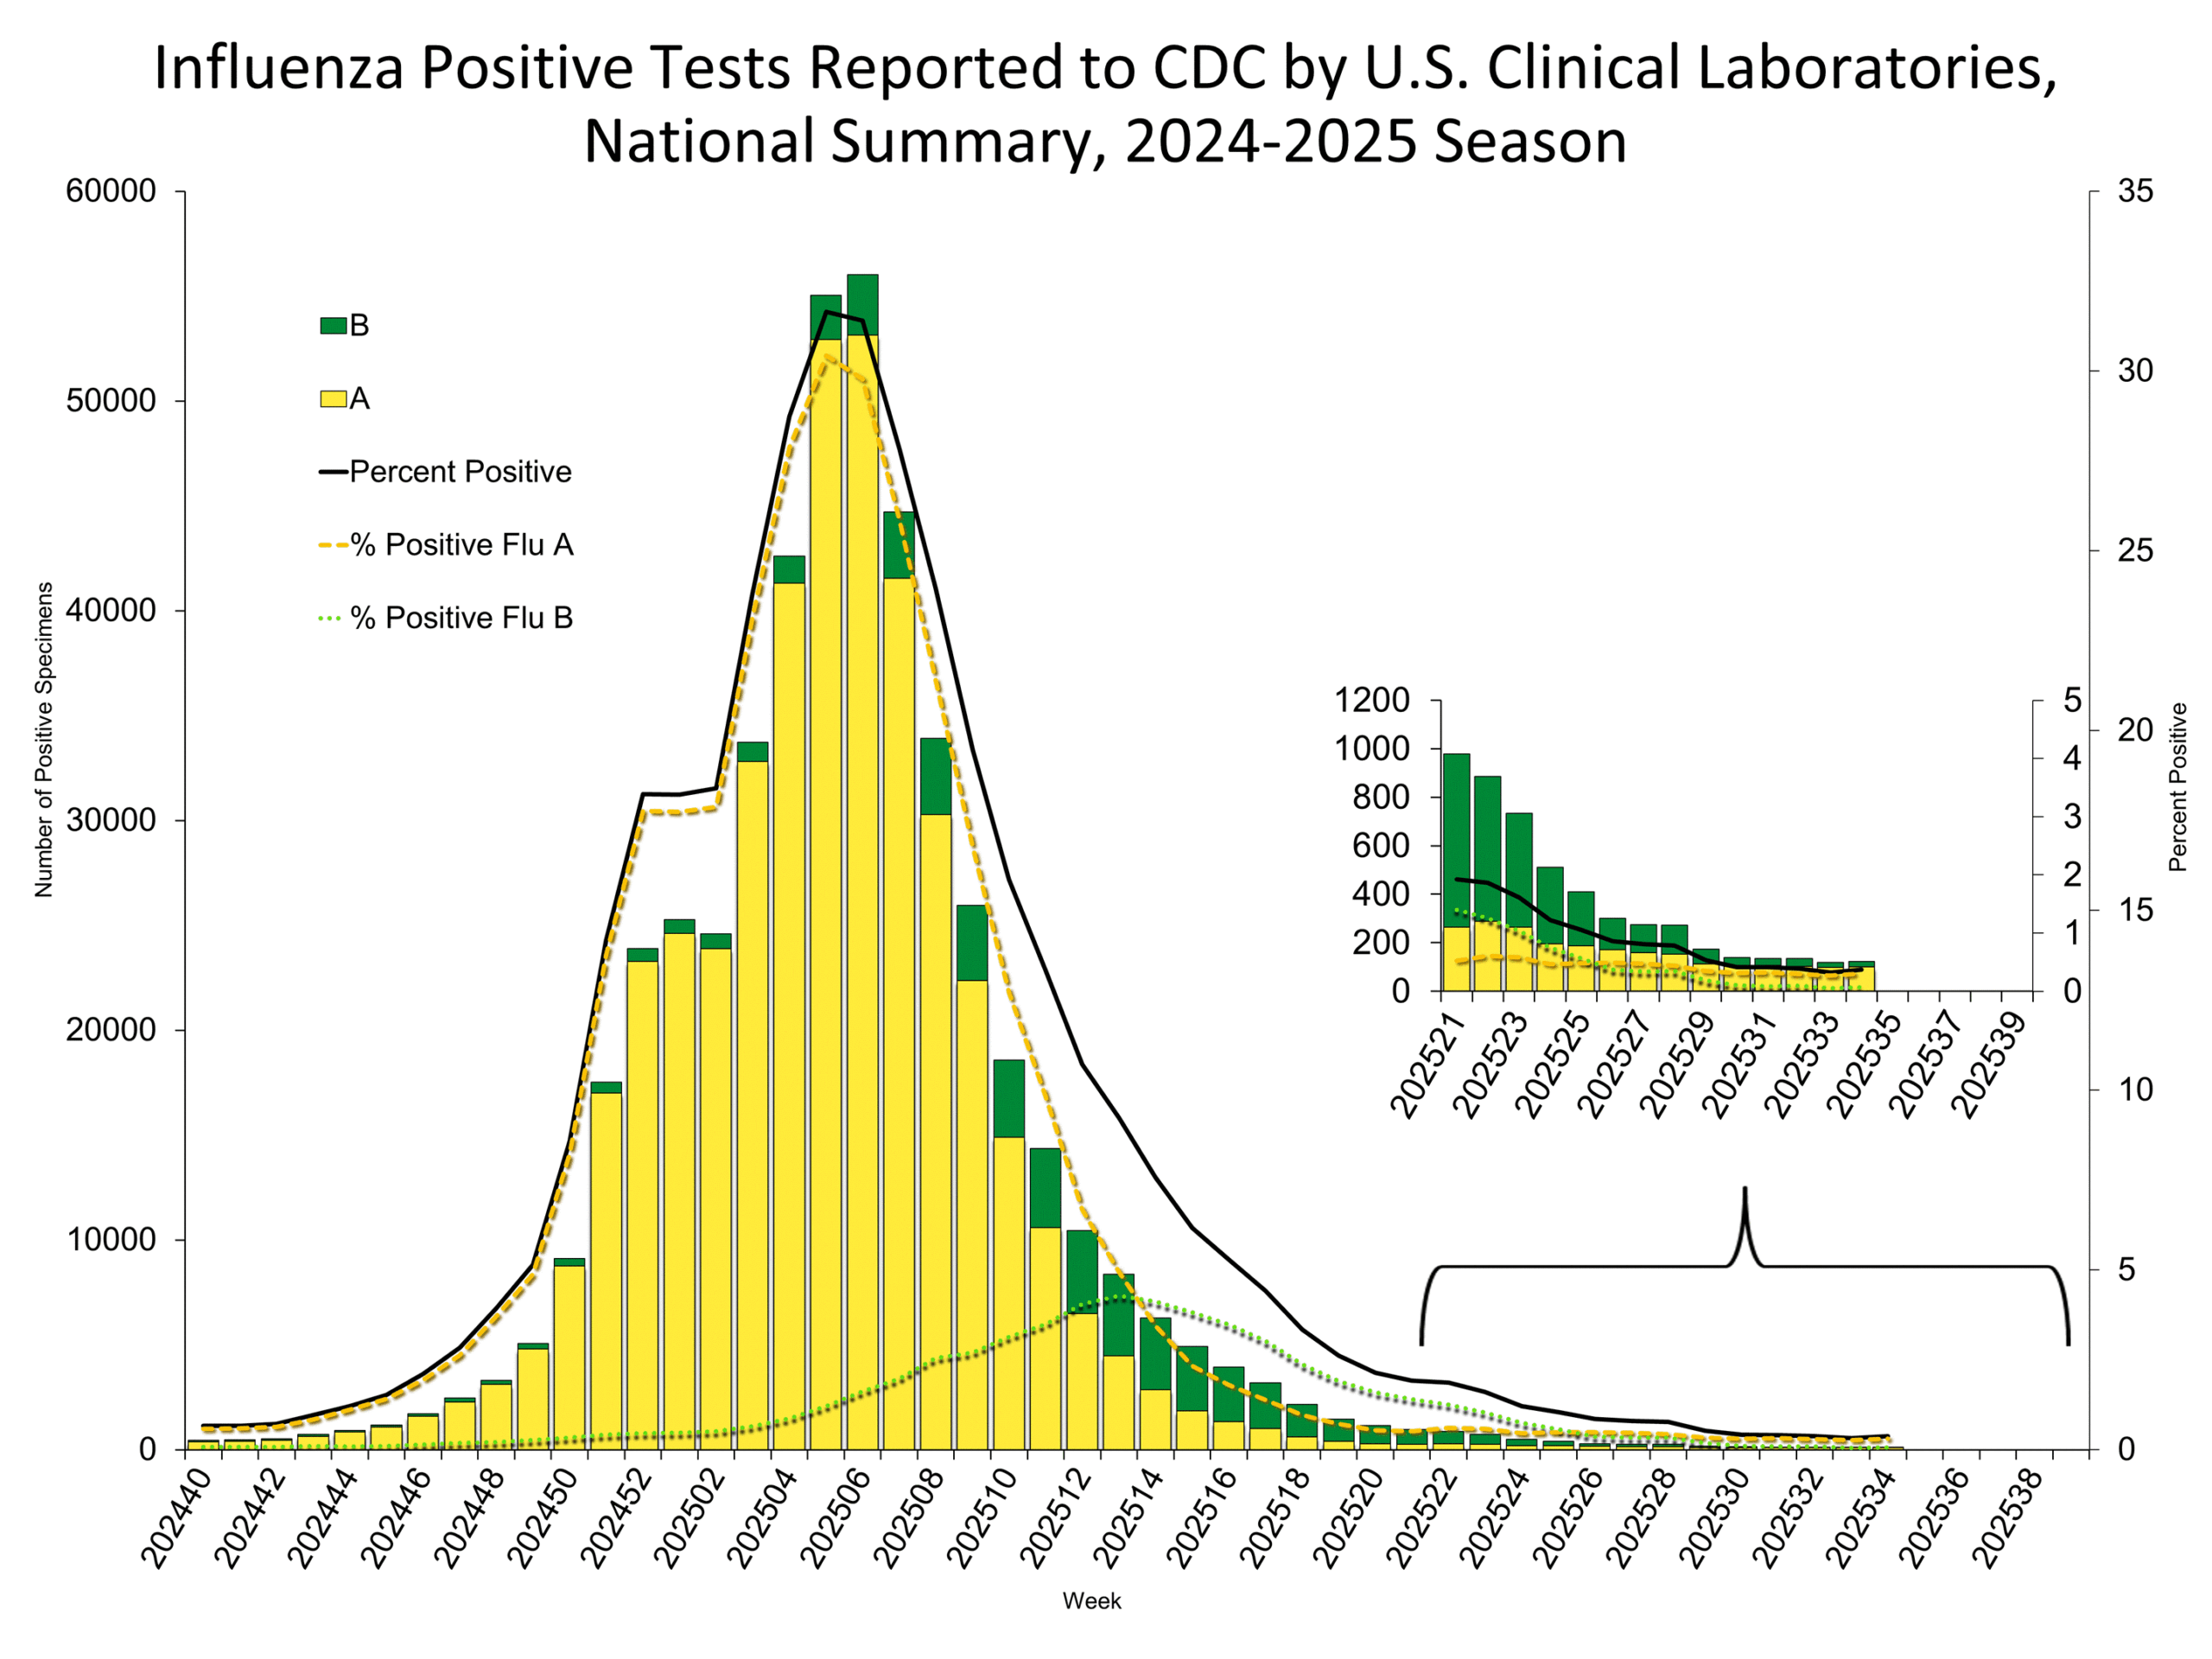
Clinical Lab 9.7% (Trend
DecreasingArrow.png
)
positive for influenza
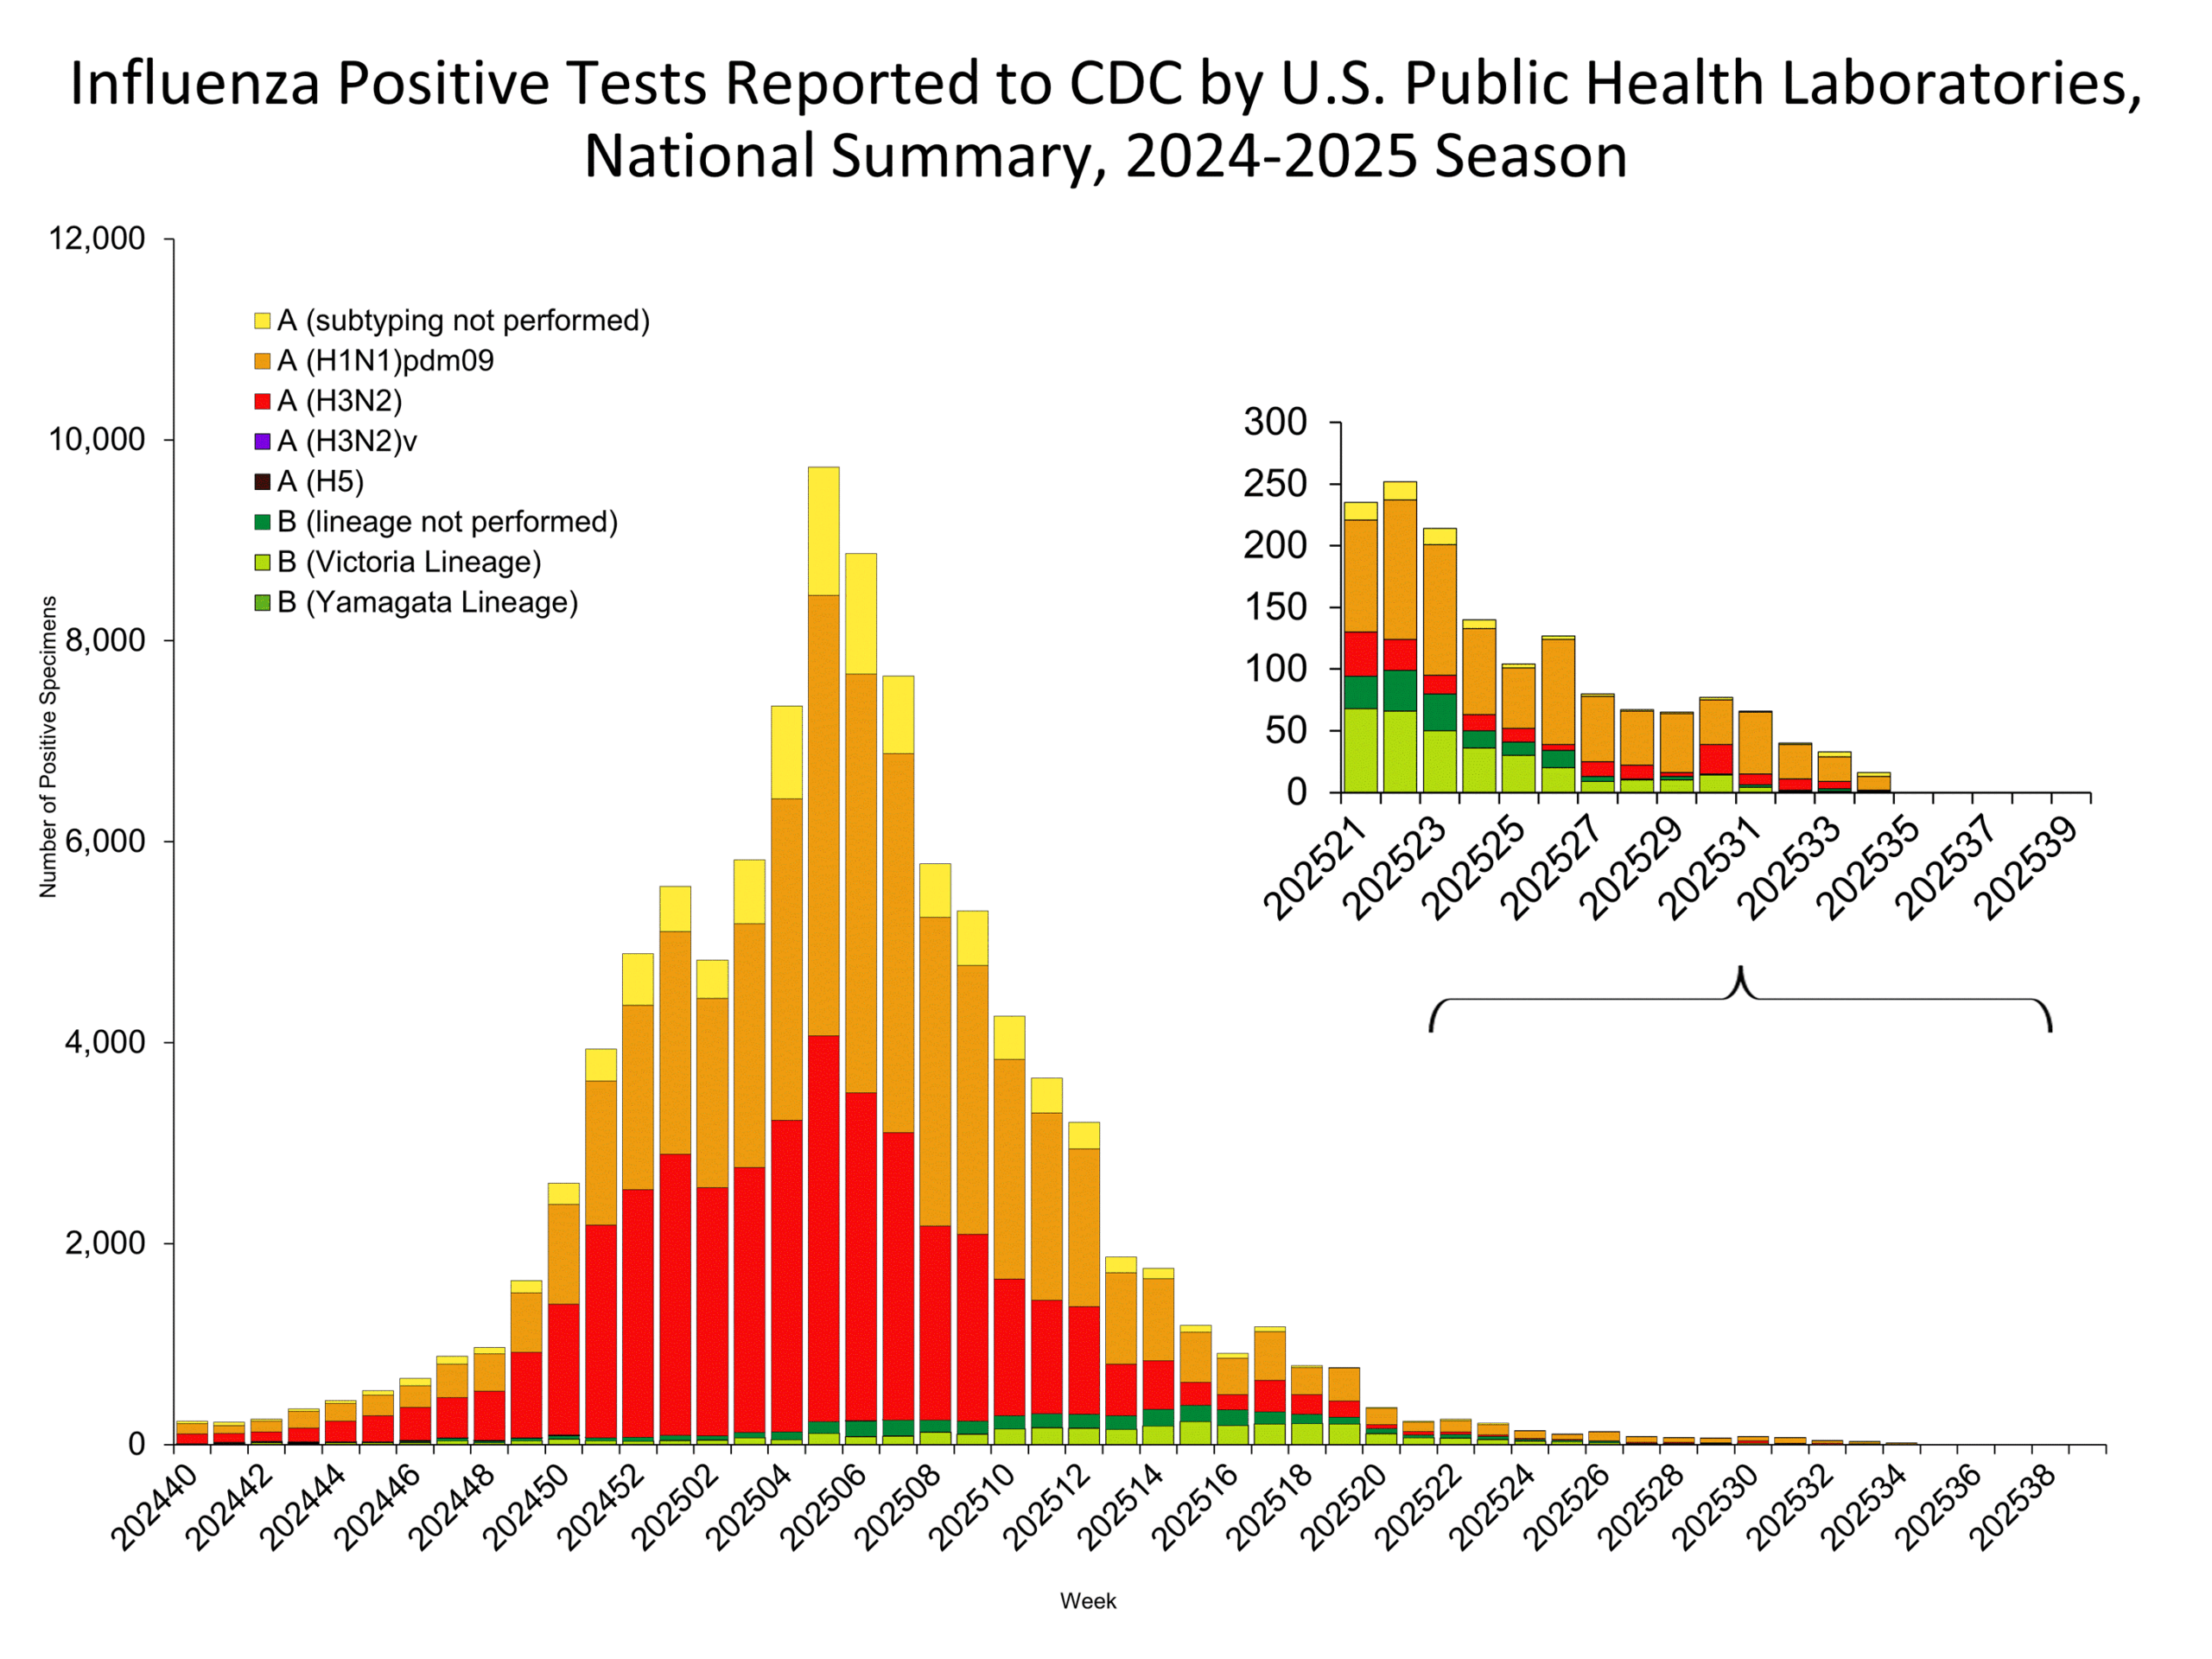
this week. Public Health Lab Influenza A(H1N1)pdm09, A(H3N2), and B
viruses were co-circulating this week.

Illness

Outpatient Respiratory Illness 3.2% (Trend
StableArrow.png
)
of visits to a health care provider this
week were for respiratory illness
(above baseline). Activity Map 12 moderate jurisdictions 2 high or very high jurisdictions FluSurv-NET 121.9 per 100,000
cumulative hospitalization rate National Healthcare Safety Network (NHSN) Hospital Respiratory Data 9,364 (Trend
DecreasingArrow.png
)
patients admitted to hospitals
with influenza this week. NCHS Mortality 0.9% (Trend
DecreasingArrow.png
)
of deaths attributed to influenza this week. Pediatric Deaths 9 influenza-associated deaths
were reported this week for
a total of 168 deaths this season.
All data are preliminary and may change as more reports are received.

Directional arrows indicate changes between the current week and the previous week. Additional information on the arrows can be found at the bottom of this page.

A description of the CDC influenza surveillance system, including methodology and detailed descriptions of each data component is available on the surveillance methods page.[SUP]1[/SUP]

Additional information on the current and previous influenza seasons for each surveillance component are available on FluView Interactive.

Key Points
  • Seasonal influenza (flu) activity continues to decline; however, CDC expects several more weeks of flu activity.
  • This season is classified as a high severity season overall and for all age groups (children, adults, older adults) and is the first high severity season since 2017-2018.
  • During Week 13, of the 1,049 viruses reported by public health laboratories, 929 were influenza A and 120 were influenza B. Of the 806 influenza A viruses subtyped during Week 13, 448 (55.6%) were influenza A(H1N1)pdm09, 358 (44.4%) were A(H3N2), and 0 (0%) were A(H5).
  • No new influenza A(H5) cases were reported to CDC this week. To date, human-to-human transmission of avian influenza A(H5) virus (H5 bird flu) has not been identified in the United States.
  • Nationally, outpatient respiratory illness remained stable this week and remains above baseline for the eighteenth consecutive week. HHS regions 1, 2, 3, and 6 are above their region-specific baselines, Region 5 is at its baseline, and all other HHS regions are below their baselines in regions.
  • Based on data from FluSurv-NET, the cumulative hospitalization rate for this season is the highest observed since the 2010-2011 season.
  • Nine pediatric deaths associated with seasonal influenza virus infection were reported this week, bringing the 2024-2025 season total to 168 pediatric deaths.
  • CDC estimates that there have been at least 45 million illnesses, 580,000 hospitalizations, and 25,000 deaths from flu so far this season.
  • CDC continues to recommend that everyone ages 6 months and older get an annual flu vaccine as long as influenza viruses are circulating.[SUP]1[/SUP]
  • There are prescription flu antiviral drugs that can treat flu illness; those should be started as early as possible and are especially important for patients at higher risk for severe illness.[SUP]2[/SUP]
  • Influenza viruses are among several viruses contributing to respiratory disease activity. CDC is providing updated, integrated information about COVID-19, flu, and respiratory syncytial virus (RSV) activity on a weekly basis.

COVID-19, flu, and RSV activity
U.S. virologic surveillance


Nationally, and in regions 1, 3, 4, 5, 7, 8, 9 and 10, the percentage of respiratory specimens testing positive for influenza virus in clinical laboratories decreased (change ≥ 0.5 percentage points), while in regions 2 and 6 the percentage remained stable (change < 0.5 percentage points) compared to the previous week. Influenza A and B viruses were co-circulating this week. For regional and state level data and age group distribution, please visit FluView Interactive. Viruses known to be associated with recent receipt of live attenuated influenza vaccine (LAIV) or found upon further testing to be a vaccine virus are not included, as they are not circulating influenza viruses.

Clinical Laboratories


The results of tests performed by clinical laboratories nationwide are summarized below. Data from clinical laboratories (the percentage of specimens tested that are positive for influenza virus) are used to monitor whether influenza activity is increasing or decreasing.
No. of specimens tested69,2632,876,143
No. of positive specimens (%)6,725 (9.7%)457,645 (15.9%)
Positive specimens by type
Influenza A3,444 (51.2%)421,653 (92.1%)
Influenza B3,281 (48.8%)35,992 (7.9%)
Public Health Laboratories


The results of tests performed by public health laboratories nationwide are summarized below. Data from public health laboratories are used to monitor the proportion of circulating influenza viruses that belong to each influenza subtype/lineage.
No. of specimens tested1,753122,424
No. of positive specimens1,04983,336
Positive specimens by type/subtype
Influenza A929 (88.6%)80,414 (96.5%)
Subtyping Performed806 (86.8%)70,797 (88.0%)
(H1N1)pdm09448 (55.6%)37,185 (52.5%)
H3N2358 (44.4%)33,532 (47.4%)
H3N2v00
H5*080 (0.1%)
Subtyping not performed123 (13.2%)9,617 (12.0%)
Influenza B120 (11.4%)2,922 (3.5%)
Lineage testing performed48 (40.0%)1,357 (46.4%)
Yamagata lineage00
Victoria lineage48 (100%)1,357 (100%)
Lineage not performed72 (60.0%)1,565 (53.6%)
[SUB]*This data reflects specimens tested and the number determined to be positive for influenza viruses at the public health labs (specimens tested is not the same as cases). It does not reflect specimens tested only at CDC and could include more than one specimen tested per person. The guidance for influenza A/H5 testing recommends testing both a conjunctival and respiratory swab for people with conjunctivitis which has resulted in more specimens testing positive for influenza A/H5 than the number of human H5 cases. For more information on the number of people infected with A/H5, please visit the [/SUB][SUB]"How CDC is monitoring influenza data among people to better understand the current avian influenza A (H5N1) situation"[/SUB]


[SUP]This graph reflects the number of specimens tested and the number determined to be positive for influenza viruses at the public health lab (specimens tested is not the same as cases). It does not reflect specimens tested only at CDC and could include more than one specimen tested per person. Specimens tested as part of routine influenza surveillance as well as those tested as part of targeted testing for people exposed to influenza A(H5) are included.[/SUP]

Additional virologic surveillance information for current and past seasons:


Surveillance Methods | FluView Interactive: National, Regional, and State Data or Age Data

Novel Influenza A Virus


No confirmed human infections with influenza A(H5) virus were reported to CDC this week. To date, human-to-human transmission of avian influenza A(H5) virus (H5 bird flu) has not been identified in the United States.

The CSTE position statement, which includes updated case definitions for confirmed, probable, and suspected cases is available at http://www.cste.org/resource/resmgr/position_statements_files_2023/24-ID-09_Novel_Influenza_A.pdf

An up-to-date human case summary during the 2024 outbreak by state and exposure source is available at www.cdc.gov/bird-flu/situation-summary/index.html

Information about avian influenza is available at https://www.cdc.gov/flu/avianflu/index.htm.

A(H5N1) virus interim recommendations for Prevention, Monitoring, and Public Health Investigations are available at https://www.cdc.gov/bird-flu/prevention/hpai-interim-recommendations.html.

The latest case reports on avian influenza outbreaks in wild birds, commercial poultry, backyard or hobbyist flocks, and mammals in the United States are available from the USDA at https://www.aphis.usda.gov/aphis/ou...e-information/avian/avian-influenza/2022-hpai.

Additional information regarding human infections with novel influenza A viruses:


Surveillance Methods | FluView Interactive

Influenza Virus Characterization


CDC performs genetic and antigenic characterization of U.S. viruses submitted from state and local public health laboratories according to the Right Size Roadmap submission guidance. These data are used to compare how similar the currently circulating influenza viruses are relative to the reference viruses representing the current influenza vaccines. The data are also used to monitor evolutionary changes that continually occur in influenza viruses circulating in humans. CDC also tests susceptibility of circulating influenza viruses to antiviral medications including the neuraminidase inhibitors (oseltamivir, zanamivir, and peramivir) and the polymerase acidic protein (PA) endonuclease inhibitor baloxavir. The HA clade and subclades were assigned using Nextclade (https://clades.nextstrain.org).

CDC has genetically characterized 3,263 influenza viruses collected since September 29, 2024.
A/H11,218
5a.2a587 (48.2%)C.1.975 (6.2%)
C.1.9.168 (5.6%)
C.1.9.25 (0.4%)
C.1.9.3433 (35.6%)
C.1.9.46 (0.5%)
5a.2a.1631 (51.8%)D30 (2.5%)
D.111 (0.9%)
D.3412 (33.8%)
D.5178 (14.6%)
A/H31,706
2a.3a1,935 (100%)G.1.3.16 (0.4%)
2a.3a.11,700 (99.6%)J.11 (0.1%)
J.1.17 (0.4%)
J.21,563 (91.6%)
J.2.145 (2.6%)
J.2.284 (4.9%)
B/Victoria339
3a.2339 (100%)C.34 (1.2%)
C.537 (10.9%)
C.5.1175 (51.6%)
C.5.51 (0.3%)
C.5.645 (13.3%)
C.5.777 (22.7%)
B/Yamagata0
Y30Y30 (0%)
CDC antigenically characterizes influenza viruses by hemagglutination inhibition (HI) assay (H1N1pdm09, H3N2, and B/Victoria viruses) or neutralization-based HINT (H3N2 viruses) using antisera that ferrets make after being infected with reference viruses representing the 2024-2025 Northern Hemisphere recommended cell or recombinant-based vaccine viruses. Antigenic differences between viruses are determined by comparing how well the antibodies made against the vaccine reference viruses recognize the circulating viruses that have been grown in cell culture. Ferret antisera are useful because antibodies raised against a particular virus can often recognize small changes in the surface proteins of other viruses. In HI assays, viruses with similar antigenic properties have antibody titer differences of less than or equal to 4-fold when compared to the reference (vaccine) virus. In HINT, viruses with similar antigenic properties have antibody neutralization titer differences of less than or equal to 8-fold. Viruses selected for antigenic characterization are a subset of the recent genetically characterized viruses and are chosen based on the genetic changes in their surface proteins and may not be proportional to the number of such viruses circulating in the United States.

Influenza A Viruses
  • A (H1N1)pdm09: 280 A(H1N1)pdm09 viruses were antigenically characterized by HI, and 278 (99.3%) were well-recognized (reacting at titers that were within 4-fold of the homologous virus titer) by ferret antisera to cell-grown A/Wisconsin/67/2022-like reference viruses representing the A(H1N1)pdm09 component for the cell- and recombinant-based influenza vaccines.
  • A (H3N2): 362 A(H3N2) viruses were antigenically characterized by HI or HINT, and 235 (64.9%) were well-recognized (reacting at titers that were within 4-fold of the homologous virus titer in HI or reacting at titers that were less than or equal to 8-fold of the homologous virus in HINT) by ferret antisera to cell-grown A/Massachusetts/18/2022-like reference viruses representing the A(H3N2) component for the cell- and recombinant-based influenza vaccines.
Influenza B Viruses
  • B/Victoria: 112 influenza B/Victoria-lineage virus were antigenically characterized by HI, and all were well-recognized (reacting at titers that were within 4-fold of the homologous virus titer) by ferret antisera to cell-grown B/Austria/1359417/2021-like reference viruses representing the B/Victoria component for the cell- and recombinant-based influenza vaccines.
  • B/Yamagata: No influenza B/Yamagata-lineage viruses were available for antigenic characterization.
Assessment of Virus Susceptibility to Antiviral Medications


CDC assesses susceptibility of influenza viruses to the antiviral medications including the neuraminidase inhibitors (oseltamivir, zanamivir, and peramivir) and the PA endonuclease inhibitor baloxavir using next generation sequence analysis supplemented by laboratory assays. Information about antiviral susceptibility test methods can be found at U.S. Influenza Surveillance: Purpose and Methods | CDC.

Viruses collected in the U.S. since September 29, 2024, were tested for antiviral susceptibility as follows:
Neuraminidase InhibitorsOseltamivirViruses Tested3,1841,2071,676301
Reduced Inhibition1 (<0.1%)1 (0.1%)00
Highly Reduced Inhibition6 (0.2%)5 (0.4%)1 (0.1%)0
PeramivirViruses Tested3,1841,2071,676301
Reduced Inhibition0000
Highly Reduced Inhibition5 (0.2%)5 (0.4%)00
ZanamivirViruses Tested3,1841,2071,676301
Reduced Inhibition0000
Highly Reduced Inhibition0000
PA Cap-Dependent Endonuclease InhibitorBaloxavirViruses Tested3,0661,0981,662306
Decreased Susceptibility1 (<0.1%)01 (0.1%)0
Five A(H1N1)pdm09 viruses had NA-H275Y amino acid substitution conferring highly reduced inhibition by oseltamivir and peramivir. One A(H1N1)pdm09 virus had NA-I223V and NA-S247N amino acid substitutions and showed reduced inhibition by oseltamivir. One A(H3N2) virus had NA-E119V amino acid substitution and showed highly reduced inhibition by oseltamivir. One A(H3N2) virus had PA-I38T amino acid substitution associated with reduced susceptibility to baloxavir.

High levels of resistance to the adamantanes (amantadine and rimantadine) persist among influenza A(H1N1)pdm09 and influenza A(H3N2) viruses (the adamantanes are not effective against influenza B viruses). Therefore, use of these antivirals for treatment and prevention of influenza A virus infection is not recommended and data from adamantane resistance testing are not presented.

Outpatient and Emergency Department Illness Surveillance

Outpatient respiratory illness visits


The U.S. Outpatient Influenza-like Illness Surveillance Network (ILINet) monitors outpatient visits for respiratory illness referred to as influenza-like illness [ILI (fever plus cough or sore throat)], not laboratory-confirmed influenza, and will therefore capture respiratory illness visits due to infection with any pathogen that can present with similar symptoms, including influenza virus, SARS-CoV-2, and RSV. It is important to evaluate syndromic surveillance data, including that from ILINet, in the context of other sources of surveillance data to obtain a complete and accurate picture of influenza, SARS-CoV-2, and other respiratory virus activity.

Nationally, during Week 13, 3.2% of patient visits reported through ILINet were due to respiratory illness that included fever plus a cough or sore throat, also referred to as ILI. This week's percentage remained stable (change of ≤ 0.1 percentage points) compared to Week 12 and remains above the national baseline of 3.0% for the eighteenth consecutive week. The percentage of visits for ILI increased slightly (change of > 0.1 percentage points) in Region 6 (likely due to a reporting anomaly) and decreased (change of > 0.1 percentage points) in all other regions this week compared to last. Regions 1, 2, 3, 6, and 10 are above their respective baselines, Region 5 is at its baseline, and regions 4, 7, 8, and 9 are below their respective baselines. Multiple respiratory viruses are co-circulating, and the relative contribution of influenza virus infections to ILI varies by location.

Outpatient respiratory illness visits by age group


About 70% of ILINet participants provide both the number of patient visits for respiratory illness and the total number of patient visits for the week broken out by age group. Based on these data, the percentage of visits for respiratory illness decreased (change of > 0.1 percentage point) in all age groups (0-4 years, 5-24 years, 25-49 years, 50-64 years, and 65+ years) in Week 13 compared to Week 12.

Outpatient respiratory illness activity map


Data collected in ILINet are used to produce a measure of ILI activity* by state/jurisdiction and Core Based Statistical Areas (CBSA).
Week 13
(Week ending
Mar. 29, 2025)
Week 12
(Week ending
Mar. 22, 2025)
Week 13
(Week ending
Mar. 29, 2025)
Week 12
(Week ending
Mar. 22, 2025)
Very High0012
High271845
Moderate12114877
Low919170193
Minimal3117455384
Insufficient Data11237228


*Data collected in ILINet may disproportionally represent certain populations within a jurisdiction or CBSA, and therefore, may not accurately depict the full picture of influenza activity for the entire jurisdiction or CBSA. Differences in the data presented here by CDC and independently by some health departments likely represent differing levels of data completeness with data presented by the health department likely being the more complete.

Additional information about medically attended visits for ILI for current and past seasons:


Surveillance Methods | FluView Interactive: National, Regional, and State Data or ILI Activity Map

National Syndromic Surveillance System (NSSP)


The overall percentage of emergency department (ED) visits with a discharge diagnosis of influenza reported in NSSP was 1.4% during Week 13, a decrease (change of > 0.1 percentage point) compared to the previous week. The percentage of ED visits with influenza discharge diagnoses decreased in all 10 HHS regions and across all age groups. RegionNationalRegion 1Region 2Region 3Region 4Region 5Region 6Region 7Region 8Region 9Region 10
Season2023-2024 & 2024-20252022-2023 Skip Over Chart Container
2.0%4.0%6.0%8.0%10.0%12.0%14.0%16.0%Percent of Emergency Department Visits for InfluenzaWeek 41 of 2023Week 45 of 2023Week 49 of 2023Week 1 of 2024Week 5 of 2024Week 9 of 2024Week 13 of 2024Week 17 of 2024Week 21 of 2024Week 25 of 2024Week 29 of 2024Week 33 of 2024Week 37 of 2024Week 41 of 2024Week 45 of 2024Week 49 of 2024Week 1 of 2025Week 5 of 2025Week 9 of 2025Week 13 of 2025

Age Group


All ages
0-4 years
5-17 years
18-64 years
65+ Skip Data Table
Data Table Download Data (CSV) Skipped data table.

Additional information about emergency department visits for flu for current and past seasons:‎‎‎


Surveillance Methods | Emergency Department Visits for COVID-19, flu, and RSV

Hospitalization surveillance

FluSurv-Net


The Influenza Hospitalization Surveillance Network (FluSurv-NET) conducts population-based surveillance for laboratory-confirmed influenza-related hospitalizations in select counties in 14 states and represents approximately 9% of the U.S. population. FluSurv-NET hospitalization data are preliminary. As data are received each week, prior case counts and rates are updated accordingly.

A total of 37,358 laboratory-confirmed influenza-associated hospitalizations were reported by FluSurv-NET sites between October 1, 2024, and March 29, 2025. The weekly hospitalization rate observed during Week 13 was 1.4 per 100,000 population. The weekly hospitalization rate observed during Week 6 (13.6 per 100,000 population) was the highest peak weekly rate observed across all seasons since 2010-2011. The cumulative hospitalization rate observed in Week 13 was 121.9 per 100,000 population, which is the highest cumulative hospitalization rate for Week 13 across all seasons since 2010-2011.

Among all hospitalizations, 36,198 (96.9%) were associated with influenza A virus, 979 (2.6%) with influenza B virus, 32 (0.1%) with influenza A virus and influenza B virus co-infection, and 149 (0.4%) with influenza virus for which the type was not determined. Among those with influenza A subtype information, 5,939 (57.2%) had A(H1N1) pdm09 and 4,441 (42.8%) had A(H3N2).

When examining rates by age, the highest cumulative hospitalization rate per 100,000 population was among adults aged 65 years and older (384.0), followed by adults aged 50-64 years (142.7), children aged 0-4 years (100), adults aged 18-49 years (49.6), and children aged 5-17 years (37.6).

When examining age-adjusted rates by race and ethnicity, the highest cumulative hospitalization rate per 100,000 population was among non-Hispanic Black persons (205.2), followed by American Indian/Alaska Native persons (150.8), non-Hispanic White persons (105.3), Hispanic persons (101.6), and Asian/Pacific Islander persons (76.1).

Among 4,082 hospitalized adults with information on underlying medical conditions, 95% had at least one reported underlying medical condition; the most commonly reported were hypertension, cardiovascular disease, metabolic disease, and obesity. Among 1,824 hospitalized women of childbearing age (15-49 years) with information on pregnancy status, 28.6% were pregnant. Among 1,554 hospitalized children with information on underlying medical conditions, 53.9% had at least one reported underlying medical condition; the most commonly reported was asthma, followed by neurologic disease and obesity.


[SUB]**In this figure, weekly rates for all seasons prior to the 2023-2024 season reflect end-of-season rates. For the 2023-2024 season, rates for recent hospital admissions are subject to reporting delays and are shown as a dashed line for the current season. As hospitalization data are received each week, prior case counts and rates are updated accordingly.[/SUB]

Additional FluSurv-NET hospitalization surveillance information for current and past seasons and additional age groups:


Surveillance Methods | FluView Interactive: Rates by Age, Sex, and Race/Ethnicity or Data on Patient Characteristics | RESP-NET Interactive

National Healthcare Safety Network (NHSN) Hospital Respiratory Data


Hospitals report to NHSN the weekly number of patients with laboratory-confirmed influenza who were admitted to the hospital. Nationally, during Week 13, 9,364 laboratory confirmed influenza-associated hospitalizations were reported. This week's influenza-associated hospitalizations decreased (change of > 5%) compared to Week 12.

The weekly hospital admission rate observed in Week 13 was 2.8 per 100,000. The weekly rate of hospital admissions decreased in all 10 HHS regions and ranged from 1.6 (Region 9) to 4.9 (Region 3).

When examining rates by age for Week 13, all age groups decreased compared to the previous week. The highest hospital admission rate per 100,000 population was among those 65+ years (8.3), followed by 50-64 years (2.8), and 0-4 years (2.3).

Additional NHSN Hospitalization Surveillance information:


Surveillance Methods | Additional Data | FluView Interactive

Mortality surveillance

National Center for Health Statistics (NCHS)


Based on NCHS mortality surveillance data available on April 3, 2025, 0.9% of the deaths that occurred during the week ending March 29, 2025 (Week 13), were due to influenza. This percentage decreased (≥ 0.1 percentage point change) compared to Week 12. The data presented are preliminary and may change as more data are received and processed.

Additional pneumonia, influenza and COVID-19 mortality surveillance information for current and past seasons:


Surveillance Methods | FluView Interactive

Influenza-Associated Pediatric Mortality


Nine influenza-associated pediatric deaths occurring during the 2024-2025 season were reported to CDC during Week 13. The deaths occurred during Week 52 of 2024 (the week ending December 28, 2024) and between weeks 9 and 12 of 2025 (the weeks ending March 1, 2025, and March 22, 2025). Seven deaths were associated with influenza A viruses. Four of the influenza A viruses had subtyping performed; one was an A(H1N1) virus and three were A(H3N2) viruses. Two deaths were associated with influenza B viruses with no lineage determined.

A total of 168 influenza-associated pediatric deaths occurring during the 2024-2025 season have been reported to CDC.

Additional pediatric mortality surveillance information for current and past seasons:


Surveillance Methods | FluView Interactive

Additional National and International Influenza Surveillance Information

Indicators Status by System


Increasing:
IncreasingArrow.png

Decreasing:
DecreasingArrow.png

Stable:
StableArrow.png


Clinical Labs: Up or down arrows indicate a change of greater than or equal to 0.5 percentage points in the percent of specimens positive for influenza compared to the previous week.
Outpatient Respiratory Illness (ILINet): Up or down arrows indicate a change of greater than 0.1 percentage points in the percent of visits due to respiratory illness (ILI) compared to the previous week.
NHSN Hospitalizations: Up or down arrows indicate change of greater than or equal to 5% of the number of patients admitted with laboratory-confirmed influenza compared to the previous week.
NCHS Mortality: Up or down arrows indicate change of greater than 0.1 percentage points of the percent of deaths due to influenza compared to the previous week.

Additional surveillance information


FluView Interactive: FluView includes enhanced web-based interactive applications that can provide dynamic visuals of the influenza data collected and analyzed by CDC. These FluView Interactive applications allow people to create customized, visual interpretations of influenza data, as well as make comparisons across flu seasons, regions, age groups and a variety of other demographics.

National Institute for Occupational Safety and Health: Monthly surveillance data on the prevalence of health-related workplace absenteeism among full-time workers in the United States are available from NIOSH.

https://www.cdc.gov/fluview/surveillance/2025-week-13.html
 
Weekly US Influenza Surveillance Report: Key Updates for Week 14, ending April 5, 2025

What to know


Seasonal influenza activity continues to decline.
Summary

Viruses

Clinical Lab 7.6% (Trend
DecreasingArrow.png
)
positive for influenza
this week. Public Health Lab Influenza A(H1N1)pdm09, A(H3N2), and B
viruses were co-circulating this week

. Illness

Outpatient Respiratory Illness 2.5% (Trend
DecreasingArrow.png
)
of visits to a health care provider this
week were for respiratory illness
(below baseline). Activity Map 5 moderate jurisdictions 0 high or very high jurisdictions FluSurv-NET 124.3 per 100,000
cumulative hospitalization rate National Healthcare Safety Network (NHSN) Hospital Respiratory Data 6,448 (Trend
DecreasingArrow.png
)
patients admitted to hospitals
with influenza this week. NCHS Mortality 0.6% (Trend
DecreasingArrow.png
)
of deaths attributed to influenza this week. Pediatric Deaths 20 influenza-associated deaths
were reported this week for
a total of 188 deaths this season.
All data are preliminary and may change as more reports are received.

Directional arrows indicate changes between the current week and the previous week. Additional information on the arrows can be found at the bottom of this page.

A description of the CDC influenza surveillance system, including methodology and detailed descriptions of each data component is available on the surveillance methods page.[SUP]1[/SUP]

Additional information on the current and previous influenza seasons for each surveillance component are available on FluView Interactive.

Key Points
  • Seasonal influenza (flu) activity continues to decline; however, CDC expects several more weeks of flu activity.
  • This season is classified as a high severity season overall and for all age groups (children, adults, older adults) and is the first high severity season since 2017-2018.
  • During Week 14, of the 993 viruses reported by public health laboratories, 876 were influenza A and 117 were influenza B. Of the 824 influenza A viruses subtyped during Week 14, 456 (55.3%) were influenza A(H1N1)pdm09, 368 (44.7%) were A(H3N2), and 0 (0%) were A(H5).
  • No new influenza A(H5) cases were reported to CDC this week. To date, human-to-human transmission of avian influenza A(H5) virus (H5 bird flu) has not been identified in the United States.
  • Nationally, outpatient respiratory illness decreased this week and is below baseline. HHS regions 1, 3, and 10 are above their region-specific baselines and all other HHS regions are below their baselines.
  • Based on data from FluSurv-NET, the cumulative hospitalization rate for this season is the highest observed since the 2010-2011 season.
  • Twenty pediatric deaths associated with seasonal influenza virus infection were reported this week, bringing the 2024-2025 season total to 188 pediatric deaths.
  • CDC estimates that there have been at least 46 million illnesses, 590,000 hospitalizations, and 26,000 deaths from flu so far this season.
  • CDC continues to recommend that everyone ages 6 months and older get an annual flu vaccine as long as influenza viruses are circulating.[SUP]1[/SUP]
  • There are prescription flu antiviral drugs that can treat flu illness; those should be started as early as possible and are especially important for patients at higher risk for severe illness.[SUP]2[/SUP]
  • Influenza viruses are among several viruses contributing to respiratory disease activity. CDC is providing updated, integrated information about COVID-19, flu, and respiratory syncytial virus (RSV) activity on a weekly basis.
COVID-19, flu, and RSV activity
U.S. virologic surveillance


Nationally, and in regions 1, 3, 4, 5, 6, 7, 8, 9 and 10, the percentage of respiratory specimens testing positive for influenza virus in clinical laboratories decreased (change ≥ 0.5 percentage points), while in region 2 the percentage remained stable (change < 0.5 percentage points) compared to the previous week. Influenza A and B viruses were co-circulating this week. For regional and state level data and age group distribution, please visit FluView Interactive. Viruses known to be associated with recent receipt of live attenuated influenza vaccine (LAIV) or found upon further testing to be a vaccine virus are not included, as they are not circulating influenza viruses.

Clinical Laboratories


The results of tests performed by clinical laboratories nationwide are summarized below. Data from clinical laboratories (the percentage of specimens tested that are positive for influenza virus) are used to monitor whether influenza activity is increasing or decreasing.
No. of specimens tested70,6432,967,628
No. of positive specimens (%)5,339 (7.6%)463,873 (15.6%)
Positive specimens by type
Influenza A2,388 (44.7%)425,352 (91.7%)
Influenza B2,951 (55.3%)38,521 (8.3%)
Public Health Laboratories


The results of tests performed by public health laboratories nationwide are summarized below. Data from public health laboratories are used to monitor the proportion of circulating influenza viruses that belong to each influenza subtype/lineage.
No. of specimens tested1,617125,506
No. of positive specimens99385,368
Positive specimens by type/subtype
Influenza A876 (88.2%)82,158 (96.2%)
Subtyping Performed824 (94.1%)72,492 (88.2%)
(H1N1)pdm09456 (55.3%)38,265 (52.8%)
H3N2368 (44.7%)34,147 (47.1%)
H3N2v[SUP]†[/SUP]00
H5*080 (0.1%)
Subtyping not performed52 (5.9%)9,666 (11.8%)
Influenza B117 (11.8%)3,210 (3.8%)
Lineage testing performed32 (27.4%)1,494 (46.5%)
Yamagata lineage00
Victoria lineage32 (100%)1,494 (100%)
Lineage not performed85 (72.6%)1,716 (53.5%)
[SUB]*These data reflect specimens tested, and the number determined to be positive for influenza viruses at the public health labs (specimens tested is not the same as cases). The data do not reflect specimens tested only at CDC and could include more than one specimen tested per person. The guidance for influenza A(H5) virus testing recommends testing both a conjunctival and respiratory swab for people with conjunctivitis which has resulted in more specimens testing positive for influenza A(H5) virus than the number of human A(H5) cases. For more information on the number of people infected with A(H5) viruses, please[/SUB][SUB] visit the [/SUB][SUB]"How CDC is monitoring influenza data among people to better understand the current avian influenza A (H5N1) situation"[/SUB]

[SUB][SUP]†[/SUP]When an influenza virus that normally circulates in swine (but not people) is detected in a person, it is called a "variant" influenza virus. Most human infections with variant influenza viruses occur following exposure to swine, but human-to-human transmission can occur. It is important to note that in most cases, variant influenza viruses have not shown the ability to spread easily and sustainably from human-to-human.[/SUB]


[SUB]This graph reflects the number of specimens tested and the number determined to be positive for influenza viruses at the public health lab (specimens tested is not the same as cases). It does not reflect specimens tested only at CDC and could include more than one specimen tested per person. Specimens tested as part of routine influenza surveillance as well as those tested as part of targeted testing for people exposed to influenza A(H5) are included.[/SUB] Additional virologic surveillance information for current and past seasons:


Surveillance Methods | FluView Interactive: National, Regional, and State Data or Age Data

Novel Influenza A Virus Infections


No confirmed human infections with influenza A(H5) virus were reported to CDC this week. To date, human-to-human transmission of avian influenza A(H5) virus (H5 bird flu) has not been identified in the United States.

The CSTE position statement, which includes updated case definitions for confirmed, probable, and suspected cases is available at http://www.cste.org/resource/resmgr/position_statements_files_2023/24-ID-09_Novel_Influenza_A.pdf

An up-to-date human case summary during the current outbreak by state and exposure source is available at www.cdc.gov/bird-flu/situation-summary/index.html

Information about avian influenza is available at https://www.cdc.gov/flu/avianflu/index.htm.

A(H5N1) virus interim recommendations for Prevention, Monitoring, and Public Health Investigations are available at https://www.cdc.gov/bird-flu/prevention/hpai-interim-recommendations.html.

The latest case reports on avian influenza outbreaks in wild birds, commercial poultry, backyard or hobbyist flocks, and mammals in the United States are available from the USDA at https://www.aphis.usda.gov/aphis/ou...e-information/avian/avian-influenza/2022-hpai.

Additional information regarding human infections with novel influenza A viruses:


Surveillance Methods | FluView Interactive

Influenza Virus Characterization


CDC performs genetic and antigenic characterization of U.S. viruses submitted from state and local public health laboratories according to the Right Size Roadmap submission guidance. These data are used to compare how similar the currently circulating influenza viruses are relative to the reference viruses representing the current influenza vaccines. The data are also used to monitor evolutionary changes that continually occur in influenza viruses circulating in humans. CDC also tests susceptibility of circulating influenza viruses to antiviral medications including the neuraminidase inhibitors (oseltamivir, zanamivir, and peramivir) and the polymerase acidic protein (PA) endonuclease inhibitor baloxavir. The HA clade and subclades were assigned using Nextclade (https://clades.nextstrain.org).

CDC has genetically characterized 3,477 influenza viruses collected since September 29, 2024.
A/H11,311
5a.2a602 (45.9%)C.1.976 (5.8%)
C.1.9.169 (5.3%)
C.1.9.25 (0.4%)
C.1.9.3446 (34.0%)
C.1.9.46 (0.5%)
5a.2a.1709 (54.1%)D32 (2.4%)
D.111 (0.8%)
D.3488 (37.2%)
D.5178 (13.6%)
A/H31,802
2a.3a6 (0.3%)G.1.3.16 (0.3%)
2a.3a.11,796 (99.7%)J.11 (0.1%)
J.1.17 (0.4%)
J.21,651 (91.6%)
J.2.146 (2.6%)
J.2.291 (5.0%)
B/Victoria364
3a.2364 (100.0%)C.35 (1.4%)
C.538 (10.4%)
C.5.1181 (49.7%)
C.5.51 (0.3%)
C.5.648 (13.2%)
C.5.791 (25.0%)
B/Yamagata0
Y30Y30 (0%)
CDC antigenically characterizes influenza viruses by hemagglutination inhibition (HI) assay (H1N1pdm09, H3N2, and B/Victoria viruses) or neutralization-based HINT (H3N2 viruses) using antisera that ferrets make after being infected with reference viruses representing the 2024-2025 Northern Hemisphere recommended cell or recombinant-based vaccine viruses. Antigenic differences between viruses are determined by comparing how well the antibodies made against the vaccine reference viruses recognize the circulating viruses that have been grown in cell culture. Ferret antisera are useful because antibodies raised against a particular virus can often recognize small changes in the surface proteins of other viruses. In HI assays, viruses with similar antigenic properties have antibody titer differences of less than or equal to 4-fold when compared to the reference (vaccine) virus. In HINT, viruses with similar antigenic properties have antibody neutralization titer differences of less than or equal to 8-fold. Viruses selected for antigenic characterization are a subset of the recent genetically characterized viruses and are chosen based on the genetic changes in their surface proteins and may not be proportional to the number of such viruses circulating in the United States.

Influenza A Viruses
  • A(H1N1)pdm09: 341 A(H1N1)pdm09 viruses were antigenically characterized by HI, and 339 (99.4%) were well-recognized (reacting at titers that were within 4-fold of the homologous virus titer) by ferret antisera to cell-grown A/Wisconsin/67/2022-like reference viruses representing the A(H1N1)pdm09 component for the cell- and recombinant-based influenza vaccines.
  • A(H3N2): 362 A(H3N2) viruses were antigenically characterized by HI or HINT, and 235 (64.9%) were well-recognized (reacting at titers that were within 4-fold of the homologous virus titer in HI or reacting at titers that were less than or equal to 8-fold of the homologous virus in HINT) by ferret antisera to cell-grown A/Massachusetts/18/2022-like reference viruses representing the A(H3N2) component for the cell- and recombinant-based influenza vaccines.
Influenza B Viruses
  • B/Victoria: 131 influenza B/Victoria-lineage virus were antigenically characterized by HI, and 129 (98.5%) were well-recognized (reacting at titers that were within 4-fold of the homologous virus titer) by ferret antisera to cell-grown B/Austria/1359417/2021-like reference viruses representing the B/Victoria component for the cell- and recombinant-based influenza vaccines.
  • B/Yamagata: No influenza B/Yamagata-lineage viruses were available for antigenic characterization.
Assessment of Virus Susceptibility to Antiviral Medications


CDC assesses susceptibility of influenza viruses to the antiviral medications including the neuraminidase inhibitors (oseltamivir, zanamivir, and peramivir) and the PA endonuclease inhibitor baloxavir using next generation sequence analysis supplemented by laboratory assays. Information about antiviral susceptibility test methods can be found at U.S. Influenza Surveillance: Purpose and Methods.

Viruses collected in the U.S. since September 29, 2024, were tested for antiviral susceptibility as follows:
Neuraminidase InhibitorsOseltamivirViruses Tested3,4241,2951,774355
Reduced Inhibition1 (<0.1%)1 (<0.1%)00
Highly Reduced Inhibition7 (0.2%)6 (0.5%)1 (<0.1%)0
PeramivirViruses Tested3,4241,2951,774355
Reduced Inhibition0000
Highly Reduced Inhibition6 (0.2%)6 (0.5%)00
ZanamivirViruses Tested3,4241,2951,774355
Reduced Inhibition0000
Highly Reduced Inhibition0000
PA Cap-Dependent Endonuclease InhibitorBaloxavirViruses Tested3,2811,1821,756343
Decreased Susceptibility1 (<0.1%)01 (<0.1%)0
Six A(H1N1)pdm09 viruses had NA-H275Y amino acid substitution conferring highly reduced inhibition by oseltamivir and peramivir. One A(H1N1)pdm09 virus had NA-I223V and NA-S247N amino acid substitutions and showed reduced inhibition by oseltamivir. One A(H3N2) virus had NA-E119V amino acid substitution and showed highly reduced inhibition by oseltamivir. One A(H3N2) virus had PA-I38T amino acid substitution associated with reduced susceptibility to baloxavir.

High levels of resistance to the adamantanes (amantadine and rimantadine) persist among influenza A(H1N1)pdm09 and influenza A(H3N2) viruses (the adamantanes are not effective against influenza B viruses). Therefore, use of these antivirals for treatment and prevention of influenza A virus infection is not recommended and data from adamantane resistance testing are not presented.

Outpatient and Emergency Department Illness Surveillance

Outpatient respiratory illness visits


The U.S. Outpatient Influenza-like Illness Surveillance Network (ILINet) monitors outpatient visits for respiratory illness referred to as influenza-like illness [ILI (fever plus cough or sore throat)], not laboratory-confirmed influenza, and will therefore capture respiratory illness visits due to infection with any pathogen that can present with similar symptoms, including influenza virus, SARS-CoV-2, and RSV. It is important to evaluate syndromic surveillance data, including that from ILINet, in the context of other sources of surveillance data to obtain a complete and accurate picture of influenza, SARS-CoV-2, and other respiratory virus activity.

Nationally, during Week 14, 2.5% of patient visits reported through ILINet were due to respiratory illness that included fever plus a cough or sore throat, also referred to as ILI. This week's percentage decreased (change of > 0.1 percentage points) compared to Week 13 and is below the national baseline of 3.0%. The percentage of visits for ILI decreased (change of > 0.1 percentage points) in all HHS regions this week compared to last. Regions 1, 3, and 10 are above their respective baselines. Regions 2, 4, 5, 6, 7, 8, and 9 are below their respective baselines. Multiple respiratory viruses are co-circulating, and the relative contribution of influenza virus infections to ILI varies by location.

Outpatient respiratory illness visits by age group


About 70% of ILINet participants provide both the number of patient visits for respiratory illness and the total number of patient visits for the week broken out by age group. Based on these data, the percentage of visits for respiratory illness decreased (change of > 0.1 percentage point) in all age groups (0-4 years, 5-24 years, 25-49 years, 50-64 years, and 65+ years) in Week 14 compared to Week 13.

Outpatient respiratory illness activity map


Data collected in ILINet are used to produce a measure of ILI activity* by state/jurisdiction and Core Based Statistical Areas (CBSA).
Week 14
(Week ending
Apr. 5, 2025)
Week 13
(Week ending
Mar. 29, 2025)
Week 14
(Week ending
Apr. 5, 2025)
Week 13
(Week ending
Mar. 29, 2025)
Very High0011
High02618
Moderate5122748
Low139101171
Minimal3731564465
Insufficient Data01230226


*Data collected in ILINet may disproportionally represent certain populations within a jurisdiction or CBSA, and therefore, may not accurately depict the full picture of influenza activity for the entire jurisdiction or CBSA. Differences in the data presented here by CDC and independently by some health departments likely represent differing levels of data completeness with data presented by the health department likely being the more complete.

Additional information about medically attended visits for ILI for current and past seasons:


Surveillance Methods | FluView Interactive: National, Regional, and State Data or ILI Activity Map

National Syndromic Surveillance System (NSSP)


The overall percentage of emergency department (ED) visits with a discharge diagnosis of influenza reported in NSSP was 1.1% during Week 14, a decrease (change of > 0.1 percentage point) compared to the previous week. The percentage of ED visits with influenza discharge diagnoses decreased in all 10 HHS regions and across all age groups. RegionNationalRegion 1Region 2Region 3Region 4Region 5Region 6Region 7Region 8Region 9Region 10
Season2023-2024 & 2024-20252022-2023 Skip Over Chart Container
2.0%4.0%6.0%8.0%10.0%12.0%14.0%16.0%Percent of Emergency Department Visits for InfluenzaWeek 42 of 2023Week 46 of 2023Week 50 of 2023Week 2 of 2024Week 6 of 2024Week 10 of 2024Week 14 of 2024Week 18 of 2024Week 22 of 2024Week 26 of 2024Week 30 of 2024Week 34 of 2024Week 38 of 2024Week 42 of 2024Week 46 of 2024Week 50 of 2024Week 2 of 2025Week 6 of 2025Week 10 of 2025Week 14 of 2025

Age Group


All ages
0-4 years
5-17 years
18-64 years
65+ Skip Data Table
Data Table Download Data (CSV) Skipped data table.

Additional information about emergency department visits for flu for current and past seasons:‎‎‎


Surveillance Methods | Emergency Department Visits for COVID-19, flu, and RSV

Hospitalization surveillance

FluSurv-Net


The Influenza Hospitalization Surveillance Network (FluSurv-NET) conducts population-based surveillance for laboratory-confirmed influenza-related hospitalizations in select counties in 14 states and represents approximately 9% of the U.S. population. FluSurv-NET hospitalization data are preliminary. As data are received each week, prior case counts and rates are updated accordingly.

A total of 38,080 laboratory-confirmed influenza-associated hospitalizations were reported by FluSurv-NET sites between October 1, 2024 and April 05, 2025. The weekly hospitalization rate observed during Week 14 was 1.2 per 100,000 population. The weekly hospitalization rates observed during Weeks 5 and 6 (13.6 per 100,000 population) were tied for the highest peak weekly rate observed across all seasons since 2010-2011. The cumulative hospitalization rate observed in Week 14 was 124.3 per 100,000 population, which is the highest cumulative hospitalization rate for all seasons since 2010-2011.

Among all hospitalizations, 36,766 (96.6%) were associated with influenza A virus, 1,128 (3.0%) with influenza B virus, 32 (0.1%) with influenza A virus and influenza B virus co-infection, and 154 (0.4%) with influenza virus for which the type was not determined. Among those with influenza A subtype information, 6,131 (57.6%) had A(H1N1) pdm09 and 4,509 (42.4%) had A(H3N2).

When examining rates by age, the highest cumulative hospitalization rate per 100,000 population was among adults aged 65 years and older (391.3), followed by adults aged 50-64 years (145.6), children aged 0-4 years (101.1), adults aged 18-49 years (50.6), and children aged 5-17 years (38.3).

When examining age-adjusted rates by race and ethnicity, the highest cumulative hospitalization rate per 100,000 population was among non-Hispanic Black persons (208.8), followed by American Indian/Alaska Native persons (159.1), non-Hispanic White persons (107.3), Hispanic persons (104.2), and Asian/Pacific Islander persons (77.0).

Among 4,372 hospitalized adults with information on underlying medical conditions, 95.0% had at least one reported underlying medical condition; the most commonly reported were hypertension, cardiovascular disease, metabolic disease, and obesity. Among 1,871 hospitalized women of childbearing age (15-49 years) with information on pregnancy status, 28.2% were pregnant. Among 1,685 hospitalized children with information on underlying medical conditions, 54.2% had at least one reported underlying medical condition; the most commonly reported was asthma, followed by neurologic disease and obesity.


[SUB]**In this figure, weekly rates for all seasons prior to the 2024-2025 season reflect end-of-season rates. For the 2024-2025 season, rates for recent hospital admissions are subject to reporting delays and are shown as a dashed line for the current season. As hospitalization data are received each week, prior case counts and rates are updated accordingly.[/SUB]

Additional FluSurv-NET hospitalization surveillance information for current and past seasons and additional age groups:


Surveillance Methods | FluView Interactive: Rates by Age, Sex, and Race/Ethnicity or Data on Patient Characteristics | RESP-NET Interactive

National Healthcare Safety Network (NHSN) Hospital Respiratory Data


Hospitals report to NHSN the weekly number of patients with laboratory-confirmed influenza who were admitted to the hospital. Nationally, during Week 14, 6,448 laboratory confirmed influenza-associated hospitalizations were reported. This week's influenza-associated hospitalizations decreased (change of > 5%) compared to Week 13.

The weekly hospital admission rate observed in Week 14 was 1.9 per 100,000. The weekly rate of hospital admissions decreased in all 10 HHS regions and ranged from 1.2 (Region 9) to 3.2 (Region 3).

When examining rates by age for Week 14, all age groups decreased compared to the previous week. The highest hospital admission rate per 100,000 population was among those 65+ years (5.6), followed by 50-64 years (1.9), and 0-4 years (1.7).

Additional NHSN Hospital Respiratory Data information:


Surveillance Methods | Additional Data | FluView Interactive

Mortality surveillance

National Center for Health Statistics (NCHS) Mortality Surveillance


Based on NCHS mortality surveillance data available on April 10, 2025, 0.6% of the deaths that occurred during the week ending April 5, 2025 (Week 14), were due to influenza. This percentage decreased (≥ 0.1 percentage point change) compared to Week 13. The data presented are preliminary and may change as more data are received and processed.

Additional pneumonia, influenza and COVID-19 mortality surveillance information for current and past seasons:


Surveillance Methods | FluView Interactive

Influenza-Associated Pediatric Mortality


Twenty influenza-associated pediatric deaths occurring during the 2024-2025 season were reported to CDC during Week 14. The deaths occurred between Week 51 of 2024 (the week ending December 21, 2024) and Week 13 of 2025 (the week ending March 29, 2025). Nineteen deaths were associated with influenza A viruses. Fourteen of the influenza A viruses had subtyping performed; nine were A(H1N1) viruses and five were A(H3N2) viruses. One death was associated with an influenza B virus with no lineage determined.

A total of 188 influenza-associated pediatric deaths occurring during the 2024-2025 season have been reported to CDC.

Additional pediatric mortality surveillance information for current and past seasons:


Surveillance Methods | FluView Interactive

Additional National and International Influenza Surveillance Information

Indicators Status by System


Increasing:
IncreasingArrow.png

Decreasing:
DecreasingArrow.png

Stable:
StableArrow.png


Clinical Labs: Up or down arrows indicate a change of greater than or equal to 0.5 percentage points in the percent of specimens positive for influenza compared to the previous week.
Outpatient Respiratory Illness (ILINet): Up or down arrows indicate a change of greater than 0.1 percentage points in the percent of visits due to respiratory illness (ILI) compared to the previous week.
NHSN Hospitalizations: Up or down arrows indicate change of greater than or equal to 5% of the number of patients admitted with laboratory-confirmed influenza compared to the previous week.
NCHS Mortality: Up or down arrows indicate change of greater than 0.1 percentage points of the percent of deaths due to influenza compared to the previous week.

Additional surveillance information


FluView Interactive: FluView includes enhanced web-based interactive applications that can provide dynamic visuals of the influenza data collected and analyzed by CDC. These FluView Interactive applications allow people to create customized, visual interpretations of influenza data, as well as make comparisons across flu seasons, regions, age groups and a variety of other demographics.

National Institute for Occupational Safety and Health: Monthly surveillance data on the prevalence of health-related workplace absenteeism among full-time workers in the United States are available from NIOSH.

https://www.cdc.gov/fluview/surveillance/2025-week-14.html
 
Weekly US Influenza Surveillance Report: Key Updates for Week 15, ending April 12, 2025

What to know


Seasonal influenza activity continues to decline.
Summary

Viruses

Clinical Lab 6.7% (Trend
DecreasingArrow.png
)
positive for influenza
this week. Public Health Lab Influenza A(H1N1)pdm09, A(H3N2), and B
viruses were co-circulating this week. Illness

Outpatient Respiratory Illness 2.4% (Trend
DecreasingArrow.png
)
of visits to a health care provider this
week were for respiratory illness
(below baseline). Activity Map 2 moderate jurisdictions 1 high or very high jurisdictions FluSurv-NET 125.6 per 100,000
cumulative hospitalization rate National Healthcare Safety Network (NHSN) Hospital Respiratory Data 4,639 (Trend
DecreasingArrow.png
)
patients admitted to hospitals
with influenza this week. NCHS Mortality 0.5% (Trend
DecreasingArrow.png
)
of deaths attributed to influenza this week. Pediatric Deaths 10 influenza-associated deaths
were reported this week for
a total of 198 deaths this season.
All data are preliminary and may change as more reports are received.

Directional arrows indicate changes between the current week and the previous week. Additional information on the arrows can be found at the bottom of this page.

A description of the CDC influenza surveillance system, including methodology and detailed descriptions of each data component is available on the surveillance methods page.[SUP]1[/SUP]

Additional information on the current and previous influenza seasons for each surveillance component are available on FluView Interactive.

Key Points
  • Seasonal influenza (flu) activity continues to decline; however, CDC expects several more weeks of flu activity.
  • This season is classified as a high severity season overall and for all age groups (children, adults, older adults) and is the first high severity season since 2017-2018.
  • During Week 15, of the 620 viruses reported by public health laboratories, 429 were influenza A and 191 were influenza B. Of the 381 influenza A viruses subtyped during Week 15, 248 (65.1%) were influenza A(H1N1)pdm09, 133 (34.9%) were A(H3N2), and 0 were A(H5).
  • No new influenza A(H5) cases were reported to CDC this week. To date, human-to-human transmission of avian influenza A(H5) virus (H5 bird flu) has not been identified in the United States.
  • Nationally, outpatient respiratory illness decreased this week and is below baseline. HHS Region 1 is above its region-specific baseline, Region 10 is at its baseline, and all other HHS regions are below their respective baselines.
  • Based on data from FluSurv-NET, the cumulative hospitalization rate for this season is the highest observed since the 2010-2011 season.
  • Ten pediatric deaths associated with seasonal influenza virus infection were reported this week, bringing the 2024-2025 season total to 198 pediatric deaths.
  • CDC estimates that there have been at least 46 million illnesses, 600,000 hospitalizations, and 26,000 deaths from flu so far this season.
  • CDC continues to recommend that everyone ages 6 months and older get an annual flu vaccine as long as influenza viruses are circulating.[SUP]1[/SUP]
  • There are prescription flu antiviral drugs that can treat flu illness; those should be started as early as possible and are especially important for patients at higher risk for severe illness.[SUP]2[/SUP]
  • Influenza viruses are among several viruses contributing to respiratory disease activity. CDC is providing updated, integrated information about COVID-19, flu, and respiratory syncytial virus (RSV) activity on a weekly basis.
COVID-19, flu, and RSV activity
U.S. virologic surveillance


Nationally, and in regions 1, 3, 5, 6, 7, 9 and 10, the percentage of respiratory specimens testing positive for influenza virus in clinical laboratories decreased (change ≥ 0.5 percentage points), while in regions 2, 4, and 8 the percentage remained stable (change < 0.5 percentage points) compared to the previous week. Influenza A and B viruses were co-circulating this week. For regional and state level data and age group distribution, please visit FluView Interactive. Viruses known to be associated with recent receipt of live attenuated influenza vaccine (LAIV) or found upon further testing to be a vaccine virus are not included, as they are not circulating influenza viruses.

Clinical Laboratories


The results of tests performed by clinical laboratories nationwide are summarized below. Data from clinical laboratories (the percentage of specimens tested that are positive for influenza virus) are used to monitor whether influenza activity is increasing or decreasing.
No. of specimens tested65,0663,050,300
No. of positive specimens (%)4,354 (6.7%)470,795 (15.4%)
Positive specimens by type
Influenza A1,576 (36.2%)427,767 (90.9%)
Influenza B2,778 (63.8%)43,028 (9.1%)
Public Health Laboratories


The results of tests performed by public health laboratories nationwide are summarized below. Data from public health laboratories are used to monitor the proportion of circulating influenza viruses that belong to each influenza subtype/lineage.
No. of specimens tested1,198127,887
No. of positive specimens62086,719
Positive specimens by type/subtype
Influenza A429 (69.2%)83,179 (95.9%)
Subtyping Performed381 (88.8%)73,537 (88.4%)
(H1N1)pdm09248 (65.1%)38,950 (53.0%)
H3N2133 (34.9%)34,507 (46.9%)
H3N2v00
H5*080 (0.1%)
Subtyping not performed48 (11.2%)9,642 (11.6%)
Influenza B191 (30.8%)3,540 (4.1%)
Lineage testing performed114 (59.7%)1,685 (47.6%)
Yamagata lineage00
Victoria lineage114 (100%)1,685 (100%)
Lineage not performed77 (40.3%)1,855 (52.4%)
[SUB]*This data reflects specimens tested and the number determined to be positive for influenza viruses at the public health labs (specimens tested is not the same as cases). It does not reflect specimens tested only at CDC and could include more than one specimen tested per person. The guidance for influenza A/H5 testing recommends testing both a conjunctival and respiratory swab for people with conjunctivitis which has resulted in more specimens testing positive for influenza A/H5 than the number of human H5 cases. For more information on the number of people infected with A/H5, please visit the [/SUB][SUB]"How CDC is monitoring influenza data among people to better understand the current avian influenza A (H5N1) situation"[/SUB]


[SUP]This graph reflects the number of specimens tested and the number determined to be positive for influenza viruses at the public health lab (specimens tested is not the same as cases). It does not reflect specimens tested only at CDC and could include more than one specimen tested per person. Sp
ecimens tested as part of routine influenza surveillance as well as those tested as part of targeted testing for people exposed to influenza A(H5) are included.[/SUP]

Additional virologic surveillance information for current and past seasons:


Surveillance Methods | FluView Interactive: National, Regional, and State Data or Age Data

Novel Influenza A Virus


No confirmed human infections with influenza A(H5) virus were reported to CDC this week. To date, human-to-human transmission of avian influenza A(H5) virus (H5 bird flu) has not been identified in the United States.

The CSTE position statement, which includes updated case definitions for confirmed, probable, and suspected cases is available at http://www.cste.org/resource/resmgr/position_statements_files_2023/24-ID-09_Novel_Influenza_A.pdf

An up-to-date human case summary during the 2024 outbreak by state and exposure source is available at www.cdc.gov/bird-flu/situation-summary/index.html

Information about avian influenza is available at https://www.cdc.gov/flu/avianflu/index.htm.

A(H5N1) virus interim recommendations for Prevention, Monitoring, and Public Health Investigations are available at https://www.cdc.gov/bird-flu/prevention/hpai-interim-recommendations.html.

The latest case reports on avian influenza outbreaks in wild birds, commercial poultry, backyard or hobbyist flocks, and mammals in the United States are available from the USDA at https://www.aphis.usda.gov/aphis/ou...e-information/avian/avian-influenza/2022-hpai

Additional information regarding human infections with novel influenza A viruses:


Surveillance Methods | FluView Interactive

Influenza Virus Characterization


CDC performs genetic and antigenic characterization of U.S. viruses submitted from state and local public health laboratories according to the Right Size Roadmap submission guidance. These data are used to compare how similar the currently circulating influenza viruses are relative to the reference viruses representing the current influenza vaccines. The data are also used to monitor evolutionary changes that continually occur in influenza viruses circulating in humans. CDC also tests susceptibility of circulating influenza viruses to antiviral medications including the neuraminidase inhibitors (oseltamivir, zanamivir, and peramivir) and the polymerase acidic protein (PA) endonuclease inhibitor baloxavir. The HA clade and subclades were assigned using Nextclade (https://clades.nextstrain.org).

CDC has genetically characterized 3,745 influenza viruses collected since September 29, 2024.
A/H11,398
5a.2a613 (43.8%)C.1.977 (5.5%)
C.1.9.169 (4.9%)
C.1.9.25 (0.4%)
C.1.9.3456 (32.6%)
C.1.9.46 (0.4%)
5a.2a.1785 (56.2%)D33 (2.4%)
D.111 (0.8%)
D.3563 (40.3%)
D.5178 (12.7%)
A/H31,935
2a.3a6 (0.3%)G.1.3.16 (0.3%)
2a.3a.11,929 (99.7%)J.11 (0.1%)
J.1.18 (0.4%)
J.21,761 (91.0%)
J.2.147 (2.4%)
J.2.2112 (5.8%)
B/Victoria412
3a.2412 (100%)C.39 (2.2%)
C.542 (10.2%)
C.5.1209 (50.7%)
C.5.51 (0.2%)
C.5.652 (12.6%)
C.5.799 (24.0%)
B/Yamagata0
Y30Y30 (0%)
CDC antigenically characterizes influenza viruses by hemagglutination inhibition (HI) assay (H1N1pdm09, H3N2, and B/Victoria viruses) or neutralization-based HINT (H3N2 viruses) using antisera that ferrets make after being infected with reference viruses representing the 2024-2025 Northern Hemisphere recommended cell or recombinant-based vaccine viruses. Antigenic differences between viruses are determined by comparing how well the antibodies made against the vaccine reference viruses recognize the circulating viruses that have been grown in cell culture. Ferret antisera are useful because antibodies raised against a particular virus can often recognize small changes in the surface proteins of other viruses. In HI assays, viruses with similar antigenic properties have antibody titer differences of less than or equal to 4-fold when compared to the reference (vaccine) virus. In HINT, viruses with similar antigenic properties have antibody neutralization titer differences of less than or equal to 8-fold. Viruses selected for antigenic characterization are a subset of the recent genetically characterized viruses and are chosen based on the genetic changes in their surface proteins and may not be proportional to the number of such viruses circulating in the United States. Influenza A Viruses
  • A (H1N1)pdm09: 341 A(H1N1)pdm09 viruses were antigenically characterized by HI, and 339 (99.4%) were well-recognized (reacting at titers that were within 4-fold of the homologous virus titer) by ferret antisera to cell-grown A/Wisconsin/67/2022-like reference viruses representing the A(H1N1)pdm09 component for the cell- and recombinant-based influenza vaccines.
  • A (H3N2): 401 A(H3N2) viruses were antigenically characterized by HI or HINT, and 249 (62.1%) were well-recognized (reacting at titers that were within 4-fold of the homologous virus titer in HI or reacting at titers that were less than or equal to 8-fold of the homologous virus in HINT) by ferret antisera to cell-grown A/Massachusetts/18/2022-like reference viruses representing the A(H3N2) component for the cell- and recombinant-based influenza vaccines.
Influenza B Viruses
  • B/Victoria: 134 influenza B/Victoria-lineage virus were antigenically characterized by HI, and 132 (98.5%) were well-recognized (reacting at titers that were within 4-fold of the homologous virus titer) by ferret antisera to cell-grown B/Austria/1359417/2021-like reference viruses representing the B/Victoria component for the cell- and recombinant-based influenza vaccines.
  • B/Yamagata: No influenza B/Yamagata-lineage viruses were available for antigenic characterization.
Assessment of Virus Susceptibility to Antiviral Medications


CDC assesses susceptibility of influenza viruses to the antiviral medications including the neuraminidase inhibitors (oseltamivir, zanamivir, and peramivir) and the PA endonuclease inhibitor baloxavir using next generation sequence analysis supplemented by laboratory assays. Information about antiviral susceptibility test methods can be found at U.S. Influenza Surveillance: Purpose and Methods | CDC.

Viruses collected in the U.S. since October 1, 2024, were tested for antiviral susceptibility as follows:
Neuraminidase InhibitorsOseltamivirViruses Tested3,6911,3811,903407
Reduced Inhibition1 (<0.1%)1 (0.1%)00
Highly Reduced Inhibition8 (0.2%)7 (0.5%)1 (0.1%)0
PeramivirViruses Tested3,6911,3811,903407
Reduced Inhibition0000
Highly Reduced Inhibition7 (0.2%)7 (0.5%)00
ZanamivirViruses Tested3,6911,3811,903407
Reduced Inhibition0000
Highly Reduced Inhibition0000
PA Cap-Dependent Endonuclease InhibitorBaloxavirViruses Tested3,5541,2711,887396
Decreased Susceptibility1 (<0.1%)01 (0.1%)0
Seven A(H1N1)pdm09 viruses had NA-H275Y amino acid substitution conferring highly reduced inhibition by oseltamivir and peramivir. One A(H1N1)pdm09 virus had NA-I223V and NA-S247N amino acid substitutions and showed reduced inhibition by oseltamivir. One A(H3N2) virus had NA-E119V amino acid substitution and showed highly reduced inhibition by oseltamivir. One A(H3N2) virus had PA-I38T amino acid substitution associated with reduced susceptibility to baloxavir.

High levels of resistance to the adamantanes (amantadine and rimantadine) persist among influenza A(H1N1)pdm09 and influenza A(H3N2) viruses (the adamantanes are not effective against influenza B viruses). Therefore, use of these antivirals for treatment and prevention of influenza A virus infection is not recommended and data from adamantane resistance testing are not presented.

Outpatient and Emergency Department Illness Surveillance

Outpatient respiratory illness visits


The U.S. Outpatient Influenza-like Illness Surveillance Network (ILINet) monitors outpatient visits for respiratory illness referred to as influenza-like illness [ILI (fever plus cough or sore throat)], not laboratory-confirmed influenza, and will therefore capture respiratory illness visits due to infection with any pathogen that can present with similar symptoms, including influenza virus, SARS-CoV-2, and RSV. It is important to evaluate syndromic surveillance data, including that from ILINet, in the context of other sources of surveillance data to obtain a complete and accurate picture of influenza, SARS-CoV-2, and other respiratory virus activity.

Nationally, during Week 15, 2.4% of patient visits reported through ILINet were due to respiratory illness that included fever plus a cough or sore throat, also referred to as ILI. This week's percentage decreased (change of > 0.1 percentage points) compared to Week 14 and is below the national baseline of 3.0%. The percentage of visits for ILI decreased (change of > 0.1 percentage points) in HHS regions 1, 3, 4, 5, and 10 and remained stable (change of ≤ 0.1 percentage points) in regions 2, 6, 7, 8, and 9. Region 1 is above its baseline, Region 10 is at its baseline, and all other regions (2, 3, 4, 5, 6, 7, 8, and 9) are below their region-specific baselines. Multiple respiratory viruses are co-circulating, and the relative contribution of influenza virus infections to ILI varies by location.

Outpatient respiratory illness visits by age group


About 70% of ILINet participants provide both the number of patient visits for respiratory illness and the total number of patient visits for the week broken out by age group. Based on these data, the percentage of visits for respiratory illness remained stable (change of ≤ 0.1 percentage points) in the 0-4 years age group and decreased (change of > 0.1 percentage point) in all other age groups (5-24 years, 25-49 years, 50-64 years, and 65+ years) in Week 15 compared to Week 14.

Outpatient respiratory illness activity map


Data collected in ILINet are used to produce a measure of ILI activity* by state/jurisdiction and Core Based Statistical Areas (CBSA).
Week 15
(Week ending
Apr. 12, 2025)
Week 14
(Week ending
Apr. 5, 2025)
Week 15
(Week ending
Apr. 12, 2025)
Week 14
(Week ending
Apr. 5, 2025)
Very High0011
High1136
Moderate252032
Low10127798
Minimal4237590565
Insufficient Data00238227


*Data collected in ILINet may disproportionally represent certain populations within a jurisdiction or CBSA, and therefore, may not accurately depict the full picture of influenza activity for the entire jurisdiction or CBSA. Differences in the data presented here by CDC and independently by some health departments likely represent differing levels of data completeness with data presented by the health department likely being the more complete.

Additional information about medically attended visits for ILI for current and past seasons:


Surveillance Methods | FluView Interactive: National, Regional, and State Data or ILI Activity Map

National Syndromic Surveillance System (NSSP)


The overall percentage of emergency department (ED) visits with a discharge diagnosis of influenza reported in NSSP was 0.8% during Week 15, a decrease (change of > 0.1 percentage point) compared to the previous week. The percentage of ED visits with influenza discharge diagnoses remained stable in regions 7, 8 and 9 and decreased in all other regions. This percentage decreased for all age groups during Week 15 compared to Week 14. RegionNationalRegion 1Region 2Region 3Region 4Region 5Region 6Region 7Region 8Region 9Region 10
Season2023-2024 & 2024-20252022-2023 Skip Over Chart Container
2.0%4.0%6.0%8.0%10.0%12.0%14.0%16.0%Percent of Emergency Department Visits for InfluenzaWeek 43 of 2023Week 47 of 2023Week 51 of 2023Week 3 of 2024Week 7 of 2024Week 11 of 2024Week 15 of 2024Week 19 of 2024Week 23 of 2024Week 27 of 2024Week 31 of 2024Week 35 of 2024Week 39 of 2024Week 43 of 2024Week 47 of 2024Week 51 of 2024Week 3 of 2025Week 7 of 2025Week 11 of 2025Week 15 of 2025 Age Group


All ages
0-4 years
5-17 years
18-64 years
65+ Skip Data Table
Data Table Download Data (CSV) Skipped data table.

Additional information about emergency department visits for flu for current and past seasons:‎‎‎


Surveillance Methods | Emergency Department Visits for COVID-19, flu, and RSV

Hospitalization surveillance

FluSurv-Net


The Influenza Hospitalization Surveillance Network (FluSurv-NET) conducts population-based surveillance for laboratory-confirmed influenza-related hospitalizations in select counties in 14 states and represents approximately 9% of the U.S. population. FluSurv-NET hospitalization data are preliminary. As data are received each week, prior case counts and rates are updated accordingly.

A total of 38,483 laboratory-confirmed influenza-associated hospitalizations were reported by FluSurv-NET sites between October 1, 2024, and April 12, 2025. The weekly hospitalization rate observed during Week 15 was 0.9 per 100,000 population. The weekly hospitalization rates observed during Weeks 5 and 6 (13.6 per 100,000 population) were tied for the highest peak weekly rate observed across all seasons since 2010-2011. The cumulative hospitalization rate observed in Week 15 was 125.6 per 100,000 population, which is the highest cumulative hospitalization rate for all seasons since 2010-11.

Among all hospitalizations, 37,040 (96.3%) were associated with influenza A virus, 1,247 (3.2%) with influenza B virus, 40 (0.1%) with influenza A virus and influenza B virus co-infection, and 156 (0.4%) with influenza virus for which the type was not determined. Among those with influenza A subtype information, 6,599 (58.2%) had A(H1N1)pdm09 and 4,741 (41.8%) had A(H3N2).

When examining rates by age, the highest cumulative hospitalization rate per 100,000 population was among adults aged 65 years and older (395.5), followed by adults aged 50-64 years (146.9), children aged 0-4 years (102.5), adults aged 18-49 years (51.0), and children aged 5-17 years (39.1).

When examining age-adjusted rates by race and ethnicity, the highest cumulative hospitalization rate per 100,000 population was among non-Hispanic Black persons (210.8), followed by American Indian/Alaska Native persons (161.9), non-Hispanic White persons (108.4), Hispanic persons (106.3), and Asian/Pacific Islander persons (78.0).

Among 4,661 hospitalized adults with information on underlying medical conditions, 95.0% had at least one reported underlying medical condition; the most commonly reported were hypertension, cardiovascular disease, metabolic disease, and obesity. Among 1,899 hospitalized women of childbearing age (15-49 years) with information on pregnancy status, 28.0% were pregnant. Among 1,801 hospitalized children with information on underlying medical conditions, 53.7% had at least one reported underlying medical condition; the most commonly reported were asthma, followed by neurologic disease and obesity.


[SUB]**In this figure, weekly rates for all seasons prior to the 2023-2024 season reflect end-of-season rates. For the 2023-2024 season, rates for recent hospital admissions are subject to reporting delays and are shown as a dashed line for the current season. As hospitalization data are received each week, prior case counts and rates are updated accordingly.[/SUB]

Additional FluSurv-NET hospitalization surveillance information for current and past seasons and additional age groups:


Surveillance Methods | FluView Interactive: Rates by Age, Sex, and Race/Ethnicity or Data on Patient Characteristics | RESP-NET Interactive

National Healthcare Safety Network (NHSN) Hospital Respiratory Data


Hospitals report to NHSN the weekly number of patients with laboratory-confirmed influenza who were admitted to the hospital. Nationally, during Week 15, 4,639 laboratory-confirmed influenza-associated hospitalizations were reported. This week's influenza-associated hospitalizations decreased (change of > 5%) compared to Week 14.

The weekly hospital admission rate observed in Week 15 was 1.4 per 100,000. The weekly rate of hospital admissions decreased in all 10 HHS regions and ranged from 0.9 (Region 6) to 2.4 (Region 2).

When examining rates by age for Week 15, all age groups decreased compared to the previous week. The highest hospital admission rate per 100,000 population was among those 65+ years (3.8), followed by 0-to-4-year age group (1.5), and 50-to-64 -year age group (1.3).

Additional NHSN Hospitalization Surveillance information:


Surveillance Methods | Additional Data | FluView Interactive

Mortality surveillance

National Center for Health Statistics (NCHS)


Based on NCHS mortality surveillance data available on April 17, 2025, 0.5% of the deaths that occurred during the week ending April 12, 2025 (Week 15), were due to influenza. This percentage decreased (≥ 0.1 percentage point change) compared to Week 14. The data presented are preliminary and may change as more data are received and processed.

Additional pneumonia, influenza and COVID-19 mortality surveillance information for current and past seasons:


Surveillance Methods | FluView Interactive

Influenza-Associated Pediatric Mortality


Ten influenza-associated pediatric deaths occurring during the 2024-2025 season were reported to CDC during Week 15. The deaths occurred between Week 4 (the week ending January 28, 2025) and Week 13 (the week ending March 29, 2025). Nine deaths were associated with influenza A viruses. Eight of the influenza A viruses had subtyping performed; five were A(H1N1) viruses and three were A(H3N2) viruses. One death was associated with an influenza virus for which type was not determined.

A total of 198 influenza-associated pediatric deaths occurring during the 2024-2025 season have been reported to CDC.

Additional pediatric mortality surveillance information for current and past seasons:


Surveillance Methods | FluView Interactive

Additional National and International Influenza Surveillance Information

Indicators Status by System


Increasing:
IncreasingArrow.png

Decreasing:
DecreasingArrow.png

Stable:
StableArrow.png


Clinical Labs: Up or down arrows indicate a change of greater than or equal to 0.5 percentage points in the percent of specimens positive for influenza compared to the previous week.
Outpatient Respiratory Illness (ILINet): Up or down arrows indicate a change of greater than 0.1 percentage points in the percent of visits due to respiratory illness (ILI) compared to the previous week.
NHSN Hospitalizations: Up or down arrows indicate change of greater than or equal to 5% of the number of patients admitted with laboratory-confirmed influenza compared to the previous week.
NCHS Mortality: Up or down arrows indicate change of greater than 0.1 percentage points of the percent of deaths due to influenza compared to the previous week.

Additional surveillance information


FluView Interactive: FluView includes enhanced web-based interactive applications that can provide dynamic visuals of the influenza data collected and analyzed by CDC. These FluView Interactive applications allow people to create customized, visual interpretations of influenza data, as well as make comparisons across flu seasons, regions, age groups and a variety of other demographics.

National Institute for Occupational Safety and Health: Monthly surveillance data on the prevalence of health-related workplace absenteeism among full-time workers in the United States are available from NIOSH.

https://www.cdc.gov/fluview/surveillance/2025-week-15.html
 
Weekly US Influenza Surveillance Report: Key Updates for Week 16, ending April 19, 2025

Key points


Seasonal influenza activity continues to decline.
Summary

Viruses

Clinical Lab 5.6% (Trend
DecreasingArrow.png
)
positive for influenza
this week. Public Health Lab Influenza A(H1N1)pdm09, A(H3N2), and B
viruses were co-circulating this week.

Illness

Outpatient Respiratory Illness 2.3% (Trend
DecreasingArrow.png
)
of visits to a health care provider this
week were for respiratory illness
(below baseline). Activity Map 1 moderate jurisdiction 1 high or very high jurisdiction FluSurv-NET 126.6 per 100,000
cumulative hospitalization rate National Healthcare Safety Network (NHSN) Hospital Respiratory Data 3,601 (Trend
DecreasingArrow.png
)
patients admitted to hospitals
with influenza this week. NCHS Mortality 0.3% (Trend
DecreasingArrow.png
)
of deaths attributed to influenza this week. Pediatric Deaths 6 influenza-associated deaths
were reported this week for
a total of 204 deaths this season.
All data are preliminary and may change as more reports are received.

Directional arrows indicate changes between the current week and the previous week. Additional information on the arrows can be found at the bottom of this page.

A description of the CDC influenza surveillance system, including methodology and detailed descriptions of each data component is available on the surveillance methods page.[SUP]1[/SUP]

Additional information on the current and previous influenza seasons for each surveillance component are available on FluView Interactive.

Key Points
  • Seasonal influenza (flu) activity continues to decline; however, CDC expects several more weeks of flu activity.
  • Due to the level of influenza activity at the peak of the season, this season is classified as a high severity season overall and for all age groups (children, adults, older adults) and is the first high severity season since 2017-2018.
  • During Week 16, of the 337 viruses reported by public health laboratories, 210 were influenza A and 127 were influenza B. Of the 187 influenza A viruses subtyped during Week 16, 128 (68.4%) were influenza A(H1N1)pdm09, 59 (31.6%) were A(H3N2), and 0 were A(H5).
  • No new influenza A(H5) cases were reported to CDC this week. To date, human-to-human transmission of avian influenza A(H5) virus (H5 bird flu) has not been identified in the United States.
  • Nationally, outpatient respiratory illness decreased this week and is below baseline for the third consecutive week. HHS Regions 2 through 9 are below their respective baselines, but Region 1 remains above its region-specific baseline.
  • Based on data from FluSurv-NET, the cumulative hospitalization rate for this season is the highest observed since the 2010-2011 season.
  • Six pediatric deaths associated with seasonal influenza virus infection were reported this week, bringing the 2024-2025 season total to 204 pediatric deaths.
  • CDC estimates that there have been at least 47 million illnesses, 610,000 hospitalizations, and 26,000 deaths from flu so far this season.
  • CDC continues to recommend that everyone ages 6 months and older get an annual flu vaccine as long as influenza viruses are circulating.[SUP]1[/SUP]
  • There are prescription flu antiviral drugs that can treat flu illness; those should be started as early as possible and are especially important for patients at higher risk for severe illness.[SUP]2[/SUP]
  • Influenza viruses are among several viruses contributing to respiratory disease activity. CDC is providing updated, integrated information about COVID-19, flu, and respiratory syncytial virus (RSV) activity on a weekly basis.
COVID-19, flu, and RSV activity


U.S. virologic surveillance


Nationally, and in regions 1, 2, 4, 5, 6, 9 and 10, the percentage of respiratory specimens testing positive for influenza virus in clinical laboratories decreased (change ≥ 0.5 percentage points), while regions 3, 7 and 8 remained stable (change < 0.5 percentage points) compared to the previous week. Influenza A and B viruses were co-circulating this week. For regional and state level data and age group distribution, please visit FluView Interactive. Viruses known to be associated with recent receipt of live attenuated influenza vaccine (LAIV) or found upon further testing to be a vaccine virus are not included, as they are not circulating influenza viruses.

Clinical Laboratories


The results of tests performed by clinical laboratories nationwide are summarized below. Data from clinical laboratories (the percentage of specimens tested that are positive for influenza virus) are used to monitor whether influenza activity is increasing or decreasing.
No. of specimens tested63,5663,130,050
No. of positive specimens (%)3,531 (5.6%)475,475 (15.2%)
Positive specimens by type
Influenza A1,173 (33.2%)429,825 (90.4%)
Influenza B2,358 (66.8%)45,650 (9.6%)

Public Health Laboratories


The results of tests performed by public health laboratories nationwide are summarized below. Data from public health laboratories are used to monitor the proportion of circulating influenza viruses that belong to each influenza subtype/lineage.
No. of specimens tested770130,230
No. of positive specimens33788,118
Positive specimens by type/subtype
Influenza A210 (62.3%)84,249 (95.6%)
Subtyping Performed187 (89.0%)74,557 (88.5%)
(H1N1)pdm09128 (68.4%)39,661 (53.2%)
H3N259 (31.6%)34,816 (46.7%)
H3N2v[SUP]†[/SUP]00
H5*080 (0.1%)
Subtyping not performed23 (11.0%)9,692 (11.5%)
Influenza B127 (37.7%)3,869 (4.4%)
Lineage testing performed64 (50.4%)1,882 (48.6%)
Yamagata lineage00
Victoria lineage64 (100.0%)1,882 (100.0%)
Lineage not performed63 (49.6%)1,987 (51.4%)
[SUB]*These data reflect specimens tested, and the number determined to be positive for influenza viruses at the public health labs (specimens tested is not the same as cases). The data do not reflect specimens tested only at CDC and could include more than one specimen tested per person. The guidance for influenza A(H5) virus testing recommends testing both a conjunctival and respiratory swab for people with conjunctivitis which has resulted in more specimens testing positive for influenza A(H5) virus than the number of human A(H5) cases. For more information on the number of people infected with A(H5) viruses, please visit the[/SUB] [SUB]"How CDC is monitoring influenza data among people to better understand the current avian influenza A (H5N1) situation".[/SUB]

[SUB][SUP]†[/SUP]When an influenza virus that normally circulates in swine (but not people) is detected in a person, it is called a "variant" influenza virus. Most human infections with variant influenza viruses occur following exposure to swine, but human-to-human transmission can occur. It is important to note that in most cases, variant influenza viruses have not shown the ability to spread easily and sustainably from human-to-human.[/SUB]


[SUB]This graph reflects the number of specimens tested and the number determined to be positive for influenza viruses at the public health lab (specimens tested is not the same as cases). It does not reflect specimens tested only at CDC and could include more than one specimen tested per person. Specimens tested as part of routine influenza surveillance as well as those tested as part of targeted testing for people exposed to influenza A(H5) are included.[/SUB]

Additional virologic surveillance information for current and past seasons:


Surveillance Methods | FluView Interactive: National, Regional, and State Data or Age Data

Novel Influenza A Virus Infections


No confirmed human infections with influenza A(H5) virus were reported to CDC this week. To date, human-to-human transmission of avian influenza A(H5) virus (H5 bird flu) has not been identified in the United States.

The CSTE position statement, which includes updated case definitions for confirmed, probable, and suspected cases is available at http://www.cste.org/resource/resmgr/position_statements_files_2023/24-ID-09_Novel_Influenza_A.pdf

An up-to-date human case summary during the current outbreak by state and exposure source is available at www.cdc.gov/bird-flu/situation-summary/index.html

Information about avian influenza is available at https://www.cdc.gov/flu/avianflu/index.htm.

A(H5N1) virus interim recommendations for Prevention, Monitoring, and Public Health Investigations are available at https://www.cdc.gov/bird-flu/prevention/hpai-interim-recommendations.html.

The latest case reports on avian influenza outbreaks in wild birds, commercial poultry, backyard or hobbyist flocks, and mammals in the United States are available from the USDA at https://www.aphis.usda.gov/aphis/ou...e-information/avian/avian-influenza/2022-hpai.

\Additional information regarding human infections with novel influenza A viruses:


Surveillance Methods | FluView Interactive

Influenza Virus Characterization


CDC performs genetic and antigenic characterization of U.S. viruses submitted from state and local public health laboratories according to the Right Size Roadmap submission guidance. These data are used to compare how similar the currently circulating influenza viruses are relative to the reference viruses representing the current influenza vaccines. The data are also used to monitor evolutionary changes that continually occur in influenza viruses circulating in humans. CDC also tests susceptibility of circulating influenza viruses to antiviral medications including the neuraminidase inhibitors (oseltamivir, zanamivir, and peramivir) and the polymerase acidic protein (PA) endonuclease inhibitor baloxavir. The HA clade and subclades were assigned using Nextclade (https://clades.nextstrain.org).

CDC has genetically characterized 3,879 influenza viruses collected since September 29, 2024.
A/H11,444
5a.2a616 (42.7%)C.1.978 (5.4%)
C.1.9.169 (4.8%)
C.1.9.25 (0.3%)
C.1.9.3458 (31.7%)
C.1.9.46 (0.4%)
5a.2a.1828 (57.3%)D33 (2.3%)
D.111 (0.8%)
D.3606 (42.0%)
D.5178 (12.3%)
A/H31,993
2a.3a6 (0.3%)G.1.3.16 (0.3%)
2a.3a.11,987 (99.7%)J.11 (0.1%)
J.1.18 (0.4%)
J.21,806 (90.6%)
J.2.149 (2.5%)
J.2.2123 (6.2%)
B/Victoria442
3a.2442 (100.0%)C.313 (2.9%)
C.543 (9.7%)
C.5.1214 (48.4%)
C.5.51 (0.2%)
C.5.659 (13.3%)
C.5.7112 (25.3%)
B/Yamagata0
Y30Y30
CDC antigenically characterizes influenza viruses by hemagglutination inhibition (HI) assay (H1N1pdm09, H3N2, and B/Victoria viruses) or neutralization-based HINT (H3N2 viruses) using antisera that ferrets make after being infected with reference viruses representing the 2024-2025 Northern Hemisphere recommended cell or recombinant-based vaccine viruses. Antigenic differences between viruses are determined by comparing how well the antibodies made against the vaccine reference viruses recognize the circulating viruses that have been grown in cell culture. Ferret antisera are useful because antibodies raised against a particular virus can often recognize small changes in the surface proteins of other viruses. In HI assays, viruses with similar antigenic properties have antibody titer differences of less than or equal to 4-fold when compared to the reference (vaccine) virus. In HINT, viruses with similar antigenic properties have antibody neutralization titer differences of less than or equal to 8-fold. Viruses selected for antigenic characterization are a subset of the recent genetically characterized viruses and are chosen based on the genetic changes in their surface proteins and may not be proportional to the number of such viruses circulating in the United States.

Influenza A Viruses
  • A(H1N1)pdm09: 341 A(H1N1)pdm09 viruses were antigenically characterized by HI, and 339 (99.4%) were well-recognized (reacting at titers that were within 4-fold of the homologous virus titer) by ferret antisera to cell-grown A/Wisconsin/67/2022-like reference viruses representing the A(H1N1)pdm09 component for the cell- and recombinant-based influenza vaccines.
  • A(H3N2): 437 A(H3N2) viruses were antigenically characterized by HI or HINT, and 262 (60.0%) were well-recognized (reacting at titers that were within 4-fold of the homologous virus titer in HI or reacting at titers that were less than or equal to 8-fold of the homologous virus in HINT) by ferret antisera to cell-grown A/Massachusetts/18/2022-like reference viruses representing the A(H3N2) component for the cell- and recombinant-based influenza vaccines.
Influenza B Viruses
  • B/Victoria: 134 influenza B/Victoria-lineage virus were antigenically characterized by HI, and 132 (98.5%) were well-recognized (reacting at titers that were within 4-fold of the homologous virus titer) by ferret antisera to cell-grown B/Austria/1359417/2021-like reference viruses representing the B/Victoria component for the cell- and recombinant-based influenza vaccines.
  • B/Yamagata: No influenza B/Yamagata-lineage viruses were available for antigenic characterization.
Assessment of Virus Susceptibility to Antiviral Medications


CDC assesses susceptibility of influenza viruses to the antiviral medications including the neuraminidase inhibitors (oseltamivir, zanamivir, and peramivir) and the PA endonuclease inhibitor baloxavir using next generation sequence analysis supplemented by laboratory assays. Information about antiviral susceptibility test methods can be found at U.S. Influenza Surveillance: Purpose and Methods.

Viruses collected in the U.S. since September 29, 2024, were tested for antiviral susceptibility as follows:
Neuraminidase InhibitorsOseltamivirViruses Tested3,8201,4271,960433
Reduced Inhibition1 (<0.1%)1 (<0.1%)00
Highly Reduced Inhibition9 (0.2%)8 (0.6%)1 (<0.1%)0
PeramivirViruses Tested3,8201,4271,960433
Reduced Inhibition0000
Highly Reduced Inhibition8 (0.2%)8 (0.6%)00
ZanamivirViruses Tested3,8201,4271,960433
Reduced Inhibition0000
Highly Reduced Inhibition0000
PA Cap-Dependent Endonuclease InhibitorBaloxavirViruses Tested3,6851,3171,942426
Decreased Susceptibility1 (<0.1%)01 (<0.1%)0
Eight A(H1N1)pdm09 viruses had NA-H275Y amino acid substitution conferring highly reduced inhibition by oseltamivir and peramivir. One A(H1N1)pdm09 virus had NA-I223V and NA-S247N amino acid substitutions and showed reduced inhibition by oseltamivir. One A(H3N2) virus had NA-E119V amino acid substitution and showed highly reduced inhibition by oseltamivir. One A(H3N2) virus had PA-I38T amino acid substitution associated with reduced susceptibility to baloxavir.

High levels of resistance to the adamantanes (amantadine and rimantadine) persist among influenza A(H1N1)pdm09 and influenza A(H3N2) viruses (the adamantanes are not effective against influenza B viruses). Therefore, use of these antivirals for treatment and prevention of influenza A virus infection is not recommended and data from adamantane resistance testing are not presented.

Outpatient and Emergency Department Illness Surveillance

Outpatient respiratory illness visits


The U.S. Outpatient Influenza-like Illness Surveillance Network (ILINet) monitors outpatient visits for respiratory illness referred to as influenza-like illness [ILI (fever plus cough or sore throat)], not laboratory-confirmed influenza, and will therefore capture respiratory illness visits due to infection with any pathogen that can present with similar symptoms, including influenza virus, SARS-CoV-2, and RSV. It is important to evaluate syndromic surveillance data, including that from ILINet, in the context of other sources of surveillance data to obtain a complete and accurate picture of influenza, SARS-CoV-2, and other respiratory virus activity.

Nationally, during Week 16, 2.3% of patient visits reported through ILINet were due to respiratory illness that included fever plus a cough or sore throat, also referred to as ILI. This week's percentage decreased (change of > 0.1 percentage points) compared to Week 15 and is below the national baseline of 3.0% for the third consecutive week. The percentage of visits for ILI decreased (change of > 0.1 percentage points) in HHS regions 1, 2, 3, 6, 9, and 10 and remained stable (change of ≤ 0.1 percentage points) in regions 4, 5, 7, and 8. Region 1 is above its baseline and all other regions (2, 3, 4, 5, 6, 7, 8, 9, and 10) are below their region-specific baselines. Multiple respiratory viruses are co-circulating, and the relative contribution of influenza virus infections to ILI varies by location.

Outpatient respiratory illness visits by age group


About 70% of ILINet participants provide both the number of patient visits for respiratory illness and the total number of patient visits for the week broken out by age group. Based on these data, the percentage of visits for respiratory illness remained stable (change of ≤ 0.1 percentage points) in the 25-49 years and 65+ years age groups and decreased (change of > 0.1 percentage point) in the 0-4 years, 5-24 years, and 50-64 years in Week 16 compared to Week 15.

Outpatient respiratory illness activity map


Data collected in ILINet are used to produce a measure of ILI activity* by state/jurisdiction and Core Based Statistical Areas (CBSA).
Week 16
(Week ending
Apr. 19, 2025)
Week 15
(Week ending
Apr. 12, 2025)
Week 16
(Week ending
Apr. 19, 2025)
Week 15
(Week ending
Apr. 12, 2025)
Very High0001
High1133
Moderate121321
Low5106179
Minimal4842626597
Insufficient Data00226228


*Data collected in ILINet may disproportionally represent certain populations within a jurisdiction or CBSA, and therefore, may not accurately depict the full picture of influenza activity for the entire jurisdiction or CBSA. Differences in the data presented here by CDC and independently by some health departments likely represent differing levels of data completeness with data presented by the health department likely being the more complete.

Additional information about medically attended visits for ILI for current and past seasons:


Surveillance Methods | FluView Interactive: National, Regional, and State Data or ILI Activity Map

National Syndromic Surveillance System (NSSP)


The overall percentage of emergency department (ED) visits with a discharge diagnosis of influenza reported in NSSP was 0.7% during Week 16 and remained stable (change of ≤ 0.1 percentage point) compared to the previous week. The percentage of ED visits with influenza discharge diagnoses remained stable in regions 4, 5, 6, 7, and 8 and decreased (change of > 0.1 percentage point) in regions 1, 2, 3, 9, and 10. Percentages in 18-64 years and 65+ years age groups remained stable and decreased in the 0-4 years and 5-17 years age groups during Week 16 compared to Week 15. RegionNationalRegion 1Region 2Region 3Region 4Region 5Region 6Region 7Region 8Region 9Region 10
Season2023-2024 & 2024-20252022-2023 Skip Over Chart Container
2.0%4.0%6.0%8.0%10.0%12.0%14.0%16.0%Percent of Emergency Department Visits for InfluenzaWeek 40 of 2023Week 44 of 2023Week 48 of 2023Week 52 of 2023Week 4 of 2024Week 8 of 2024Week 12 of 2024Week 16 of 2024Week 20 of 2024Week 24 of 2024Week 28 of 2024Week 32 of 2024Week 36 of 2024Week 40 of 2024Week 44 of 2024Week 48 of 2024Week 52 of 2024Week 4 of 2025Week 8 of 2025Week 12 of 2025Week 16 of 2025

Age Group


All ages
0-4 years
5-17 years
18-64 years
65+ Skip Data Table
Data Table Download Data (CSV) Skipped data table.

Additional information about emergency department visits for flu for current and past seasons:‎‎‎


Surveillance Methods | Emergency Department Visits for COVID-19, flu, and RSV

Hospitalization surveillance

FluSurv-Net


The Influenza Hospitalization Surveillance Network (FluSurv-NET) conducts population-based surveillance for laboratory-confirmed influenza-related hospitalizations in select counties in 14 states and represents approximately 9% of the U.S. population. FluSurv-NET hospitalization data are preliminary. As data are received each week, prior case counts and rates are updated accordingly.

A total of 38,798 laboratory-confirmed influenza-associated hospitalizations were reported by FluSurv-NET sites between October 1, 2024 and April 19, 2025. The weekly hospitalization rate observed during Week 16 was 0.6 per 100,000 population. The weekly hospitalization rate observed during Week 6 (13.6 per 100,000 population) was the highest peak weekly rate observed across all seasons since 2010-2011. The cumulative hospitalization rate observed in Week 16 was 126.6 per 100,000 population, which is the highest cumulative hospitalization rate for all seasons since 2010-2011.

Among all hospitalizations, 37,259 (96.0%) were associated with influenza A virus, 1,348 (3.5%) with influenza B virus, 38 (0.1%) with influenza A virus and influenza B virus co-infection, and 153 (0.4%) with influenza virus for which the type was not determined. Among those with influenza A subtype information, 6,693 (58.3%) had A(H1N1) pdm09 and 4,785 (41.7%) had A(H3N2).

When examining rates by age, the highest cumulative hospitalization rate per 100,000 population was among adults aged 65 years and older (398.7), followed by adults aged 50-64 years (147.8), children aged 0-4 years (103.7), adults aged 18-49 years (51.5), and children aged 5-17 years (39.4).

When examining age-adjusted rates by race and ethnicity, the highest cumulative hospitalization rate per 100,000 population was among non-Hispanic Black persons (211.8), followed by American Indian/Alaska Native persons (163.6), non-Hispanic White persons (109.2), Hispanic persons (108.3), and Asian/Pacific Islander persons (79.1).

Among 4,983 hospitalized adults with information on underlying medical conditions, 95.0% had at least one reported underlying medical condition; the most commonly reported were hypertension, cardiovascular disease, metabolic disease, and obesity. Among 1,939 hospitalized women of childbearing age (15-49 years) with information on pregnancy status, 27.9% were pregnant. Among 1,936 hospitalized children with information on underlying medical conditions, 52.6% had at least one reported underlying medical condition; the most commonly reported was asthma, followed by neurologic disease and obesity.


[SUB]**In this figure, weekly rates for all seasons prior to the 2024-2025 season reflect end-of-season rates. For the 2024-2025 season, rates for recent hospital admissions are subject to reporting delays and are shown as a dashed line for the current season. As hospitalization data are received each week, prior case counts and rates are updated accordingly.[/SUB]

Additional FluSurv-NET hospitalization surveillance information for current and past seasons and additional age groups:


Surveillance Methods | FluView Interactive: Rates by Age, Sex, and Race/Ethnicity or Data on Patient Characteristics | RESP-NET Interactive

National Healthcare Safety Network (NHSN) Hospital Respiratory Data


Hospitals report to NHSN the weekly number of patients with laboratory-confirmed influenza who were admitted to the hospital. Nationally, during Week 16, 3,601 laboratory-confirmed influenza-associated hospitalizations were reported. This week's influenza-associated hospitalizations decreased (change of > 5%) compared to Week 15.

The weekly hospital admission rate observed in Week 16 was 1.1 per 100,000. The weekly rate of hospital admissions decreased in all 10 HHS regions and ranged from 0.7 (Region 10) to 1.8 (Region 2).

When examining rates by age for Week 16, all age groups decreased compared to the previous week. The highest hospital admission rate per 100,000 population was among those 65+ years (2.9), followed by 0-4 years (1.2), and 50-64 years age group (1.0).

Additional NHSN Hospital Respiratory Data information:


Surveillance Methods | Additional Data | FluView Interactive

Mortality surveillance

National Center for Health Statistics (NCHS) Mortality Surveillance


Based on NCHS mortality surveillance data available on April 24, 2025, 0.3% of the deaths that occurred during the week ending April 19, 2025 (Week 16), were due to influenza. This percentage decreased (≥ 0.1 percentage point change) compared to Week 15. The data presented are preliminary and may change as more data are received and processed.

Additional pneumonia, influenza and COVID-19 mortality surveillance information for current and past seasons:


Surveillance Methods | FluView Interactive

Influenza-Associated Pediatric Mortality


Six influenza-associated pediatric deaths occurring during the 2024-2025 season were reported to CDC during Week 16. The deaths occurred during weeks 6, 8 and 15 (the weeks ending February 8, February 22, and April 12 of 2025). Five deaths were associated with influenza A viruses. Three of the influenza A viruses had subtyping performed, and all three were A(H1N1) viruses. One death was associated with an influenza B virus with no lineage determined.

A total of 204 influenza-associated pediatric deaths occurring during the 2024-2025 season have been reported to CDC.

Additional pediatric mortality surveillance information for current and past seasons:


Surveillance Methods | FluView Interactive

Additional National and International Influenza Surveillance Information

Indicators Status by System


Increasing:
IncreasingArrow.png

Decreasing:
DecreasingArrow.png

Stable:
StableArrow.png


Clinical Labs: Up or down arrows indicate a change of greater than or equal to 0.5 percentage points in the percent of specimens positive for influenza compared to the previous week.
Outpatient Respiratory Illness (ILINet): Up or down arrows indicate a change of greater than 0.1 percentage points in the percent of visits due to respiratory illness (ILI) compared to the previous week.
NHSN Hospitalizations: Up or down arrows indicate change of greater than or equal to 5% of the number of patients admitted with laboratory-confirmed influenza compared to the previous week.
NCHS Mortality: Up or down arrows indicate change of greater than 0.1 percentage points of the percent of deaths due to influenza compared to the previous week.

Additional surveillance information


FluView Interactive: FluView includes enhanced web-based interactive applications that can provide dynamic visuals of the influenza data collected and analyzed by CDC. These FluView Interactive applications allow people to create customized, visual interpretations of influenza data, as well as make comparisons across flu seasons, regions, age groups and a variety of other demographics.

National Institute for Occupational Safety and Health: Monthly surveillance data on the prevalence of health-related workplace absenteeism among full-time workers in the United States are available from NIOSH.

https://www.cdc.gov/fluview/surveillance/2025-week-16.html
 
Weekly US Influenza Surveillance Report: Key Updates for Week 17, ending April 26, 2025

Key points


Seasonal influenza activity continues to decline.
Summary

Viruses

Clinical Lab 4.6% (Trend
DecreasingArrow.png
)
positive for influenza
this week. Public Health Lab Influenza A(H1N1)pdm09, A(H3N2), and B
viruses were co-circulating this week.

Illness

Outpatient Respiratory Illness 2.2% (Trend
StableArrow.png
)
of visits to a health care provider this
week were for respiratory illness
(below baseline). Activity Map 0 moderate jurisdiction 0 high or very high jurisdiction FluSurv-NET 127.4 per 100,000
cumulative hospitalization rate National Healthcare Safety Network (NHSN) Hospital Respiratory Data 2,857 (Trend
DecreasingArrow.png
)
patients admitted to hospitals
with influenza this week. NCHS Mortality 0.2% (Trend
DecreasingArrow.png
)
of deaths attributed to influenza this week. Pediatric Deaths 12 influenza-associated deaths
were reported this week for
a total of 216 deaths this season.
All data are preliminary and may change as more reports are received.

Directional arrows indicate changes between the current week and the previous week. Additional information on the arrows can be found at the bottom of this page.

A description of the CDC influenza surveillance system, including methodology and detailed descriptions of each data component is available on the surveillance methods page.[SUP]1[/SUP]

Additional information on the current and previous influenza seasons for each surveillance component are available on FluView Interactive.

Key Points
  • Seasonal influenza (flu) activity continues to decline.
  • This season is classified as a high severity season overall and for all age groups (children, adults, older adults) and is the first high severity season since 2017-2018.
  • During Week 17, of the 347 viruses reported by public health laboratories, 240 were influenza A and 107 were influenza B. Of the 200 influenza A viruses subtyped during Week 17, 135 (67.5%) were influenza A(H1N1)pdm09, 65 (32.5%) were A(H3N2), and 0 were A(H5).
  • No new influenza A(H5) cases were reported to CDC this week. To date, human-to-human transmission of avian influenza A(H5) virus (H5 bird flu) has not been identified in the United States.
  • Nationally, outpatient respiratory illness remained stable this week and is below baseline. All HHS regions are below their region-specific baselines.
  • Based on data from FluSurv-NET, the cumulative hospitalization rate for this season is the highest observed since the 2010-2011 season.
  • Twelve pediatric deaths associated with seasonal influenza virus infection were reported this week, bringing the 2024-2025 season total to 216 pediatric deaths. This number of pediatric deaths exceeds the previous high reported for a regular (non-pandemic) season. The previous high of 207 was reported during the 2023-2024 season.
  • CDC estimates that there have been at least 47 million illnesses, 610,000 hospitalizations, and 26,000 deaths from flu so far this season.
  • CDC continues to recommend that everyone ages 6 months and older get an annual flu vaccine as long as influenza viruses are circulating.[SUP]1[/SUP]
  • There are prescription flu antiviral drugs that can treat flu illness; those should be started as early as possible and are especially important for patients at higher risk for severe illness.[SUP]2[/SUP]
  • Influenza viruses are among several viruses contributing to respiratory disease activity. CDC is providing updated, integrated information about COVID-19, flu, and respiratory syncytial virus (RSV) activity on a weekly basis.
COVID-19, flu, and RSV activity


U.S. virologic surveillance


Nationally, and in regions 1, 2, 3, 5, 7 and 9, the percentage of respiratory specimens testing positive for influenza virus in clinical laboratories decreased, (change ≥ 0.5 percentage points), while in regions 4, 6, 8 and 10 the percentage remained stable (change < 0.5 percentage points) compared to the previous week. Influenza A and B viruses were co-circulating this week. For regional and state level data and age group distribution, please visit FluView Interactive. Viruses known to be associated with recent receipt of live attenuated influenza vaccine (LAIV) or found upon further testing to be a vaccine virus are not included, as they are not circulating influenza viruses.

Clinical Laboratories


The results of tests performed by clinical laboratories nationwide are summarized below. Data from clinical laboratories (the percentage of specimens tested that are positive for influenza virus) are used to monitor whether influenza activity is increasing or decreasing.
No. of specimens tested59,4313,197,184
No. of positive specimens (%)2,722 (4.6%)478,429 (15.0%)
Positive specimens by type
Influenza A814 (29.9%)430,757 (90.0%)
Influenza B1,908 (70.1%)47,672 (10.0%)


Public Health Laboratories


The results of tests performed by public health laboratories nationwide are summarized below. Data from public health laboratories are used to monitor the proportion of circulating influenza viruses that belong to each influenza subtype/lineage.
No. of specimens tested891132,924
No. of positive specimens34790,131
Positive specimens by type/subtype
Influenza A240 (69.2%)85,893 (95.3%)
Subtyping Performed200 (83.3%)76,118 (88.6%)
(H1N1)pdm09135 (67.5%)40,309 (53.0%)
H3N265 (32.5%)35,729 (46.9%)
H3N2v[SUP]†[/SUP]00
H5*080 (0.1%)
Subtyping not performed40 (16.7%)9,775 (11.4%)
Influenza B107 (30.8%)4,238 (4.7%)
Lineage testing performed27 (25.2%)2,080 (49.1%)
Yamagata lineage00
Victoria lineage27 (100%)2,080 (100%)
Lineage not performed80 (74.8%)2,158 (50.9%)
[SUB]*These data reflect specimens tested, and the number determined to be positive for influenza viruses at the public health labs (specimens tested is not the same as cases). The data do not reflect specimens tested only at CDC and could include more than one specimen tested per person. The guidance for influenza A(H5) virus testing recommends testing both a conjunctival and respiratory swab for people with conjunctivitis which has resulted in more specimens testing positive for influenza A(H5) virus than the number of human A(H5) cases. For more information on the number of people infected with A(H5) viruses, please visit the[/SUB] [SUB]"How CDC is monitoring influenza data among people to better understand the current avian influenza A (H5N1) situation".[/SUB]

[SUB][SUP]†[/SUP]When an influenza virus that normally circulates in swine (but not people) is detected in a person, it is called a "variant" influenza virus. Most human infections with variant influenza viruses occur following exposure to swine, but human-to-human transmission can occur. It is important to note that in most cases, variant influenza viruses have not shown the ability to spread easily and sustainably from human-to-human.[/SUB]


[SUP]*This graph reflects the number of specimens tested and the number determined to be positive for influenza viruses at the public health lab (specimens tested is not the same as cases). It does not reflect specimens tested only at CDC and could include more than one specimen tested per person. Specimens tested as part of routine influenza surveillance as well as those tested as part of targeted testing for people exposed to influenza A(H5) are included.[/SUP]

Additional virologic surveillance information for current and past seasons:


Surveillance Methods | FluView Interactive: National, Regional, and State Data or Age Data

Novel Influenza A Virus Infections


No confirmed human infections with influenza A(H5) virus were reported to CDC this week. To date, human-to-human transmission of avian influenza A(H5) virus (H5 bird flu) has not been identified in the United States.

The CSTE position statement, which includes updated case definitions for confirmed, probable, and suspected cases is available at http://www.cste.org/resource/resmgr/position_statements_files_2023/24-ID-09_Novel_Influenza_A.pdf

An up-to-date human case summary during the current outbreak by state and exposure source is available at www.cdc.gov/bird-flu/situation-summary/index.html

Information about avian influenza is available at https://www.cdc.gov/flu/avianflu/index.htm.

A(H5N1) virus interim recommendations for Prevention, Monitoring, and Public Health Investigations are available at https://www.cdc.gov/bird-flu/prevention/hpai-interim-recommendations.html.

The latest case reports on avian influenza outbreaks in wild birds, commercial poultry, backyard or hobbyist flocks, and mammals in the United States are available from the USDA at https://www.aphis.usda.gov/aphis/ou...e-information/avian/avian-influenza/2022-hpai.

Additional information regarding human infections with novel influenza A viruses:


Surveillance Methods | FluView Interactive

Influenza Virus Characterization


CDC performs genetic and antigenic characterization of U.S. viruses submitted from state and local public health laboratories according to the Right Size Roadmap submission guidance. These data are used to compare how similar the currently circulating influenza viruses are relative to the reference viruses representing the current influenza vaccines. The data are also used to monitor evolutionary changes that continually occur in influenza viruses circulating in humans. CDC also tests susceptibility of circulating influenza viruses to antiviral medications including the neuraminidase inhibitors (oseltamivir, zanamivir, and peramivir) and the polymerase acidic protein (PA) endonuclease inhibitor baloxavir. The HA clade and subclades were assigned using Nextclade (https://clades.nextstrain.org).

CDC has genetically characterized 4,078 influenza viruses collected since September 29, 2024.
A/H11,528
5a.2a616 (40.3%)C.1.977 (5.0%)
C.1.9.169 (4.5%)
C.1.9.25 (0.3%)
C.1.9.3459 (30.0%)
C.1.9.46 (0.4%)
5a.2a.1912 (59.7%)D33 (2.2%)
D.111 (0.7%)
D.3689 (45.1%)
D.5179 (11.7%)
A/H32,061
2a.3a6 (0.3%)G.1.3.16 (0.3%)
2a.3a.12,055 (99.7%)J.11 (<0.1%)
J.1.18 (0.4%)
J.21,867 (90.6%)
J.2.150 (2.4%)
J.2.2129 (6.3%)
B/Victoria489
3a.2489 (100%)C.318 (3.7%)
C.548 (9.8%)
C.5.1231 (47.2%)
C.5.51 (0.2%)
C.5.669 (14.1%)
C.5.7122 (24.9%)
B/Yamagata0
Y30Y30
CDC antigenically characterizes influenza viruses by hemagglutination inhibition (HI) assay (H1N1pdm09, H3N2, and B/Victoria viruses) or neutralization-based HINT (H3N2 viruses) using antisera that ferrets make after being infected with reference viruses representing the 2024-2025 Northern Hemisphere recommended cell or recombinant-based vaccine viruses. Antigenic differences between viruses are determined by comparing how well the antibodies made against the vaccine reference viruses recognize the circulating viruses that have been grown in cell culture. Ferret antisera are useful because antibodies raised against a particular virus can often recognize small changes in the surface proteins of other viruses. In HI assays, viruses with similar antigenic properties have antibody titer differences of less than or equal to 4-fold when compared to the reference (vaccine) virus. In HINT, viruses with similar antigenic properties have antibody neutralization titer differences of less than or equal to 8-fold. Viruses selected for antigenic characterization are a subset of the recent genetically characterized viruses and are chosen based on the genetic changes in their surface proteins and may not be proportional to the number of such viruses circulating in the United States.

Influenza A Viruses
  • A(H1N1)pdm09: 354 A(H1N1)pdm09 viruses were antigenically characterized by HI, and 352 (99.4%) were well-recognized (reacting at titers that were within 4-fold of the homologous virus titer) by ferret antisera to cell-grown A/Wisconsin/67/2022-like reference viruses representing the A(H1N1)pdm09 component for the cell- and recombinant-based influenza vaccines.
  • A(H3N2): 437 A(H3N2) viruses were antigenically characterized by HI or HINT, and 262 (60.0%) were well-recognized (reacting at titers that were within 4-fold of the homologous virus titer in HI or reacting at titers that were less than or equal to 8-fold of the homologous virus in HINT) by ferret antisera to cell-grown A/Massachusetts/18/2022-like reference viruses representing the A(H3N2) component for the cell- and recombinant-based influenza vaccines.
Influenza B Viruses
  • B/Victoria: 134 influenza B/Victoria-lineage virus were antigenically characterized by HI, and 132 (98.5%) were well-recognized (reacting at titers that were within 4-fold of the homologous virus titer) by ferret antisera to cell-grown B/Austria/1359417/2021-like reference viruses representing the B/Victoria component for the cell- and recombinant-based influenza vaccines.
  • B/Yamagata: No influenza B/Yamagata-lineage viruses were available for antigenic characterization.
Assessment of Virus Susceptibility to Antiviral Medications


CDC assesses susceptibility of influenza viruses to the antiviral medications including the neuraminidase inhibitors (oseltamivir, zanamivir, and peramivir) and the PA endonuclease inhibitor baloxavir using next generation sequence analysis supplemented by laboratory assays. Information about antiviral susceptibility test methods can be found at U.S. Influenza Surveillance: Purpose and Methods.

Viruses collected in the U.S. since September 29, 2024, were tested for antiviral susceptibility as follows:
Neuraminidase InhibitorsOseltamivirViruses Tested4,0261,5162,031479
Reduced Inhibition1 (<0.1%)1 (0.1%)00
Highly Reduced Inhibition9 (0.2%)8 (0.5%)1 (<0.1%)0
PeramivirViruses Tested4,0261,5162,031479
Reduced Inhibition0000
Highly Reduced Inhibition8 (0.2%)8 (0.5%)00
ZanamivirViruses Tested4,0261,5162,031479
Reduced Inhibition0000
Highly Reduced Inhibition0000
PA Cap-Dependent Endonuclease InhibitorBaloxavirViruses Tested3,8821,4002,009473
Decreased Susceptibility2 (0.1%)1 (0.1%)1 (<0.1%)0
Eight A(H1N1)pdm09 viruses had NA-H275Y amino acid substitution conferring highly reduced inhibition by oseltamivir and peramivir. One A(H1N1)pdm09 virus had NA-I223V and NA-S247N amino acid substitutions and showed reduced inhibition by oseltamivir. One A(H3N2) virus had NA-E119V amino acid substitution and showed highly reduced inhibition by oseltamivir. One A(H1N1)pdm09 virus and one A(H3N2) virus had PA-I38T amino acid substitution associated with reduced susceptibility to baloxavir.

High levels of resistance to the adamantanes (amantadine and rimantadine) persist among influenza A(H1N1)pdm09 and influenza A(H3N2) viruses (the adamantanes are not effective against influenza B viruses). Therefore, use of these antivirals for treatment and prevention of influenza A virus infection is not recommended and data from adamantane resistance testing are not presented.

Outpatient and Emergency Department Illness Surveillance

Outpatient respiratory illness visits


The U.S. Outpatient Influenza-like Illness Surveillance Network (ILINet) monitors outpatient visits for respiratory illness referred to as influenza-like illness [ILI (fever plus cough or sore throat)], not laboratory-confirmed influenza, and will therefore capture respiratory illness visits due to infection with any pathogen that can present with similar symptoms, including influenza virus, SARS-CoV-2, and RSV. It is important to evaluate syndromic surveillance data, including that from ILINet, in the context of other sources of surveillance data to obtain a complete and accurate picture of influenza, SARS-CoV-2, and other respiratory virus activity.

Nationally, during Week 17, 2.2% of patient visits reported through ILINet were due to respiratory illness that included fever plus a cough or sore throat, also referred to as ILI. This week's percentage remained stable (change of ≤ 0.1 percentage points) compared to Week 16 and is below the national baseline of 3.0%. The percentage of visits for ILI decreased (change of > 0.1 percentage points) in regions 1, 2, 3, and 7, remained stable (change of ≤ 0.1 percentage points) in regions 4, 5, 8, 9, and 10, and increased slightly in Region 6 (change of > 0.1 percentage points). All regions are below their region-specific baselines. Multiple respiratory viruses are co-circulating, and the relative contribution of influenza virus infections to ILI varies by location.

Outpatient respiratory illness visits by age group


About 70% of ILINet participants provide both the number of patient visits for respiratory illness and the total number of patient visits for the week broken out by age group. Based on these data, the percentage of visits for respiratory illness decreased in the 0-4 years and 5-24 years age groups (change of > 0.1 percentage point) and remained stable (change of ≤ 0.1 percentage points) in the 25-49 years, 50-64 years, and 65+ years age groups in Week 17 compared to Week 16.

Outpatient respiratory illness activity map


Data collected in ILINet are used to produce a measure of ILI activity* by state/jurisdiction and Core Based Statistical Areas (CBSA).
Week 17
(Week ending
Apr. 26, 2025)
Week 16
(Week ending
Apr. 19, 2025)
Week 17
(Week ending
Apr. 26, 2025)
Week 16
(Week ending
Apr. 19, 2025)
Very High0000
High0142
Moderate011014
Low554960
Minimal4948629630
Insufficient Data10237223


*Data collected in ILINet may disproportionally represent certain populations within a jurisdiction or CBSA, and therefore, may not accurately depict the full picture of influenza activity for the entire jurisdiction or CBSA. Differences in the data presented here by CDC and independently by some health departments likely represent differing levels of data completeness with data presented by the health department likely being the more complete.

Additional information about medically attended visits for ILI for current and past seasons:


Surveillance Methods | FluView Interactive: National, Regional, and State Data or ILI Activity Map

National Syndromic Surveillance System (NSSP)


The overall percentage of emergency department (ED) visits with a discharge diagnosis of influenza reported in NSSP was 0.6% during Week 17, remaining stable (change of ≤ 0.1 percentage point) compared to the previous week. The percentage of ED visits with influenza discharge diagnoses remained stable in regions 4, 7, 8, 9, and 10, and decreased in all other regions. The percentage decreased for the 0-4 years and 5-17 years age groups and remained stable for the 18-64 years and 65+ years age groups during Week 17 compared to Week 16. RegionNationalRegion 1Region 2Region 3Region 4Region 5Region 6Region 7Region 8Region 9Region 10
Season2023-2024 & 2024-20252022-2023 Skip Over Chart Container
2.0%4.0%6.0%8.0%10.0%12.0%14.0%16.0%Percent of Emergency Department Visits for InfluenzaWeek 41 of 2023Week 45 of 2023Week 49 of 2023Week 1 of 2024Week 5 of 2024Week 9 of 2024Week 13 of 2024Week 17 of 2024Week 21 of 2024Week 25 of 2024Week 29 of 2024Week 33 of 2024Week 37 of 2024Week 41 of 2024Week 45 of 2024Week 49 of 2024Week 1 of 2025Week 5 of 2025Week 9 of 2025Week 13 of 2025Week 17 of 2025

Age Group


All ages
0-4 years
5-17 years
18-64 years
65+ Skip Data Table
Data Table Download Data (CSV) Skipped data table.
\
Additional information about emergency department visits for flu for current and past seasons:‎‎‎


Surveillance Methods | Emergency Department Visits for COVID-19, flu, and RSV

Hospitalization surveillance

FluSurv-Net


The Influenza Hospitalization Surveillance Network (FluSurv-NET) conducts population-based surveillance for laboratory-confirmed influenza-related hospitalizations in select counties in 14 states and represents approximately 9% of the U.S. population. FluSurv-NET hospitalization data are preliminary. As data are received each week, prior case counts and rates are updated accordingly.

A total of 39,053 laboratory-confirmed influenza-associated hospitalizations were reported by FluSurv-NET sites between October 1, 2024, and April 26, 2025. The weekly hospitalization rate observed during Week 17 was 0.5 per 100,000 population. The weekly hospitalization rate observed during Week 6 (13.6 per 100,000 population) was the highest peak weekly rate observed across all seasons since 2010-2011. The cumulative hospitalization rate observed in Week 17 was 127.4 per 100,000 population, which is the highest cumulative hospitalization rate for all seasons since 2010-2011.

Among all hospitalizations, 37,465 (95.9%) were associated with influenza A virus, 1,434 (3.7%) with influenza B virus, 38 (0.1%) with influenza A virus and influenza B virus co-infection, and 116 (0.3%) with influenza virus for which the type was not determined. Among those with influenza A subtype information, 6,764 (58.4%) had A(H1N1) pdm09 and 4,828 (41.6%) had A(H3N2).

When examining rates by age, the highest cumulative hospitalization rate per 100,000 population was among adults aged 65 years and older (401.4), followed by adults aged 50-64 years (148.8), children aged 0-4 years (103.6), adults aged 18-49 years (52), and children aged 5-17 years (39.8).

When examining age-adjusted rates by race and ethnicity, the highest cumulative hospitalization rate per 100,000 population was among non-Hispanic Black persons (212.5), followed by American Indian/Alaska Native persons (164.7), non-Hispanic White persons (110), Hispanic persons (109.5), and Asian/Pacific Islander persons (79.5).

Among 5,179 hospitalized adults with information on underlying medical conditions, 95.1% had at least one reported underlying medical condition; the most commonly reported were hypertension, cardiovascular disease, metabolic disease, and obesity. Among 1,981 hospitalized women of childbearing age (15-49 years) with information on pregnancy status, 27.8% were pregnant. Among 2,073 hospitalized children with information on underlying medical conditions, 52.6% had at least one reported underlying medical condition; the most commonly reported was asthma, followed by neurologic disease and obesity.


[SUP]**In this figure, weekly rates for all seasons prior to the 2024-2025 season reflect end-of-season rates. For the 2024-2025 season, rates for recent hospital admissions are subject to reporting delays and are shown as a dashed line for the current season. As hospitalization data are received each week, prior case counts and rates are updated accordingly.[/SUP]

Additional FluSurv-NET hospitalization surveillance information for current and past seasons and additional age groups:


Surveillance Methods | FluView Interactive: Rates by Age, Sex, and Race/Ethnicity or Data on Patient Characteristics | RESP-NET Interactive

National Healthcare Safety Network (NHSN) Hospital Respiratory Data


Hospitals report to NHSN the weekly number of patients with laboratory-confirmed influenza who were admitted to the hospital. Nationally, during Week 17, 2,857 laboratory-confirmed influenza-associated hospitalizations were reported. This week's influenza-associated hospitalizations decreased (change of > 5%) compared to Week 16.

The weekly hospital admission rate observed in Week 17 was 0.9 per 100,000. The weekly rate of hospital admissions decreased in all 10 HHS regions and ranged from 0.6 (Region 10) to 1.3 (Region 2).

When examining rates by age for Week 17, all age groups decreased compared to the previous week. The highest hospital admission rate per 100,000 population was among those 65+ years (2.2), followed by 0-4 years (1.0), and 50-64 years age group (0.7).

Additional NHSN Hospital Respiratory Data information:


Surveillance Methods | Additional Data | FluView Interactive

Mortality surveillance

National Center for Health Statistics (NCHS) Mortality Surveillance


Based on NCHS mortality surveillance data available on May 1, 2025, 0.2% of the deaths that occurred during the week ending April 26, 2025 (Week 17), were due to influenza. This percentage decreased (≥ 0.1 percentage point change) compared to Week 16. The data presented are preliminary and may change as more data are received and processed.


View Chart Data

Additional pneumonia, influenza and COVID-19 mortality surveillance information for current and past seasons:


Surveillance Methods | FluView Interactive

Influenza-Associated Pediatric Mortality


Twelve influenza-associated pediatric deaths occurring during the 2024-2025 season were reported to CDC during Week 17. The deaths occurred between weeks 5 (the week ending February 1, 2025) and 16 (the week ending April 19, 2025). Ten deaths were associated with influenza A viruses. Eight of the influenza A viruses had subtyping performed; four were A(H1N1) viruses and four were A(H3N2) viruses. Two deaths were associated with influenza B viruses with no lineage determined.

A total of 216 influenza-associated pediatric deaths occurring during the 2024-2025 season have been reported to CDC. This number of pediatric deaths exceeds the previous high reported for a regular (non-pandemic) flu season. The previous high of 207 deaths was reported during the 2023-2024 flu season.

Additional pediatric mortality surveillance information for current and past seasons:


Surveillance Methods | FluView Interactive

Additional National and International Influenza Surveillance Information

Indicators Status by System


Increasing:
IncreasingArrow.png

Decreasing:
DecreasingArrow.png

Stable:
StableArrow.png


Clinical Labs: Up or down arrows indicate a change of greater than or equal to 0.5 percentage points in the percent of specimens positive for influenza compared to the previous week.
Outpatient Respiratory Illness (ILINet): Up or down arrows indicate a change of greater than 0.1 percentage points in the percent of visits due to respiratory illness (ILI) compared to the previous week.
NHSN Hospitalizations: Up or down arrows indicate change of greater than or equal to 5% of the number of patients admitted with laboratory-confirmed influenza compared to the previous week.
NCHS Mortality: Up or down arrows indicate change of greater than 0.1 percentage points of the percent of deaths due to influenza compared to the previous week.

Additional surveillance information


FluView Interactive: FluView includes enhanced web-based interactive applications that can provide dynamic visuals of the influenza data collected and analyzed by CDC. These FluView Interactive applications allow people to create customized, visual interpretations of influenza data, as well as make comparisons across flu seasons, regions, age groups and a variety of other demographics.

National Institute for Occupational Safety and Health: Monthly surveillance data on the prevalence of health-related workplace absenteeism among full-time workers in the United States are available from NIOSH.

https://www.cdc.gov/fluview/surveillance/2025-week-17.html
 
Weekly US Influenza Surveillance Report: Key Updates for Week 18, ending May 3, 2025

Key points


Seasonal influenza activity is low and declining.
Summary

Viruses

Clinical Lab 3.6% (Trend
DecreasingArrow.png
)
positive for influenza
this week. Public Health Lab Influenza A(H1N1)pdm09, A(H3N2), and B
viruses were co-circulating this week. Illness

Outpatient Respiratory Illness 2.1% (Trend
StableArrow.png
)
of visits to a health care provider this
week were for respiratory illness
(below baseline). Activity Map 0 moderate jurisdictions 0 high or very high jurisdictions FluSurv-NET 128.1 per 100,000
cumulative hospitalization rate National Healthcare Safety Network (NHSN) Hospital Respiratory Data 2,336 (Trend
DecreasingArrow.png
)
patients admitted to hospitals
with influenza this week. NCHS Mortality 0.2% (Trend
StableArrow.png
)
of deaths attributed to influenza this week. Pediatric Deaths 10 influenza-associated deaths
were reported this week for
a total of 226 deaths this season.
All data are preliminary and may change as more reports are received.

Directional arrows indicate changes between the current week and the previous week. Additional information on the arrows can be found at the bottom of this page.

A description of the CDC influenza surveillance system, including methodology and detailed descriptions of each data component is available on the surveillance methods page.[SUP]1[/SUP]

Additional information on the current and previous influenza seasons for each surveillance component are available on FluView Interactive.

Key Points
  • Seasonal influenza (flu) activity is low and declining.
  • This season is classified as a high severity season overall and for all age groups (children, adults, older adults) and is the first high severity season since 2017-2018.
  • During Week 18, of the 480 viruses reported by public health laboratories, 349 were influenza A and 131 were influenza B. Of the 323 influenza A viruses subtyped during Week 18, 163 (50.5%) were influenza A(H1N1)pdm09, 160 (49.5%) were A(H3N2), and 0 were A(H5).
  • No new influenza A(H5) cases were reported to CDC this week. To date, human-to-human transmission of avian influenza A(H5) virus (H5 bird flu) has not been identified in the United States.
  • Nationally, outpatient respiratory illness remained stable this week and is below baseline. All HHS regions are below their region-specific baselines.
  • Based on data from FluSurv-NET, the cumulative hospitalization rate for this season is the highest observed since the 2010-2011 season.
  • Ten pediatric deaths associated with seasonal influenza virus infection were reported this week, bringing the 2024-2025 season total to 226 pediatric deaths. So far this season, among children who were eligible for influenza vaccination and with known vaccine status, 90% of reported pediatric deaths have occurred in children who were not fully vaccinated against influenza.
  • CDC estimates that there have been at least 47 million illnesses, 610,000 hospitalizations, and 27,000 deaths from flu so far this season.
  • CDC continues to recommend that everyone ages 6 months and older get an annual flu vaccine as long as influenza viruses are circulating.[SUP]1[/SUP]
  • There are prescription flu antiviral drugs that can treat flu illness; those should be started as early as possible and are especially important for patients at higher risk for severe illness.[SUP]2[/SUP]
  • Influenza viruses are among several viruses contributing to respiratory disease activity. CDC is providing updated, integrated information about COVID-19, flu, and respiratory syncytial virus (RSV) activity on a weekly basis.
COVID-19, flu, and RSV activity


U.S. virologic surveillance


Nationally, and in HHS regions 1, 2, 3, 4, 5, 6, 8, and 9 the percentage of respiratory specimens testing positive for influenza virus in clinical laboratories decreased (change ≥ 0.5 percentage points) compared to week 17. Percent positivity increased slightly in region 10 (change ≥ 0.5 percentage points) and remained stable in Region 7 (change < 0.5 percentage points) compared to the previous week. Influenza A and B viruses were co-circulating this week. For regional and state level data and age group distribution, please visit FluView Interactive. Viruses known to be associated with recent receipt of live attenuated influenza vaccine (LAIV) or found upon further testing to be a vaccine virus are not included, as they are not circulating influenza viruses.

Clinical Laboratories


The results of tests performed by clinical laboratories nationwide are summarized below. Data from clinical laboratories (the percentage of specimens tested that are positive for influenza virus) are used to monitor whether influenza activity is increasing or decreasing.
No. of specimens tested50,0713,258,608
No. of positive specimens (%)1,814 (3.6%)480,747 (14.8%)
Positive specimens by type
Influenza A503 (27.7%)431,457 (89.7%)
Influenza B1,311 (72.3%)49,290 (10.3%)
Public Health Laboratories


The results of tests performed by public health laboratories nationwide are summarized below. Data from public health laboratories are used to monitor the proportion of circulating influenza viruses that belong to each influenza subtype/lineage.
No. of specimens tested947135,122
No. of positive specimens48091,601
Positive specimens by type/subtype
Influenza A349 (72.7%)87,012 (95.0%)
Subtyping Performed323 (92.6%)77,226 (88.8%)
(H1N1)pdm09163 (50.5%)40,944 (53.0%)
H3N2160 (49.5%)36,202 (46.9%)
H3N2v[SUP]†[/SUP]0 (0.0%)0 (0.0%)
H5*0 (0.0%)80 (0.1%)
Subtyping not performed26 (7.4%)9,786 (11.2%)
Influenza B131 (27.3%)4,589 (5.0%)
Lineage testing performed79 (60.3%)2,336 (50.9%)
Yamagata lineage0 (0.0%)0 (0.0%)
Victoria lineage79 (100.0%)2,336 (100.0%)
Lineage not performed52 (39.7%)2,253 (49.1%)
[SUB]*These data reflect specimens tested, and the number determined to be positive for influenza viruses at the public health labs (specimens tested is not the same as cases). The data do not reflect specimens tested only at CDC and could include more than one specimen tested per person. The guidance for influenza A(H5) virus testing recommends testing both a conjunctival and respiratory swab for people with conjunctivitis which has resulted in more specimens testing positive for influenza A(H5) virus than the number of human A(H5) cases. For more information on the number of people infected with A(H5) viruses, please[/SUB][SUB] visit the[/SUB] [SUB]"How CDC is monitoring influenza data among people to better understand the current avian influenza A (H5N1) situation".[/SUB]

[SUB][SUP]†[/SUP]When an influenza virus that normally circulates in swine (but not people) is detected in a person, it is called a "variant" influenza virus. Most human infections with variant influenza viruses occur following exposure to swine, but human-to-human transmission can occur. It is important to note that in most cases, variant influenza viruses have not shown the ability to spread easily and sustainably from human-to-human.[/SUB]


[SUP]*This graph reflects the number of specimens tested and the number determined to be positive for influenza viruses at the public health lab (specimens tested is not the same as cases). It does not reflect specimens tested only at CDC and could include more than one specimen tested per person. Specimens tested as part of routine influenza surveillance as well as those tested as part of targeted testing for people exposed to influenza A(H5) are included.[/SUP]

Additional virologic surveillance information for current and past seasons:


Surveillance Methods | FluView Interactive: National, Regional, and State Data or Age Data

Novel Influenza A Virus Infections


No confirmed human infections with influenza A(H5) virus were reported to CDC this week. To date, human-to-human transmission of avian influenza A(H5) virus (H5 bird flu) has not been identified in the United States.

The CSTE position statement, which includes updated case definitions for confirmed, probable, and suspected cases is available at http://www.cste.org/resource/resmgr/position_statements_files_2023/24-ID-09_Novel_Influenza_A.pdf

An up-to-date human case summary during the current outbreak by state and exposure source is available at www.cdc.gov/bird-flu/situation-summary/index.html

Information about avian influenza is available at https://www.cdc.gov/flu/avianflu/index.htm.

A(H5N1) virus interim recommendations for Prevention, Monitoring, and Public Health Investigations are available at https://www.cdc.gov/bird-flu/prevention/hpai-interim-recommendations.html.

The latest case reports on avian influenza outbreaks in wild birds, commercial poultry, backyard or hobbyist flocks, and mammals in the United States are available from the USDA at https://www.aphis.usda.gov/aphis/ou...e-information/avian/avian-influenza/2022-hpai.

Additional information regarding human infections with novel influenza A viruses:


Surveillance Methods | FluView Interactive

Influenza Virus Characterization


CDC performs genetic and antigenic characterization of U.S. viruses submitted from state and local public health laboratories according to the Right Size Roadmap submission guidance. These data are used to compare how similar the currently circulating influenza viruses are relative to the reference viruses representing the current influenza vaccines. The data are also used to monitor evolutionary changes that continually occur in influenza viruses circulating in humans. CDC also tests susceptibility of circulating influenza viruses to antiviral medications including the neuraminidase inhibitors (oseltamivir, zanamivir, and peramivir) and the polymerase acidic protein (PA) endonuclease inhibitor baloxavir. The HA clade and subclades were assigned using Nextclade (https://clades.nextstrain.org).

CDC has genetically characterized 4,217 influenza viruses collected since September 29, 2024.
A/H11,604
5a.2a619 (38.6%)C.1.978 (4.9%)
C.1.9.169 (4.3%)
C.1.9.25 (0.3%)
C.1.9.3461 (28.7%)
C.1.9.46 (0.4%)
5a.2a.1985 (61.4%)D33 (2.1%)
D.111 (0.7%)
D.3762 (47.5%)
D.5179 (11.2%)
A/H32,090
2a.3a6 (0.3%)G.1.3.16 (0.3%)
2a.3a.12,084 (99.7%)J.11 (<0.1%)
J.1.18 (0.4%)
J.21,889 (90.4%)
J.2.151 (2.4%)
J.2.2135 (6.5%)
B/Victoria523
3a.2523 (100%)C.320 (3.8%)
C.549 (9.4%)
C.5.1239 (45.7%)
C.5.51 (0.2%)
C.5.672 (13.8%)
C.5.7142 (27.2%)
B/Yamagata0
Y30Y30
CDC antigenically characterizes influenza viruses by hemagglutination inhibition (HI) assay (H1N1pdm09, H3N2, and B/Victoria viruses) or neutralization-based HINT (H3N2 viruses) using antisera that ferrets make after being infected with reference viruses representing the 2024-2025 Northern Hemisphere recommended cell or recombinant-based vaccine viruses. Antigenic differences between viruses are determined by comparing how well the antibodies made against the vaccine reference viruses recognize the circulating viruses that have been grown in cell culture. Ferret antisera are useful because antibodies raised against a particular virus can often recognize small changes in the surface proteins of other viruses. In HI assays, viruses with similar antigenic properties have antibody titer differences of less than or equal to 4-fold when compared to the reference (vaccine) virus. In HINT, viruses with similar antigenic properties have antibody neutralization titer differences of less than or equal to 8-fold. Viruses selected for antigenic characterization are a subset of the recent genetically characterized viruses and are chosen based on the genetic changes in their surface proteins and may not be proportional to the number of such viruses circulating in the United States.

Influenza A Viruses
  • A(H1N1)pdm09: 389 A(H1N1)pdm09 viruses were antigenically characterized by HI, and 387 (99.5%) were well-recognized (reacting at titers that were within 4-fold of the homologous virus titer) by ferret antisera to cell-grown A/Wisconsin/67/2022-like reference viruses representing the A(H1N1)pdm09 component for the cell- and recombinant-based influenza vaccines.
  • A(H3N2): 437 A(H3N2) viruses were antigenically characterized by HI or HINT, and 262 (60.0%) were well-recognized (reacting at titers that were within 4-fold of the homologous virus titer in HI or reacting at titers that were less than or equal to 8-fold of the homologous virus in HINT) by ferret antisera to cell-grown A/Massachusetts/18/2022-like reference viruses representing the A(H3N2) component for the cell- and recombinant-based influenza vaccines.
Influenza B Viruses
  • B/Victoria: 149 influenza B/Victoria-lineage virus were antigenically characterized by HI, and 147 (98.7%) were well-recognized (reacting at titers that were within 4-fold of the homologous virus titer) by ferret antisera to cell-grown B/Austria/1359417/2021-like reference viruses representing the B/Victoria component for the cell- and recombinant-based influenza vaccines.
  • B/Yamagata: No influenza B/Yamagata-lineage viruses were available for antigenic characterization.
Assessment of Virus Susceptibility to Antiviral Medications


CDC assesses susceptibility of influenza viruses to the antiviral medications including the neuraminidase inhibitors (oseltamivir, zanamivir, and peramivir) and the PA endonuclease inhibitor baloxavir using next generation sequence analysis supplemented by laboratory assays. Information about antiviral susceptibility test methods can be found at U.S. Influenza Surveillance: Purpose and Methods.

Viruses collected in the U.S. since September 29, 2024, were tested for antiviral susceptibility as follows:
Neuraminidase InhibitorsOseltamivirViruses Tested4,1691,5922,059518
Reduced Inhibition1 (<0.1%)1 (<0.1%)00
Highly Reduced Inhibition9 (0.2%)8 (0.5%)1 (<0.1%)0
PeramivirViruses Tested4,1691,5922,059518
Reduced Inhibition0000
Highly Reduced Inhibition8 (0.2%)8 (0.5%)00
ZanamivirViruses Tested4,1691,5922,059518
Reduced Inhibition0000
Highly Reduced Inhibition0000
PA Cap-Dependent Endonuclease InhibitorBaloxavirViruses Tested3,9841,4412,036507
Decreased Susceptibility2 (<0.1%)1 (<0.1%)1 (<0.1%)0
Eight A(H1N1)pdm09 viruses had NA-H275Y amino acid substitution conferring highly reduced inhibition by oseltamivir and peramivir. One A(H1N1)pdm09 virus had NA-I223V and NA-S247N amino acid substitutions and showed reduced inhibition by oseltamivir. One A(H3N2) virus had NA-E119V amino acid substitution and showed highly reduced inhibition by oseltamivir. One A(H1N1)pdm09 virus and one A(H3N2) virus had PA-I38T amino acid substitution associated with reduced susceptibility to baloxavir.

High levels of resistance to the adamantanes (amantadine and rimantadine) persist among influenza A(H1N1)pdm09 and influenza A(H3N2) viruses (the adamantanes are not effective against influenza B viruses). Therefore, use of these antivirals for treatment and prevention of influenza A virus infection is not recommended and data from adamantane resistance testing are not presented.

Outpatient and Emergency Department Illness Surveillance

Outpatient respiratory illness visits


The U.S. Outpatient Influenza-like Illness Surveillance Network (ILINet) monitors outpatient visits for respiratory illness referred to as influenza-like illness [ILI (fever plus cough or sore throat)], not laboratory-confirmed influenza, and will therefore capture respiratory illness visits due to infection with any pathogen that can present with similar symptoms, including influenza virus, SARS-CoV-2, and RSV. It is important to evaluate syndromic surveillance data, including that from ILINet, in the context of other sources of surveillance data to obtain a complete and accurate picture of influenza, SARS-CoV-2, and other respiratory virus activity.

Nationally, during Week 18, 2.1% of patient visits reported through ILINet were due to respiratory illness that included fever plus a cough or sore throat, also referred to as ILI. This week's percentage remained stable (change of ≤ 0.1 percentage points) compared to Week 17 and is below the national baseline of 3.0%. During Week 18, the percentage of visits for ILI decreased (change of > 0.1 percentage points) in regions 1, 2, 3, and 6 and remained stable (change of ≤ 0.1 percentage points) in regions 4, 5, 7, 8, 9, and 10 compared to last week. All regions are below their region-specific baselines. Multiple respiratory viruses are co-circulating, and the relative contribution of influenza virus infections to ILI varies by location.

Outpatient respiratory illness visits by age group


About 70% of ILINet participants provide both the number of patient visits for respiratory illness and the total number of patient visits for the week broken out by age group. Based on these data, the percentage of visits for respiratory illness decreased in the 0-4 years, 5-24 years, and 25-49 years age groups (change of > 0.1 percentage point) and remained stable (change of ≤ 0.1 percentage points) in the 50-64 years and 65+ years age groups in Week 18 compared to Week 17.

Outpatient respiratory illness activity map


Data collected in ILINet are used to produce a measure of ILI activity* by state/jurisdiction and Core Based Statistical Areas (CBSA).
Week 18
(Week ending
May. 3, 2025)
Week 17
(Week ending
Apr. 26, 2025)
Week 18
(Week ending
May. 3, 2025)
Week 17
(Week ending
Apr. 26, 2025)
Very High0000
High0004
Moderate00210
Low244649
Minimal5350648640
Insufficient Data01233226


*Data collected in ILINet may disproportionally represent certain populations within a jurisdiction or CBSA, and therefore, may not accurately depict the full picture of influenza activity for the entire jurisdiction or CBSA. Differences in the data presented here by CDC and independently by some health departments likely represent differing levels of data completeness with data presented by the health department likely being the more complete.

Additional information about medically attended visits for ILI for current and past seasons:


Surveillance Methods | FluView Interactive: National, Regional, and State Data or ILI Activity Map

National Syndromic Surveillance System (NSSP)


The overall percentage of emergency department (ED) visits with a discharge diagnosis of influenza reported in NSSP was 0.4% during Week 18, a decrease (change of > 0.1 percentage point) compared to the previous week. The percentage of ED visits with influenza discharge diagnoses decreased in regions 1, 2, 3, and 5, and remained stable in all other regions. The percentage decreased for the 0-4 years, 5-17 years and 18-64 years age groups and remained stable for the 65+ years age group during Week 18 compared to Week 17. RegionNationalRegion 1Region 2Region 3Region 4Region 5Region 6Region 7Region 8Region 9Region 10
Season2023-2024 & 2024-20252022-2023 Skip Over Chart Container
2.0%4.0%6.0%8.0%10.0%12.0%14.0%16.0%Percent of Emergency Department Visits for InfluenzaWeek 41 of 2023Week 45 of 2023Week 49 of 2023Week 1 of 2024Week 5 of 2024Week 9 of 2024Week 13 of 2024Week 17 of 2024Week 21 of 2024Week 25 of 2024Week 29 of 2024Week 33 of 2024Week 37 of 2024Week 41 of 2024Week 45 of 2024Week 49 of 2024Week 1 of 2025Week 5 of 2025Week 9 of 2025Week 13 of 2025Week 17 of 2025

Age Group


All ages
0-4 years
5-17 years
18-64 years
65+ Skip Data Table
Data Table Download Data (CSV) Skipped data table.

Additional information about emergency department visits for flu for current and past seasons:‎‎‎


Surveillance Methods | Emergency Department Visits for COVID-19, flu, and RSV

Hospitalization surveillance

FluSurv-Net


The Influenza Hospitalization Surveillance Network (FluSurv-NET) conducts population-based surveillance for laboratory-confirmed influenza-related hospitalizations in select counties in 14 states and represents approximately 9% of the U.S. population. FluSurv-NET surveillance for 2024-2025 season ended on April 30, 2025. FluSurv-NET hospitalization data are preliminary. As data are received each week, prior case counts and rates are updated accordingly.

A total of 39,253 laboratory-confirmed influenza-associated hospitalizations were reported by FluSurv-NET sites between October 1, 2024 and April 30, 2025. The weekly hospitalization rate observed during Week 17 and the first 4 days of Week 18 (through April 30) combined was 0.9 per 100,000 population. The weekly hospitalization rate observed during Week 6 (13.6 per 100,000 population) was the highest peak weekly rate observed across all seasons since 2010-2011. The cumulative hospitalization rate was 128.1 per 100,000 population, which is the highest cumulative hospitalization rate for all seasons since 2010-2011.

Among all hospitalizations, 37,465 (95.8%) were associated with influenza A virus, 1,434 (3.8%) with influenza B virus, 38 (0.1%) with influenza A virus and influenza B virus co-infection, and 116 (0.3%) with influenza virus for which the type was not determined. Among those with influenza A subtype information, 6,764 (58.5%) had A(H1N1) pdm09 and 4,828 (41.5%) had A(H3N2).

When examining rates by age, the highest cumulative hospitalization rate per 100,000 population was among adults aged 65 years and older (403.4), followed by adults aged 50-64 years (149.6), children aged 0-4 years (103.6), adults aged 18-49 years (52.3), and children aged 5-17 years (40).

When examining age-adjusted rates by race and ethnicity, the highest cumulative hospitalization rate per 100,000 population was among non-Hispanic Black persons (212.7), followed by American Indian/Alaska Native persons (166.2), non-Hispanic White persons (110.4), Hispanic persons (110.8), and Asian/Pacific Islander persons (79.4).

Among 5,377 hospitalized adults with information on underlying medical conditions, 95.2% had at least one reported underlying medical condition; the most commonly reported were hypertension, cardiovascular disease, metabolic disease, and obesity. Among 2,054 hospitalized women of childbearing age (15-49 years) with information on pregnancy status, 27.8% were pregnant. Among 2,246 hospitalized children with information on underlying medical conditions, 53.1% had at least one reported underlying medical condition; the most commonly reported was asthma, followed by neurologic disease and obesity.


[SUP]**In this figure, weekly rates for all seasons prior to the 2024-2025 season reflect end-of-season rates. For the 2024-2025 season, rates for recent hospital admissions are subject to reporting delays and are shown as a dashed line for the current season. As hospitalization data are received each week, prior case counts and rates are updated accordingly.[/SUP]

Additional FluSurv-NET hospitalization surveillance information for current and past seasons and additional age groups:


Surveillance Methods | FluView Interactive: Rates by Age, Sex, and Race/Ethnicity or Data on Patient Characteristics | RESP-NET Interactive

National Healthcare Safety Network (NHSN) Hospital Respiratory Data


Hospitals report to NHSN the weekly number of patients with laboratory-confirmed influenza who were admitted to the hospital. Nationally, during Week 18, 2,336 laboratory-confirmed influenza-associated hospitalizations were reported. This week's influenza-associated hospitalizations decreased (change of > 5%) compared to Week 17.

The weekly hospital admission rate observed in Week 18 was 0.7 per 100,000. The weekly rate of hospital admissions decreased in HHS regions 1, 2, 3, 4, 5, 6, 7, and 10, remained stable in Region 9 and ranged from 0.3 (Region 7) to 1.1 (Region 3).

When examining rates by age for Week 18, all age groups decreased compared to the previous week. The highest hospital admission rate per 100,000 population was among those 65+ years (1.9), followed by 0-4 years (0.8), and 50-64 years age group (0.6).

Additional NHSN Hospital Respiratory Data information:


Surveillance Methods | Additional Data | FluView Interactive

Mortality surveillance

National Center for Health Statistics (NCHS) Mortality Surveillance


Based on NCHS mortality surveillance data available on May 8, 2025, 0.2% of the deaths that occurred during the week ending May 3, 2025 (Week 18), were due to influenza. This percentage remained stable (< 0.1 percentage point change) compared to Week 17. The data presented are preliminary and may change as more data are received and processed.

Additional pneumonia, influenza and COVID-19 mortality surveillance information for current and past seasons:


Surveillance Methods | FluView Interactive

Influenza-Associated Pediatric Mortality


Ten influenza-associated pediatric deaths occurring during the 2024-2025 season were reported to CDC during Week 18. The deaths occurred between weeks 3 (the week ending January 18, 2025) and 15 (the week ending April 12, 2025). Seven deaths were associated with influenza A viruses. Two of the influenza A viruses had subtyping performed and both were A(H3N2) viruses. Three deaths were associated with influenza B viruses with no lineage determined.

A total of 226 influenza-associated pediatric deaths occurring during the 2024-2025 season have been reported to CDC. Among children who were eligible for influenza vaccination and with known vaccine status, 90% of reported pediatric deaths have occurred in children who were not fully vaccinated against influenza.

Additional pediatric mortality surveillance information for current and past seasons:


Surveillance Methods | FluView Interactive

Additional National and International Influenza Surveillance Information

Indicators Status by System


Increasing:
IncreasingArrow.png

Decreasing:
DecreasingArrow.png

Stable:
StableArrow.png


Clinical Labs: Up or down arrows indicate a change of greater than or equal to 0.5 percentage points in the percent of specimens positive for influenza compared to the previous week.
Outpatient Respiratory Illness (ILINet): Up or down arrows indicate a change of greater than 0.1 percentage points in the percent of visits due to respiratory illness (ILI) compared to the previous week.
NHSN Hospitalizations: Up or down arrows indicate change of greater than or equal to 5% of the number of patients admitted with laboratory-confirmed influenza compared to the previous week.
NCHS Mortality: Up or down arrows indicate change of greater than 0.1 percentage points of the percent of deaths due to influenza compared to the previous week.

Additional surveillance information


FluView Interactive: FluView includes enhanced web-based interactive applications that can provide dynamic visuals of the influenza data collected and analyzed by CDC. These FluView Interactive applications allow people to create customized, visual interpretations of influenza data, as well as make comparisons across flu seasons, regions, age groups and a variety of other demographics.

National Institute for Occupational Safety and Health: Monthly surveillance data on the prevalence of health-related workplace absenteeism among full-time workers in the United States are available from NIOSH.

https://www.cdc.gov/fluview/surveillance/2025-week-18.html
 
Weekly US Influenza Surveillance Report: Key Updates for Week 19, ending May 10, 2025

Key points


Seasonal influenza activity is low and declining.
Summary

Viruses

Clinical Lab 2.9% (Trend
DecreasingArrow.png
)
positive for influenza
this week. Public Health Lab Influenza A(H1N1)pdm09, A(H3N2), and B
viruses were co-circulating this week. Illness

Outpatient Respiratory Illness 1.9% (Trend
StableArrow.png
)
of visits to a health care provider this
week were for respiratory illness
(below baseline). Activity Map 0 moderate jurisdictions 0 high or very high jurisdictions FluSurv-NET 128 per 100,000
cumulative hospitalization rate National Healthcare Safety Network (NHSN) Hospital Respiratory Data 2,008 (Trend
DecreasingArrow.png
)
patients admitted to hospitals
with influenza this week. NCHS Mortality 0.2% (Trend
StableArrow.png
)
of deaths attributed to influenza this week. Pediatric Deaths 1 influenza-associated deaths
were reported this week for
a total of 227 deaths this season.
All data are preliminary and may change as more reports are received.

Directional arrows indicate changes between the current week and the previous week. Additional information on the arrows can be found at the bottom of this page.

A description of the CDC influenza surveillance system, including methodology and detailed descriptions of each data component is available on the surveillance methods page.[SUP]1[/SUP]

Additional information on the current and previous influenza seasons for each surveillance component are available on FluView Interactive.

Key Points
  • Seasonal influenza (flu) activity is low and declining.
  • This season is classified as a high severity season overall and for all age groups (children, adults, older adults) and is the first high severity season since 2017-2018.
  • During Week 19, of the 501 viruses reported by public health laboratories, 334 were influenza A and 167 were influenza B. Of the 327 influenza A viruses subtyped during Week 19, 195 (59.6%) were influenza A(H1N1)pdm09, 132 (40.4%) were A(H3N2), and 0 were A(H5).
  • No new influenza A(H5) cases were reported to CDC this week. To date, human-to-human transmission of avian influenza A(H5) virus (H5 bird flu) has not been identified in the United States.
  • Nationally, outpatient respiratory illness remained stable this week and is below baseline. All HHS regions are below their region-specific baselines.
  • Based on data from FluSurv-NET, the cumulative hospitalization rate for this season is the highest observed since the 2010-2011 season.
  • One pediatric death associated with seasonal influenza virus infection was reported this week, bringing the 2024-2025 season total to 227 pediatric deaths. So far this season, among children who were eligible for influenza vaccination and with known vaccine status, 90% of reported pediatric deaths have occurred in children who were not fully vaccinated against influenza.
  • CDC estimates that there have been at least 47 million illnesses, 610,000 hospitalizations, and 27,000 deaths from flu so far this season.
  • CDC continues to recommend that everyone ages 6 months and older get an annual flu vaccine as long as influenza viruses are circulating.[SUP]1[/SUP]
  • There are prescription flu antiviral drugs that can treat flu illness; those should be started as early as possible and are especially important for patients at higher risk for severe illness.[SUP]2[/SUP]
  • Influenza viruses are among several viruses contributing to respiratory disease activity. CDC is providing updated, integrated information about COVID-19, flu, and respiratory syncytial virus (RSV) activity on a weekly basis.
COVID-19, flu, and RSV activity

U.S. virologic surveillance


Nationally, and in HHS regions 1, 2, 6, and 8, the percentage of respiratory specimens testing positive for influenza virus in clinical laboratories decreased (change ≥ 0.5 percentage points) compared to week 18. Percent positivity remained stable in regions 3, 4, 5, 7, 9, and 10 (change < 0.5 percentage points) compared to the previous week. Influenza A and B viruses were co-circulating this week. For regional and state level data and age group distribution, please visit FluView Interactive. Viruses known to be associated with recent receipt of live attenuated influenza vaccine (LAIV) or found upon further testing to be a vaccine virus are not included, as they are not circulating influenza viruses.

Clinical Laboratories


The results of tests performed by clinical laboratories nationwide are summarized below. Data from clinical laboratories (the percentage of specimens tested that are positive for influenza virus) are used to monitor whether influenza activity is increasing or decreasing.
No. of specimens tested43,5633,312,618
No. of positive specimens (%)1,263 (2.9%)482,292 (14.6%)
Positive specimens by type
Influenza A351 (27.8%)431,926 (89.6%)
Influenza B912 (72.2%)50,366 (10.4%)


Public Health Laboratories


The results of tests performed by public health laboratories nationwide are summarized below. Data from public health laboratories are used to monitor the proportion of circulating influenza viruses that belong to each influenza subtype/lineage.
No. of specimens tested938136,863
No. of positive specimens50192,552
Positive specimens by type/subtype
Influenza A334 (66.7%)87,605 (94.7%)
Subtyping Performed327 (97.9%)77,880 (88.9%)
(H1N1)pdm09195 (59.6%)41,343 (53.1%)
H3N2132 (40.4%)36,457 (46.8%)
H3N2v[SUP]†[/SUP]00
H5*080 (0.1%)
Subtyping not performed7 (2.1%)9,725 (11.1%)
Influenza B167 (33.3%)4,947 (5.3%)
Lineage testing performed113 (67.7%)2,634 (53.2%)
Yamagata lineage00
Victoria lineage113 (100%)2,634 (100%)
Lineage not performed54 (32.3%)2,313 (46.8%)
[SUB]*These data reflect specimens tested, and the number determined to be positive for influenza viruses at the public health labs (specimens tested is not the same as cases). The data do not reflect specimens tested only at CDC and could include more than one specimen tested per person. The guidance for influenza A(H5) virus testing recommends testing both a conjunctival and respiratory swab for people with conjunctivitis which has resulted in more specimens testing positive for influenza A(H5) virus than the number of human A(H5) cases. For more information on the number of people infected with A(H5) viruses, please visit the[/SUB] [SUB]"How CDC is monitoring influenza data among people to better understand the current avian influenza A (H5N1) situation".[/SUB]

[SUB][SUP]†[/SUP]When an influenza virus that normally circulates in swine (but not people) is detected in a person, it is called a "variant" influenza virus. Most human infections with variant influenza viruses occur following exposure to swine, but human-to-human transmission can occur. It is important to note that in most cases, variant influenza viruses have not shown the ability to spread easily and sustainably from human-to-human.[/SUB]


[SUP]*This graph reflects the number of specimens tested and the number determined to be positive for influenza viruses at the public health lab (specimens tested is not the same as cases). It does not reflect specimens tested only at CDC and could include more than one specimen tested per person. Specimens tested as part of routine influenza surveillance as well as those tested as part of targeted testing for people exposed to influenza A(H5) are included.[/SUP]

Additional virologic surveillance information for current and past seasons:


Surveillance Methods | FluView Interactive: National, Regional, and State Data or Age Data

Novel Influenza A Virus Infections


No confirmed human infections with influenza A(H5) virus were reported to CDC this week. To date, human-to-human transmission of avian influenza A(H5) virus (H5 bird flu) has not been identified in the United States.

The CSTE position statement, which includes updated case definitions for confirmed, probable, and suspected cases is available at http://www.cste.org/resource/resmgr/position_statements_files_2023/24-ID-09_Novel_Influenza_A.pdf

An up-to-date human case summary during the current outbreak by state and exposure source is available at www.cdc.gov/bird-flu/situation-summary/index.html

Information about avian influenza is available at https://www.cdc.gov/flu/avianflu/index.htm.

A(H5N1) virus interim recommendations for Prevention, Monitoring, and Public Health Investigations are available at https://www.cdc.gov/bird-flu/prevention/hpai-interim-recommendations.html.

The latest case reports on avian influenza outbreaks in wild birds, commercial poultry, backyard or hobbyist flocks, and mammals in the United States are available from the USDA at https://www.aphis.usda.gov/aphis/ou...e-information/avian/avian-influenza/2022-hpai.

Additional information regarding human infections with novel influenza A viruses:


Surveillance Methods | FluView Interactive

Influenza Virus Characterization


CDC performs genetic and antigenic characterization of U.S. viruses submitted from state and local public health laboratories according to the Right Size Roadmap submission guidance. These data are used to compare how similar the currently circulating influenza viruses are relative to the reference viruses representing the current influenza vaccines. The data are also used to monitor evolutionary changes that continually occur in influenza viruses circulating in humans. CDC also tests susceptibility of circulating influenza viruses to antiviral medications including the neuraminidase inhibitors (oseltamivir, zanamivir, and peramivir) and the polymerase acidic protein (PA) endonuclease inhibitor baloxavir. The HA clade and subclades were assigned using Nextclade (https://clades.nextstrain.org).

CDC has genetically characterized 4,327 influenza viruses collected since September 29, 2024.
A/H11,654
5a.2a632 (38.2%)C.1.978 (4.7%)
C.1.9.170 (4.2%)
C.1.9.25 (0.4%)
C.1.9.3473 (28.6%)
C.1.9.46 (0.4%)
5a.2a.11,022 (61.8%)D34 (2.1%)
D.111 (0.7%)
D.3798 (48.2%)
D.5179 (10.8%)
A/H32,112
2a.3a6 (0.3%)G.1.3.16 (0.3%)
2a.3a.12,106 (99.7%)J.11 (<0.1%)
J.1.18 (0.4%)
J.21,910 (90.4%)
J.2.151 (2.4%)
J.2.2136 (6.4%)
B/Victoria561
3a.2561 (100%)C.326 (4.6%)
C.554 (9.6%)
C.5.1261 (46.5%)
C.5.51 (0.2%)
C.5.674 (13.2%)
C.5.7145 (25.8%)
B/Yamagata0
Y30Y30
CDC antigenically characterizes influenza viruses by hemagglutination inhibition (HI) assay (H1N1pdm09, H3N2, and B/Victoria viruses) or neutralization-based HINT (H3N2 viruses) using antisera that ferrets make after being infected with reference viruses representing the 2024-2025 Northern Hemisphere recommended cell or recombinant-based vaccine viruses. Antigenic differences between viruses are determined by comparing how well the antibodies made against the vaccine reference viruses recognize the circulating viruses that have been grown in cell culture. Ferret antisera are useful because antibodies raised against a particular virus can often recognize small changes in the surface proteins of other viruses. In HI assays, viruses with similar antigenic properties have antibody titer differences of less than or equal to 4-fold when compared to the reference (vaccine) virus. In HINT, viruses with similar antigenic properties have antibody neutralization titer differences of less than or equal to 8-fold. Viruses selected for antigenic characterization are a subset of the recent genetically characterized viruses and are chosen based on the genetic changes in their surface proteins and may not be proportional to the number of such viruses circulating in the United States.

Influenza A Viruses
  • A(H1N1)pdm09: 423 A(H1N1)pdm09 viruses were antigenically characterized by HI, and 421 (99.5%) were well-recognized (reacting at titers that were within 4-fold of the homologous virus titer) by ferret antisera to cell-grown A/Wisconsin/67/2022-like reference viruses representing the A(H1N1)pdm09 component for the cell- and recombinant-based influenza vaccines.
  • A(H3N2): 491 A(H3N2) viruses were antigenically characterized by HI or HINT, and 285 (58.0%) were well-recognized (reacting at titers that were within 4-fold of the homologous virus titer in HI or reacting at titers that were less than or equal to 8-fold of the homologous virus in HINT) by ferret antisera to cell-grown A/Massachusetts/18/2022-like reference viruses representing the A(H3N2) component for the cell- and recombinant-based influenza vaccines.
Influenza B Viruses
  • B/Victoria: 175 influenza B/Victoria-lineage virus were antigenically characterized by HI, and 170 (97.1%) were well-recognized (reacting at titers that were within 4-fold of the homologous virus titer) by ferret antisera to cell-grown B/Austria/1359417/2021-like reference viruses representing the B/Victoria component for the cell- and recombinant-based influenza vaccines.
  • B/Yamagata: No influenza B/Yamagata-lineage viruses were available for antigenic characterization.
Assessment of Virus Susceptibility to Antiviral Medications


CDC assesses susceptibility of influenza viruses to the antiviral medications including the neuraminidase inhibitors (oseltamivir, zanamivir, and peramivir) and the PA endonuclease inhibitor baloxavir using next generation sequence analysis supplemented by laboratory assays. Information about antiviral susceptibility test methods can be found at U.S. Influenza Surveillance: Purpose and Methods.

Viruses collected in the U.S. since September 29, 2024, were tested for antiviral susceptibility as follows:
Neuraminidase InhibitorsOseltamivirViruses Tested4,2351,6242,072539
Reduced Inhibition1 (<0.1%)1 (0.1%)00
Highly Reduced Inhibition9 (0.2%)8 (0.5%)1 (<0.1%)0
PeramivirViruses Tested4,2351,6242,072539
Reduced Inhibition0000
Highly Reduced Inhibition8 (0.2%)8 (0.5%)00
ZanamivirViruses Tested4,2351,6242,072539
Reduced Inhibition0000
Highly Reduced Inhibition0000
PA Cap-Dependent Endonuclease InhibitorBaloxavirViruses Tested4,0781,5012,049528
Decreased Susceptibility2 (<0.1%)1 (0.1%)1 (<0.1%)0
Eight A(H1N1)pdm09 viruses had NA-H275Y amino acid substitution conferring highly reduced inhibition by oseltamivir and peramivir. One A(H1N1)pdm09 virus had NA-I223V and NA-S247N amino acid substitutions and showed reduced inhibition by oseltamivir. One A(H3N2) virus had NA-E119V amino acid substitution and showed highly reduced inhibition by oseltamivir. One A(H1N1)pdm09 virus and one A(H3N2) virus had PA-I38T amino acid substitution associated with reduced susceptibility to baloxavir.

High levels of resistance to the adamantanes (amantadine and rimantadine) persist among influenza A(H1N1)pdm09 and influenza A(H3N2) viruses (the adamantanes are not effective against influenza B viruses). Therefore, use of these antivirals for treatment and prevention of influenza A virus infection is not recommended and data from adamantane resistance testing are not presented.

Outpatient and Emergency Department Illness Surveillance

Outpatient respiratory illness visits


The U.S. Outpatient Influenza-like Illness Surveillance Network (ILINet) monitors outpatient visits for respiratory illness referred to as influenza-like illness [ILI (fever plus cough or sore throat)], not laboratory-confirmed influenza, and will therefore capture respiratory illness visits due to infection with any pathogen that can present with similar symptoms, including influenza virus, SARS-CoV-2, and RSV. It is important to evaluate syndromic surveillance data, including that from ILINet, in the context of other sources of surveillance data to obtain a complete and accurate picture of influenza, SARS-CoV-2, and other respiratory virus activity.

Nationally, during Week 19, 1.9% of patient visits reported through ILINet were due to respiratory illness that included fever plus a cough or sore throat, also referred to as ILI. This week's percentage remained stable (change of ≤ 0.1 percentage points) compared to Week 18 and is below the national baseline of 3.0%. During Week 19, the percentage of visits for ILI decreased (change of > 0.1 percentage points) in regions 1, 2, and 6 and remained stable (change of ≤ 0.1 percentage points) in regions 3, 4, 5, 7, 8, 9, and 10 compared to last week. All regions are below their region-specific baselines. Multiple respiratory viruses are co-circulating, and the relative contribution of influenza virus infections to ILI varies by location.

Outpatient respiratory illness visits by age group


About 70% of ILINet participants provide both the number of patient visits for respiratory illness and the total number of patient visits for the week broken out by age group. Based on these data, the percentage of visits for respiratory illness remained stable (change of ≤ 0.1 percentage points) in all age groups (0-4 years, 5-24 years, 25-49 years, 50-64 years, and 65+ years) in Week 19 compared to Week 18.

Outpatient respiratory illness activity map


Data collected in ILINet are used to produce a measure of ILI activity* by state/jurisdiction and Core Based Statistical Areas (CBSA).
Week 19
(Week ending
May 10, 2025)
Week 18
(Week ending
May 3, 2025)
Week 19
(Week ending
May 10, 2025)
Week 18
(Week ending
May 3, 2025)
Very High0000
High0000
Moderate0012
Low122547
Minimal5453670651
Insufficient Data00233229


*Data collected in ILINet may disproportionally represent certain populations within a jurisdiction or CBSA, and therefore, may not accurately depict the full picture of influenza activity for the entire jurisdiction or CBSA. Differences in the data presented here by CDC and independently by some health departments likely represent differing levels of data completeness with data presented by the health department likely being the more complete.

Additional information about medically attended visits for ILI for current and past seasons:


Surveillance Methods | FluView Interactive: National, Regional, and State Data or ILI Activity Map

National Syndromic Surveillance System (NSSP)


The overall percentage of emergency department (ED) visits with a discharge diagnosis of influenza reported in NSSP was 0.3% during Week 19 and remained stable (change of ≤ 0.1 percentage point) compared to the previous week. The percentage of ED visits with influenza discharge diagnoses decreased (change of > 0.1 percentage point) in regions 1 and 2 and remained stable in all other regions (3, 4, 5, 6, 7, 8, 9, and 10). The percentage decreased (change of > 0.1 percentage point) in the 0-4 years and 5-17 years age groups and remained stable (change of ≤ 0.1 percentage point) for all other age groups (18-64 years, and 65+ years) during Week 19 compared to Week 18. RegionNationalRegion 1Region 2Region 3Region 4Region 5Region 6Region 7Region 8Region 9Region 10
Season2023-2024 & 2024-20252022-2023 Skip Over Chart Container
2.0%4.0%6.0%8.0%10.0%12.0%14.0%16.0%Percent of Emergency Department Visits for InfluenzaWeek 43 of 2023Week 47 of 2023Week 51 of 2023Week 3 of 2024Week 7 of 2024Week 11 of 2024Week 15 of 2024Week 19 of 2024Week 23 of 2024Week 27 of 2024Week 31 of 2024Week 35 of 2024Week 39 of 2024Week 43 of 2024Week 47 of 2024Week 51 of 2024Week 3 of 2025Week 7 of 2025Week 11 of 2025Week 15 of 2025Week 19 of 2025 Age Group


All ages
0-4 years
5-17 years
18-64 years
65+ Skip Data Table
Data Table Download Data (CSV) Skipped data table.

Additional information about emergency department visits for flu for current and past seasons:‎‎‎


Surveillance Methods | Emergency Department Visits for COVID-19, flu, and RSV

Hospitalization surveillance

FluSurv-Net


The Influenza Hospitalization Surveillance Network (FluSurv-NET) conducts population-based surveillance for laboratory-confirmed influenza-related hospitalizations in select counties in 14 states and represents approximately 9% of the U.S. population. FluSurv-NET surveillance for 2024-2025 season ended on April 30, 2025. FluSurv-NET hospitalization data are preliminary. As data are received each week, prior case counts and rates are updated accordingly.

A total of 39,233 laboratory-confirmed influenza-associated hospitalizations were reported by FluSurv-NET sites between October 1, 2024, and April 30, 2025. The weekly hospitalization rate observed during Week 17 and the first four days of Week 18 combined was 1.0 per 100,000 population. The weekly hospitalization rates observed during Week 5 and Week 6 (13.6 per 100,000 population) were tied for the highest peak weekly rate observed across all seasons since 2010-2011. The cumulative hospitalization rate was 128.0 per 100,000 population, which is the highest cumulative hospitalization rate for all seasons since 2010-2011.

Among all hospitalizations, 37,588 (95.8%) were associated with influenza A virus, 1,496 (3.8%) with influenza B virus, 41 (0.1%) with influenza A virus and influenza B virus co-infection, and 108 (0.3%) with influenza virus for which the type was not determined. Among those with influenza A subtype information, 6,885 (58.5%) had A(H1N1) pdm09 and 4,888 (41.5%) had A(H3N2).

When examining rates by age, the highest cumulative hospitalization rate per 100,000 population was among adults aged 65 years and older (403.1), followed by adults aged 50-64 years (149.7), children aged 0-4 years (103.8), adults aged 18-49 years (52.2), and children aged 5-17 years (39.9).

When examining age-adjusted rates by race and ethnicity, the highest cumulative hospitalization rate per 100,000 population was among non-Hispanic Black persons (212.5), followed by American Indian/Alaska Native persons (166.7), non-Hispanic White persons (110.4), Hispanic persons (111.0), and Asian/Pacific Islander persons (79.3).

Among 5,377 hospitalized adults with information on underlying medical conditions, 95.2% had at least one reported underlying medical condition; the most commonly reported were hypertension, cardiovascular disease, metabolic disease, and obesity. Among 2,054 hospitalized women of childbearing age (15-49 years) with information on pregnancy status, 27.8% were pregnant. Among 2,246 hospitalized children with information on underlying medical conditions, 53.4% had at least one reported underlying medical condition; the most commonly reported was asthma, followed by neurologic disease and obesity.


[SUP]**In this figure, weekly rates for all seasons prior to the 2024-2025 season reflect end-of-season rates. For the 2024-2025 season, rates for recent hospital admissions are subject to reporting delays and are shown as a dashed line for the current season. As hospitalization data are received each week, prior case counts and rates are updated accordingly.[/SUP]

Additional FluSurv-NET hospitalization surveillance information for current and past seasons and additional age groups:


Surveillance Methods | FluView Interactive: Rates by Age, Sex, and Race/Ethnicity or Data on Patient Characteristics | RESP-NET Interactive

National Healthcare Safety Network (NHSN) Hospital Respiratory Data


Hospitals report to NHSN the weekly number of patients with laboratory-confirmed influenza who were admitted to the hospital. Nationally, during Week 19, 2,008 laboratory-confirmed influenza-associated hospitalizations were reported. This week's influenza-associated hospitalizations decreased (change of > 5%) compared to Week 18.

The weekly hospital admission rate observed in Week 19 was 0.6 per 100,000. The weekly rate of hospital admissions decreased in HHS regions 1, 3, 4, 5, 6, 7, 8, 9, and 10, remained stable in Region 2, and ranged from 0.3 (Region 7) to 1.1 (Region 2).

When examining rates by age for Week 19, all age groups decreased compared to the previous week, except for the 0-4-years age group, which remained stable. The highest hospital admission rate per 100,000 population was among those 65+ years (1.6), followed by 0-4 years (0.8), and 50-64 years age group (0.5).

Additional NHSN Hospital Respiratory Data information:


Surveillance Methods | Additional Data | FluView Interactive

Mortality surveillance

National Center for Health Statistics (NCHS) Mortality Surveillance


Based on NCHS mortality surveillance data available on May 15, 2025, 0.2% of the deaths that occurred during the week ending May 10, 2025 (Week 19), were due to influenza. This percentage remained stable (< 0.1 percentage point change) compared to Week 18. The data presented are preliminary and may change as more data are received and processed.


View Chart Data

Additional pneumonia, influenza and COVID-19 mortality surveillance information for current and past seasons:


Surveillance Methods | FluView Interactive

Influenza-Associated Pediatric Mortality


One influenza-associated pediatric death occurring during the 2024-2025 season was reported to CDC during Week 19. This death was associated with an influenza A(H1N1) virus and occurred during Week 2 (the week ending January 11, 2025).

A total of 227 influenza-associated pediatric deaths occurring during the 2024-2025 season have been reported to CDC. Among children who were eligible for influenza vaccination and with known vaccine status, 90% of reported pediatric deaths have occurred in children who were not fully vaccinated against influenza.

Additional pediatric mortality surveillance information for current and past seasons:


Surveillance Methods | FluView Interactive

Additional National and International Influenza Surveillance Information

Indicators Status by System


Increasing:
IncreasingArrow.png

Decreasing:
DecreasingArrow.png

Stable:
StableArrow.png


Clinical Labs: Up or down arrows indicate a change of greater than or equal to 0.5 percentage points in the percent of specimens positive for influenza compared to the previous week.
Outpatient Respiratory Illness (ILINet): Up or down arrows indicate a change of greater than 0.1 percentage points in the percent of visits due to respiratory illness (ILI) compared to the previous week.
NHSN Hospitalizations: Up or down arrows indicate change of greater than or equal to 5% of the number of patients admitted with laboratory-confirmed influenza compared to the previous week.
NCHS Mortality: Up or down arrows indicate change of greater than 0.1 percentage points of the percent of deaths due to influenza compared to the previous week.

Additional surveillance information


FluView Interactive: FluView includes enhanced web-based interactive applications that can provide dynamic visuals of the influenza data collected and analyzed by CDC. These FluView Interactive applications allow people to create customized, visual interpretations of influenza data, as well as make comparisons across flu seasons, regions, age groups and a variety of other demographics.

National Institute for Occupational Safety and Health: Monthly surveillance data on the prevalence of health-related workplace absenteeism among full-time workers in the United States are available from NIOSH.

https://www.cdc.gov/fluview/surveillance/2025-week-19.html
 
Weekly US Influenza Surveillance Report: Key Updates for Week 20, ending May 17, 2025

Key points


Seasonal influenza activity is low.
Summary

Viruses

Clinical Lab 2.4% (Trend
StableArrow.png
)
positive for influenza
this week. Public Health Lab Influenza A(H1N1)pdm09, A(H3N2), and B
viruses were co-circulating this week.

Illness

Outpatient Respiratory Illness 1.9% (Trend
StableArrow.png
)
of visits to a health care provider this
week were for respiratory illness
(below baseline). Activity Map 0 moderate jurisdictions 0 high or very high jurisdictions FluSurv-NET 128.1 per 100,000
cumulative hospitalization rate National Healthcare Safety Network (NHSN) Hospital Respiratory Data 1,677 (Trend
DecreasingArrow.png
)
patients admitted to hospitals
with influenza this week. NCHS Mortality 0.1% (Trend
StableArrow.png
)
of deaths attributed to influenza this week. Pediatric Deaths 4 influenza-associated deaths
were reported this week for
a total of 231 deaths this season.
All data are preliminary and may change as more reports are received.

Directional arrows indicate changes between the current week and the previous week. Additional information on the arrows can be found at the bottom of this page.

A description of the CDC influenza surveillance system, including methodology and detailed descriptions of each data component is available on the surveillance methods page.[SUP]1[/SUP]

Additional information on the current and previous influenza seasons for each surveillance component are available on FluView Interactive.

Key Points
  • Seasonal influenza (flu) activity is low.
  • This season is classified as a high severity season overall and for all age groups (children, adults, older adults) and is the first high severity season since 2017-2018.
  • During Week 20, of the 1,025 viruses reported by public health laboratories, 917 were influenza A and 108 were influenza B. Of the 904 influenza A viruses subtyped during Week 20, 491 (54.3%) were influenza A(H1N1)pdm09, 413 (45.7%) were A(H3N2), and 0 were A(H5).
  • No new influenza A(H5) cases were reported to CDC this week. To date, human-to-human transmission of avian influenza A(H5) virus (H5 bird flu) has not been identified in the United States.
  • Nationally, outpatient respiratory illness remained stable this week and is below baseline. All HHS regions are below their region-specific baselines.
  • Based on data from FluSurv-NET, the cumulative hospitalization rate for this season is the highest observed since the 2010-2011 season.
  • Four pediatric deaths associated with seasonal influenza virus infection were reported this week, bringing the 2024-2025 season total to 231 pediatric deaths. So far this season, among children who were eligible for influenza vaccination and with known vaccine status, 90% of reported pediatric deaths have occurred in children who were not fully vaccinated against influenza.
  • CDC estimates that there have been at least 47 million illnesses, 610,000 hospitalizations, and 27,000 deaths from flu so far this season.
  • CDC continues to recommend that everyone ages 6 months and older get an annual flu vaccine as long as influenza viruses are circulating.[SUP]1[/SUP]
  • There are prescription flu antiviral drugs that can treat flu illness; those should be started as early as possible and are especially important for patients at higher risk for severe illness.[SUP]2[/SUP]
  • Influenza viruses are among several viruses contributing to respiratory disease activity. CDC is providing updated, integrated information about COVID-19, flu, and respiratory syncytial virus (RSV) activity on a weekly basis.
COVID-19, flu, and RSV activity


U.S. virologic surveillance


Nationally, the percentage of respiratory specimens testing positive for influenza virus in clinical laboratories remained stable (change < 0.5 percentage points) compared to Week 19. Percent positivity decreased (change ≥ 0.5 percentage points) in HHS regions 1, 2, 3, 5, and 9 and remained stable in HHS regions 4, 6, 7, 8, and 10 (change < 0.5 percentage points) compared to the previous week. Influenza A and B viruses were co-circulating this week. For regional and state level data and age group distribution, please visit FluView Interactive. Viruses known to be associated with recent receipt of live attenuated influenza vaccine (LAIV) or found upon further testing to be a vaccine virus are not included, as they are not circulating influenza viruses.

Clinical Laboratories


The results of tests performed by clinical laboratories nationwide are summarized below. Data from clinical laboratories (the percentage of specimens tested that are positive for influenza virus) are used to monitor whether influenza activity is increasing or decreasing.
No. of specimens tested37,5303,366,979
No. of positive specimens (%)892 (2.4%)483,636 (14.4%)
Positive specimens by type
Influenza A228 (25.6%)432,310 (89.4%)
Influenza B664 (74.4%)51,326 (10.6%)


Public Health Laboratories


The results of tests performed by public health laboratories nationwide are summarized below. Data from public health laboratories are used to monitor the proportion of circulating influenza viruses that belong to each influenza subtype/lineage.
No. of specimens tested1,383138,957
No. of positive specimens1,02594,084
Positive specimens by type/subtype
Influenza A917 (89.5%)88,945 (94.5%)
Subtyping Performed904 (98.6%)79,309 (89.2%)
(H1N1)pdm09491 (54.3%)42,119 (53.1%)
H3N2413 (45.7%)37,111 (46.8%)
H3N2v[SUP]†[/SUP]00
H5*079 (0.1%)
Subtyping not performed13 (1.4%)9,636 (10.8%)
Influenza B108 (10.5%)5,193 (5.5%)
Lineage testing performed93 (86.1%)2,813 (54.7%)
Yamagata lineage00
Victoria lineage93 (100%)2,813 (100%)
Lineage not performed15 (13.9%)2,326 (45.3%)
[SUB]*These data reflect specimens tested, and the number determined to be positive for influenza viruses at the public health labs (specimens tested is not the same as cases). The data do not reflect specimens tested only at CDC and could include more than one specimen tested per person. The guidance for influenza A(H5) virus testing recommends testing both a conjunctival and respiratory swab for people with conjunctivitis which has resulted in more specimens testing positive for influenza A(H5) virus than the number of human A(H5) cases. For more information on the number of people infected with A(H5) viruses, please visit the[/SUB] [SUB]"How CDC is monitoring influenza data among people to better understand the current avian influenza A (H5N1) situation".[/SUB]

[SUB][SUP]†[/SUP]When an influenza virus that normally circulates in swine (but not people) is detected in a person, it is called a "variant" influenza virus. Most human infections with variant influenza viruses occur following exposure to swine, but human-to-human transmission can occur. It is important to note that in most cases, variant influenza viruses have not shown the ability to spread easily and sustainably from human-to-human.[/SUB]


[SUP]*This graph reflects the number of specimens tested and the number determined to be positive for influenza viruses at the public health lab (specimens tested is not the same as cases). It does not reflect specimens tested only at CDC and could include more than one specimen tested per person. Specimens tested as part of routine influenza surveillance as well as those tested as part of targeted testing for people exposed to influenza A(H5) are included.[/SUP]

Additional virologic surveillance information for current and past seasons:


Surveillance Methods | FluView Interactive: National, Regional, and State Data or Age Data

Novel Influenza A Virus Infections


No confirmed human infections with influenza A(H5) virus were reported to CDC this week. To date, human-to-human transmission of avian influenza A(H5) virus (H5 bird flu) has not been identified in the United States.

The CSTE position statement, which includes updated case definitions for confirmed, probable, and suspected cases is available at http://www.cste.org/resource/resmgr/position_statements_files_2023/24-ID-09_Novel_Influenza_A.pdf

An up-to-date human case summary during the current outbreak by state and exposure source is available at www.cdc.gov/bird-flu/situation-summary/index.html

Information about avian influenza is available at https://www.cdc.gov/flu/avianflu/index.htm.

A(H5N1) virus interim recommendations for Prevention, Monitoring, and Public Health Investigations are available at https://www.cdc.gov/bird-flu/prevention/hpai-interim-recommendations.html.

The latest case reports on avian influenza outbreaks in wild birds, commercial poultry, backyard or hobbyist flocks, and mammals in the United States are available from the USDA at https://www.aphis.usda.gov/aphis/ou...e-information/avian/avian-influenza/2022-hpai.

Additional information regarding human infections with novel influenza A viruses:


Surveillance Methods | FluView Interactive

Influenza Virus Characterization


CDC performs genetic and antigenic characterization of U.S. viruses submitted from state and local public health laboratories according to the Right Size Roadmap submission guidance. These data are used to compare how similar the currently circulating influenza viruses are relative to the reference viruses representing the current influenza vaccines. The data are also used to monitor evolutionary changes that continually occur in influenza viruses circulating in humans. CDC also tests susceptibility of circulating influenza viruses to antiviral medications including the neuraminidase inhibitors (oseltamivir, zanamivir, and peramivir) and the polymerase acidic protein (PA) endonuclease inhibitor baloxavir. The HA clade and subclades were assigned using Nextclade (https://clades.nextstrain.org).

CDC has genetically characterized 4,567 influenza viruses collected since September 29, 2024.
A/H11,722
5a.2a637 (37.0%)C.1.981 (4.7%)
C.1.9.170 (4.1%)
C.1.9.25 (0.3%)
C.1.9.3475 (27.6%)
C.1.9.46 (0.3%)
5a.2a.11,085 (63.0%)D34 (2.0%)
D.111 (0.6%)
D.3861 (50.0%)
D.5179 (10.4%)
A/H32,189
2a.3a6 (0.3%)G.1.3.16 (0.3%)
2a.3a.12,183 (99.7%)J.11 (<0.1%)
J.1.18 (0.4%)
J.21,981 (90.5%)
J.2.151 (2.3%)
J.2.2142 (6.5%)
B/Victoria656
3a.2656 (100%)C.348 (7.3%)
C.559 (9.0%)
C.5.1292 (44.5%)
C.5.51 (0.2%)
C.5.688 (13.4%)
C.5.7168 (25.6%)
B/Yamagata0
Y30Y30
CDC antigenically characterizes influenza viruses by hemagglutination inhibition (HI) assay (H1N1pdm09, H3N2, and B/Victoria viruses) or neutralization-based HINT (H3N2 viruses) using antisera that ferrets make after being infected with reference viruses representing the 2024-2025 Northern Hemisphere recommended cell or recombinant-based vaccine viruses. Antigenic differences between viruses are determined by comparing how well the antibodies made against the vaccine reference viruses recognize the circulating viruses that have been grown in cell culture. Ferret antisera are useful because antibodies raised against a particular virus can often recognize small changes in the surface proteins of other viruses. In HI assays, viruses with similar antigenic properties have antibody titer differences of less than or equal to 4-fold when compared to the reference (vaccine) virus. In HINT, viruses with similar antigenic properties have antibody neutralization titer differences of less than or equal to 8-fold. Viruses selected for antigenic characterization are a subset of the recent genetically characterized viruses and are chosen based on the genetic changes in their surface proteins and may not be proportional to the number of such viruses circulating in the United States.

Influenza A Viruses
  • A(H1N1)pdm09: 423 A(H1N1)pdm09 viruses were antigenically characterized by HI, and 421 (99.5%) were well-recognized (reacting at titers that were within 4-fold of the homologous virus titer) by ferret antisera to cell-grown A/Wisconsin/67/2022-like reference viruses representing the A(H1N1)pdm09 component for the cell- and recombinant-based influenza vaccines.
  • A(H3N2): 558 A(H3N2) viruses were antigenically characterized by HI or HINT, and 327 (58.6%) were well-recognized (reacting at titers that were within 4-fold of the homologous virus titer in HI or reacting at titers that were less than or equal to 8-fold of the homologous virus in HINT) by ferret antisera to cell-grown A/Massachusetts/18/2022-like reference viruses representing the A(H3N2) component for the cell- and recombinant-based influenza vaccines.
Influenza B Viruses
  • B/Victoria: 184 influenza B/Victoria-lineage virus were antigenically characterized by HI, and 177 (96.2%) were well-recognized (reacting at titers that were within 4-fold of the homologous virus titer) by ferret antisera to cell-grown B/Austria/1359417/2021-like reference viruses representing the B/Victoria component for the cell- and recombinant-based influenza vaccines.
  • B/Yamagata: No influenza B/Yamagata-lineage viruses were available for antigenic characterization.
Assessment of Virus Susceptibility to Antiviral Medications


CDC assesses susceptibility of influenza viruses to the antiviral medications including the neuraminidase inhibitors (oseltamivir, zanamivir, and peramivir) and the PA endonuclease inhibitor baloxavir using next generation sequence analysis supplemented by laboratory assays. Information about antiviral susceptibility test methods can be found at U.S. Influenza Surveillance: Purpose and Methods.

Viruses collected in the U.S. since September 29, 2024, were tested for antiviral susceptibility as follows:
Neuraminidase InhibitorsOseltamivirViruses Tested4,4411,6872,131623
Reduced Inhibition1 (<0.1%)1 (<0.1%)00
Highly Reduced Inhibition9 (0.2%)8 (0.5%)1 (<0.1%)0
PeramivirViruses Tested4,4411,6872,131623
Reduced Inhibition0000
Highly Reduced Inhibition8 (0.2%)8 (0.5%)00
ZanamivirViruses Tested4,4411,6872,131623
Reduced Inhibition0000
Highly Reduced Inhibition0000
PA Cap-Dependent Endonuclease InhibitorBaloxavirViruses Tested4,2911,5582,111622
Decreased Susceptibility2 (<0.1%)1 (<0.1%)1 (<0.1%)0
Eight A(H1N1)pdm09 viruses had NA-H275Y amino acid substitution conferring highly reduced inhibition by oseltamivir and peramivir. One A(H1N1)pdm09 virus had NA-I223V and NA-S247N amino acid substitutions and showed reduced inhibition by oseltamivir. One A(H3N2) virus had NA-E119V amino acid substitution and showed highly reduced inhibition by oseltamivir. One A(H1N1)pdm09 virus and one A(H3N2) virus had PA-I38T amino acid substitution associated with reduced susceptibility to baloxavir.

High levels of resistance to the adamantanes (amantadine and rimantadine) persist among influenza A(H1N1)pdm09 and influenza A(H3N2) viruses (the adamantanes are not effective against influenza B viruses). Therefore, use of these antivirals for treatment and prevention of influenza A virus infection is not recommended and data from adamantane resistance testing are not presented.

Outpatient and Emergency Department Illness Surveillance

Outpatient respiratory illness visits


The U.S. Outpatient Influenza-like Illness Surveillance Network (ILINet) monitors outpatient visits for respiratory illness referred to as influenza-like illness [ILI (fever plus cough or sore throat)], not laboratory-confirmed influenza, and will therefore capture respiratory illness visits due to infection with any pathogen that can present with similar symptoms, including influenza virus, SARS-CoV-2, and RSV. It is important to evaluate syndromic surveillance data, including that from ILINet, in the context of other sources of surveillance data to obtain a complete and accurate picture of influenza, SARS-CoV-2, and other respiratory virus activity.

Nationally, during Week 20, 1.9% of patient visits reported through ILINet were due to respiratory illness that included fever plus a cough or sore throat, also referred to as ILI. This week's percentage remained stable (change of ≤ 0.1 percentage points) compared to Week 19 and is below the national baseline of 3.0%. During Week 20, the percentage of visits for ILI decreased (change of > 0.1 percentage points) in Region 7, remained stable (change of ≤ 0.1 percentage points) in regions 1, 3, 4, 5, 6, 8, 9, and 10, and increased (change of > 0.1 percentage points) slightly in Region 2 compared to last week. All regions are below their region-specific baselines. Multiple respiratory viruses are co-circulating, and the relative contribution of influenza virus infections to ILI varies by location.

Outpatient respiratory illness visits by age group


About 70% of ILINet participants provide both the number of patient visits for respiratory illness and the total number of patient visits for the week broken out by age group. Based on these data, the percentage of visits for respiratory illness remained stable (change of ≤ 0.1 percentage points) in all age groups (0-4 years, 5-24 years, 25-49 years, 50-64 years, and 65+ years) in Week 20 compared to Week 19.

Outpatient respiratory illness activity map


Data collected in ILINet are used to produce a measure of ILI activity* by state/jurisdiction and Core Based Statistical Areas (CBSA).
Week 20
(Week ending
May 17, 2025)
Week 19
(Week ending
May 10, 2025)
Week 20
(Week ending
May 17, 2025)
Week 19
(Week ending
May 10, 2025)
Very High0000
High0010
Moderate0011
Low011526
Minimal5554679671
Insufficient Data00233231


*Data collected in ILINet may disproportionally represent certain populations within a jurisdiction or CBSA, and therefore, may not accurately depict the full picture of influenza activity for the entire jurisdiction or CBSA. Differences in the data presented here by CDC and independently by some health departments likely represent differing levels of data completeness with data presented by the health department likely being the more complete.

Additional information about medically attended visits for ILI for current and past seasons:


Surveillance Methods | FluView Interactive: National, Regional, and State Data or ILI Activity Map

National Syndromic Surveillance System (NSSP)


The overall percentage of emergency department (ED) visits with a discharge diagnosis of influenza reported in NSSP was 0.3% during Week 20 and remained stable (change of ≤ 0.1 percentage point) compared to the previous week. The percentage of ED visits with influenza discharge diagnoses decreased (change of > 0.1 percentage point) in Region 3 and remained stable in regions 1, 2, 4, 5, 6, 7, 8, 9, and 10. The percentage remained stable (change of ≤ 0.1 percentage point) for all age groups (0-4 years, 5-17 years, 18-64 years, and 65+ years) during Week 20 compared to Week 19. RegionNationalRegion 1Region 2Region 3Region 4Region 5Region 6Region 7Region 8Region 9Region 10
Season2023-2024 & 2024-20252022-2023 Skip Over Chart Container
2.0%4.0%6.0%8.0%10.0%12.0%14.0%16.0%Percent of Emergency Department Visits for InfluenzaWeek 40 of 2023Week 44 of 2023Week 48 of 2023Week 52 of 2023Week 4 of 2024Week 8 of 2024Week 12 of 2024Week 16 of 2024Week 20 of 2024Week 24 of 2024Week 28 of 2024Week 32 of 2024Week 36 of 2024Week 40 of 2024Week 44 of 2024Week 48 of 2024Week 52 of 2024Week 4 of 2025Week 8 of 2025Week 12 of 2025Week 16 of 2025Week 20 of 2025

Age Group


All ages
0-4 years
5-17 years
18-64 years
65+ Skip Data Table
Data Table Download Data (CSV) Skipped data table.

Additional information about emergency department visits for flu for current and past seasons:‎‎‎


Surveillance Methods | Emergency Department Visits for COVID-19, flu, and RSV

Hospitalization surveillance

FluSurv-Net


The Influenza Hospitalization Surveillance Network (FluSurv-NET) conducts population-based surveillance for laboratory-confirmed influenza-related hospitalizations in select counties in 14 states and represents approximately 9% of the U.S. population. FluSurv-NET surveillance for 2024-2025 season ended on April 30, 2025. FluSurv-NET hospitalization data are preliminary. As data are received each week, prior case counts and rates are updated accordingly.

A total of 39,244 laboratory-confirmed influenza-associated hospitalizations were reported by FluSurv-NET sites between October 1, 2024 and April 30, 2025. The weekly hospitalization rate observed during Weeks 17 and the first four days of Week 18 combined was 1.0 per 100,000 population. The weekly hospitalization rates observed during Week 5 and Week 6 (13.6 per 100,000 population) were tied for the highest peak weekly rate observed across all seasons since 2010-2011. The cumulative hospitalization rate was 128.1 per 100,000 population, which is the highest cumulative hospitalization rate for all seasons since 2010-2011.

Among all hospitalizations, 37,602 (95.8%) were associated with influenza A virus, 1,492 (3.8%) with influenza B virus, 41 (0.1%) with influenza A virus and influenza B virus co-infection, and 109 (0.3%) with influenza virus for which the type was not determined. Among those with influenza A subtype information, 6,922 (58.5%) had A(H1N1) pdm09 and 4,907(41.5%) had A(H3N2).

When examining rates by age, the highest cumulative hospitalization rate per 100,000 population was among adults aged 65 years and older (403.4), followed by adults aged 50-64 years (149.7), children aged 0-4 years (103.6), adults aged 18-49 years (52.2), and children aged 5-17 years (39.9).

When examining age-adjusted rates by race and ethnicity, the highest cumulative hospitalization rate per 100,000 population was among non-Hispanic Black persons (212.4), followed by American Indian/Alaska Native persons (167.8), Hispanic persons (111.2), non-Hispanic White persons (110.4), and Asian/Pacific Islander persons (79.3).

Among 5,377 hospitalized adults with information on underlying medical conditions, 95.2% had at least one reported underlying medical condition; the most commonly reported were hypertension, cardiovascular disease, metabolic disease, and obesity. Among 2,054 hospitalized women of childbearing age (15-49 years) with information on pregnancy status, 27.6% were pregnant. Among 2,246 hospitalized children with information on underlying medical conditions, 53.1% had at least one reported underlying medical condition; the most commonly reported was asthma, followed by neurologic disease and obesity.


[SUP]**In this figure, weekly rates for all seasons prior to the 2024-2025 season reflect end-of-season rates. For the 2024-2025 season, rates for recent hospital admissions are subject to reporting delays and are shown as a dashed line for the current season. As hospitalization data are received each week, prior case counts and rates are updated accordingly.[/SUP]

Additional FluSurv-NET hospitalization surveillance information for current and past seasons and additional age groups:


Surveillance Methods | FluView Interactive: Rates by Age, Sex, and Race/Ethnicity or Data on Patient Characteristics | RESP-NET Interactive

National Healthcare Safety Network (NHSN) Hospital Respiratory Data


Hospitals report to NHSN the weekly number of patients with laboratory-confirmed influenza who were admitted to the hospital. Nationally, during Week 20, 1,677 laboratory-confirmed influenza-associated hospitalizations were reported. This week's influenza-associated hospitalizations decreased (change of > 5%) compared to Week 19.

The weekly hospital admission rate observed in Week 20 was 0.5 per 100,000. The weekly rate of hospital admissions decreased in HHS regions 1, 2, 3, 4, 5, 7, 8, 9, and 10, remained stable in Region 6, and ranged from 0.3 (Region 10) to 0.8 (Region 2).

When examining rates by age for Week 20, all age groups decreased compared to the previous week. The highest hospital admission rate per 100,000 population was among those 65+ years (1.4), followed by 0-4 years (0.8), and 50-64 years age group (0.4).

Additional NHSN Hospital Respiratory Data information:


Surveillance Methods | Additional Data | FluView Interactive

Mortality surveillance

National Center for Health Statistics (NCHS) Mortality Surveillance


Based on NCHS mortality surveillance data available on May 22, 2025, 0.1% of the deaths that occurred during the week ending May 17, 2025 (Week 20), were due to influenza. This percentage remained stable (< 0.1 percentage point change) compared to Week 19. The data presented are preliminary and may change as more data are received and processed.


View Chart Data

Additional pneumonia, influenza and COVID-19 mortality surveillance information for current and past seasons:


Surveillance Methods | FluView Interactive

Influenza-Associated Pediatric Mortality


Four influenza-associated pediatric deaths occurring during the 2024-2025 season were reported to CDC during Week 20. The deaths occurred during weeks 7, 9 and 19 (the weeks ending February 15, March 1, and May 10 of 2025). All four deaths were associated with influenza A viruses. Three of the influenza A viruses had subtyping performed; one was an A(H1N1) virus and two were A(H3N2) viruses.

A total of 231 influenza-associated pediatric deaths occurring during the 2024-2025 season have been reported to CDC.

Additional pediatric mortality surveillance information for current and past seasons:


Surveillance Methods | FluView Interactive

Additional National and International Influenza Surveillance Information

Indicators Status by System


Increasing:
IncreasingArrow.png

Decreasing:
DecreasingArrow.png

Stable:
StableArrow.png


Clinical Labs: Up or down arrows indicate a change of greater than or equal to 0.5 percentage points in the percent of specimens positive for influenza compared to the previous week.
Outpatient Respiratory Illness (ILINet): Up or down arrows indicate a change of greater than 0.1 percentage points in the percent of visits due to respiratory illness (ILI) compared to the previous week.
NHSN Hospitalizations: Up or down arrows indicate change of greater than or equal to 5% of the number of patients admitted with laboratory-confirmed influenza compared to the previous week.
NCHS Mortality: Up or down arrows indicate change of greater than 0.1 percentage points of the percent of deaths due to influenza compared to the previous week.

Additional surveillance information


FluView Interactive: FluView includes enhanced web-based interactive applications that can provide dynamic visuals of the influenza data collected and analyzed by CDC. These FluView Interactive applications allow people to create customized, visual interpretations of influenza data, as well as make comparisons across flu seasons, regions, age groups and a variety of other demographics.

National Institute for Occupational Safety and Health: Monthly surveillance data on the prevalence of health-related workplace absenteeism among full-time workers in the United States are available from NIOSH.

https://www.cdc.gov/fluview/surveillance/2025-week-20.html
 
Weekly US Influenza Surveillance Report: Key Updates for Week 21, ending May 24, 2025

For Everyone
May 30, 2025 \

Key points


Seasonal influenza activity is low.
U.S. virologic surveillance

Clinical Laboratories


The results of tests performed by clinical laboratories nationwide are summarized below. Data from clinical laboratories (the percentage of specimens tested that are positive for influenza) are used to monitor whether influenza activity is increasing or decreasing. Nationally, during Week 21, the percentage of respiratory specimens testing positive for influenza virus in clinical laboratories was 1.9%.
No. of specimens tested37,8513,416,973
No. of positive specimens (%)727 (1.9%)484,581 (14.2%)
Positive specimens by type
Influenza A192 (26.4%)432,558 (89.3%)
Influenza B534 (73.5%)52,022 (10.7%)
Public Health Laboratories


The results of tests performed by public health laboratories nationwide are summarized below. Data from public health laboratories are used to monitor the proportion of circulating viruses that belong to each influenza virus type/subtype/lineage. Viruses known to be associated with recent live attenuated influenza vaccine (LAIV) receipt or found upon further testing to be a vaccine virus are not included as they are not circulating influenza viruses.
No. of specimens tested393140,525
No. of positive specimens6095,026
Positive specimens by type/subtype
Influenza A26 (43.3%)89,845 (94.5%)
Subtyping Performed19 (73.1%)80,204 (89.3%)
(H1N1)pdm0916 (84.2%)42,269 (52.7%)
H3N23 (15.8%)37,856 (47.2%)
H3N2v0 (0%)0 (0%)
H50 (0%)79 (0.1%)
Subtyping not performed7 (26.9%)9,641 (10.7%)
Influenza B34 (56.7%)5,181 (5.5%)
Lineage testing performed17 (50.0%)2,807 (54.2%)
Yamagata lineage0 (0%)0 (0%)
Victoria lineage17 (100%)2,807 (100%)
Lineage not performed17 (50.0%)2,374 (45.8%)
Additional virologic surveillance information for current and past seasons:

Surveillance Methods | FluView Interactive: National, Regional, and State Data or Age Data

Novel Influenza A Virus Infections


No confirmed human infections with influenza A(H5) virus were reported to CDC this week. To date, human-to-human transmission of avian influenza A(H5) virus (H5 bird flu) has not been identified in the United States.

The CSTE position statement, which includes updated case definitions for confirmed, probable, and suspected cases is available at http://www.cste.org/resource/resmgr/position_statements_files_2023/24-ID-09_Novel_Influenza_A.pdf

An up-to-date human case summary during the current outbreak by state and exposure source is available at www.cdc.gov/bird-flu/situation-summary/index.html

Information about avian influenza is available at https://www.cdc.gov/flu/avianflu/index.htm.

A(H5N1) virus interim recommendations for Prevention, Monitoring, and Public Health Investigations are available at https://www.cdc.gov/bird-flu/prevention/hpai-interim-recommendations.html.

The latest case reports on avian influenza outbreaks in wild birds, commercial poultry, backyard or hobbyist flocks, and mammals in the United States are available from the USDA at https://www.aphis.usda.gov/aphis/ou...e-information/avian/avian-influenza/2022-hpai.

Additional information regarding human infections with novel influenza A viruses:


Surveillance Methods | FluView Interactive


Outpatient and Emergency Department Illness Surveillance

Outpatient Respiratory Illness Visits


The U.S. Outpatient Influenza-like Illness Surveillance Network (ILINet) monitors outpatient visits for respiratory illness referred to as influenza-like illness [ILI (fever plus cough or sore throat)], not laboratory-confirmed influenza, and may capture respiratory illness visits due to infection with any pathogen that can present with similar symptoms, including influenza, SARS-CoV-2, and RSV. Therefore, it is important to evaluate syndromic surveillance data, including that from ILINet, in the context of other sources of surveillance data to obtain a complete and accurate picture of influenza, SARS-CoV-2, and other respiratory virus activity.

Nationwide during Week 21, 1.8% of patient visits reported through ILINet were due to respiratory illness that included fever plus a cough or sore throat, also referred to as ILI. Multiple respiratory viruses are co-circulating, and the relative contribution of influenza virus infection to ILI varies by location.

Outpatient Respiratory Illness Visits by Age Group


More than 70% of ILINet participants provide both the number of patient visits for respiratory illness and the total number of patient visits for the week broken out by age group. Data from this subset of providers are used to calculate the percentages of patient visits for respiratory illness by age group.

During Week 21, the percentage of visits for respiratory illness reported in ILINet was 6.0% among those 0-4 years, 2.8% among those 5-24 years, 1.4% among those 25-49 years, 1.0% among those 50-64 years, and 0.7% among those 65 years and older.

Outpatient Respiratory Illness Activity Map


Data collected in ILINet are used to produce a measure of ILI activity* by state/jurisdiction and Core Based Statistical Areas (CBSA).
Week 21
(Week ending
May. 24, 2025)
Week 20
(Week ending
May. 17, 2025)
Week 21
(Week ending
May. 24, 2025)
Week 20
(Week ending
May. 17, 2025)
Very High0000
High0001
Moderate0011
Low101914
Minimal5455665682
Insufficient Data00244231


*Data collected in ILINet may disproportionally represent certain populations within a jurisdiction or CBSA, and therefore, may not accurately depict the full picture of influenza activity for the entire jurisdiction or CBSA. Differences in the data presented here by CDC and independently by some health departments likely represent differing levels of data completeness with data presented by the health department likely being the more complete.

Additional information about medically attended visits for ILI for current and past seasons:

Surveillance Methods | FluView Interactive: National, Regional, and State Data or ILI Activity Map

National Syndromic Surveillance System (NSSP)


The overall percentage of emergency department (ED) visits with a discharge diagnosis of influenza reported in NSSP was 0.3% during Week 21. The percentage of visits was 0.6% among those 0-4 years, 0.9% among those 5-17 years, 0.2% among those 18-64 years, and 0.1% among those 65+ years. RegionNationalRegion 1Region 2Region 3Region 4Region 5Region 6Region 7Region 8Region 9Region 10
Season2023-2024 & 2024-20252022-2023 Skip Over Chart Container
2.0%4.0%6.0%8.0%10.0%12.0%14.0%16.0%Percent of Emergency Department Visits for InfluenzaWeek 41 of 2023Week 45 of 2023Week 49 of 2023Week 1 of 2024Week 5 of 2024Week 9 of 2024Week 13 of 2024Week 17 of 2024Week 21 of 2024Week 25 of 2024Week 29 of 2024Week 33 of 2024Week 37 of 2024Week 41 of 2024Week 45 of 2024Week 49 of 2024Week 1 of 2025Week 5 of 2025Week 9 of 2025Week 13 of 2025Week 17 of 2025Week 21 of 2025

Age Group


All ages
0-4 years
5-17 years
18-64 years
65+ Skip Data Table
Data Table Download Data (CSV) Skipped data table. Additional information about emergency department visits for flu for current and past seasons:‎‎‎

Surveillance Methods | Emergency Department Visits for COVID-19, flu, and RSV
Hospitalization Surveillance

FluSurv-Net


The Influenza Hospitalization Surveillance Network (FluSurv-NET) conducts population-based surveillance for laboratory-confirmed influenza-related hospitalizations in select counties in 14 states and represents approximately 9% of the U.S. population. FluSurv-NET hospitalization data are preliminary. Patients admitted for laboratory-confirmed influenza-related hospitalization after April 30, 2025, will not be included in FluSurv-NET for the 2024-2025 season. Data on patients admitted through April 30, 2025, will continue to be updated on FluView Interactive as additional information is received.

Additional FluSurv-NET hospitalization surveillance information for current and past seasons and additional age groups:

Surveillance Methods | FluView Interactive: Rates by Age, Sex, and Race/Ethnicity or Data on Patient Characteristics | RESP-NET Interactive

National Healthcare Safety Network (NHSN) Hospital Respiratory Data


Hospitals report to NHSN the weekly number of patients with laboratory-confirmed influenza who were admitted to the hospital. Nationally, during Week 21, 1,577 (0.5 per 100,000 population) laboratory-confirmed influenza-associated hospitalizations were reported. When examining rates by age, the highest hospital admission rate per 100,000 population was among those 65+ years (1.5), followed by 0-4 years (0.6), and 50-64 years age group (0.4).

Additional NHSN Hospital Respiratory Data information:

Surveillance Methods | Additional Data | FluView Interactive
Mortality Surveillance

National Center for Health Statistics (NCHS) Mortality Surveillance


Based on NCHS mortality surveillance data available on May 29, 2025, 0.1% of the deaths that occurred during the week ending May 24, 2025 (Week 21) were due to influenza. The data presented are preliminary and may change as more data are received and processed.

Additional pneumonia, influenza and COVID-19 mortality surveillance information for current and past seasons:

Surveillance Methods | FluView Interactive

Influenza-Associated Pediatric Mortality


Four influenza-associated pediatric deaths occurring during the 2024-2025 season were reported to CDC during Week 21. The deaths occurred during weeks 52, 2, 5 and 7 (the weeks ending December 21, 2024, January 11, 2025, February 1, 2025, and February 15, 2025, respectively). A total of 235 influenza-associated pediatric deaths occurring during the 2024-2025 season have been reported to CDC.

Additional pediatric mortality surveillance information for current and past seasons:

Surveillance Methods | FluView Interactive

All data in this report are preliminary and may change as more reports are received.

A description of the CDC influenza surveillance system, including methodology and detailed descriptions of each data component, is available on the surveillance methods page.[SUP]1[/SUP]

Additional information on the current and previous influenza seasons for each surveillance component are available on FluView Interactive.

Additional National and International Influenza Surveillance Information

Additional surveillance information


FluView Interactive: FluView includes enhanced web-based interactive applications that can provide dynamic visuals of the influenza data collected and analyzed by CDC. These FluView Interactive applications allow people to create customized, visual interpretations of influenza data, as well as make comparisons across flu seasons, regions, age groups and a variety of other demographics.

National Institute for Occupational Safety and Health: Monthly surveillance data on the prevalence of health-related workplace absenteeism among full-time workers in the United States are available from NIOSH.

https://www.cdc.gov/fluview/surveillance/2025-week-21.html
 
Weekly US Influenza Surveillance Report: Key Updates for Week 22, ending May 31, 2025

For Everyone
June 6, 2025 Key points


Seasonal influenza activity is low.
U.S. virologic surveillance

Clinical Laboratories


The results of tests performed by clinical laboratories nationwide are summarized below. Data from clinical laboratories (the percentage of specimens tested that are positive for influenza) are used to monitor whether influenza activity is increasing or decreasing. Nationally, during Week 22, the percentage of respiratory specimens testing positive for influenza virus in clinical laboratories was 2.0%.
No. of specimens tested39,8343,475,092
No. of positive specimens (%)809 (2.0%)485,789 (14.0%)
Positive specimens by type
Influenza A268 (33.1%)432,945 (89.1%)
Influenza B541 (66.9%)52,844 (10.9%)
Public Health Laboratories


The results of tests performed by public health laboratories nationwide are summarized below. Data from public health laboratories are used to monitor the proportion of circulating viruses that belong to each influenza virus type/subtype/lineage. Viruses known to be associated with recent live attenuated influenza vaccine (LAIV) receipt or found upon further testing to be a vaccine virus are not included as they are not circulating influenza viruses.
No. of specimens tested393144,697
No. of positive specimens6597,702
Positive specimens by type/subtype
Influenza A39 (60.0%)92,317 (94.5%)
Subtyping Performed29 (74.4%)82,678 (89.6%)
(H1N1)pdm0925 (86.2%)43,538 (52.7%)
H3N24 (13.8%)39,061 (47.2%)
H3N2v00
H5079 (0.1%)
Subtyping not performed10 (25.6%)9,639 (10.4%)
Influenza B26 (40.0%)5,385 (5.5%)
Lineage testing performed16 (61.5%)3,003 (55.8%)
Yamagata lineage00
Victoria lineage16 (100%)3,003 (100%)
Lineage not performed10 (38.5%)2,382 (44.2%)
Additional virologic surveillance information for current and past seasons:

Surveillance Methods | FluView Interactive: National, Regional, and State Data or Age Data

Novel Influenza A Virus Infections


No confirmed human infections with influenza A(H5) virus were reported to CDC this week. To date, human-to-human transmission of avian influenza A(H5) virus (H5 bird flu) has not been identified in the United States.

The CSTE position statement, which includes updated case definitions for confirmed, probable, and suspected cases is available at http://www.cste.org/resource/resmgr/position_statements_files_2023/24-ID-09_Novel_Influenza_A.pdf

An up-to-date human case summary during the current outbreak by state and exposure source is available at www.cdc.gov/bird-flu/situation-summary/index.html

Information about avian influenza is available at https://www.cdc.gov/flu/avianflu/index.htm.

A(H5N1) virus interim recommendations for Prevention, Monitoring, and Public Health Investigations are available at https://www.cdc.gov/bird-flu/prevention/hpai-interim-recommendations.html.

The latest case reports on avian influenza outbreaks in wild birds, commercial poultry, backyard or hobbyist flocks, and mammals in the United States are available from the USDA at https://www.aphis.usda.gov/aphis/ou...e-information/avian/avian-influenza/2022-hpai.

Additional information regarding human infections with novel influenza A viruses:

Surveillance Methods | FluView Interactive
Outpatient and Emergency Department Illness Surveillance

Outpatient Respiratory Illness Visits


The U.S. Outpatient Influenza-like Illness Surveillance Network (ILINet) monitors outpatient visits for respiratory illness referred to as influenza-like illness [ILI (fever plus cough or sore throat)], not laboratory-confirmed influenza, and may capture respiratory illness visits due to infection with any pathogen that can present with similar symptoms, including influenza, SARS-CoV-2, and RSV. Therefore, it is important to evaluate syndromic surveillance data, including that from ILINet, in the context of other sources of surveillance data to obtain a complete and accurate picture of influenza, SARS-CoV-2, and other respiratory virus activity.

Nationwide during Week 22, 1.9% of patient visits reported through ILINet were due to respiratory illness that included fever plus a cough or sore throat, also referred to as ILI. Multiple respiratory viruses are co-circulating, and the relative contribution of influenza virus infection to ILI varies by location.

Outpatient Respiratory Illness Visits by Age Group


More than 70% of ILINet participants provide both the number of patient visits for respiratory illness and the total number of patient visits for the week broken out by age group. Data from this subset of providers are used to calculate the percentages of patient visits for respiratory illness by age group.

During Week 22, the percentage of visits for respiratory illness reported in ILINet was 6.1% among those 0-4 years, 2.7% among those 5-24 years, 1.4% among those 25-49 years, 1.0% among those 50-64 years, and 0.8% among those 65 years and older.

Outpatient Respiratory Illness Activity Map


Data collected in ILINet are used to produce a measure of ILI activity* by state/jurisdiction and Core Based Statistical Areas (CBSA).
Week 22
(Week ending
May. 31, 2025)
Week 21
(Week ending
May. 24, 2025)
Week 22
(Week ending
May. 31, 2025)
Week 21
(Week ending
May. 24, 2025)
Very High0000
High0010
Moderate0022
Low201620
Minimal5355673673
Insufficient Data00237234


*Data collected in ILINet may disproportionally represent certain populations within a jurisdiction or CBSA, and therefore, may not accurately depict the full picture of influenza activity for the entire jurisdiction or CBSA. Differences in the data presented here by CDC and independently by some health departments likely represent differing levels of data completeness with data presented by the health department likely being the more complete.

Additional information about medically attended visits for ILI for current and past seasons:

Surveillance Methods | FluView Interactive: National, Regional, and State Data or ILI Activity Map

National Syndromic Surveillance System (NSSP)


The overall percentage of emergency department (ED) visits with a discharge diagnosis of influenza reported in NSSP was 0.3% during Week 22. The percentage of visits was 0.6% among those 0-4 years, 0.8% among those 5-17 years, 0.2% among those 18-64 years, and 0.1% among those 65+ years. RegionNationalRegion 1Region 2Region 3Region 4Region 5Region 6Region 7Region 8Region 9Region 10
Season2023-2024 & 2024-20252022-2023 Skip Over Chart Container
2.0%4.0%6.0%8.0%10.0%12.0%14.0%16.0%Percent of Emergency Department Visits for InfluenzaWeek 42 of 2023Week 46 of 2023Week 50 of 2023Week 2 of 2024Week 6 of 2024Week 10 of 2024Week 14 of 2024Week 18 of 2024Week 22 of 2024Week 26 of 2024Week 30 of 2024Week 34 of 2024Week 38 of 2024Week 42 of 2024Week 46 of 2024Week 50 of 2024Week 2 of 2025Week 6 of 2025Week 10 of 2025Week 14 of 2025Week 18 of 2025Week 22 of 2025

Age Group


All ages
0-4 years
5-17 years
18-64 years
65+ Skip Data Table
Data Table Download Data (CSV) Skipped data table.

Additional information about emergency department visits for flu for current and past seasons:‎‎‎

Surveillance Methods | Emergency Department Visits for COVID-19, flu, and RSV
Hospitalization Surveillance

FluSurv-Net


The Influenza Hospitalization Surveillance Network (FluSurv-NET) conducts population-based surveillance for laboratory-confirmed influenza-related hospitalizations in select counties in 14 states and represents approximately 9% of the U.S. population. FluSurv-NET hospitalization data are preliminary. Patients admitted for laboratory-confirmed influenza-related hospitalization after April 30, 2025, will not be included in FluSurv-NET for the 2024-2025 season. Data on patients admitted through April 30, 2025, will continue to be updated on FluView Interactive as additional information is received.


Additional FluSurv-NET hospitalization surveillance information for current and past seasons and additional age groups:

Surveillance Methods | FluView Interactive: Rates by Age, Sex, and Race/Ethnicity or Data on Patient Characteristics | RESP-NET Interactive

National Healthcare Safety Network (NHSN) Hospital Respiratory Data


Hospitals report to NHSN the weekly number of patients with laboratory-confirmed influenza who were admitted to the hospital. Nationally, during Week 22, 1,682 (0.5 per 100,000 population) laboratory-confirmed influenza-associated hospitalizations were reported. When examining rates by age, the highest hospital admission rate per 100,000 population was among those 65+ years (1.3), followed by 0-4 years (0.7), and 50-64 years age group (0.4).

Additional NHSN Hospital Respiratory Data information:

Surveillance Methods | Additional Data | FluView Interactive
Mortality Surveillance

National Center for Health Statistics (NCHS) Mortality Surveillance


Based on NCHS mortality surveillance data available on June 5, 2025, 0.1% of the deaths that occurred during the week ending May 31, 2025 (Week 22) were due to influenza. The data presented are preliminary and may change as more data are received and processed.

Additional pneumonia, influenza and COVID-19 mortality surveillance information for current and past seasons:

Surveillance Methods | FluView Interactive

Influenza-Associated Pediatric Mortality


Six influenza-associated pediatric deaths occurring during the 2024-2025 season were reported to CDC during Week 22. The deaths occurred between weeks 47 and 10 (the weeks ending November 23, 2024 and March 8, 2025, respectively). A total of 241 influenza-associated pediatric deaths occurring during the 2024-2025 season have been reported to CDC. This is the highest number of pediatric deaths reported in any non-pandemic influenza season since the condition became reportable in 2004.

Among children who were eligible for influenza vaccination and with known vaccine status, 90% of reported pediatric deaths this season (compared to 82% during the 2023-2024 season) have occurred in children who were not fully vaccinated against influenza.

Additional pediatric mortality surveillance information for current and past seasons:

Surveillance Methods | FluView Interactive

All data in this report are preliminary and may change as more reports are received.

A description of the CDC influenza surveillance system, including methodology and detailed descriptions of each data component, is available on the surveillance methods page.[SUP]1[/SUP]

Additional information on the current and previous influenza seasons for each surveillance component are available on FluView Interactive.

Additional National and International Influenza Surveillance Information

Additional surveillance information


FluView Interactive: FluView includes enhanced web-based interactive applications that can provide dynamic visuals of the influenza data collected and analyzed by CDC. These FluView Interactive applications allow people to create customized, visual interpretations of influenza data, as well as make comparisons across flu seasons, regions, age groups and a variety of other demographics.

National Institute for Occupational Safety and Health: Monthly surveillance data on the prevalence of health-related workplace absenteeism among full-time workers in the United States are available from NIOSH.

https://www.cdc.gov/fluview/surveillance/2025-week-22.html
 
Weekly US Influenza Surveillance Report: Key Updates for Week 23, ending June 7, 2025

For Everyone
June 13, 2025

Key points


Seasonal influenza activity is low.
U.S. virologic surveillance

Clinical Laboratories


The results of tests performed by clinical laboratories nationwide are summarized below. Data from clinical laboratories (the percentage of specimens tested that are positive for influenza) are used to monitor whether influenza activity is increasing or decreasing. Nationally, during Week 23, the percentage of respiratory specimens testing positive for influenza virus in clinical laboratories was 1.7%.
No. of specimens tested32,7523,513,159
No. of positive specimens (%)564 (1.7%)486,440 (13.8%)
Positive specimens by type
Influenza A198 (35.1%)433,160 (89.0%)
Influenza B366 (64.9%)53,280 (11.0%)
Public Health Laboratories


The results of tests performed by public health laboratories nationwide are summarized below. Data from public health laboratories are used to monitor the proportion of circulating viruses that belong to each influenza virus type/subtype/lineage. Viruses known to be associated with recent live attenuated influenza vaccine (LAIV) receipt or found upon further testing to be a vaccine virus are not included as they are not circulating influenza viruses.
No. of specimens tested495146,540
No. of positive specimens6098,208
Positive specimens by type/subtype
Influenza A31 (51.7%)92,670 (94.4%)
Subtyping Performed24 (77.4%)83,015 (89.6%)
(H1N1)pdm0921 (87.5%)43,751 (52.7%)
H3N23 (12.5%)39,185 (47.2%)
H3N2v00
H5079 (0.1%)
Subtyping not performed7 (22.6%)9,655 (10.4%)
Influenza B29 (48.3%)5,538 (5.6%)
Lineage testing performed18 (62.1%)3,078 (55.6%)
Yamagata lineage00
Victoria lineage18 (100%)3,078 (100%)
Lineage not performed11 (37.9%)2,460 (44.4%)
Additional virologic surveillance information for current and past seasons:

Surveillance Methods | FluView Interactive: National, Regional, and State Data or Age Data

Novel Influenza A Virus Infections


No confirmed human infections with influenza A(H5) virus were reported to CDC this week. To date, human-to-human transmission of avian influenza A(H5) virus (H5 bird flu) has not been identified in the United States.

The CSTE position statement, which includes updated case definitions for confirmed, probable, and suspected cases is available at http://www.cste.org/resource/resmgr/position_statements_files_2023/24-ID-09_Novel_Influenza_A.pdf

An up-to-date human case summary during the current outbreak by state and exposure source is available at www.cdc.gov/bird-flu/situation-summary/index.html

Information about avian influenza is available at https://www.cdc.gov/flu/avianflu/index.htm.

A(H5N1) virus interim recommendations for Prevention, Monitoring, and Public Health Investigations are available at https://www.cdc.gov/bird-flu/prevention/hpai-interim-recommendations.html.

The latest case reports on avian influenza outbreaks in wild birds, commercial poultry, backyard or hobbyist flocks, and mammals in the United States are available from the USDA at https://www.aphis.usda.gov/h5n1-hpai#detections-hpai.

Additional information regarding human infections with novel influenza A viruses:

Surveillance Methods | FluView Interactive
Outpatient and Emergency Department Illness Surveillance

Outpatient respiratory illness visits


The U.S. Outpatient Influenza-like Illness Surveillance Network (ILINet) monitors outpatient visits for respiratory illness referred to as influenza-like illness [ILI (fever plus cough or sore throat)], not laboratory-confirmed influenza, and may capture respiratory illness visits due to infection with any pathogen that can present with similar symptoms, including influenza, SARS-CoV-2, and RSV. Therefore, it is important to evaluate syndromic surveillance data, including that from ILINet, in the context of other sources of surveillance data to obtain a complete and accurate picture of influenza, SARS-CoV-2, and other respiratory virus activity.

Nationwide during Week 23, 1.6% of patient visits reported through ILINet were due to respiratory illness that included fever plus a cough or sore throat, also referred to as ILI. Multiple respiratory viruses are co-circulating, and the relative contribution of influenza virus infection to ILI varies by location.

Outpatient respiratory illness visits by age group


More than 70% of ILINet participants provide both the number of patient visits for respiratory illness and the total number of patient visits for the week broken out by age group. Data from this subset of providers are used to calculate the percentages of patient visits for respiratory illness by age group.

During Week 23, the percentage of visits for respiratory illness reported in ILINet was 5.4% among those 0-4 years, 2.2% among those 5-24 years, 1.3% among those 25-49 years, 0.9% among those 50-64 years, and 0.7% among those 65 years and older.

Outpatient respiratory illness activity map


Data collected in ILINet are used to produce a measure of ILI activity* by state/jurisdiction and Core Based Statistical Areas (CBSA).
Week 23
(Week ending
Jun. 7, 2025)
Week 22
(Week ending
May 31, 2025)
Week 23
(Week ending
Jun. 7, 2025)
Week 22
(Week ending
May 31, 2025)
Very High0000
High0001
Moderate0022
Low02617
Minimal5353666674
Insufficient Data20255235


*Data collected in ILINet may disproportionally represent certain populations within a jurisdiction or CBSA, and therefore, may not accurately depict the full picture of influenza activity for the entire jurisdiction or CBSA. Differences in the data presented here by CDC and independently by some health departments likely represent differing levels of data completeness with data presented by the health department likely being the more complete.

Additional information about medically attended visits for ILI for current and past seasons:

Surveillance Methods | FluView Interactive: National, Regional, and State Data or ILI Activity Map

National Syndromic Surveillance System (NSSP)


The overall percentage of emergency department (ED) visits with a discharge diagnosis of influenza reported in NSSP was 0.2% during Week 23. The percentage of visits was 0.5% among those 0-4 years, 0.5% among those 5-17 years, 0.2% among those 18-64 years, and 0.1% among those 65 years and older. RegionNationalRegion 1Region 2Region 3Region 4Region 5Region 6Region 7Region 8Region 9Region 10
Season2023-2024 & 2024-20252022-2023 Skip Over Chart Container
2.0%4.0%6.0%8.0%10.0%12.0%14.0%16.0%Percent of Emergency Department Visits for InfluenzaWeek 43 of 2023Week 47 of 2023Week 51 of 2023Week 3 of 2024Week 7 of 2024Week 11 of 2024Week 15 of 2024Week 19 of 2024Week 23 of 2024Week 27 of 2024Week 31 of 2024Week 35 of 2024Week 39 of 2024Week 43 of 2024Week 47 of 2024Week 51 of 2024Week 3 of 2025Week 7 of 2025Week 11 of 2025Week 15 of 2025Week 19 of 2025Week 23 of 2025

Age Group


All ages
0-4 years
5-17 years
18-64 years
65+ Skip Data Table
Data Table Download Data (CSV) Skipped data table.

Additional information about emergency department visits for flu for current and past seasons:‎‎‎

Surveillance Methods | Emergency Department Visits for COVID-19, flu, and RSV
Hospitalization surveillance

FluSurv-Net


The Influenza Hospitalization Surveillance Network (FluSurv-NET) conducts population-based surveillance for laboratory-confirmed influenza-related hospitalizations in select counties in 14 states and represents approximately 9% of the U.S. population. FluSurv-NET hospitalization data are preliminary. Patients admitted for laboratory-confirmed influenza-related hospitalization after April 30, 2025, will not be included in FluSurv-NET for the 2024-2025 season. Data on patients admitted through April 30, 2025, will continue to be updated on FluView Interactive as additional information is received.

Additional FluSurv-NET hospitalization surveillance information for current and past seasons and additional age groups:

Surveillance Methods | FluView Interactive: Rates by Age, Sex, and Race/Ethnicity or Data on Patient Characteristics | RESP-NET Interactive

National Healthcare Safety Network (NHSN) Hospital Respiratory Data


Hospitals report to NHSN the weekly number of patients with laboratory-confirmed influenza who were admitted to the hospital. Nationally, during Week 23, 1,455 (0.4 per 100,000 population) laboratory-confirmed influenza-associated hospitalizations were reported. When examining rates by age, the highest hospital admission rate per 100,000 population was among those 65 years and older (1.2), followed by those 0-4 years (0.5), and the 50-64 years age group (0.4).

Additional NHSN Hospital Respiratory Data information:

Surveillance Methods | Additional Data | FluView Interactive
Mortality surveillance

National Center for Health Statistics (NCHS) Mortality Surveillance


Based on NCHS mortality surveillance data available on June 12, 2025, 0.1% of the deaths that occurred during the week ending June 7, 2025 (Week 23) were due to influenza. The data presented are preliminary and may change as more data are received and processed.


View Chart Data

Additional pneumonia, influenza and COVID-19 mortality surveillance information for current and past seasons:

Surveillance Methods | FluView Interactive

Influenza-Associated Pediatric Mortality


Five influenza-associated pediatric deaths occurring during the 2024-2025 season were reported to CDC during Week 23. The deaths occurred between weeks 5 and 17 (the weeks ending February 1, 2025, and April 26, 2025, respectively). A total of 246 influenza-associated pediatric deaths occurring during the 2024-2025 season have been reported to CDC. This is the highest number of pediatric deaths reported in any non-pandemic influenza season since the condition became reportable in 2004.

Among children who were eligible for influenza vaccination and with known vaccine status, 90% of reported pediatric deaths this season (compared to 82% during the 2023-2024 season) have occurred in children who were not fully vaccinated against influenza.

Additional pediatric mortality surveillance information for current and past seasons:

Surveillance Methods | FluView Interactive
Additional National and International Influenza Surveillance Information

Additional surveillance information


FluView Interactive: FluView includes enhanced web-based interactive applications that can provide dynamic visuals of the influenza data collected and analyzed by CDC. These FluView Interactive applications allow people to create customized, visual interpretations of influenza data, as well as make comparisons across flu seasons, regions, age groups and a variety of other demographics.

National Institute for Occupational Safety and Health: Monthly surveillance data on the prevalence of health-related workplace absenteeism among full-time workers in the United States are available from NIOSH.

https://www.cdc.gov/fluview/surveillance/2025-week-23.html
 
Weekly US Influenza Surveillance Report: Key Updates for Week 27, ending July 5, 2025

For Everyone
July 11, 2025

Key points


Seasonal influenza activity is low.
U.S. virologic surveillance

Clinical Laboratories


The results of tests performed by clinical laboratories nationwide are summarized below. Data from clinical laboratories (the percentage of specimens tested that are positive for influenza) are used to monitor whether influenza activity is increasing or decreasing. Nationally, during Week 27, the percentage of respiratory specimens testing positive for influenza virus in clinical laboratories was 0.9%.
No. of specimens tested23,9053,666,248
No. of positive specimens (%)206 (0.9%)488,112 (13.3%)
Positive specimens by type
Influenza A120 (58.3%)433,970 (88.9%)
Influenza B86 (41.7%)54,142 (11.1%)


Public Health Laboratories


The results of tests performed by public health laboratories nationwide are summarized below. Data from public health laboratories are used to monitor the proportion of circulating viruses that belong to each influenza virus type/subtype/lineage. Viruses known to be associated with recent live attenuated influenza vaccine (LAIV) receipt or found upon further testing to be a vaccine virus are not included as they are not circulating influenza viruses.
No. of specimens tested280149,206
No. of positive specimens2699,020
Positive specimens by type/subtype
Influenza A24 (92.3%)93,248 (94.2%)
Subtyping Performed17 (70.8%)83,646 (89.7%)
(H1N1)pdm0916 (94.1%)44,183 (52.8%)
H3N21 (5.9%)39,384 (47.1%)
H3N2v[SUP]†[/SUP]00
H5*079 (0.1%)
Subtyping not performed7 (29.2%)9,602 (10.3%)
Influenza B2 (7.7%)5,772 (5.8%)
Lineage testing performed03,218 (55.8%)
Yamagata lineage00
Victoria lineage03,218 (100%)
Lineage not performed2 (100%)2,554 (44.2%)
[SUB]*These data reflect specimens tested, and the number determined to be positive for influenza viruses at the public health labs (specimens tested is not the same as cases). The data do not reflect specimens tested only at CDC and could include more than one specimen tested per person. The guidance for avian influenza A(H5) virus testing recommends testing both a conjunctival and respiratory swab for people with conjunctivitis which has resulted in more specimens testing positive for avian influenza A(H5) virus than the number of human A(H5) cases. For more information on the number of people infected with avian influenza A(H5) viruses, please visit the "How CDC is monitoring influenza data among people to better understand the current avian influenza A (H5N1) situation"[/SUB]

[SUB][SUP]†[/SUP]When an influenza virus that normally circulates in swine (but not people) is detected in a person, it is called a "variant" influenza virus. Most human infections with variant influenza viruses occur following exposure to swine, but human-to-human transmission can occur. It is important to note that in most cases, variant influenza viruses have not shown the ability to spread easily and sustainably from human-to-human.[/SUB]


[SUB]*This graph reflects the number of specimens tested and the number determined to be positive for influenza viruses at the public health lab (specimens tested is not the same as cases). It does not reflect specimens tested only at CDC and could include more than one specimen tested per person. Specimens tested as part of routine influenza surveillance as well as those tested as part of targeted testing for people exposed to avian influenza A(H5) are included.[/SUB]

Additional virologic surveillance information for current and past seasons:

Surveillance Methods | FluView Interactive: National, Regional, and State Data or Age Data

Novel Influenza A Virus Infections


No confirmed human infections with influenza A(H5) virus were reported to CDC this week. To date, human-to-human transmission of avian influenza A(H5) virus (H5 bird flu) has not been identified in the United States.

The CSTE position statement, which includes updated case definitions for confirmed, probable, and suspected cases is available at http://www.cste.org/resource/resmgr/position_statements_files_2023/24-ID-09_Novel_Influenza_A.pdf.

An up-to-date human case summary during the current outbreak by state and exposure source is available at www.cdc.gov/bird-flu/situation-summary/index.html.

Information about avian influenza is available at https://www.cdc.gov/flu/avianflu/index.htm.

A(H5N1) virus interim recommendations for Prevention, Monitoring, and Public Health Investigations are available at https://www.cdc.gov/bird-flu/prevention/hpai-interim-recommendations.html.

The latest case reports on avian influenza outbreaks in wild birds, commercial poultry, backyard or hobbyist flocks, and mammals in the United States are available from the USDA at https://www.aphis.usda.gov/h5n1-hpai#detections-hpai.

Additional information regarding human infections with novel influenza A viruses:

Surveillance Methods | FluView Interactive
Outpatient and Emergency Department Illness Surveillance

Outpatient Respiratory Illness Visits


The U.S. Outpatient Influenza-like Illness Surveillance Network (ILINet) monitors outpatient visits for respiratory illness referred to as influenza-like illness [ILI (fever plus cough or sore throat)], not laboratory-confirmed influenza, and may capture respiratory illness visits due to infection with any pathogen that can present with similar symptoms, including influenza, SARS-CoV-2, and RSV. Therefore, it is important to evaluate syndromic surveillance data, including that from ILINet, in the context of other sources of surveillance data to obtain a complete and accurate picture of influenza, SARS-CoV-2, and other respiratory virus activity.

Nationally, during Week 27, 1.1% of patient visits reported through ILINet were due to respiratory illness that included fever plus a cough or sore throat, also referred to as ILI. Multiple respiratory viruses are co-circulating, and the relative contribution of influenza virus infection to ILI varies by location.

Outpatient Respiratory Illness Visits by Age Group


More than 70% of ILINet participants provide both the number of patient visits for respiratory illness and the total number of patient visits for the week broken out by age group. Data from this subset of providers are used to calculate the percentages of patient visits for respiratory illness by age group.

During Week 27, the percentage of visits for respiratory illness reported in ILINet was 3.6% among those 0-4 years, 1.4% among those 5-24 years, 0.9% among those 25-49 years, 0.7% among those 50-64 years, and 0.6% among those 65 years and older.

Outpatient Respiratory Illness Activity Map


Data collected in ILINet are used to produce a measure of ILI activity* by state/jurisdiction and Core Based Statistical Areas (CBSA).
Week 27
(Week ending
Jul. 5, 2025)
Week 26
(Week ending
Jun. 28, 2025)
Week 27
(Week ending
Jul. 5, 2025)
Week 26
(Week ending
Jun. 28, 2025)
Very High0000
High0000
Moderate0000
Low0010
Minimal5555693693
Insufficient Data00235236


[SUB]*Data collected in ILINet may disproportionally represent certain populations within a jurisdiction or CBSA, and therefore, may not accurately depict the full picture of influenza activity for the entire jurisdiction or CBSA. Differences in the data presented here by CDC and independently by some health departments likely represent differing levels of data completeness with data presented by the health department likely being the more complete.[/SUB]

Additional information about medically attended visits for ILI for current and past seasons:

Surveillance Methods | FluView Interactive: National, Regional, and State Data or ILI Activity Map

National Syndromic Surveillance System (NSSP)


The overall percentage of emergency department (ED) visits with a discharge diagnosis of influenza reported in NSSP was 0.1% during Week 27. The percentage of visits was 0.3% among those 0-4 years, 0.2% among those 5-17 years, 0.1% among those 18-64 years, and 0.1% among those 65 years and older. RegionNationalRegion 1Region 2Region 3Region 4Region 5Region 6Region 7Region 8Region 9Region 10
Season2023-2024 & 2024-20252022-2023 Skip Over Chart Container
2.0%4.0%6.0%8.0%10.0%12.0%14.0%16.0%Percent of Emergency Department Visits for InfluenzaWeek 43 of 2023Week 47 of 2023Week 51 of 2023Week 3 of 2024Week 7 of 2024Week 11 of 2024Week 15 of 2024Week 19 of 2024Week 23 of 2024Week 27 of 2024Week 31 of 2024Week 35 of 2024Week 39 of 2024Week 43 of 2024Week 47 of 2024Week 51 of 2024Week 3 of 2025Week 7 of 2025Week 11 of 2025Week 15 of 2025Week 19 of 2025Week 23 of 2025Week 27 of 2025

Age Group

Skip Data Table
Data Table Download Data (CSV) Skipped data table.

Additional information about emergency department visits for flu for current and past seasons:‎‎‎

Surveillance Methods | Emergency Department Visits for COVID-19, flu, and RSV
Hospitalization Surveillance

FluSurv-Net


The Influenza Hospitalization Surveillance Network (FluSurv-NET) conducts population-based surveillance for laboratory-confirmed influenza-related hospitalizations in select counties in 14 states and represents approximately 9% of the U.S. population. FluSurv-NET hospitalization data are preliminary. Patients admitted for laboratory-confirmed influenza-related hospitalization after April 30, 2025, will not be included in FluSurv-NET for the 2024-2025 season. Data on patients admitted through April 30, 2025, will continue to be updated on FluView Interactive as additional information is received.

Additional FluSurv-NET hospitalization surveillance information for current and past seasons and additional age groups:

Surveillance Methods | FluView Interactive: Rates by Age, Sex, and Race/Ethnicity or Data on Patient Characteristics | RESP-NET Interactive

National Healthcare Safety Network (NHSN) Hospital Respiratory Data


Hospitals report to NHSN the weekly number of patients with laboratory-confirmed influenza who were admitted to the hospital. Nationally, during Week 27, 911 (0.3 per 100,000 population) laboratory-confirmed influenza-associated hospitalizations were reported. When examining rates by age, the highest hospital admission rate per 100,000 population was among those 65 years and older (0.9), followed by those 0-4 years (0.3), and the 50-64 years age group (0.3).

Additional NHSN Hospital Respiratory Data information:

Surveillance Methods | Additional Data | FluView Interactive
Mortality Surveillance

National Center for Health Statistics (NCHS) Mortality Surveillance


Based on NCHS mortality surveillance data available on July 10, 2025, 0.04% of the deaths that occurred during the week ending July 5, 2025 (Week 27) were due to influenza. The data presented are preliminary and may change as more data are received and processed.

Additional pneumonia, influenza and COVID-19 mortality surveillance information for current and past seasons:

Surveillance Methods | FluView Interactive

Influenza-Associated Pediatric Mortality


Four influenza-associated pediatric deaths occurring during the 2024-2025 season were reported to CDC during Week 27. The deaths occurred during weeks 9, 11, 21 and 24 (the weeks ending March 1, March 15, May 24, and June 14, 2025, respectively). A total of 260 influenza-associated pediatric deaths occurring during the 2024-2025 season have been reported to CDC. This is the highest number of pediatric deaths reported in any non-pandemic influenza season since the condition became reportable in 2004.

Among children who were eligible for influenza vaccination and with known vaccine status, 89% of reported pediatric deaths this season (compared to 82% during the 2023-2024 season) have occurred in children who were not fully vaccinated against influenza.

Additional pediatric mortality surveillance information for current and past seasons:

Surveillance Methods | FluView Interactive
All data in this report are preliminary and may change as more reports are received.

A description of the CDC influenza surveillance system, including methodology and detailed descriptions of each data component, is available on the surveillance methods page.[SUP]1[/SUP]

Additional information on the current and previous influenza seasons for each surveillance component are available on FluView Interactive.

Additional National and International Influenza Surveillance Information

Additional surveillance information


FluView Interactive: FluView includes enhanced web-based interactive applications that can provide dynamic visuals of the influenza data collected and analyzed by CDC. These FluView Interactive applications allow people to create customized, visual interpretations of influenza data, as well as make comparisons across flu seasons, regions, age groups and a variety of other demographics.

National Institute for Occupational Safety and Health: Monthly surveillance data on the prevalence of health-related workplace absenteeism among full-time workers in the United States are available from NIOSH.

https://www.cdc.gov/fluview/surveillance/2025-week-27.html
 
Weekly US Influenza Surveillance Report: Key Updates for Week 28, ending July 12, 2025

For Everyone
July 18, 2025

Key points


Seasonal influenza activity is low.

U.S. virologic surveillance

Clinical Laboratories


The results of tests performed by clinical laboratories nationwide are summarized below. Data from clinical laboratories (the percentage of specimens tested that are positive for influenza) are used to monitor whether influenza activity is increasing or decreasing. Nationally, during Week 28, the percentage of respiratory specimens testing positive for influenza virus in clinical laboratories was 0.8%.
No. of specimens tested29,6853,706,766
No. of positive specimens (%)243 (0.8%)488,429 (13.2%)
Positive specimens by type
Influenza A137 (56.4%)434,146 (88.9%)
Influenza B106 (43.6%)54,283 (11.1%)
Public Health Laboratories


The results of tests performed by public health laboratories nationwide are summarized below. Data from public health laboratories are used to monitor the proportion of circulating viruses that belong to each influenza virus type/subtype/lineage. Viruses known to be associated with recent live attenuated influenza vaccine (LAIV) receipt or found upon further testing to be a vaccine virus are not included as they are not circulating influenza viruses.
No. of specimens tested463150,130
No. of positive specimens1599,170
Positive specimens by type/subtype
Influenza A15 (100%)93,379 (94.2%)
Subtyping Performed10 (66.7%)83,769 (89.7%)
(H1N1)pdm0910 (100%)44,278 (52.9%)
H3N2039,412 (47.0%)
H3N2v[SUP]†[/SUP]00
H5*079 (0.1%)
Subtyping not performed5 (33.3%)9,610 (10.3%)
Influenza B05,791 (5.8%)
Lineage testing performed03,230 (55.8%)
Yamagata lineage00
Victoria lineage03,230 (100%)
Lineage not performed02,561 (44.2%)
[SUB]*These data reflect specimens tested, and the number determined to be positive for influenza viruses at the public health labs (specimens tested is not the same as cases). The data do not reflect specimens tested only at CDC and could include more than one specimen tested per person. The guidance for avian influenza A(H5) virus testing recommends testing both a conjunctival and respiratory swab for people with conjunctivitis which has resulted in more specimens testing positive for avian influenza A(H5) virus than the number of human A(H5) cases. For more information on the number of people infected with avian influenza A(H5) viruses, please visit the "How CDC is monitoring influenza data among people to better understand the current avian influenza A (H5N1) situation"[/SUB]

[SUB][SUP]†[/SUP]When an influenza virus that normally circulates in swine (but not people) is detected in a person, it is called a "variant" influenza virus. Most human infections with variant influenza viruses occur following exposure to swine, but human-to-human transmission can occur. It is important to note that in most cases, variant influenza viruses have not shown the ability to spread easily and sustainably from human-to-human.[/SUB]


[SUB]*This graph reflects the number of specimens tested and the number determined to be positive for influenza viruses at the public health lab (specimens tested is not the same as cases). It does not reflect specimens tested only at CDC and could include more than one specimen tested per person. Specimens tested as part of routine influenza surveillance as well as those tested as part of targeted testing for people exposed to avian influenza A(H5) are included.[/SUB]

Additional virologic surveillance information for current and past seasons:

Surveillance Methods | FluView Interactive: National, Regional, and State Data or Age Data

Novel Influenza A Virus Infections


No confirmed human infections with influenza A(H5) virus were reported to CDC this week. To date, human-to-human transmission of avian influenza A(H5) virus (H5 bird flu) has not been identified in the United States.

The CSTE position statement, which includes updated case definitions for confirmed, probable, and suspected cases is available at http://www.cste.org/resource/resmgr/position_statements_files_2023/24-ID-09_Novel_Influenza_A.pdf.

An up-to-date human case summary during the current outbreak by state and exposure source is available at www.cdc.gov/bird-flu/situation-summary/index.html.

Information about avian influenza is available at https://www.cdc.gov/flu/avianflu/index.htm.

A(H5N1) virus interim recommendations for Prevention, Monitoring, and Public Health Investigations are available at https://www.cdc.gov/bird-flu/prevention/hpai-interim-recommendations.html.

The latest case reports on avian influenza outbreaks in wild birds, commercial poultry, backyard or hobbyist flocks, and mammals in the United States are available from the USDA at https://www.aphis.usda.gov/h5n1-hpai#detections-hpai.

Additional information regarding human infections with novel influenza A viruses:

Surveillance Methods | FluView Interactive


Outpatient and Emergency Department Illness Surveillance

Outpatient Respiratory Illness Visits


The U.S. Outpatient Influenza-like Illness Surveillance Network (ILINet) monitors outpatient visits for respiratory illness referred to as influenza-like illness [ILI (fever plus cough or sore throat)], not laboratory-confirmed influenza, and may capture respiratory illness visits due to infection with any pathogen that can present with similar symptoms, including influenza, SARS-CoV-2, and RSV. Therefore, it is important to evaluate syndromic surveillance data, including that from ILINet, in the context of other sources of surveillance data to obtain a complete and accurate picture of influenza, SARS-CoV-2, and other respiratory virus activity.

Nationally, during Week 28, 1.1% of patient visits reported through ILINet were due to respiratory illness that included fever plus a cough or sore throat, also referred to as ILI. Multiple respiratory viruses are co-circulating, and the relative contribution of influenza virus infection to ILI varies by location.

Outpatient Respiratory Illness Visits by Age Group


More than 70% of ILINet participants provide both the number of patient visits for respiratory illness and the total number of patient visits for the week broken out by age group. Data from this subset of providers are used to calculate the percentages of patient visits for respiratory illness by age group.

During Week 28, the percentage of visits for respiratory illness reported in ILINet was 3.6% among those 0-4 years, 1.4% among those 5-24 years, 0.9% among those 25-49 years, 0.7% among those 50-64 years, and 0.5% among those 65 years and older.

Outpatient Respiratory Illness Activity Map


Data collected in ILINet are used to produce a measure of ILI activity* by state/jurisdiction and Core Based Statistical Areas (CBSA).
Week 28
(Week ending
Jul. 12, 2025)
Week 27
(Week ending
Jul. 5, 2025)
Week 28
(Week ending
Jul. 12, 2025)
Week 27
(Week ending
Jul. 5, 2025)
Very High0000
High0000
Moderate0000
Low0021
Minimal5455679695
Insufficient Data10248233


[SUB]*Data collected in ILINet may disproportionally represent certain populations within a jurisdiction or CBSA, and therefore, may not accurately depict the full picture of influenza activity for the entire jurisdiction or CBSA. Differences in the data presented here by CDC and independently by some health departments likely represent differing levels of data completeness with data presented by the health department likely being the more complete.[/SUB]

Additional information about medically attended visits for ILI for current and past seasons:

Surveillance Methods | FluView Interactive: National, Regional, and State Data or ILI Activity Map

National Syndromic Surveillance System (NSSP)


The overall percentage of emergency department (ED) visits with a discharge diagnosis of influenza reported in NSSP was 0.1% during Week 28. The percentage of visits was 0.3% among those 0-4 years, 0.2% among those 5-17 years, 0.1% among those 18-64 years, and 0.1% among those 65 years and older. RegionNationalRegion 1Region 2Region 3Region 4Region 5Region 6Region 7Region 8Region 9Region 10
Season2023-2024 & 2024-20252022-2023 Skip Over Chart Container
2.0%4.0%6.0%8.0%10.0%12.0%14.0%16.0%Percent of Emergency Department Visits for InfluenzaWeek 43 of 2023Week 47 of 2023Week 51 of 2023Week 3 of 2024Week 7 of 2024Week 11 of 2024Week 15 of 2024Week 19 of 2024Week 23 of 2024Week 27 of 2024Week 31 of 2024Week 35 of 2024Week 39 of 2024Week 43 of 2024Week 47 of 2024Week 51 of 2024Week 3 of 2025Week 7 of 2025Week 11 of 2025Week 15 of 2025Week 19 of 2025Week 23 of 2025Week 27 of 2025 Age Group

Skip Data Table
Data Table Download Data (CSV) Skipped data table.

Additional information about emergency department visits for flu for current and past seasons:‎‎‎

Surveillance Methods | Emergency Department Visits for COVID-19, flu, and RSV


Hospitalization Surveillance

FluSurv-Net


The Influenza Hospitalization Surveillance Network (FluSurv-NET) conducts population-based surveillance for laboratory-confirmed influenza-related hospitalizations in select counties in 14 states and represents approximately 9% of the U.S. population. FluSurv-NET hospitalization data are preliminary. Patients admitted for laboratory-confirmed influenza-related hospitalization after April 30, 2025, will not be included in FluSurv-NET for the 2024-2025 season. Data on patients admitted through April 30, 2025, will continue to be updated on FluView Interactive as additional information is received.

Additional FluSurv-NET hospitalization surveillance information for current and past seasons and additional age groups:

Surveillance Methods | FluView Interactive: Rates by Age, Sex, and Race/Ethnicity or Data on Patient Characteristics | RESP-NET Interactive

National Healthcare Safety Network (NHSN) Hospital Respiratory Data


Hospitals report to NHSN the weekly number of patients with laboratory-confirmed influenza who were admitted to the hospital. Nationally, during Week 28, 979 (0.3 per 100,000 population) laboratory-confirmed influenza-associated hospitalizations were reported. When examining rates by age, the highest hospital admission rate per 100,000 population was among those 65 years and older (0.9), followed by those 0-4 years (0.3), and the 50-64 years age group (0.2).

Additional NHSN Hospital Respiratory Data information:

Surveillance Methods | Additional Data | FluView Interactive

Mortality Surveillance

National Center for Health Statistics (NCHS) Mortality Surveillance


Based on NCHS mortality surveillance data available on July 17, 2025, 0.1% of the deaths that occurred during the week ending July 12, 2025 (Week 28) were due to influenza. The data presented are preliminary and may change as more data are received and processed.

Additional pneumonia, influenza and COVID-19 mortality surveillance information for current and past seasons:

Surveillance Methods | FluView Interactive

Influenza-Associated Pediatric Mortality


One influenza-associated pediatric death that occurred during Week 27 (the week ending July 5, 2025) of the 2024-2025 season was reported to CDC during Week 28. A total of 261 influenza-associated pediatric deaths occurring during the 2024-2025 season have been reported to CDC. This is the highest number of pediatric deaths reported in any non-pandemic influenza season since the condition became reportable in 2004.

Among children who were eligible for influenza vaccination and with known vaccine status, 90% of reported pediatric deaths this season (compared to 82% during the 2023-2024 season) have occurred in children who were not fully vaccinated against influenza.

Additional pediatric mortality surveillance information for current and past seasons:

Surveillance Methods | FluView Interactive
All data in this report are preliminary and may change as more reports are received.

A description of the CDC influenza surveillance system, including methodology and detailed descriptions of each data component, is available on the surveillance methods page.[SUP]1[/SUP]

Additional information on the current and previous influenza seasons for each surveillance component are available on FluView Interactive.

Additional National and International Influenza Surveillance Information

Additional surveillance information


FluView Interactive: FluView includes enhanced web-based interactive applications that can provide dynamic visuals of the influenza data collected and analyzed by CDC. These FluView Interactive applications allow people to create customized, visual interpretations of influenza data, as well as make comparisons across flu seasons, regions, age groups and a variety of other demographics.

National Institute for Occupational Safety and Health: Monthly surveillance data on the prevalence of health-related workplace absenteeism among full-time workers in the United States are available from NIOSH.

https://www.cdc.gov/fluview/surveillance/2025-week-28.html
 
Weekly US Influenza Surveillance Report: Key Updates for Week 29, ending July 19, 2025

For Everyone
July 25, 2025 Key points


Seasonal influenza activity is low.
U.S. virologic surveillance

Clinical Laboratories


The results of tests performed by clinical laboratories nationwide are summarized below. Data from clinical laboratories (the percentage of specimens tested that are positive for influenza) are used to monitor whether influenza activity is increasing or decreasing. Nationally, during Week 29, the percentage of respiratory specimens testing positive for influenza virus in clinical laboratories was 0.6%.
No. of specimens tested26,0223,740,636
No. of positive specimens (%)142 (0.6%)488,614 (13.1%)
Positive specimens by type
Influenza A93 (65.5%)434,258 (88.9%)
Influenza B49 (34.5%)54,356 (11.1%)
Public Health Laboratories


The results of tests performed by public health laboratories nationwide are summarized below. Data from public health laboratories are used to monitor the proportion of circulating viruses that belong to each influenza virus type/subtype/lineage. Viruses known to be associated with recent live attenuated influenza vaccine (LAIV) receipt or found upon further testing to be a vaccine virus are not included as they are not circulating influenza viruses.
No. of specimens tested226150,515
No. of positive specimens1799,265
Positive specimens by type/subtype
Influenza A12 (70.6%)93,447 (94.1%)
Subtyping Performed8 (66.7%)83,850 (89.7%)
(H1N1)pdm098 (100%)44,351 (52.9%)
H3N2039,420 (47.0%)
H3N2v00
H5079 (0.1%)
Subtyping not performed4 (33.3%)9,597 (10.3%)
Influenza B5 (29.4%)5,818 (5.9%)
Lineage testing performed3 (60.0%)3,254 (55.9%)
Yamagata lineage00
Victoria lineage3 (100%)3,254 (100%)
Lineage not performed2 (40.0%)2,564 (44.1%)
[SUB]*These data reflect specimens tested, and the number determined to be positive for influenza viruses at the public health labs (specimens tested is not the same as cases). The data do not reflect specimens tested only at CDC and could include more than one specimen tested per person. The guidance for avian influenza A(H5) virus testing recommends testing both a conjunctival and respiratory swab for people with conjunctivitis which has resulted in more specimens testing positive for avian influenza A(H5) virus than the number of human A(H5) cases. For more information on the number of people infected with avian influenza A(H5) viruses, please visit the "How CDC is monitoring influenza data among people to better understand the current avian influenza A (H5N1) situation"[/SUB]

[SUB][SUP]†[/SUP]When an influenza virus that normally circulates in swine (but not people) is detected in a person, it is called a "variant" influenza virus. Most human infections with variant influenza viruses occur following exposure to swine, but human-to-human transmission can occur. It is important to note that in most cases, variant influenza viruses have not shown the ability to spread easily and sustainably from human-to-human.[/SUB]


[SUB]*This graph reflects the number of specimens tested and the number determined to be positive for influenza viruses at the public health lab (specimens tested is not the same as cases). It does not reflect specimens tested only at CDC and could include more than one specimen tested per person. Specimens tested as part of routine influenza surveillance as well as those tested as part of targeted testing for people exposed to avian influenza A(H5) are included.[/SUB]

Additional virologic surveillance information for current and past seasons:

Surveillance Methods | FluView Interactive: National, Regional, and State Data or Age Data

Novel Influenza A Virus Infections


No confirmed human infections with influenza A(H5) virus were reported to CDC this week. To date, human-to-human transmission of avian influenza A(H5) virus (H5 bird flu) has not been identified in the United States.

The CSTE position statement, which includes updated case definitions for confirmed, probable, and suspected cases is available at http://www.cste.org/resource/resmgr/position_statements_files_2023/24-ID-09_Novel_Influenza_A.pdf.

An up-to-date human case summary during the current outbreak by state and exposure source is available at www.cdc.gov/bird-flu/situation-summary/index.html.

Information about avian influenza is available at https://www.cdc.gov/flu/avianflu/index.htm.

A(H5N1) virus interim recommendations for Prevention, Monitoring, and Public Health Investigations are available at https://www.cdc.gov/bird-flu/prevention/hpai-interim-recommendations.html.

The latest case reports on avian influenza outbreaks in wild birds, commercial poultry, backyard or hobbyist flocks, and mammals in the United States are available from the USDA at https://www.aphis.usda.gov/h5n1-hpai#detections-hpai.

Additional information regarding human infections with novel influenza A viruses:

Surveillance Methods | FluView Interactive

Outpatient Respiratory Illness Surveillance


The U.S. Outpatient Influenza-like Illness Surveillance Network (ILINet) monitors outpatient visits for respiratory illness referred to as influenza-like illness [ILI (fever plus cough or sore throat)], not laboratory-confirmed influenza, and may capture respiratory illness visits due to infection with any pathogen that can present with similar symptoms, including influenza, SARS-CoV-2, and RSV. Therefore, it is important to evaluate syndromic surveillance data, including that from ILINet, in the context of other sources of surveillance data to obtain a complete and accurate picture of influenza, SARS-CoV-2, and other respiratory virus activity.

Outpatient Respiratory Illness Visits


Nationally, during Week 29, 1.0% of patient visits reported through ILINet were due to respiratory illness that included fever plus a cough or sore throat, also referred to as ILI. Multiple respiratory viruses are co-circulating, and the relative contribution of influenza virus infection to ILI varies by location.

Outpatient Respiratory Illness Visits by Age Group


More than 70% of ILINet participants provide both the number of patient visits for respiratory illness and the total number of patient visits for the week broken out by age group. Data from this subset of providers are used to calculate the percentages of patient visits for respiratory illness by age group.

During Week 29, the percentage of visits for respiratory illness reported in ILINet was 3.2% among those 0-4 years, 1.3% among those 5-24 years, 0.9% among those 25-49 years, 0.7% among those 50-64 years, and 0.5% among those 65 years and older.

Outpatient Respiratory Illness Activity Map


Data collected in ILINet are used to produce a measure of ILI activity* by state/jurisdiction and Core Based Statistical Areas (CBSA).
Week 29
(Week ending
Jul. 19, 2025)
Week 28
(Week ending
Jul. 12, 2025)
Week 29
(Week ending
Jul. 19, 2025)
Week 28
(Week ending
Jul. 12, 2025)
Very High0000
High0000
Moderate0000
Low0002
Minimal5554683680
Insufficient Data01246247


[SUB]*Data collected in ILINet may disproportionally represent certain populations within a jurisdiction or CBSA, and therefore, may not accurately depict the full picture of influenza activity for the entire jurisdiction or CBSA. Differences in the data presented here by CDC and independently by some health departments likely represent differing levels of data completeness with data presented by the health department likely being the more complete.[/SUB]

Additional information about medically attended visits for ILI for current and past seasons:

Surveillance Methods | FluView Interactive: National, Regional, and State Data or ILI Activity Map

National Syndromic Surveillance System (NSSP)


The overall percentage of emergency department (ED) visits with a discharge diagnosis of influenza reported in NSSP was 0.1% during Week 29. The percentage of visits was 0.2% among those 0-4 years, 0.1% among those 5-17 years, 0.1% among those 18-64 years, and 0.1% among those 65 years and older. RegionNationalRegion 1Region 2Region 3Region 4Region 5Region 6Region 7Region 8Region 9Region 10
Season2023-2024 & 2024-20252022-2023 Skip Over Chart Container
2.0%4.0%6.0%8.0%10.0%12.0%14.0%16.0%Percent of Emergency Department Visits for InfluenzaWeek 41 of 2023Week 45 of 2023Week 49 of 2023Week 1 of 2024Week 5 of 2024Week 9 of 2024Week 13 of 2024Week 17 of 2024Week 21 of 2024Week 25 of 2024Week 29 of 2024Week 33 of 2024Week 37 of 2024Week 41 of 2024Week 45 of 2024Week 49 of 2024Week 1 of 2025Week 5 of 2025Week 9 of 2025Week 13 of 2025Week 17 of 2025Week 21 of 2025Week 25 of 2025Week 29 of 2025

Age Group

Skip Data Table
Data Table Download Data (CSV) Skipped data table.

Additional information about emergency department visits for flu for current and past seasons:‎‎‎

Surveillance Methods | Emergency Department Visits for COVID-19, flu, and RSV

Hospitalization Surveillance

FluSurv-Net


The Influenza Hospitalization Surveillance Network (FluSurv-NET) conducts population-based surveillance for laboratory-confirmed influenza-related hospitalizations in select counties in 14 states and represents approximately 9% of the U.S. population. FluSurv-NET hospitalization data are preliminary. Patients admitted for laboratory-confirmed influenza-related hospitalization after April 30, 2025, will not be included in FluSurv-NET for the 2024-2025 season. Data on patients admitted through April 30, 2025, will continue to be updated on FluView Interactive as additional information is received.

Additional FluSurv-NET hospitalization surveillance information for current and past seasons and additional age groups:

Surveillance Methods | FluView Interactive: Rates by Age, Sex, and Race/Ethnicity or Data on Patient Characteristics | RESP-NET Interactive

National Healthcare Safety Network (NHSN) Hospital Respiratory Data


Hospitals report to NHSN the weekly number of patients with laboratory-confirmed influenza who were admitted to the hospital. Nationally, during Week 29, 787 (0.2 per 100,000 population) laboratory-confirmed influenza-associated hospitalizations were reported. When examining rates by age, the highest hospital admission rate per 100,000 population was among those 65 years and older (0.7), followed by those 0-4 years (0.3), and the 50-64 years age group (0.2).

Additional NHSN Hospital Respiratory Data information:

Surveillance Methods | Additional Data | FluView Interactive
Mortality Surveillance

National Center for Health Statistics (NCHS) Mortality Surveillance


Based on NCHS mortality surveillance data available on July 24, 2025, 0.04% of the deaths that occurred during the week ending July 19, 2025 (Week 29) were due to influenza. The data presented are preliminary and may change as more data are received and processed.

Additional pneumonia, influenza and COVID-19 mortality surveillance information for current and past seasons:

Surveillance Methods | FluView Interactive

Influenza-Associated Pediatric Mortality


Five influenza-associated pediatric deaths occurring during the 2024-2025 season were reported to CDC during Week 29. The deaths occurred during weeks 8, 9, 19, 24 and 27 (the weeks ending February 22, March 1, May 10, June 14, and July 5, 2025, respectively). A total of 266 influenza-associated pediatric deaths occurring during the 2024-2025 season have been reported to CDC. This is the highest number of pediatric deaths reported in any non-pandemic influenza season since the condition became reportable in 2004. Among children who were eligible for influenza vaccination and with known vaccine status, 90% of reported pediatric deaths this season (compared to 82% during the 2023-2024 season) have occurred in children who were not fully vaccinated against influenza.

One death occurring in the 2023-2024 season during Week 2 (the week ending January 13, 2024) was also reported. This brings the total number of pediatric deaths for last season to 208.

Additional pediatric mortality surveillance information for current and past seasons:

Surveillance Methods | FluView Interactive
All data in this report are preliminary and may change as more reports are received.

A description of the CDC influenza surveillance system, including methodology and detailed descriptions of each data component, is available on the surveillance methods page.[SUP]1[/SUP]

Additional information on the current and previous influenza seasons for each surveillance component are available on FluView Interactive.

Additional National and International Influenza Surveillance Information

Additional surveillance information


FluView Interactive: FluView includes enhanced web-based interactive applications that can provide dynamic visuals of the influenza data collected and analyzed by CDC. These FluView Interactive applications allow people to create customized, visual interpretations of influenza data, as well as make comparisons across flu seasons, regions, age groups and a variety of other demographics.

National Institute for Occupational Safety and Health: Monthly surveillance data on the prevalence of health-related workplace absenteeism among full-time workers in the United States are available from NIOSH.

https://www.cdc.gov/fluview/surveillance/2025-week-29.html
 
Weekly US Influenza Surveillance Report: Key Updates for Week 30, ending July 26, 2025

For Everyone
Aug. 1, 2025

Key points


Seasonal influenza activity is low.
U.S. virologic surveillance

Clinical Laboratories


The results of tests performed by clinical laboratories nationwide are summarized below. Data from clinical laboratories (the percentage of specimens tested that are positive for influenza) are used to monitor whether influenza activity is increasing or decreasing. Nationally, during Week 30, the percentage of respiratory specimens testing positive for influenza virus in clinical laboratories was 0.4%.
No. of specimens tested25,8763,771,794
No. of positive specimens (%)100 (0.4%)488,745 (13.0%)
Positive specimens by type
Influenza A78 (78.0%)434,356 (88.9%)
Influenza B22 (22.0%)54,389 (11.1%)
Public Health Laboratories


The results of tests performed by public health laboratories nationwide are summarized below. Data from public health laboratories are used to monitor the proportion of circulating viruses that belong to each influenza virus type/subtype/lineage. Viruses known to be associated with recent live attenuated influenza vaccine (LAIV) receipt or found upon further testing to be a vaccine virus are not included as they are not circulating influenza viruses.
No. of specimens tested247151,254
No. of positive specimens3199,414
Positive specimens by type/subtype
Influenza A26 (83.9%)93,553 (94.1%)
Subtyping Performed23 (88.5%)83,978 (89.8%)
(H1N1)pdm0917 (73.9%)44,447 (52.9%)
H3N26 (26.1%)39,452 (47.0%)
H3N2v[SUP]†[/SUP]00
H5*079 (0.1%)
Subtyping not performed3 (11.5%)9,575 (10.2%)
Influenza B5 (16.1%)5,861 (5.9%)
Lineage testing performed1 (20.0%)3,290 (56.1%)
Yamagata lineage00
Victoria lineage1 (100%)3,290 (100%)
Lineage not performed4 (80.0%)2,571 (43.9%)
[SUB]*These data reflect specimens tested, and the number determined to be positive for influenza viruses at the public health labs (specimens tested is not the same as cases). The data do not reflect specimens tested only at CDC and could include more than one specimen tested per person. The guidance for avian influenza A(H5) virus testing recommends testing both a conjunctival and respiratory swab for people with conjunctivitis which has resulted in more specimens testing positive for avian influenza A(H5) virus than the number of human A(H5) cases. For more information on the number of people infected with avian influenza A(H5) viruses, please visit the "How CDC is monitoring influenza data among people to better understand the current avian influenza A (H5N1) situation"[/SUB]

[SUB][SUP]†[/SUP]When an influenza virus that normally circulates in swine (but not people) is detected in a person, it is called a "variant" influenza virus. Most human infections with variant influenza viruses occur following exposure to swine, but human-to-human transmission can occur. It is important to note that in most cases, variant influenza viruses have not shown the ability to spread easily and sustainably from human-to-human.[/SUB]


[SUB]*This graph reflects the number of specimens tested and the number determined to be positive for influenza viruses at the public health lab (specimens tested is not the same as cases). It does not reflect specimens tested only at CDC and could include more than one specimen tested per person. Specimens tested as part of routine influenza surveillance as well as those tested as part of targeted testing for people exposed to avian influenza A(H5) are included.[/SUB] Additional virologic surveillance information for current and past seasons:

Surveillance Methods | FluView Interactive: National, Regional, and State Data or Age Data

Novel Influenza A Virus Infections


No confirmed human infections with influenza A(H5) virus were reported to CDC this week. To date, human-to-human transmission of avian influenza A(H5) virus (H5 bird flu) has not been identified in the United States.

The CSTE position statement, which includes updated case definitions for confirmed, probable, and suspected cases is available at http://www.cste.org/resource/resmgr/position_statements_files_2023/24-ID-09_Novel_Influenza_A.pdf.

An up-to-date human case summary during the current outbreak by state and exposure source is available at www.cdc.gov/bird-flu/situation-summary/index.html.

Information about avian influenza is available at https://www.cdc.gov/flu/avianflu/index.htm.

A(H5N1) virus interim recommendations for Prevention, Monitoring, and Public Health Investigations are available at https://www.cdc.gov/bird-flu/prevention/hpai-interim-recommendations.html.

The latest case reports on avian influenza outbreaks in wild birds, commercial poultry, backyard or hobbyist flocks, and mammals in the United States are available from the USDA at https://www.aphis.usda.gov/h5n1-hpai#detections-hpai.

Additional information regarding human infections with novel influenza A viruses:

Surveillance Methods | FluView Interactive
Outpatient and Emergency Department Illness Surveillance

Outpatient Respiratory Illness Visits


The U.S. Outpatient Influenza-like Illness Surveillance Network (ILINet) monitors outpatient visits for respiratory illness referred to as influenza-like illness [ILI (fever plus cough or sore throat)], not laboratory-confirmed influenza, and may capture respiratory illness visits due to infection with any pathogen that can present with similar symptoms, including influenza, SARS-CoV-2, and RSV. Therefore, it is important to evaluate syndromic surveillance data, including that from ILINet, in the context of other sources of surveillance data to obtain a complete and accurate picture of influenza, SARS-CoV-2, and other respiratory virus activity.

Nationally, during Week 30, 1.0% of patient visits reported through ILINet were due to respiratory illness that included fever plus a cough or sore throat, also referred to as ILI. Multiple respiratory viruses are co-circulating, and the relative contribution of influenza virus infection to ILI varies by location.

Outpatient Respiratory Illness Visits by Age Group


More than 70% of ILINet participants provide both the number of patient visits for respiratory illness and the total number of patient visits for the week broken out by age group. Data from this subset of providers are used to calculate the percentages of patient visits for respiratory illness by age group.

During Week 30, the percentage of visits for respiratory illness reported in ILINet was 3.4% among those 0-4 years, 1.4% among those 5-24 years, 0.9% among those 25-49 years, 0.6% among those 50-64 years, and 0.5% among those 65 years and older.

Outpatient Respiratory Illness Activity Map


Data collected in ILINet are used to produce a measure of ILI activity* by state/jurisdiction and Core Based Statistical Areas (CBSA).
Week 30
(Week ending
Jul. 26, 2025)
Week 29
(Week ending
Jul. 19, 2025)
Week 30
(Week ending
Jul. 26, 2025)
Week 29
(Week ending
Jul. 19, 2025)
Very High0000
High0000
Moderate0000
Low0000
Minimal5555692688
Insufficient Data00237241


[SUB]*Data collected in ILINet may disproportionally represent certain populations within a jurisdiction or CBSA, and therefore, may not accurately depict the full picture of influenza activity for the entire jurisdiction or CBSA. Differences in the data presented here by CDC and independently by some health departments likely represent differing levels of data completeness with data presented by the health department likely being the more complete.[/SUB] Additional information about medically attended visits for ILI for current and past seasons:

Surveillance Methods | FluView Interactive: National, Regional, and State Data or ILI Activity Map

National Syndromic Surveillance System (NSSP)


The overall percentage of emergency department (ED) visits with a discharge diagnosis of influenza reported in NSSP was 0.1% during Week 30. The percentage of visits was 0.2% among those 0-4 years and 0.1% among those 5-17 years, 18-64 years, and 65 years and older. RegionNationalRegion 1Region 2Region 3Region 4Region 5Region 6Region 7Region 8Region 9Region 10
Season2023-2024 & 2024-20252022-2023 Skip Over Chart Container
2.0%4.0%6.0%8.0%10.0%12.0%14.0%16.0%Percent of Emergency Department Visits for InfluenzaWeek 41 of 2023Week 45 of 2023Week 49 of 2023Week 1 of 2024Week 5 of 2024Week 9 of 2024Week 13 of 2024Week 17 of 2024Week 21 of 2024Week 25 of 2024Week 29 of 2024Week 33 of 2024Week 37 of 2024Week 41 of 2024Week 45 of 2024Week 49 of 2024Week 1 of 2025Week 5 of 2025Week 9 of 2025Week 13 of 2025Week 17 of 2025Week 21 of 2025Week 25 of 2025Week 29 of 2025

Age Group

Skip Data Table
Data Table Download Data (CSV) Skipped data table.

Additional information about emergency department visits for flu for current and past seasons:‎‎‎

Surveillance Methods | Emergency Department Visits for COVID-19, flu, and RSV
Hospitalization Surveillance

FluSurv-Net


The Influenza Hospitalization Surveillance Network (FluSurv-NET) conducts population-based surveillance for laboratory-confirmed influenza-related hospitalizations in select counties in 14 states and represents approximately 9% of the U.S. population. FluSurv-NET hospitalization data are preliminary. Patients admitted for laboratory-confirmed influenza-related hospitalization after April 30, 2025, will not be included in FluSurv-NET for the 2024-2025 season. Data on patients admitted through April 30, 2025, will continue to be updated on FluView Interactive as additional information is received.

Additional FluSurv-NET hospitalization surveillance information for current and past seasons and additional age groups:

Surveillance Methods | FluView Interactive: Rates by Age, Sex, and Race/Ethnicity or Data on Patient Characteristics | RESP-NET Interactive

National Healthcare Safety Network (NHSN) Hospital Respiratory Data


Hospitals report to NHSN the weekly number of patients with laboratory-confirmed influenza who were admitted to the hospital. Nationally, during Week 30, 825 (0.2 per 100,000 population) laboratory-confirmed influenza-associated hospitalizations were reported. When examining rates by age, the highest hospital admission rate per 100,000 population was among those 65 years and older (0.8), followed by those 0-4 years (0.3), and the 50-64 years age group (0.2).

Additional NHSN Hospital Respiratory Data information:

Surveillance Methods | Additional Data | FluView Interactive
Mortality Surveillance

National Center for Health Statistics (NCHS) Mortality Surveillance


Based on NCHS mortality surveillance data available on July 31, 2025, 0.04% of the deaths that occurred during the week ending July 26, 2025 (Week 30) were due to influenza. The data presented are preliminary and may change as more data are received and processed.

Additional pneumonia, influenza and COVID-19 mortality surveillance information for current and past seasons:

Surveillance Methods | FluView Interactive

Influenza-Associated Pediatric Mortality


No influenza-associated pediatric deaths occurring during the 2024-2025 season were reported to CDC during Week 30. A total of 266 influenza-associated pediatric deaths occurring during the 2024-2025 season have been reported to CDC. This is the highest number of pediatric deaths reported in any non-pandemic influenza season since the condition became reportable in 2004. Among children who were eligible for influenza vaccination and with known vaccine status, 90% of reported pediatric deaths this season (compared to 82% during the 2023-2024 season) have occurred in children who were not fully vaccinated against influenza.

One death occurring in the 2023-2024 season during Week 1 (the week ending January 6, 2024) was reported to CDC during week 30. This brings the total number of pediatric deaths for last season to 209.

Additional pediatric mortality surveillance information for current and past seasons:

Surveillance Methods | FluView Interactive
All data in this report are preliminary and may change as more reports are received.

A description of the CDC influenza surveillance system, including methodology and detailed descriptions of each data component, is available on the surveillance methods page.[SUP]1[/SUP]

Additional information on the current and previous influenza seasons for each surveillance component are available on FluView Interactive.

Additional National and International Influenza Surveillance Information

Additional surveillance information


FluView Interactive: FluView includes enhanced web-based interactive applications that can provide dynamic visuals of the influenza data collected and analyzed by CDC. These FluView Interactive applications allow people to create customized, visual interpretations of influenza data, as well as make comparisons across flu seasons, regions, age groups and a variety of other demographics.

National Institute for Occupational Safety and Health: Monthly surveillance data on the prevalence of health-related workplace absenteeism among full-time workers in the United States are available from NIOSH.

https://www.cdc.gov/fluview/surveillance/2025-week-30.html
 
Weekly US Influenza Surveillance Report: Key Updates for Week 31, ending August 2, 2025

For Everyone
Aug. 8, 2025 Key points


Seasonal influenza activity is low.
U.S. virologic surveillance

Clinical Laboratories


The results of tests performed by clinical laboratories nationwide are summarized below. Data from clinical laboratories (the percentage of specimens tested that are positive for influenza) are used to monitor whether influenza activity is increasing or decreasing. Nationally, during Week 31, the percentage of respiratory specimens testing positive for influenza virus in clinical laboratories was 0.4%.
No. of specimens tested24,3353,802,325
No. of positive specimens (%)94 (0.4%)488,889 (12.9%)
Positive specimens by type
Influenza A70 (74.5%)434,454 (88.9%)
Influenza B24 (25.5%)54,435 (11.1%)
Public Health Laboratories


The results of tests performed by public health laboratories nationwide are summarized below. Data from public health laboratories are used to monitor the proportion of circulating viruses that belong to each influenza virus type/subtype/lineage. Viruses known to be associated with recent live attenuated influenza vaccine (LAIV) receipt or found upon further testing to be a vaccine virus are not included as they are not circulating influenza viruses.
No. of specimens tested294152,238
No. of positive specimens3599,557
Positive specimens by type/subtype
Influenza A34 (97.1%)93,674 (94.1%)
Subtyping Performed26 (76.5%)84,080 (89.8%)
(H1N1)pdm0924 (92.3%)44,511 (52.9%)
H3N22 (7.7%)39,490 (47.0%)
H3N2v00
H5079 (0.1%)
Subtyping not performed8 (23.5%)9,594 (10.2%)
Influenza B1 (2.9%)5,883 (5.9%)
Lineage testing performed03,308 (56.2%)
Yamagata lineage00
Victoria lineage03,308 (100%)
Lineage not performed1 (100%)2,575 (43.8%)


[SUB]*This graph reflects the number of specimens tested and the number determined to be positive for influenza viruses at the public health lab (specimens tested is not the same as cases). It does not reflect specimens tested only at CDC and could include more than one specimen tested per person. Specimens tested as part of routine influenza surveillance as well as those tested as part of targeted testing for people exposed to avian influenza A(H5) are included.[/SUB]

Additional virologic surveillance information for current and past seasons:

Surveillance Methods | FluView Interactive: National, Regional, and State Data or Age Data

Novel Influenza A Virus Infections


No confirmed human infections with influenza A(H5) virus were reported to CDC this week. To date, human-to-human transmission of avian influenza A(H5) virus (H5 bird flu) has not been identified in the United States.

The CSTE position statement, which includes updated case definitions for confirmed, probable, and suspected cases is available at http://www.cste.org/resource/resmgr/position_statements_files_2023/24-ID-09_Novel_Influenza_A.pdf.

An up-to-date human case summary during the current outbreak by state and exposure source is available at www.cdc.gov/bird-flu/situation-summary/index.html.

Information about avian influenza is available at https://www.cdc.gov/flu/avianflu/index.htm.

A(H5N1) virus interim recommendations for Prevention, Monitoring, and Public Health Investigations are available at https://www.cdc.gov/bird-flu/prevention/hpai-interim-recommendations.html.

The latest case reports on avian influenza outbreaks in wild birds, commercial poultry, backyard or hobbyist flocks, and mammals in the United States are available from the USDA at https://www.aphis.usda.gov/h5n1-hpai#detections-hpai.

Additional information regarding human infections with novel influenza A viruses:

Surveillance Methods | FluView Interactive
Outpatient Respiratory Illness Surveillance


The U.S. Outpatient Influenza-like Illness Surveillance Network (ILINet) monitors outpatient visits for respiratory illness referred to as influenza-like illness [ILI (fever plus cough or sore throat)], not laboratory-confirmed influenza, and may capture respiratory illness visits due to infection with any pathogen that can present with similar symptoms, including influenza, SARS-CoV-2, and RSV. Therefore, it is important to evaluate syndromic surveillance data, including that from ILINet, in the context of other sources of surveillance data to obtain a complete and accurate picture of influenza, SARS-CoV-2, and other respiratory virus activity.

Outpatient Respiratory Illness Visits


Nationally, during Week 31, 1.0% of patient visits reported through ILINet were due to respiratory illness that included fever plus a cough or sore throat, also referred to as ILI. Multiple respiratory viruses are co-circulating, and the relative contribution of influenza virus infection to ILI varies by location.

Outpatient Respiratory Illness Visits by Age Group


More than 70% of ILINet participants provide both the number of patient visits for respiratory illness and the total number of patient visits for the week broken out by age group. Data from this subset of providers are used to calculate the percentages of patient visits for respiratory illness by age group.

During Week 31, the percentage of visits for respiratory illness reported in ILINet was 3.4% among those 0-4 years, 1.4% among those 5-24 years, 0.9% among those 25-49 years, 0.6% among those 50-64 years, and 0.5% among those 65 years and older.

Outpatient Respiratory Illness Activity Map


Data collected in ILINet are used to produce a measure of ILI activity* by state/jurisdiction and Core Based Statistical Areas (CBSA).
Week 31
(Week ending
Aug. 2, 2025)
Week 30
(Week ending
Jul. 26, 2025)
Week 31
(Week ending
Aug. 2, 2025)
Week 30
(Week ending
Jul. 26, 2025)
Very High0000
High0000
Moderate0000
Low0002
Minimal5555682694
Insufficient Data00247235


[SUB]*Data collected in ILINet may disproportionally represent certain populations within a jurisdiction or CBSA, and therefore, may not accurately depict the full picture of influenza activity for the entire jurisdiction or CBSA. Differences in the data presented here by CDC and independently by some health departments likely represent differing levels of data completeness with data presented by the health department likely being the more complete.[/SUB]

Additional information about medically attended visits for ILI for current and past seasons:

Surveillance Methods | FluView Interactive: National, Regional, and State Data or ILI Activity Map

National Syndromic Surveillance System (NSSP)


The overall percentage of emergency department (ED) visits with a discharge diagnosis of influenza reported in NSSP was 0.1% during Week 31. The percentage of visits was 0.2% among those 0-4 years, and 0.1% among those 5-17 years, 18-64 years, and 65 years and older. RegionNationalRegion 1Region 2Region 3Region 4Region 5Region 6Region 7Region 8Region 9Region 10
Season2023-2024 & 2024-20252022-2023 Skip Over Chart Container
2.0%4.0%6.0%8.0%10.0%12.0%14.0%16.0%Percent of Emergency Department Visits for InfluenzaWeek 43 of 2023Week 47 of 2023Week 51 of 2023Week 3 of 2024Week 7 of 2024Week 11 of 2024Week 15 of 2024Week 19 of 2024Week 23 of 2024Week 27 of 2024Week 31 of 2024Week 35 of 2024Week 39 of 2024Week 43 of 2024Week 47 of 2024Week 51 of 2024Week 3 of 2025Week 7 of 2025Week 11 of 2025Week 15 of 2025Week 19 of 2025Week 23 of 2025Week 27 of 2025Week 31 of 2025

Age Group

Skip Data Table
Data Table Download Data (CSV) Skipped data table.

Additional information about emergency department visits for flu for current and past seasons:‎‎‎

Surveillance Methods | Emergency Department Visits for COVID-19, flu, and RSV
Hospitalization Surveillance

FluSurv-Net


The Influenza Hospitalization Surveillance Network (FluSurv-NET) conducts population-based surveillance for laboratory-confirmed influenza-related hospitalizations in select counties in 14 states and represents approximately 9% of the U.S. population. FluSurv-NET hospitalization data are preliminary. Patients admitted for laboratory-confirmed influenza-related hospitalization after April 30, 2025, will not be included in FluSurv-NET for the 2024-2025 season. Data on patients admitted through April 30, 2025, will continue to be updated on FluView Interactive as additional information is received.

Additional FluSurv-NET hospitalization surveillance information for current and past seasons and additional age groups:

Surveillance Methods | FluView Interactive: Rates by Age, Sex, and Race/Ethnicity or Data on Patient Characteristics | RESP-NET Interactive

National Healthcare Safety Network (NHSN) Hospital Respiratory Data


Hospitals report to NHSN the weekly number of patients with laboratory-confirmed influenza who were admitted to the hospital. Nationally, during Week 31, 733 (0.2 per 100,000 population) laboratory-confirmed influenza-associated hospitalizations were reported. When examining rates by age, the highest hospital admission rate per 100,000 population was among those 65 years and older (0.7), followed by those 0-4 years (0.2) and 50-64 years (0.2).

Additional NHSN Hospital Respiratory Data information:

Surveillance Methods | Additional Data | FluView Interactive

Mortality Surveillance

National Center for Health Statistics (NCHS) Mortality Surveillance


Based on NCHS mortality surveillance data available on August 7, 2025, 0.03% of the deaths that occurred during the week ending August 2, 2025 (Week 31) were due to influenza. The data presented are preliminary and may change as more data are received and processed.

Additional pneumonia, influenza and COVID-19 mortality surveillance information for current and past seasons:

Surveillance Methods | FluView Interactive

Influenza-Associated Pediatric Mortality


One influenza-associated pediatric death that occurred during Week 16 (the week ending April 19, 2025) of the 2024-2025 season was reported to CDC during Week 31. A total of 267 influenza-associated pediatric deaths occurring during the 2024-2025 season have been reported to CDC. This is the highest number of pediatric deaths reported in any non-pandemic influenza season since the condition became reportable in 2004.

Among children who were eligible for influenza vaccination and with known vaccine status, 90% of reported pediatric deaths this season (compared to 82% during the 2023-2024 season) have occurred in children who were not fully vaccinated against influenza.

Additional pediatric mortality surveillance information for current and past seasons:

Surveillance Methods | FluView Interactive
All data in this report are preliminary and may change as more reports are received.

A description of the CDC influenza surveillance system, including methodology and detailed descriptions of each data component, is available on the surveillance methods page.[SUP]1[/SUP]

Additional information on the current and previous influenza seasons for each surveillance component are available on FluView Interactive.

Additional National and International Influenza Surveillance Information

Additional surveillance information


FluView Interactive: FluView includes enhanced web-based interactive applications that can provide dynamic visuals of the influenza data collected and analyzed by CDC. These FluView Interactive applications allow people to create customized, visual interpretations of influenza data, as well as make comparisons across flu seasons, regions, age groups and a variety of other demographics.

National Institute for Occupational Safety and Health: Monthly surveillance data on the prevalence of health-related workplace absenteeism among full-time workers in the United States are available from NIOSH.

https://www.cdc.gov/fluview/surveillance/2025-week-31.html
 
Weekly US Influenza Surveillance Report: Key Updates for Week 32, ending August 9, 2025

For Everyone
Aug. 15, 2025

Key points


Seasonal influenza activity is low.
U.S. virologic surveillance

Clinical Laboratories


The results of tests performed by clinical laboratories nationwide are summarized below. Data from clinical laboratories (the percentage of specimens tested that are positive for influenza) are used to monitor whether influenza activity is increasing or decreasing. Nationally, during Week 32, the percentage of respiratory specimens testing positive for influenza virus in clinical laboratories was 0.4%.
No. of specimens tested28,0093,845,643
No. of positive specimens (%)116 (0.4%)489,052 (12.7%)
Positive specimens by type
Influenza A88 (75.9%)434,575 (88.9%)
Influenza B28 (24.1%)54,477 (11.1%)
Public Health Laboratories


The results of tests performed by public health laboratories nationwide are summarized below. Data from public health laboratories are used to monitor the proportion of circulating viruses that belong to each influenza virus type/subtype/lineage. Viruses known to be associated with recent live attenuated influenza vaccine (LAIV) receipt or found upon further testing to be a vaccine virus are not included as they are not circulating influenza viruses.
No. of specimens tested310153,366
No. of positive specimens1999,818
Positive specimens by type/subtype
Influenza A17 (89.5%)93,918 (94.1%)
Subtyping Performed13 (76.5%)84,330 (89.8%)
(H1N1)pdm099 (69.2%)44,672 (53.0%)
H3N24 (30.8%)39,579 (46.9%)
H3N2v00
H5079 (0.1%)
Subtyping not performed4 (23.5%)9,588 (10.2%)
Influenza B2 (10.5%)5,900 (5.9%)
Lineage testing performed1 (50.0%)3,322 (56.3%)
Yamagata lineage00
Victoria lineage1 (100%)3,322 (100%)
Lineage not performed1 (50.0%)2,578 (43.7%)
[SUB]*These data reflect specimens tested, and the number determined to be positive for influenza viruses at the public health labs (specimens tested is not the same as cases). The data do not reflect specimens tested only at CDC and could include more than one specimen tested per person. The guidance for avian influenza A(H5) virus testing recommends testing both a conjunctival and respiratory swab for people with conjunctivitis which has resulted in more specimens testing positive for avian influenza A(H5) virus than the number of human A(H5) cases. For more information on the number of people infected with avian influenza A(H5) viruses, please visit the "How CDC is monitoring influenza data among people to better understand the current avian influenza A (H5N1) situation"[/SUB]

[SUB][SUP]†[/SUP]When an influenza virus that normally circulates in swine (but not people) is detected in a person, it is called a "variant" influenza virus. Most human infections with variant influenza viruses occur following exposure to swine, but human-to-human transmission can occur. It is important to note that in most cases, variant influenza viruses have not shown the ability to spread easily and sustainably from human-to-human.[/SUB]


[SUB]*This graph reflects the number of specimens tested and the number determined to be positive for influenza viruses at the public health lab (specimens tested is not the same as cases). It does not reflect specimens tested only at CDC and could include more than one specimen tested per person. Specimens tested as part of routine influenza surveillance as well as those tested as part of targeted testing for people exposed to avian influenza A(H5) are included.[/SUB]

Additional virologic surveillance information for current and past seasons:

Surveillance Methods | FluView Interactive: National, Regional, and State Data or Age Data

Novel Influenza A Virus Infections


No confirmed human infections with influenza A(H5) virus were reported to CDC this week. To date, human-to-human transmission of avian influenza A(H5) virus (H5 bird flu) has not been identified in the United States.

The CSTE position statement, which includes updated case definitions for confirmed, probable, and suspected cases is available at http://www.cste.org/resource/resmgr/position_statements_files_2023/24-ID-09_Novel_Influenza_A.pdf.

An up-to-date human case summary during the current outbreak by state and exposure source is available at www.cdc.gov/bird-flu/situation-summary/index.html.

Information about avian influenza is available at https://www.cdc.gov/flu/avianflu/index.htm.

A(H5N1) virus interim recommendations for Prevention, Monitoring, and Public Health Investigations are available at https://www.cdc.gov/bird-flu/prevention/hpai-interim-recommendations.html.

The latest case reports on avian influenza outbreaks in wild birds, commercial poultry, backyard or hobbyist flocks, and mammals in the United States are available from the USDA at https://www.aphis.usda.gov/h5n1-hpai#detections-hpai.

Additional information regarding human infections with novel influenza A viruses:

Surveillance Methods | FluView Interactive
Outpatient and Emergency Department Illness Surveillance

Outpatient Respiratory Illness Visits


The U.S. Outpatient Influenza-like Illness Surveillance Network (ILINet) monitors outpatient visits for respiratory illness referred to as influenza-like illness [ILI (fever plus cough or sore throat)], not laboratory-confirmed influenza, and may capture respiratory illness visits due to infection with any pathogen that can present with similar symptoms, including influenza, SARS-CoV-2, and RSV. Therefore, it is important to evaluate syndromic surveillance data, including that from ILINet, in the context of other sources of surveillance data to obtain a complete and accurate picture of influenza, SARS-CoV-2, and other respiratory virus activity.

Nationally, during Week 32, 1.1% of patient visits reported through ILINet were due to respiratory illness that included fever plus a cough or sore throat, also referred to as ILI. Multiple respiratory viruses are co-circulating, and the relative contribution of influenza virus infection to ILI varies by location.

Outpatient Respiratory Illness Visits by Age Group


More than 70% of ILINet participants provide both the number of patient visits for respiratory illness and the total number of patient visits for the week broken out by age group. Data from this subset of providers are used to calculate the percentages of patient visits for respiratory illness by age group.

During Week 32, the percentage of visits for respiratory illness reported in ILINet was 3.5% among those 0-4 years, 1.5% among those 5-24 years, 1.0% among those 25-49 years, 0.7% among those 50-64 years, and 0.5% among those 65 years and older.

Outpatient Respiratory Illness Activity Map


Data collected in ILINet are used to produce a measure of ILI activity* by state/jurisdiction and Core Based Statistical Areas (CBSA).
Week 32
(Week ending
Aug. 9, 2025)
Week 31
(Week ending
Aug. 2, 2025)
Week 32
(Week ending
Aug. 9, 2025)
Week 31
(Week ending
Aug. 2, 2025)
Very High0000
High0000
Moderate0000
Low0020
Minimal5455691684
Insufficient Data10236245


[SUB]*Data collected in ILINet may disproportionally represent certain populations within a jurisdiction or CBSA, and therefore, may not accurately depict the full picture of influenza activity for the entire jurisdiction or CBSA. Differences in the data presented here by CDC and independently by some health departments likely represent differing levels of data completeness with data presented by the health department likely being the more complete.[/SUB]

Additional information about medically attended visits for ILI for current and past seasons:

Surveillance Methods | FluView Interactive: National, Regional, and State Data or ILI Activity Map

National Syndromic Surveillance System (NSSP)


The overall percentage of emergency department (ED) visits with a discharge diagnosis of influenza reported in NSSP was 0.1% during Week 32. The percentage of visits was 0.2% among those 0-4 years, and 0.1% among those 5-17 years, 18-64 years, and 65 years and older. RegionNationalRegion 1Region 2Region 3Region 4Region 5Region 6Region 7Region 8Region 9Region 10
Season2023-2024 & 2024-20252022-2023 Skip Over Chart Container
2.0%4.0%6.0%8.0%10.0%12.0%14.0%16.0%Percent of Emergency Department Visits for InfluenzaWeek 41 of 2023Week 45 of 2023Week 49 of 2023Week 1 of 2024Week 5 of 2024Week 9 of 2024Week 13 of 2024Week 17 of 2024Week 21 of 2024Week 25 of 2024Week 29 of 2024Week 33 of 2024Week 37 of 2024Week 41 of 2024Week 45 of 2024Week 49 of 2024Week 1 of 2025Week 5 of 2025Week 9 of 2025Week 13 of 2025Week 17 of 2025Week 21 of 2025Week 25 of 2025Week 29 of 2025 Age Group

Skip Data Table
Data Table Download Data (CSV) Skipped data table.

Additional information about emergency department visits for flu for current and past seasons:‎‎‎

Surveillance Methods | Emergency Department Visits for COVID-19, flu, and RSV
Hospitalization surveillance

FluSurv-Net


The Influenza Hospitalization Surveillance Network (FluSurv-NET) conducts population-based surveillance for laboratory-confirmed influenza-related hospitalizations in select counties in 14 states and represents approximately 9% of the U.S. population. FluSurv-NET hospitalization data are preliminary. Patients admitted for laboratory-confirmed influenza-related hospitalization after April 30, 2025, will not be included in FluSurv-NET for the 2024-2025 season. Data on patients admitted through April 30, 2025, will continue to be updated on FluView Interactive as additional information is received.

Additional FluSurv-NET hospitalization surveillance information for current and past seasons and additional age groups:

Surveillance Methods | FluView Interactive: Rates by Age, Sex, and Race/Ethnicity or Data on Patient Characteristics | RESP-NET Interactive

National Healthcare Safety Network (NHSN) Hospital Respiratory Data


Hospitals report to NHSN the weekly number of patients with laboratory-confirmed influenza who were admitted to the hospital. Nationally, during Week 32, 705 (0.2 per 100,000 population) laboratory-confirmed influenza-associated hospitalizations were reported. When examining rates by age, the highest hospital admission rate per 100,000 population was among those 65 years and older (0.7), followed by those 50-64 years (0.2) and 0-4 years (0.1).

Additional NHSN Hospital Respiratory Data information:

Surveillance Methods | Additional Data | FluView Interactive
Mortality surveillance

National Center for Health Statistics (NCHS) Mortality Surveillance


Based on NCHS mortality surveillance data available on August 14, 2025, 0.02% of the deaths that occurred during the week ending August 9, 2025 (Week 32) were due to influenza. The data presented are preliminary and may change as more data are received and processed.

Additional pneumonia, influenza and COVID-19 mortality surveillance information for current and past seasons:

Surveillance Methods | FluView Interactive

Influenza-Associated Pediatric Mortality


Three influenza-associated pediatric deaths occurring during the 2024-2025 season were reported to CDC during Week 32. The deaths occurred during week 48 of 2024 (the week ending November 30, 2024) and week 9 of 2025 (the week ending March 1, 2025). A total of 270 influenza-associated pediatric deaths occurring during the 2024-2025 season have been reported to CDC. This is the highest number of pediatric deaths reported in any non-pandemic influenza season since the condition became reportable in 2004.

Among children who were eligible for influenza vaccination and with known vaccine status, 90% of reported pediatric deaths this season (compared to 82% during the 2023-2024 season) have occurred in children who were not fully vaccinated against influenza.

Additional pediatric mortality surveillance information for current and past seasons:

Surveillance Methods | FluView Interactive
All data in this report are preliminary and may change as more reports are received.

A description of the CDC influenza surveillance system, including methodology and detailed descriptions of each data component, is available on the surveillance methods page.[SUP]1[/SUP]

Additional information on the current and previous influenza seasons for each surveillance component are available on FluView Interactive.

Additional National and International Influenza Surveillance Information

Additional surveillance information


FluView Interactive: FluView includes enhanced web-based interactive applications that can provide dynamic visuals of the influenza data collected and analyzed by CDC. These FluView Interactive applications allow people to create customized, visual interpretations of influenza data, as well as make comparisons across flu seasons, regions, age groups and a variety of other demographics.

National Institute for Occupational Safety and Health: Monthly surveillance data on the prevalence of health-related workplace absenteeism among full-time workers in the United States are available from NIOSH.

https://www.cdc.gov/fluview/surveillance/2025-week-32.html
 
Weekly US Influenza Surveillance Report: Key Updates for Week 33, ending August 16, 2025

For Everyone
Aug. 22, 2025

Key points


Seasonal influenza activity is low.

U.S. virologic surveillance

Clinical Laboratories


The results of tests performed by clinical laboratories nationwide are summarized below. Data from clinical laboratories (the percentage of specimens tested that are positive for influenza) are used to monitor whether influenza activity is increasing or decreasing. Nationally, during Week 33, the percentage of respiratory specimens testing positive for influenza virus in clinical laboratories was 0.3%.
No. of specimens tested31,8303,887,178
No. of positive specimens (%)100 (0.3%)489,182 (12.6%)
Positive specimens by type
Influenza A81 (81.0%)434,683 (88.9%)
Influenza B19 (19.0%)54,499 (11.1%)
Public Health Laboratories


The results of tests performed by public health laboratories nationwide are summarized below. Data from public health laboratories are used to monitor the proportion of circulating viruses that belong to each influenza virus type/subtype/lineage. Viruses known to be associated with recent live attenuated influenza vaccine (LAIV) receipt or found upon further testing to be a vaccine virus are not included as they are not circulating influenza viruses.
No. of specimens tested338153,988
No. of positive specimens1599,853
Positive specimens by type/subtype
Influenza A13 (86.7%)93,946 (94.1%)
Subtyping Performed11 (84.6%)84,102 (89.5%)
(H1N1)pdm0910 (90.9%)44,604 (53.0%)
H3N21 (9.1%)39,419 (46.9%)
H3N2v[SUP]†[/SUP]00
H5*079 (0.1%)
Subtyping not performed2 (15.4%)9,844 (10.5%)
Influenza B2 (13.3%)5,907 (5.9%)
Lineage testing performed1 (50.0%)3,308 (56.0%)
Yamagata lineage00
Victoria lineage1 (100%)3,308 (100%)
Lineage not performed1 (50.0%)2,599 (44.0%)
[SUB]*These data reflect specimens tested, and the number determined to be positive for influenza viruses at the public health labs (specimens tested is not the same as cases). The data do not reflect specimens tested only at CDC and could include more than one specimen tested per person. The guidance for avian influenza A(H5) virus testing recommends testing both a conjunctival and respiratory swab for people with conjunctivitis which has resulted in more specimens testing positive for avian influenza A(H5) virus than the number of human A(H5) cases. For more information on the number of people infected with avian influenza A(H5) viruses, please visit the "How CDC is monitoring influenza data among people to better understand the current avian influenza A (H5N1) situation"[/SUB]

[SUB][SUP]†[/SUP]When an influenza virus that normally circulates in swine (but not people) is detected in a person, it is called a "variant" influenza virus. Most human infections with variant influenza viruses occur following exposure to swine, but human-to-human transmission can occur. It is important to note that in most cases, variant influenza viruses have not shown the ability to spread easily and sustainably from human-to-human.[/SUB]


[SUB]*This graph reflects the number of specimens tested and the number determined to be positive for influenza viruses at the public health lab (specimens tested is not the same as cases). It does not reflect specimens tested only at CDC and could include more than one specimen tested per person. Specimens tested as part of routine influenza surveillance as well as those tested as part of targeted testing for people exposed to avian influenza A(H5) are included.[/SUB]

Additional virologic surveillance information for current and past seasons:

Surveillance Methods | FluView Interactive: National, Regional, and State Data or Age Data

Novel Influenza A Virus Infections


No confirmed human infections with influenza A(H5) virus were reported to CDC this week. To date, human-to-human transmission of avian influenza A(H5) virus (H5 bird flu) has not been identified in the United States.

The CSTE position statement, which includes updated case definitions for confirmed, probable, and suspected cases is available at http://www.cste.org/resource/resmgr/position_statements_files_2023/24-ID-09_Novel_Influenza_A.pdf.

An up-to-date human case summary during the current outbreak by state and exposure source is available at www.cdc.gov/bird-flu/situation-summary/index.html.

Information about avian influenza is available at https://www.cdc.gov/flu/avianflu/index.htm.

A(H5N1) virus interim recommendations for Prevention, Monitoring, and Public Health Investigations are available at https://www.cdc.gov/bird-flu/prevention/hpai-interim-recommendations.html.

The latest case reports on avian influenza outbreaks in wild birds, commercial poultry, backyard or hobbyist flocks, and mammals in the United States are available from the USDA at https://www.aphis.usda.gov/h5n1-hpai#detections-hpai.

Additional information regarding human infections with novel influenza A viruses:

Surveillance Methods | FluView Interactive
Outpatient and Emergency Department Illness Surveillance

Outpatient Respiratory Illness Visits


The U.S. Outpatient Influenza-like Illness Surveillance Network (ILINet) monitors outpatient visits for respiratory illness referred to as influenza-like illness [ILI (fever plus cough or sore throat)], not laboratory-confirmed influenza, and may capture respiratory illness visits due to infection with any pathogen that can present with similar symptoms, including influenza, SARS-CoV-2, and RSV. Therefore, it is important to evaluate syndromic surveillance data, including that from ILINet, in the context of other sources of surveillance data to obtain a complete and accurate picture of influenza, SARS-CoV-2, and other respiratory virus activity.

Nationally, during Week 33, 1.2% of patient visits reported through ILINet were due to respiratory illness that included fever plus a cough or sore throat, also referred to as ILI. Multiple respiratory viruses are co-circulating, and the relative contribution of influenza virus infection to ILI varies by location.

Outpatient Respiratory Illness Visits by Age Group


More than 70% of ILINet participants provide both the number of patient visits for respiratory illness and the total number of patient visits for the week broken out by age group. Data from this subset of providers are used to calculate the percentages of patient visits for respiratory illness by age group.

During Week 33, the percentage of visits for respiratory illness reported in ILINet was 3.6% among those 0-4 years, 1.7% among those 5-24 years, 1.1% among those 25-49 years, 0.7% among those 50-64 years, and 0.5% among those 65 years and older.

Outpatient Respiratory Illness Activity Map


Data collected in ILINet are used to produce a measure of ILI activity* by state/jurisdiction and Core Based Statistical Areas (CBSA).
Week 33
(Week ending
Aug. 16, 2025)
Week 32
(Week ending
Aug. 9, 2025)
Week 33
(Week ending
Aug. 16, 2025)
Week 32
(Week ending
Aug. 9, 2025)
Very High0000
High0000
Moderate0000
Low0062
Minimal5554678693
Insufficient Data01245234


[SUB]*Data collected in ILINet may disproportionally represent certain populations within a jurisdiction or CBSA, and therefore, may not accurately depict the full picture of influenza activity for the entire jurisdiction or CBSA. Differences in the data presented here by CDC and independently by some health departments likely represent differing levels of data completeness with data presented by the health department likely being the more complete.[/SUB]

Additional information about medically attended visits for ILI for current and past seasons:

Surveillance Methods | FluView Interactive: National, Regional, and State Data or ILI Activity Map

National Syndromic Surveillance System (NSSP)


The overall percentage of emergency department (ED) visits with a discharge diagnosis of influenza reported in NSSP was 0.1% during Week 33. The percentage of visits was 0.3% among those 0-4 years, and 0.1% among those 5-17 years, 18-64 years, and 65 years and older. RegionNationalRegion 1Region 2Region 3Region 4Region 5Region 6Region 7Region 8Region 9Region 10
Season2023-2024 & 2024-20252022-2023 Skip Over Chart Container
2.0%4.0%6.0%8.0%10.0%12.0%14.0%16.0%Percent of Emergency Department Visits for InfluenzaWeek 41 of 2023Week 45 of 2023Week 49 of 2023Week 1 of 2024Week 5 of 2024Week 9 of 2024Week 13 of 2024Week 17 of 2024Week 21 of 2024Week 25 of 2024Week 29 of 2024Week 33 of 2024Week 37 of 2024Week 41 of 2024Week 45 of 2024Week 49 of 2024Week 1 of 2025Week 5 of 2025Week 9 of 2025Week 13 of 2025Week 17 of 2025Week 21 of 2025Week 25 of 2025Week 29 of 2025Week 33 of 2025

Age Group

Skip Data Table
Data Table Download Data (CSV) Skipped data table.

Additional information about emergency department visits for flu for current and past seasons:‎‎‎

Surveillance Methods | Emergency Department Visits for COVID-19, flu, and RSV
Hospitalization surveillance

FluSurv-Net


The Influenza Hospitalization Surveillance Network (FluSurv-NET) conducts population-based surveillance for laboratory-confirmed influenza-related hospitalizations in select counties in 14 states and represents approximately 9% of the U.S. population. FluSurv-NET hospitalization data are preliminary. Patients admitted for laboratory-confirmed influenza-related hospitalization after April 30, 2025, will not be included in FluSurv-NET for the 2024-2025 season. Data on patients admitted through April 30, 2025, will continue to be updated on FluView Interactive as additional information is received.

Additional FluSurv-NET hospitalization surveillance information for current and past seasons and additional age groups:

Surveillance Methods | FluView Interactive: Rates by Age, Sex, and Race/Ethnicity or Data on Patient Characteristics | RESP-NET Interactive

National Healthcare Safety Network (NHSN) Hospital Respiratory Data


Hospitals report to NHSN the weekly number of patients with laboratory-confirmed influenza who were admitted to the hospital. Nationally, during Week 33, 738 (0.2 per 100,000 population) laboratory-confirmed influenza-associated hospitalizations were reported. When examining rates by age, the highest hospital admission rate per 100,000 population was among those 65 years and older (0.7), followed by those 50-64 years and 0-4 years (0.2 each).

Additional NHSN Hospital Respiratory Data information:

Surveillance Methods | Additional Data | FluView Interactive
Mortality surveillance

National Center for Health Statistics (NCHS) Mortality Surveillance


Based on NCHS mortality surveillance data available on August 21, 2025, 0.03% of the deaths that occurred during the week ending August 16, 2025 (Week 33) were due to influenza. The data presented are preliminary and may change as more data are received and processed.

Additional pneumonia, influenza and COVID-19 mortality surveillance information for current and past seasons:

Surveillance Methods | FluView Interactive

Influenza-Associated Pediatric Mortality


Five influenza-associated pediatric deaths occurring during the 2024-2025 season were reported to CDC during Week 33. The deaths occurred between Week 4 (the week ending January 25, 2025) and Week 21 (the week ending May 24, 2025). A total of 275 influenza-associated pediatric deaths occurring during the 2024-2025 season have been reported to CDC. This is the highest number of pediatric deaths reported in any non-pandemic influenza season since the condition became reportable in 2004.

Among children who were eligible for influenza vaccination and with known vaccine status, 90% of reported pediatric deaths this season (compared to 82% during the 2023-2024 season) have occurred in children who were not fully vaccinated against influenza.

Additional pediatric mortality surveillance information for current and past seasons:

Surveillance Methods | FluView Interactive
All data in this report are preliminary and may change as more reports are received.

A description of the CDC influenza surveillance system, including methodology and detailed descriptions of each data component, is available on the surveillance methods page.[SUP]1[/SUP]

Additional information on the current and previous influenza seasons for each surveillance component are available on FluView Interactive.

Additional National and International Influenza Surveillance Information

Additional surveillance information


FluView Interactive: FluView includes enhanced web-based interactive applications that can provide dynamic visuals of the influenza data collected and analyzed by CDC. These FluView Interactive applications allow people to create customized, visual interpretations of influenza data, as well as make comparisons across flu seasons, regions, age groups and a variety of other demographics.

National Institute for Occupational Safety and Health: Monthly surveillance data on the prevalence of health-related workplace absenteeism among full-time workers in the United States are available from NIOSH.

https://www.cdc.gov/fluview/surveillance/2025-week-33.html
 
Weekly US Influenza Surveillance Report: Key Updates for Week 34, ending August 23, 2025

For Everyone
Aug. 29, 2025

Key points


Seasonal influenza activity is low.
U.S. virologic surveillance

Clinical Laboratories


The results of tests performed by clinical laboratories nationwide are summarized below. Data from clinical laboratories (the percentage of specimens tested that are positive for influenza) are used to monitor whether influenza activity is increasing or decreasing. Nationally, during Week 34, the percentage of respiratory specimens testing positive for influenza virus in clinical laboratories was 0.4%.
No. of specimens tested32,7343,925,834
No. of positive specimens (%)123 (0.4%)489,328 (12.5%)
Positive specimens by type
Influenza A101 (82.1%)434,804 (88.9%)
Influenza B22 (17.9%)54,524 (11.1%)
View Larger
WHONPHL34.gif
Influenza Positive Tests Reported to CDC by Clinical Laboratories, National Summary, 2024-25 Season, week ending Aug. 23, 2025
View Chart Data

Public Health Laboratories


The results of tests performed by public health laboratories nationwide are summarized below. Data from public health laboratories are used to monitor the proportion of circulating viruses that belong to each influenza virus type/subtype/lineage. Viruses known to be associated with recent live attenuated influenza vaccine (LAIV) receipt or found upon further testing to be a vaccine virus are not included as they are not circulating influenza viruses.
No. of specimens tested353154,714
No. of positive specimens1699,931
Positive specimens by type/subtype
Influenza A15 (93.8%)94,004 (94.1%)
Subtyping Performed12 (80.0%)84,159 (89.5%)
(H1N1)pdm0911 (91.7%)44,646 (53.0%)
H3N21 (8.3%)39,434 (46.9%)
H3N2v00
H5079 (0.1%)
Subtyping not performed3 (20.0%)9,845 (10.5%)
Influenza B1 (6.3%)5,927 (5.9%)
Lineage testing performed03,323 (56.1%)
Yamagata lineage00
Victoria lineage03,323 (100%)
Lineage not performed1 (100%)2,604 (43.9%)
[SUB]*These data reflect specimens tested, and the number determined to be positive for influenza viruses at the public health labs (specimens tested is not the same as cases). The data do not reflect specimens tested only at CDC and could include more than one specimen tested per person. The guidance for avian influenza A(H5) virus testing recommends testing both a conjunctival and respiratory swab for people with conjunctivitis which has resulted in more specimens testing positive for avian influenza A(H5) virus than the number of human A(H5) cases. For more information on the number of people infected with avian influenza A(H5) viruses, please visit the "How CDC is monitoring influenza data among people to better understand the current avian influenza A (H5N1) situation"[/SUB]

[SUB][SUP]†[/SUP]When an influenza virus that normally circulates in swine (but not people) is detected in a person, it is called a "variant" influenza virus. Most human infections with variant influenza viruses occur following exposure to swine, but human-to-human transmission can occur. It is important to note that in most cases, variant influenza viruses have not shown the ability to spread easily and sustainably from human-to-human.[/SUB] View Larger
WHOPHL34.gif
This graph reflects the number of specimens tested and the number determined to be positive for influenza viruses at the public health lab (specimens tested is not the same as cases). It does not reflect specimens tested only at CDC and could include... Show More
View Chart Data

Additional virologic surveillance information for current and past seasons:

Surveillance Methods | FluView Interactive: National, Regional, and State Data or Age Data

Novel Influenza A Virus Infections


No confirmed human infections with influenza A(H5) virus were reported to CDC this week. To date, human-to-human transmission of avian influenza A(H5) virus (H5 bird flu) has not been identified in the United States.

The CSTE position statement, which includes updated case definitions for confirmed, probable, and suspected cases is available at http://www.cste.org/resource/resmgr/position_statements_files_2023/24-ID-09_Novel_Influenza_A.pdf.

An up-to-date human case summary during the current outbreak by state and exposure source is available at www.cdc.gov/bird-flu/situation-summary/index.html.

Information about avian influenza is available at https://www.cdc.gov/flu/avianflu/index.htm.

A(H5N1) virus interim recommendations for Prevention, Monitoring, and Public Health Investigations are available at https://www.cdc.gov/bird-flu/prevention/hpai-interim-recommendations.html.

The latest case reports on avian influenza outbreaks in wild birds, commercial poultry, backyard or hobbyist flocks, and mammals in the United States are available from the USDA at https://www.aphis.usda.gov/h5n1-hpai#detections-hpai.

Additional information regarding human infections with novel influenza A viruses:

Surveillance Methods | FluView Interactive
Outpatient and Emergency Department Illness Surveillance

Outpatient Respiratory Illness Visits


The U.S. Outpatient Influenza-like Illness Surveillance Network (ILINet) monitors outpatient visits for respiratory illness referred to as influenza-like illness [ILI (fever plus cough or sore throat)], not laboratory-confirmed influenza, and may capture respiratory illness visits due to infection with any pathogen that can present with similar symptoms, including influenza, SARS-CoV-2, and RSV. Therefore, it is important to evaluate syndromic surveillance data, including that from ILINet, in the context of other sources of surveillance data to obtain a complete and accurate picture of influenza, SARS-CoV-2, and other respiratory virus activity.

Nationally, during Week 34, 1.4% of patient visits reported through ILINet were due to respiratory illness that included fever plus a cough or sore throat, also referred to as ILI. Multiple respiratory viruses are co-circulating, and the relative contribution of influenza virus infection to ILI varies by location. View Larger
ILI34.gif
Percentage of Outpatient Visits for Respiratory Illness Reported by. The U.S. Outpatient Influenza-like Illness Surveillance Network (ILINet)

Outpatient Respiratory Illness Visits by Age Group


More than 70% of ILINet participants provide both the number of patient visits for respiratory illness and the total number of patient visits for the week broken out by age group. Data from this subset of providers are used to calculate the percentages of patient visits for respiratory illness by age group.

During Week 34, the percentage of visits for respiratory illness reported in ILINet was 4.4% among those 0-4 years, 2.3% among those 5-24 years, 1.2% among those 25-49 years, 0.8% among those 50-64 years, and 0.6% among those 65 years and older.

Outpatient Respiratory Illness Activity Map


Data collected in ILINet are used to produce a measure of ILI activity* by state/jurisdiction and Core Based Statistical Areas (CBSA).
Week 34
(Week ending
Aug. 23, 2025)
Week 33
(Week ending
Aug. 16, 2025)
Week 34
(Week ending
Aug. 23, 2025)
Week 33
(Week ending
Aug. 16, 2025)
Very High0000
High0010
Moderate0060
Low00226
Minimal5555655678
Insufficient Data00245245


[SUB]*Data collected in ILINet may disproportionally represent certain populations within a jurisdiction or CBSA, and therefore, may not accurately depict the full picture of influenza activity for the entire jurisdiction or CBSA. Differences in the data presented here by CDC and independently by some health departments likely represent differing levels of data completeness with data presented by the health department likely being the more complete.[/SUB]

Additional information about medically attended visits for ILI for current and past seasons:

Surveillance Methods | FluView Interactive: National, Regional, and State Data or ILI Activity Map

National Syndromic Surveillance System (NSSP)


The overall percentage of emergency department (ED) visits with a discharge diagnosis of influenza reported in NSSP was 0.1% during Week 34. The percentage of visits was 0.3% among those 0-4 and 5-17 years, and 0.1% among those 18-64 years and 65 years and older. RegionNationalRegion 1Region 2Region 3Region 4Region 5Region 6Region 7Region 8Region 9Region 10
Season2023-2024 & 2024-20252022-2023 Skip Over Chart Container
2.0%4.0%6.0%8.0%10.0%12.0%14.0%16.0%Percent of Emergency Department Visits for InfluenzaWeek 42 of 2023Week 46 of 2023Week 50 of 2023Week 2 of 2024Week 6 of 2024Week 10 of 2024Week 14 of 2024Week 18 of 2024Week 22 of 2024Week 26 of 2024Week 30 of 2024Week 34 of 2024Week 38 of 2024Week 42 of 2024Week 46 of 2024Week 50 of 2024Week 2 of 2025Week 6 of 2025Week 10 of 2025Week 14 of 2025Week 18 of 2025Week 22 of 2025Week 26 of 2025Week 30 of 2025Week 34 of 2025

Age Group

Skip Data Table
Data Table Download Data (CSV)
Skipped data table.

Additional information about emergency department visits for flu for current and past seasons:‎‎‎

Surveillance Methods | Emergency Department Visits for COVID-19, flu, and RSV
Hospitalization surveillance

FluSurv-Net


The Influenza Hospitalization Surveillance Network (FluSurv-NET) conducts population-based surveillance for laboratory-confirmed influenza-related hospitalizations in select counties in 14 states and represents approximately 9% of the U.S. population. FluSurv-NET hospitalization data are preliminary. Patients admitted for laboratory-confirmed influenza-related hospitalization after April 30, 2025, will not be included in FluSurv-NET for the 2024-2025 season. Data on patients admitted through April 30, 2025, will continue to be updated on FluView Interactive as additional information is received.

Additional FluSurv-NET hospitalization surveillance information for current and past seasons and additional age groups:

Surveillance Methods | FluView Interactive: Rates by Age, Sex, and Race/Ethnicity or Data on Patient Characteristics | RESP-NET Interactive

National Healthcare Safety Network (NHSN) Hospital Respiratory Data


Hospitals report to NHSN the weekly number of patients with laboratory-confirmed influenza who were admitted to the hospital. Nationally, during Week 34, 725 (0.2 per 100,000 population) laboratory-confirmed influenza-associated hospitalizations were reported. When examining rates by age, the highest hospital admission rate per 100,000 population was among those 65 years and older (0.7), followed by those 50-64 years and 0-4 years (0.2 each).

Additional NHSN Hospital Respiratory Data information:

Surveillance Methods | Additional Data | FluView Interactive
Mortality surveillance

National Center for Health Statistics (NCHS) Mortality Surveillance


Based on NCHS mortality surveillance data available on August 28, 2025, 0.03% of the deaths that occurred during the week ending August 23, 2025 (Week 34) were due to influenza. The data presented are preliminary and may change as more data are received and processed.

Additional pneumonia, influenza and COVID-19 mortality surveillance information for current and past seasons:

Surveillance Methods | FluView Interactive

Influenza-Associated Pediatric Mortality


Three influenza-associated pediatric deaths occurring during the 2024-2025 season were reported to CDC during Week 34. The deaths occurred during weeks 7, 13 and 23 (the weeks ending February 15, March 29, and June 7, 2025, respectively). A total of 278 influenza-associated pediatric deaths occurring during the 2024-2025 season have been reported to CDC. This is the highest number of pediatric deaths reported in any non-pandemic influenza season since the condition became reportable in 2004. Among children who were eligible for influenza vaccination and with known vaccine status, 90% of reported pediatric deaths this season (compared to 82% during the 2023-2024 season) have occurred in children who were not fully vaccinated against influenza.

One death that occurred during the 2023-2024 season during week 4 (the week ending January 27, 2024) was also reported. This brings the total number of pediatric deaths for last season to 210.

Additional pediatric mortality surveillance information for current and past seasons:

Surveillance Methods | FluView Interactive
All data in this report are preliminary and may change as more reports are received.

A description of the CDC influenza surveillance system, including methodology and detailed descriptions of each data component, is available on the surveillance methods page.[SUP]1[/SUP]

Additional information on the current and previous influenza seasons for each surveillance component are available on FluView Interactive.

Additional National and International Influenza Surveillance Information

Additional surveillance information


FluView Interactive: FluView includes enhanced web-based interactive applications that can provide dynamic visuals of the influenza data collected and analyzed by CDC. These FluView Interactive applications allow people to create customized, visual interpretations of influenza data, as well as make comparisons across flu seasons, regions, age groups and a variety of other demographics.

National Institute for Occupational Safety and Health: Monthly surveillance data on the prevalence of health-related workplace absenteeism among full-time workers in the United States are available from NIOSH.

https://www.cdc.gov/fluview/surveillance/2025-week-34.html
 
Back
Top