• FluTrackers.com Inc. does not provide medical advice. Information on this web site is collected from various internet resources, and the FluTrackers board of directors makes no warranty to the safety, efficacy, correctness or completeness of the information posted on this site by any author or poster. The information collated here is for instructional and/or discussion purposes only and is NOT intended to diagnose or treat any disease, illness, or other medical condition. Every individual reader or poster should seek advice from their personal physician/healthcare practitioner before considering or using any interventions that are discussed on this website. By continuing to access this website you agree to consult your personal physican before using any interventions posted on this website, and you agree to hold harmless FluTrackers.com Inc., the board of directors, the members, and all authors and posters for any effects from use of any medication, supplement, vitamin or other substance, device, intervention, etc. mentioned in posts on this website, or other internet venues referenced in posts on this website.
  • We are not asking for any donations. Do not donate to any entity who says they are raising funds for us.

US FluView - Weekly Surveillance Flu report 2024/2025 season - for trend analysis

Lance

MPH, CSP & CIT Retired, CHMM Emeritus
For previous season please see:

US FluView - Weekly Surveillance Flu report 2023/2024 season - for trend analysis

-----------------------------------------


Weekly US Influenza Surveillance Report: Key Updates for Week 40, ending October 5, 2024

What to know


Seasonal influenza activity remains low nationally.
Summary

Viruses

Clinical Lab 0.7% (Trend
StableArrow.png
)
positive for influenza
this week. Public Health Lab Influenza A(H1N1)pdm09 and A(H3N2)
viruses were co-circulating this week.

Illness

Outpatient Respiratory Illness

1.9% (Trend
StableArrow.png
)
of visits to a health care provider this
week were for respiratory illness
(below baseline).

Activity Map

0 moderate jurisdictions 0 high or very high jurisdictions

FluSurv-NET

0 per 100,000
weekly hospitalization rate

NCHS Mortality

0.06% (Trend
StableArrow.png
)
of deaths attributed to influenza this week.

Pediatric Deaths

0 influenza-associated deaths
reported this week.
All data are preliminary and may change as more reports are received.

Directional arrows indicate changes between the current week and the previous week. Additional information on the arrows can be found at the bottom of this page.


A description of the CDC influenza surveillance system, including methodology and detailed descriptions of each data component is available on the surveillance methods page.1

Additional information on the current and previous influenza seasons for each surveillance component are available on FluView Interactive.


Key Points‎


• Seasonal influenza activity is low nationally.

• Percent positivity for influenza and the percentage of emergency department visits for influenza are stable at low levels.

• During Week 40, all 56 viruses reported by public health laboratories were influenza A. Of the 43 influenza A viruses subtyped during Week 40, 24 (55.8%) were influenza A(H1N1)pdm09 and 19 (44.2%) were A(H3N2).

• Two human infections with influenza A(H5) virus were reported by the California Department of Public Health.

• No influenza-associated pediatric deaths occurring during the 2024-2025 season were reported to CDC during Week 40.

• CDC recommends that everyone ages 6 months and older get an annual influenza (flu) vaccine, ideally by the end of October.[SUP]1[/SUP]

• There are prescription flu antiviral drugs that can treat flu illness; those should be started as early as possible and are especially important for higher risk patients.2

• Influenza viruses are among several viruses contributing to respiratory disease activity. CDC is providing updated, integrated information about COVID-19, flu, and respiratory syncytial virus (RSV) activity on a weekly basis.


COVID-19, flu, and RSV activity


U.S. virologic surveillance


Nationally and in HHS regions 1 through 9, the percentage of respiratory specimens testing positive for influenza virus in clinical laboratories remained stable (change of <0.5 percentage points) compared to the previous week. In Region 10, the percent positive increased slightly compared to the previous week. Influenza A(H1N1)pdm09 and A(H3N2) viruses are co-circulating; however, the distribution of circulating viruses varies by region. For regional and state level data and age group distribution, please visit FluView Interactive. Viruses known to be associated with recent receipt of live attenuated influenza vaccine (LAIV) or found upon further testing to be a vaccine virus are not included, as they are not circulating influenza viruses. Clinical Laboratories


The results of tests performed by clinical laboratories nationwide are summarized below. Data from clinical laboratories (the percentage of specimens tested that are positive for influenza virus) are used to monitor whether influenza activity is increasing or decreasing.
No. of specimens tested53,69953,424
No. of positive specimens (%)380 (0.7%)264 (0.5%)
Positive specimens by type
Influenza A333 (87.6%)208 (78.8%)
Influenza B47 (12.4%)56 (21.2%)
Public Health Laboratories


The results of tests performed by public health laboratories nationwide are summarized below. Data from public health laboratories are used to monitor the proportion of circulating influenza viruses that belong to each influenza subtype/lineage.
No. of specimens tested6381,113
No. of positive specimens56154
Positive specimens by type/subtype
Influenza A56 (100.0%)147 (95.5%)
Subtyping Performed43 (76.8%)135 (91.8%)
(H1N1)pdm0924 (55.8%)69 (51.1%)
H3N219 (44.2%)66 (48.9%)
H3N2v[SUP]†[/SUP]00
H5*00
Subtyping not performed13 (23.2%)12 (8.2%)
Influenza B07 (4.5%)
Lineage testing performed07 (100.0%)
Yamagata lineage00
Victoria lineage07 (100.0%)
Lineage testing not performed00
[SUB]*These data reflect specimens tested, and the number determined to be positive for influenza viruses at the public health labs (specimens tested is not the same as cases). The data do not reflect specimens tested only at CDC and could include more than one specimen tested per person. The guidance for influenza A/H5 virus testing recommends testing both a conjunctival and respiratory swab for people with conjunctivitis which has resulted in more specimens testing positive for influenza A/H5 virus than the number of human H5 cases. For more information on the number of people infected with A/H5 viruses, please visit the [/SUB][SUB]"How CDC is monitoring influenza data among people to better understand the current avian influenza A (H5N1) situation"[/SUB]

[SUP]†[/SUP][SUB]When an influenza virus that normally circulates in swine (but not people) is detected in a person, it is called a "variant" influenza virus. Most human infections with variant influenza viruses occur following exposure to swine, but human-to-human transmission can occur. It is important to note that in most cases, variant influenza viruses have not shown the ability to spread easily and sustainably from person to person.[/SUB]


[SUB]*This graph reflects the number of specimens tested and the number determined to be positive for influenza viruses at the public health lab (specimens tested is not the same as cases). It does not reflect specimens tested only at CDC and could include more than one specimen tested per person. Specimens tested as part of routine influenza surveillance as well as those tested as part of targeted testing for people exposed to influenza A(H5) are included.[/SUB]

Additional virologic surveillance information for current and past seasons:‎

Surveillance Methods | FluView Interactive: National, Regional, and State Data or Age Data

Novel Influenza A Virus Infections


Two human infections with influenza A(H5) viruses were reported to CDC this week by the California Department of Public Health. These cases are associated with an ongoing outbreak of HPAI A(H5N1) virus in dairy cows.

Both individuals are aged >18 years and work at commercial dairy cattle farms where highly pathogenic avian influenza (HPAI) A(H5N1) virus had been detected in cows. These individuals work on different farms and there is no known link or contact between them or between the two cases reported from California last week. These individuals had mild symptoms which they reported to the local health department. Specimens were collected from both persons and were initially tested at the local public health laboratory using the Centers for Disease Control and Prevention (CDC) influenza A(H5) assay before being sent to CDC for further testing. Specimens from both individuals were positive for influenza A(H5) virus using diagnostic rRT-PCR at CDC. Additional analysis including genetic sequencing is underway.

In response to these detections, additional case investigations and surveillance activities are being conducted by public health officials.

Eighteen cases of human infections with influenza A(H5) viruses have been reported in the United States during 2024. Eight of these occurred in individuals working with dairy cows, nine in individuals associated with poultry depopulation and disposal, and one in an individual with an unknown source of exposure. An ongoing outbreak of avian influenza A(H5N1) continues in domestic dairy cows and poultry, and monitoring for additional human cases is ongoing.

Information about avian influenza is available at https://www.cdc.gov/flu/avianflu/index.htm.

Interim recommendations for Prevention, Monitoring, and Public Health Investigations are available at https://www.cdc.gov/bird-flu/prevention/hpai-interim-recommendations.html.

The latest case reports on avian influenza outbreaks in wild birds, commercial poultry, backyard or hobbyist flocks, and mammals in the United States are available from the USDA at https://www.aphis.usda.gov/aphis/ou...e-information/avian/avian-influenza/2022-hpai.

Additional information regarding human infections with novel influenza A viruses:‎

Surveillance Methods | FluView Interactive


Influenza Virus Characterization


CDC performs genetic and antigenic characterization of U.S. viruses submitted from state and local public health laboratories according to the Right Size Roadmap submission guidance. These data are used to compare how similar the currently circulating influenza viruses are to the reference viruses representing the current season's influenza vaccines. The data are also used to monitor evolutionary changes that continually occur in influenza viruses circulating in humans. CDC also tests susceptibility of circulating influenza viruses to antiviral medications including the neuraminidase inhibitors (oseltamivir, zanamivir, and peramivir) and the polymerase acidic protein (PA) endonuclease inhibitor baloxavir. The HA clade and subclades were assigned using Nextclade (Nextclade (nextstrain.org).

CDC has genetically characterized 571 influenza viruses collected since May 19, 2024.
A/H1197
5a.2a93 (47.2%)C.11 (0.5%)
C.1.992 (46.7%)
5a.2a.1104 (52.8%)C.1.12 (1.0%)
D92 (46.7%)
D.21 (0.5%)
D.35 (2.5%)
D.44 (2.0%)
A/H3310
2a.3a1 (0.3%)G.1.3.11 (0.3%)
2a.3a.1309 (99.7%)J.110 (3.2%)
J.2299 (96.5%)
B/Victoria64
3a.264 (100.0%)C.51 (1.6%)
C.5.151 (79.7%)
C.5.68 (12.5%)
C.5.74 (6.3%)
B/Yamagata0
Y30Y30
CDC antigenically characterizes influenza viruses by hemagglutination inhibition (HI) assay (H1N1pdm09, H3N2, and B/Victoria viruses) or neutralization-based HINT (H3N2 viruses) using antisera that ferrets make after being infected with reference viruses representing the 2024-2025 Northern Hemisphere recommended cell or recombinant-based influenza vaccine viruses. Antigenic differences between viruses are determined by comparing how well the antibodies made against the vaccine reference viruses recognize the circulating viruses that have been grown in cell culture. Ferret antisera are useful because antibodies raised against a particular virus can often recognize small changes in the surface proteins of other viruses. In HI assays, viruses with similar antigenic properties have antibody titer differences of less than or equal to 4-fold when compared to the reference (vaccine) virus. In HINT, viruses with similar antigenic properties have antibody neutralization titer differences of less than or equal to 8-fold. Viruses selected for antigenic characterization are a subset of the recent genetically characterized viruses and are chosen based on the genetic changes in their surface proteins and may not be proportional to the number of such viruses circulating in the United States. Influenza A Viruses
  • A (H1N1)pdm09: 54 A(H1N1)pdm09 viruses were antigenically characterized by HI, and 53 (98.1%) were well-recognized (reacting at titers that were within 4-fold of the homologous virus titer) by ferret antisera to cell-grown A/Wisconsin/67/2022-like reference viruses representing the A(H1N1)pdm09 component for the cell- and recombinant-based influenza vaccines.
  • A (H3N2): 118 A(H3N2) viruses were antigenically characterized by HI or HINT, and 95 (80.5%) were well-recognized (reacting at titers that were within 4-fold of the homologous virus titer in HI or reacting at titers that were less than or equal to 8-fold of the homologous virus in HINT) by ferret antisera to cell-grown A/Massachusetts/18/2022-like reference viruses representing the A(H3N2) component for the cell- and recombinant-based influenza vaccines.
Influenza B Viruses
  • B/Victoria: 24 influenza B/Victoria-lineage virus were antigenically characterized by HI, and all were well-recognized (reacting at titers that were within 4-fold of the homologous virus titer) by ferret antisera to cell-grown B/Austria/1359417/2021-like reference viruses representing the B/Victoria component for the cell- and recombinant-based influenza vaccines.
  • B/Yamagata: No influenza B/Yamagata-lineage viruses were available for antigenic characterization.
Assessment of Virus Susceptibility to Antiviral Medications


CDC assesses susceptibility of influenza viruses to the antiviral medications including the neuraminidase inhibitors (oseltamivir, zanamivir, and peramivir) and the PA endonuclease inhibitor baloxavir using next generation sequence analysis supplemented by laboratory assays. Information about antiviral susceptibility test methods can be found at U.S. Influenza Surveillance: Purpose and Methods.

Viruses collected in the United States since May 19, 2024, were tested for antiviral susceptibility are as follows:
Neuraminidase InhibitorsOseltamivirViruses Tested55919430560
Reduced Inhibition0000
Highly Reduced Inhibition2 (0.4%)2 (1.0%)00
PeramivirViruses Tested55919430560
Reduced Inhibition0000
Highly Reduced Inhibition2 (0.4%)2 (1.0%)00
ZanamivirViruses Tested55919430560
Reduced Inhibition0000
Highly Reduced Inhibition0000
PA Cap-Dependent Endonuclease InhibitorBaloxavirViruses Tested54517730464
Decreased Susceptibility0000
Two A(H1N1)pdm09 viruses had NA-H275Y amino acid substitution conferring highly reduced inhibition by oseltamivir and peramivir.

High levels of resistance to the adamantanes (amantadine and rimantadine) persist among influenza A(H1N1)pdm09 and influenza A(H3N2) viruses (the adamantanes are not effective against influenza B viruses). Therefore, use of these antivirals for treatment and prevention of influenza virus infection is not recommended and data from adamantane resistance testing are not presented.

Outpatient and Emergency Department Illness Surveillance

Outpatient respiratory illness visits


The U.S. Outpatient Influenza-like Illness Surveillance Network (ILINet) monitors outpatient visits for respiratory illness referred to as influenza-like illness [ILI (fever plus cough or sore throat)], not laboratory-confirmed influenza, and will therefore capture respiratory illness visits due to infection with any pathogen that can present with similar symptoms, including influenza virus, SARS-CoV-2, and RSV. It is important to evaluate syndromic surveillance data, including that from ILINet, in the context of other sources of surveillance data to obtain a complete and accurate picture of influenza, SARS-CoV-2, and other respiratory virus activity.

Nationally, during Week 40, 1.9% of patient visits reported through ILINet were due to respiratory illness that included fever plus a cough or sore throat, also referred to as ILI. This week's percentage remained stable (change of ≤ 0.1 percentage points) compared to Week 39 and is below the national baseline of 3.0%. All 10 HHS regions are below their respective baselines. The percentage of visits for ILI remained stable in regions 1, 3, 4, 5, 7, 8, and 9, increased slightly in regions 6 and 10, and decreased slightly in region 2 in Week 40 compared to Week 39. Multiple respiratory viruses are co-circulating, and the relative contribution of influenza virus infection to ILI varies by location.

Outpatient respiratory illness visits by age group


About 70% of ILINet participants provide both the number of patient visits for respiratory illness and the total number of patient visits for the week broken out by age group. Based on these data, the percentage of visits for respiratory illness decreased for two age groups (0-4 years, 50-64 years) and remained stable (change of ≤ 0.1 percentage point) for three age groups (5-24, 25-49 years, and 65+ years) in Week 40 compared to Week 39.
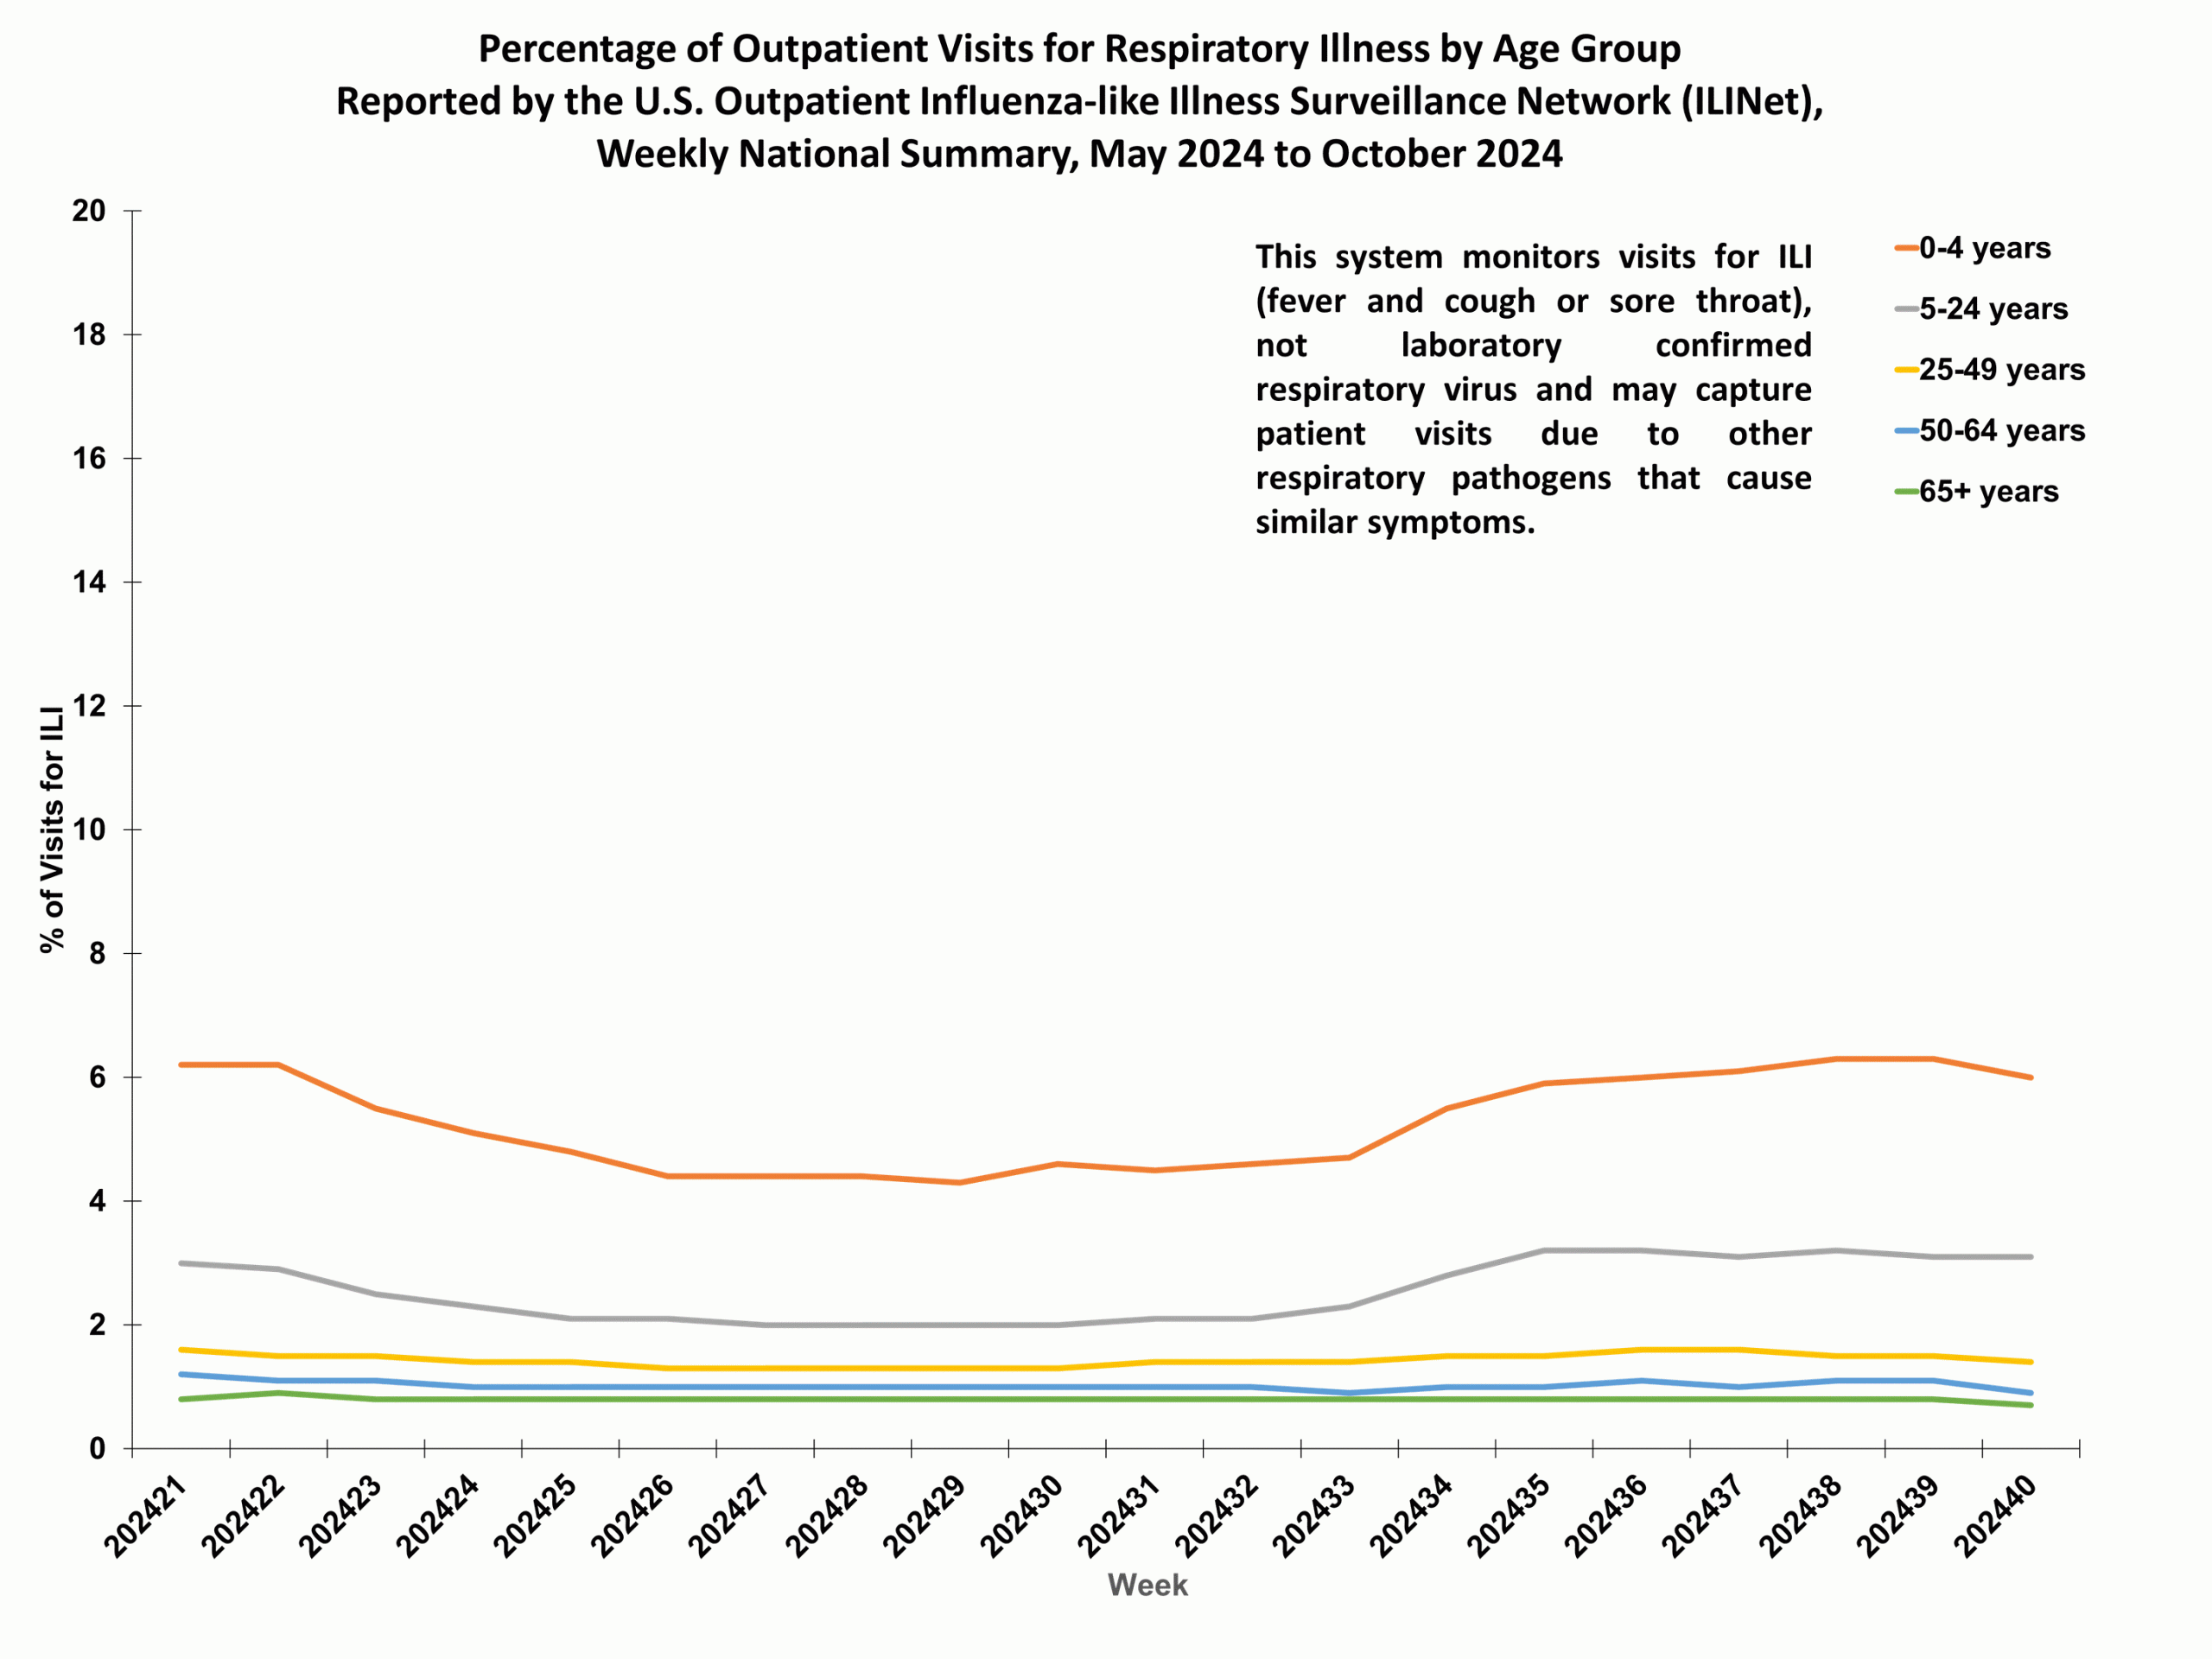
ILIAge40.gif
ILINet Age Rates Week 40 Outpatient respiratory illness activity map


Data collected in ILINet are used to produce a measure of ILI activity* by state/jurisdiction and Core Based Statistical Areas (CBSA).
Week 40
(Week ending
Oct. 5, 2024)
Week 39
(Week ending
Sep. 28, 2024)
Week 40
(Week ending
Oct. 5, 2024)
Week 39
(Week ending
Sep. 28, 2024)
Very High0000
High0002
Moderate0032
Low012929
Minimal5554672646
Insufficient Data00225250
*Data collected in ILINet may disproportionally represent certain populations within a jurisdiction or CBSA, and therefore, may not accurately depict the full picture of influenza activity for the entire jurisdiction or CBSA. Differences in the data presented here by CDC and independently by some health departments likely represent differing levels of data completeness with data presented by the health department likely being the more complete. Additional information about medically attended visits for ILI for current and past seasons:‎

Surveillance Methods | FluView Interactive: National, Regional, and State Data or ILI Activity Map National Syndromic Surveillance System (NSSP)


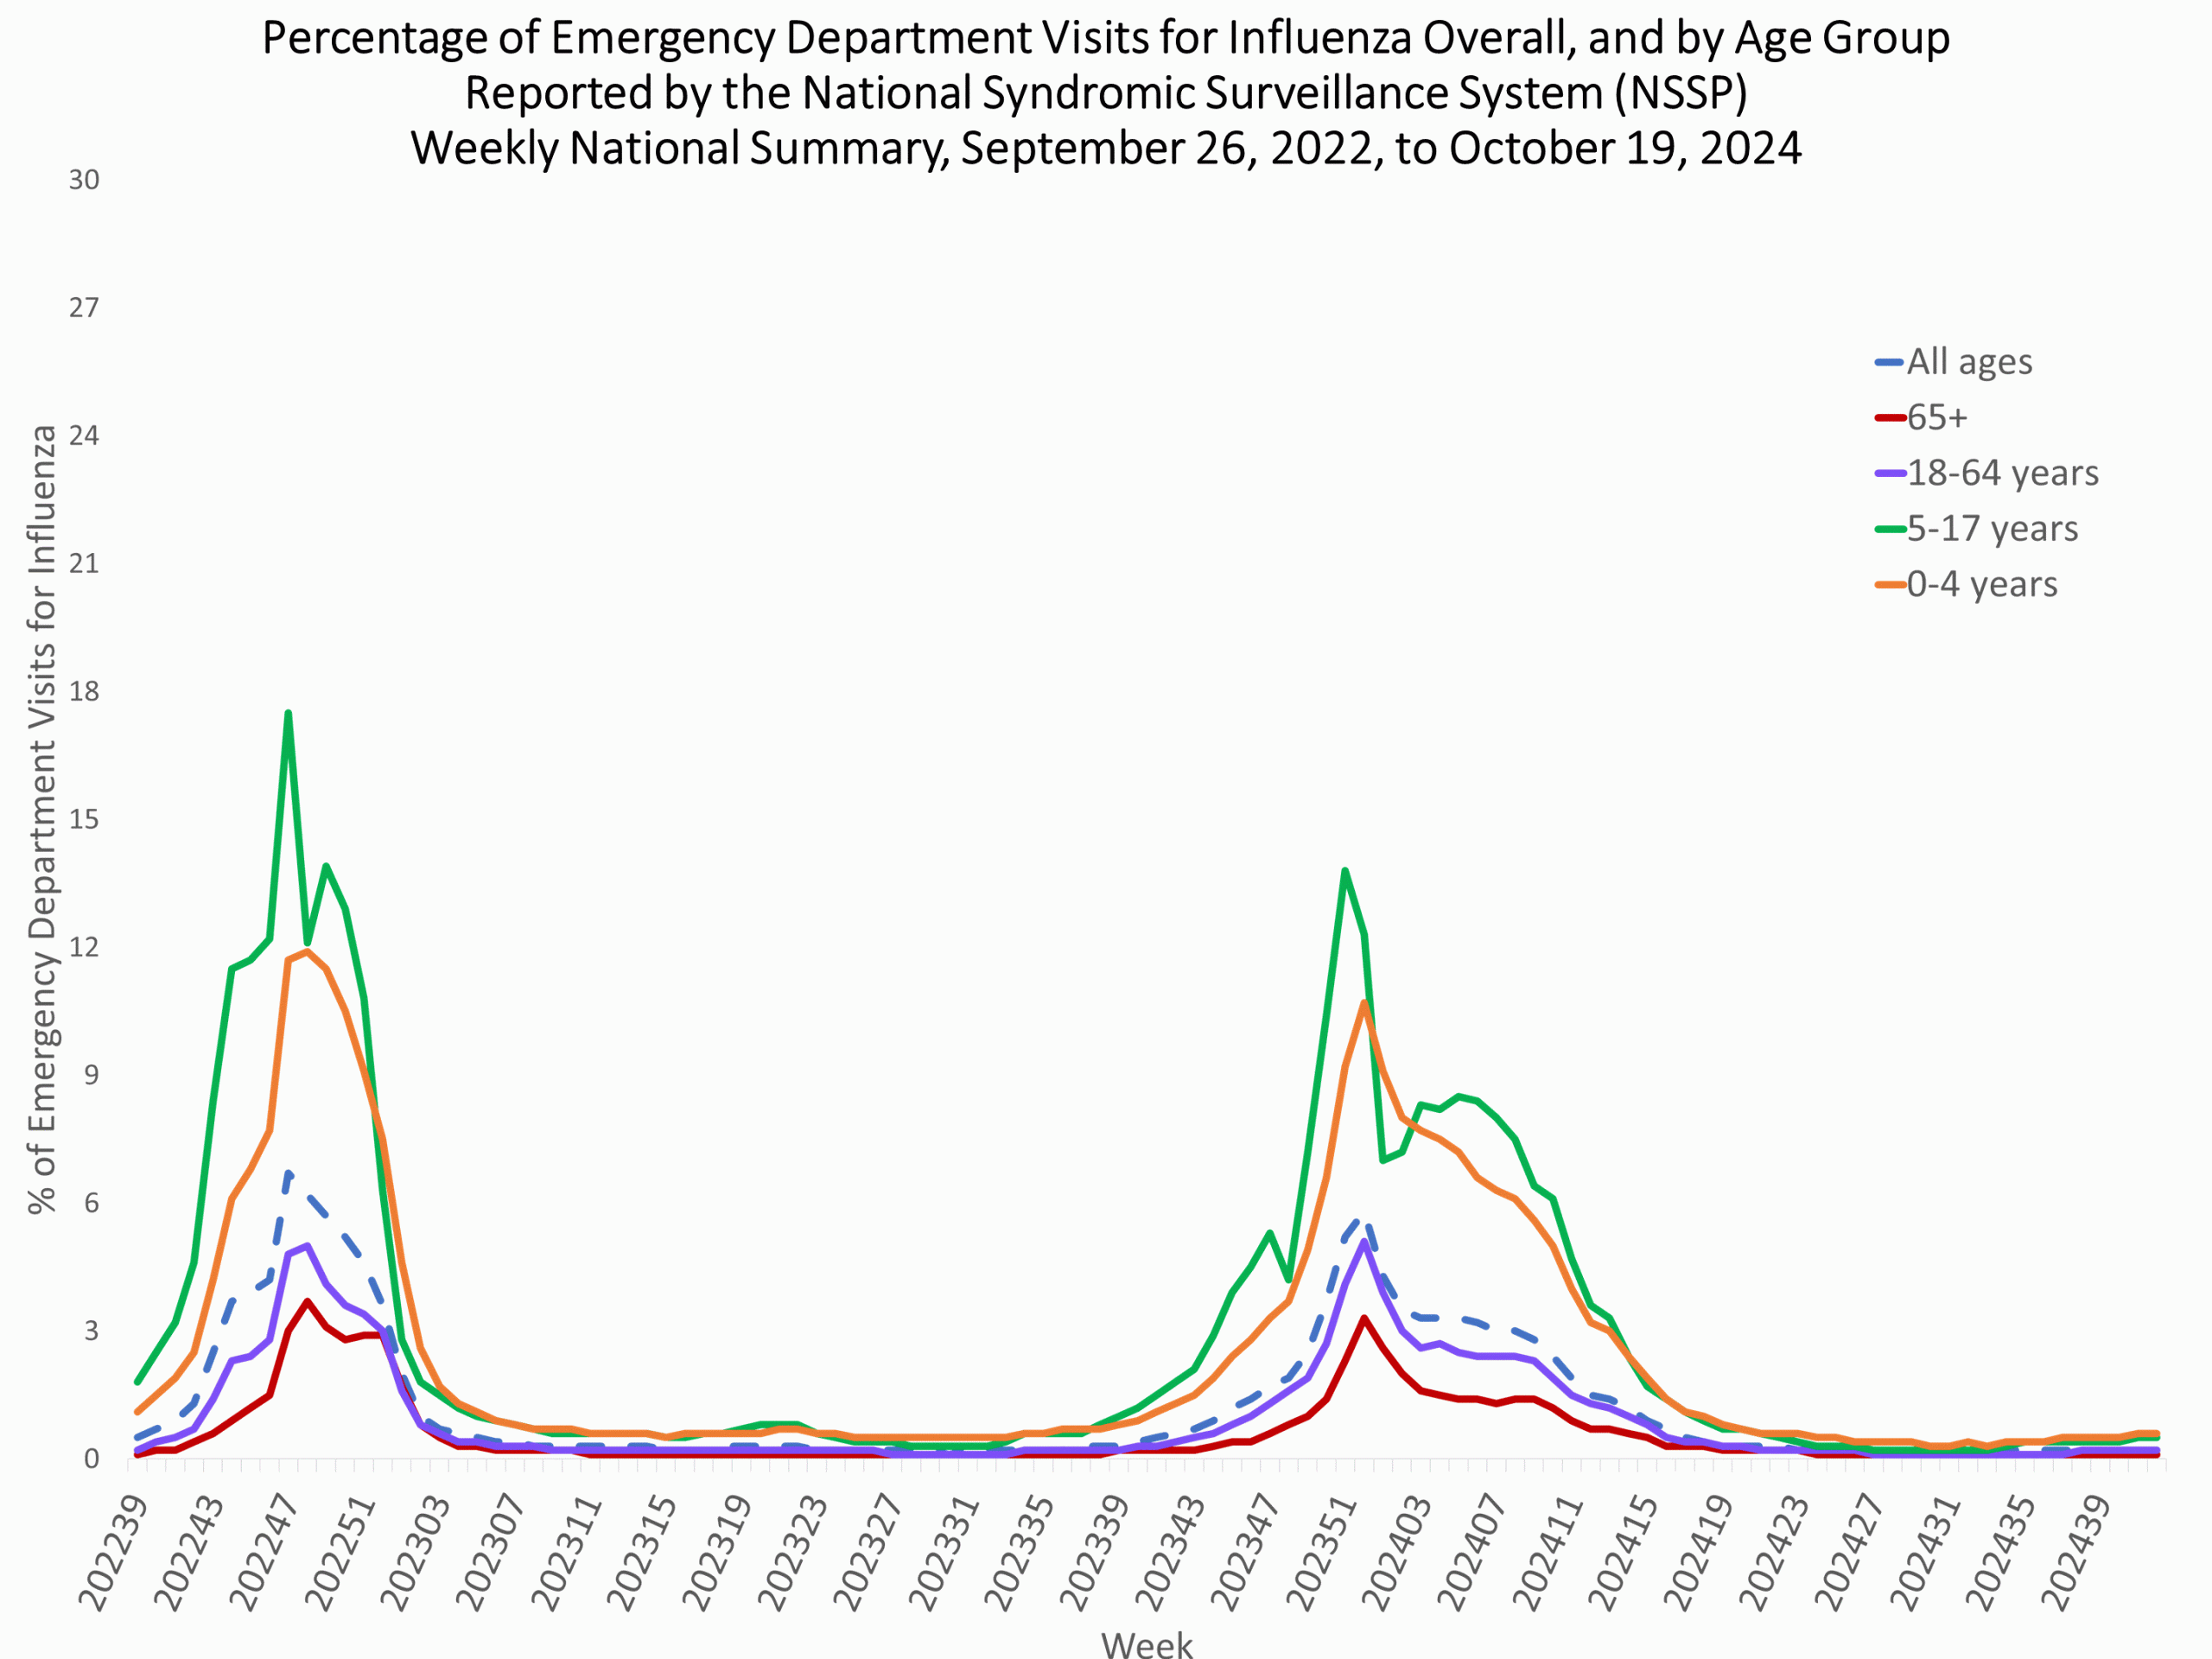
The percentage of emergency department (ED) visits with a discharge diagnosis of influenza reported in NSSP was 0.2% overall during Week 40. This week's percentage remained stable overall and among all age groups compared to the previous week.
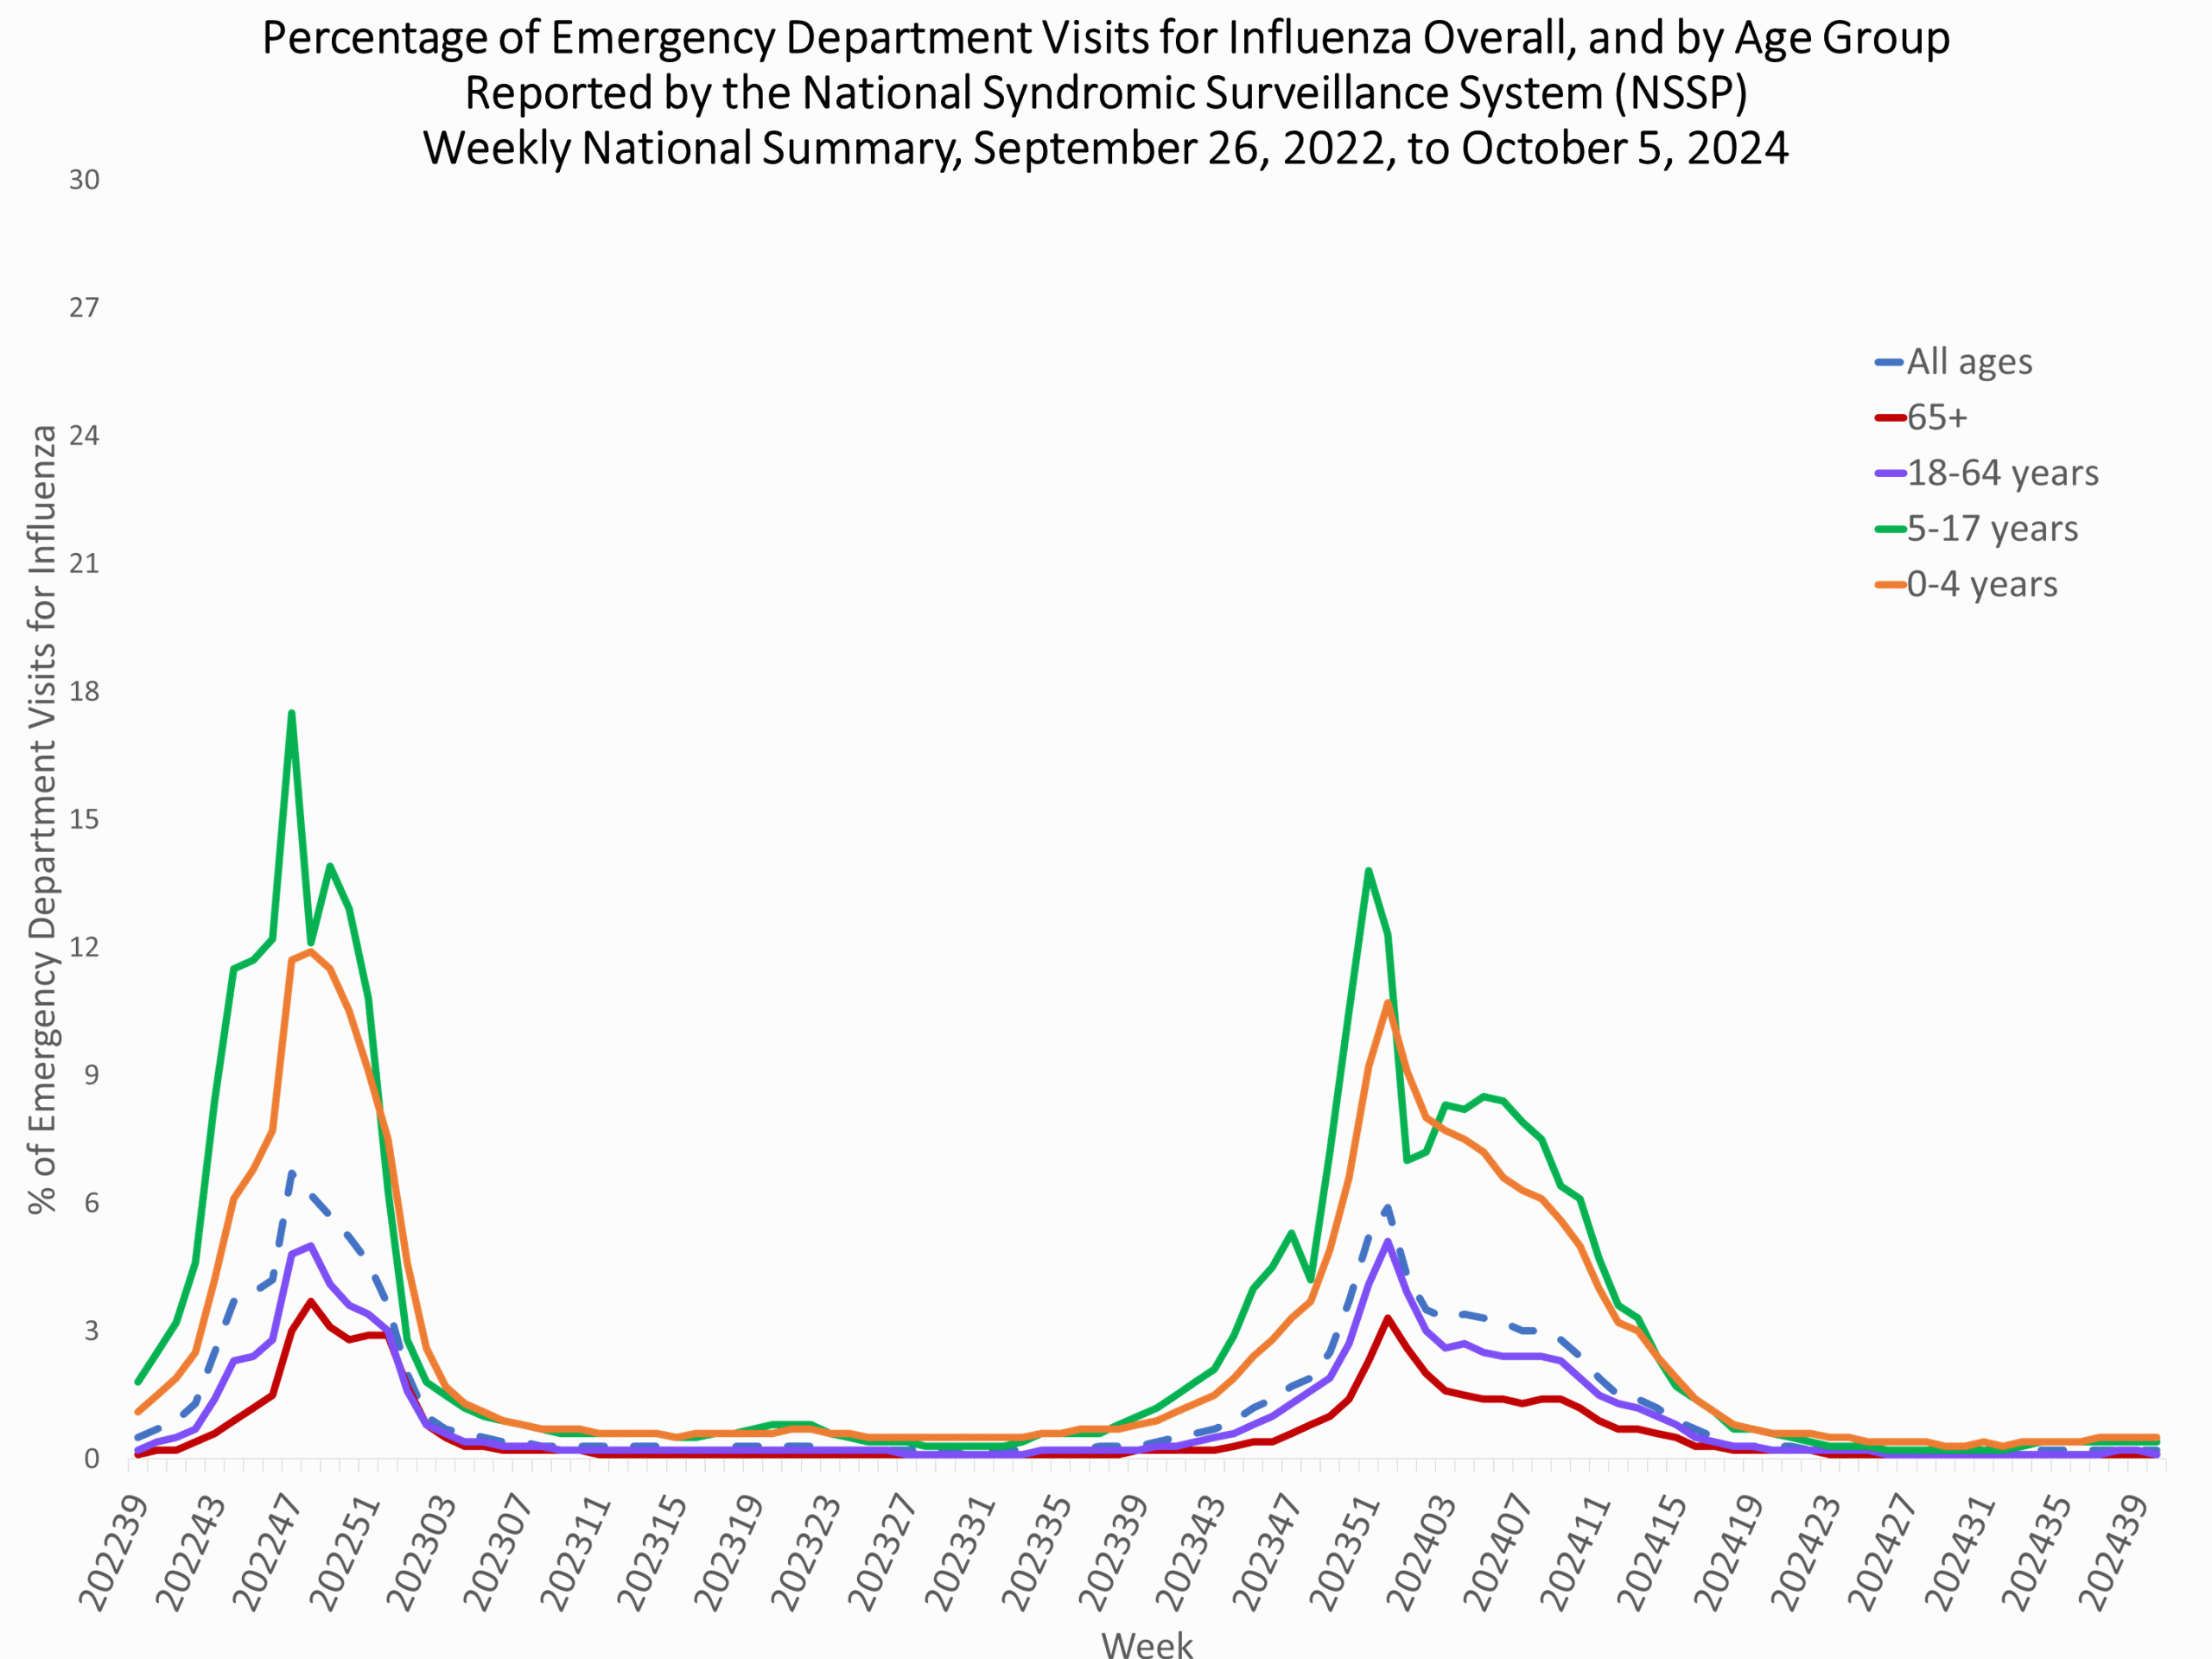
NSSP40.gif
NSSP Age Rates Week 40 Additional information about emergency department visits for flu for current and past seasons:‎

Surveillance Methods | Emergency Department Visits for COVID-19, flu, and RSV
Hospitalization surveillance

FluSurv-Net


The Influenza Hospitalization Surveillance Network (FluSurv-NET) conducts population-based surveillance for laboratory-confirmed influenza-related hospitalizations in select counties in 14 states and represents approximately 9% of the U.S. population. FluSurv-NET hospitalization data are preliminary.

A total of 15 laboratory-confirmed influenza-associated hospitalizations were reported by FluSurv-NET sites between October 1 (the start of FluSurv-NET enrollment for the 2024-2025 season) and October 5, 2024. The weekly hospitalization rate observed in week 40 was 0.0 per 100,000 population.

[SUB]**In this figure, weekly rates for all seasons prior to the 2024-2025 season reflect end-of-season rates. For the 2024-2025 season, rates for recent hospital admissions are subject to reporting delays and are shown as a dashed line for the current season. As hospitalization data are received each week, prior case counts and rates are updated accordingly.[/SUB]

Additional FluSurv-NET hospitalization surveillance information for current and past seasons and additional age groups:‎

Surveillance Methods | FluView Interactive: Rates by Age, Sex, and Race/Ethnicity or Data on Patient Characteristics | RESP-NET Interactive

National healthcare safety network (NHSN) hospitalization surveillance


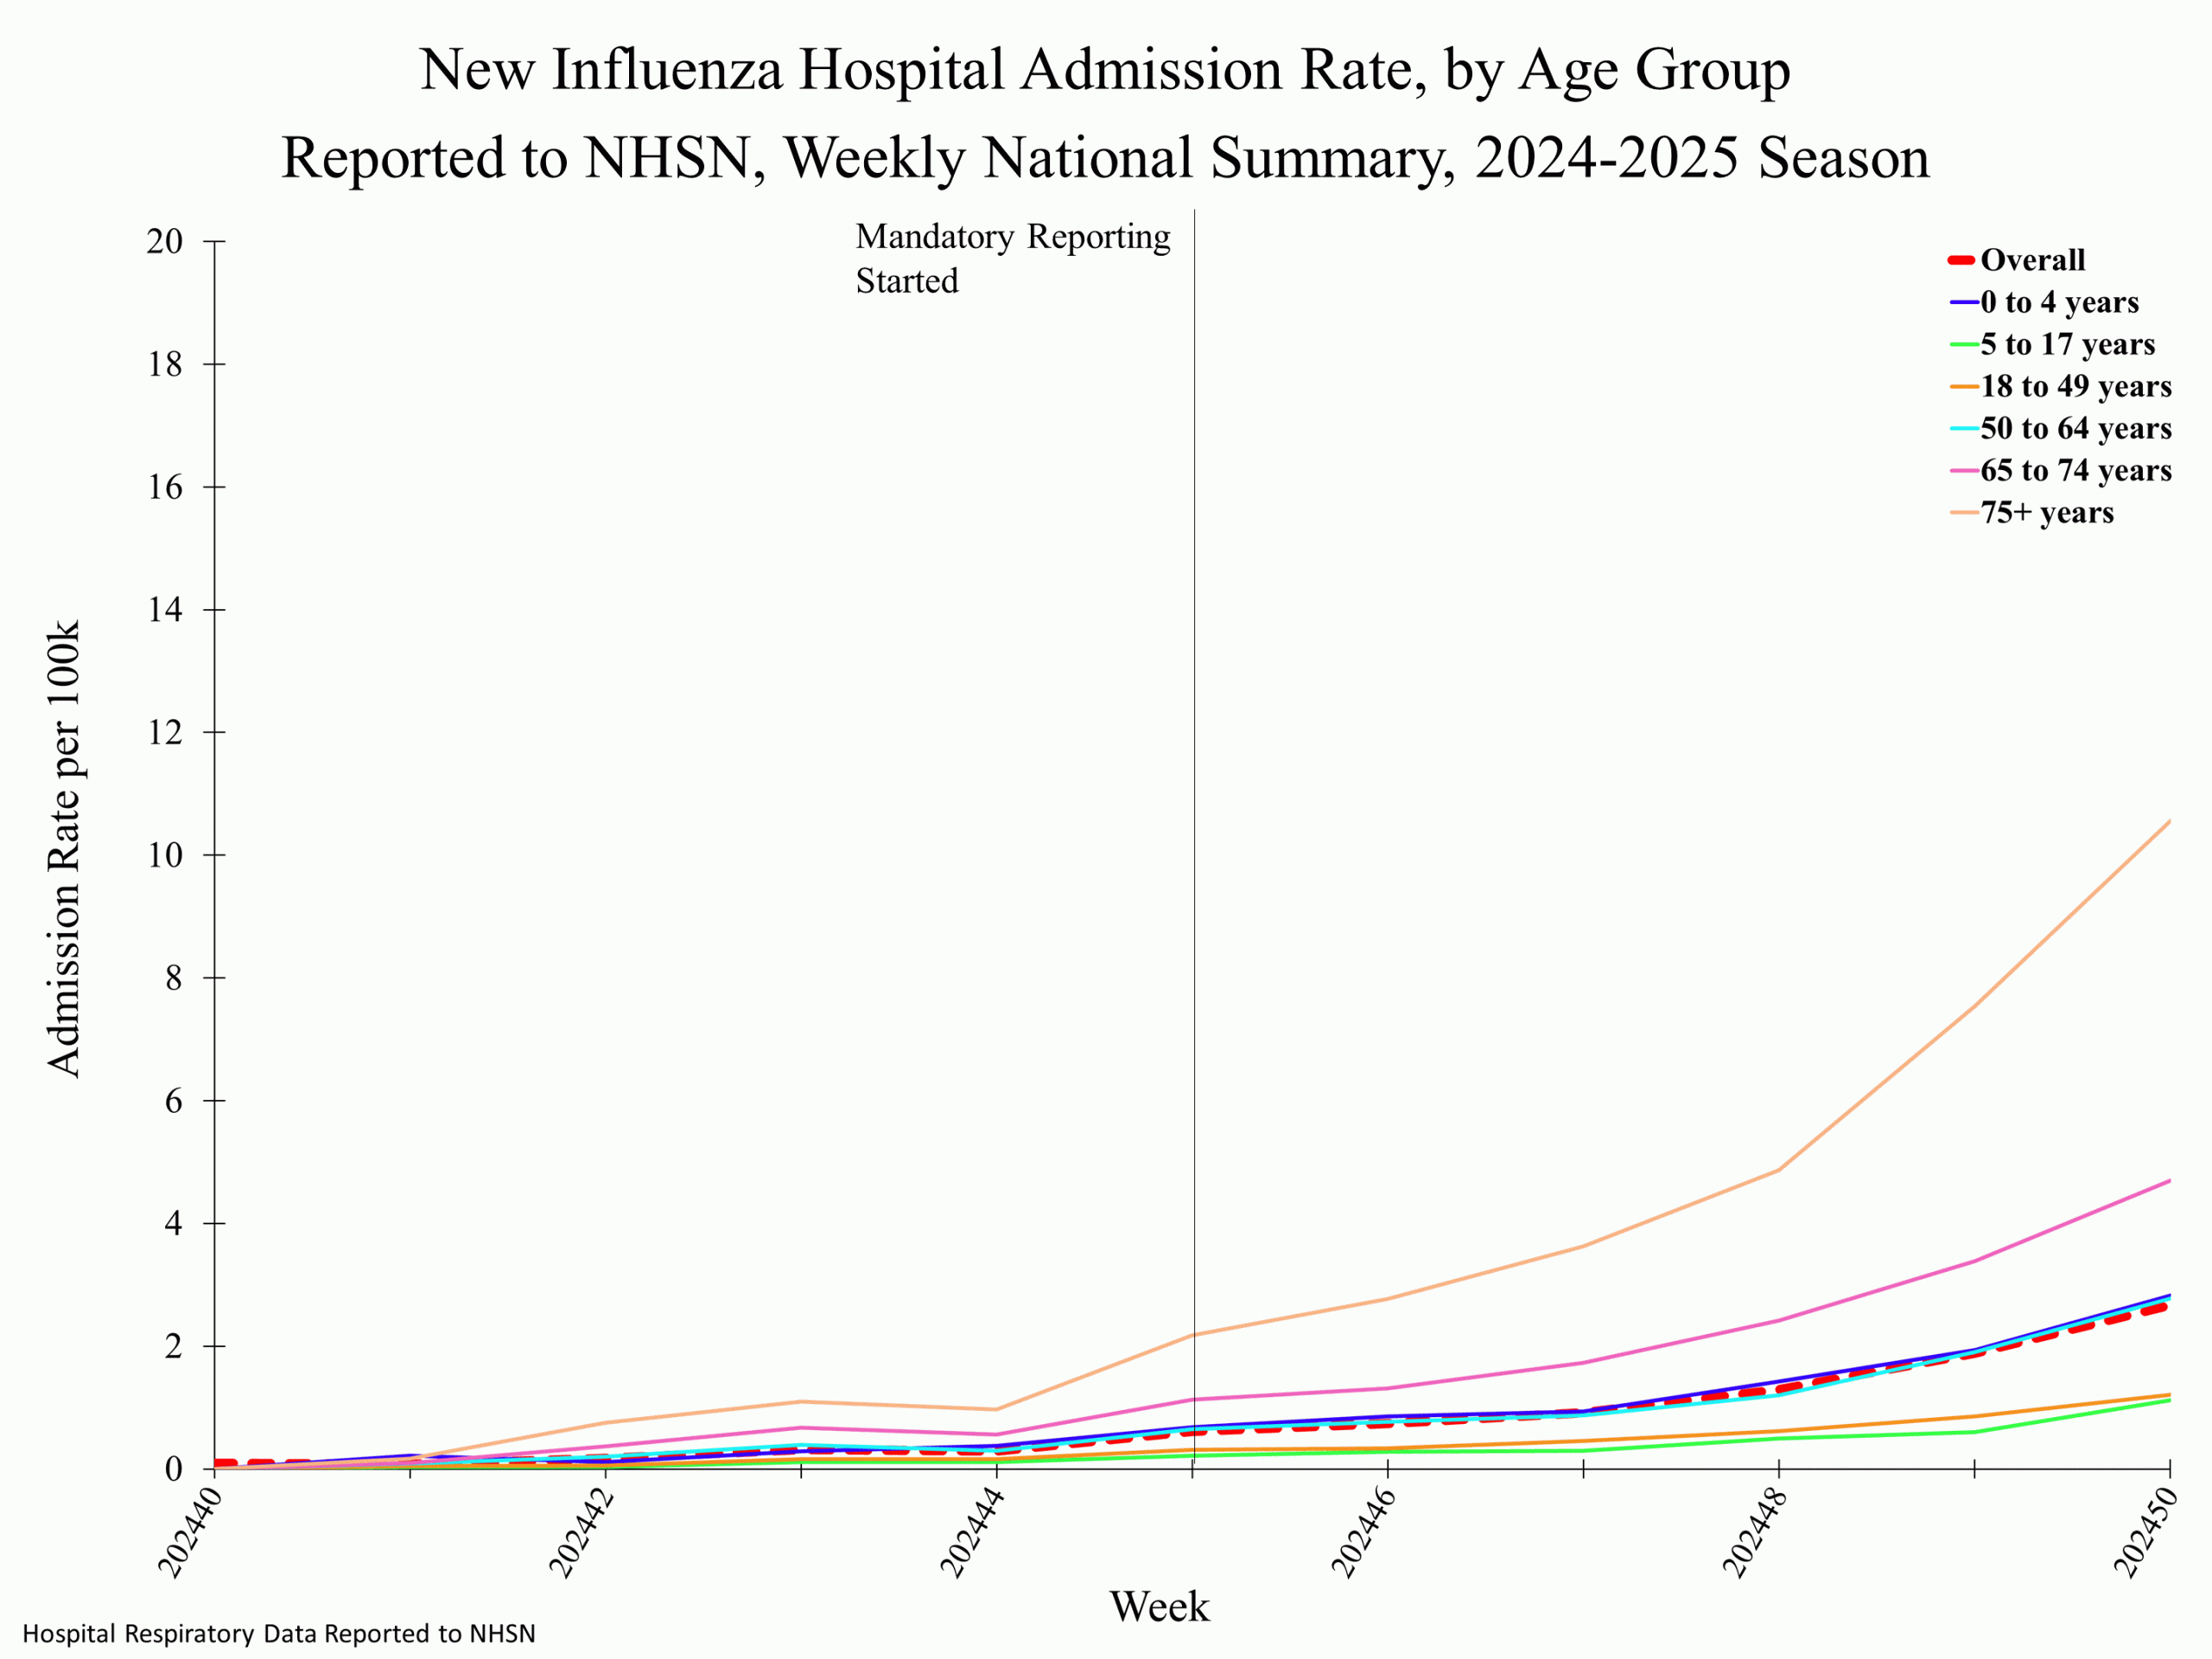
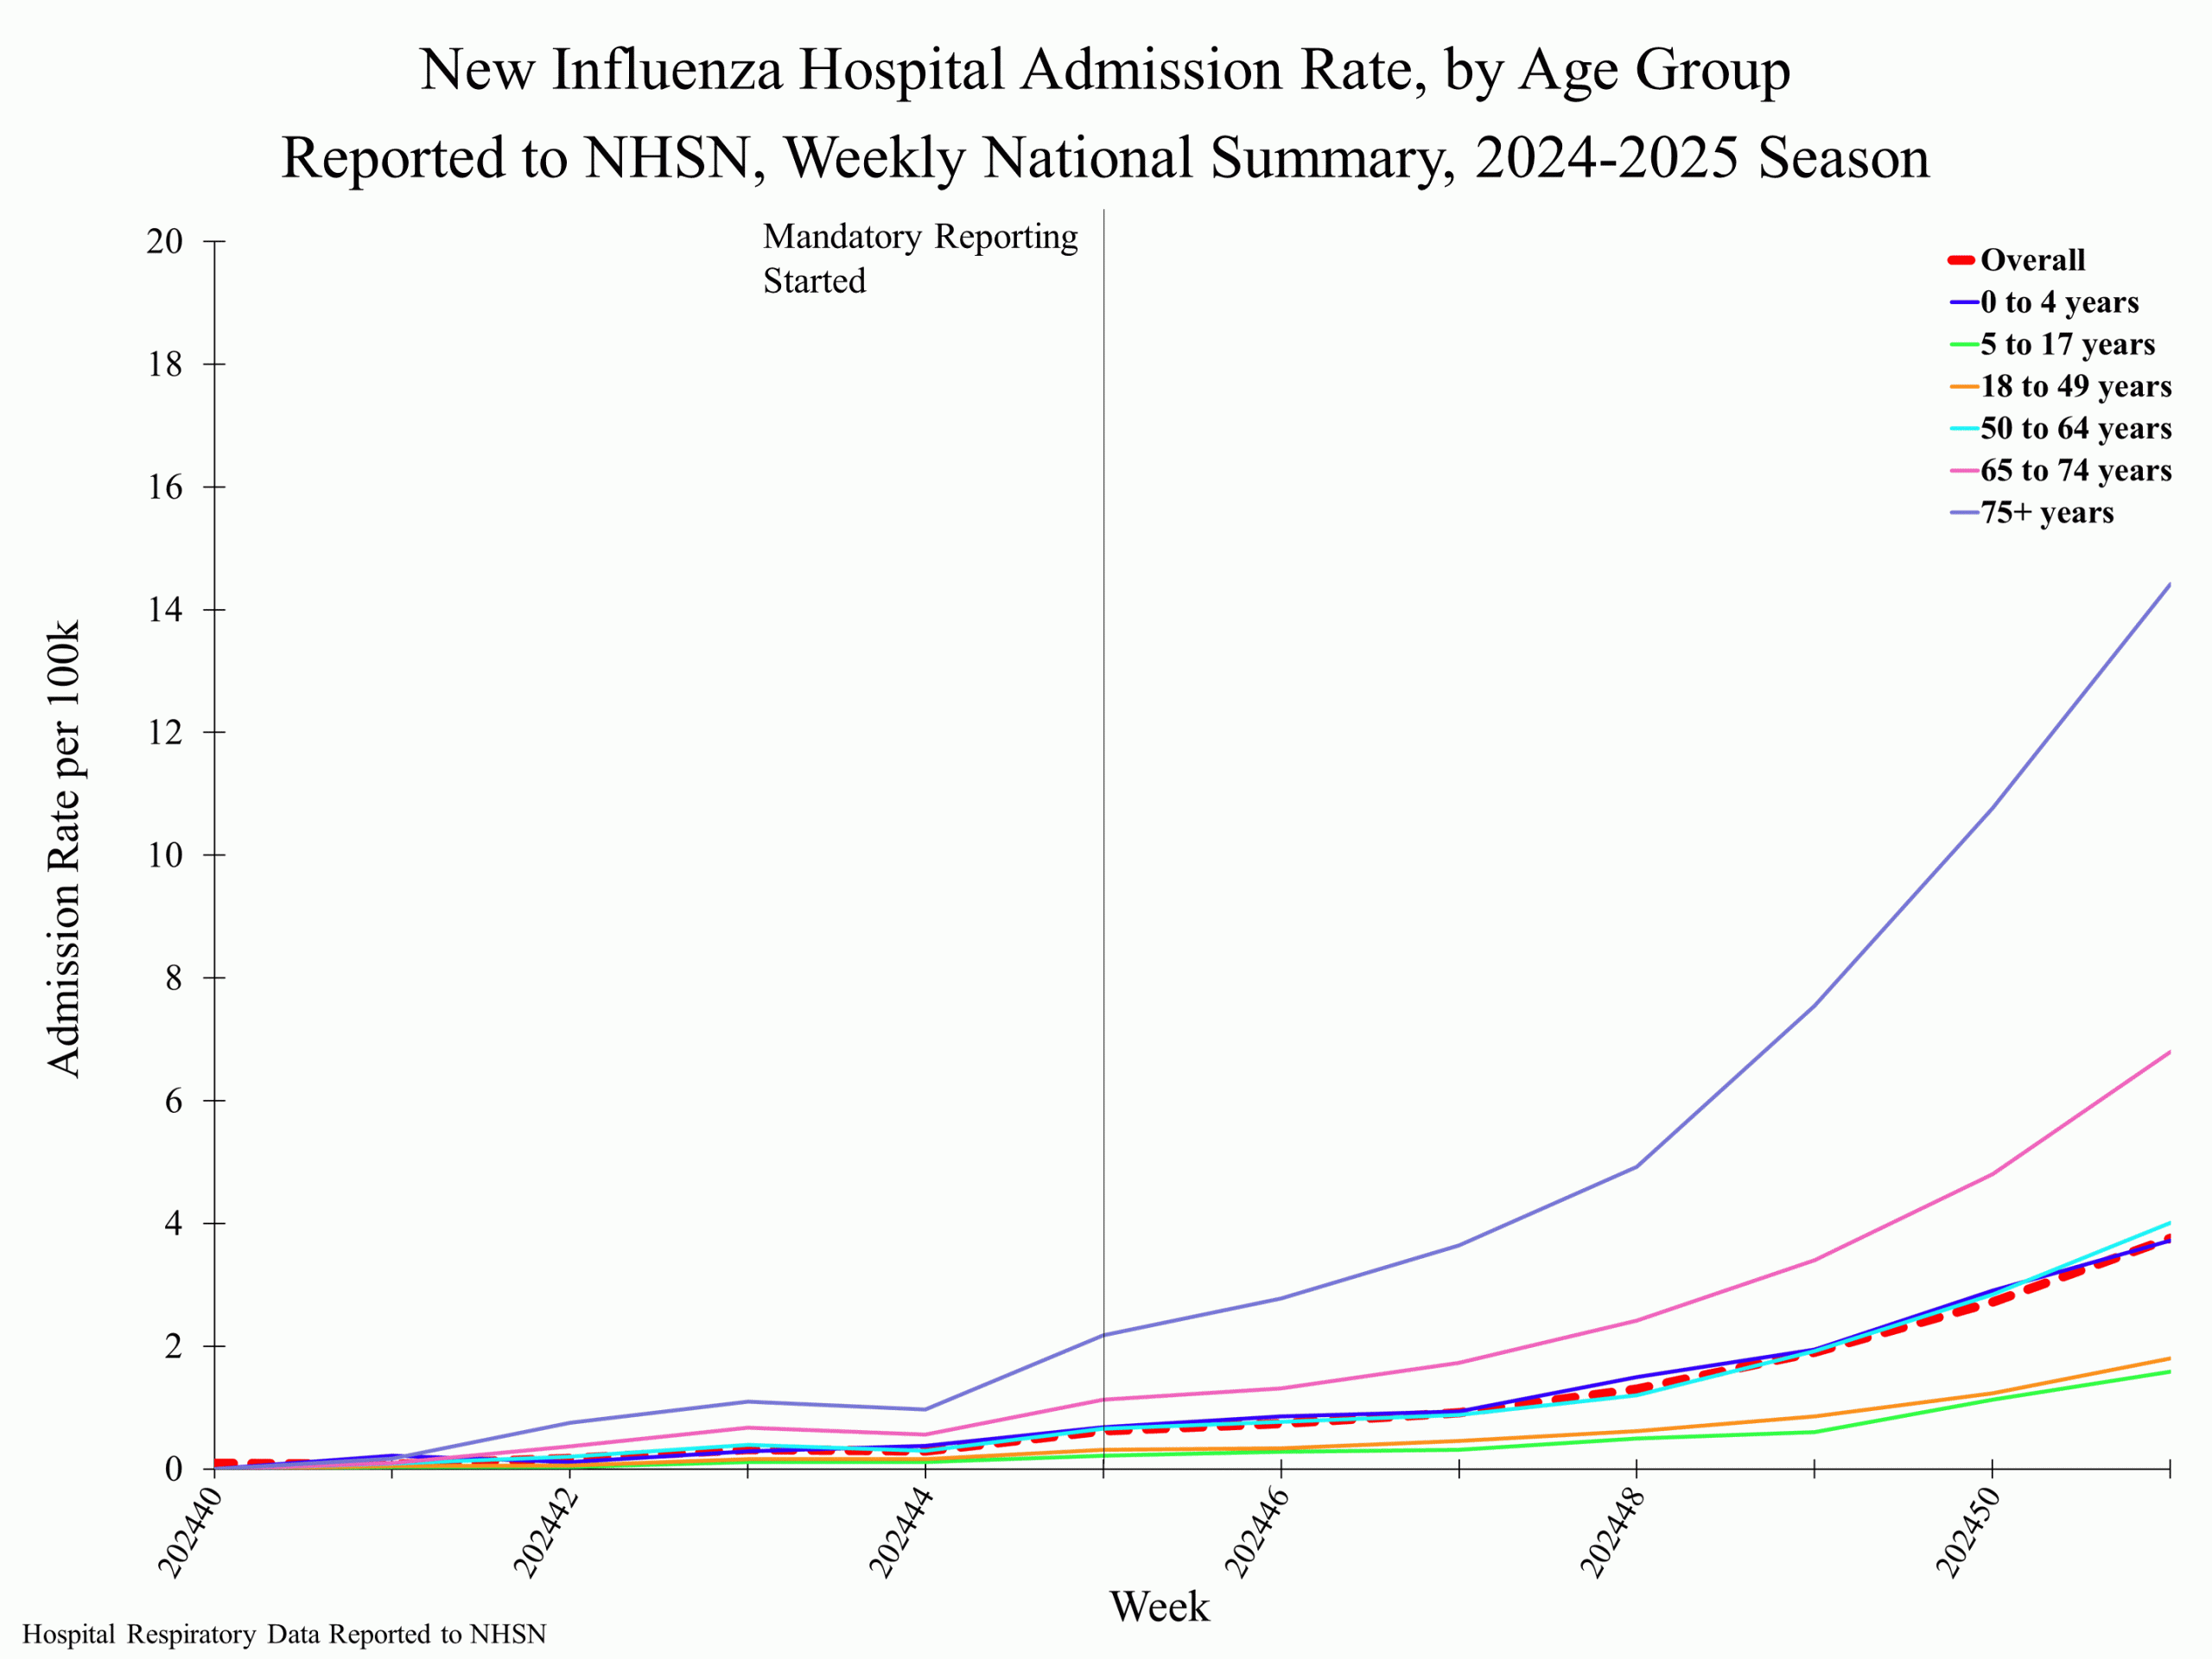
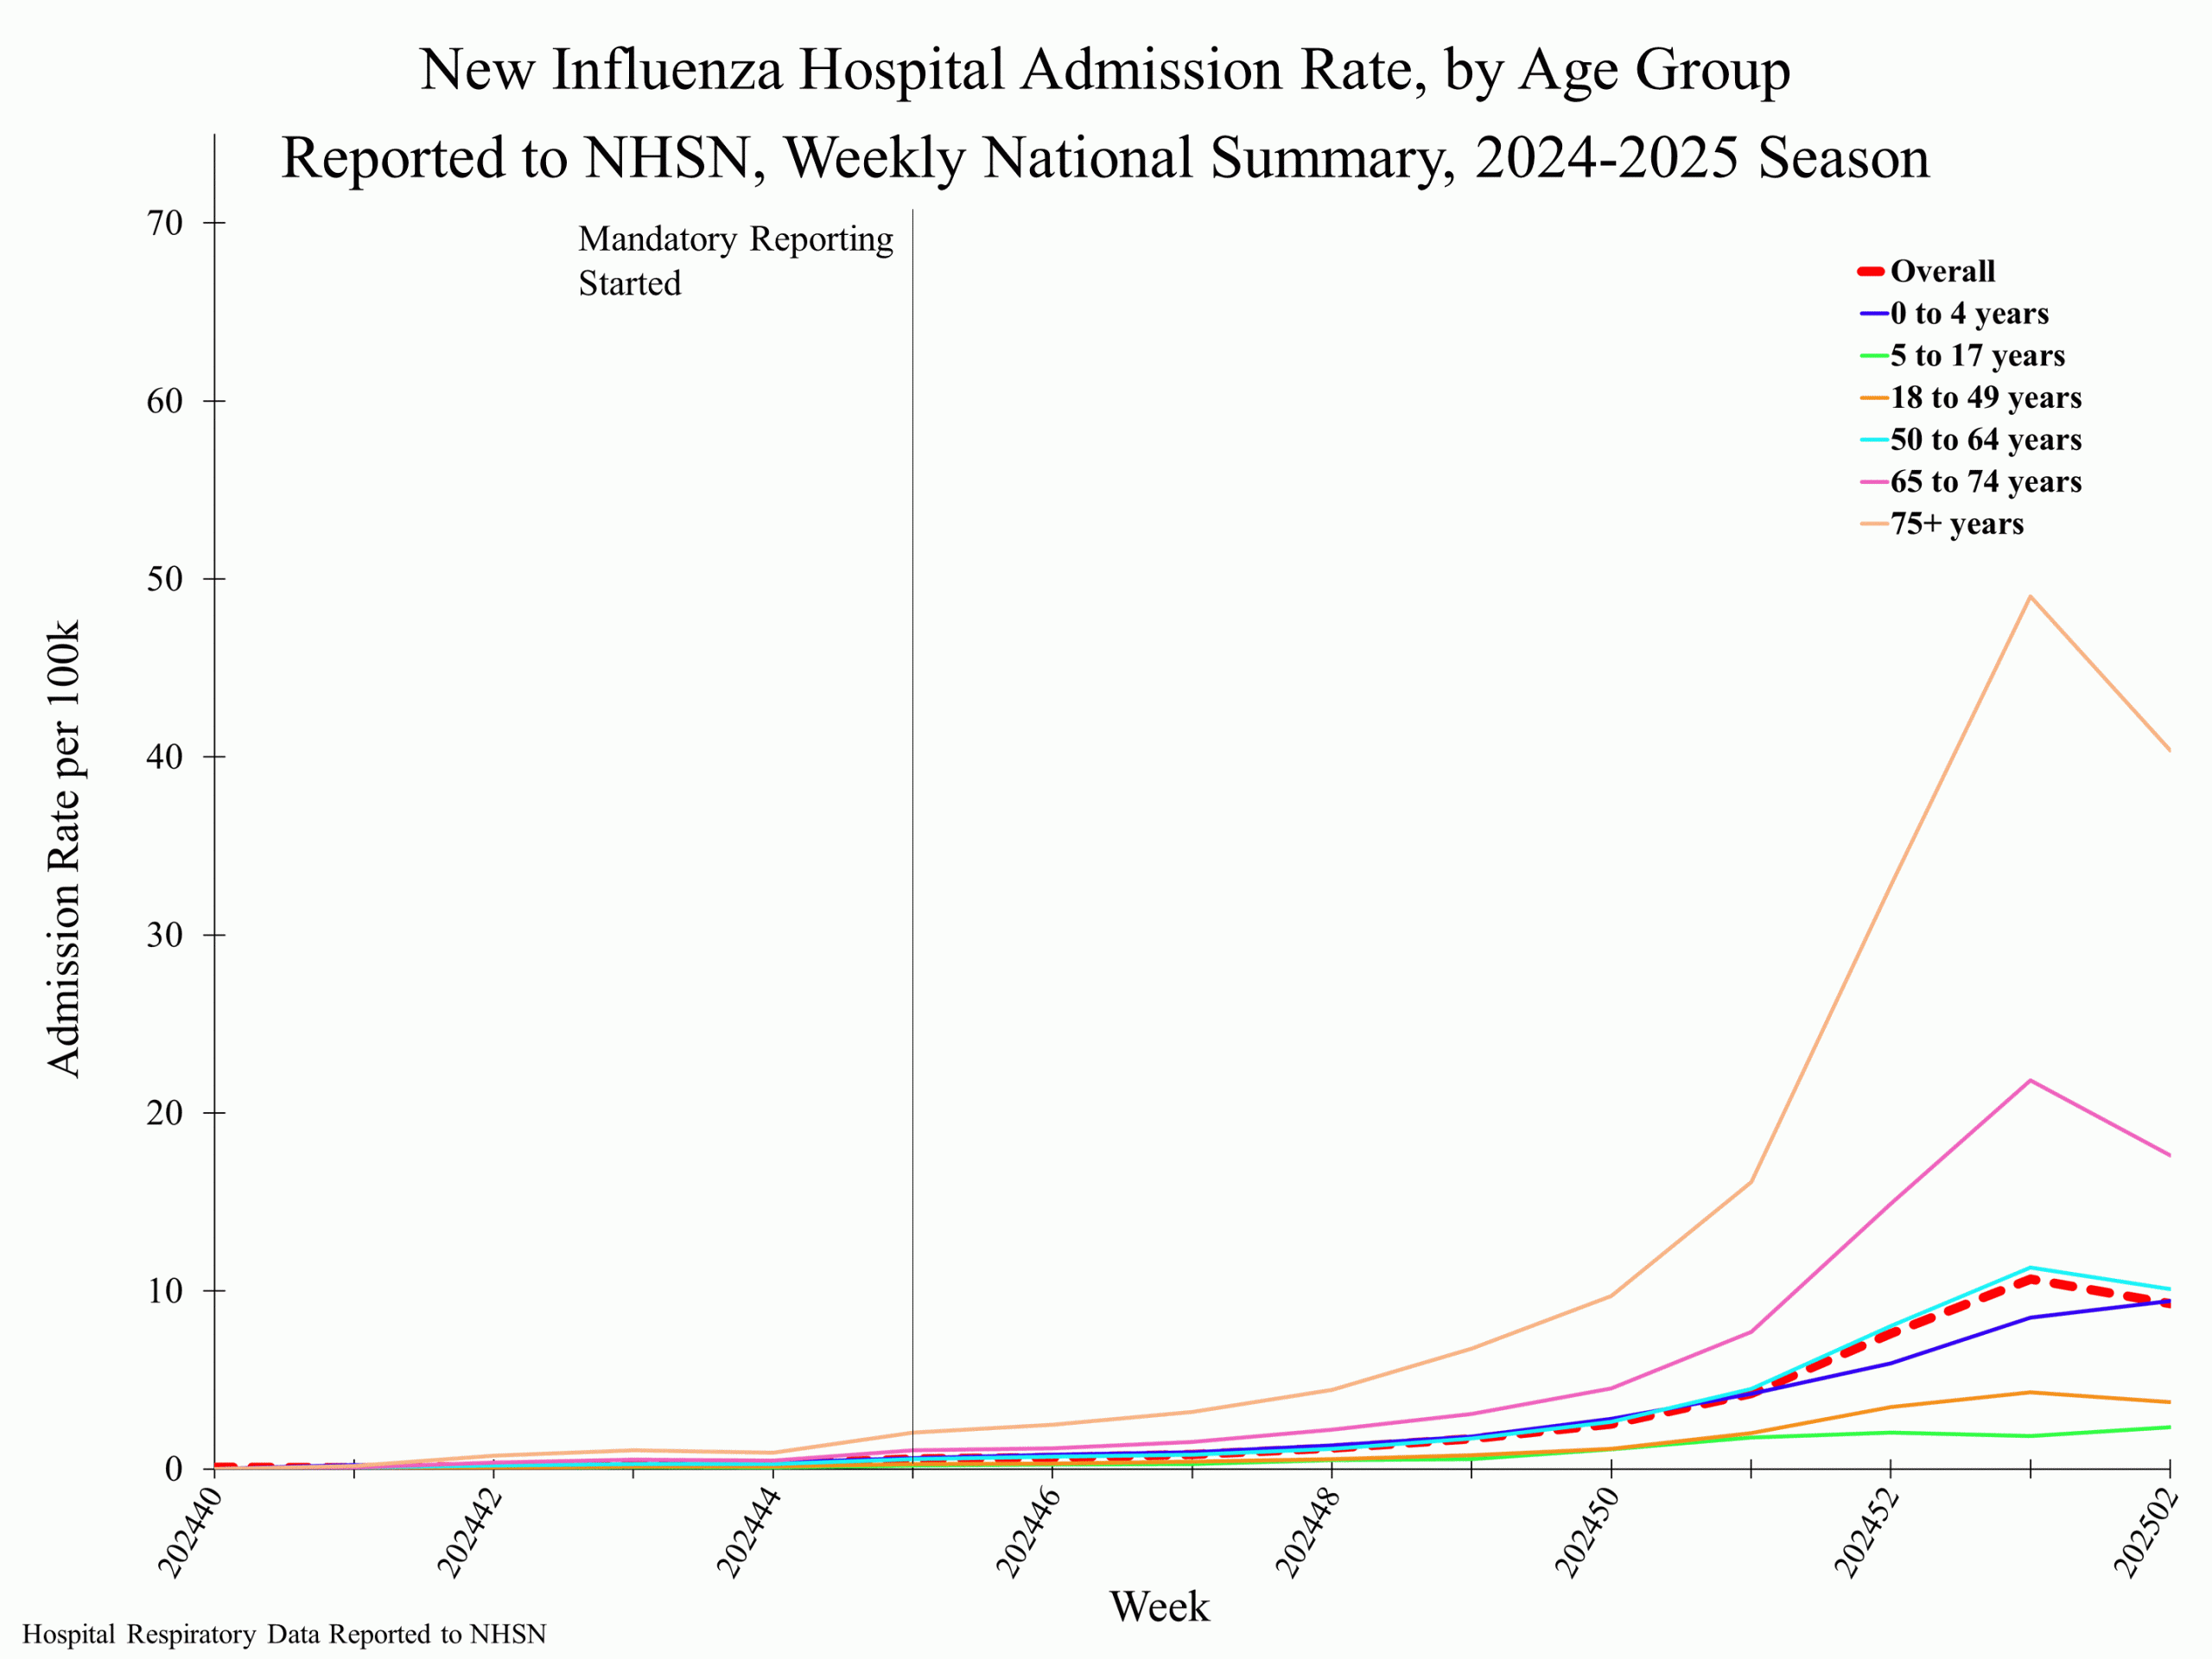
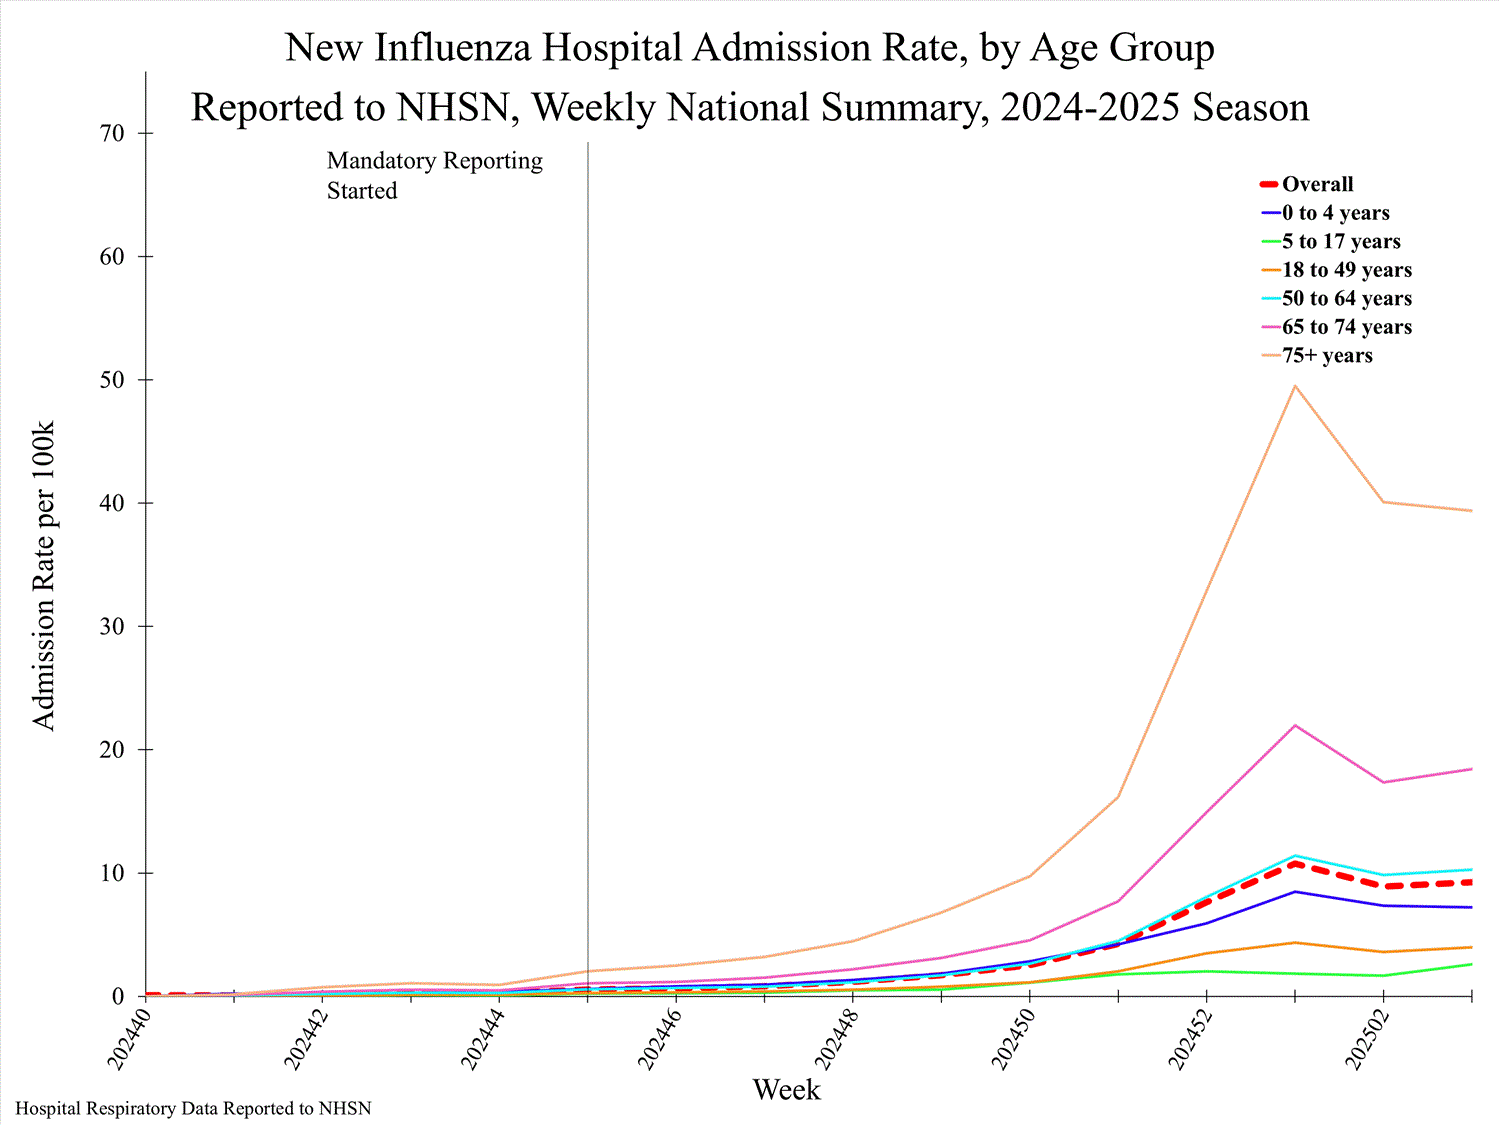
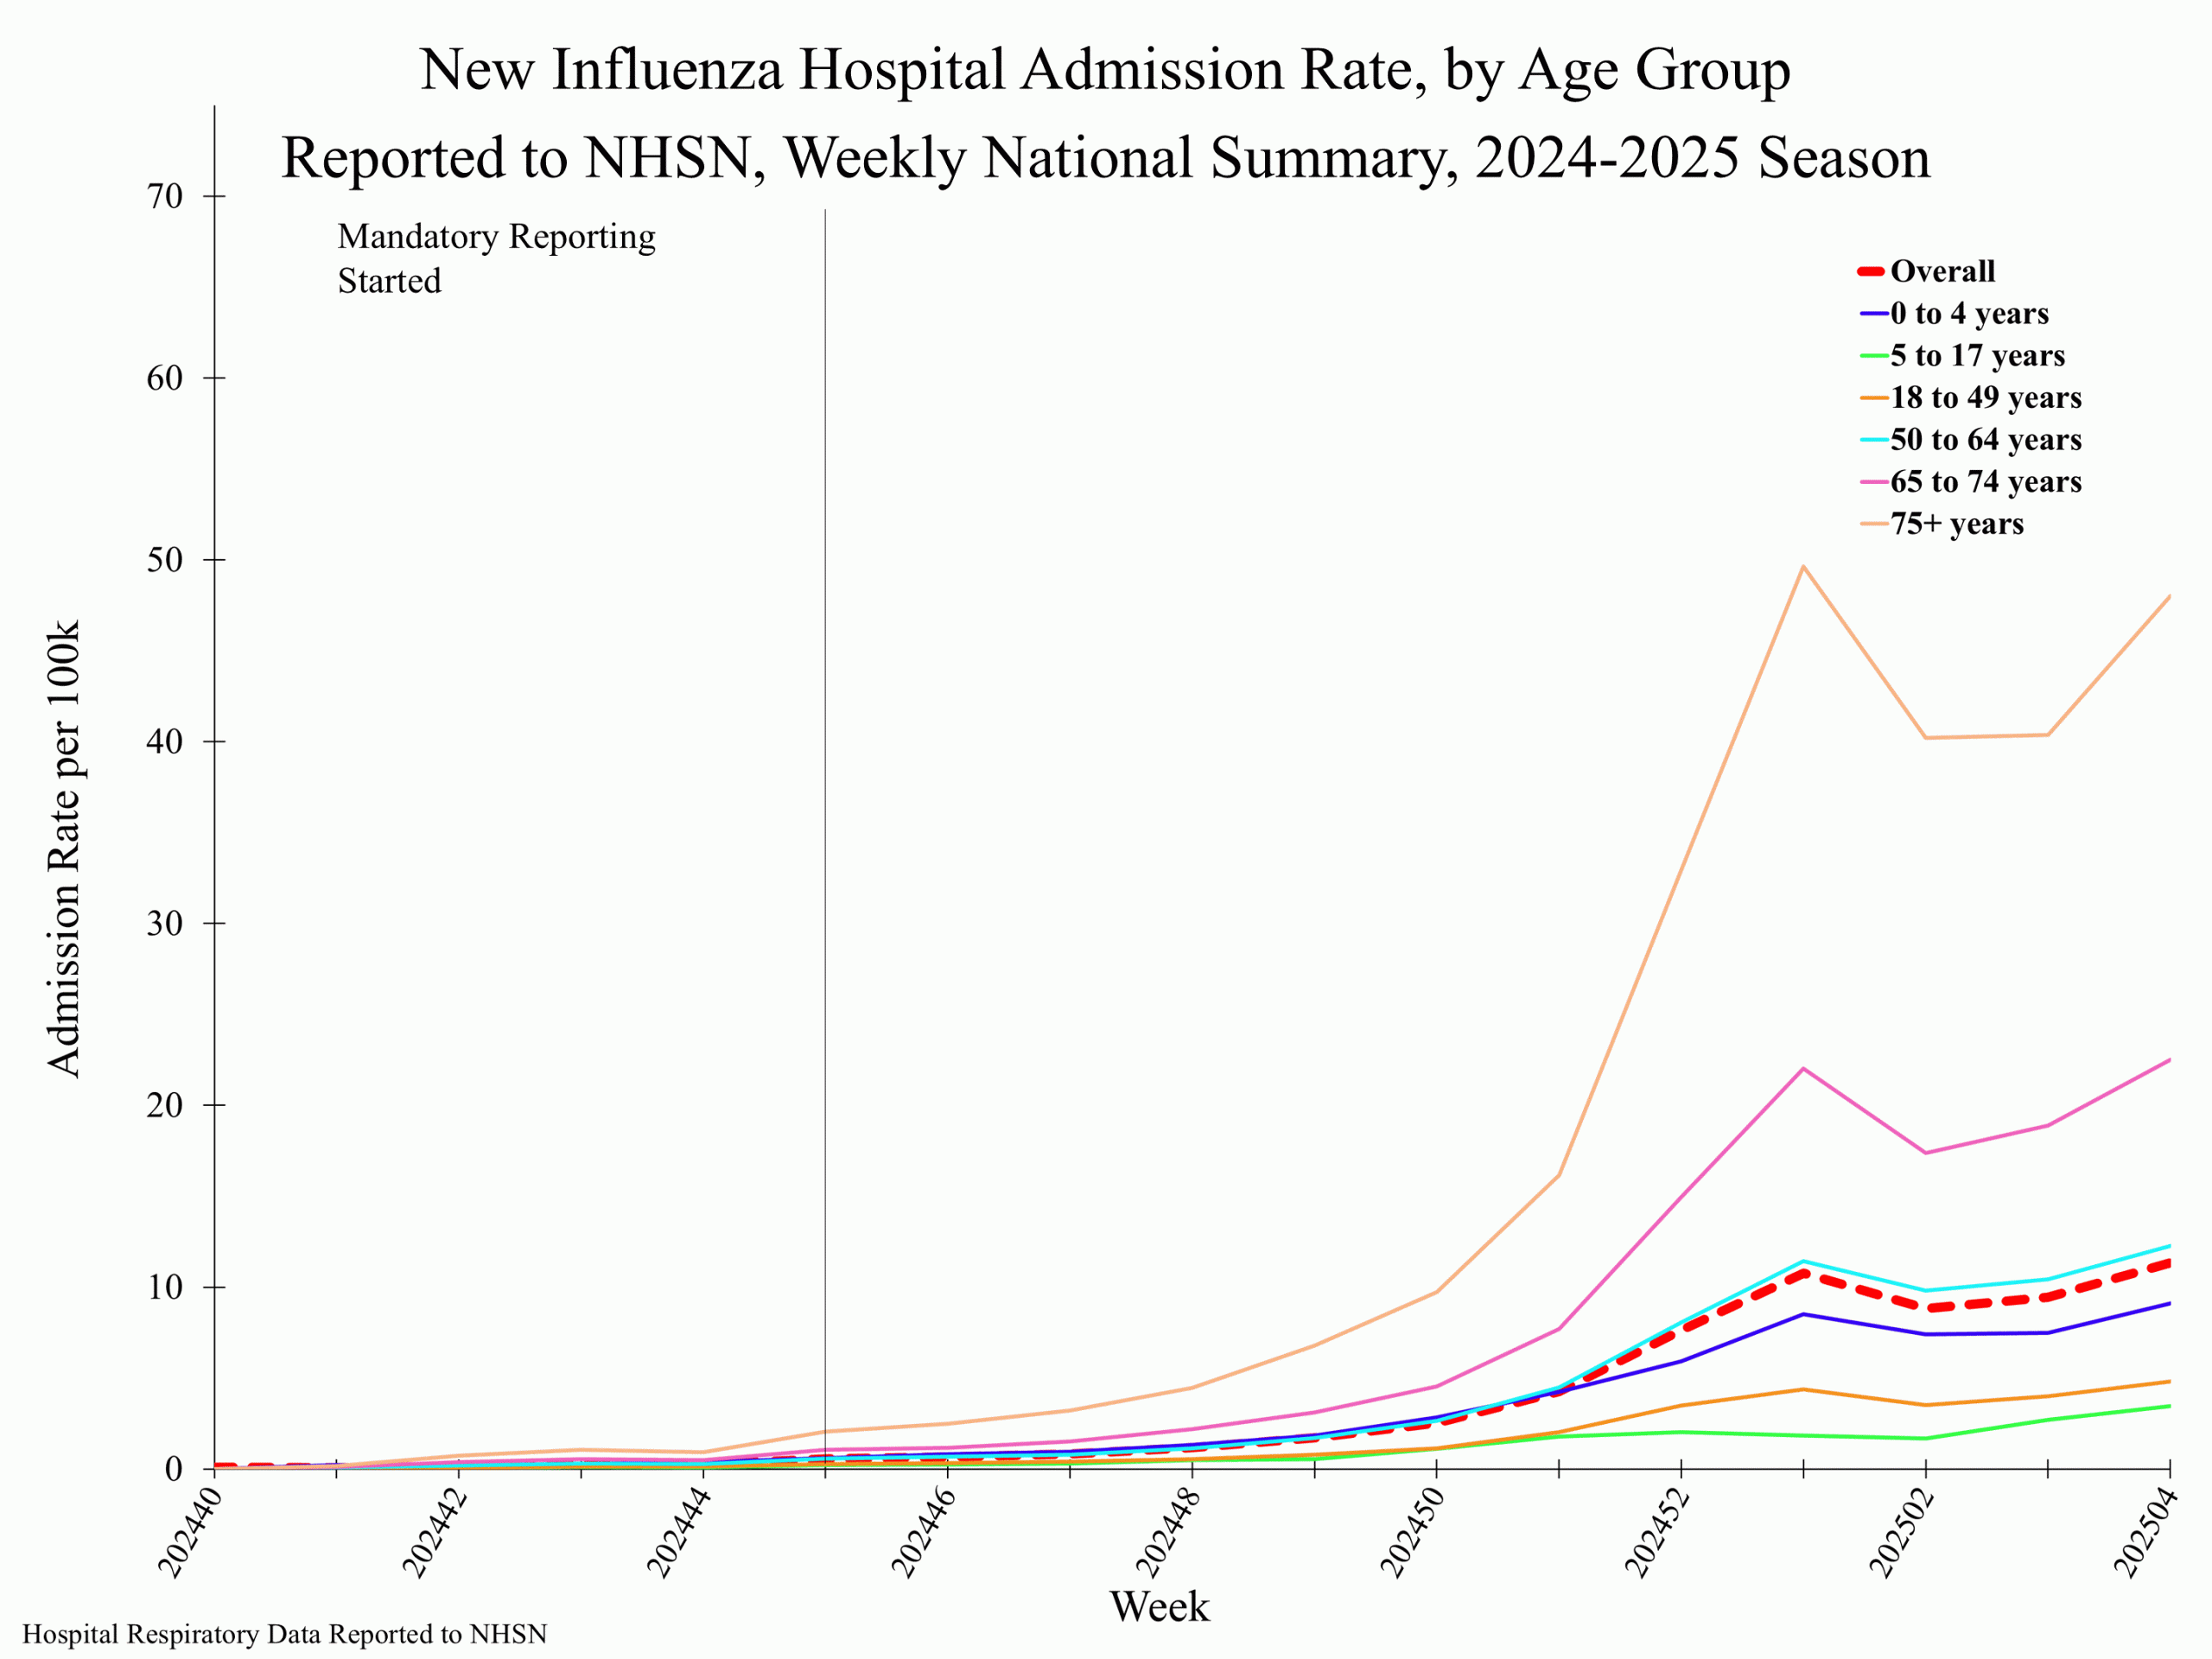
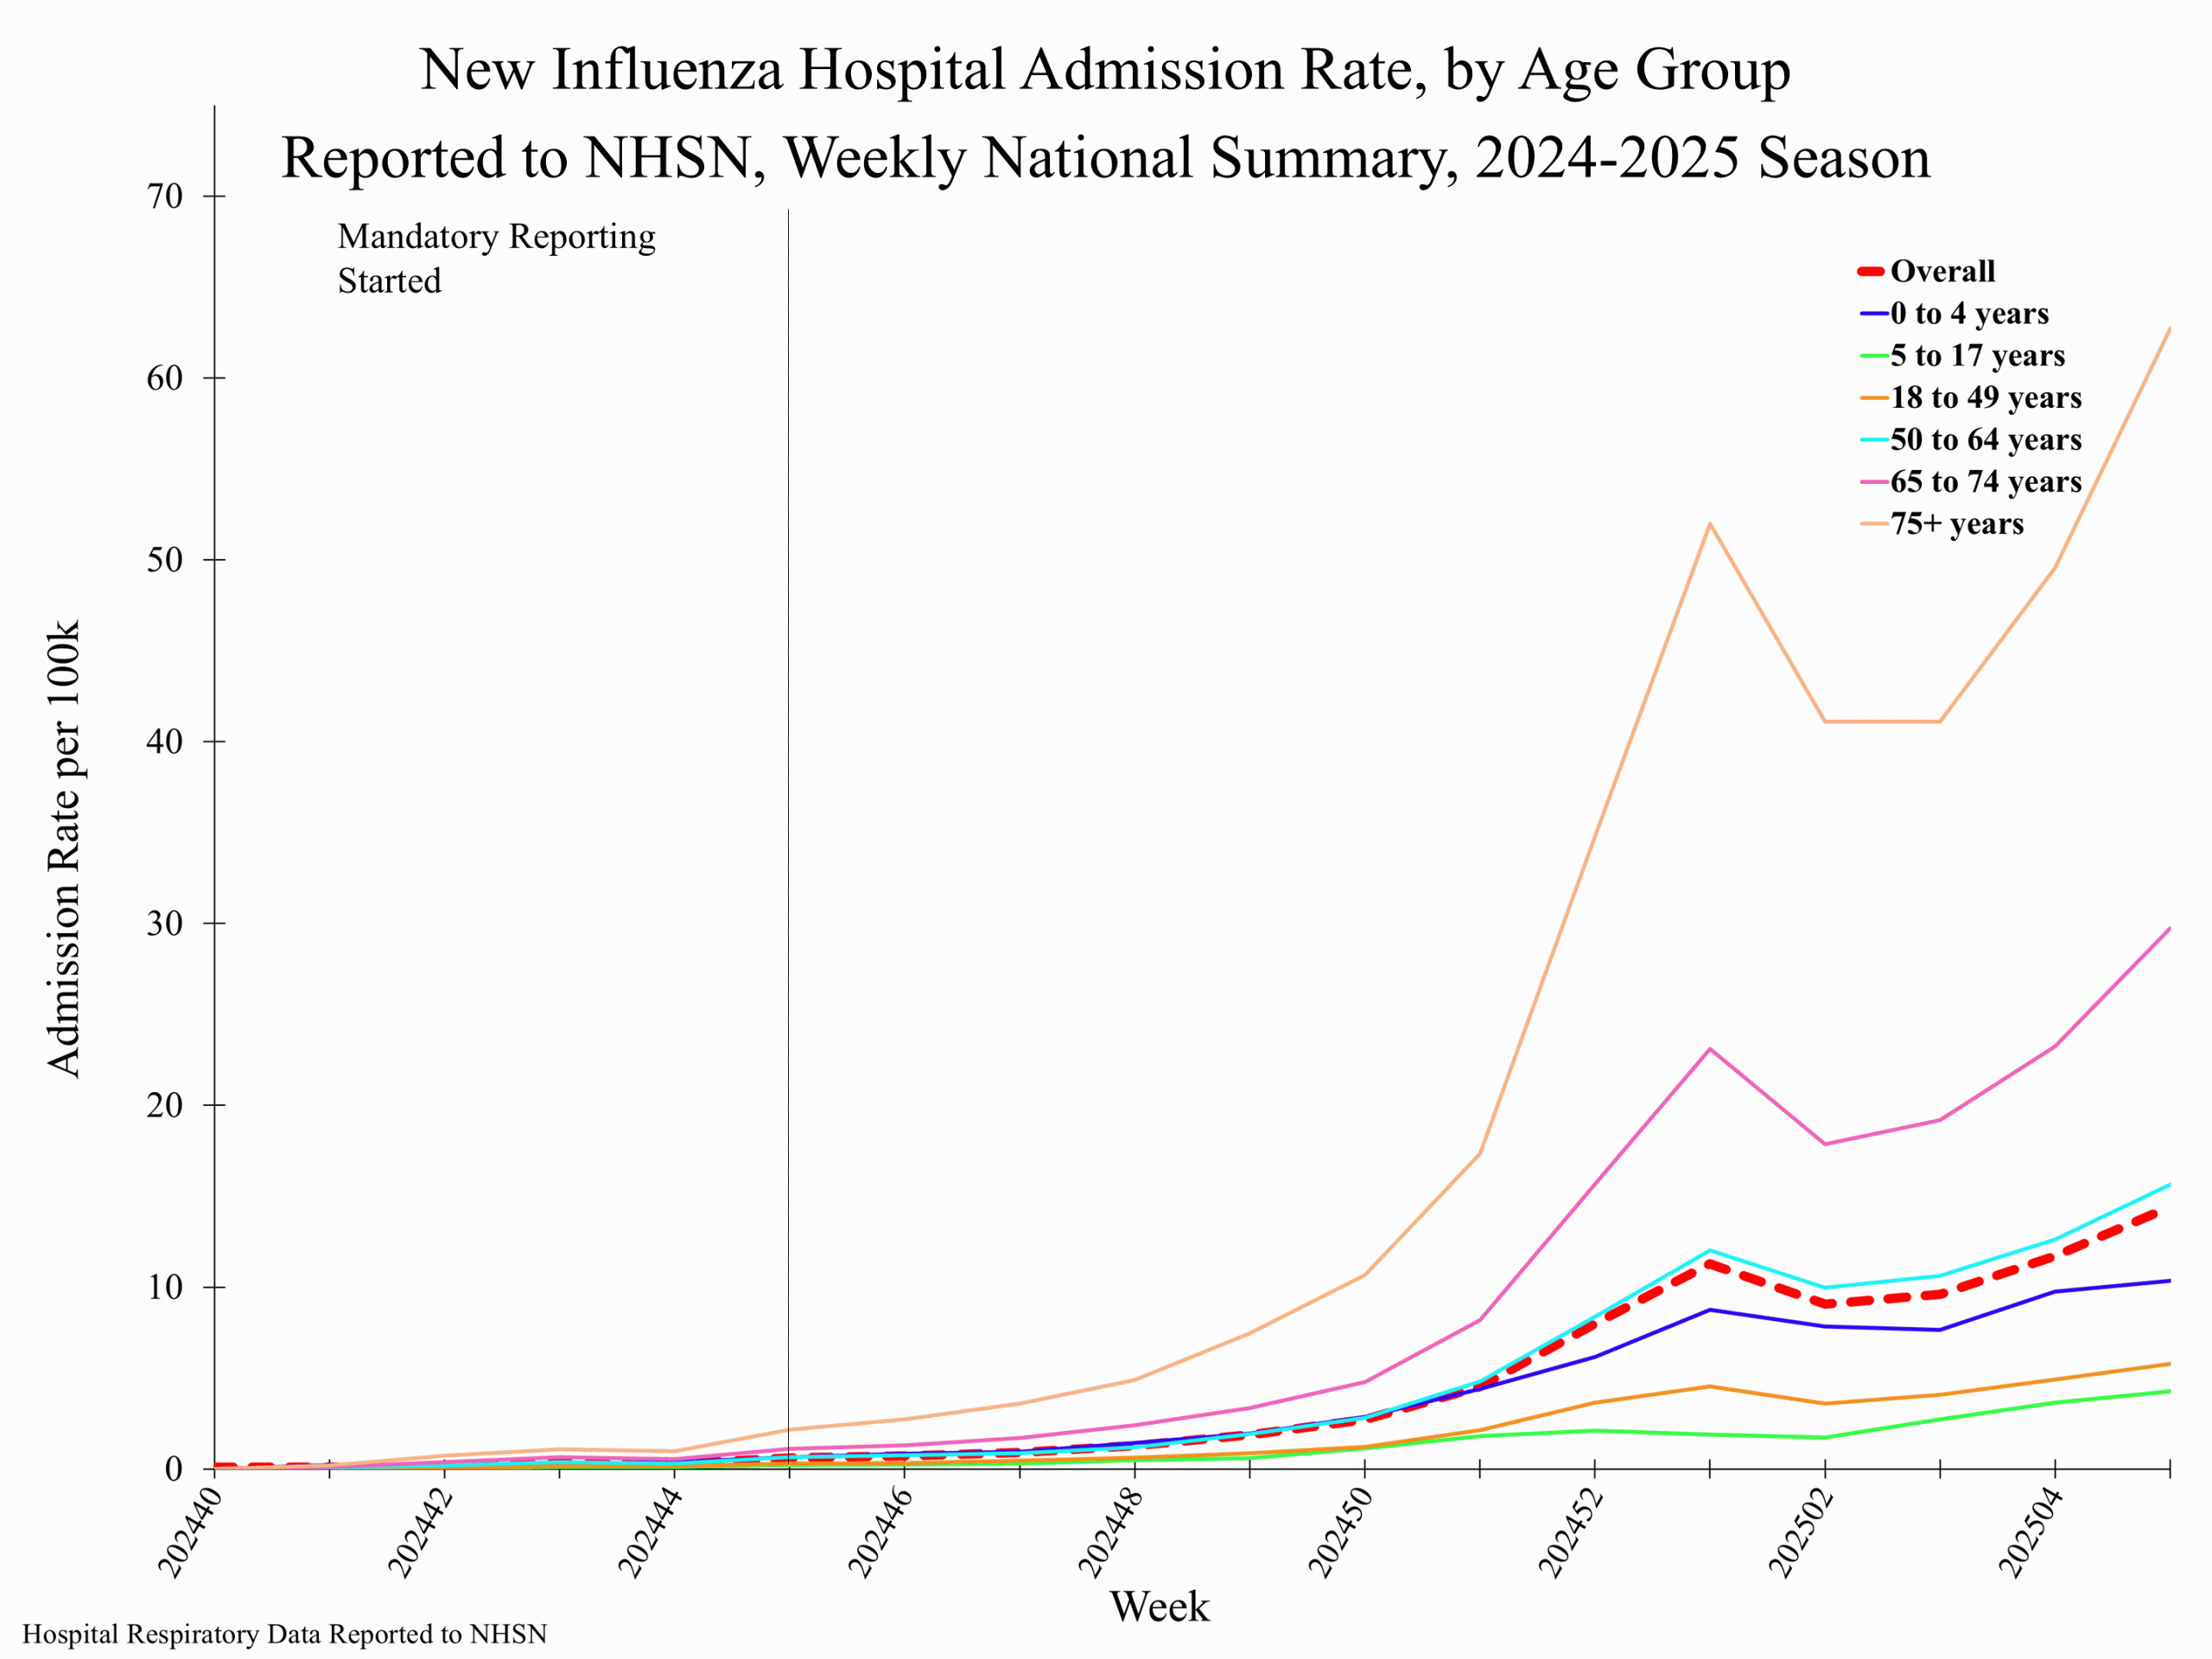
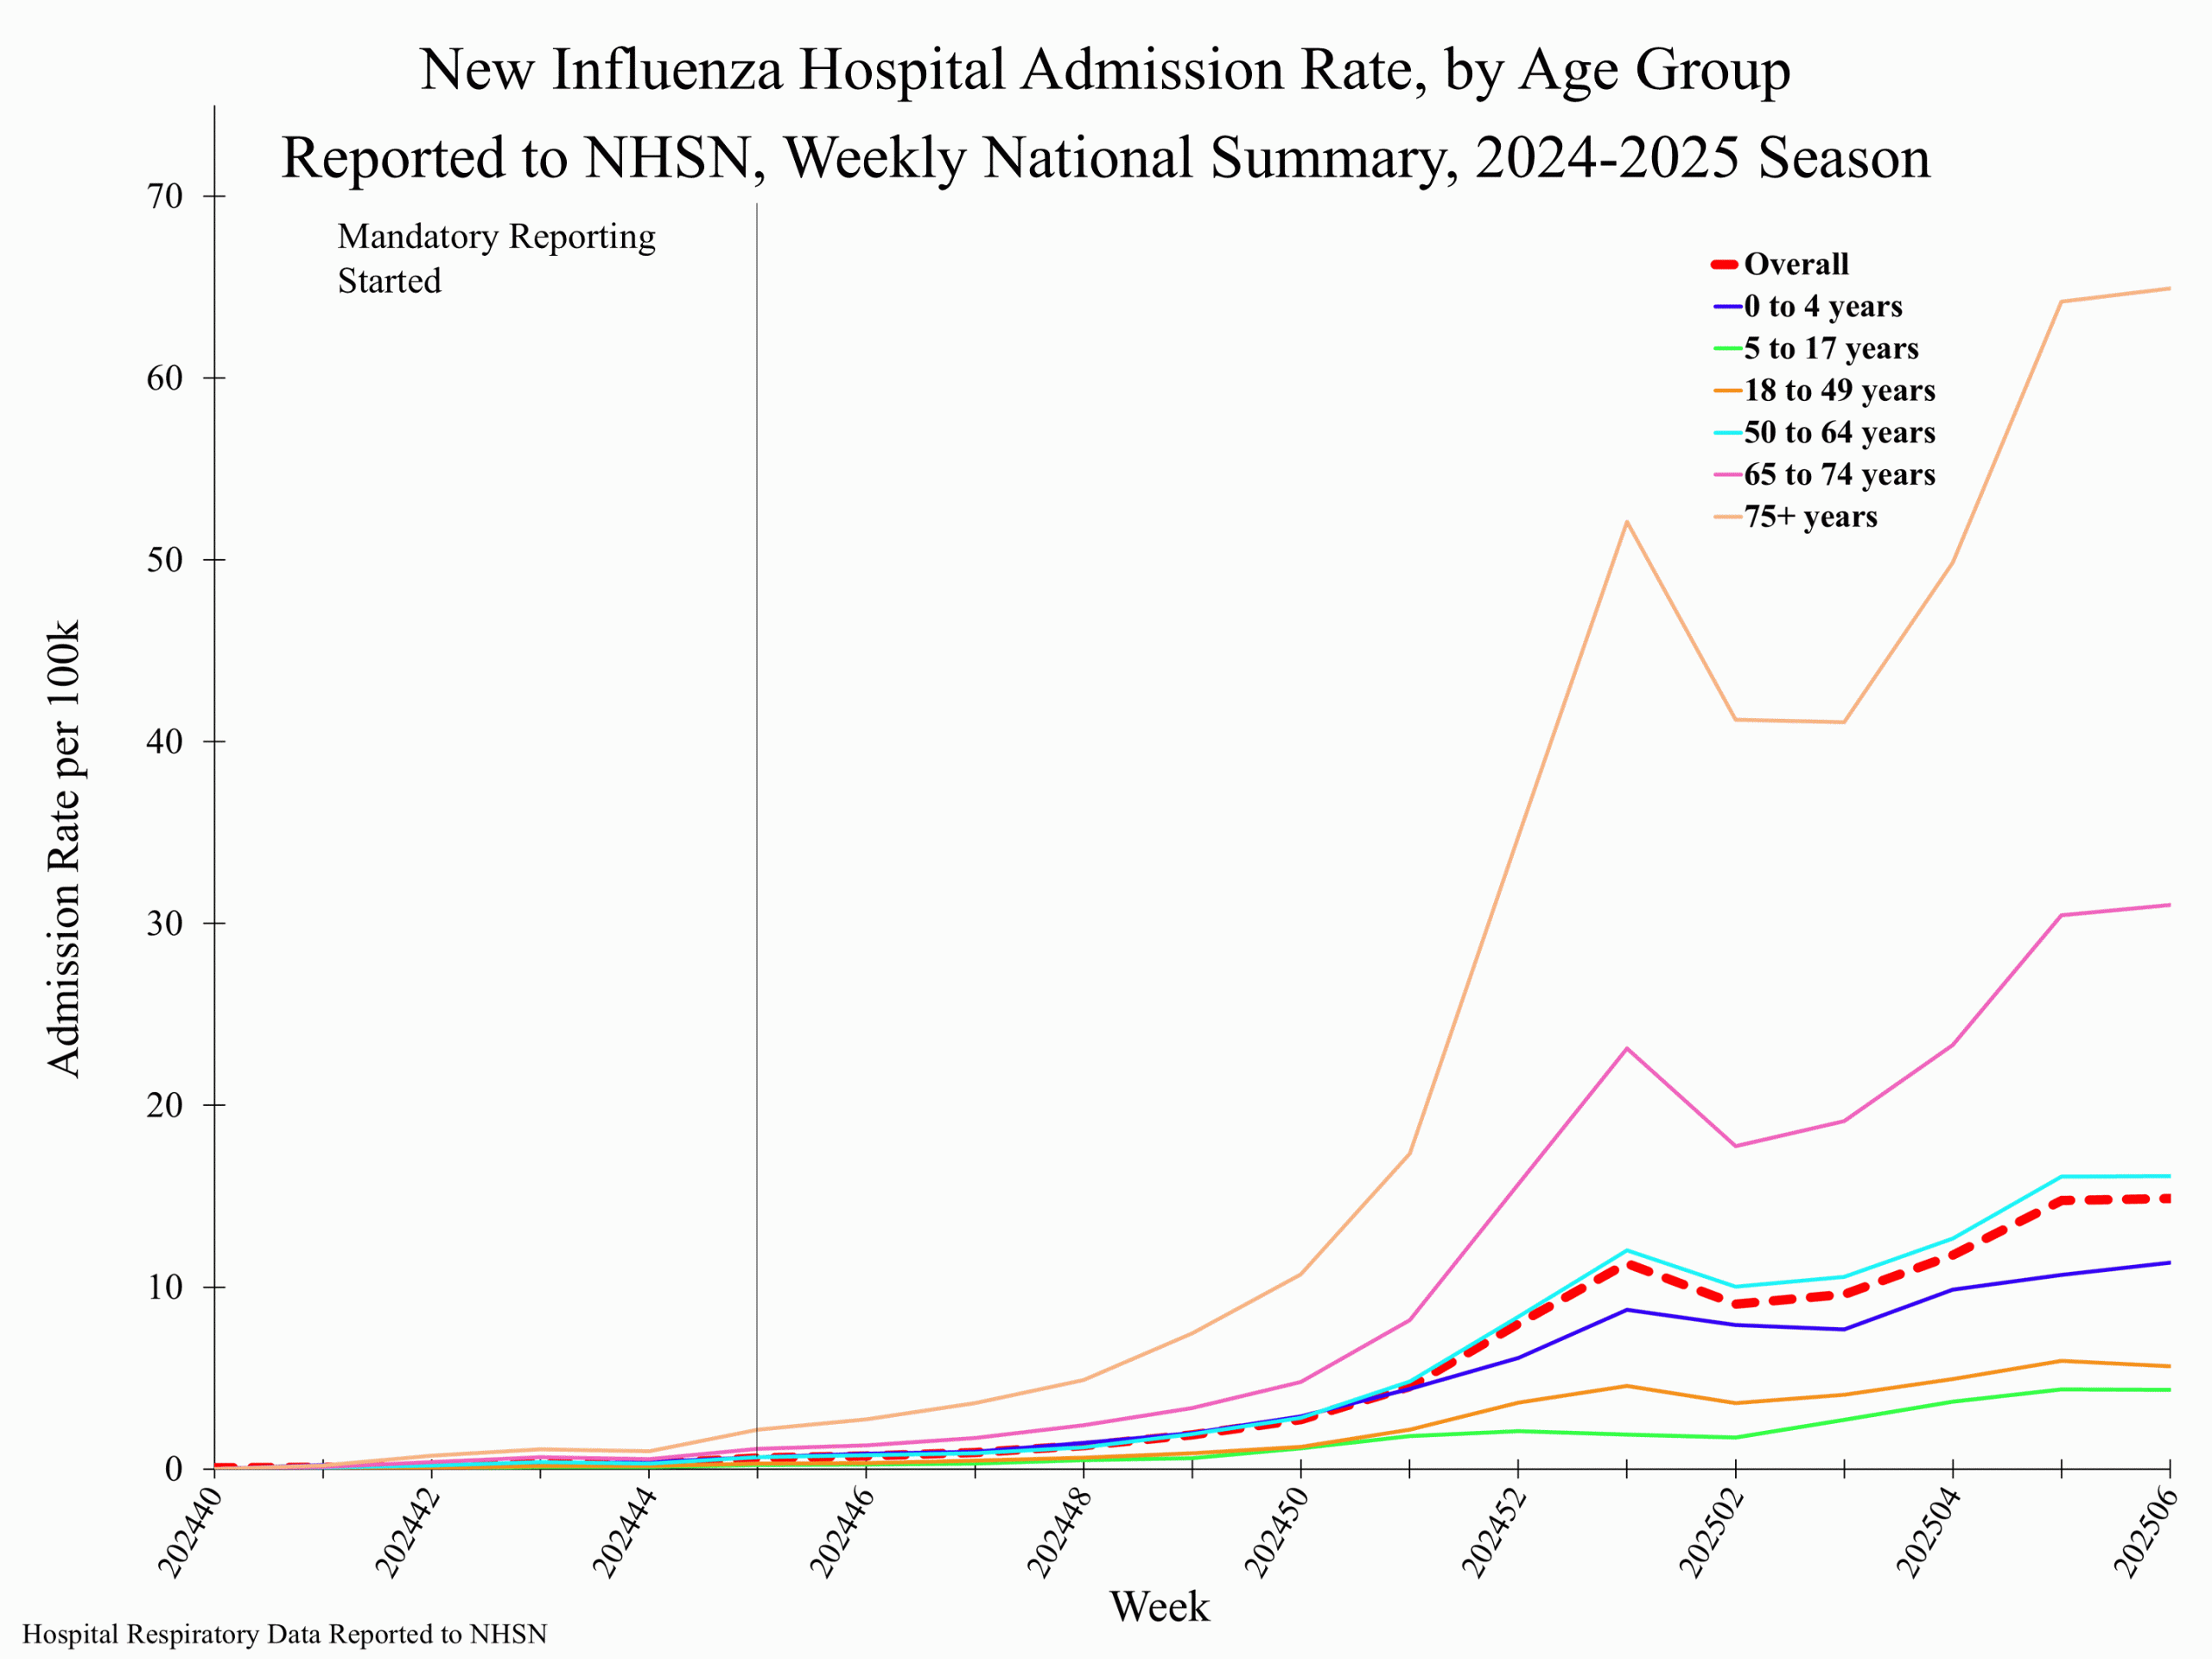
Effective November 1, 2024, all acute care and critical access hospitals will be required to report the number of patients admitted with laboratory-confirmed influenza to NHSN. These data will be updated weekly in FluView and on FluView Interactive once sufficient data has been collected. Public datasets, including data reported on a voluntary basis prior to November 1, can be found here: https://data.cdc.gov/Public-Health-...talization-Metrics-by-Ju/aemt-mg7g/about_data.

Additional NHSN Hospitalization Surveillance information:‎

Surveillance Methods | Additional Data | FluView Interactive


Mortality surveillance


Based on NCHS mortality surveillance data available on October 10, 2024, 0.06% of the deaths that occurred during the week ending October 5, 2024 (Week 40), were due to influenza. This percentage remained stable (≤ 0.1 percentage point change) compared to week 39. The data presented are preliminary and may change as more data are received and processed.

Additional pneumonia, influenza and COVID-19 mortality surveillance information for current and past seasons:‎

Surveillance Methods | FluView Interactive

Influenza-Associated Pediatric Mortality


No influenza-associated pediatric deaths occurring during the 2024-2025 season have been reported to CDC.

Additional pediatric mortality surveillance information for current and past seasons:‎

Surveillance Methods | FluView Interactive

https://www.cdc.gov/fluview/surveillance/2024-week-40.html
 
Last edited by a moderator:
Weekly US Influenza Surveillance Report: Key Updates for Week 41, ending October 12, 2024

What to know


Seasonal influenza activity remains low nationally.
Summary

Viruses

Clinical Lab 0.8% (Trend
StableArrow.png
)
positive for influenza
this week. Public Health Lab Influenza A(H1N1)pdm09 and A(H3N2)
viruses were co-circulating this week. Illness

Outpatient Respiratory Illness

2.1% (Trend
StableArrow.png
)
of visits to a health care provider this
week were for respiratory illness
(below baseline). Activity Map

0 moderate jurisdictions 0 high or very high jurisdictions

FluSurv-NET

0.1 per 100,000
weekly hospitalization rate

NCHS Mortality

0.04% (Trend
StableArrow.png
)
of deaths attributed to influenza this week.

Pediatric Deaths

0 influenza-associated deaths
occurring during the 2024-2025 season were reported this week.
All data are preliminary and may change as more reports are received.

Directional arrows indicate changes between the current week and the previous week. Additional information on the arrows can be found at the bottom of this page.


A description of the CDC influenza surveillance system, including methodology and detailed descriptions of each data component is available on the surveillance methods page.1

Additional information on the current and previous influenza seasons for each surveillance component are available on FluView Interactive.

Key Points‎

• Seasonal influenza activity is low nationally.

• During Week 41, all 38 viruses reported by public health laboratories were influenza A. Of the 29 influenza A viruses subtyped during Week 41, 14 (48.3%) were influenza A(H1N1)pdm09 and 15 (51.7%) were A(H3N2).

• Seven human infections with influenza A(H5) virus were reported by the California Department of Public Health this week.

• No influenza-associated pediatric deaths occurring during the 2024-2025 season were reported to CDC during Week 40. No influenza-associated pediatric deaths occurring during the 2024-2025 season were reported to CDC during Week 41.

• CDC recommends that everyone ages 6 months and older get an annual influenza (flu) vaccine, ideally by the end of October.[SUP]1[/SUP]

• There are prescription flu antiviral drugs that can treat flu illness; those should be started as early as possible and are especially important for higher risk patients. [SUP]2[/SUP]

• Influenza viruses are among several viruses contributing to respiratory disease activity. CDC is providing updated, integrated information about COVID-19, flu, and respiratory syncytial virus (RSV) activity on a weekly basis.


COVID-19, flu, and RSV activity

U.S. virologic surveillance


Nationally and in HHS regions 1 through 10, the percentage of respiratory specimens testing positive for influenza virus in clinical laboratories remained stable (change of <0.5 percentage points) compared to the previous week. Influenza A(H1N1)pdm09 and A(H3N2) viruses are co-circulating; however, the distribution of circulating viruses varies by region. For regional and state level data and age group distribution, please visit FluView Interactive. Viruses known to be associated with recent receipt of live attenuated influenza vaccine (LAIV) or found upon further testing to be a vaccine virus are not included, as they are not circulating influenza viruses.

Clinical Laboratories


The results of tests performed by clinical laboratories nationwide are summarized below. Data from clinical laboratories (the percentage of specimens tested that are positive for influenza virus) are used to monitor whether influenza activity is increasing or decreasing.
No. of specimens tested46,025107,292
No. of positive specimens (%)359 (0.8%)779 (0.7%)
Positive specimens by type
Influenza A323 (90.0%)689 (88.4%)
Influenza B36 (10.0%)90 (11.6%)
Public Health Laboratories


The results of tests performed by public health laboratories nationwide are summarized below. Data from public health laboratories are used to monitor the proportion of circulating influenza viruses that belong to each influenza subtype/lineage.
No. of specimens tested6881,664
No. of positive specimens38168
Positive specimens by type/subtype
Influenza A38 (100%)165 (98.2%)
Subtyping Performed29 (76.3%)132 (80.0%)
(H1N1)pdm0914 (48.3%)70 (53.0%)
H3N215 (51.7%)58 (43.9%)
H3N2v00
H5*04* (3.0%)
Subtyping not performed9 (23.7%)33 (20.0%)
Influenza B03 (1.8%)
Lineage testing performed03 (100%)
Yamagata lineage00
Victoria lineage03 (100%)
Lineage not performed00
[SUB]*This data reflects specimens tested and the number determined to be positive for influenza viruses at the public health labs (specimens tested is not the same as cases). It does not reflect specimens tested only at CDC and could include more than one specimen tested per person. The guidance for influenza A/H5 testing recommends testing both a conjunctival and respiratory swab for people with conjunctivitis which has resulted in more specimens testing positive for influenza A/H5 than the number of human H5 cases. For more information on the number of people infected with A/H5, please visit the [/SUB][SUB]"How CDC is monitoring influenza data among people to better understand the current avian influenza A (H5N1) situation"[/SUB]

[SUB]This graph reflects the number of specimens tested and the number determined to be positive for influenza viruses at the public health lab (specimens tested is not the same as cases). It does not reflect specimens tested only at CDC and could include more than one specimen tested per person. Specimens tested as part of routine influenza surveillance as well as those tested as part of targeted testing for people exposed to influenza A(H5) are included.[/SUB]

Additional virologic surveillance information for current and past seasons:‎

Surveillance Methods | FluView Interactive: National, Regional, and State Data or Age Data

Novel Influenza A Virus


Seven human infections with influenza A(H5) viruses were reported to CDC this week by the California Department of Public Health. These cases are associated with an ongoing outbreak of HPAI A(H5N1) virus in dairy cows. There have now been 11 confirmed human cases in California in October 2024. To date, human-to-human transmission of influenza A(H5) virus has not been identified in the United States.

All seven individuals with influenza A(H5) virus infection reported to CDC this week are aged >18 years and work at commercial dairy cattle farms where highly pathogenic avian influenza (HPAI) A(H5N1) virus had been detected in cows. These individuals had mild symptoms which they reported to the local health department. Specimens were collected from the individuals and were initially tested at local public health laboratories using the Centers for Disease Control and Prevention (CDC) influenza A(H5) assay before being sent to CDC for further testing. Specimens from the individuals were positive for influenza A(H5) virus using diagnostic rRT-PCR at CDC. Additional analysis including genetic sequencing is underway.

In response to these detections, additional case investigations and surveillance activities are being conducted by public health officials.

Twenty-five cases of human infections with influenza A(H5) viruses have been reported in the United States during 2024. Fifteen of these occurred in individuals working with dairy cows, nine in individuals associated with poultry depopulation and disposal, and one in an individual with an unknown source of exposure. An ongoing outbreak of avian influenza A(H5N1) continues in domestic dairy cows and poultry, and monitoring for additional human cases is ongoing.

Information about avian influenza is available at https://www.cdc.gov/flu/avianflu/index.htm.

Interim recommendations for Prevention, Monitoring, and Public Health Investigations are available at https://www.cdc.gov/bird-flu/prevention/hpai-interim-recommendations.html.

The latest case reports on avian influenza outbreaks in wild birds, commercial poultry, backyard or hobbyist flocks, and mammals in the United States are available from the USDA at https://www.aphis.usda.gov/aphis/ou...e-information/avian/avian-influenza/2022-hpai.

Additional information regarding human infections with novel influenza A viruses:‎

Surveillance Methods | FluView Interactive

Influenza Virus Characterization


CDC performs genetic and antigenic characterization of U.S. viruses submitted from state and local public health laboratories according to the Right Size Roadmap submission guidance. These data are used to compare how similar the currently circulating influenza viruses are to the reference viruses representing the current season's influenza vaccines. The data are also used to monitor evolutionary changes that continually occur in influenza viruses circulating in humans. CDC also tests susceptibility of circulating influenza viruses to antiviral medications including the neuraminidase inhibitors (oseltamivir, zanamivir, and peramivir) and the polymerase acidic protein (PA) endonuclease inhibitor baloxavir. The HA clade and subclades were assigned using Nextclade (Nextclade (nextstrain.org).

CDC has genetically characterized 649 influenza viruses collected since May 19, 2024.
A/H1239
5a.2a106 (44.4%)C.11 (0.4%)
C.1.9105 (43.9%)
5a.2a.1133 (55.6%)C.1.12 (0.8%)
D119 (49.8%)
D.21 (0.4%)
D.37 (2.9%)
D.44 (1.7%)
A/H3344
2a.3a1 (0.3%)G.1.3.11 (0.1%)
2a.3a.1343 (99.7%)J.110 (2.9%)
J.2333 (96.8%)
B/Victoria66
3a.266 (100%)C.52 (3.0%)
C.5.152 (78.8%)
C.5.68 (12.1%)
C.5.74 (6.1%)
B/Yamagata0
Y30Y30
CDC antigenically characterizes influenza viruses by hemagglutination inhibition (HI) assay (H1N1pdm09, H3N2, and B/Victoria viruses) or neutralization-based HINT (H3N2 viruses) using antisera that ferrets make after being infected with reference viruses representing the 2024-2025 Northern Hemisphere recommended cell or recombinant-based vaccine viruses. Antigenic differences between viruses are determined by comparing how well the antibodies made against the vaccine reference viruses recognize the circulating viruses that have been grown in cell culture. Ferret antisera are useful because antibodies raised against a particular virus can often recognize small changes in the surface proteins of other viruses. In HI assays, viruses with similar antigenic properties have antibody titer differences of less than or equal to 4-fold when compared to the reference (vaccine) virus. In HINT, viruses with similar antigenic properties have antibody neutralization titer differences of less than or equal to 8-fold. Viruses selected for antigenic characterization are a subset of the recent genetically characterized viruses and are chosen based on the genetic changes in their surface proteins and may not be proportional to the number of such viruses circulating in the United States.

Influenza A Viruses
  • A (H1N1)pdm09:54 A(H1N1)pdm09 viruses were antigenically characterized by HI, and 53 (98.1%) were well-recognized (reacting at titers that were within 4-fold of the homologous virus titer) by ferret antisera to cell-grown A/Wisconsin/67/2022-like reference viruses representing the A(H1N1)pdm09 component for the cell- and recombinant-based influenza vaccines.
  • (H3N2):143 A(H3N2) viruses were antigenically characterized by HI or HINT, and 113 (79.0%) were well-recognized (reacting at titers that were within 4-fold of the homologous virus titer in HI or reacting at titers that were less than or equal to 8-fold of the homologous virus in HINT) by ferret antisera to cell-grown A/Massachusetts/18/2022-like reference viruses representing the A(H3N2) component for the cell- and recombinant-based influenza vaccines.
Influenza B Viruses
  • B/Victoria:26 influenza B/Victoria-lineage virus were antigenically characterized by HI, and all were well-recognized (reacting at titers that were within 4-fold of the homologous virus titer) by ferret antisera to cell-grown B/Austria/1359417/2021-like reference viruses representing the B/Victoria component for the cell- and recombinant-based influenza vaccines.
  • B/Yamagata: No influenza B/Yamagata-lineage viruses were available for antigenic characterization.
Assessment of Virus Susceptibility to Antiviral Medications


CDC assesses susceptibility of influenza viruses to the antiviral medications including the neuraminidase inhibitors (oseltamivir, zanamivir, and peramivir) and the PA endonuclease inhibitor baloxavir using next generation sequence analysis supplemented by laboratory assays. Information about antiviral susceptibility test methods can be found at U.S. Influenza Surveillance: Purpose and Methods | CDC.

Viruses collected in the U.S. since May 19, 2024, were tested for antiviral susceptibility as follows:
Neuraminidase InhibitorsOseltamivirViruses Tested62522833463
Reduced Inhibition0000
Highly Reduced Inhibition2 (0.3%)2 (0.9%)00
PeramivirViruses Tested62522833463
Reduced Inhibition0000
Highly Reduced Inhibition2 (0.3%)2 (0.9%)00
ZanamivirViruses Tested62522833463
Reduced Inhibition0000
Highly Reduced Inhibition0000
PA Cap-Dependent Endonuclease InhibitorBaloxavirViruses Tested61420534267
Decreased Susceptibility0000
Two A(H1N1)pdm09 viruses had NA-H275Y amino acid substitution conferring highly reduced inhibition by oseltamivir and peramivir.

High levels of resistance to the adamantanes (amantadine and rimantadine) persist among influenza A(H1N1)pdm09 and influenza A(H3N2) viruses (the adamantanes are not effective against influenza B viruses). Therefore, use of these antivirals for treatment and prevention of influenza A virus infection is not recommended and data from adamantane resistance testing are not presented.

Outpatient respiratory illness surveillance


The U.S. Outpatient Influenza-like Illness Surveillance Network (ILINet) monitors outpatient visits for respiratory illness referred to as influenza-like illness [ILI (fever plus cough or sore throat)], not laboratory-confirmed influenza and will therefore capture respiratory illness visits due to infection with pathogens that can present with similar symptoms, including influenza viruses, SARS-CoV-2, and RSV. It is important to evaluate syndromic surveillance data, including that from ILINet, in the context of other sources of surveillance data to obtain a more complete and accurate picture of influenza, SARS-CoV-2, and other respiratory virus virus activity. CDC is providing integrated information about COVID-19, influenza, and RSV activity on a website that is updated weekly. Information about other respiratory virus activity can be found on CDC's National Respiratory and Enteric Virus Surveillance System (NREVSS) website.

Outpatient respiratory illness visits


Nationally, during Week 41, 2.1% of patient visits reported through ILINet were due to respiratory illness that included fever plus a cough or sore throat, also referred to as ILI. This week's percentage remained stable (change of ≤ 0.1 percentage points) compared to Week 40 and is below the national baseline of 3.0%. All 10 HHS regions are below their respective baselines. The percentage of visits for ILI increased in regions 2, 3, and 8, and remained stable in all other regions (1, 4, 5, 6, 7, 9, and 10) in Week 41 compared to Week 40. Multiple respiratory viruses are co-circulating, and the relative contribution of influenza virus infection to ILI varies by location.

Outpatient respiratory illness visits by age group


About 70% of ILINet participants provide both the number of patient visits for respiratory illness and the total number of patient visits for the week broken out by age group. Based on these data, the percentage of visits for respiratory illness increased (change of ≥ 0.1 percentage point) in the 0-4 years and 5-24 years age groups and remained stable (change of ≤ 0.1 percentage point) in the 25-49 years, 50-64 years, and 65+ years age groups in Week 41 compared to Week 40.

Outpatient respiratory illness activity map


Data collected in ILINet are used to produce a measure of ILI activity* by state/jurisdiction and Core Based Statistical Areas (CBSA).
Week 41
(Week ending
Oct. 12, 2024)
Week 40
(Week ending
Oct. 5, 2024)
Week 41
(Week ending
Oct. 12, 2024)
Week 40
(Week ending
Oct. 5, 2024)
Very High0000
High0010
Moderate0053
Low104329
Minimal5455649678
Insufficient Data00231219


*Data collected in ILINet may disproportionally represent certain populations within a jurisdiction or CBSA, and therefore, may not accurately depict the full picture of influenza activity for the entire jurisdiction or CBSA. Differences in the data presented here by CDC and independently by some health departments likely represent differing levels of data completeness with data presented by the health department likely being the more complete.

Additional information about medically attended visits for ILI for current and past seasons:‎

Surveillance Methods | FluView Interactive: National, Regional, and State Data or ILI Activity Map

National Syndromic Surveillance System (NSSP)


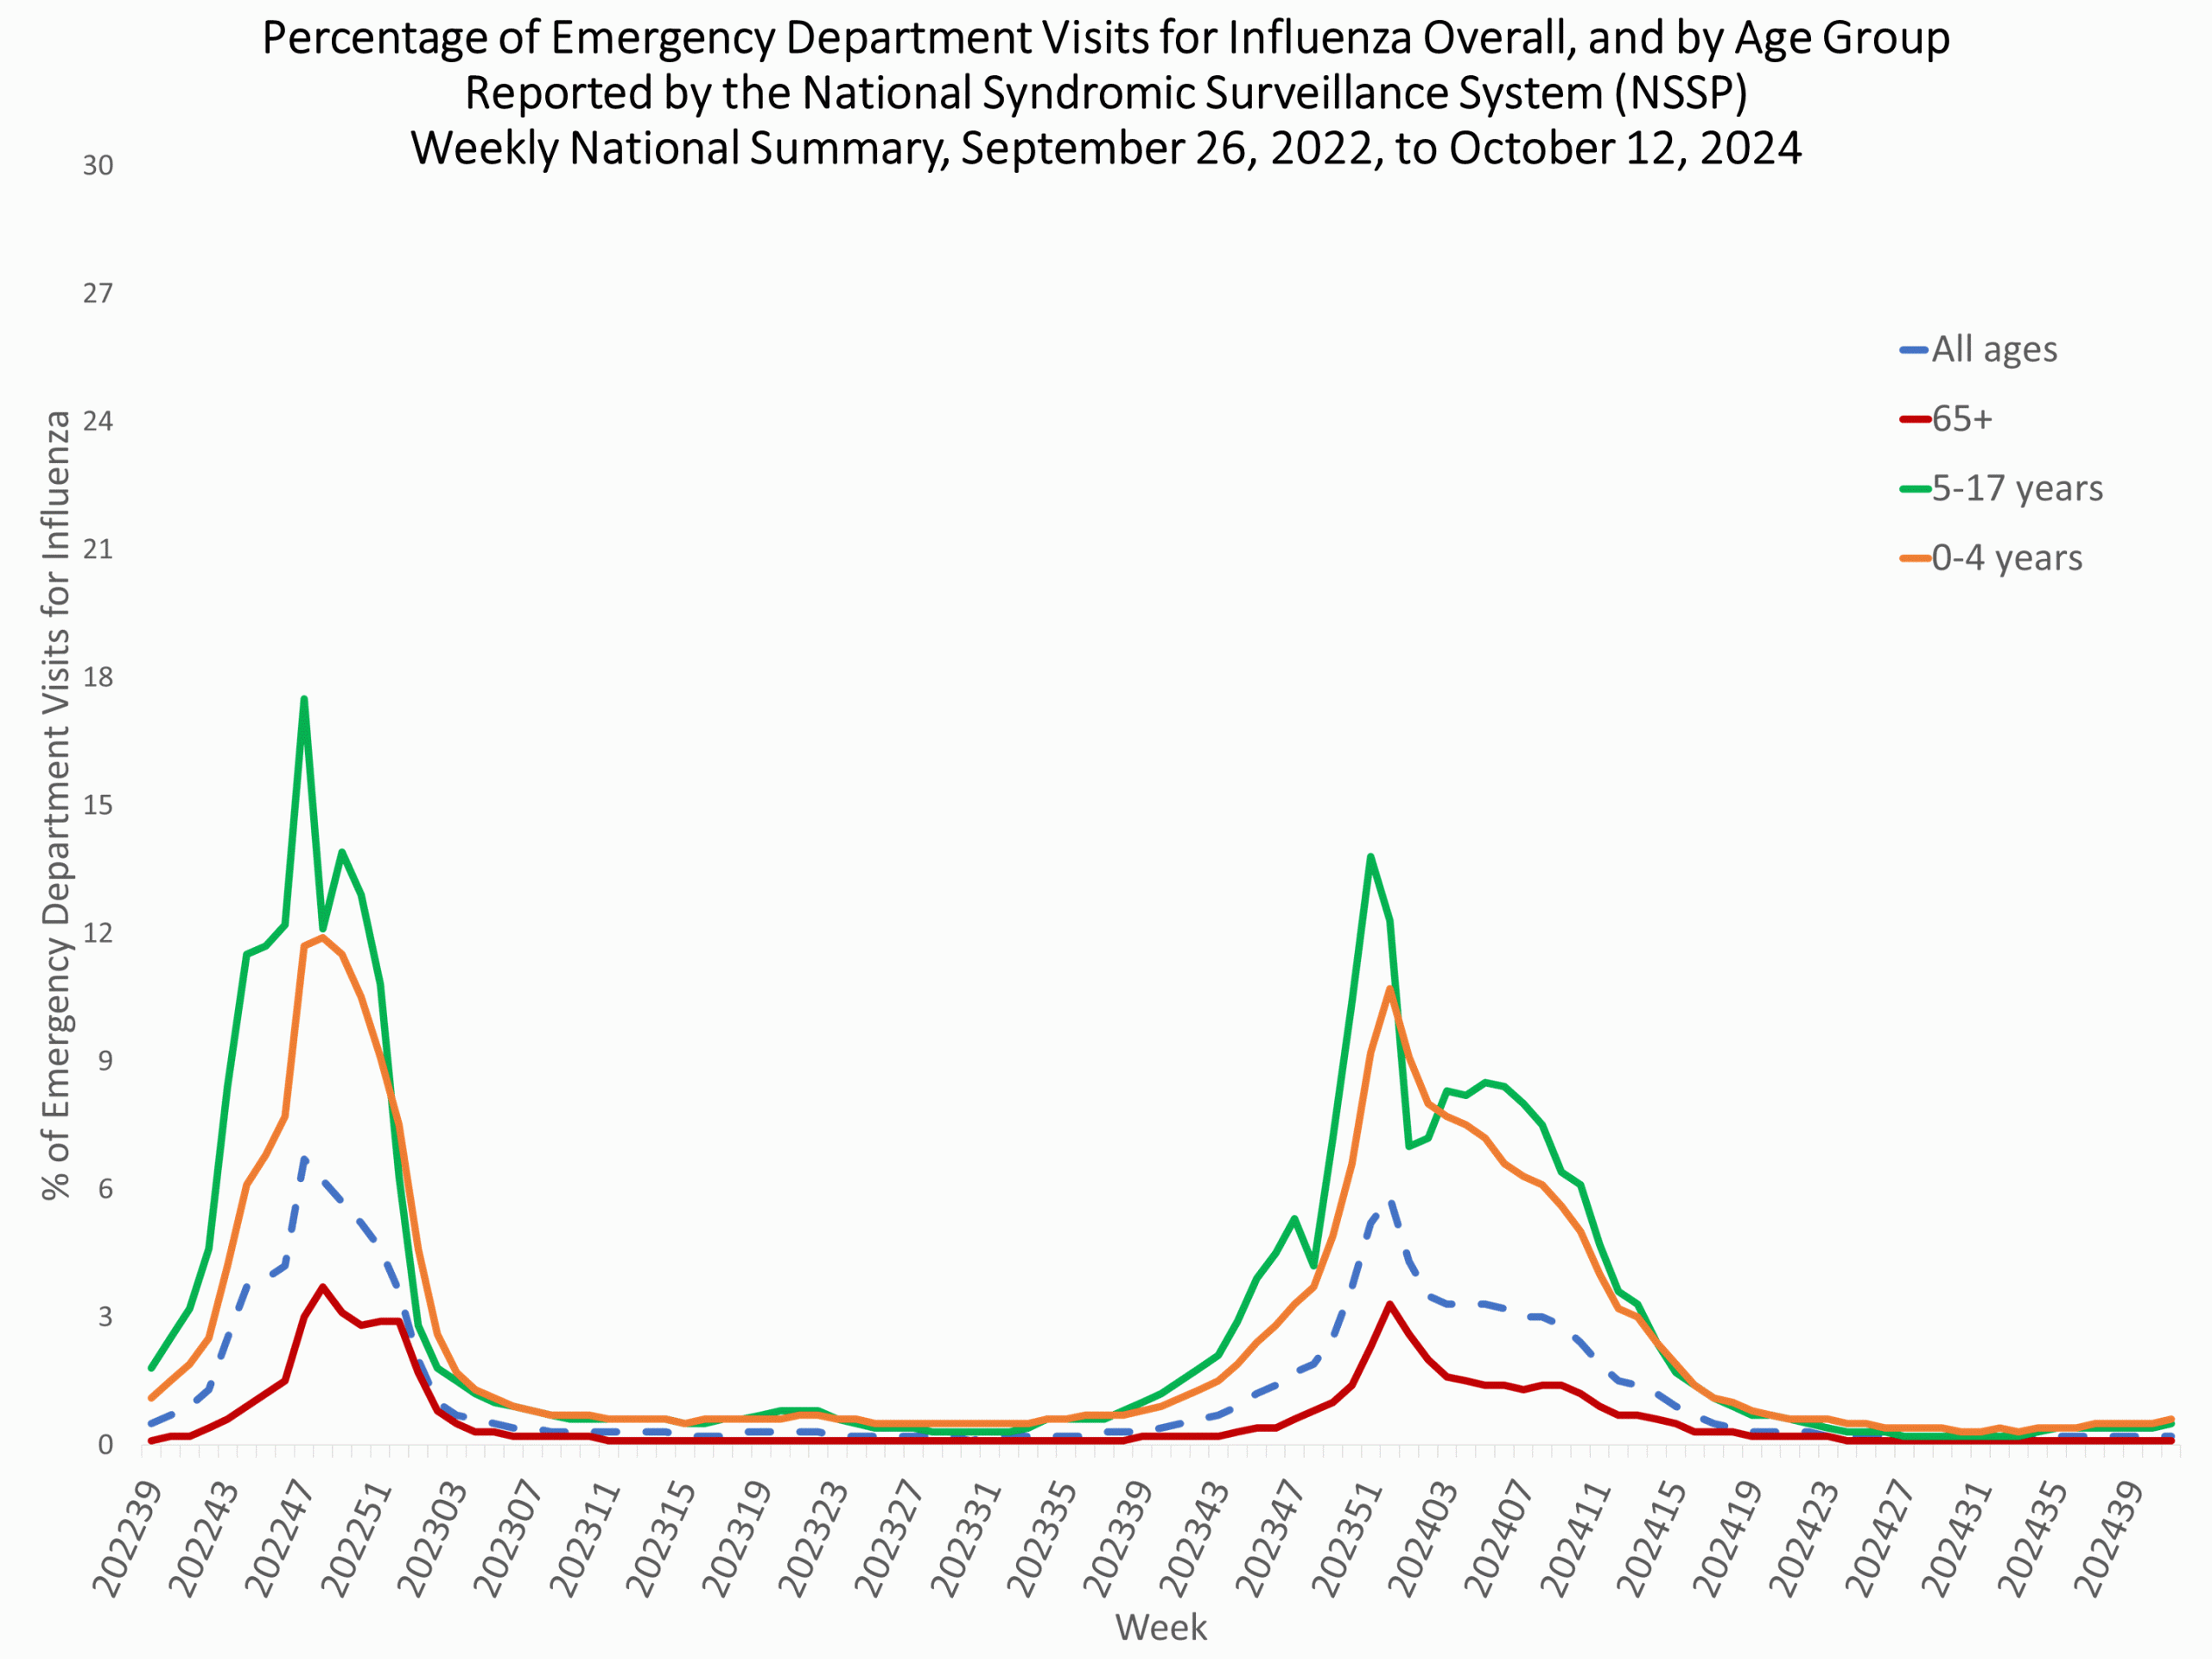
The percentage of emergency department (ED) visits with a discharge diagnosis of influenza reported in NSSP was 0.2% overall during Week 41. This week's percentage remained stable overall and among all age groups compared to the previous week. View Larger
NSSP41.gif
NSSP Age Rates Week 41 Additional information about emergency department visits for flu for current and past seasons:‎

Surveillance Methods | Emergency Department Visits for COVID-19, flu, and RSV

Hospitalization surveillance

FluSurv-Net


The Influenza Hospitalization Surveillance Network (FluSurv-NET) conducts population-based surveillance for laboratory-confirmed influenza-related hospitalizations in select counties in 14 states and represents approximately 9% of the U.S. population. FluSurv-NET hospitalization data are preliminary.

A total of 46 laboratory-confirmed influenza-associated hospitalizations were reported by FluSurv-NET sites between October 1 and October 12, 2024. The weekly hospitalization rate observed in Week 41 was 0.1 per 100,000 population.

[SUB]**In this figure, weekly rates for all seasons prior to the 2023-2024 season reflect end-of-season rates. For the 2023-2024 season, rates for recent hospital admissions are subject to reporting delays and are shown as a dashed line for the current season. As hospitalization data are received each week, prior case counts and rates are updated accordingly.[/SUB]

Additional FluSurv-NET hospitalization surveillance information for current and past seasons and additional age groups:‎

Surveillance Methods | FluView Interactive: Rates by Age, Sex, and Race/Ethnicity or Data on Patient Characteristics | RESP-NET Interactive

National healthcare safety network (NHSN) hospitalization surveillance


Effective November 1, 2024, all acute care and critical access hospitals will be required to report the number of patients admitted with laboratory-confirmed influenza to NHSN. These data will be updated weekly in FluView and on FluView Interactive once sufficient data has been collected. Public datasets, including data reported on a voluntary basis prior to November 1, can be found here: https://data.cdc.gov/Public-Health-...talization-Metrics-by-Ju/aemt-mg7g/about_data.

Additional NHSN Hospitalization Surveillance information:‎

Surveillance Methods | Additional Data | FluView Interactive


Mortality surveillance


Based on NCHS mortality surveillance data available on October 17, 2024, 0.04% of the deaths that occurred during the week ending October 12, 2024 (Week 41), were due to influenza. This percentage remained stable (≤ 0.1 percentage point change) compared to Week 40. The data presented are preliminary and may change as more data are received and processed.

Additional pneumonia, influenza and COVID-19 mortality surveillance information for current and past seasons:‎

Surveillance Methods | FluView Interactive

Influenza-Associated Pediatric Mortality


No influenza-associated pediatric deaths occurring during the 2024-2025 season have been reported to CDC.

One influenza-associated pediatric death occurring during the 2023-2024 season was reported to CDC during Week 41. The death was associated with an influenza A(H3) virus and occurred during Week 39 of 2024 (the week ending September 28, 2024). A total of 202 influenza-associated pediatric deaths that occurred during the 2023-2024 season have been reported to CDC.

Additional pediatric mortality surveillance information for current and past seasons:‎

Surveillance Methods | FluView Interactive

https://www.cdc.gov/fluview/surveillance/2024-week-41.html
 
Weekly US Influenza Surveillance Report: Key Updates for Week 42, ending October 19, 2024

What to know


Seasonal influenza activity remains low nationally.
Summary

Viruses

Clinical Lab 0.7% (Trend
StableArrow.png
)
positive for influenza
this week. Public Health Lab Influenza A(H1N1)pdm09 and A(H3N2)
viruses were co-circulating this week

. Illness

Outpatient Respiratory Illness

2.1% (Trend
StableArrow.png
)
of visits to a health care provider this
week were for respiratory illness
(below baseline).

Activity Map

1 moderate jurisdiction 0 high or very high jurisdictions

FluSurv-NET

0.1 per 100,000
weekly hospitalization rate

NCHS Mortality

0.05% (Trend
StableArrow.png
)
of deaths attributed to influenza this week. Pediatric Deaths

0 influenza-associated deaths
reported this week.
All data are preliminary and may change as more reports are received.

Directional arrows indicate changes between the current week and the previous week. Additional information on the arrows can be found at the bottom of this page.


A description of the CDC influenza surveillance system, including methodology and detailed descriptions of each data component is available on the surveillance methods page.1

Additional information on the current and previous influenza seasons for each surveillance component are available on FluView Interactive.


Key Points‎

• Season influenza activity remains low nationally.

• Percent positivity for influenza and the percentage of emergency department visits for influenza are stable at low levels.

• During Week 42, of the 97 viruses reported by public health laboratories, 94 were influenza A and 3 were influenza B. Of the 63 influenza A viruses subtyped during Week 42, 37 (58.7%) were influenza A(H1N1)pdm09 and 26 (41.3%) were A(H3N2).

• Six human infections with influenza A(H5) virus were reported to CDC this week.

• No influenza-associated pediatric deaths were reported this week.

• CDC recommends that everyone ages 6 months and older get an annual influenza (flu) vaccine, ideally by the end of October.[SUP]1[/SUP]

•There are prescription flu antiviral drugs that can treat flu illness; those should be started as early as possible and are especially important for higher risk patients.2

• Influenza viruses are among several viruses contributing to respiratory disease activity. CDC is providing updated, integrated information about COVID-19, flu, and respiratory syncytial virus (RSV) activity on a weekly basis.

COVID-19, flu, and RSV activity

U.S. virologic surveillance


Nationally and in all 10 HHS regions, the percentage of respiratory specimens testing positive for influenza virus in clinical laboratories remained stable (change of <0.5 percentage points) compared to the previous week. Influenza A(H1N1)pdm09 and A(H3N2) viruses are co-circulating; however, the distribution of circulating viruses varies by region. For regional and state level data and age group distribution, please visit FluView Interactive. Viruses known to be associated with recent receipt of live attenuated influenza vaccine (LAIV) or found upon further testing to be a vaccine virus are not included, as they are not circulating influenza viruses.

Clinical Laboratories


The results of tests performed by clinical laboratories nationwide are summarized below. Data from clinical laboratories (the percentage of specimens tested that are positive for influenza virus) are used to monitor whether influenza activity is increasing or decreasing.
No. of specimens tested62,800188,968
No. of positive specimens (%)436 (0.7%)1,304 (0.7%)
Positive specimens by type
Influenza A386 (88.5%)1,150 (88.2%)
Influenza B50 (11.5%)154 (11.8%)

Public Health Laboratories


The results of tests performed by public health laboratories nationwide are summarized below. Data from public health laboratories are used to monitor the proportion of circulating influenza viruses that belong to each influenza subtype/lineage.
No. of specimens tested7942,970
No. of positive specimens97395
Positive specimens by type/subtype
Influenza A94 (96.9%)387 (98.0%)
Subtyping Performed63 (67.0%)312 (80.6%)
(H1N1)pdm0937 (58.7%)148 (47.4%)
H3N226 (41.3%)145 (46.5%)
H3N2v[SUP]†[/SUP]00
H5*019 (6.1%)
Subtyping not performed31 (33.0%)75 (19.4%)
Influenza B3 (3.1%)8 (2.0%)
Lineage testing performed3 (100.0%)7 (87.5%)
Yamagata lineage00
Victoria lineage3 (100.0%)7 (100.0%)
Lineage testing not performed01 (12.5%)
[SUB]*[/SUB][SUB]These data reflect specimens tested, and the number determined to be positive for influenza viruses at the public health labs (specimens tested is not the same as cases). The data do not reflect specimens tested only at CDC and could include more than one specimen tested per person. The guidance for influenza A/H5 virus testing recommends testing both a conjunctival and respiratory swab for people with conjunctivitis which has resulted in more specimens testing positive for influenza A/H5 virus than the number of human H5 cases.[/SUB][SUB] For more information on the number of people infected with A/H5 viruses, please visit the [/SUB][SUB]"How CDC is monitoring influenza data among people to better understand the current avian influenza A (H5N1) situation"[/SUB]

[SUP]†[/SUP][SUB]When an influenza virus that normally circulates in swine (but not people) is detected in a person, it is called a "variant" influenza virus. Most human infections with variant influenza viruses occur following exposure to swine, but human-to-human transmission can occur. It is important to note that in most cases, variant influenza viruses have not shown the ability to spread easily and sustainably from person to person.[/SUB]


[SUB]*This graph reflects the number of specimens tested and the number determined to be positive for influenza viruses at the public health lab (specimens tested is not the same as cases). It does not reflect specimens tested only at CDC and could include more than one specimen tested per person. Specimens tested as part of routine influenza surveillance as well as those tested as part of targeted testing for people exposed to influenza A(H5) are included.[/SUB]
Additional virologic surveillance information for current and past seasons:‎

Surveillance Methods | FluView Interactive: National, Regional, and State Data or Age Data

Novel Influenza A Virus Infections


Six human infections with influenza A(H5) viruses were reported to CDC this week. To date, human-to-human transmission of influenza A(H5) virus has not been identified in the United States.

Four of these infections were reported by the California Department of Public Health. These cases occurred among workers at commercial dairy cattle farms where highly pathogenic avian influenza (HPAI) A(H5N1) viruses had been detected in cows. There have now been 15 total confirmed human cases in California.

The other two infections were reported by the Washington State Department of Health. These cases occurred among workers performing depopulation activities at a commercial poultry facility where HPAI A (H5N1) viruses had been detected in birds. These are the first two confirmed human cases in Washington.

All six individuals with influenza A(H5) virus infection reported to CDC this week are aged >18 years. These individuals had mild symptoms, which they reported to local health department officials. Specimens were collected from the individuals and were initially tested at state or local public health laboratories using the Centers for Disease Control and Prevention (CDC) influenza A(H5) assay before being sent to CDC for further testing. Specimens from the individuals were positive for influenza A(H5) virus using diagnostic rRT-PCR at CDC. Additional analysis including genetic sequencing is underway.

In response to these detections, additional case investigations and surveillance activities are being conducted by public health officials in California and Washington.

Thirty-one cases of human infections with influenza A(H5) viruses have been reported in the United States during 2024. Nineteen of these occurred in individuals working with dairy cows, 11 in individuals associated with poultry depopulation and disposal, and one in an individual with an unknown source of exposure. An ongoing outbreak of avian influenza A(H5N1) continues in domestic dairy cows and poultry, and monitoring for additional human cases is ongoing.

Information about avian influenza is available at https://www.cdc.gov/flu/avianflu/index.htm.

Interim recommendations for Prevention, Monitoring, and Public Health Investigations are available at https://www.cdc.gov/bird-flu/prevention/hpai-interim-recommendations.html.

The latest case reports on avian influenza outbreaks in wild birds, commercial poultry, backyard or hobbyist flocks, and mammals in the United States are available from the USDA at https://www.aphis.usda.gov/aphis/ou...e-information/avian/avian-influenza/2022-hpai.

Additional information regarding human infections with novel influenza A viruses:‎

Surveillance Methods | FluView Interactive


Influenza Virus Characterization


CDC performs genetic and antigenic characterization of U.S. viruses submitted from state and local public health laboratories according to the Right Size Roadmap submission guidance. These data are used to compare how similar the currently circulating influenza viruses are to the reference viruses representing the current influenza vaccines. The data are also used to monitor evolutionary changes that continually occur in influenza viruses circulating in humans. CDC also tests susceptibility of circulating influenza viruses to antiviral medications including the neuraminidase inhibitors (oseltamivir, zanamivir, and peramivir) and the polymerase acidic protein (PA) endonuclease inhibitor baloxavir. The HA clade and subclades were assigned using Nextclade (https://clades.nextstrain.org).

CDC has genetically characterized 688 influenza viruses collected since May 19, 2024.
A/H1256
5a.2a108 (42.2%)C.11 (0.4%)
C.1.9107 (41.8%)
5a.2a.1148 (57.8%)C.1.12 (0.8%)
D134 (52.3%)
D.21 (0.4%)
D.37 (2.7%)
D.44 (1.6%)
A/H3365
2a.3a1 (0.3%)G.1.3.11 (0.3%)
2a.3a.1364 (99.7%)J.110 (2.7%)
J.2354 (97.0%)
B/Victoria67
3a.267 (100%)C.52 (3.0%)
C.5.152 (77.6%)
C.5.68 (11.9%)
C.5.75 (7.5%)
B/Yamagata0
Y30Y30
CDC antigenically characterizes influenza viruses by hemagglutination inhibition (HI) assay (H1N1pdm09, H3N2, and B/Victoria viruses) or neutralization-based HINT (H3N2 viruses) using antisera that ferrets make after being infected with reference viruses representing the 2024-2025 Northern Hemisphere recommended cell or recombinant-based vaccine viruses. Antigenic differences between viruses are determined by comparing how well the antibodies made against the vaccine reference viruses recognize the circulating viruses that have been grown in cell culture. Ferret antisera are useful because antibodies raised against a particular virus can often recognize small changes in the surface proteins of other viruses. In HI assays, viruses with similar antigenic properties have antibody titer differences of less than or equal to 4-fold when compared to the reference (vaccine) virus. In HINT, viruses with similar antigenic properties have antibody neutralization titer differences of less than or equal to 8-fold. Viruses selected for antigenic characterization are a subset of the recent genetically characterized viruses and are chosen based on the genetic changes in their surface proteins and may not be proportional to the number of such viruses circulating in the United States. Influenza A Viruses
  • A(H1N1)pdm09: 54 A(H1N1)pdm09 viruses were antigenically characterized by HI, and 53 (98.1%) were well-recognized (reacting at titers that were within 4-fold of the homologous virus titer) by ferret antisera to cell-grown A/Wisconsin/67/2022-like reference viruses representing the A(H1N1)pdm09 component for the cell- and recombinant-based influenza vaccines.
  • A(H3N2): 166 A(H3N2) viruses were antigenically characterized by HI or HINT, and 127 (76.5%) were well-recognized (reacting at titers that were within 4-fold of the homologous virus titer in HI or reacting at titers that were less than or equal to 8-fold of the homologous virus in HINT) by ferret antisera to cell-grown A/Massachusetts/18/2022-like reference viruses representing the A(H3N2) component for the cell- and recombinant-based influenza vaccines.
Influenza B Viruses
  • B/Victoria: 26 influenza B/Victoria-lineage virus were antigenically characterized by HI, and all were well-recognized (reacting at titers that were within 4-fold of the homologous virus titer) by ferret antisera to cell-grown B/Austria/1359417/2021-like reference viruses representing the B/Victoria component for the cell- and recombinant-based influenza vaccines.
  • B/Yamagata: No influenza B/Yamagata-lineage viruses were available for antigenic characterization.
Assessment of Virus Susceptibility to Antiviral Medications


CDC assesses susceptibility of influenza viruses to the antiviral medications including the neuraminidase inhibitors (oseltamivir, zanamivir, and peramivir) and the PA endonuclease inhibitor baloxavir using next generation sequence analysis supplemented by laboratory assays. Information about antiviral susceptibility test methods can be found at U.S. Influenza Surveillance: Purpose and Methods.

Viruses collected in the U.S. since May 19, 2024, were tested for antiviral susceptibility as follows:
Neuraminidase InhibitorsOseltamivirViruses Tested68825736764
Reduced Inhibition0000
Highly Reduced Inhibition2 (0.3%)2 (0.8%)00
PeramivirViruses Tested68825736764
Reduced Inhibition0000
Highly Reduced Inhibition2 (0.3%)2 (0.8%)00
ZanamivirViruses Tested68825736764
Reduced Inhibition0000
Highly Reduced Inhibition0000
PA Cap-Dependent Endonuclease InhibitorBaloxavirViruses Tested65022236167
Decreased Susceptibility0000
Two A(H1N1)pdm09 viruses had NA-H275Y amino acid substitution conferring highly reduced inhibition by oseltamivir and peramivir.

High levels of resistance to the adamantanes (amantadine and rimantadine) persist among influenza A(H1N1)pdm09 and influenza A(H3N2) viruses (the adamantanes are not effective against influenza B viruses). Therefore, use of these antivirals for treatment and prevention of influenza A virus infection is not recommended and data from adamantane resistance testing are not presented.

Outpatient and Emergency Department Illness Surveillance

Outpatient respiratory illness visits


The U.S. Outpatient Influenza-like Illness Surveillance Network (ILINet) monitors outpatient visits for respiratory illness referred to as influenza-like illness [ILI (fever plus cough or sore throat)], not laboratory-confirmed influenza, and will therefore capture respiratory illness visits due to infection with any pathogen that can present with similar symptoms, including influenza virus, SARS-CoV-2, and RSV. It is important to evaluate syndromic surveillance data, including that from ILINet, in the context of other sources of surveillance data to obtain a complete and accurate picture of influenza, SARS-CoV-2, and other respiratory virus activity.

Nationally, during Week 42, 2.1% of patient visits reported through ILINet were due to respiratory illness that included fever plus a cough or sore throat, also referred to as ILI. This week's percentage remained stable (change of ≤ 0.1 percentage points) compared to Week 41 and is below the national baseline of 3.0%. All 10 HHS regions are below their respective baselines. The percentage of visits for ILI increased slightly in regions 1 and 3, decreased slightly in regions 6 and 8, and remained stable in all other regions (2, 4, 5, 7, 9, and 10) in Week 42 compared to Week 41. Multiple respiratory viruses are co-circulating, and the relative contribution of influenza virus infection to ILI varies by location.

Outpatient respiratory illness visits by age group


About 70% of ILINet participants provide both the number of patient visits for respiratory illness and the total number of patient visits for the week broken out by age group. Based on these data, the percentage of visits for respiratory illness increased (change of ≥ 0.1 percentage point) in the 0-4 years age group and remained stable (change of ≤ 0.1 percentage point) in the 5-24 years, 25-49 years, 50-64 years, and 65+ years age groups in Week 42 compared to Week 41.

Outpatient respiratory illness activity map


Data collected in ILINet are used to produce a measure of ILI activity* by state/jurisdiction and Core Based Statistical Areas (CBSA).
Week 42
(Week ending
Oct. 19, 2024)
Week 41
(Week ending
Oct. 12, 2024)
Week 42
(Week ending
Oct. 19, 2024)
Week 41
(Week ending
Oct. 12, 2024)
Very High0000
High0021
Moderate1095
Low516043
Minimal4954621657
Insufficient Data00237223


*Data collected in ILINet may disproportionally represent certain populations within a jurisdiction or CBSA, and therefore, may not accurately depict the full picture of influenza activity for the entire jurisdiction or CBSA. Differences in the data presented here by CDC and independently by some health departments likely represent differing levels of data completeness with data presented by the health department likely being the more complete. Additional information about medically attended visits for ILI for current and past seasons:‎

Surveillance Methods | FluView Interactive: National, Regional, and State Data or ILI Activity Map

National Syndromic Surveillance System (NSSP)


The overall percentage of emergency department (ED) visits with a discharge diagnosis of influenza reported in NSSP was 0.2% during Week 42. Nationally, in all ten HHS regions and among all age groups, the percentage of ED visits for influenza remained stable compared to the previous week. View Larger
NSSP42.gif
Additional information about emergency department visits for flu for current and past seasons:‎

Surveillance Methods | Emergency Department Visits for COVID-19, flu, and RSV

Hospitalization surveillance

FluSurv-Net


The Influenza Hospitalization Surveillance Network (FluSurv-NET) conducts population-based surveillance for laboratory-confirmed influenza-related hospitalizations in select counties in 14 states and represents approximately 9% of the U.S. population. FluSurv-NET hospitalization data are preliminary. As data are received each week, prior case counts and rates are updated accordingly.

A total of 93 laboratory-confirmed influenza-associated hospitalizations were reported by FluSurv-NET sites between October 1 and October 19, 2024. The weekly hospitalization rate observed in week 42 was 0.1 per 100,000 population. The cumulative hospitalization rate observed in week 42 was 0.3 per 100,000 population.


[SUB]**In this figure, weekly rates for all seasons prior to the 2024-2025 season reflect end-of-season rates. For the 2024-2025 season, rates for recent hospital admissions are subject to reporting delays and are shown as a dashed line for the current season. As hospitalization data are received each week, prior case counts and rates are updated accordingly.[/SUB]

Additional FluSurv-NET hospitalization surveillance information for current and past seasons and additional age groups:‎

Surveillance Methods | FluView Interactive: Rates by Age, Sex, and Race/Ethnicity or Data on Patient Characteristics | RESP-NET Interactive

National healthcare safety network (NHSN) hospitalization surveillance


Effective November 1, 2024, all acute care and critical access hospitals will be required to report the number of patients admitted with laboratory-confirmed influenza to NHSN. These data will be updated weekly in FluView and on FluView Interactive once sufficient data has been collected. Public datasets, including data reported on a voluntary basis prior to November 1, can be found here: https://data.cdc.gov/Public-Health-...talization-Metrics-by-Ju/aemt-mg7g/about_data.

Additional NHSN Hospitalization Surveillance information:‎

Surveillance Methods | Additional Data | FluView Interactive


Mortality surveillance


Based on NCHS mortality surveillance data available on October 24, 2024, 0.05% of the deaths that occurred during the week ending October 19, 2024 (Week 42), were due to influenza. This percentage remained stable (≤ 0.1 percentage point change) compared to Week 41. The data presented are preliminary and may change as more data are received and processed.

Additional pneumonia, influenza and COVID-19 mortality surveillance information for current and past seasons:‎

Surveillance Methods | FluView Interactive

Influenza-Associated Pediatric Mortality


No influenza-associated pediatric deaths occurring during the 2024-2025 season have been reported to CDC.

Additional pediatric mortality surveillance information for current and past seasons:‎

Surveillance Methods | FluView Interactive

https://www.cdc.gov/fluview/surveillance/2024-week-42.html
 
Weekly US Influenza Surveillance Report: Key Updates for Week 43, ending October 26, 2024

What to know


Seasonal influenza activity remains low nationally.

Summary

Viruses

Clinical Lab 1% (Trend
StableArrow.png
)
positive for influenza
this week. Public Health Lab Influenza A(H1N1)pdm09 and A(H3N2)
viruses were co-circulating this week.

Illness

Outpatient Respiratory Illness 2.2% (Trend
StableArrow.png
)
of visits to a health care provider this
week were for respiratory illness
(below baseline). Activity Map 1 moderate jurisdiction 0 high or very high jurisdictions FluSurv-NET 0.4 per 100,000
cumulative hospitalization rate NCHS Mortality 0.03% (Trend
StableArrow.png
)
of deaths attributed to influenza this week. Pediatric Deaths 0 influenza-associated deaths occurring during the
2024-2025 season were reported this week.
All data are preliminary and may change as more reports are received.

Directional arrows indicate changes between the current week and the previous week. Additional information on the arrows can be found at the bottom of this page.


A description of the CDC influenza surveillance system, including methodology and detailed descriptions of each data component is available on the surveillance methods page.1

Additional information on the current and previous influenza seasons for each surveillance component are available on FluView Interactive.


Key Points‎

• Seasonal influenza activity remains low nationally.

• Percent positivity for influenza and the percentage of emergency department visits for influenza are stable at low levels.

• During Week 43, of the 98 viruses reported by public health laboratories, 93 were influenza A and 5 were influenza B. Of the 62 influenza A viruses subtyped during Week 43, 20 (32.3%) were influenza A(H1N1)pdm09, 35 (56.5%) were A(H3N2), and 7 (11.3%) were A(H5).

• Eight human infections with influenza A(H5) virus were reported to CDC this week.

• No influenza-associated pediatric deaths occurring during the 2024-2025 season were reported this week. However, one pediatric death occurring during the 2023-2024 season was reported. This brings last season's total to 203 influenza associated pediatric deaths.

• CDC recommends that everyone ages 6 months and older get an annual influenza (flu) vaccine, ideally by the end of October.[SUP]1[/SUP]

• There are prescription flu antiviral drugs that can treat flu illness; those should be started as early as possible and are especially important for higher risk patients.2

• Influenza viruses are among several viruses contributing to respiratory disease activity. CDC is providing updated, integrated information about COVID-19, flu, and respiratory syncytial virus (RSV) activity on a weekly basis.


COVID-19, flu, and RSV activity


U.S. virologic surveillance


Nationally and in all 10 HHS regions, the percentage of respiratory specimens testing positive for influenza virus in clinical laboratories remained low and stable (change of <0.5 percentage points) compared to the previous week. Influenza A(H1N1)pdm09 and A(H3N2) viruses are co-circulating; however, the distribution of circulating viruses varies by region. For regional and state level data and age group distribution, FluView Interactive. Viruses known to be associated with recent receipt of live attenuated influenza vaccine (LAIV) or found upon further testing to be a vaccine virus are not included, as they are not circulating influenza viruses.

Clinical Laboratories


The results of tests performed by clinical laboratories nationwide are summarized below. Data from clinical laboratories (the percentage of specimens tested that are positive for influenza virus) are used to monitor whether influenza activity is increasing or decreasing.
No. of specimens tested60,464256,880
No. of positive specimens (%)594 (1.0%)1,982 (0.8%)
Positive specimens by type
Influenza A523 (88.0%)1,744 (88.0%)
Influenza B71 (12.0%)238 (12.0%)

Public Health Laboratories


The results of tests performed by public health laboratories nationwide are summarized below. Data from public health laboratories are used to monitor the proportion of circulating influenza viruses that belong to each influenza subtype/lineage.
No. of specimens tested1,2344,707
No. of positive specimens96617
Positive specimens by type/subtype
Influenza A91 (94.8%)594 (96.3%)
Subtyping Performed62 (68.1%)506 (85.2%)
(H1N1)pdm0920 (32.3%)220 (43.4%)
H3N235 (56.5%)249 (49.2%)
H3N2v0 (0.0%)0 (0.0%)
H5*7 (11.3%)37 (7.3%)
Subtyping not performed29 (31.9%)88 (14.8%)
Influenza B5 (5.1%)23 (3.7%)
Lineage testing performed4 (80.0%)19 (82.6%)
Yamagata lineage0 (0.0%)0 (0.0%)
Victoria lineage4 (100%)19 (100%)
Lineage not performed1 (20.0%)4 (17.4%)
[SUB]*This data reflects specimens tested and the number determined to be positive for influenza viruses at the public health labs (specimens tested is not the same as cases). It does not reflect specimens tested only at CDC and could include more than one specimen tested per person. The guidance for influenza A/H5 testing recommends testing both a conjunctival and respiratory swab for people with conjunctivitis which has resulted in more specimens testing positive for influenza A/H5 than the number of human H5 cases. For more information on the number of people infected with A/H5, please visit the [/SUB][SUB]"How CDC is monitoring influenza data among people to better understand the current avian influenza A (H5N1) situation"[/SUB]


[SUB]This graph reflects the number of specimens tested and the number determined to be positive for influenza viruses at the public health lab (specimens tested is not the same as cases). It does not reflect specimens tested only at CDC and could include more than one specimen tested per person. Specimens tested as part of routine influenza surveillance as well as those tested as part of targeted testing for people exposed to influenza A(H5) are included.[/SUB]

Additional virologic surveillance information for current and past seasons:‎

Surveillance Methods | FluView Interactive: National, Regional, and State Data or Age Data

Novel Influenza A Virus Infections


Eight confirmed human infections with influenza A(H5) viruses were reported to CDC this week. To date, human-to-human transmission of influenza A(H5) virus has not been identified in the United States.

One confirmed case was reported by the California Department of Public Health. This case occurred in a worker at a commercial dairy cattle farm where highly pathogenic avian influenza (HPAI) A(H5N1) viruses had been detected in cows. There have now been 16 total confirmed human cases in California.

Seven confirmed cases were reported by the Washington State Department of Health. These cases occurred among workers performing depopulation activities at a commercial poultry facility where HPAI A (H5N1) viruses had been detected in birds. There have now been nine total confirmed human cases in Washington.

All 8 individuals with confirmed influenza A(H5) virus infection reported to CDC this week are aged >18 years. These individuals had mild symptoms, which they reported to local health department officials. Specimens were collected from the individuals and were initially tested at state or local public health laboratories using the CDC influenza A(H5) assay before being sent to CDC for further testing. Specimens from the individuals were positive for influenza A(H5) virus using diagnostic rRT-PCR at CDC. Additional analysis including genetic sequencing is underway.

In response to these detections, additional case investigations and surveillance activities are being conducted by public health officials in California and Washington.

An up-to-date human case summary during the 2024 outbreak by state and exposure source is available at www.cdc.gov/bird-flu/situation-summary/index.html

Information about avian influenza is available at https://www.cdc.gov/flu/avianflu/index.htm.

Interim recommendations for Prevention, Monitoring, and Public Health Investigations are available at https://www.cdc.gov/bird-flu/prevention/hpai-interim-recommendations.html.

The latest case reports on avian influenza outbreaks in wild birds, commercial poultry, backyard or hobbyist flocks, and mammals in the United States are available from the USDA at https://www.aphis.usda.gov/aphis/ou...e-information/avian/avian-influenza/2022-hpai.
\
Additional information regarding human infections with novel influenza A viruses:‎

Surveillance Methods | FluView Interactive

Influenza Virus Characterization


CDC performs genetic and antigenic characterization of U.S. viruses submitted from state and local public health laboratories according to the Right Size Roadmap submission guidance. These data are used to compare how similar the currently circulating influenza viruses are to the reference viruses representing viruses contained in the current influenza vaccines. The data are also used to monitor evolutionary changes that continually occur in influenza viruses circulating in humans. CDC also tests susceptibility of circulating influenza viruses to antiviral medications including the neuraminidase inhibitors (oseltamivir, zanamivir, and peramivir) and the PA endonuclease inhibitor baloxavir. The HA clade and subclades were assigned using Nextclade (https://clades.nextstrain.org).

CDC has genetically characterized 746 influenza viruses collected since May 19, 2024.
A/H1239
5a.2a133 (44.5%)C.11 (0.3%)
C.1.9132 (44.1%)
5a.2a.1166 (55.5%)C.1.12 (0.7%)
D150 (50.2%)
D.11 (0.3%)
D.21 (0.3%)
D.38 (2.7%)
D.44 (1.3%)
A/H3344
2a.3a1 (0.3%)G.1.3.11 (0.3%)
2a.3a.1343 (99.7%)J.110 (2.7%)
J.2366 (97.1%)
B/Victoria66
3a.266 (100%)C.52 (2.9%)
C.5.154 (77.1%)
C.5.69 (12.9%)
C.5.75 (7.1%)
B/Yamagata0
Y30Y30
CDC antigenically characterizes influenza viruses by hemagglutination inhibition (HI) (H1N1pdm09, H3N2, B/Victoria, and B/Yamagata viruses) or neutralization-based HINT (H3N2 viruses) using antisera that ferrets make after being infected with reference viruses representing the 2023-2024 Northern Hemisphere recommended cell or recombinant-based vaccine viruses. Antigenic differences between viruses are determined by comparing how well the antibodies made against the vaccine reference viruses recognize the circulating viruses that have been grown in cell culture. Ferret antisera are useful because antibodies raised against a particular virus can often recognize small changes in the surface proteins of other viruses. In HI assays, viruses with similar antigenic properties have antibody titer differences of less than or equal to 4-fold when compared to the reference (vaccine) virus. In HINT, viruses with similar antigenic properties have antibody neutralization titer differences of less than or equal to 8-fold. Viruses selected for antigenic characterization are a subset representing the genetic changes in the surface proteins and may not be proportional to the number of such viruses circulating in the United States.

Influenza A Viruses
  • A (H1N1)pdm09: 64 A(H1N1)pdm09 viruses were antigenically characterized by HI, and 61 (95.3%) were well-recognized (reacting at titers that were within 4-fold of the homologous virus titer) by ferret antisera to cell-grown A/Wisconsin/67/2022-like reference viruses representing the A(H1N1)pdm09 component for the cell- and recombinant-based influenza vaccines.
  • A (H3N2): 166 A(H3N2) viruses were antigenically characterized by HI or HINT, and 127 (76.5%) were well-recognized (reacting at titers that were within 4-fold of the homologous virus titer in HI or reacting at titers that were less than or equal to 8-fold of the homologous virus in HINT) by ferret antisera to cell-grown A/Massachusetts/18/2022-like reference viruses representing the A(H3N2) component for the cell- and recombinant-based influenza vaccines.
Influenza B Viruses
  • B/Victoria: 26 influenza B/Victoria-lineage virus were antigenically characterized by HI, and all were well-recognized (reacting at titers that were within 4-fold of the homologous virus titer) by ferret antisera to cell-grown B/Austria/1359417/2021-like reference viruses representing the B/Victoria component for the cell- and recombinant-based influenza vaccines.
  • B/Yamagata: No influenza B/Yamagata-lineage viruses were available for antigenic characterization.
Assessment of Virus Susceptibility to Antiviral Medications


CDC assesses susceptibility of influenza viruses to the antiviral medications including the neuraminidase inhibitors (oseltamivir, zanamivir, and peramivir) and the PA endonuclease inhibitor baloxavir using next generation sequence analysis supplemented by laboratory assays. Information about antiviral susceptibility test methods can be found at U.S. Influenza Surveillance: Purpose and Methods.

Viruses collected in the U.S. since May 19, 2024, were tested for antiviral susceptibility as follows:
Neuraminidase InhibitorsOseltamivirViruses Tested73629637466
Reduced Inhibition0000
Highly Reduced Inhibition2 (0.3%)2 (0.7%)00
PeramivirViruses Tested73629637466
Reduced Inhibition0000
Highly Reduced Inhibition2 (0.3%)2 (0.7%)00
ZanamivirViruses Tested73629637466
Reduced Inhibition0000
Highly Reduced Inhibition0000
PA Cap-Dependent Endonuclease InhibitorBaloxavirViruses Tested69025436670
Decreased Susceptibility0000
Two A(H1N1)pdm09 viruses had NA-H275Y amino acid substitution conferring highly reduced inhibition by oseltamivir and peramivir.

High levels of resistance to the adamantanes (amantadine and rimantadine) persist among influenza A(H1N1)pdm09 and influenza A(H3N2) viruses (the adamantanes are not effective against influenza B viruses). Therefore, use of these antivirals for treatment and prevention of influenza A virus infection is not recommended and data from adamantane resistance testing are not presented.

Outpatient and Emergency Department Illness Surveillance

Outpatient respiratory illness visits


The U.S. Outpatient Influenza-like Illness Surveillance Network (ILINet) monitors outpatient visits for respiratory illness referred to as influenza-like illness [ILI (fever plus cough or sore throat)], not laboratory-confirmed influenza, and will therefore capture respiratory illness visits due to infection with any pathogen that can present with similar symptoms, including influenza virus, SARS-CoV-2, and RSV. It is important to evaluate syndromic surveillance data, including that from ILINet, in the context of other sources of surveillance data to obtain a complete and accurate picture of influenza, SARS-CoV-2, and other respiratory virus activity.

Nationally, during Week 43, 2.2% of patient visits reported through ILINet were due to respiratory illness that included fever plus a cough or sore throat, also referred to as ILI. This week's percentage remained stable (change of ≤ 0.1 percentage points) compared to Week 42 but is trending upwards slightly since early October. Nationally and in all 10 HHS regions, the percentage of visits for ILI are below their respective baselines. The percentage of visits for ILI increased in regions 4, 6, and 9, and remained stable in all other regions (1, 2, 3, 5, 7, 8, and 10) in Week 43 compared to Week 42. Multiple respiratory viruses are co-circulating, and the relative contribution of influenza virus infection to ILI varies by location.

Outpatient respiratory illness visits by age group


About 70% of ILINet participants provide both the number of patient visits for respiratory illness and the total number of patient visits for the week broken out by age group. Based on these data, the percentage of visits for respiratory illness increased (change of ≥ 0.1 percentage point) in the 0-4 years and 5-24 years age groups and remained stable (change of ≤ 0.1 percentage point) in the 25-49 years, 50-64 years, and 65+ years age groups in Week 43 compared to Week 42.

Outpatient respiratory illness activity map


Data collected in ILINet are used to produce a measure of ILI activity* by state/jurisdiction and Core Based Statistical Areas (CBSA).
Week 43
(Week ending
Oct. 26, 2024)
Week 42
(Week ending
Oct. 19, 2024)
Week 43
(Week ending
Oct. 26, 2024)
Week 42
(Week ending
Oct. 19, 2024)
Very High0000
High0042
Moderate11149
Low746661
Minimal4750612636
Insufficient Data00233221


*Data collected in ILINet may disproportionally represent certain populations within a jurisdiction or CBSA, and therefore, may not accurately depict the full picture of influenza activity for the entire jurisdiction or CBSA. Differences in the data presented here by CDC and independently by some health departments likely represent differing levels of data completeness with data presented by the health department likely being the more complete. Additional information about medically attended visits for ILI for current and past seasons:‎

Surveillance Methods | FluView Interactive: National, Regional, and State Data or ILI Activity Map

National Syndromic Surveillance System (NSSP)


The overall percentage of emergency department (ED) visits with a discharge diagnosis of influenza reported in NSSP was 0.3% during Week 43. Nationally, in all ten HHS regions and among all age groups, the percentage ED visits for influenza remained stable compared to the previous week (change of ≤ 0.1 percentage point). Make a selection from the filters to change the visualization information.
RegionNationalRegion 1Region 2Region 3Region 4Region 5Region 6Region 7Region 8Region 9Region 10
Season(s)2023-2024 & 2024-20252022-2023 Skip Over Chart Container
1.0%2.0%3.0%4.0%5.0%6.0%7.0%8.0%9.0%10.0%11.0%12.0 %13.0%Percent of Emergency Department Visits for InfluenzaWeek 43 of 2023Week 47 of 2023Week 51 of 2023Week 3 of 2024Week 7 of 2024Week 11 of 2024Week 15 of 2024Week 19 of 2024Week 23 of 2024Week 27 of 2024Week 31 of 2024Week 35 of 2024Week 39 of 2024Week 43 of 2024

Age Group

All ages
0-4 years
5-17 years
18-64 years
65+ Skip Data Table
Data Table Download Data (CSV) Skipped data table.

Additional information about emergency department visits for flu for current and past seasons:‎‎

Surveillance Methods | Emergency Department Visits for COVID-19, flu, and RSV

Hospitalization surveillance

FluSurv-Net


The Influenza Hospitalization Surveillance Network (FluSurv-NET) conducts population-based surveillance for laboratory-confirmed influenza-related hospitalizations in select counties in 14 states and represents approximately 9% of the U.S. population. FluSurv-NET hospitalization data are preliminary. As data are received each week, prior case counts and rates are updated accordingly.

A total of 134 laboratory-confirmed influenza-associated hospitalizations were reported by FluSurv-NET sites between October 1 and October 26, 2024. The weekly hospitalization rate observed in Week 43 was 0.1 per 100,000 population. The cumulative hospitalization rate observed in Week 43 was 0.4 per 100,000 population.


[SUB]**In this figure, weekly rates for all seasons prior to the 2023-2024 season reflect end-of-season rates. For the 2023-2024 season, rates for recent hospital admissions are subject to reporting delays and are shown as a dashed line for the current season. As hospitalization data are received each week, prior case counts and rates are updated accordingly.[/SUB]

Additional FluSurv-NET hospitalization surveillance information for current and past seasons and additional age groups:‎

Surveillance Methods | FluView Interactive: Rates by Age, Sex, and Race/Ethnicity or Data on Patient Characteristics | RESP-NET Interactive

National healthcare safety network (NHSN) hospitalization surveillance


Effective May 1, 2024, hospitals are no longer required to report hospital admissions, hospital capacity, or hospital occupancy data to HHS through NHSN. Voluntarily reported NHSN hospital data can found at Weekly United States Hospitalization Metrics by Jurisdiction.

Additional NHSN Hospitalization Surveillance information:‎

Surveillance Methods | Additional Data | FluView Interactive

Mortality surveillance


Based on NCHS mortality surveillance data available on October 31, 2024, 0.03% of the deaths that occurred during the week ending October 26, 2024 (Week 43), were due to influenza. This percentage remained stable (≤ 0.1 percentage point change) compared to Week 42. The data presented are preliminary and may change as more data are received and processed.

Additional pneumonia, influenza and COVID-19 mortality surveillance information for current and past seasons:‎

Surveillance Methods | FluView Interactive

Influenza-Associated Pediatric Mortality


No influenza-associated pediatric deaths occurring during the 2024-2025 season have been reported to CDC.

One influenza-associated pediatric death occurring during the 2023-2024 season was reported to CDC during Week 43. This death was associated with an influenza A(H3) virus and occurred during Week 15 of 2024 (the week ending April 13, 2024). A total of 203 influenza-associated pediatric deaths that occurred during the 2023-2024 season have been reported to CDC.

Additional pediatric mortality surveillance information for current and past seasons:‎

Surveillance Methods | FluView Interactive

https://www.cdc.gov/fluview/surveillance/2024-week-43.html
 
Weekly US Influenza Surveillance Report: Key Updates for Week 44, ending November 2, 2024

What to know


Influenza activity is increasing slightly among children, but remains low nationally.
Summary

Viruses

Clinical Lab 1.3% (Trend
StableArrow.png
)
positive for influenza
this week. Public Health Lab Influenza A(H1N1)pdm09 and A(H3N2)
viruses were co-circulating this week.

Illness

Outpatient Respiratory Illness 2.4% (Trend
IncreasingArrow.png
)
of visits to a health care provider this
week were for respiratory illness
(below baseline). Activity Map 0 moderate jurisdictions 1 high or very high jurisdiction FluSurv-NET 0.7 per 100,000
cumulative hospitalization rate NCHS Mortality 0.04% (Trend
StableArrow.png
)
of deaths attributed to influenza this week. Pediatric Deaths 1 influenza-associated death occurring during the
2024-2025 season was reported this week.
All data are preliminary and may change as more reports are received.

Directional arrows indicate changes between the current week and the previous week. Additional information on the arrows can be found at the bottom of this page.


A description of the CDC influenza surveillance system, including methodology and detailed descriptions of each data component is available on the surveillance methods page.1

Additional information on the current and previous influenza seasons for each surveillance component are available on FluView Interactive.

Key Points‎

• Seasonal influenza activity remains low nationally, although there are slight increases in the pediatric age groups.

• Percent positivity for influenza has trended upward slightly during the past few weeks and the percentage of emergency department visits for influenza increased slightly among pediatric age groups this week.

• During Week 44, of the 134 viruses reported by public health laboratories, 127 (94.8%) were influenza A and 7 (5.2%) were influenza B. Of the 105 influenza A viruses subtyped during Week 44, 55 (52.4%) were influenza A(H1N1)pdm09, 46 (43.8%) were A(H3N2), and 4 (3.8%) were A(H5).

• Seven confirmed and four probable human infections with influenza A(H5) viruses were reported to CDC this week. To date, human-to-human transmission of influenza A(H5) virus has not been identified in the United States.

• The first influenza-associated pediatric death occurring during the 2024-2025 season was reported this week. Also, one pediatric death occurring during the 2023-2024 season was reported this week. This brings last season's total to 204 influenza associated pediatric deaths.

• CDC recommends that everyone ages 6 months and older get an annual influenza (flu) vaccine.[SUP]1[/SUP]

• There are prescription flu antiviral drugs that can treat flu illness; those should be started as early as possible and are especially important for higher risk patients2.

• Influenza viruses are among several viruses contributing to respiratory disease activity. CDC is providing updated, integrated information about COVID-19, flu, and respiratory syncytial virus (RSV) activity on a weekly basis.


COVID-19, flu, and RSV activity


U.S. virologic surveillance


Nationally and in all 10 HHS regions, the percentage of respiratory specimens testing positive for influenza virus in clinical laboratories remained low. Influenza A(H1N1)pdm09 and A(H3N2) viruses are co-circulating; however, the distribution of circulating viruses varies by region. For regional and state level data and age group distribution, please visit FluView Interactive. Viruses known to be associated with recent receipt of live attenuated influenza vaccine (LAIV) or found upon further testing to be a vaccine virus are not included, as they are not circulating influenza viruses. Clinical Laboratories


The results of tests performed by clinical laboratories nationwide are summarized below. Data from clinical laboratories (the percentage of specimens tested that are positive for influenza virus) are used to monitor whether influenza activity is increasing or decreasing.
No. of specimens tested57,221324,682
No. of positive specimens (%)739 (1.3%)2,827 (0.9%)
Positive specimens by type
Influenza A682 (92.3%)2,518 (89.1%)
Influenza B57 (7.7%)309 (10.9%)
Public Health Laboratories


The results of tests performed by public health laboratories nationwide are summarized below. Data from public health laboratories are used to monitor the proportion of circulating influenza viruses that belong to each influenza subtype/lineage.
No. of specimens tested8695,998
No. of positive specimens134890
Positive specimens by type/subtype
Influenza A127 (94.8%)852 (95.7%)
Subtyping Performed105 (82.7%)746 (87.6%)
(H1N1)pdm0955 (52.4%)348 (46.6%)
H3N246 (43.8%)351 (47.1%)
H3N2v[SUP]†[/SUP]00
H5*4 (3.8%)47 (6.3%)
Subtyping not performed22 (17.3%)106 (12.4%)
Influenza B7 (5.2%)38 (4.3%)
Lineage testing performed1 (14.3%)27 (71.1%)
Yamagata lineage00
Victoria lineage1 (100%)27 (100%)
Lineage testing not performed6 (85.7%)11 (28.9%)
[SUB]*[/SUB][SUB]These data reflect specimens tested, and the number determined to be positive for influenza viruses at the public health labs (specimens tested is not the same as cases). The data do not reflect specimens tested only at CDC and could include more than one specimen tested per person. The guidance for influenza A/H5 virus testing recommends testing both a conjunctival and respiratory swab for people with conjunctivitis which has resulted in more specimens testing positive for influenza A/H5 virus than the number of human H5 cases. [/SUB][SUB]For more information on the number of people infected with A/H5, please visit the [/SUB][SUB]"How CDC is monitoring influenza data among people to better understand the current avian influenza A (H5N1) situation"[/SUB]

[SUP]†[/SUP][SUB]When an influenza virus that normally circulates in swine (but not people) is detected in a person, it is called a "variant" influenza virus. Most human infections with variant influenza viruses occur following exposure to swine, but human-to-human transmission can occur. It is important to note that in most cases, variant influenza viruses have not shown the ability to spread easily and sustainably from person to person.[/SUB]


[SUB]*This graph reflects the number of specimens tested and the number determined to be positive for influenza viruses at the public health lab (specimens tested is not the same as cases). It does not reflect specimens tested only at CDC and could include more than one specimen tested per person. Specimens tested as part of routine influenza surveillance as well as those tested as part of targeted testing for people exposed to influenza A(H5) are included.[/SUB] Additional virologic surveillance information for current and past seasons:‎

Surveillance Methods | FluView Interactive: National, Regional, and State Data or Age Data

Novel Influenza A Virus Infections


Seven confirmed and four probable human infections with influenza A(H5) viruses were reported to CDC this week. To date, human-to-human transmission of influenza A(H5) virus has not been identified in the United States.

Five confirmed cases and one probable case were reported by the California Department of Public Health. These cases occurred in workers at commercial dairy cattle farms in areas where highly pathogenic avian influenza (HPAI) A(H5N1) viruses had been detected in cows. There have now been 21 total confirmed cases and one probable human case in California.

Two confirmed and three probable cases were reported by the Washington State Department of Health. These cases occurred among workers performing depopulation activities at a commercial poultry facility where HPAI A (H5N1) viruses had been detected in birds. There have now been 11 total confirmed and three probable human cases in Washington.

All eleven individuals with confirmed or probable influenza A(H5) virus infection reported to CDC this week are aged >18 years. These individuals had mild symptoms, which they reported to local health department officials. Specimens were collected from the individuals and were initially tested at state or local public health laboratories using the CDC influenza A(H5) assay before being sent to CDC for further testing. Specimens from the confirmed cases were positive for influenza A(H5) virus using diagnostic rRT-PCR at CDC. Additional analysis including genetic sequencing is underway.

In response to these detections, additional case investigations and surveillance activities are being conducted by public health officials in California and Washington.

The CSTE position statement, which includes updated case definitions for confirmed, probable, and suspect cases is available at http://www.cste.org/resource/resmgr/position_statements_files_2023/24-ID-09_Novel_Influenza_A.pdf

An up-to-date human case summary during the 2024 outbreak by state and exposure source is available at www.cdc.gov/bird-flu/situation-summary/index.html

Information about avian influenza is available at https://www.cdc.gov/flu/avianflu/index.htm.

Interim recommendations for Prevention, Monitoring, and Public Health Investigations are available at https://www.cdc.gov/bird-flu/prevention/hpai-interim-recommendations.html.

The latest case reports on avian influenza outbreaks in wild birds, commercial poultry, backyard or hobbyist flocks, and mammals in the United States are available from the USDA at https://www.aphis.usda.gov/aphis/ou...e-information/avian/avian-influenza/2022-hpai.

Additional information regarding human infections with novel influenza A viruses:‎

Surveillance Methods | FluView Interactive


Influenza Virus Characterization


CDC performs genetic and antigenic characterization of U.S. viruses submitted from state and local public health laboratories according to the Right Size Roadmap submission guidance. These data are used to compare how similar the currently circulating influenza viruses are to the reference viruses representing the current influenza vaccines. The data are also used to monitor evolutionary changes that continually occur in influenza viruses circulating in humans. CDC also tests susceptibility of circulating influenza viruses to antiviral medications including the neuraminidase inhibitors (oseltamivir, zanamivir, and peramivir) and the polymerase acidic protein (PA) endonuclease inhibitor baloxavir. The HA clade and subclades were assigned using Nextclade (https://clades.nextstrain.org).

CDC has genetically characterized 772 influenza viruses collected since May 19, 2024.
A/H1309
5a.2a136 (44.0%)C.11 (0.3%)
C.1.9135 (43.7%)
5a.2a.1173 (56.0%)C.1.12 (0.6%)
D157 (50.8%)
D.11 (0.3%)
D.21 (0.3%)
D.38 (2.6%)
D.44 (1.3%)
A/H3391
2a.3a1 (0.3%)G.1.3.11 (0.3%)
2a.3a.1390 (99.7%)J.111 (2.8%)
J.2379 (96.9%)
B/Victoria72
3a.272 (100%)C.52 (2.8%)
C.5.155 (76.4%)
C.5.610 (13.9%)
C.5.75 (6.9%)
B/Yamagata0
Y30Y30
CDC antigenically characterizes influenza viruses by hemagglutination inhibition (HI) (H1N1pdm09, H3N2, and B/Victoria viruses) or neutralization-based HINT (H3N2 viruses) using antisera that ferrets make after being infected with reference viruses representing the 2024-2025 Northern Hemisphere recommended cell or recombinant-based vaccine viruses. Antigenic differences between viruses are determined by comparing how well the antibodies made against the vaccine reference viruses recognize the circulating viruses that have been grown in cell culture. Ferret antisera are useful because antibodies raised against a particular virus can often recognize small changes in the surface proteins of other viruses. In HI assays, viruses with similar antigenic properties have antibody titer differences of less than or equal to 4-fold when compared to the reference (vaccine) virus. In HINT, viruses with similar antigenic properties have antibody neutralization titer differences of less than or equal to 8-fold. Viruses selected for antigenic characterization are a subset of the recent genetically characterized viruses and are chosen based on the genetic changes in their surface proteins and may not be proportional to the number of such viruses circulating in the United States. Influenza A Viruses
  • A(H1N1)pdm09: 81 A(H1N1)pdm09 viruses were antigenically characterized by HI, and 78 (96.3%) were well-recognized (reacting at titers that were within 4-fold of the homologous virus titer) by ferret antisera to cell-grown A/Wisconsin/67/2022-like reference viruses representing the A(H1N1)pdm09 component for the cell- and recombinant-based influenza vaccines.
  • A(H3N2): 187 A(H3N2) viruses were antigenically characterized by HI or HINT, and 140 (74.9%) were well-recognized (reacting at titers that were within 4-fold of the homologous virus titer in HI or reacting at titers that were less than or equal to 8-fold of the homologous virus in HINT) by ferret antisera to cell-grown A/Massachusetts/18/2022-like reference viruses representing the A(H3N2) component for the cell- and recombinant-based influenza vaccines.
Influenza B Viruses
  • B/Victoria: 26 influenza B/Victoria-lineage virus were antigenically characterized by HI, and all were well-recognized (reacting at titers that were within 4-fold of the homologous virus titer) by ferret antisera to cell-grown B/Austria/1359417/2021-like reference viruses representing the B/Victoria component for the cell- and recombinant-based influenza vaccines.
  • B/Yamagata: No influenza B/Yamagata-lineage viruses were available for antigenic characterization.
Assessment of Virus Susceptibility to Antiviral Medications


CDC assesses susceptibility of influenza viruses to the antiviral medications including the neuraminidase inhibitors (oseltamivir, zanamivir, and peramivir) and the PA endonuclease inhibitor baloxavir using next generation sequence analysis supplemented by laboratory assays. Information about antiviral susceptibility test methods can be found at U.S. Influenza Surveillance: Purpose and Methods.

Viruses collected in the U.S. since May 19, 2024 were tested for antiviral susceptibility as follows:
Neuraminidase InhibitorsOseltamivirViruses Tested74429838066
Reduced Inhibition0000
Highly Reduced Inhibition2 (0.3%)2 (0.7%)00
PeramivirViruses Tested74429838066
Reduced Inhibition0000
Highly Reduced Inhibition2 (0.3%)2 (0.7%)00
ZanamivirViruses Tested74429838066
Reduced Inhibition0000
Highly Reduced Inhibition0000
PA Cap-Dependent Endonuclease InhibitorBaloxavirViruses Tested70126137070
Decreased Susceptibility0000
Two A(H1N1)pdm09 viruses had NA-H275Y amino acid substitution conferring highly reduced inhibition by oseltamivir and peramivir.

High levels of resistance to the adamantanes (amantadine and rimantadine) persist among influenza A(H1N1)pdm09 and influenza A(H3N2) viruses (the adamantanes are not effective against influenza B viruses). Therefore, use of these antivirals for treatment and prevention of influenza A virus infection is not recommended and data from adamantane resistance testing are not presented.

Outpatient and Emergency Department Illness Surveillance

Outpatient respiratory illness visits


The U.S. Outpatient Influenza-like Illness Surveillance Network (ILINet) monitors outpatient visits for respiratory illness referred to as influenza-like illness [ILI (fever plus cough or sore throat)], not laboratory-confirmed influenza, and will therefore capture respiratory illness visits due to infection with any pathogen that can present with similar symptoms, including influenza virus, SARS-CoV-2, and RSV. It is important to evaluate syndromic surveillance data, including that from ILINet, in the context of other sources of surveillance data to obtain a complete and accurate picture of influenza, SARS-CoV-2, and other respiratory virus activity.

Nationally, during Week 44, 2.5% of patient visits reported through ILINet were due to respiratory illness that included fever plus a cough or sore throat, also referred to as ILI. This week's percentage increased (change of > 0.1 percentage points) compared to Week 43. Nationally and in all 10 HHS regions, the percentage of visits for ILI are below their respective baselines. The percentage of visits for ILI increased in regions 4, 6, and 9, decreased in Region 7, and remained stable in all other regions (1, 2, 3, 5, 8, and 10) in Week 44 compared to Week 43. Multiple respiratory viruses are co-circulating, and the relative contribution of influenza virus infection to ILI varies by location.

Outpatient respiratory illness visits by age group


About 70% of ILINet participants provide both the number of patient visits for respiratory illness and the total number of patient visits for the week broken out by age group. Based on these data, the percentage of visits for respiratory illness increased (change of > 0.1 percentage point) in the 0-4 years and 25-49 years age groups and remained stable (change of ≤ 0.1 percentage point) in the 5-24 years, 50-64 years, and 65+ years age groups in Week 44 compared to Week 43.

Outpatient respiratory illness activity map


Data collected in ILINet are used to produce a measure of ILI activity* by state/jurisdiction and Core Based Statistical Areas (CBSA).
Week 44
(Week ending
Nov. 2, 2024)
Week 43
(Week ending
Oct. 26, 2024)
Week 44
(Week ending
Nov. 2, 2024)
Week 43
(Week ending
Oct. 26, 2024)
Very High0000
High1024
Moderate012214
Low677768
Minimal4847596622
Insufficient Data00232221


*Data collected in ILINet may disproportionally represent certain populations within a jurisdiction or CBSA, and therefore, may not accurately depict the full picture of influenza activity for the entire jurisdiction or CBSA. Differences in the data presented here by CDC and independently by some health departments likely represent differing levels of data completeness with data presented by the health department likely being the more complete.

Additional information about medically attended visits for ILI for current and past seasons:‎

Surveillance Methods | FluView Interactive: National, Regional, and State Data or ILI Activity Map

National Syndromic Surveillance System (NSSP)


The overall percentage of emergency department (ED) visits with a discharge diagnosis of influenza reported in NSSP was 0.3% during Week 44. Nationally, and in all ten HHS regions, the percentage ED visits for influenza remained stable (change of ≤ 0.1 percentage point) compared to the previous week. This percentage increased among the 0-4 years and 5-17 years age groups and remained stable among the 18-64 years and 65+ age groups. Make a selection from the filters to change the visualization information.
RegionNationalRegion 1Region 2Region 3Region 4Region 5Region 6Region 7Region 8Region 9Region 10
Season(s)2023-2024 & 2024-20252022-2023 Skip Over Chart Container
1.0%2.0%3.0%4.0%5.0%6.0%7.0%8.0%9.0%10.0%11.0%12.0 %13.0%Percent of Emergency Department Visits for InfluenzaWeek 40 of 2023Week 44 of 2023Week 48 of 2023Week 52 of 2023Week 4 of 2024Week 8 of 2024Week 12 of 2024Week 16 of 2024Week 20 of 2024Week 24 of 2024Week 28 of 2024Week 32 of 2024Week 36 of 2024Week 40 of 2024Week 44 of 2024 Age Group

All ages
0-4 years
5-17 years
18-64 years
65+ Skip Data Table
Data Table Download Data (CSV) Skipped data table.

Additional information about emergency department visits for flu for current and past seasons:‎‎‎

Surveillance Methods | Emergency Department Visits for COVID-19, flu, and RSV

Hospitalization surveillance

FluSurv-Net


The Influenza Hospitalization Surveillance Network (FluSurv-NET) conducts population-based surveillance for laboratory-confirmed influenza-related hospitalizations in select counties in 14 states and represents approximately 9% of the U.S. population. FluSurv-NET hospitalization data are preliminary. As data are received each week, prior case counts and rates are updated accordingly.

A total of 201 laboratory-confirmed influenza-associated hospitalizations were reported by FluSurv-NET sites between October 1 and November 2, 2024. The weekly hospitalization rate observed in Week 44 was 0.1 per 100,000 population. The cumulative hospitalization rate observed in Week 44 was 0.7 per 100,000 population.


[SUB]**In this figure, weekly rates for all seasons prior to the 2024-2025 season reflect end-of-season rates. For the 2024-2025 season, rates for recent hospital admissions are subject to reporting delays and are shown as a dashed line for the current season. As hospitalization data are received each week, prior case counts and rates are updated accordingly.[/SUB]

Additional FluSurv-NET hospitalization surveillance information for current and past seasons and additional age groups:‎

Surveillance Methods | FluView Interactive: Rates by Age, Sex, and Race/Ethnicity or Data on Patient Characteristics | RESP-NET Interactive

National healthcare safety network (NHSN) hospitalization surveillance


Effective November 1, 2024, all acute care and critical access hospitals are required to report the number of patients admitted with laboratory-confirmed influenza to NHSN. These data will be updated weekly in FluView and on FluView Interactive once sufficient data has been collected. Public datasets, including data reported on a voluntary basis prior to November 1, can be found here: https://data.cdc.gov/Public-Health-...talization-Metrics-by-Ju/aemt-mg7g/about_data.

Additional NHSN Hospitalization Surveillance information:‎

Surveillance Methods | Additional Data | FluView Interactive

Mortality surveillance


Based on NCHS mortality surveillance data available on November 7, 2024, 0.04% of the deaths that occurred during the week ending November 2, 2024 (Week 44), were due to influenza. This percentage remained stable (≤ 0.1 percentage point change) compared to Week 43. The data presented are preliminary and may change as more data are received and processed.

Additional pneumonia, influenza and COVID-19 mortality surveillance information for current and past seasons:‎

Surveillance Methods | FluView Interactive

Influenza-Associated Pediatric Mortality


Two influenza-associated pediatric deaths were reported to CDC during Week 44.

One death occurred during Week 41 (the week ending October 12, 2024) and was associated with an influenza A virus for which no subtyping was performed. This is the first influenza-associated pediatric death occurring during the 2024-2025 season that has been reported to CDC.

One death occurring during the 2023-2024 season was also reported, which brings the total number of pediatric deaths for last season to 204. This death was associated with an influenza A(H1N1) virus and occurred during Week 8 of 2024 (the week ending February 24, 2024).

Additional pediatric mortality surveillance information for current and past seasons:‎

Surveillance Methods | FluView Interactive

https://www.cdc.gov/fluview/surveillance/2024-week-44.html
 
Weekly US Influenza Surveillance Report: Key Updates for Week 45, ending November 9, 2024

What to know


Influenza activity is increasing slightly among children but remains low nationally.
Summary

Viruses

Clinical Lab 1.6% (Trend
StableArrow.png
)
positive for influenza
this week. Public Health Lab Influenza A(H1N1)pdm09 and A(H3N2)
viruses were co-circulating this week.

Illness

Outpatient Respiratory Illness 2.5% (Trend
StableArrow.png
)
of visits to a health care provider this
week were for respiratory illness
(below baseline). Activity Map 0 moderate jurisdictions 0 high or very high jurisdiction FluSurv-NET 0.9 per 100,000
cumulative hospitalization rate NCHS Mortality 0.07% (Trend
StableArrow.png
)
of deaths attributed to influenza this week. Pediatric Deaths 0 influenza-associated deaths occurring during the
2024-2025 season were reported this week.
All data are preliminary and may change as more reports are received.

Directional arrows indicate changes between the current week and the previous week. Additional information on the arrows can be found at the bottom of this page.


A description of the CDC influenza surveillance system, including methodology and detailed descriptions of each data component is available on the surveillance methods page.

Additional information on the current and previous influenza seasons for each surveillance component are available on FluView Interactive.


Key Points‎


• Seasonal influenza activity is increasing slightly among children but remains low nationally.

• Percent positivity for influenza has trended upward slightly during the past few weeks and the percentage of emergency department visits for influenza increased slightly among pediatric age groups this week.

• During Week 45, of the 192 viruses reported by public health laboratories, 183 (95.3%) were influenza A and 9 (4.7%) were influenza B. Of the 122 influenza A viruses subtyped during Week 45, 57 (46.7%) were influenza A(H1N1)pdm09, 63 (51.6%) were A(H3N2), and 2 (1.6%) were A(H5).

• Three confirmed human infections with influenza A(H5) viruses were reported to CDC this week. To date, human-to-human transmission of influenza A(H5) virus has not been identified in the United States.

• No new pediatric deaths were reported this week for the 2024-2025 season. One pediatric death occurring during the 2023-2024 season was reported this week. This brings last season's total to 205 influenza-associated pediatric deaths.

• CDC recommends that everyone ages 6 months and older get an annual influenza (flu) vaccine.[SUP]1[/SUP]

• There are prescription flu antiviral drugs that can treat flu illness; those should be started as early as possible and are especially important for higher risk.[SUP]2[/SUP]

• Influenza viruses are among several viruses contributing to respiratory disease activity. CDC is providing updated, integrated information about COVID-19, flu, and respiratory syncytial virus (RSV) activity on a weekly basis.

COVID-19, flu, and RSV activity

U.S. virologic surveillance


Nationally and in all 10 HHS regions, the percentage of respiratory specimens testing positive for influenza virus in clinical laboratories remained low. Influenza A(H1N1)pdm09 and A(H3N2) viruses are co-circulating; however, the distribution of circulating viruses varies by region. For regional and state level data and age group distribution, please visit FluView Interactive. Viruses known to be associated with recent receipt of live attenuated influenza vaccine (LAIV) or found upon further testing to be a vaccine virus are not included, as they are not circulating influenza viruses.

Clinical Laboratories


The results of tests performed by clinical laboratories nationwide are summarized below. Data from clinical laboratories (the percentage of specimens tested that are positive for influenza virus) are used to monitor whether influenza activity is increasing or decreasing.
No. of specimens tested59,198400,620
No. of positive specimens (%)947 (1.6%)3,908 (1.0%)
Positive specimens by type
Influenza A878 (92.7%)3,524 (90.2%)
Influenza B69 (7.3%)384 (9.8%)

Public Health Laboratories


The results of tests performed by public health laboratories nationwide are summarized below. Data from public health laboratories are used to monitor the proportion of circulating influenza viruses that belong to each influenza subtype/lineage.
No. of specimens tested9107,385
No. of positive specimens1921,298
Positive specimens by type/subtype
Influenza A183 (95.3%)1,236 (95.2%)
Subtyping Performed122 (66.7%)1,059 (85.7%)
(H1N1)pdm0957 (46.7%)499 (47.1%)
H3N263 (51.6%)511 (48.3%)
H3N2v00
H5*2 (1.6%)49 (4.6%)
Subtyping not performed61 (33.3%)177 (14.3%)
Influenza B9 (4.7%)62 (4.8%)
Lineage testing performed1 (11.1%)37 (59.7%)
Yamagata lineage00
Victoria lineage1 (100.0%)37 (100%)
Lineage not performed8 (88.9%)25 (40.3%)
[SUB]*This data reflects specimens tested and the number determined to be positive for influenza viruses at the public health labs (specimens tested is not the same as cases). It does not reflect specimens tested only at CDC and could include more than one specimen tested per person. The guidance for influenza A/H5 testing recommends testing both a conjunctival and respiratory swab for people with conjunctivitis which has resulted in more specimens testing positive for influenza A/H5 than the number of human H5 cases. For more information on the number of people infected with A/H5, please visit the [/SUB][SUB]"How CDC is monitoring influenza data among people to better understand the current avian influenza A (H5N1) situation"[/SUB]


[SUB]This graph reflects the number of specimens tested and the number determined to be positive for influenza viruses at the public health lab (specimens tested is not the same as cases). It does not reflect specimens tested only at CDC and could include more than one specimen tested per person. Specimens tested as part of routine influenza surveillance as well as those tested as part of targeted testing for people exposed to influenza A(H5) are included.[/SUB]

Additional virologic surveillance information for current and past seasons:‎

Surveillance Methods | FluView Interactive: National, Regional, and State Data or Age Data

Novel Influenza A Virus


Three confirmed human infections with influenza A(H5) viruses were reported to CDC this week by the California Department of Public Health. To date, human-to-human transmission of influenza A(H5) virus has not been identified in the United States.

These cases occurred in workers at commercial dairy cattle farms in areas where highly pathogenic avian influenza (HPAI) A(H5N1) viruses had been detected in cows. There have now been 24 total confirmed cases and one probable human case in California.

All three individuals reported this week are over than 18 years old. These individuals had mild symptoms, which they reported to local health department officials. Specimens were collected from the individuals and were initially tested at state or local public health laboratories using the CDC influenza A(H5) assay before being sent to CDC for further testing. Specimens from the confirmed cases were positive for influenza A(H5) virus using diagnostic RT-PCR at CDC. Additional analysis including genetic sequencing is underway.

In response to these detections, additional case investigations and surveillance activities are being conducted by public health officials in California and Washington.

The CSTE position statement, which includes updated case definitions for confirmed, probable, and suspect cases is available at http://www.cste.org/resource/resmgr/position_statements_files_2023/24-ID-09_Novel_Influenza_A.pdf

An up-to-date human case summary during the 2024 outbreak by state and exposure source is available at www.cdc.gov/bird-flu/situation-summary/index.html

Information about avian influenza is available at https://www.cdc.gov/flu/avianflu/index.htm.

Interim recommendations for Prevention, Monitoring, and Public Health Investigations are available at https://www.cdc.gov/bird-flu/prevention/hpai-interim-recommendations.html.

The latest case reports on avian influenza outbreaks in wild birds, commercial poultry, backyard or hobbyist flocks, and mammals in the United States are available from the USDA at https://www.aphis.usda.gov/aphis/ou...e-information/avian/avian-influenza/2022-hpai.

Additional information regarding human infections with novel influenza A viruses:‎

Surveillance Methods | FluView Interactive

Influenza Virus Characterization


CDC performs genetic and antigenic characterization of U.S. viruses submitted from state and local public health laboratories according to the Right Size Roadmap submission guidance. These data are used to compare how similar the currently circulating influenza viruses are relative to the reference viruses representing the current influenza vaccines. The data are also used to monitor evolutionary changes that continually occur in influenza viruses circulating in humans. CDC also tests susceptibility of circulating influenza viruses to antiviral medications including the neuraminidase inhibitors (oseltamivir, zanamivir, and peramivir) and the polymerase acidic protein (PA) endonuclease inhibitor baloxavir. The HA clade and subclades were assigned using Nextclade (https://clades.nextstrain.org).

CDC has genetically characterized 801 influenza viruses collected since May 19, 2024.
A/H1323
5a.2a141 (43.7%)C.11 (0.3%)
C.1.9140 (43.3%)
5a.2a.1182 (56.3%)C.1.12 (0.6%)
D166 (51.4%)
D.11 (0.3%)
D.21 (0.3%)
D.38 (2.5%)
D.44 (1.2%)
A/H3404
2a.3a1 (0.2%)G.1.3.11 (0.2%)
2a.3a.1403 (99.8%)J.111 (2.7%)
J.2392 (97.3%)
B/Victoria74
3a.274 (100%)C.53 (4.1%)
C.5.155 (74.3%)
C.5.611 (14.9%)
C.5.75 (6.8%)
B/Yamagata0
Y30Y30
CDC antigenically characterizes influenza viruses by hemagglutination inhibition (HI) assay (H1N1pdm09, H3N2, and B/Victoria viruses) or neutralization-based HINT (H3N2 viruses) using antisera that ferrets make after being infected with reference viruses representing the 2024-2025 Northern Hemisphere recommended cell or recombinant-based vaccine viruses. Antigenic differences between viruses are determined by comparing how well the antibodies made against the vaccine reference viruses recognize the circulating viruses that have been grown in cell culture. Ferret antisera are useful because antibodies raised against a particular virus can often recognize small changes in the surface proteins of other viruses. In HI assays, viruses with similar antigenic properties have antibody titer differences of less than or equal to 4-fold when compared to the reference (vaccine) virus. In HINT, viruses with similar antigenic properties have antibody neutralization titer differences of less than or equal to 8-fold. Viruses selected for antigenic characterization are a subset of the recent genetically characterized viruses and are chosen based on the genetic changes in their surface proteins and may not be proportional to the number of such viruses circulating in the United States.

Influenza A Viruses
  • A (H1N1)pdm09: 81 A(H1N1)pdm09 viruses were antigenically characterized by HI, and 78 (96.3%) were well-recognized (reacting at titers that were within 4-fold of the homologous virus titer) by ferret antisera to cell-grown A/Wisconsin/67/2022-like reference viruses representing the A(H1N1)pdm09 component for the cell- and recombinant-based influenza vaccines.
  • A(H3N2): 203 A(H3N2) viruses were antigenically characterized by HI or HINT, and 149 (73.4%) were well-recognized (reacting at titers that were within 4-fold of the homologous virus titer in HI or reacting at titers that were less than or equal to 8-fold of the homologous virus in HINT) by ferret antisera to cell-grown A/Massachusetts/18/2022-like reference viruses representing the A(H3N2) component for the cell- and recombinant-based influenza vaccines.
Influenza B Viruses
  • B/Victoria: 28 influenza B/Victoria-lineage virus were antigenically characterized by HI, and all were well-recognized (reacting at titers that were within 4-fold of the homologous virus titer) by ferret antisera to cell-grown B/Austria/1359417/2021-like reference viruses representing the B/Victoria component for the cell- and recombinant-based influenza vaccines.
  • B/Yamagata: No influenza B/Yamagata-lineage viruses were available for antigenic characterization.
Assessment of Virus Susceptibility to Antiviral Medications


CDC assesses susceptibility of influenza viruses to the antiviral medications including the neuraminidase inhibitors (oseltamivir, zanamivir, and peramivir) and the PA endonuclease inhibitor baloxavir using next generation sequence analysis supplemented by laboratory assays. Information about antiviral susceptibility test methods can be found at U.S. Influenza Surveillance: Purpose and Methods.

Viruses collected in the U.S. since May 19, 2024, were tested for antiviral susceptibility as follows:
Neuraminidase InhibitorsOseltamivirViruses Tested79331840273
Reduced Inhibition0000
Highly Reduced Inhibition2 (0.3%)2 (0.6%)00
PeramivirViruses Tested79331840273
Reduced Inhibition0000
Highly Reduced Inhibition2 (0.3%)2 (0.6%)00
ZanamivirViruses Tested79331840273
Reduced Inhibition0000
Highly Reduced Inhibition0000
PA Cap-Dependent Endonuclease InhibitorBaloxavirViruses Tested77528941175
Decreased Susceptibility0000
Two A(H1N1)pdm09 viruses had NA-H275Y amino acid substitution conferring highly reduced inhibition by oseltamivir and peramivir.

High levels of resistance to the adamantanes (amantadine and rimantadine) persist among influenza A(H1N1)pdm09 and influenza A(H3N2) viruses (the adamantanes are not effective against influenza B viruses). Therefore, use of these antivirals for treatment and prevention of influenza A virus infection is not recommended and data from adamantane resistance testing are not presented.

Outpatient and Emergency Department Illness Surveillance

Outpatient respiratory illness visits


The U.S. Outpatient Influenza-like Illness Surveillance Network (ILINet) monitors outpatient visits for respiratory illness referred to as influenza-like illness [ILI (fever plus cough or sore throat)], not laboratory-confirmed influenza, and will therefore capture respiratory illness visits due to infection with any pathogen that can present with similar symptoms, including influenza virus, SARS-CoV-2, and RSV. It is important to evaluate syndromic surveillance data, including that from ILINet, in the context of other sources of surveillance data to obtain a complete and accurate picture of influenza, SARS-CoV-2, and other respiratory virus activity.

Nationally, during Week 45, 2.5% of patient visits reported through ILINet were due to respiratory illness that included fever plus a cough or sore throat, also referred to as ILI. This week's percentage remained stable (change of ≤ 0.1 percentage points) compared to Week 44 but have been increasing slowly for the past three weeks. Nationally and in all 10 HHS regions, the percentage of visits for ILI are below their respective baselines. The percentage of visits for ILI increased in regions 4, 6, 8, and 9, and remained stable (change of ≤ 0.1 percentage points) in all other regions (1, 2, 3, 5, 7, and 10) in Week 45 compared to Week 44. Multiple respiratory viruses are co-circulating, and the relative contribution of influenza virus infections to ILI varies by location.

Outpatient respiratory illness visits by age group


About 70% of ILINet participants provide both the number of patient visits for respiratory illness and the total number of patient visits for the week broken out by age group. Based on these data, the percentage of visits for respiratory illness increased (change of > 0.1 percentage point) in the 0-4 years and 5-24 years age groups and remained stable (change of ≤ 0.1 percentage point) in the 25-49 years, 50-64 years, and 65+ years age groups in Week 45 compared to Week 44.

Outpatient respiratory illness activity map


Data collected in ILINet are used to produce a measure of ILI activity* by state/jurisdiction and Core Based Statistical Areas (CBSA).
Week 45
(Week ending
Nov. 9, 2024)
Week 44
(Week ending
Nov. 2, 2024)
Week 45
(Week ending
Nov. 9, 2024)
Week 44
(Week ending
Nov. 2, 2024)
Very High0000
High0083
Moderate011921
Low12710177
Minimal4347565599
Insufficient Data00236229


*Data collected in ILINet may disproportionally represent certain populations within a jurisdiction or CBSA, and therefore, may not accurately depict the full picture of influenza activity for the entire jurisdiction or CBSA. Differences in the data presented here by CDC and independently by some health departments likely represent differing levels of data completeness with data presented by the health department likely being the more complete.

Additional information about medically attended visits for ILI for current and past seasons:‎

Surveillance Methods | FluView Interactive: National, Regional, and State Data or ILI Activity Map

National Syndromic Surveillance System (NSSP)


The overall percentage of emergency department (ED) visits with a discharge diagnosis of influenza reported in NSSP was 0.4% during Week 45. Nationally, and in all ten HHS regions, the percentage ED visits for influenza remained stable (change of ≤ 0.1 percentage point) compared to the previous week. This percentage increased among the 5-17 years age group and remained stable (change of ≤ 0.1 percentage point) among the 0-4 years, 18-64 years, and 65+ years age groups. Make a selection from the filters to change the visualization information.
RegionNationalRegion 1Region 2Region 3Region 4Region 5Region 6Region 7Region 8Region 9Region 10
Season(s)2023-2024 & 2024-20252022-2023 Skip Over Chart Container

1.0%2.0%3.0%4.0%5.0%6.0%7.0%8.0%9.0%10.0%11.0%12.0 %13.0%Percent of Emergency Department Visits for InfluenzaWeek 41 of 2023Week 45 of 2023Week 49 of 2023Week 1 of 2024Week 5 of 2024Week 9 of 2024Week 13 of 2024Week 17 of 2024Week 21 of 2024Week 25 of 2024Week 29 of 2024Week 33 of 2024Week 37 of 2024Week 41 of 2024Week 45 of 2024

Age Group

All ages
0-4 years
5-17 years
18-64 years
65+ Skip Data Table
Data Table Download Data (CSV) Skipped data table.

Additional information about emergency department visits for flu for current and past seasons:‎‎‎‎

Surveillance Methods | Emergency Department Visits for COVID-19, flu, and RSV

Hospitalization surveillance

FluSurv-Net


The Influenza Hospitalization Surveillance Network (FluSurv-NET) conducts population-based surveillance for laboratory-confirmed influenza-related hospitalizations in select counties in 14 states and represents approximately 9% of the U.S. population. FluSurv-NET hospitalization data are preliminary. As data are received each week, prior case counts and rates are updated accordingly.

A total of 274 laboratory-confirmed influenza-associated hospitalizations were reported by FluSurv-NET sites between October 1 and November 9, 2024. The weekly hospitalization rate observed in Week 45 was 0.2 per 100,000 population. The cumulative hospitalization rate observed in Week 45 was 0.9 per 100,000 population.


[SUB]**In this figure, weekly rates for all seasons prior to the 2023-2024 season reflect end-of-season rates. For the 2023-2024 season, rates for recent hospital admissions are subject to reporting delays and are shown as a dashed line for the current season. As hospitalization data are received each week, prior case counts and rates are updated accordingly.[/SUB]

Additional FluSurv-NET hospitalization surveillance information for current and past seasons and additional age groups:‎

Surveillance Methods | FluView Interactive: Rates by Age, Sex, and Race/Ethnicity or Data on Patient Characteristics | RESP-NET Interactive

National healthcare safety network (NHSN) hospitalization surveillance


Effective November 1, 2024, all acute care and critical access hospitals are required to report the number of patients admitted with laboratory-confirmed influenza to NHSN. These data will be updated weekly in FluView and on FluView Interactive once sufficient data has been collected. Public datasets, including data reported on a voluntary basis prior to November 1, can be found here: https://data.cdc.gov/Public-Health-...talization-Metrics-by-Ju/aemt-mg7g/about_data.

Additional NHSN Hospitalization Surveillance information:‎

Surveillance Methods | Additional Data | FluView Interactive

Mortality surveillance


Based on NCHS mortality surveillance data available on November 14, 2024, 0.07% of the deaths that occurred during the week ending November 9, 2024 (Week 45), were due to influenza. This percentage remained stable (≤ 0.1 percentage point change) compared to Week 44. The data presented are preliminary and may change as more data are received and processed.

Additional pneumonia, influenza and COVID-19 mortality surveillance information for current and past seasons:‎

Surveillance Methods | FluView Interactive

Influenza-Associated Pediatric Mortality


No influenza-associated pediatric deaths occurring during the 2024-2025 season were reported to CDC during Week 45.

One influenza-associated pediatric death occurring during the 2023-2024 season was reported to CDC during Week 45. This death was associated with an influenza A(H1N1) virus and occurred during Week 19 of 2024 (the week ending May 11, 2024). A total of 205 influenza-associated pediatric deaths that occurred during the 2023-2024 season have been reported to CDC.

Additional pediatric mortality surveillance information for current and past seasons:‎

Surveillance Methods | FluView Interactive
 
Weekly US Influenza Surveillance Report: Key Updates for Week 46, ending November 16, 2024

What to know
  • Note: Due to the Thanksgiving holiday, FluView for Week 47 will be posted on December 2, 2024.
  • Seasonal influenza activity is increasing slightly among children but remains low nationally.
Summary

Viruses

Clinical Lab 2.1% (Trend
IncreasingArrow.png
)
positive for influenza
this week. Public Health Lab Influenza A(H1N1)pdm09 and A(H3N2)
viruses were co-circulating this week.

Illness

Outpatient Respiratory Illness 2.7% (Trend
IncreasingArrow.png
)
of visits to a health care provider this
week were for respiratory illness
(below baseline). Activity Map 3 moderate jurisdictions 0 high or very high jurisdictions FluSurv-NET 1.2 per 100,000
cumulative hospitalization rate NCHS Mortality 0.03% (Trend
StableArrow.png
)
of deaths attributed to influenza this week. Pediatric Deaths 1 influenza-associated death
was reported this week.
All data are preliminary and may change as more reports are received.

Directional arrows indicate changes between the current week and the previous week. Additional information on the arrows can be found at the bottom of this page.

A description of the CDC influenza surveillance system, including methodology and detailed descriptions of each data component is available on the surveillance methods page.[SUP]1[/SUP]

Additional information on the current and previous influenza seasons for each surveillance component are available on FluView Interactive.

Key Points‎

• Seasonal influenza activity is increasing slightly among children but remains low nationally.

• Nationally, percent positivity for influenza overall increased this week and the percentage of emergency department visits for influenza increased slightly among pediatric age groups.

• During Week 46, of the 309 viruses reported by public health laboratories, 293 were influenza A and 16 were influenza B. Of the 211 influenza A viruses subtyped during Week 46, 77 (36.5%) were influenza A(H1N1)pdm09, 129 (61.1%) were A(H3N2), and 5 (2.4%) were A(H5).

• Six confirmed human infections with influenza A(H5) viruses were reported to CDC this week. To date, human-to-human transmission of influenza A(H5) virus has not been identified in the United States.

• One pediatric death associated with a seasonal influenza virus infection and occurring during the 2024-2025 season was reported this week.

• CDC recommends that everyone ages 6 months and older get an annual influenza (flu) vaccine.[SUP]1[/SUP]

• There are prescription flu antiviral drugs that can treat flu illness; those should be started as early as possible and are especially important for higher risk patients.[SUP]2[/SUP]

• Influenza viruses are among several viruses contributing to respiratory disease activity. CDC is providing updated, integrated information about COVID-19, flu, and respiratory syncytial virus (RSV) activity on a weekly basis.

COVID-19, flu, and RSV activity

U.S. virologic surveillance


Nationally and in HHS regions 6, 8, 9, and 10, the percentage of respiratory specimens testing positive for influenza virus in clinical laboratories increased (change of ≥0.5 percentage points) compared to the previous week. In regions 3, 4, and 5, percent positivity has trended upward during the past few weeks. Influenza A(H1N1)pdm09 and A(H3N2) viruses are co-circulating; however, the distribution of circulating viruses varies by region. For regional and state level data and age group distribution, please visit FluView Interactive. Viruses known to be associated with recent receipt of live attenuated influenza vaccine (LAIV) or found upon further testing to be a vaccine virus are not included, as they are not circulating influenza viruses.

Clinical Laboratories


The results of tests performed by clinical laboratories nationwide are summarized below. Data from clinical laboratories (the percentage of specimens tested that are positive for influenza virus) are used to monitor whether influenza activity is increasing or decreasing.
No. of specimens tested60,189473,787
No. of positive specimens (%)1,244 (2.1%)5,284 (1.1%)
Positive specimens by type
Influenza A1,155 (92.8%)4,793 (90.7%)
Influenza B89 (7.2%)491 (9.3%)
Public Health Laboratories


The results of tests performed by public health laboratories nationwide are summarized below. Data from public health laboratories are used to monitor the proportion of circulating influenza viruses that belong to each influenza subtype/lineage.
No. of specimens tested9939,245
No. of positive specimens3091,944
Positive specimens by type/subtype
Influenza A293 (94.8%)1,843 (94.8%)
Subtyping Performed211 (72.0%)1,608 (87.2%)
(H1N1)pdm0977 (36.5%)718 (44.7%)
H3N2129 (61.1%)833 (51.8%)
H3N2v[SUP]†[/SUP]00
H5*5 (2.4%)57 (3.5%)
Subtyping not performed82 (28.0%)235 (12.8%)
Influenza B16 (5.2%)101 (5.2%)
Lineage testing performed7 (43.8%)62 (61.4%)
Yamagata lineage00
Victoria lineage7 (100.0%)62 (100.0%)
Lineage not performed9 (56.2%)39 (38.6%)
[SUB]*[/SUB][SUB]These data reflect specimens tested, and the number determined to be positive for influenza viruses at the public health labs (specimens tested is not the same as cases). The data do not reflect specimens tested only at CDC and could include more than one specimen tested per person. The guidance for influenza A/H5 virus testing recommends testing both a conjunctival and respiratory swab for people with conjunctivitis which has resulted in more specimens testing positive for influenza A/H5 virus than the number of human H5 cases.[/SUB][SUB] For more information on the number of people infected with A/H5, please visit the [/SUB][SUB]"How CDC is monitoring influenza data among people to better understand the current avian influenza A (H5N1) situation"[/SUB]

[SUP]†[/SUP][SUB]When an influenza virus that normally circulates in swine (but not people) is detected in a person, it is called a "variant" influenza virus. Most human infections with variant influenza viruses occur following exposure to swine, but human-to-human transmission can occur. It is important to note that in most cases, variant influenza viruses have not shown the ability to spread easily and sustainably from person to person.[/SUB]


[SUB]*This graph reflects the number of specimens tested and the number determined to be positive for influenza viruses at the public health lab (specimens tested is not the same as cases). It does not reflect specimens tested only at CDC and could include more than one specimen tested per person. Specimens tested as part of routine influenza surveillance as well as those tested as part of targeted testing for people exposed to influenza A(H5) are included.[/SUB]
Additional virologic surveillance information for current and past seasons:‎

Surveillance Methods | FluView Interactive: National, Regional, and State Data or Age Data

Novel Influenza A Virus Infections


Six confirmed human infections with influenza A(H5) viruses were reported to CDC this week. To date, human-to-human transmission of influenza A(H5) virus has not been identified in the United States.

Five confirmed cases were reported by the California Department of Public Health. Four of these cases occurred in workers at commercial dairy cattle farms in areas where highly pathogenic avian influenza (HPAI) A(H5N1) viruses had been detected in cows, and one case occurred in a child with no known contact with influenza A(H5N1) virus-infected animals. The investigation into the source of infection for this case is ongoing, but there is currently no evidence of human-to-human transmission. There have now been 29 total confirmed human cases and one probable human case in California.

One confirmed case was reported by the Oregon Health Authority. This case was in a worker who performed depopulation activities at a commercial poultry facility where HPAI A (H5N1) viruses had been detected in birds. This is the first human case identified in Oregon.

Five of the six individuals reported this week are more than 18 years old and one was less than 18 years old. All six individuals had mild symptoms. Specimens from all six individuals were tested at state or public health laboratories using the CDC influenza A (H5) assay before being sent to CDC for further testing. Specimens from all six confirmed cases were positive for influenza A(H5) virus using diagnostic RT-PCR or genetic sequencing at CDC. Additional analysis including genetic sequencing is underway.

In response to these detections, additional case investigations and surveillance activities are being conducted by public health officials in California and Oregon.

The CSTE position statement, which includes updated case definitions for confirmed, probable, and suspect cases is available at http://www.cste.org/resource/resmgr/position_statements_files_2023/24-ID-09_Novel_Influenza_A.pdf

An up-to-date human case summary during the 2024 outbreak by state and exposure source is available at www.cdc.gov/bird-flu/situation-summary/index.html

Information about avian influenza is available at https://www.cdc.gov/flu/avianflu/index.htm.

Interim recommendations for Prevention, Monitoring, and Public Health Investigations are available at https://www.cdc.gov/bird-flu/prevention/hpai-interim-recommendations.html.

The latest case reports on avian influenza outbreaks in wild birds, commercial poultry, backyard or hobbyist flocks, and mammals in the United States are available from the USDA at https://www.aphis.usda.gov/aphis/ou...e-information/avian/avian-influenza/2022-hpai.

Additional information regarding human infections with novel influenza A viruses:‎

Surveillance Methods | FluView Interactive

Influenza Virus Characterization


CDC performs genetic and antigenic characterization of U.S. viruses submitted from state and local public health laboratories according to the Right Size Roadmap submission guidance. These data are used to compare how similar the currently circulating influenza viruses are to the reference viruses representing the current influenza vaccines. The data are also used to monitor evolutionary changes that continually occur in influenza viruses circulating in humans. CDC also tests susceptibility of circulating influenza viruses to antiviral medications including the neuraminidase inhibitors (oseltamivir, zanamivir, and peramivir) and the polymerase acidic protein (PA) endonuclease inhibitor baloxavir. The HA clade and subclades were assigned using Nextclade (https://clades.nextstrain.org).

CDC has genetically characterized 863 influenza viruses collected since May 19, 2024.
A/H1349
5a.2a155 (44.4%)C.11 (0.3%)
C.1.9154 (44.1%)
5a.2a.1194 (55.6%)C.1.12 (0.6%)
D177 (50.7%)
D.11 (0.3%)
D.21 (0.3%)
D.39 (2.6%)
D.44 (1.1%)
A/H3436
2a.3a3 (0.7%)G.1.3.13 (0.7%)
2a.3a.1433 (99.3%)J.111 (2.5%)
J.2422 (96.8%)
B/Victoria78
3a.278 (100%)C.54 (5.1%)
C.5.158 (74.4%)
C.5.611 (14.1%)
C.5.75 (6.4%)
B/Yamagata0
Y30Y30
CDC antigenically characterizes influenza viruses by hemagglutination inhibition (HI) (H1N1pdm09, H3N2, and B/Victoria viruses) or neutralization-based HINT (H3N2 viruses) using antisera that ferrets make after being infected with reference viruses representing the 2024-2025 Northern Hemisphere recommended cell or recombinant-based vaccine viruses. Antigenic differences between viruses are determined by comparing how well the antibodies made against the vaccine reference viruses recognize the circulating viruses that have been grown in cell culture. Ferret antisera are useful because antibodies raised against a particular virus can often recognize small changes in the surface proteins of other viruses. In HI assays, viruses with similar antigenic properties have antibody titer differences of less than or equal to 4-fold when compared to the reference (vaccine) virus. In HINT, viruses with similar antigenic properties have antibody neutralization titer differences of less than or equal to 8-fold. Viruses selected for antigenic characterization are a subset of the recent genetically characterized viruses and are chosen based on the genetic changes in their surface proteins and may not be proportional to the number of such viruses circulating in the United States. Influenza A Viruses
  • A(H1N1)pdm09: 97 A(H1N1)pdm09 viruses were antigenically characterized by HI, and 94 (96.9%) were well-recognized (reacting at titers that were within 4-fold of the homologous virus titer) by ferret antisera to cell-grown A/Wisconsin/67/2022-like reference viruses representing the A(H1N1)pdm09 component for the cell- and recombinant-based influenza vaccines.
  • A(H3N2): 203 A(H3N2) viruses were antigenically characterized by HI or HINT, and 149 (73.4%) were well-recognized (reacting at titers that were within 4-fold of the homologous virus titer in HI or reacting at titers that were less than or equal to 8-fold of the homologous virus in HINT) by ferret antisera to cell-grown A/Massachusetts/18/2022-like reference viruses representing the A(H3N2) component for the cell- and recombinant-based influenza vaccines.
Influenza B Viruses
  • B/Victoria: 28 influenza B/Victoria-lineage virus were antigenically characterized by HI, and all were well-recognized (reacting at titers that were within 4-fold of the homologous virus titer) by ferret antisera to cell-grown B/Austria/1359417/2021-like reference viruses representing the B/Victoria component for the cell- and recombinant-based influenza vaccines.
  • B/Yamagata: No influenza B/Yamagata-lineage viruses were available for antigenic characterization.
Assessment of Virus Susceptibility to Antiviral Medications


CDC assesses susceptibility of influenza viruses to the antiviral medications including the neuraminidase inhibitors (oseltamivir, zanamivir, and peramivir) and the PA endonuclease inhibitor baloxavir using next generation sequence analysis supplemented by laboratory assays. Information about antiviral susceptibility test methods can be found at U.S. Influenza Surveillance: Purpose and Methods.

Viruses collected in the U.S. since May 19, 2024, were tested for antiviral susceptibility as follows:
Neuraminidase InhibitorsOseltamivirViruses Tested86434444377
Reduced Inhibition1 (0.1%)1 (0.3%)00
Highly Reduced Inhibition2 (0.2%)2 (0.6%)00
PeramivirViruses Tested86434444377
Reduced Inhibition0000
Highly Reduced Inhibition2 (0.2%)2 (0.6%)00
ZanamivirViruses Tested86434444377
Reduced Inhibition0000
Highly Reduced Inhibition0000
PA Cap-Dependent Endonuclease InhibitorBaloxavirViruses Tested84031744281
Decreased Susceptibility0000
Two A(H1N1)pdm09 viruses had NA-H275Y amino acid substitution conferring highly reduced inhibition by oseltamivir and peramivir. One A(H1N1)pdm09 virus had NA-I223V and NA-S247N amino acid substitutions and showed reduced inhibition by oseltamivir.

High levels of resistance to the adamantanes (amantadine and rimantadine) persist among influenza A(H1N1)pdm09 and influenza A(H3N2) viruses (the adamantanes are not effective against influenza B viruses). Therefore, use of these antivirals for treatment and prevention of influenza A virus infection is not recommended and data from adamantane resistance testing are not presented.

Outpatient and Emergency Department Illness Surveillance

Outpatient respiratory illness visits


The U.S. Outpatient Influenza-like Illness Surveillance Network (ILINet) monitors outpatient visits for respiratory illness referred to as influenza-like illness [ILI (fever plus cough or sore throat)], not laboratory-confirmed influenza, and will therefore capture respiratory illness visits due to infection with any pathogen that can present with similar symptoms, including influenza virus, SARS-CoV-2, and RSV. It is important to evaluate syndromic surveillance data, including that from ILINet, in the context of other sources of surveillance data to obtain a complete and accurate picture of influenza, SARS-CoV-2, and other respiratory virus activity.

Nationally, during Week 46, 2.7% of patient visits reported through ILINet were due to respiratory illness that included fever plus a cough or sore throat, also referred to as ILI. This week's percentage increased (change of > 0.1 percentage points) compared to Week 45 and has been trending upward for the past four weeks but remains below baseline. Region 4 is at its baseline while the remaining nine HHS regions are below their respective baselines. The percentage of visits for ILI increased this week compared to last week in regions 4, 6, 9, and 10 , and has been trending upward in regions 2 and 8. ILI activity remained stable (change of ≤ 0.1 percentage points) in all other regions (1, 3, 5, and 7) in Week 46 compared to Week 45. Multiple respiratory viruses are co-circulating, and the relative contribution of influenza virus infections to ILI varies by location.

Outpatient respiratory illness visits by age group


About 70% of ILINet participants provide both the number of patient visits for respiratory illness and the total number of patient visits for the week broken out by age group. Based on these data, the percentage of visits for respiratory illness increased (change of > 0.1 percentage point) in the 0-4 years, 5-24 years, and 25-49 years age groups and remained stable (change of ≤ 0.1 percentage point) in the 50-64 years and 65+ years age groups in Week 46 compared to Week 45.

Outpatient respiratory illness activity map


Data collected in ILINet are used to produce a measure of ILI activity* by state/jurisdiction and Core Based Statistical Areas (CBSA).
Week 46
(Week ending
Nov. 16, 2024)
Week 45
(Week ending
Nov. 9, 2024)
Week 46
(Week ending
Nov. 16, 2024)
Week 45
(Week ending
Nov. 9, 2024)
Very High0000
High00158
Moderate312519
Low1613119102
Minimal3641547579
Insufficient Data00223221


*Data collected in ILINet may disproportionally represent certain populations within a jurisdiction or CBSA, and therefore, may not accurately depict the full picture of influenza activity for the entire jurisdiction or CBSA. Differences in the data presented here by CDC and independently by some health departments likely represent differing levels of data completeness with data presented by the health department likely being the more complete.

Additional information about medically attended visits for ILI for current and past seasons:‎

Surveillance Methods | FluView Interactive: National, Regional, and State Data or ILI Activity Map

National Syndromic Surveillance System (NSSP)


The overall percentage of emergency department (ED) visits with a discharge diagnosis of influenza reported in NSSP was 0.5% during Week 46 and has been trending up slightly over the past few weeks. In Region 9, the percentage of ED visits increased in Week 46 compared to the previous week and in regions 4 and 6 it has been trending upward over the past few weeks. In the remaining seven HHS regions, the percentage of ED visits for influenza remained stable (change of ≤ 0.1 percentage point) compared to the previous week. This percentage increased among the 0-4 years and 5-17 years age groups and remained stable (change of ≤ 0.1 percentage point) among the 18-64 years and 65+ age groups. Make a selection from the filters to change the visualization information.
RegionNationalRegion 1Region 2Region 3Region 4Region 5Region 6Region 7Region 8Region 9Region 10
Season(s)2023-2024 & 2024-20252022-2023 Skip Over Chart Container
1.0%2.0%3.0%4.0%5.0%6.0%7.0%8.0%9.0%10.0%11.0%12.0 %13.0%Percent of Emergency Department Visits for InfluenzaWeek 42 of 2023Week 46 of 2023Week 50 of 2023Week 2 of 2024Week 6 of 2024Week 10 of 2024Week 14 of 2024Week 18 of 2024Week 22 of 2024Week 26 of 2024Week 30 of 2024Week 34 of 2024Week 38 of 2024Week 42 of 2024Week 46 of 2024 Age Group


All ages
0-4 years
5-17 years
18-64 years
65+ Skip Data Table
Data Table Download Data (CSV) Skipped data table.

Additional information about emergency department visits for flu for current and past seasons:‎‎‎


Surveillance Methods | Emergency Department Visits for COVID-19, flu, and RSV

Hospitalization surveillance

FluSurv-Net


The Influenza Hospitalization Surveillance Network (FluSurv-NET) conducts population-based surveillance for laboratory-confirmed influenza-related hospitalizations in select counties in 14 states and represents approximately 9% of the U.S. population. FluSurv-NET hospitalization data are preliminary. As data are received each week, prior case counts and rates are updated accordingly.

A total of 365 laboratory-confirmed influenza-associated hospitalizations were reported by FluSurv-NET sites between October 1, 2024 and November 16, 2024. The weekly hospitalization rate observed in Week 46 was 0.3 per 100,000 population. The cumulative hospitalization rate observed in Week 46 was 1.2 per 100,000 population.

[SUB]**In this figure, weekly rates for all seasons prior to the 2024-2025 season reflect end-of-season rates. For the 2024-2025 season, rates for recent hospital admissions are subject to reporting delays and are shown as a dashed line for the current season. As hospitalization data are received each week, prior case counts and rates are updated accordingly.[/SUB]

Additional FluSurv-NET hospitalization surveillance information for current and past seasons and additional age groups:‎

Surveillance Methods | FluView Interactive: Rates by Age, Sex, and Race/Ethnicity or Data on Patient Characteristics | RESP-NET Interactive

National healthcare safety network (NHSN) hospitalization surveillance


Effective November 1, 2024, all acute care and critical access hospitals are required to report the number of patients admitted with laboratory-confirmed influenza to NHSN. These data will be updated weekly in FluView and on FluView Interactive once sufficient data has been collected. Public datasets, including data reported on a voluntary basis prior to November 1, 2024, can be found here: https://data.cdc.gov/Public-Health-...talization-Metrics-by-Ju/aemt-mg7g/about_data.

Additional NHSN Hospitalization Surveillance information:‎

Surveillance Methods | Additional Data | FluView Interactive


Mortality surveillance


Based on NCHS mortality surveillance data available on November 21, 2024, 0.03% of the deaths that occurred during the week ending November 16, 2024 (Week 46), were due to influenza. This percentage remained stable (≤ 0.1 percentage point change) compared to Week 45. The data presented are preliminary and may change as more data are received and processed.

Additional pneumonia, influenza and COVID-19 mortality surveillance information for current and past seasons:‎

Surveillance Methods | FluView Interactive Influenza-Associated Pediatric Mortality


One influenza-associated pediatric death occurring during the 2024-2025 season was reported to CDC during week 46. The death was associated with an influenza A(H3) virus and occurred during Week 45 (the week ending November 9, 2024). This is the second seasonal influenza-associated pediatric death occurring during the 2024-2025 season that has been reported to CDC.

Additional pediatric mortality surveillance information for current and past seasons:‎

Surveillance Methods | FluView Interactive
Additional National and International Influenza Surveillance Information

Indicators Status by System


Increasing:
IncreasingArrow.png

Decreasing:
DecreasingArrow.png

Stable:
StableArrow.png


Clinical Labs: Up or down arrows indicate a change of greater than or equal to 0.5 percentage points in the percent of specimens positive for influenza compared to the previous week.
Outpatient Respiratory Illness (ILINet): Up or down arrows indicate a change of greater than 0.1 percentage points in the percent of visits due to respiratory illness (ILI) compared to the previous week.
NHSN Hospitalizations: Up or down arrows indicate change of greater than or equal to 5% of the number of patients admitted with laboratory-confirmed influenza compared to the previous week.
NCHS Mortality: Up or down arrows indicate change of greater than 0.1 percentage points of the percent of deaths due to influenza compared to the previous week.

Additional surveillance information


FluView Interactive: FluView includes enhanced web-based interactive applications that can provide dynamic visuals of the influenza data collected and analyzed by CDC. These FluView Interactive applications allow people to create customized, visual interpretations of influenza data, as well as make comparisons across flu seasons, regions, age groups and a variety of other demographics.

National Institute for Occupational Safety and Health: Monthly surveillance data on the prevalence of health-related workplace absenteeism among full-time workers in the United States are available from NIOSH.

U.S. State and local influenza surveillance: Select a jurisdiction below to access the latest local influenza information.

https://www.cdc.gov/fluview/surveillance/2024-week-46.html
 
Weekly US Influenza Surveillance Report: Key Updates for Week 48, ending November 30, 2024

What to know


Seasonal influenza activity is continuing to increase but remains low nationally.
Summary

Viruses

Clinical Lab 3.5% (Trend
IncreasingArrow.png
)
positive for influenza
this week. Public Health Lab Influenza A(H1N1)pdm09 and A(H3N2)
viruses were co-circulating this week.

Illness

Outpatient Respiratory Illness 3.2% (Trend
IncreasingArrow.png
)
of visits to a health care provider this
week were for respiratory illness
(above baseline). Activity Map 9 moderate jurisdictions 4 high or very high jurisdictions FluSurv-NET 2.1 per 100,000
cumulative hospitalization rate NCHS Mortality 0.1% (Trend
StableArrow.png
)
of deaths attributed to influenza this week. Pediatric Deaths 0 influenza-associated deaths
reported this week.
All data are preliminary and may change as more reports are received.

Directional arrows indicate changes between the current week and the previous week. Additional information on the arrows can be found at the bottom of this page.

A description of the CDC influenza surveillance system, including methodology and detailed descriptions of each data component is available on the surveillance methods page.[SUP]1[/SUP]

Additional information on the current and previous influenza seasons for each surveillance component are available on FluView Interactive.

Key Points‎


• Seasonal influenza activity is continuing to increase but remains low nationally.

• Nationally, percent positivity for influenza and the percentage of emergency department visits for influenza increased this week compared to last week.

• During Week 48, of the 275 viruses reported by public health laboratories, 266 were influenza A and 9 were influenza B. Of the 201 influenza A viruses subtyped during Week 48, 73 (36.3%) were influenza A(H1N1)pdm09, 124 (61.7%) were A(H3N2), and 4 (2.0%) were A(H5).

• One confirmed human infection with an influenza A(H5) virus was reported to CDC this week. To date, human-to-human transmission of influenza A(H5) virus has not been identified in the United States.

• No pediatric deaths associated with seasonal influenza virus infection were reported this week.

• CDC recommends that everyone ages 6 months and older get an annual influenza (flu) vaccine.[SUP]1[/SUP]

• There are prescription flu antiviral drugs that can treat flu illness; those should be started as early as possible and are especially important for higher risk patients.[SUP]2[/SUP]

• Influenza viruses are among several viruses contributing to respiratory disease activity. CDC is providing updated, integrated information about COVID-19, flu, and respiratory syncytial virus (RSV) activity on a weekly basis.

COVID-19, flu, and RSV activity


U.S. virologic surveillance


Nationally and in HHS regions 2, 6, 7, 8, and 9, the percentage of respiratory specimens testing positive for influenza virus in clinical laboratories increased (change of ≥0.5 percentage points) compared to the previous week. In HHS regions 1, 3, 4, 5, and 10, the percentage of specimens testing positive has been increasing during the past several weeks, but the increase this week compared to the previous week was <0.5 percentage points. Influenza A(H1N1)pdm09 and A(H3N2) viruses are co-circulating; however, the distribution of circulating viruses varies by region. For regional and state level data and age group distribution, please visit FluView Interactive. Viruses known to be associated with recent receipt of live attenuated influenza vaccine (LAIV) or found upon further testing to be a vaccine virus are not included, as they are not circulating influenza viruses. Clinical Laboratories


The results of tests performed by clinical laboratories nationwide are summarized below. Data from clinical laboratories (the percentage of specimens tested that are positive for influenza virus) are used to monitor whether influenza activity is increasing or decreasing.
No. of specimens tested66,386644,626
No. of positive specimens (%)2,348 (3.5%)10,239 (1.6%)
Positive specimens by type
Influenza A2,218 (94.5%)9,445 (92.2%)
Influenza B130 (5.5%)794 (7.8%)
Public Health Laboratories


The results of tests performed by public health laboratories nationwide are summarized below. Data from public health laboratories are used to monitor the proportion of circulating influenza viruses that belong to each influenza subtype/lineage.
No. of specimens tested85612,622
No. of positive specimens2753,210
Positive specimens by type/subtype
Influenza A266 (96.7%)3,037 (94.6%)
Subtyping Performed201 (75.6%)2,626 (86.5%)
(H1N1)pdm0973 (36.3%)1,192 (45.4%)
H3N2124 (61.7%)1,369 (52.1%)
H3N2v[SUP]†[/SUP]00
H5*4 (2.0%)65 (2.5%)
Subtyping not performed65 (24.4%)411 (13.5%)
Influenza B9 (3.3%)173 (5.4%)
Lineage testing performed0101 (58.4%)
Yamagata lineage00
Victoria lineage0101 (100.0%)
Lineage not performed9 (100.0%)72 (41.6%)
[SUB]*This data reflects specimens tested and the number determined to be positive for influenza viruses at the public health labs (specimens tested is not the same as cases). It does not reflect specimens tested only at CDC and could include more than one specimen tested per person. The guidance for influenza A/H5 testing recommends testing both a conjunctival and respiratory swab for people with conjunctivitis which has resulted in more specimens testing positive for influenza A/H5 than the number of human H5 cases. For more information on the number of people infected with A/H5, please visit the [/SUB][SUB]"How CDC is monitoring influenza data among people to better understand the current avian influenza A (H5N1) situation"[/SUB]

[SUP]†[/SUP][SUB]When an influenza virus that normally circulates in swine (but not people) is detected in a person, it is called a "variant" influenza virus. Most human infections with variant influenza viruses occur following exposure to swine, but human-to-human transmission can occur. It is important to note that in most cases, variant influenza viruses have not shown the ability to spread easily and sustainably from person to person.[/SUB]


[SUB]*This graph reflects the number of specimens tested and the number determined to be positive for influenza viruses at the public health lab (specimens tested is not the same as cases). It does not reflect specimens tested only at CDC and could include more than one specimen tested per person. Specimens tested as part of routine influenza surveillance as well as those tested as part of targeted testing for people exposed to influenza A(H5) are included.[/SUB]

Additional virologic surveillance information for current and past seasons:‎

Surveillance Methods | FluView Interactive: National, Regional, and State Data or Age Data

Novel Influenza A Virus Infections


One confirmed human infection with an influenza A(H5) virus was reported to CDC this week. To date, human-to-human transmission of influenza A(H5) virus has not been identified in the United States.

The confirmed case was reported by the California Department of Public Health. The case occurred in a worker aged ≥18 years at a commercial dairy cattle farm in an area where highly pathogenic avian influenza (HPAI) A(H5N1) viruses had been detected in cows. This individual had mild symptoms, which they reported to local health department officials. There have now been 32 total confirmed cases and one probable human case in California.

Specimens were collected from the individual and initially tested at a local public health laboratory using the CDC influenza A(H5) assay before being sent to CDC for further testing. The specimen was positive for influenza A(H5) virus using diagnostic RT-PCR at CDC. Additional analysis, including genetic sequencing, is underway.

In response to these detections, additional case investigations and surveillance activities are being conducted by public health officials.

The CSTE position statement, which includes updated case definitions for confirmed, probable, and suspect cases is available at http://www.cste.org/resource/resmgr/position_statements_files_2023/24-ID-09_Novel_Influenza_A.pdf

An up-to-date human case summary during the 2024 outbreak by state and exposure source is available at www.cdc.gov/bird-flu/situation-summary/index.html

Information about avian influenza is available at https://www.cdc.gov/flu/avianflu/index.htm.

Interim recommendations for Prevention, Monitoring, and Public Health Investigations are available at https://www.cdc.gov/bird-flu/prevention/hpai-interim-recommendations.html.

The latest case reports on avian influenza outbreaks in wild birds, commercial poultry, backyard or hobbyist flocks, and mammals in the United States are available from the USDA at https://www.aphis.usda.gov/aphis/ou...e-information/avian/avian-influenza/2022-hpai.

Additional information regarding human infections with novel influenza A viruses:‎

Surveillance Methods | FluView Interactive

Influenza Virus Characterization


CDC performs genetic and antigenic characterization of U.S. viruses submitted from state and local public health laboratories according to the Right Size Roadmap submission guidance. These data are used to compare how similar the currently circulating influenza viruses are to the reference viruses representing the current influenza vaccines. The data are also used to monitor evolutionary changes that continually occur in influenza viruses circulating in humans. CDC also tests susceptibility of circulating influenza viruses to antiviral medications including the neuraminidase inhibitors (oseltamivir, zanamivir, and peramivir) and the polymerase acidic protein (PA) endonuclease inhibitor baloxavir. The HA clade and subclades were assigned using Nextclade (https://clades.nextstrain.org).

CDC has genetically characterized 990 influenza viruses collected since May 19, 2024.
A/H1405
5a.2a181 (44.7%)C.11 (0.2%)
C.1.9180 (44.4%)
5a.2a.1224 (55.3%)C.1.12 (0.5%)
D207 (51.1%)
D.11 (0.2%)
D.21 (0.2%)
D.39 (2.2%)
D.44 (1.0%)
A/H3498
2a.3a5 (1.0%)G.1.3.15 (1.0%)
2a.3a.1493 (99.0%)J.111 (2.2%)
J.2482 (96.8%)
B/Victoria87
3a.287 (100%)C.55 (5.7%)
C.5.162 (71.3%)
C.5.615 (17.2%)
C.5.75 (5.7%)
B/Yamagata0
Y30Y30
CDC antigenically characterizes influenza viruses by hemagglutination inhibition (HI) (H1N1pdm09, H3N2, and B/Victoria viruses) or neutralization-based HINT (H3N2 viruses) using antisera that ferrets make after being infected with reference viruses representing the 2024-2025 Northern Hemisphere recommended cell or recombinant-based vaccine viruses. Antigenic differences between viruses are determined by comparing how well the antibodies made against the vaccine reference viruses recognize the circulating viruses that have been grown in cell culture. Ferret antisera are useful because antibodies raised against a particular virus can often recognize small changes in the surface proteins of other viruses. In HI assays, viruses with similar antigenic properties have antibody titer differences of less than or equal to 4-fold when compared to the reference (vaccine) virus. In HINT, viruses with similar antigenic properties have antibody neutralization titer differences of less than or equal to 8-fold. Viruses selected for antigenic characterization are a subset of the recent genetically characterized viruses and are chosen based on the genetic changes in their surface proteins and may not be proportional to the number of such viruses circulating in the United States. Influenza A Viruses
  • A(H1N1)pdm09: 97 A(H1N1)pdm09 viruses were antigenically characterized by HI, and 94 (96.9%) were well-recognized (reacting at titers that were within 4-fold of the homologous virus titer) by ferret antisera to cell-grown A/Wisconsin/67/2022-like reference viruses representing the A(H1N1)pdm09 component for the cell- and recombinant-based influenza vaccines.
  • A(H3N2): 219 A(H3N2) viruses were antigenically characterized by HI or HINT, and 156 (71.2%) were well-recognized (reacting at titers that were within 4-fold of the homologous virus titer in HI or reacting at titers that were less than or equal to 8-fold of the homologous virus in HINT) by ferret antisera to cell-grown A/Massachusetts/18/2022-like reference viruses representing the A(H3N2) component for the cell- and recombinant-based influenza vaccines.
Influenza B Viruses
  • B/Victoria: 28 influenza B/Victoria-lineage virus were antigenically characterized by HI, and all were well-recognized (reacting at titers that were within 4-fold of the homologous virus titer) by ferret antisera to cell-grown B/Austria/1359417/2021-like reference viruses representing the B/Victoria component for the cell- and recombinant-based influenza vaccines.
  • B/Yamagata: No influenza B/Yamagata-lineage viruses were available for antigenic characterization.
Assessment of Virus Susceptibility to Antiviral Medications


CDC assesses susceptibility of influenza viruses to the antiviral medications including the neuraminidase inhibitors (oseltamivir, zanamivir, and peramivir) and the PA endonuclease inhibitor baloxavir using next generation sequence analysis supplemented by laboratory assays. Information about antiviral susceptibility test methods can be found at U.S. Influenza Surveillance: Purpose and Methods.

Viruses collected in the U.S. since May 19, 2024, were tested for antiviral susceptibility as follows:
Neuraminidase InhibitorsOseltamivirViruses Tested99340350486
Reduced Inhibition1 (0.1%)1 (0.2%)00
Highly Reduced Inhibition2 (0.2%)2 (0.5%)00
PeramivirViruses Tested99340350486
Reduced Inhibition0000
Highly Reduced Inhibition2 (0.2%)2 (0.5%)00
ZanamivirViruses Tested99340350486
Reduced Inhibition0000
Highly Reduced Inhibition0000
PA Cap-Dependent Endonuclease InhibitorBaloxavirViruses Tested101738653992
Decreased Susceptibility0000
Two A(H1N1)pdm09 viruses had NA-H275Y amino acid substitution conferring highly reduced inhibition by oseltamivir and peramivir. One A(H1N1)pdm09 virus had NA-I223V and NA-S247N amino acid substitutions and showed reduced inhibition by oseltamivir.

High levels of resistance to the adamantanes (amantadine and rimantadine) persist among influenza A(H1N1)pdm09 and influenza A(H3N2) viruses (the adamantanes are not effective against influenza B viruses). Therefore, use of these antivirals for treatment and prevention of influenza A virus infection is not recommended and data from adamantane resistance testing are not presented.

Outpatient and Emergency Department Illness Surveillance

Outpatient respiratory illness visits


The U.S. Outpatient Influenza-like Illness Surveillance Network (ILINet) monitors outpatient visits for respiratory illness referred to as influenza-like illness [ILI (fever plus cough or sore throat)], not laboratory-confirmed influenza, and will therefore capture respiratory illness visits due to infection with any pathogen that can present with similar symptoms, including influenza virus, SARS-CoV-2, and RSV. It is important to evaluate syndromic surveillance data, including that from ILINet, in the context of other sources of surveillance data to obtain a complete and accurate picture of influenza, SARS-CoV-2, and other respiratory virus activity.

Nationally, during Week 48, 3.2% of patient visits reported through ILINet were due to respiratory illness that included fever plus a cough or sore throat, also referred to as ILI. This week's percentage increased (change of > 0.1 percentage points) compared to Week 47 and is above baseline for the first time this season. The percentage of visits for ILI increased (change of > 0.1 percentage points) in HHS regions 1, 2, 4, 5, 7, 9, and 10. In HHS regions 3, 6, and 8, the percentage of visits for ILI has been increasing over the past several weeks, but the increase this week compared to the previous week was ≤0.1 percentage points. Nationally and in HHS regions 1, 3, 4, 9, and 10 activity is above their respective baselines, while Region 6 is at its baseline this week. Multiple respiratory viruses are co-circulating, and the relative contribution of influenza virus infections to ILI varies by location.

Outpatient respiratory illness visits by age group


About 70% of ILINet participants provide both the number of patient visits for respiratory illness and the total number of patient visits for the week broken out by age group. Based on these data, the percentage of visits for respiratory illness increased (change of > 0.1 percentage point) in the 0-4 years, 5-24 years, 50-64 years, and 65+ years age groups and remained stable (change of ≤ 0.1 percentage point) in the 25-49 years age group in Week 48 compared to Week 47.

Outpatient respiratory illness activity map


Data collected in ILINet are used to produce a measure of ILI activity* by state/jurisdiction and Core Based Statistical Areas (CBSA).
Week 48
(Week ending
Nov. 30, 2024)
Week 47
(Week ending
Nov. 23, 2024)
Week 48
(Week ending
Nov. 30, 2024)
Week 47
(Week ending
Nov. 23, 2024)
Very High1121
High312316
Moderate936741
Low1619158146
Minimal2631445502
Insufficient Data00234223


*Data collected in ILINet may disproportionally represent certain populations within a jurisdiction or CBSA, and therefore, may not accurately depict the full picture of influenza activity for the entire jurisdiction or CBSA. Differences in the data presented here by CDC and independently by some health departments likely represent differing levels of data completeness with data presented by the health department likely being the more complete.

Additional information about medically attended visits for ILI for current and past seasons:‎

Surveillance Methods | FluView Interactive: National, Regional, and State Data or ILI Activity Map

National Syndromic Surveillance System (NSSP)


The overall percentage of emergency department (ED) visits with a discharge diagnosis of influenza reported in NSSP increased to 0.9% during Week 48. In HHS regions 2, 4, 6, 8, 9, and 10 the percentage of ED visits increased in Week 48 compared to the previous week. In the remaining four HHS regions, the percentage of ED visits for influenza remained stable (change of ≤ 0.1 percentage point) compared to the previous week. The percentage of visits for influenza increased among the 0-4 years, 5-17 years, and 18-64 years age groups and remained stable (change of ≤ 0.1 percentage point), but is trending upward, among the 65+ age group. Make a selection from the filters to change the visualization information.
RegionNationalRegion 1Region 2Region 3Region 4Region 5Region 6Region 7Region 8Region 9Region 10
Season(s)2023-2024 & 2024-20252022-2023 Skip Over Chart Container
1.0%2.0%3.0%4.0%5.0%6.0%7.0%8.0%9.0%10.0%11.0%12.0 %13.0%Percent of Emergency Department Visits for InfluenzaWeek 40 of 2023Week 44 of 2023Week 48 of 2023Week 52 of 2023Week 4 of 2024Week 8 of 2024Week 12 of 2024Week 16 of 2024Week 20 of 2024Week 24 of 2024Week 28 of 2024Week 32 of 2024Week 36 of 2024Week 40 of 2024Week 44 of 2024Week 48 of 2024

Age Group


All ages
0-4 years
5-17 years
18-64 years
65+ Skip Data Table
Data Table Download Data (CSV) Skipped data table.

Additional information about emergency department visits for flu for current and past seasons:‎‎‎


Surveillance Methods | Emergency Department Visits for COVID-19, flu, and RSV

Hospitalization surveillance

FluSurv-Net


The Influenza Hospitalization Surveillance Network (FluSurv-NET) conducts population-based surveillance for laboratory-confirmed influenza-related hospitalizations in select counties in 14 states and represents approximately 9% of the U.S. population. FluSurv-NET hospitalization data are preliminary. As data are received each week, prior case counts and rates are updated accordingly.

A total of 642 laboratory-confirmed influenza-associated hospitalizations were reported by FluSurv-NET sites between October 1 and November 30, 2024. The weekly hospitalization rate observed in Week 48 was 0.4 per 100,000 population. The cumulative hospitalization rate observed in Week 48 was 2.1 per 100,000 population.

When examining rates by age, the highest cumulative hospitalization rate per 100,000 population was among adults aged 65 years and older (6.5), followed by adults aged 50-64 years (2.1) and children aged 0-4 years (2.0).


[SUB]**In this figure, weekly rates for all seasons prior to the 2024-2025 season reflect end-of-season rates. For the 2024-2025 season, rates for recent hospital admissions are subject to reporting delays and are shown as a dashed line for the current season. As hospitalization data are received each week, prior case counts and rates are updated accordingly.[/SUB]

Additional FluSurv-NET hospitalization surveillance information for current and past seasons and additional age groups:‎

Surveillance Methods | FluView Interactive: Rates by Age, Sex, and Race/Ethnicity or Data on Patient Characteristics | RESP-NET Interactive

National healthcare safety network (NHSN) hospitalization surveillance


Effective November 1, 2024, all acute care and critical access hospitals are required to report the number of patients admitted with laboratory-confirmed influenza to NHSN. These data will be updated weekly in FluView and on FluView Interactive once sufficient data has been collected. Public datasets, including data reported on a voluntary basis prior to November 1, 2024, can be found here: https://data.cdc.gov/Public-Health-...talization-Metrics-by-Ju/aemt-mg7g/about_data.

Additional NHSN Hospitalization Surveillance information:‎

Surveillance Methods | Additional Data | FluView Interactive

Mortality surveillance


Based on NCHS mortality surveillance data available on December 5, 2024, 0.1% of the deaths that occurred during the week ending November 30, 2024 (Week 48), were due to influenza. This percentage remained stable (≤ 0.1 percentage point change) compared to Week 47. The data presented are preliminary and may change as more data are received and processed.

Additional pneumonia, influenza and COVID-19 mortality surveillance information for current and past seasons:‎

Surveillance Methods | FluView Interactive

Influenza-Associated Pediatric Mortality


No influenza-associated pediatric deaths were reported to CDC during Week 48.

A total of two influenza-associated pediatric deaths occurring during the 2024-2025 season have been reported to CDC.

Additional pediatric mortality surveillance information for current and past seasons:‎

Surveillance Methods | FluView Interactive
Additional National and International Influenza Surveillance Information

Indicators Status by System


Increasing:
IncreasingArrow.png

Decreasing:
DecreasingArrow.png

Stable:
StableArrow.png


Clinical Labs: Up or down arrows indicate a change of greater than or equal to 0.5 percentage points in the percent of specimens positive for influenza compared to the previous week.
Outpatient Respiratory Illness (ILINet): Up or down arrows indicate a change of greater than 0.1 percentage points in the percent of visits due to respiratory illness (ILI) compared to the previous week.
NHSN Hospitalizations: Up or down arrows indicate change of greater than or equal to 5% of the number of patients admitted with laboratory-confirmed influenza compared to the previous week.
NCHS Mortality: Up or down arrows indicate change of greater than 0.1 percentage points of the percent of deaths due to influenza compared to the previous week.

Additional surveillance information


FluView Interactive: FluView includes enhanced web-based interactive applications that can provide dynamic visuals of the influenza data collected and analyzed by CDC. These FluView Interactive applications allow people to create customized, visual interpretations of influenza data, as well as make comparisons across flu seasons, regions, age groups and a variety of other demographics.

National Institute for Occupational Safety and Health: Monthly surveillance data on the prevalence of health-related workplace absenteeism among full-time workers in the United States are available from NIOSH.
https://www.cdc.gov/fluview/surveillance/2024-week-48.html
 
Weekly US Influenza Surveillance Report: Key Updates for Week 49, ending December 7, 2024

What to know


Seasonal influenza activity continues to increase across the country.
Summary

Viruses

Clinical Lab 5.1% (Trend
IncreasingArrow.png
)
positive for influenza
this week. Public Health Lab Influenza A(H1N1)pdm09, A(H3N2),
and B viruses were co-circulating this week. Illness

Outpatient Respiratory Illness 3.4% (Trend
IncreasingArrow.png
)
of visits to a health care provider this
week were for respiratory illness
(above baseline). Activity Map 13 moderate jurisdictions 6 high or very high jurisdictions FluSurv-NET 3.1 per 100,000
cumulative hospitalization rate NCHS Mortality 0.1% (Trend
StableArrow.png
)
of deaths attributed to influenza this week. Pediatric Deaths 0 influenza-associated deaths
reported this week.
All data are preliminary and may change as more reports are received.

Directional arrows indicate changes between the current week and the previous week. Additional information on the arrows can be found at the bottom of this page.

A description of the CDC influenza surveillance system, including methodology and detailed descriptions of each data component is available on the surveillance methods page.[SUP]1[/SUP]

Additional information on the current and previous influenza seasons for each surveillance component are available on FluView Interactive. Key Points


• Seasonal influenza activity continues to increase across the country.

• Nationally, percent positivity for influenza, the percentage of emergency department visits for influenza, percentage of outpatient visits for respiratory illness, and the rate of influenza associated hospitalizations increased this week compared to last week.

• During Week 49, of the 621 viruses reported by public health laboratories, 603 were influenza A and 18 were influenza B. Of the 429 influenza A viruses subtyped during Week 49, 168 (39.2%) were influenza A(H1N1)pdm09 and 261 (60.8%) were A(H3N2).

• Two probable cases of influenza A(H5) virus were reported to CDC this week. To date, human-to-human transmission of influenza A(H5) virus has not been identified in the United States.

• No pediatric deaths associated with seasonal influenza virus infection were reported this week.

• CDC recommends that everyone ages 6 months and older get an annual influenza (flu) vaccine.[SUP]1[/SUP]

• There are prescription flu antiviral drugs that can treat flu illness; those should be started as early as possible and are especially important for higher risk patients.[SUP]2[/SUP]

• Influenza viruses are among several viruses contributing to respiratory disease activity. CDC is providing updated, integrated information about COVID-19, flu, and respiratory syncytial virus (RSV) activity on a weekly basis.
COVID-19, flu, and RSV activity
U.S. virologic surveillance


Nationally and in HHS regions 1, 2, 3, 5, 6, 7, 8, and 10, the percentage of respiratory specimens testing positive for influenza virus in clinical laboratories increased (change of ≥0.5 percentage points) compared to the previous week. In HHS regions 4 and 9, the percentage of specimens testing positive have been increasing over the past several weeks but were stable (change of <0.5 percentage points) this week compared to the previous. Influenza A(H1N1)pdm09, A(H3N2), and B(Vic) viruses are co-circulating. For regional and state level data and age group distribution, please visit FluView Interactive. Viruses known to be associated with recent receipt of live attenuated influenza vaccine (LAIV) or found upon further testing to be a vaccine virus are not included, as they are not circulating influenza viruses. Clinical Laboratories


The results of tests performed by clinical laboratories nationwide are summarized below. Data from clinical laboratories (the percentage of specimens tested that are positive for influenza virus) are used to monitor whether influenza activity is increasing or decreasing.
No. of specimens tested81,992746,191
No. of positive specimens (%)4,151 (5.1%)15,408 (2.1%)
Positive specimens by type
Influenza A3,924 (94.5%)14,321 (92.9%)
Influenza B227 (5.5%)1,087 (7.1%)
Public Health Laboratories


The results of tests performed by public health laboratories nationwide are summarized below. Data from public health laboratories are used to monitor the proportion of circulating influenza viruses that belong to each influenza subtype/lineage.
No. of specimens tested1,36314,991
No. of positive specimens6214,372
Positive specimens by type/subtype
Influenza A603 (97.1%)4,155 (95.0%)
Subtyping Performed429 (71.1%)3,474 (83.6%)
(H1N1)pdm09168 (39.2%)1,538 (44.3%)
H3N2261 (60.8%)1,869 (53.8%)
H3N2v00
H5*067* (1.9%)
Subtyping not performed174 (28.9%)681 (16.7%)
Influenza B18 (2.9%)217 (5.0%)
Lineage testing performed1 (5.6%)105 (48.4%)
Yamagata lineage00
Victoria lineage1 (100%)105 (100.0%)
Lineage not performed17 (94.4%)112 (51.6%)
[SUB]*This data reflects specimens tested and the number determined to be positive for influenza viruses at the public health labs (specimens tested is not the same as cases). It does not reflect specimens tested only at CDC and could include more than one specimen tested per person. The guidance for influenza A/H5 testing recommends testing both a conjunctival and respiratory swab for people with conjunctivitis which has resulted in more specimens testing positive for influenza A/H5 than the number of human H5 cases. For more information on the number of people infected with A/H5, please visit the [/SUB][SUB]"How CDC is monitoring influenza data among people to better understand the current avian influenza A (H5N1) situation"[/SUB]

[SUB][SUP]†[/SUP]When an influenza virus that normally circulates in swine (but not people) is detected in a person, it is called a "variant" influenza virus. Most human infections with variant influenza viruses occur following exposure to swine, but human-to-human transmission can occur. It is important to note that in most cases, variant influenza viruses have not shown the ability to spread easily and sustainably from human-to-human.[/SUB]


[SUP]This graph reflects the number of specimens tested and the number determined to be positive for influenza viruses at the public health lab (specimens tested is not the same as cases). It does not reflect specimens tested only at CDC and could include more than one specimen tested per person. Specimens tested as part of routine influenza surveillance as well as those tested as part of targeted testing for people exposed to influenza A(H5) are included.[/SUP]

Additional virologic surveillance information for current and past seasons:


Surveillance Methods | FluView Interactive: National, Regional, and State Data or Age Data

Novel Influenza A Virus


Two probable cases of influenza A(H5) virus infection were reported to CDC this week by the Arizona Department of Health Services. To date, human-to-human transmission of influenza A(H5) virus has not been identified in the United States.

These cases occurred among two adult workers, ≥ 18 years of age, performing depopulation activities at a commercial poultry facility where highly pathogenic avian influenza (HPAI) A(H5N1) virus had been detected. While being monitored by local public health, these patients developed illness during the weeks ending November 23 and November 30, respectively. Both patients reported respiratory symptoms. One patient also reported conjunctivitis.

Specimens were collected from the patients and initially tested positive with high CT values at public health laboratories using the CDC influenza A(H5) assay. The specimens were negative for influenza A(H5) virus using diagnostic RT-PCR at CDC. These two probable cases are the first reported human influenza A(H5) cases reported in Arizona.

No additional notification to WHO of these probable cases is required per International Health Regulations (IHR). More information regarding IHR can be found at http://www.who.int/topics/international_health_regulations/en/.

The CSTE position statement, which includes updated case definitions for confirmed, probable, and suspected cases is available at http://www.cste.org/resource/resmgr/position_statements_files_2023/24-ID-09_Novel_Influenza_A.pdf

An up-to-date human case summary during the 2024 outbreak by state and exposure source is available at www.cdc.gov/bird-flu/situation-summary/index.html

Information about avian influenza is available at https://www.cdc.gov/flu/avianflu/index.htm.

Interim recommendations for Prevention, Monitoring, and Public Health Investigations are available at https://www.cdc.gov/bird-flu/prevention/hpai-interim-recommendations.html.

The latest case reports on avian influenza outbreaks in wild birds, commercial poultry, backyard or hobbyist flocks, and mammals in the United States are available from the USDA at https://www.aphis.usda.gov/aphis/ou...e-information/avian/avian-influenza/2022-hpai.

Additional information regarding human infections with novel influenza A viruses:


Surveillance Methods | FluView Interactive

Influenza Virus Characterization


CDC performs genetic and antigenic characterization of U.S. viruses submitted from state and local public health laboratories according to the Right Size Roadmap submission guidance. These data are used to compare how similar the currently circulating influenza viruses are relative to the reference viruses representing the current influenza vaccines. The data are also used to monitor evolutionary changes that continually occur in influenza viruses circulating in humans. CDC also tests susceptibility of circulating influenza viruses to antiviral medications including the neuraminidase inhibitors (oseltamivir, zanamivir, and peramivir) and the polymerase acidic protein (PA) endonuclease inhibitor baloxavir. The HA clade and subclades were assigned using Nextclade (https://clades.nextstrain.org).

CDC has genetically characterized 234 influenza viruses collected since September 29, 2024
A/H1101
5a.2a45 (44.6%)C.1.945 (44.6%)
5a.2a.156 (55.4%)D1 (1.0%)
D.31 (1.0%)
D.554 (53.5%)
A/H3117
2a.3a4 (3.4%)G.1.3.14 (3.4%)
2a.3a.1113 (96.6%)J.1.11 (0.9%)
J.2102 (87.2%)
J.2.11 (0.9%)
J.2.29 (7.7%)
B/Victoria16
V1A16 (100%)C.53 (18.8%)
C.5.18 (50.0%)
C.5.65 (31.3%)
B/Yamagata0
Y30Y30
CDC antigenically characterizes influenza viruses by hemagglutination inhibition (HI) assay (H1N1pdm09, H3N2, and B/Victoria viruses) or neutralization-based HINT (H3N2 viruses) using antisera that ferrets make after being infected with reference viruses representing the 2024-2025 Northern Hemisphere recommended cell or recombinant-based vaccine viruses. Antigenic differences between viruses are determined by comparing how well the antibodies made against the vaccine reference viruses recognize the circulating viruses that have been grown in cell culture. Ferret antisera are useful because antibodies raised against a particular virus can often recognize small changes in the surface proteins of other viruses. In HI assays, viruses with similar antigenic properties have antibody titer differences of less than or equal to 4-fold when compared to the reference (vaccine) virus. In HINT, viruses with similar antigenic properties have antibody neutralization titer differences of less than or equal to 8-fold. Viruses selected for antigenic characterization are a subset of the recent genetically characterized viruses and are chosen based on the genetic changes in their surface proteins and may not be proportional to the number of such viruses circulating in the United States. Influenza A Viruses
  • A (H1N1)pdm09: 14 A(H1N1)pdm09 viruses were antigenically characterized by HI, and all were well-recognized (reacting at titers that were within 4-fold of the homologous virus titer) by ferret antisera to cell-grown A/Wisconsin/67/2022-like reference viruses representing the A(H1N1)pdm09 component for the cell- and recombinant-based influenza vaccines.
  • A (H3N2): 15 A(H3N2) viruses were antigenically characterized by HI or HINT, and 6 (40.0%) were well-recognized (reacting at titers that were within 4-fold of the homologous virus titer in HI or reacting at titers that were less than or equal to 8-fold of the homologous virus in HINT) by ferret antisera to cell-grown A/Massachusetts/18/2022-like reference viruses representing the A(H3N2) component for the cell- and recombinant-based influenza vaccines
Influenza B Viruses
  • B/Victoria: No influenza B/Victoria-lineage virus were antigenically characterized by HI yet.
  • B/Yamagata: No influenza B/Yamagata-lineage viruses were available for antigenic characterization.
Assessment of Virus Susceptibility to Antiviral Medications


CDC assesses susceptibility of influenza viruses to the antiviral medications including the neuraminidase inhibitors (oseltamivir, zanamivir, and peramivir) and the PA endonuclease inhibitor baloxavir using next generation sequence analysis supplemented by laboratory assays. Information about antiviral susceptibility test methods can be found at U.S. Influenza Surveillance: Purpose and Methods | CDC.

Viruses collected in the U.S. since September 29, 2024, were tested for antiviral susceptibility as follows:
Neuraminidase InhibitorsOseltamivirViruses Tested34514018025
Reduced Inhibition1 (0.3%)1 (0.7%)00
Highly Reduced Inhibition0000
PeramivirViruses Tested34514018025
Reduced Inhibition0000
Highly Reduced Inhibition0000
ZanamivirViruses Tested34514018025
Reduced Inhibition0000
Highly Reduced Inhibition0000
PA Cap-Dependent Endonuclease InhibitorBaloxavirViruses Tested31112116921
Decreased Susceptibility0000
One A(H1N1)pdm09 virus had NA-I223V and NA-S247N amino acid substitutions and showed reduced inhibition by oseltamivir.

High levels of resistance to the adamantanes (amantadine and rimantadine) persist among influenza A(H1N1)pdm09 and influenza A(H3N2) viruses (the adamantanes are not effective against influenza B viruses). Therefore, use of these antivirals for treatment and prevention of influenza A virus infection is not recommended and data from adamantane resistance testing are not presented.

Outpatient and Emergency Department Illness Surveillance

Outpatient respiratory illness visits


The U.S. Outpatient Influenza-like Illness Surveillance Network (ILINet) monitors outpatient visits for respiratory illness referred to as influenza-like illness [ILI (fever plus cough or sore throat)], not laboratory-confirmed influenza, and will therefore capture respiratory illness visits due to infection with any pathogen that can present with similar symptoms, including influenza virus, SARS-CoV-2, and RSV. It is important to evaluate syndromic surveillance data, including that from ILINet, in the context of other sources of surveillance data to obtain a complete and accurate picture of influenza, SARS-CoV-2, and other respiratory virus activity.

Nationally, during Week 49, 3.4% of patient visits reported through ILINet were due to respiratory illness that included fever plus a cough or sore throat, also referred to as ILI. This week's percentage increased (change of > 0.1 percentage points) compared to Week 48 and is above the national baseline of 3.0% for the second consecutive week. The percentage of visits for ILI increased (change of > 0.1 percentage points) in HHS regions 2, 7, 8, 9, and 10. Regions 1, 3, 4, 5, and 6 have remained stable (change of ≤0.1 percentage points) compared to Week 48 but have been increasing over the past several weeks. HHS regions 1, 2, 3, 4, 7, 9, and 10 are above their respective baselines and regions 5 and 6 are at their respective baselines. Multiple respiratory viruses are co-circulating, and the relative contribution of influenza virus infections to ILI varies by location.

Outpatient respiratory illness visits by age group


About 70% of ILINet participants provide both the number of patient visits for respiratory illness and the total number of patient visits for the week broken out by age group. Based on these data, the percentage of visits for respiratory illness increased (change of > 0.1 percentage point) in the 25-49 years, 50-64 years, and 65+ years age groups and decreased slightly (change of > 0.1 percentage point) in the 0-4 years and 5-24 years age groups in Week 49 compared to Week 48.

Outpatient respiratory illness activity map


Data collected in ILINet are used to produce a measure of ILI activity* by state/jurisdiction and Core Based Statistical Areas (CBSA).
Week 49
(Week ending
Dec. 7, 2024)
Week 48
(Week ending
Nov. 30, 2024)
Week 49
(Week ending
Dec. 7, 2024)
Week 48
(Week ending
Nov. 30, 2024)
Very High0122
High623923
Moderate13106467
Low1716190160
Minimal1926410448
Insufficient Data00224229

*Data collected in ILINet may disproportionally represent certain populations within a jurisdiction or CBSA, and therefore, may not accurately depict the full picture of influenza activity for the entire jurisdiction or CBSA. Differences in the data presented here by CDC and independently by some health departments likely represent differing levels of data completeness with data presented by the health department likely being the more complete.

Additional information about medically attended visits for ILI for current and past seasons:


Surveillance Methods | FluView Interactive: National, Regional, and State Data or ILI Activity Map

National Syndromic Surveillance System (NSSP)


The overall percentage of emergency department (ED) visits with a discharge diagnosis of influenza reported in NSSP was 1.0% during Week 49. This percentage has remained stable from the previous week. In HHS regions 2, 3, 5, 8, 9, and 10 the percentage of ED visits increased (change of > 0.1 percentage points) in Week 49 compared to the previous week. In regions 1, 4, 6, and 7, the percentage of ED visits for influenza remained stable (change of ≤ 0.1 percentage point) compared to the previous week but have been increasing slowly over the past several weeks. The percentage of visits for influenza increased (change of > 0.1 percentage points) among the 0-4 years, 18-64 years, and 65+ years age groups and remained stable (change of ≤ 0.1 percentage points) among the 5-17 years age group. Make a selection from the filters to change the visualization information.
RegionNationalRegion 1Region 2Region 3Region 4Region 5Region 6Region 7Region 8Region 9Region 10
Season(s)2023-2024 & 2024-20252022-2023 Skip Over Chart Container
1.0%2.0%3.0%4.0%5.0%6.0%7.0%8.0%9.0%10.0%11.0%12.0 %13.0%Percent of Emergency Department Visits for InfluenzaWeek 41 of 2023Week 45 of 2023Week 49 of 2023Week 1 of 2024Week 5 of 2024Week 9 of 2024Week 13 of 2024Week 17 of 2024Week 21 of 2024Week 25 of 2024Week 29 of 2024Week 33 of 2024Week 37 of 2024Week 41 of 2024Week 45 of 2024Week 49 of 2024 Age Group


All ages
0-4 years
5-17 years
18-64 years
65+ Skip Data Table
Data Table Download Data (CSV) Skipped data table.

Additional information about emergency department visits for flu for current and past seasons:‎‎‎


Surveillance Methods | Emergency Department Visits for COVID-19, flu, and RSV

Hospitalization surveillance

FluSurv-Net


The Influenza Hospitalization Surveillance Network (FluSurv-NET) conducts population-based surveillance for laboratory-confirmed influenza-related hospitalizations in select counties in 14 states and represents approximately 9% of the U.S. population. FluSurv-NET hospitalization data are preliminary. As data are received each week, prior case counts and rates are updated accordingly.

A total of 962 laboratory-confirmed influenza-associated hospitalizations were reported by FluSurv-NET sites between October 1, 2024, and December 7, 2024. The weekly hospitalization rate observed in Week 49 was 0.9 per 100,000 population. The cumulative hospitalization rate observed in Week 49 was 3.1 per 100,000 population.

When examining rates by age, the highest cumulative hospitalization rate per 100,000 population was among adults aged 65 years and older (9.9), followed by adults aged 50-64 years (3.2) and children aged 0-4 years (2.6).

When examining age-adjusted rates by race and ethnicity, the highest cumulative hospitalization rate per 100,000 population was among non-Hispanic Black persons (4.3) followed by Hispanic persons (2.9), non-Hispanic White persons (2.5), American Indian/Alaska Native persons (2.4), and Asian/Pacific Islander persons (2.3).


[SUB]**In this figure, weekly rates for all seasons prior to the 2023-2024 season reflect end-of-season rates. For the 2023-2024 season, rates for recent hospital admissions are subject to reporting delays and are shown as a dashed line for the current season. As hospitalization data are received each week, prior case counts and rates are updated accordingly.[/SUB]

Additional FluSurv-NET hospitalization surveillance information for current and past seasons and additional age groups:


Surveillance Methods | FluView Interactive: Rates by Age, Sex, and Race/Ethnicity or Data on Patient Characteristics | RESP-NET Interactive

National healthcare safety network (NHSN) hospitalization surveillance


Effective November 1, 2024, all acute care and critical access hospitals are required to report the number of patients admitted with laboratory-confirmed influenza to NHSN. These data will be updated weekly in FluView and on FluView Interactive once sufficient data has been collected. Public datasets, including data reported on a voluntary basis prior to November 1, 2024 can be found here: https://data.cdc.gov/Public-Health-...talization-Metrics-by-Ju/aemt-mg7g/about_data.

Additional NHSN Hospitalization Surveillance information:


Surveillance Methods | Additional Data | FluView Interactive

Mortality surveillance


Based on NCHS mortality surveillance data available on December 12, 2024, 0.1% of the deaths that occurred during the week ending December 7, 2024 (Week 49), were due to influenza. This percentage remained stable (≤ 0.1 percentage point change) compared to Week 48. The data presented are preliminary and may change as more data are received and processed.

Additional pneumonia, influenza and COVID-19 mortality surveillance information for current and past seasons:


Surveillance Methods | FluView Interactive

Influenza-Associated Pediatric Mortality


No influenza-associated pediatric deaths were reported to CDC during Week 49.

A total of two influenza-associated pediatric deaths occurring during the 2024-2025 season have been reported to CDC.

Additional pediatric mortality surveillance information for current and past seasons:


Surveillance Methods | FluView Interactive

https://www.cdc.gov/fluview/surveillance/2024-week-49.html

​​
 
December 20, 2024 Weekly US Influenza Surveillance Report: Key Updates for Week 50, ending December 14, 2024

What to know


Seasonal influenza activity continues to increase across the country.
Summary

Viruses

Clinical Lab 9% (Trend
IncreasingArrow.png
)
positive for influenza
this week. Public Health Lab Influenza A(H1N1)pdm09 and A(H3N2)
were the predominant viruses reported this week. Illness

Outpatient Respiratory Illness 3.8% (Trend
IncreasingArrow.png
)
of visits to a health care provider this
week were for respiratory illness
(above baseline). Activity Map 11 moderate jurisdictions 15 high or very high jurisdictions FluSurv-NET 4.8 per 100,000
cumulative hospitalization rate National Healthcare Safety Network (NHSN) Hospital Respiratory Data 8,912 (Trend
IncreasingArrow.png
)
patients admitted to hospitals
with influenza this week. NCHS Mortality 0.2% (Trend
StableArrow.png
)
of deaths attributed to influenza this week. Pediatric Deaths 2 influenza-associated deaths
were reported this week for a total of 4 deaths this season.
All data are preliminary and may change as more reports are received.

Directional arrows indicate changes between the current week and the previous week. Additional information on the arrows can be found at the bottom of this page.

A description of the CDC influenza surveillance system, including methodology and detailed descriptions of each data component is available on the surveillance methods page.[SUP]1[/SUP]

Additional information on the current and previous influenza seasons for each surveillance component are available on FluView Interactive.

Key Points


• Seasonal influenza activity continues to increase across the country.

• Nationally, percent positivity for influenza, the percentage of emergency department visits for influenza, percentage of outpatient visits for respiratory illness, and influenza-associated hospitalizations increased this week compared to last week.

• During Week 50, of the 871 viruses reported by public health laboratories, 842 were influenza A and 29 were influenza B. Of the 593 influenza A viruses subtyped during Week 50, 274 (46.2%) were influenza A(H1N1)pdm09, 317 (53.5%) were A(H3N2), and 2 (0.3%) were A(H5).

• Three confirmed cases and one probable case of influenza A(H5) virus were reported to CDC this week. To date, human-to-human transmission of influenza A(H5) virus has not been identified in the United States.

• Two pediatric deaths associated with seasonal influenza virus infection were reported this week, bringing the 2024-2025 season total to four pediatric deaths.

• CDC estimates that there have been at least 1.9 million illnesses, 23,000 hospitalizations, and 970 deaths from flu so far this season.

• CDC recommends that everyone ages 6 months and older get an annual influenza (flu) vaccine.[SUP]1[/SUP]

• There are prescription flu antiviral drugs that can treat flu illness; those should be started as early as possible and are especially important for higher risk patients.[SUP]2[/SUP]

• Influenza viruses are among several viruses contributing to respiratory disease activity. CDC is providing updated, integrated information about COVID-19, flu, and respiratory syncytial virus (RSV) activity on a weekly basis.
COVID-19, flu, and RSV activity

U.S. virologic surveillance


Nationally and in all HHS regions, the percentage of respiratory specimens testing positive for influenza virus in clinical laboratories increased (change of ≥ 0.5 percentage points) compared to the previous week. Influenza A(H1N1)pdm09 and A(H3N2) were the predominant viruses reported this week. For regional and state level data and age group distribution, please visit FluView Interactive. Viruses known to be associated with recent receipt of live attenuated influenza vaccine (LAIV) or found upon further testing to be a vaccine virus are not included, as they are not circulating influenza viruses.

Clinical Laboratories


The results of tests performed by clinical laboratories nationwide are summarized below. Data from clinical laboratories (the percentage of specimens tested that are positive for influenza virus) are used to monitor whether influenza activity is increasing or decreasing.
No. of specimens tested86,686844,153
No. of positive specimens (%)7,831 (9.0%)23,892 (2.8%)
Positive specimens by type
Influenza A7,518 (96.0%)22,472 (94.1%)
Influenza B313 (4.0%)1,420 (5.9%)

Public Health Laboratories


The results of tests performed by public health laboratories nationwide are summarized below. Data from public health laboratories are used to monitor the proportion of circulating influenza viruses that belong to each influenza subtype/lineage.
No. of specimens tested1,66317,866
No. of positive specimens8715,981
Positive specimens by type/subtype
Influenza A842 (96.7%)5,712 (95.5%)
Subtyping Performed593 (70.4%)4,802 (84.1%)
(H1N1)pdm09274 (46.2%)2,127 (44.3%)
H3N2317 (53.5%)2,602 (54.2%)
H3N2v[SUP]†[/SUP]00
H5*2 (0.3%)73 (1.5%)
Subtyping not performed249 (29.6%)910 (15.9%)
Influenza B29 (3.3%)269 (4.5%)
Lineage testing performed8 (27.6%)123 (45.7%)
Yamagata lineage00
Victoria lineage8 (100.0%)123 (100.0%)
Lineage not performed21 (72.4%)146 (54.3%)
[SUB]*This data reflects specimens tested and the number determined to be positive for influenza viruses at the public health labs (specimens tested is not the same as cases). It does not reflect specimens tested only at CDC and could include more than one specimen tested per person. The guidance for influenza A/H5 testing recommends testing both a conjunctival and respiratory swab for people with conjunctivitis which has resulted in more specimens testing positive for influenza A/H5 than the number of human H5 cases. For more information on the number of people infected with A/H5, please visit the [/SUB][SUB]"How CDC is monitoring influenza data among people to better understand the current avian influenza A (H5N1) situation"[/SUB]

[SUP]†[/SUP][SUB]When an influenza virus that normally circulates in swine (but not people) is detected in a person, it is called a "variant" influenza virus. Most human infections with variant influenza viruses occur following exposure to swine, but human-to-human transmission can occur. It is important to note that in most cases, variant influenza viruses have not shown the ability to spread easily and sustainably from person to person.[/SUB]


[SUB]*This graph reflects the number of specimens tested and the number determined to be positive for influenza viruses at the public health lab (specimens tested is not the same as cases). It does not reflect specimens tested only at CDC and could include more than one specimen tested per person. Specimens tested as part of routine influenza surveillance as well as those tested as part of targeted testing for people exposed to influenza A(H5) are included.[/SUB]

Additional virologic surveillance information for current and past seasons:


Surveillance Methods | FluView Interactive: National, Regional, and State Data or Age Data

Novel Influenza A Virus


Three confirmed cases and one probable influenza A(H5) case were reported to CDC this week. To date, human-to-human transmission of influenza A(H5) virus has not been identified in the United States.

Two of these confirmed cases were reported by the California Department of Public Health. The cases occurred in a workers aged ≥18 years at a commercial dairy cattle farm in an area where highly pathogenic avian influenza (HPAI) A(H5N1) viruses had been detected in cows. The individuals had mild symptoms, which they reported to local health department officials. There have now been 34 total confirmed cases and one probable case in California.

The other confirmed case was reported by the Louisiana Department of Health. This case occurred in an individual aged ≥18 years. This individual developed respiratory symptoms during week 48 and was hospitalized with their illness. A respiratory specimen was collected at the healthcare facility and tested positive for influenza A, but negative for seasonal virus subtypes. The specimen was sent to the Louisiana Public Health Laboratory for further testing, where it tested presumptive positive for influenza A(H5) virus using the CDC influenza A(H5) assay. Influenza A(H5) virus was confirmed at CDC. The investigation by public health officials identified exposure to backyard poultry prior to the patient's illness onset. The patient remains hospitalized. This is the first influenza A(H5) case in Louisiana and the first instance of severe illness from influenza A(H5) virus infection in the United States.

The probable case was reported by the Delaware Division of Public Health. The case occurred in an individual aged ≥18 years. This individual developed respiratory symptoms during week 48 and sought healthcare for their illness. A respiratory specimen was collected at the healthcare facility and tested positive for influenza A. The specimen was sent to the Delaware Public Health Laboratory for routine surveillance, where it tested presumptive positive for influenza A(H5) virus using the CDC influenza A(H5) assay. The specimen was negative for influenza A(H5) virus using diagnostic RT-PCR at CDC. The investigation by public health officials did not find any exposure to poultry or cows or consumption of raw dairy products prior to the patient's illness onset. The patient has since recovered. This is the first probable case in Delaware.

Notification of the case reported by the Louisiana Department of Health to WHO was initiated per International Health Regulations (IHR). More information regarding IHR can be found at http://www.who.int/topics/international_health_regulations/en/. No additional notification to WHO of the probable case or confirmed cases exposed to dairy cows in California is required per International Health Regulations (IHR).

The CSTE position statement, which includes updated case definitions for confirmed, probable, and suspected cases is available at http://www.cste.org/resource/resmgr/position_statements_files_2023/24-ID-09_Novel_Influenza_A.pdf

An up-to-date human case summary during the 2024 outbreak by state and exposure source is available at www.cdc.gov/bird-flu/situation-summary/index.html

Information about avian influenza is available at https://www.cdc.gov/flu/avianflu/index.htm.

Interim recommendations for Prevention, Monitoring, and Public Health Investigations are available at https://www.cdc.gov/bird-flu/prevention/hpai-interim-recommendations.html.

The latest case reports on avian influenza outbreaks in wild birds, commercial poultry, backyard or hobbyist flocks, and mammals in the United States are available from the USDA at https://www.aphis.usda.gov/aphis/ou...e-information/avian/avian-influenza/2022-hpai.

Additional information regarding human infections with novel influenza A viruses:


Surveillance Methods | FluView Interactive

Influenza Virus Characterization


CDC performs genetic and antigenic characterization of U.S. viruses submitted from state and local public health laboratories according to the Right Size Roadmap submission guidance. These data are used to compare how similar the currently circulating influenza viruses are to the reference viruses representing the current influenza vaccines. The data are also used to monitor evolutionary changes that continually occur in influenza viruses circulating in humans. CDC also tests susceptibility of circulating influenza viruses to antiviral medications including the neuraminidase inhibitors (oseltamivir, zanamivir, and peramivir) and the polymerase acidic protein (PA) endonuclease inhibitor baloxavir. The HA clade and subclades were assigned using Nextclade (https://clades.nextstrain.org).

CDC has genetically characterized 394 influenza viruses collected since September 29, 2024
A/H1161
5a.2a77 (47.8%)C.1.977 (47.8%)
5a.2a.184 (52.2%)D1 (0.6%)
D.38 (5.0%)
D.575 (46.6%)
A/H3206
2a.3a4 (1.9%)G.1.3.14 (1.9%)
2a.3a.1202 (98.1%)J.1.12 (1.0%)
J.2180 (87.4%)
J.2.12 (1.0%)
J.2.218 (8.7%)
B/Victoria27
3a.227 (100%)C.53 (11.1%)
C.5.115 (55.6%)
C.5.66 (22.2%)
C.5.73 (11.1%)
B/Yamagata0
Y30Y30
CDC antigenically characterizes influenza viruses by hemagglutination inhibition (HI) (H1N1pdm09, H3N2, and B/Victoria viruses) or neutralization-based HINT (H3N2 viruses) using antisera that ferrets make after being infected with reference viruses representing the 2024-2025 Northern Hemisphere recommended cell or recombinant-based vaccine viruses. Antigenic differences between viruses are determined by comparing how well the antibodies made against the vaccine reference viruses recognize the circulating viruses that have been grown in cell culture. Ferret antisera are useful because antibodies raised against a particular virus can often recognize small changes in the surface proteins of other viruses. In HI assays, viruses with similar antigenic properties have antibody titer differences of less than or equal to 4-fold when compared to the reference (vaccine) virus. In HINT, viruses with similar antigenic properties have antibody neutralization titer differences of less than or equal to 8-fold. Viruses selected for antigenic characterization are a subset of the recent genetically characterized viruses and are chosen based on the genetic changes in their surface proteins and may not be proportional to the number of such viruses circulating in the United States.

Influenza A Viruses
  • A(H1N1)pdm09: 14 A(H1N1)pdm09 viruses were antigenically characterized by HI, and 14 (100%) were well-recognized (reacting at titers that were within 4-fold of the homologous virus titer) by ferret antisera to cell-grown A/Wisconsin/67/2022-like reference viruses representing the A(H1N1)pdm09 component for the cell- and recombinant-based influenza vaccines.
  • A(H3N2): 34 A(H3N2) viruses were antigenically characterized by HI or HINT, and 19 (55.9%) were well-recognized (reacting at titers that were within 4-fold of the homologous virus titer in HI or reacting at titers that were less than or equal to 8-fold of the homologous virus in HINT) by ferret antisera to cell-grown A/Massachusetts/18/2022-like reference viruses representing the A(H3N2) component for the cell- and recombinant-based influenza vaccines.
Influenza B Viruses
  • B/Victoria: No influenza B/Victoria-lineage virus were antigenically characterized by HI yet.
  • B/Yamagata: No influenza B/Yamagata-lineage viruses were available for antigenic characterization.
Assessment of Virus Susceptibility to Antiviral Medications


CDC assesses susceptibility of influenza viruses to the antiviral medications including the neuraminidase inhibitors (oseltamivir, zanamivir, and peramivir) and the PA endonuclease inhibitor baloxavir using next generation sequence analysis supplemented by laboratory assays. Information about antiviral susceptibility test methods can be found at U.S. Influenza Surveillance: Purpose and Methods.

Viruses collected in the U.S. since September 29, 2024, were tested for antiviral susceptibility as follows:
Neuraminidase InhibitorsOseltamivirViruses Tested38215520027
Reduced Inhibition1 (0.3%)1 (0.6%)00
Highly Reduced Inhibition0000
PeramivirViruses Tested38215520027
Reduced Inhibition0000
Highly Reduced Inhibition0000
ZanamivirViruses Tested38215520027
Reduced Inhibition0000
Highly Reduced Inhibition0000
PA Cap-Dependent Endonuclease InhibitorBaloxavirViruses Tested35813519924
Decreased Susceptibility0000
One A(H1N1)pdm09 virus had NA-I223V and NA-S247N amino acid substitutions and showed reduced inhibition by oseltamivir.

High levels of resistance to the adamantanes (amantadine and rimantadine) persist among influenza A(H1N1)pdm09 and influenza A(H3N2) viruses (the adamantanes are not effective against influenza B viruses). Therefore, use of these antivirals for treatment and prevention of influenza A virus infection is not recommended and data from adamantane resistance testing are not presented.

Outpatient and Emergency Department Illness Surveillance

Outpatient respiratory illness visits


The U.S. Outpatient Influenza-like Illness Surveillance Network (ILINet) monitors outpatient visits for respiratory illness referred to as influenza-like illness [ILI (fever plus cough or sore throat)], not laboratory-confirmed influenza, and will therefore capture respiratory illness visits due to infection with any pathogen that can present with similar symptoms, including influenza virus, SARS-CoV-2, and RSV. It is important to evaluate syndromic surveillance data, including that from ILINet, in the context of other sources of surveillance data to obtain a complete and accurate picture of influenza, SARS-CoV-2, and other respiratory virus activity.

Nationally, during Week 50, 3.8% of patient visits reported through ILINet were due to respiratory illness that included fever plus a cough or sore throat, also referred to as ILI. This week's percentage increased (change of > 0.1 percentage points) compared to Week 49 and is above the national baseline of 3.0% for the third consecutive week. The percentage of visits for ILI increased (change of > 0.1 percentage points) in all HHS regions except Region 3, which remained stable (change of ≤0.1 percentage points) compared to Week 49 but has been increasing over the past several weeks. All HHS regions are above their respective baselines, except Region 8, which is still below its baseline. Multiple respiratory viruses are co-circulating, and the relative contribution of influenza virus infections to ILI varies by location.

Outpatient respiratory illness visits by age group


About 70% of ILINet participants provide both the number of patient visits for respiratory illness and the total number of patient visits for the week broken out by age group. Based on these data, the percentage of visits for respiratory illness increased (change of > 0.1 percentage point) in the 0-4 years, 5-24 years, and 25-49 years age groups and remained stable (change of ≤0.1 percentage points) in the 50-64 years and 65+ years age groups in Week 50 compared to Week 49.

Outpatient respiratory illness activity map


Data collected in ILINet are used to produce a measure of ILI activity* by state/jurisdiction and Core Based Statistical Areas (CBSA).
Week 50
(Week ending
Dec. 14, 2024)
Week 49
(Week ending
Dec. 7, 2024)
Week 50
(Week ending
Dec. 14, 2024)
Week 49
(Week ending
Dec. 7, 2024)
Very High20112
High1365440
Moderate11139365
Low1015176188
Minimal1921374417
Insufficient Data00221217


*Data collected in ILINet may disproportionally represent certain populations within a jurisdiction or CBSA, and therefore, may not accurately depict the full picture of influenza activity for the entire jurisdiction or CBSA. Differences in the data presented here by CDC and independently by some health departments likely represent differing levels of data completeness with data presented by the health department likely being the more complete.

Additional information about medically attended visits for ILI for current and past seasons:


Surveillance Methods | FluView Interactive: National, Regional, and State Data or ILI Activity Map

National Syndromic Surveillance System (NSSP)


The overall percentage of emergency department (ED) visits with a discharge diagnosis of influenza reported in NSSP was 1.7% during Week 50, an increase (change of > 0.1 percentage points) from 1.0% the previous week. In all 10 HHS regions and among all age groups, the percentage of ED visits for influenza increased (change of > 0.1 percentage points) in Week 50 compared to the previous week. RegionNationalRegion 1Region 2Region 3Region 4Region 5Region 6Region 7Region 8Region 9Region 10
Season(s)2023-2024 & 2024-20252022-2023 Skip Over Chart Container
1.0%2.0%3.0%4.0%5.0%6.0%7.0%8.0%9.0%10.0%11.0%12.0 %13.0%Percent of Emergency Department Visits for InfluenzaWeek 42 of 2023Week 46 of 2023Week 50 of 2023Week 2 of 2024Week 6 of 2024Week 10 of 2024Week 14 of 2024Week 18 of 2024Week 22 of 2024Week 26 of 2024Week 30 of 2024Week 34 of 2024Week 38 of 2024Week 42 of 2024Week 46 of 2024Week 50 of 2024

Age Group


All ages
0-4 years
5-17 years
18-64 years
65+ Skip Data Table
Data Table Download Data (CSV) Skipped data table.

Additional information about emergency department visits for flu for current and past seasons:‎‎‎


Surveillance Methods | Emergency Department Visits for COVID-19, flu, and RSV

Hospitalization surveillance

FluSurv-Net


The Influenza Hospitalization Surveillance Network (FluSurv-NET) conducts population-based surveillance for laboratory-confirmed influenza-related hospitalizations in select counties in 14 states and represents approximately 9% of the U.S. population. FluSurv-NET hospitalization data are preliminary. As data are received each week, prior case counts and rates are updated accordingly.

A total of 1,481 laboratory-confirmed influenza-associated hospitalizations were reported by FluSurv-NET sites between October 1 and December 14, 2024. The weekly hospitalization rate observed in Week 50 was 1.5 per 100,000 population. The cumulative hospitalization rate observed in Week 50 was 4.8 per 100,000 population.

When examining rates by age, the highest cumulative hospitalization rate per 100,000 population was among adults aged 65 years and older (14.6), followed by adults aged 50-64 years (5.2), children aged 0-4 years (4.4), adults aged 18-49 (2.2), and children aged 5-17 (1.8).

When examining age-adjusted rates by race and ethnicity, the highest cumulative hospitalization rate per 100,000 population was among non-Hispanic Black persons (6.7) followed by Hispanic persons (4.9), American Indian/Alaska Native persons (4.1), non-Hispanic White persons (3.8), and Asian/Pacific Islander persons (3.1).


[SUB]**In this figure, weekly rates for all seasons prior to the 2024-2025 season reflect end-of-season rates. For the 2024-2025 season, rates for recent hospital admissions are subject to reporting delays and are shown as a dashed line for the current season. As hospitalization data are received each week, prior case counts and rates are updated accordingly.[/SUB]

Additional FluSurv-NET hospitalization surveillance information for current and past seasons and additional age groups:


Surveillance Methods | FluView Interactive: Rates by Age, Sex, and Race/Ethnicity or Data on Patient Characteristics | RESP-NET Interactive

National Healthcare Safety Network (NHSN) Hospital Respiratory Data


Hospitals report to NHSN the weekly number of patients with laboratory-confirmed influenza who were admitted to the hospital. Nationally, during week 50, 8,912 laboratory confirmed influenza-associated hospitalizations were reported. This is an increase (change of >5%) compared to week 49 when 6,314 hospitalizations were reported.

The weekly hospital admission rate observed in week 50 was 2.7 per 100,000. The weekly rate of hospital admissions in the 10 HHS regions ranged from 1.4 per 100,000 (Region 1) to 4.9 per 100,000 (Region 9) and increased compared to the previous week in all 10 regions.

When examining rates by age for week 50, all age groups increased (change of >5%) compared to the previous week. The highest hospital admission rate per 100,000 population was among those 75+ years (10.6), followed by 65-to-74-year age group (4.7), and 0-to-4-year age group (2.8). View Larger
NHSN50_1.gif
Additional NHSN Hospital Respiratory Data information:


Surveillance Methods | Additional Data | FluView Interactive

Mortality surveillance


Based on NCHS mortality surveillance data available on December 19, 2024, 0.2% of the deaths that occurred during the week ending December 14, 2024 (Week 50), were due to influenza. This percentage remained stable (≤ 0.1 percentage point change) compared to Week 49. The data presented are preliminary and may change as more data are received and processed.

Additional pneumonia, influenza and COVID-19 mortality surveillance information for current and past seasons:


Surveillance Methods | FluView Interactive

Influenza-Associated Pediatric Mortality


Two influenza-associated pediatric deaths occurring during the 2024-2025 season were reported to CDC during week 50. One death was associated with an influenza A virus with no subtyping performed and occurred during week 49 (the week ending December 7, 2024). The other death was associated with an influenza B virus with no lineage determined and occurred during week 50 (the week ending December 14, 2024).

A total of four influenza-associated pediatric deaths occurring during the 2024-2025 season have been reported to CDC.

Additional pediatric mortality surveillance information for current and past seasons:


Surveillance Methods | FluView Interactive

Additional National and International Influenza Surveillance Information

Indicators Status by System


Increasing:
IncreasingArrow.png

Decreasing:
DecreasingArrow.png

Stable:
StableArrow.png


Clinical Labs: Up or down arrows indicate a change of greater than or equal to 0.5 percentage points in the percent of specimens positive for influenza compared to the previous week.
Outpatient Respiratory Illness (ILINet): Up or down arrows indicate a change of greater than 0.1 percentage points in the percent of visits due to respiratory illness (ILI) compared to the previous week.
NHSN Hospitalizations: Up or down arrows indicate change of greater than or equal to 5% of the number of patients admitted with laboratory-confirmed influenza compared to the previous week.
NCHS Mortality: Up or down arrows indicate change of greater than 0.1 percentage points of the percent of deaths due to influenza compared to the previous week.

Additional surveillance information


FluView Interactive: FluView includes enhanced web-based interactive applications that can provide dynamic visuals of the influenza data collected and analyzed by CDC. These FluView Interactive applications allow people to create customized, visual interpretations of influenza data, as well as make comparisons across flu seasons, regions, age groups and a variety of other demographics.

National Institute for Occupational Safety and Health: Monthly surveillance data on the prevalence of health-related workplace absenteeism among full-time workers in the United States are available from NIOSH.

https://www.cdc.gov/fluview/surveillance/2024-week-50.html
 
Weekly US Influenza Surveillance Report: Key Updates for Week 51, ending December 21, 2024

What to know


Seasonal influenza activity continues to increase across the country.
Summary

Viruses

Clinical Lab 12.0% (Trend
IncreasingArrow.png
)
positive for influenza
this week. Public Health Lab Influenza A(H1N1)pdm09 and A(H3N2)
were the predominant viruses reported this week. Illness

Outpatient Respiratory Illness 4.9% (Trend
IncreasingArrow.png
)
of visits to a health care provider this
week were for respiratory illness
(above baseline). Activity Map 8 moderate jurisdictions 26 high or very high jurisdictions FluSurv-NET 7.7 per 100,000
cumulative hospitalization rate National Healthcare Safety Network (NHSN) Hospital Respiratory Data 12,543 (Trend
IncreasingArrow.png
)
patients admitted to hospitals
with influenza this week. NCHS Mortality 0.3% (Trend
StableArrow.png
)
of deaths attributed to influenza this week. Pediatric Deaths 5 influenza-associated deaths
were reported this week for a total of 9 deaths this season.
All data are preliminary and may change as more reports are received.

Directional arrows indicate changes between the current week and the previous week. Additional information on the arrows can be found at the bottom of this page.

A description of the CDC influenza surveillance system, including methodology and detailed descriptions of each data component is available on the surveillance methods page.[SUP]1[/SUP]

Additional information on the current and previous influenza seasons for each surveillance component are available on FluView Interactive.

Key Points


• Seasonal influenza activity continues to increase across the country.

• Nationally, percent positivity for influenza, the percentage of emergency department visits for influenza, percentage of outpatient visits for respiratory illness, and influenza-associated hospitalizations increased this week compared to last week.

• During Week 51, of the 1,132 viruses reported by public health laboratories, 1,110 were influenza A and 22 were influenza B. Of the 818 influenza A viruses subtyped during Week 51, 356 (43.5%) were influenza A(H1N1)pdm09, 461 (56.4%) were A(H3N2), and 1 (0.1%) were A(H5).

• Five confirmed influenza A(H5) cases were reported to CDC this week. To date, human-to-human transmission of influenza A(H5) virus has not been identified in the United States.

• Five pediatric deaths associated with seasonal influenza virus infection were reported this week, bringing the 2024-2025 season total to nine pediatric deaths.

• CDC estimates that there have been at least 3.1 million illnesses, 37,000 hospitalizations, and 1,500 deaths from flu so far this season.

• CDC recommends that everyone ages 6 months and older get an annual influenza (flu) vaccine.[SUP]1[/SUP]

• There are prescription flu antiviral drugs that can treat flu illness; those should be started as early as possible and are especially important for patients at higher risk for severe illness.[SUP]2[/SUP]

• Influenza viruses are among several viruses contributing to respiratory disease activity. CDC is providing updated, integrated information about COVID-19, flu, and respiratory syncytial virus (RSV) activity on a weekly basis.
COVID-19, flu, and RSV activity

U.S. virologic surveillance


Nationally, the percentage of respiratory specimens testing positive for influenza virus in clinical laboratories increased (change of ≥ 0.5 percentage points) compared to the previous week. Influenza A(H1N1)pdm09 and A(H3N2) were the predominant viruses reported this week. For regional and state level data and age group distribution, please visit FluView Interactive. Viruses known to be associated with recent receipt of live attenuated influenza vaccine (LAIV) or found upon further testing to be a vaccine virus are not included, as they are not circulating influenza viruses.

Clinical Laboratories


The results of tests performed by clinical laboratories nationwide are summarized below. Data from clinical laboratories (the percentage of specimens tested that are positive for influenza virus) are used to monitor whether influenza activity is increasing or decreasing.
No. of specimens tested74,587941,281
No. of positive specimens (%)8,953 (12.0%)33,472 (3.6%)
Positive specimens by type
Influenza A8,787 (98.1%)31,861 (95.2%)
Influenza B166 (1.9%)1,611 (4.8%)
Public Health Laboratories


The results of tests performed by public health laboratories nationwide are summarized below. Data from public health laboratories are used to monitor the proportion of circulating influenza viruses that belong to each influenza subtype/lineage.
No. of specimens tested1,69420,997
No. of positive specimens1,1328,174
Positive specimens by type/subtype
Influenza A1,110 (98.1%)7,857 (96.1%)
Subtyping Performed818 (73.7%)6,748 (85.9%)
(H1N1)pdm09356 (43.5%)3,016 (44.7%)
H3N2461 (56.4%)3,655 (54.2%)
H3N2v[SUP]†[/SUP]00
H5*1 (0.1%)77 (1.1%)
Subtyping not performed292 (26.3%)1,109 (14.1%)
Influenza B22 (1.9%)317 (3.9%)
Lineage testing performed9 (40.9%)169 (53.3%)
Yamagata lineage00
Victoria lineage9 (100%)169 (100%)
Lineage not performed13 (59.1%)148 (46.7%)
[SUB]*These data reflect specimens tested, and the number determined to be positive for influenza viruses at the public health labs (specimens tested is not the same as cases). The data do not reflect specimens tested only at CDC and could include more than one specimen tested per person. The guidance for influenza A(H5) virus testing recommends testing both a conjunctival and respiratory swab for people with conjunctivitis which has resulted in more specimens testing positive for influenza A(H5) virus than the number of human A(H5) cases. For more information on the number of people infected with A(H5) viruses, please visit the"How CDC is monitoring influenza data among people to better understand the current avian influenza A (H5N1) situation"[/SUB]

[SUB][SUP]†[/SUP]When an influenza virus that normally circulates in swine (but not people) is detected in a person, it is called a "variant" influenza virus. Most human infections with variant influenza viruses occur following exposure to swine, but human-to-human transmission can occur. It is important to note that in most cases, variant influenza viruses have not shown the ability to spread easily and sustainably from human-to-human.[/SUB]


[SUB]*This graph reflects the number of specimens tested and the number determined to be positive for influenza viruses at the public health lab (specimens tested is not the same as cases). It does not reflect specimens tested only at CDC and could include more than one specimen tested per person. Specimens tested as part of routine influenza surveillance as well as those tested as part of targeted testing for people exposed to influenza A(H5) are included.[/SUB] Additional virologic surveillance information for current and past seasons:


Surveillance Methods | FluView Interactive: National, Regional, and State Data or Age Data Novel Influenza A Virus


Five confirmed cases of influenza A(H5) were reported to CDC this week. To date, human-to-human transmission of influenza A(H5) virus has not been identified in the United States.

Three of these cases were reported by the California Department of Public Health. The cases occurred in workers aged ≥18 years at commercial dairy cattle farms in an area where highly pathogenic avian influenza (HPAI) A(H5N1) viruses had been detected in cows. The individuals had mild symptoms, which they reported to local health department officials. There have now been 37 total confirmed cases and one probable case in California during the 2024-2025 influenza season.

One case was reported by the Wisconsin Department of Health. This case occurred in an individual aged ≥18 years who worked at a poultry facility where HPAI A(H5N1) virus had been identified in birds. This individual developed respiratory symptoms during Week 50. Specimens were collected from the individual and initially tested at the state public health laboratories using the CDC influenza A(H5) assay before being sent to CDC for further testing. Influenza A(H5) virus was confirmed at CDC. This is the first influenza A(H5) case in Wisconsin.

One case was reported by the Iowa Department of Health and Human Services. This case occurred in an individual aged ≥18 years who worked at a poultry facility where HPAI A(H5N1) virus had been identified in birds. This individual developed conjunctivitis and respiratory symptoms during Week 50. Specimens were collected from the individual and initially tested at the State Hygienic Laboratory at the University of Iowa using the CDC influenza A(H5) assay before being sent to CDC for further testing. Influenza A(H5) virus was confirmed at CDC. This is the first influenza A(H5) case in Iowa.

Notification to WHO of the cases reported by the Wisconsin and Iowa departments of health was initiated per International Health Regulations (IHR). More information regarding IHR can be found at http://www.who.int/topics/international_health_regulations/en/. No additional notification to WHO of the cases exposed to dairy cows in California is required per International Health Regulations (IHR).

The CSTE position statement, which includes updated case definitions for confirmed, probable, and suspected cases is available at http://www.cste.org/resource/resmgr/position_statements_files_2023/24-ID-09_Novel_Influenza_A.pdf

An up-to-date human case summary during the 2024 outbreak by state and exposure source is available at www.cdc.gov/bird-flu/situation-summary/index.html

Information about avian influenza is available at https://www.cdc.gov/flu/avianflu/index.htm.

Interim recommendations for Prevention, Monitoring, and Public Health Investigations are available at https://www.cdc.gov/bird-flu/prevention/hpai-interim-recommendations.html.

The latest case reports on avian influenza outbreaks in wild birds, commercial poultry, backyard or hobbyist flocks, and mammals in the United States are available from the USDA at https://www.aphis.usda.gov/aphis/ou...e-information/avian/avian-influenza/2022-hpai. Additional information regarding human infections with novel influenza A viruses:


Surveillance Methods | FluView Interactive

Influenza Virus Characterization


CDC performs genetic and antigenic characterization of U.S. viruses submitted from state and local public health laboratories according to the Right Size Roadmap submission guidance. These data are used to compare how similar the currently circulating influenza viruses are to the reference viruses representing the current influenza vaccines. The data are also used to monitor evolutionary changes that continually occur in influenza viruses circulating in humans. CDC also tests susceptibility of circulating influenza viruses to antiviral medications including the neuraminidase inhibitors (oseltamivir, zanamivir, and peramivir) and the polymerase acidic protein (PA) endonuclease inhibitor baloxavir. The HA clade and subclades were assigned using Nextclade (https://clades.nextstrain.org).

CDC has genetically characterized 577 influenza viruses collected since September 29, 2024.
A/H1229
5a.2a116 (50.7%)C.1.9116 (50.7%)
5a.2a.1113 (49.3%)D4 (1.7%)
D.11 (0.4%)
D.311 (4.8%)
D.597 (42.4%)
A/H3310
2a.3a4 (1.3%)G.1.3.14 (1.3%)
2a.3a.1306 (98.7%)J.1.13 (1.0%)
J.2277 (89.4%)
J.2.16 (1.9%)
J.2.220 (6.5%)
B/Victoria38
3a.238 (100%)C.54 (10.5%)
C.5.122 (57.9%)
C.5.68 (21.1%)
C.5.74 (10.5%)
B/Yamagata0
Y30Y30
CDC antigenically characterizes influenza viruses by hemagglutination inhibition (HI) (H1N1pdm09, H3N2, and B/Victoria viruses) or neutralization-based HINT (H3N2 viruses) using antisera that ferrets make after being infected with reference viruses representing the 2024-2025 Northern Hemisphere recommended cell or recombinant-based vaccine viruses. Antigenic differences between viruses are determined by comparing how well the antibodies made against the vaccine reference viruses recognize the circulating viruses that have been grown in cell culture. Ferret antisera are useful because antibodies raised against a particular virus can often recognize small changes in the surface proteins of other viruses. In HI assays, viruses with similar antigenic properties have antibody titer differences of less than or equal to 4-fold when compared to the reference (vaccine) virus. In HINT, viruses with similar antigenic properties have antibody neutralization titer differences of less than or equal to 8-fold. Viruses selected for antigenic characterization are a subset of the recent genetically characterized viruses and are chosen based on the genetic changes in their surface proteins and may not be proportional to the number of such viruses circulating in the United States. Influenza A Viruses
  • A(H1N1)pdm09: 40 A(H1N1)pdm09 viruses were antigenically characterized by HI, and all were well-recognized (reacting at titers that were within 4-fold of the homologous virus titer) by ferret antisera to cell-grown A/Wisconsin/67/2022-like reference viruses representing the A(H1N1)pdm09 component for the cell- and recombinant-based influenza vaccines.
  • A(H3N2): 34 A(H3N2) viruses were antigenically characterized by HI or HINT, and 19 (55.9%) were well-recognized (reacting at titers that were within 4-fold of the homologous virus titer in HI or reacting at titers that were less than or equal to 8-fold of the homologous virus in HINT) by ferret antisera to cell-grown A/Massachusetts/18/2022-like reference viruses representing the A(H3N2) component for the cell- and recombinant-based influenza vaccines.
Influenza B Viruses
  • B/Victoria: 7 influenza B/Victoria-lineage virus were antigenically characterized by HI, and all were well-recognized (reacting at titers that were within 4-fold of the homologous virus titer) by ferret antisera to cell-grown B/Austria/1359417/2021-like reference viruses representing the B/Victoria component for the cell- and recombinant-based influenza vaccines.
  • B/Yamagata: No influenza B/Yamagata-lineage viruses were available for antigenic characterization.
Assessment of Virus Susceptibility to Antiviral Medications


CDC assesses susceptibility of influenza viruses to the antiviral medications including the neuraminidase inhibitors (oseltamivir, zanamivir, and peramivir) and the PA endonuclease inhibitor baloxavir using next generation sequence analysis supplemented by laboratory assays. Information about antiviral susceptibility test methods can be found at U.S. Influenza Surveillance: Purpose and Methods.

Viruses collected in the U.S. since September 29, 2024, were tested for antiviral susceptibility as follows:
Neuraminidase InhibitorsOseltamivirViruses Tested57222630838
Reduced Inhibition1 (0.2%)1 (0.4%)00
Highly Reduced Inhibition0000
PeramivirViruses Tested57222630838
Reduced Inhibition0000
Highly Reduced Inhibition0000
ZanamivirViruses Tested57222630838
Reduced Inhibition0000
Highly Reduced Inhibition0000
PA Cap-Dependent Endonuclease InhibitorBaloxavirViruses Tested58121233237
Decreased Susceptibility0000
One A(H1N1)pdm09 virus had NA-I223V and NA-S247N amino acid substitutions and showed reduced inhibition by oseltamivir.

High levels of resistance to the adamantanes (amantadine and rimantadine) persist among influenza A(H1N1)pdm09 and influenza A(H3N2) viruses (the adamantanes are not effective against influenza B viruses). Therefore, use of these antivirals for treatment and prevention of influenza A virus infection is not recommended and data from adamantane resistance testing are not presented.

Outpatient and Emergency Department Illness Surveillance

Outpatient respiratory illness visits


The U.S. Outpatient Influenza-like Illness Surveillance Network (ILINet) monitors outpatient visits for respiratory illness referred to as influenza-like illness [ILI (fever plus cough or sore throat)], not laboratory-confirmed influenza, and will therefore capture respiratory illness visits due to infection with any pathogen that can present with similar symptoms, including influenza virus, SARS-CoV-2, and RSV. It is important to evaluate syndromic surveillance data, including that from ILINet, in the context of other sources of surveillance data to obtain a complete and accurate picture of influenza, SARS-CoV-2, and other respiratory virus activity.

Nationally, during Week 51, 4.9% of patient visits reported through ILINet were due to respiratory illness that included fever plus a cough or sore throat, also referred to as ILI. This week's percentage increased (change of > 0.1 percentage points) compared to Week 50 and is above the national baseline of 3.0% for the fourth consecutive week. The percentage of visits for ILI increased (change of > 0.1 percentage points) in all HHS regions compared to Week 50. All HHS regions are above their respective baselines. Multiple respiratory viruses are co-circulating, and the relative contribution of influenza virus infections to ILI varies by location.

Outpatient respiratory illness visits by age group


About 70% of ILINet participants provide both the number of patient visits for respiratory illness and the total number of patient visits for the week broken out by age group. Based on these data, the percentage of visits for respiratory illness increased (change of > 0.1 percentage point) in all age groups in Week 51 compared to Week 50.

Outpatient respiratory illness activity map


Data collected in ILINet are used to produce a measure of ILI activity* by state/jurisdiction and Core Based Statistical Areas (CBSA).
Week 51
(Week ending
Dec. 21, 2024)
Week 50
(Week ending
Dec. 14, 2024)
Week 51
(Week ending
Dec. 21, 2024)
Week 50
(Week ending
Dec. 14, 2024)
Very High922211
High171413657
Moderate81112193
Low79149176
Minimal1219253373
Insufficient Data20248219


*Data collected in ILINet may disproportionally represent certain populations within a jurisdiction or CBSA, and therefore, may not accurately depict the full picture of influenza activity for the entire jurisdiction or CBSA. Differences in the data presented here by CDC and independently by some health departments likely represent differing levels of data completeness with data presented by the health department likely being the more complete. Additional information about medically attended visits for ILI for current and past seasons:


Surveillance Methods | FluView Interactive: National, Regional, and State Data or ILI Activity Map

National Syndromic Surveillance System (NSSP)


The overall percentage of emergency department (ED) visits with a discharge diagnosis of influenza reported in NSSP was 3.1% during Week 51, an increase (change of > 0.1 percentage points) from 1.8% the previous week. In all 10 HHS regions and among all age groups, the percentage of ED visits for influenza increased (change of > 0.1 percentage points) in Week 51 compared to the previous week. RegionNationalRegion 1Region 2Region 3Region 4Region 5Region 6Region 7Region 8Region 9Region 10
Season(s)2023-2024 & 2024-20252022-2023 Skip Over Chart Container
1.0%2.0%3.0%4.0%5.0%6.0%7.0%8.0%9.0%10.0%11.0%12.0 %13.0%Percent of Emergency Department Visits for InfluenzaWeek 43 of 2023Week 47 of 2023Week 51 of 2023Week 3 of 2024Week 7 of 2024Week 11 of 2024Week 15 of 2024Week 19 of 2024Week 23 of 2024Week 27 of 2024Week 31 of 2024Week 35 of 2024Week 39 of 2024Week 43 of 2024Week 47 of 2024Week 51 of 2024

Age Group


All ages
0-4 years
5-17 years
18-64 years
65+ Skip Data Table
Data Table Download Data (CSV) Skipped data table.

Additional information about emergency department visits for flu for current and past seasons:‎‎‎


Surveillance Methods | Emergency Department Visits for COVID-19, flu, and RSV

Hospitalization surveillance

FluSurv-Net


The Influenza Hospitalization Surveillance Network (FluSurv-NET) conducts population-based surveillance for laboratory-confirmed influenza-related hospitalizations in select counties in 14 states and represents approximately 9% of the U.S. population. FluSurv-NET hospitalization data are preliminary. As data are received each week, prior case counts and rates are updated accordingly.

A total of 2,345 laboratory-confirmed influenza-associated hospitalizations were reported by FluSurv-NET sites between October 1, 2024, and December 21, 2024. The weekly hospitalization rate observed in Week 51 was 2.4 per 100,000 population. The cumulative hospitalization rate observed in Week 51 was 7.7 per 100,000 population.

When examining rates by age, the highest cumulative hospitalization rate per 100,000 population was among adults aged 65 years and older (22.0), followed by adults aged 50-64 years (8.7), children aged 0-4 years (7.3), adults aged 18-49 (3.6), and children aged 5-17 (3.1).

When examining age-adjusted rates by race and ethnicity, the highest cumulative hospitalization rate per 100,000 population was among American Indian/Alaska Native persons (11.4), followed by non-Hispanic Black persons (10.8), Hispanic persons (8.6), non-Hispanic White persons (6.4), and Asian/Pacific Islander persons (4.8).


[SUB]**In this figure, weekly rates for all seasons prior to the 2024-2025 season reflect end-of-season rates. For the 2024-2025 season, rates for recent hospital admissions are subject to reporting delays and are shown as a dashed line for the current season. As hospitalization data are received each week, prior case counts and rates are updated accordingly.[/SUB]

Additional FluSurv-NET hospitalization surveillance information for current and past seasons and additional age groups:


Surveillance Methods | FluView Interactive: Rates by Age, Sex, and Race/Ethnicity or Data on Patient Characteristics | RESP-NET Interactive

National healthcare safety network (NHSN) hospitalization surveillance


Hospitals report to NHSN the weekly number of patients with laboratory-confirmed influenza who were admitted to the hospital. Nationally, during Week 51, 12,543 laboratory confirmed influenza-associated hospitalizations were reported. This is an increase (change of >5%) compared to Week 50 when 9,087 hospitalizations were reported.

The weekly hospital admission rate observed in Week 51 was 3.8 per 100,000. The weekly rate of hospital admissions in the 10 HHS regions ranged from 1.5 (Region 1) to 5.8 (Region 10) and increased in regions 2, 3, 4, 5, 6, 7, 8, 9, and 10. Region 1 remained stable.

When examining rates by age for Week 51, all age groups increased this week (change of >5%) compared to the previous week. The highest hospital admission rate per 100,000 population was among those 75+ years (14.4), followed by 65-to-74-year age group (6.8), and 50-to-64-year age group (4.0). View Larger
NHSN51.gif
Additional NHSN Hospitalization Surveillance information:


Surveillance Methods | Additional Data | FluView Interactive

Mortality surveillance

National Center for Health Statistics (NCHS) Mortality Surveillance


Based on NCHS mortality surveillance data available on December 26, 2024, 0.3% of the deaths that occurred during the week ending December 21, 2024 (Week 51), were due to influenza. This percentage remained stable (≤ 0.1 percentage point change) compared to Week 50. The data presented are preliminary and may change as more data are received and processed.

Additional pneumonia, influenza and COVID-19 mortality surveillance information for current and past seasons:


Surveillance Methods | FluView Interactive

Influenza-Associated Pediatric Mortality


Five influenza-associated pediatric deaths occurring during the 2024-2025 season were reported to CDC during Week 51. The deaths occurred during weeks 49, 50 and 51 (the weeks ending December 7, December 14, and December 21 of 2024). All the deaths were associated with influenza A viruses. Four of the influenza A viruses had subtyping performed; one was an A(H1N1) virus and three were A(H3) viruses.

A total of nine influenza-associated pediatric deaths occurring during the 2024-2025 season have been reported to CDC.

Additional pediatric mortality surveillance information for current and past seasons:


Surveillance Methods | FluView Interactive

Additional National and International Influenza Surveillance Information

Indicators Status by System


Increasing:
IncreasingArrow.png

Decreasing:
DecreasingArrow.png

Stable:
StableArrow.png


Clinical Labs: Up or down arrows indicate a change of greater than or equal to 0.5 percentage points in the percent of specimens positive for influenza compared to the previous week.
Outpatient Respiratory Illness (ILINet): Up or down arrows indicate a change of greater than 0.1 percentage points in the percent of visits due to respiratory illness (ILI) compared to the previous week.
NHSN Hospitalizations: Up or down arrows indicate change of greater than or equal to 5% of the number of patients admitted with laboratory-confirmed influenza compared to the previous week.
NCHS Mortality: Up or down arrows indicate change of greater than 0.1 percentage points of the percent of deaths due to influenza compared to the previous week.

Additional surveillance information


FluView Interactive: FluView includes enhanced web-based interactive applications that can provide dynamic visuals of the influenza data collected and analyzed by CDC. These FluView Interactive applications allow people to create customized, visual interpretations of influenza data, as well as make comparisons across flu seasons, regions, age groups and a variety of other demographics.

National Institute for Occupational Safety and Health: Monthly surveillance data on the prevalence of health-related workplace absenteeism among full-time workers in the United States are available from NIOSH.

https://www.cdc.gov/fluview/surveillance/2024-week-51.html
 
Weekly US Influenza Surveillance Report: Key Updates for Week 52, ending December 28, 2024

What to know


Seasonal influenza activity continues to increase and is elevated across most of the country.
Summary

Viruses

Clinical Lab 18.7% (Trend
IncreasingArrow.png
)
positive for influenza
this week. Public Health Lab Influenza A(H1N1)pdm09 and A(H3N2)
were the predominant viruses reported this week. Illness

Outpatient Respiratory Illness 6.8% (Trend
IncreasingArrow.png
)
of visits to a health care provider this
week were for respiratory illness
(above baseline). Activity Map 6 moderate jurisdictions 42 high or very high jurisdictions FluSurv-NET 13.2 per 100,000
cumulative hospitalization rate National Healthcare Safety Network (NHSN) Hospital Respiratory Data 26,088 (Trend
IncreasingArrow.png
)
patients admitted to hospitals
with influenza this week. NCHS Mortality 0.5% (Trend
StableArrow.png
)
of deaths attributed to influenza this week. Pediatric Deaths 2 influenza-associated deaths
were reported this week for a total of 11 deaths this season.
All data are preliminary and may change as more reports are received.

Directional arrows indicate changes between the current week and the previous week. Additional information on the arrows can be found at the bottom of this page.

A description of the CDC influenza surveillance system, including methodology and detailed descriptions of each data component is available on the surveillance methods page.[SUP]1[/SUP]

Additional information on the current and previous influenza seasons for each surveillance component are available on FluView Interactive.

Key Points


• Seasonal influenza activity continues to increase and is elevated across most of the country.

• Nationally, percent positivity for influenza, the percentage of emergency department visits for influenza, and influenza-associated hospitalizations increased this week compared to last week.

• During Week 52, of the 1,254 viruses reported by public health laboratories, 1,234 were influenza A and 20 were influenza B. Of the 823 influenza A viruses subtyped during Week 52, 335 (40.7%) were influenza A(H1N1)pdm09 and 488 (59.3%) were A(H3N2).

• Outpatient respiratory illness is above baseline nationally for the fifth consecutive week and is above baseline in all 10 HHS regions.

• No influenza A(H5) cases were reported to CDC this week. To date, human-to-human transmission of influenza A(H5) virus has not been identified in the United States.

• Two pediatric deaths associated with seasonal influenza virus infection were reported this week, bringing the 2024-2025 season total to 11 pediatric deaths.

• CDC estimates that there have been at least 5.3 million illnesses, 63,000 hospitalizations, and 2,700 deaths from flu so far this season.

• CDC recommends that everyone ages 6 months and older get an annual influenza (flu) vaccine.[SUP]1[/SUP]

• There are prescription flu antiviral drugs that can treat flu illness; those should be started as early as possible and are especially important for patients at higher risk for severe illness.[SUP]2[/SUP]

• Influenza viruses are among several viruses contributing to respiratory disease activity. CDC is providing updated, integrated information about COVID-19, flu, and respiratory syncytial virus (RSV) activity on a weekly basis.
COVID-19, flu, and RSV activity

U.S. virologic surveillance


Nationally, the percentage of respiratory specimens testing positive for influenza virus in clinical laboratories increased (change of ≥ 0.5 percentage points) compared to the previous week. The regions with the highest percent positivity were regions 8 (28.1), 9 (32.7), and 10 (26.0). Influenza A(H1N1)pdm09 and A(H3N2) were the predominant viruses reported this week. For regional and state level data and age group distribution, please visit FluView Interactive. Viruses known to be associated with recent receipt of live attenuated influenza vaccine (LAIV) or found upon further testing to be a vaccine virus are not included, as they are not circulating influenza viruses.

Clinical Laboratories


The results of tests performed by clinical laboratories nationwide are summarized below. Data from clinical laboratories (the percentage of specimens tested that are positive for influenza virus) are used to monitor whether influenza activity is increasing or decreasing.
No. of specimens tested63,6821,047,154
No. of positive specimens (%)11,912 (18.7%)52,596 (5.0%)
Positive specimens by type
Influenza A11,674 (98.0%)50,497 (96.0%)
Influenza B238 (2.0%)2,099 (4.0%)

Public Health Laboratories


The results of tests performed by public health laboratories nationwide are summarized below. Data from public health laboratories are used to monitor the proportion of circulating influenza viruses that belong to each influenza subtype/lineage.
No. of specimens tested1,73125,214
No. of positive specimens1,25411,292
Positive specimens by type/subtype
Influenza A1,234 (98.4%)10,906 (96.6%)
Subtyping Performed823 (66.7%)9,374 (86.0%)
(H1N1)pdm09335 (40.7%)4,137 (44.2%)
H3N2488 (59.3%)5,160 (55.0%)
H3N2v00
H5*077 (0.8%)
Subtyping not performed411 (33.3%)1,532 (14.0%)
Influenza B20 (1.6%)386 (3.4%)
Lineage testing performed2 (10.0%)183 (47.4%)
Yamagata lineage00
Victoria lineage2 (100.0%)183 (100.0%)
Lineage not performed18 (90.0%)203 (52.6%)
[SUB]*This data reflects specimens tested and the number determined to be positive for influenza viruses at the public health labs (specimens tested is not the same as cases). It does not reflect specimens tested only at CDC and could include more than one specimen tested per person. The guidance for influenza A(H5) testing recommends testing both a conjunctival and respiratory swab for people with conjunctivitis which has resulted in more specimens testing positive for influenza A(H5) [/SUB][SUB]than the number of human H5 cases. For more information on the number of people infected with A(H5), please visit the [/SUB][SUB]"How CDC is monitoring influenza data among people to better understand the current avian influenza A (H5N1) situation"[/SUB]

[SUB][SUP]†[/SUP]When an influenza virus that normally circulates in swine (but not people) is detected in a person, it is called a "variant" influenza virus. Most human infections with variant influenza viruses occur following exposure to swine, but human-to-human transmission can occur. It is important to note that in most cases, variant influenza viruses have not shown the ability to spread easily and sustainably from human-to-human.[/SUB]


[SUP]This graph reflects the number of specimens tested and the number determined to be positive for influenza viruses at the public health lab (specimens tested is not the same as cases). It does not reflect specimens tested only at CDC and could include more than one specimen tested per person. Specimens tested as part of routine influenza surveillance as well as those tested as part of targeted testing for people exposed to influenza A(H5) are included.[/SUP]
Additional virologic surveillance information for current and past seasons:


Surveillance Methods | FluView Interactive: National, Regional, and State Data or Age Data

Novel Influenza A Virus


No cases of influenza A(H5) were reported to CDC this week. To date, human-to-human transmission of influenza A(H5) virus has not been identified in the United States.

The CSTE position statement, which includes updated case definitions for confirmed, probable, and suspected cases is available at http://www.cste.org/resource/resmgr/position_statements_files_2023/24-ID-09_Novel_Influenza_A.pdf

An up-to-date human case summary during the 2024 outbreak by state and exposure source is available at www.cdc.gov/bird-flu/situation-summary/index.html

Information about avian influenza is available at https://www.cdc.gov/flu/avianflu/index.htm.

Interim recommendations for Prevention, Monitoring, and Public Health Investigations are available at https://www.cdc.gov/bird-flu/prevention/hpai-interim-recommendations.html.

The latest case reports on avian influenza outbreaks in wild birds, commercial poultry, backyard or hobbyist flocks, and mammals in the United States are available from the USDA at https://www.aphis.usda.gov/aphis/ou...e-information/avian/avian-influenza/2022-hpai.

Additional information regarding human infections with novel influenza A viruses:


Surveillance Methods | FluView Interactive

Influenza Virus Characterization


CDC performs genetic and antigenic characterization of U.S. viruses submitted from state and local public health laboratories according to the Right Size Roadmap submission guidance. These data are used to compare how similar the currently circulating influenza viruses are relative to the reference viruses representing the current influenza vaccines. The data are also used to monitor evolutionary changes that continually occur in influenza viruses circulating in humans. CDC also tests susceptibility of circulating influenza viruses to antiviral medications including the neuraminidase inhibitors (oseltamivir, zanamivir, and peramivir) and the polymerase acidic protein (PA) endonuclease inhibitor baloxavir. The HA clade and subclades were assigned using Nextclade (https://clades.nextstrain.org).

CDC has genetically characterized 698 influenza viruses collected since September 29, 2024.
A/H1270
5a.2a149 (55.2%)C.1.9149 (55.2%)
5a.2a.1121 (44.8%)D4 (1.5%)
D.11 (0.4%)
D.313 (4.8%)
D.5103 (38.1%)
A/H3375
2a.3a5 (1.3%)G.1.3.15 (1.3%)
2a.3a.1370 (98.7%)J.11 (0.3%)
J.1.13 (0.8%)
J.2334 (89.1%)
J.2.17 (1.9%)
J.2.225 (6.7%)
B/Victoria53
3a.253 (100%)C.31 (1.9%)
C.56 (11.3%)
C.5.132 (60.4%)
C.5.68 (15.1%)
C.5.76 (11.3%)
B/Yamagata0
Y30Y30
CDC antigenically characterizes influenza viruses by hemagglutination inhibition (HI) assay (H1N1pdm09, H3N2, and B/Victoria viruses) or neutralization-based HINT (H3N2 viruses) using antisera that ferrets make after being infected with reference viruses representing the 2024-2025 Northern Hemisphere recommended cell or recombinant-based vaccine viruses. Antigenic differences between viruses are determined by comparing how well the antibodies made against the vaccine reference viruses recognize the circulating viruses that have been grown in cell culture. Ferret antisera are useful because antibodies raised against a particular virus can often recognize small changes in the surface proteins of other viruses. In HI assays, viruses with similar antigenic properties have antibody titer differences of less than or equal to 4-fold when compared to the reference (vaccine) virus. In HINT, viruses with similar antigenic properties have antibody neutralization titer differences of less than or equal to 8-fold. Viruses selected for antigenic characterization are a subset of the recent genetically characterized viruses and are chosen based on the genetic changes in their surface proteins and may not be proportional to the number of such viruses circulating in the United States.

Influenza A Viruses
  • A (H1N1)pdm09: 40 A(H1N1)pdm09 viruses were antigenically characterized by HI, and 40 (100%) were well-recognized (reacting at titers that were within 4-fold of the homologous virus titer) by ferret antisera to cell-grown A/Wisconsin/67/2022-like reference viruses representing the A(H1N1)pdm09 component for the cell- and recombinant-based influenza vaccines.
  • A (H3N2): 34 A(H3N2) viruses were antigenically characterized by HI or HINT, and 19 (55.9%) were well-recognized (reacting at titers that were within 4-fold of the homologous virus titer in HI or reacting at titers that were less than or equal to 8-fold of the homologous virus in HINT) by ferret antisera to cell-grown A/Massachusetts/18/2022-like reference viruses representing the A(H3N2) component for the cell- and recombinant-based influenza vaccines.
Influenza B Viruses
  • B/Victoria: 7 influenza B/Victoria-lineage virus were antigenically characterized by HI, and all were well-recognized (reacting at titers that were within 4-fold of the homologous virus titer) by ferret antisera to cell-grown B/Austria/1359417/2021-like reference viruses representing the B/Victoria component for the cell- and recombinant-based influenza vaccines.
  • B/Yamagata: No influenza B/Yamagata-lineage viruses were available for antigenic characterization.
Assessment of Virus Susceptibility to Antiviral Medications


CDC assesses susceptibility of influenza viruses to the antiviral medications including the neuraminidase inhibitors (oseltamivir, zanamivir, and peramivir) and the PA endonuclease inhibitor baloxavir using next generation sequence analysis supplemented by laboratory assays. Information about antiviral susceptibility test methods can be found at U.S. Influenza Surveillance: Purpose and Methods.

Viruses collected in the U.S. since September 29, 2024, were tested for antiviral susceptibility as follows:
Neuraminidase InhibitorsOseltamivirViruses Tested63824934544
Reduced Inhibition1 (0.2%)1 (0.4%)00
Highly Reduced Inhibition0000
PeramivirViruses Tested63824934544
Reduced Inhibition0000
Highly Reduced Inhibition0000
ZanamivirViruses Tested63824934544
Reduced Inhibition0000
Highly Reduced Inhibition0000
PA Cap-Dependent Endonuclease InhibitorBaloxavirViruses Tested63522936046
Decreased Susceptibility0000
One A(H1N1)pdm09 virus had NA-I223V and NA-S247N amino acid substitutions and showed reduced inhibition by oseltamivir.

High levels of resistance to the adamantanes (amantadine and rimantadine) persist among influenza A(H1N1)pdm09 and influenza A(H3N2) viruses (the adamantanes are not effective against influenza B viruses). Therefore, use of these antivirals for treatment and prevention of influenza A virus infection is not recommended and data from adamantane resistance testing are not presented.

Outpatient and Emergency Department Illness Surveillance

Outpatient respiratory illness visits


The U.S. Outpatient Influenza-like Illness Surveillance Network (ILINet) monitors outpatient visits for respiratory illness referred to as influenza-like illness [ILI (fever plus cough or sore throat)], not laboratory-confirmed influenza, and will therefore capture respiratory illness visits due to infection with any pathogen that can present with similar symptoms, including influenza virus, SARS-CoV-2, and RSV. It is important to evaluate syndromic surveillance data, including that from ILINet, in the context of other sources of surveillance data to obtain a complete and accurate picture of influenza, SARS-CoV-2, and other respiratory virus activity.

Nationally, during Week 52, 6.8% of patient visits reported through ILINet were due to respiratory illness that included fever plus a cough or sore throat, also referred to as ILI. This week's percentage increased (change of > 0.1 percentage points) compared to Week 51 and is above the national baseline of 3.0% for the fifth consecutive week. The percentage of visits for ILI increased (change of > 0.1 percentage points) in all HHS regions compared to Week 51. All HHS regions are above their respective baselines. Multiple respiratory viruses are co-circulating, and the relative contribution of influenza virus infections to ILI varies by location.

Outpatient respiratory illness visits by age group


About 70% of ILINet participants provide both the number of patient visits for respiratory illness and the total number of patient visits for the week broken out by age group. Based on these data, the percentage of visits for respiratory illness increased (change of > 0.1 percentage point) in all age groups in Week 52 compared to Week 51.

Outpatient respiratory illness activity map


Data collected in ILINet are used to produce a measure of ILI activity* by state/jurisdiction and Core Based Statistical Areas (CBSA).
Week 52
(Week ending
Dec. 28, 2024)
Week 51
(Week ending
Dec. 21, 2024)
Week 52
(Week ending
Dec. 28, 2024)
Week 51
(Week ending
Dec. 21, 2024)
Very High2597622
High1720192143
Moderate67133118
Low39157158
Minimal39131256
Insufficient Data11240232


*Data collected in ILINet may disproportionally represent certain populations within a jurisdiction or CBSA, and therefore, may not accurately depict the full picture of influenza activity for the entire jurisdiction or CBSA. Differences in the data presented here by CDC and independently by some health departments likely represent differing levels of data completeness with data presented by the health department likely being the more complete.

Additional information about medically attended visits for ILI for current and past seasons:


Surveillance Methods | FluView Interactive: National, Regional, and State Data or ILI Activity Map

National Syndromic Surveillance System (NSSP)


The overall percentage of emergency department (ED) visits with a discharge diagnosis of influenza reported in NSSP was 5.2% during Week 52, an increase (change of > 0.1 percentage points) from 3.2% the previous week. In all 10 HHS regions and among all age groups, the percentage of ED visits for influenza increased (change of > 0.1 percentage points) in Week 52 compared to the previous week. RegionNationalRegion 1Region 2Region 3Region 4Region 5Region 6Region 7Region 8Region 9Region 10
Season(s)2023-2024 & 2024-20252022-2023 Skip Over Chart Container
1.0%2.0%3.0%4.0%5.0%6.0%7.0%8.0%9.0%10.0%11.0%12.0 %13.0%Percent of Emergency Department Visits for InfluenzaWeek 40 of 2023Week 44 of 2023Week 48 of 2023Week 52 of 2023Week 4 of 2024Week 8 of 2024Week 12 of 2024Week 16 of 2024Week 20 of 2024Week 24 of 2024Week 28 of 2024Week 32 of 2024Week 36 of 2024Week 40 of 2024Week 44 of 2024Week 48 of 2024Week 52 of 2024

Age Group


All ages
0-4 years
5-17 years
18-64 years
65+ Skip Data Table
Data Table Download Data (CSV) Skipped data table.

Additional information about emergency department visits for flu for current and past seasons:‎‎‎


Surveillance Methods | Emergency Department Visits for COVID-19, flu, and RSV

Hospitalization surveillance

FluSurv-Net


The Influenza Hospitalization Surveillance Network (FluSurv-NET) conducts population-based surveillance for laboratory-confirmed influenza-related hospitalizations in select counties in 14 states and represents approximately 9% of the U.S. population. FluSurv-NET hospitalization data are preliminary. As data are received each week, prior case counts and rates are updated accordingly.

A total of 4,049 laboratory-confirmed influenza-associated hospitalizations were reported by FluSurv-NET sites between October 1, 2024, and December 28, 2024. The weekly hospitalization rate observed in Week 52 was 4.3 per 100,000 population. The cumulative hospitalization rate observed in Week 52 was 13.2 per 100,000 population.

When examining rates by age, the highest cumulative hospitalization rate per 100,000 population was among adults aged 65 years and older (38.6), followed by adults aged 50-64 years (15.1), children aged 0-4 years (12.2), adults aged 18-49 (6.2), and children aged 5-17 (4.8).

When examining age-adjusted rates by race and ethnicity, the highest cumulative hospitalization rate per 100,000 population was among non-Hispanic Black persons (20.5), followed by American Indian/Alaska Native persons (19.7), Hispanic persons (13.7), non-Hispanic White persons (10.6), and Asian/Pacific Islander persons (9.3).


[SUB]**In this figure, weekly rates for all seasons prior to the 2023-2024 season reflect end-of-season rates. For the 2023-2024 season, rates for recent hospital admissions are subject to reporting delays and are shown as a dashed line for the current season. As hospitalization data are received each week, prior case counts and rates are updated accordingly.[/SUB]

Additional FluSurv-NET hospitalization surveillance information for current and past seasons and additional age groups:


Surveillance Methods | FluView Interactive: Rates by Age, Sex, and Race/Ethnicity or Data on Patient Characteristics | RESP-NET Interactive

National Healthcare Safety Network (NHSN) Hospital Respiratory Data


Hospitals report to NHSN the weekly number of patients with laboratory-confirmed influenza who were admitted to the hospital. Nationally, during Week 52, 26,088 laboratory confirmed influenza-associated hospitalizations were reported. This is an increase (change of >5%) compared to Week 51, when 14,755 hospitalizations were reported.

The weekly hospital admission rate observed in Week 52 was 7.8 per 100,000. The weekly rate of hospital admissions in the 10 HHS regions ranged from 3.6 (Region 1) to 11.1 (Region 9) and increased in all regions.

When examining rates by age for Week 52, all age groups increased this week (change of >5%) compared to the previous week. The highest hospital admission rate per 100,000 population was among those 75+ years (34.2), followed by 65-to-74-year age group (15.4), and 50-to-64-year age group (8.3). View Larger
NHSN52.gif
NHSN Week 52

Additional NHSN Hospital Respiratory Data information:


Surveillance Methods | Additional Data | FluView Interactive

Mortality surveillance

National Center for Health Statistics (NCHS) Mortality Surveillance


Based on NCHS mortality surveillance data available on January 2, 2025, 0.5% of the deaths that occurred during the week ending December 28, 2024 (Week 52), were due to influenza. This percentage remained stable (≤ 0.1 percentage point change) compared to Week 51. The data presented are preliminary and may change as more data are received and processed.

Additional pneumonia, influenza and COVID-19 mortality surveillance information for current and past seasons:


Surveillance Methods | FluView Interactive

Influenza-Associated Pediatric Mortality


Two influenza-associated pediatric deaths occurring during the 2024-2025 season were reported to CDC during week 52. One death was associated with an influenza B virus with no lineage determined and occurred during week 51 (the week ending December 21, 2024). The other death was associated with an influenza A virus with no subtyping performed and occurred during week 52 (the week ending December 28, 2024).

A total of 11 influenza-associated pediatric deaths occurring during the 2024-2025 season have been reported to CDC.

Additional pediatric mortality surveillance information for current and past seasons:


Surveillance Methods | FluView Interactive

Additional National and International Influenza Surveillance Information

Indicators Status by System


Increasing:
IncreasingArrow.png

Decreasing:
DecreasingArrow.png

Stable:
StableArrow.png


Clinical Labs: Up or down arrows indicate a change of greater than or equal to 0.5 percentage points in the percent of specimens positive for influenza compared to the previous week.
Outpatient Respiratory Illness (ILINet): Up or down arrows indicate a change of greater than 0.1 percentage points in the percent of visits due to respiratory illness (ILI) compared to the previous week.
NHSN Hospitalizations: Up or down arrows indicate change of greater than or equal to 5% of the number of patients admitted with laboratory-confirmed influenza compared to the previous week.
NCHS Mortality: Up or down arrows indicate change of greater than 0.1 percentage points of the percent of deaths due to influenza compared to the previous week.

Additional surveillance information


FluView Interactive: FluView includes enhanced web-based interactive applications that can provide dynamic visuals of the influenza data collected and analyzed by CDC. These FluView Interactive applications allow people to create customized, visual interpretations of influenza data, as well as make comparisons across flu seasons, regions, age groups and a variety of other demographics.

National Institute for Occupational Safety and Health: Monthly surveillance data on the prevalence of health-related workplace absenteeism among full-time workers in the United States are available from NIOSH.

https://www.cdc.gov/fluview/surveillance/2024-week-52.html
 
Weekly US Influenza Surveillance Report: Key Updates for Week 2, ending January 11, 2025

What to know


Seasonal influenza activity remains elevated across most of the country.
Summary

Viruses

Clinical Lab 18.8% (Trend
IncreasingArrow.png
)
positive for influenza
this week. Public Health Lab Influenza A(H1N1)pdm09 and A(H3N2)
were the predominant viruses reported this week. Illness

Outpatient Respiratory Illness 5.4% (Trend
DecreasingArrow.png
)
of visits to a health care provider this
week were for respiratory illness
(above baseline). Activity Map 10 moderate jurisdictions 35 high or very high jurisdictions FluSurv-NET 32.6 per 100,000
cumulative hospitalization rate National Healthcare Safety Network (NHSN) Hospital Respiratory Data 31,379 (Trend
DecreasingArrow.png
)
patients admitted to hospitals
with influenza this week. NCHS Mortality 1.5% (Trend
IncreasingArrow.png
)
of deaths attributed to influenza this week. Pediatric Deaths 11 influenza-associated deaths
occurring during the 2024-2025 season
were reported this week for
a total of 27 deaths this season.
All data are preliminary and may change as more reports are received.

Directional arrows indicate changes between the current week and the previous week. Additional information on the arrows can be found at the bottom of this page.

A description of the CDC influenza surveillance system, including methodology and detailed descriptions of each data component is available on the surveillance methods page.[SUP]1[/SUP]

Additional information on the current and previous influenza seasons for each surveillance component are available on FluView Interactive.

Key Points
  • Seasonal influenza activity remains elevated across most of the country.
  • Although some indicators have decreased or remained stable this week compared to last, this could be due to changes in healthcare seeking behavior or reporting during the holidays rather than an indication that influenza activity has peaked. The country is still experiencing elevated influenza activity and that is expected to continue for several more weeks.
  • During Week 2, of the 1,754 viruses reported by public health laboratories, 1,719 were influenza A and 35 were influenza B. Of the 1,440 influenza A viruses subtyped during Week 2, 621 (43.1%) were influenza A(H1N1)pdm09, 818 (56.8%) were A(H3N2), and 1 (<0.1%) was A(H5).
  • Outpatient respiratory illness is above baseline nationally for the seventh consecutive week and is above baseline in all 10 HHS regions.
  • One new influenza A(H5) case was reported to CDC this week. To date, human-to-human transmission of influenza A(H5) virus has not been identified in the United States.
  • Eleven pediatric deaths associated with seasonal influenza virus infection were reported this week, bringing the 2024-2025 season total to 27 pediatric deaths.
  • CDC estimates that there have been at least 12 million illnesses, 160,000 hospitalizations, and 6,600 deaths from flu so far this season.
  • CDC recommends that everyone ages 6 months and older get an annual influenza (flu) vaccine.[SUP]1[/SUP]
  • There are prescription flu antiviral drugs that can treat flu illness; those should be started as early as possible and are especially important for patients at higher risk for severe illness.[SUP]2[/SUP]
  • Influenza viruses are among several viruses contributing to respiratory disease activity. CDC is providing updated, integrated information about COVID-19, flu, and respiratory syncytial virus (RSV) activity on a weekly basis.
COVID-19, flu, and RSV activity


U.S. virologic surveillance


Nationally, the percentage of respiratory specimens testing positive for influenza virus in clinical laboratories increased (change of ≥ 0.5 percentage points) compared to the previous week. Percent positivity varied by region, with Region 6 the highest (22.5%) and Region 4 the lowest (13.2%). A decrease in percent positivity during this time could be due to changes in healthcare seeking behavior or reporting during the holidays rather than an indication that influenza activity has peaked. Influenza A(H1N1)pdm09 and A(H3N2) were the predominant viruses reported this week. For regional and state level data and age group distribution, please visit FluView Interactive. Viruses known to be associated with recent receipt of live attenuated influenza vaccine (LAIV) or found upon further testing to be a vaccine virus are not included, as they are not circulating influenza viruses.

Clinical Laboratories


The results of tests performed by clinical laboratories nationwide are summarized below. Data from clinical laboratories (the percentage of specimens tested that are positive for influenza virus) are used to monitor whether influenza activity is increasing or decreasing.
No. of specimens tested115,2671,389,448
No. of positive specimens (%)21,655 (18.8%)112,302 (8.1%)
Positive specimens by type
Influenza A21,039 (97.2%)108,446 (96.6%)
Influenza B616 (2.8%)3,835 (3.4%)


Public Health Laboratories


The results of tests performed by public health laboratories nationwide are summarized below. Data from public health laboratories are used to monitor the proportion of circulating influenza viruses that belong to each influenza subtype/lineage.
No. of specimens tested2,70736,052
No. of positive specimens1,75419,271
Positive specimens by type/subtype
Influenza A1,719 (98.0%)18,704 (97.1%)
Subtyping Performed1,440 (83.8%)16,560 (88.5%)
(H1N1)pdm09621 (43.1%)7,513 (45.4%)
H3N2818 (56.8%)8,969 (54.2%)
H3N2v00
H5*1 (<0.1%)78 (0.4%)
Subtyping not performed279 (16.2%)2,144 (11.5%)
Influenza B35 (2.0%)567 (2.9%)
Lineage testing performed16 (45.7%)300 (52.9%)
Yamagata lineage00
Victoria lineage16 (100.0%)300 (100.0%)
Lineage not performed19 (54.3%)267 (47.1%)
[SUB]*This data reflects specimens tested and the number determined to be positive for influenza viruses at the public health labs (specimens tested is not the same as cases). It does not reflect specimens tested only at CDC and could include more than one specimen tested per person. The guidance for influenza A/H5 testing recommends testing both a conjunctival and respiratory swab for people with conjunctivitis which has resulted in more specimens testing positive for influenza A/H5 than the number of human H5 cases. For more information on the number of people infected with A/H5, please visit the [/SUB][SUB]"How CDC is monitoring influenza data among people to better understand the current avian influenza A (H5N1) situation"[/SUB]


[SUP]This graph reflects the number of specimens tested and the number determined to be positive for influenza viruses at the public health lab (specimens tested is not the same as cases). It does not reflect specimens tested only at CDC and could include more than one specimen tested per person. Specimens tested as part of routine influenza surveillance as well as those tested as part of targeted testing for people exposed to influenza A(H5) are included.[/SUP]

Additional virologic surveillance information for current and past seasons:


Surveillance Methods | FluView Interactive: National, Regional, and State Data or Age Data

Novel Influenza A Virus


One confirmed human infection with influenza A(H5) virus was reported to CDC this week. To date, human-to-human transmission of influenza A(H5) virus has not been identified in the United States.

This case was reported by the California Department of Public Health and occurred in a child less than 18 years old with no known contact with influenza A(H5N1) virus-infected animals or humans. The investigation into the source of infection for this case is ongoing, and no human-to-human transmission has been identified.

A specimen from the individual was tested at a public health laboratory using the CDC influenza A(H5) assay before being sent to CDC for further testing. The specimen was positive for influenza A(H5) virus using diagnostic RT-PCR at CDC. Additional analysis including genetic sequencing is underway. In response to this detection, additional case investigation and contact monitoring are being conducted by public health officials in California.

There have now been 38 total confirmed human A(H5) cases and one probable human case of A(H5) case in California. This is the second reported pediatric case in California and in the United States.

Notification to WHO of this case was initiated per International Health Regulations (IHR). More information regarding IHR can be found at http://www.who.int/topics/international_health_regulations/en/.

The CSTE position statement, which includes updated case definitions for confirmed, probable, and suspected cases is available at http://www.cste.org/resource/resmgr/position_statements_files_2023/24-ID-09_Novel_Influenza_A.pdf

An up-to-date human case summary during the outbreak by state and exposure source is available at www.cdc.gov/bird-flu/situation-summary/index.html

Information about avian influenza is available at https://www.cdc.gov/flu/avianflu/index.htm.

Interim recommendations for Prevention, Monitoring, and Public Health Investigations are available at https://www.cdc.gov/bird-flu/prevention/hpai-interim-recommendations.html.

The latest case reports on avian influenza outbreaks in wild birds, commercial poultry, backyard or hobbyist flocks, and mammals in the United States are available from the USDA at https://www.aphis.usda.gov/aphis/ou...e-information/avian/avian-influenza/2022-hpai.

Additional information regarding human infections with novel influenza A viruses:


Surveillance Methods | FluView Interactive

Influenza Virus Characterization


CDC performs genetic and antigenic characterization of U.S. viruses submitted from state and local public health laboratories according to the Right Size Roadmap submission guidance. These data are used to compare how similar the currently circulating influenza viruses are relative to the reference viruses representing the current influenza vaccines. The data are also used to monitor evolutionary changes that continually occur in influenza viruses circulating in humans. CDC also tests susceptibility of circulating influenza viruses to antiviral medications including the neuraminidase inhibitors (oseltamivir, zanamivir, and peramivir) and the polymerase acidic protein (PA) endonuclease inhibitor baloxavir. The HA clade and subclades were assigned using Nextclade (https://clades.nextstrain.org).

CDC has genetically characterized 984 influenza viruses collected since September 29, 2024.
A/H1377
5a.2a216 (57.3%)C.1.9216 (57.3%)
5a.2a.1161 (42.7%)D12 (3.2%)
D.13 (0.8%)
D.321 (5.6%)
D.5125 (33.2%)
A/H3530
2a.3a5 (0.9%)G.1.3.15 (0.9%)
2a.3a.1525 (99.1%)J.11 (0.2%)
J.1.15 (0.9%)
J.2476 (89.8%)
J.2.110 (1.9%)
J.2.233 (6.2%)
B/Victoria77
3a.277 (100%)C.31 (1.3%)
C.510 (13.0%)
C.5.143 (55.8%)
C.5.611 (14.3%)
C.5.712 (15.6%)
B/Yamagata0
Y30Y30
CDC antigenically characterizes influenza viruses by hemagglutination inhibition (HI) assay (H1N1pdm09, H3N2, and B/Victoria viruses) or neutralization-based HINT (H3N2 viruses) using antisera that ferrets make after being infected with reference viruses representing the 2024-2025 Northern Hemisphere recommended cell or recombinant-based vaccine viruses. Antigenic differences between viruses are determined by comparing how well the antibodies made against the vaccine reference viruses recognize the circulating viruses that have been grown in cell culture. Ferret antisera are useful because antibodies raised against a particular virus can often recognize small changes in the surface proteins of other viruses. In HI assays, viruses with similar antigenic properties have antibody titer differences of less than or equal to 4-fold when compared to the reference (vaccine) virus. In HINT, viruses with similar antigenic properties have antibody neutralization titer differences of less than or equal to 8-fold. Viruses selected for antigenic characterization are a subset of the recent genetically characterized viruses and are chosen based on the genetic changes in their surface proteins and may not be proportional to the number of such viruses circulating in the United States.

Influenza A Viruses
  • A (H1N1)pdm09: 51 A(H1N1)pdm09 viruses were antigenically characterized by HI, and 51 (100%) were well-recognized (reacting at titers that were within 4-fold of the homologous virus titer) by ferret antisera to cell-grown A/Wisconsin/67/2022-like reference viruses representing the A(H1N1)pdm09 component for the cell- and recombinant-based influenza vaccines.
  • A (H3N2): 63 A(H3N2) viruses were antigenically characterized by HI or HINT, and 25 (39.7%) were well-recognized (reacting at titers that were within 4-fold of the homologous virus titer in HI or reacting at titers that were less than or equal to 8-fold of the homologous virus in HINT) by ferret antisera to cell-grown A/Massachusetts/18/2022-like reference viruses representing the A(H3N2) component or the cell- and recombinant-based influenza vaccines.
Influenza B Viruses
  • B/Victoria: 9 influenza B/Victoria-lineage virus were antigenically characterized by HI, and all were well-recognized (reacting at titers that were within 4-fold of the homologous virus titer) by ferret antisera to cell-grown B/Austria/1359417/2021-like reference viruses representing the B/Victoria component for the cell- and recombinant-based influenza vaccines.
  • B/Yamagata: No influenza B/Yamagata-lineage viruses were available for antigenic characterization.
Assessment of Virus Susceptibility to Antiviral Medications


CDC assesses susceptibility of influenza viruses to the antiviral medications including the neuraminidase inhibitors (oseltamivir, zanamivir, and peramivir) and the PA endonuclease inhibitor baloxavir using next generation sequence analysis supplemented by laboratory assays. Information about antiviral susceptibility test methods can be found at U.S. Influenza Surveillance: Purpose and Methods | CDC.

Viruses collected in the U.S. since September 29, 2024, were tested for antiviral susceptibility as follows:
Neuraminidase InhibitorsOseltamivirViruses Tested97738452271
Reduced Inhibition1 (0.1%)1 (0.3%)00
Highly Reduced Inhibition0000
PeramivirViruses Tested97738452271
Reduced Inhibition0000
Highly Reduced Inhibition0000
ZanamivirViruses Tested97738452271
Reduced Inhibition0000
Highly Reduced Inhibition0000
PA Cap-Dependent Endonuclease InhibitorBaloxavirViruses Tested87730451162
Decreased Susceptibility0000
One A(H1N1)pdm09 virus had NA-I223V and NA-S247N amino acid substitutions and showed reduced inhibition by oseltamivir.

High levels of resistance to the adamantanes (amantadine and rimantadine) persist among influenza A(H1N1)pdm09 and influenza A(H3N2) viruses (the adamantanes are not effective against influenza B viruses). Therefore, use of these antivirals for treatment and prevention of influenza A virus infection is not recommended and data from adamantane resistance testing are not presented.

Outpatient and Emergency Department Illness Surveillance

Outpatient respiratory illness visits


The U.S. Outpatient Influenza-like Illness Surveillance Network (ILINet) monitors outpatient visits for respiratory illness referred to as influenza-like illness [ILI (fever plus cough or sore throat)], not laboratory-confirmed influenza, and will therefore capture respiratory illness visits due to infection with any pathogen that can present with similar symptoms, including influenza virus, SARS-CoV-2, and RSV. It is important to evaluate syndromic surveillance data, including that from ILINet, in the context of other sources of surveillance data to obtain a complete and accurate picture of influenza, SARS-CoV-2, and other respiratory virus activity.

Nationally, during Week 2, 5.4% of patient visits reported through ILINet were due to respiratory illness that included fever plus a cough or sore throat, also referred to as ILI. This week's percentage decreased (change of > 0.1 percentage points) compared to Week 1 but remains above the national baseline of 3.0% for the seventh consecutive week. The percentage of visits for ILI remained stable in Region 2 (change of ≤ 0.1 percentage points) and decreased in all other regions (1, 3, 4, 5, 6, 7, 8, 9, and 10) this week compared to last. All regions are above their respective baselines and ILI activity remains elevated across the country. The decreases the past two weeks could be due to changes in healthcare seeking behavior or reporting during the holidays rather than an indication that influenza activity has peaked. Multiple respiratory viruses are co-circulating, and the relative contribution of influenza virus infections to ILI varies by location.

Outpatient respiratory illness visits by age group


About 70% of ILINet participants provide both the number of patient visits for respiratory illness and the total number of patient visits for the week broken out by age group. Based on these data, the percentage of visits for respiratory illness decreased (change of > 0.1 percentage point) in all age groups (0-4 years, 5-24 years, 25-49 years, 50-64 years, and 65+ years) in Week 2 compared to Week 1.

Outpatient respiratory illness activity map


Data collected in ILINet are used to produce a measure of ILI activity* by state/jurisdiction and Core Based Statistical Areas (CBSA). The state of Vermont is working with CDC to ensure that appropriate data are being used to calculate the state's activity level. Vermont's activity level will be reported again after the issue is resolved.
Week 2
(Week ending
Jan. 11, 2025)
Week 1
(Week ending
Jan. 4, 2025)
Week 2
(Week ending
Jan. 11, 2025)
Week 1
(Week ending
Jan. 4, 2025)
Very High10203871
High2523139191
Moderate105138135
Low63188169
Minimal33197140
Insufficient Data11229223


*Data collected in ILINet may disproportionally represent certain populations within a jurisdiction or CBSA, and therefore, may not accurately depict the full picture of influenza activity for the entire jurisdiction or CBSA. Differences in the data presented here by CDC and independently by some health departments likely represent differing levels of data completeness with data presented by the health department likely being the more complete.

Additional information about medically attended visits for ILI for current and past seasons:


Surveillance Methods | FluView Interactive: National, Regional, and State Data or ILI Activity Map

National Syndromic Surveillance System (NSSP)


The overall percentage of emergency department (ED) visits with a discharge diagnosis of influenza reported in NSSP was 4.2% during Week 2. This is a decrease (change of > 0.1 percentage point) compared to the previous week. The percentage also decreased in week 2 compared to the previous week in all 10 HHS regions and among the 0-4, 18-64, and 65+ years age groups. The percentage remained stable (change of ≤ 0.1 percentage point) among the 5-17 years age group. The decreases this week compared to last week could be due to changes in healthcare seeking or reporting during the holidays rather than an indication that influenza activity has peaked. Region
Season(s)2023-2024 & 2024-20252022-2023 Skip Over Chart Container
No Data AvailablePercent of Emergency Department Visits for Influenza

Age Group


All ages
0-4 years
5-17 years
18-64 years
65+ Skip Data Table
Data Table Download Data (CSV) Skipped data table.

Additional information about emergency department visits for flu for current and past seasons:‎‎‎


Surveillance Methods | Emergency Department Visits for COVID-19, flu, and RSV

Hospitalization surveillance

FluSurv-Net


The Influenza Hospitalization Surveillance Network (FluSurv-NET) conducts population-based surveillance for laboratory-confirmed influenza-related hospitalizations in select counties in 14 states and represents approximately 9% of the U.S. population. FluSurv-NET hospitalization data are preliminary. As data are received each week, prior case counts and rates are updated accordingly.

A total of 9,987 laboratory-confirmed influenza-associated hospitalizations were reported by FluSurv-NET sites between October 1, 2024, and January 11, 2025. The weekly hospitalization rate observed during Week 2 was 6.0 per 100,000 population. The weekly hospitalization rate observed during Week 1 (9.6 per 100,000 population) is the second highest peak weekly rate observed, following the 2017-2018 season, across all seasons since 2010-2011. The cumulative hospitalization rate observed in Week 2 was 32.6 per 100,000 population.

Among all hospitalizations, 9,707 (97.2%) were associated with influenza A virus, 221 (2.2%) with influenza B virus, 14 (0.1%) with influenza A virus and influenza B virus co-infection, and 45 (0.5%) with influenza virus for which the type was not determined. Among those with influenza A subtype information, 1,021 (47.7%) were A(H1N1) pdm09 and 1,119 (52.2%) were A(H3N2). When examining rates by age, the highest cumulative hospitalization rate per 100,000 population was among adults aged 65 years and older (98.3), followed by adults aged 50-64 years (36.5), children aged 0-4 years (29.8), adults aged 18-49 (15.3), and children aged 5-17 (9.8).

When examining age-adjusted rates by race and ethnicity, the highest cumulative hospitalization rate per 100,000 population was among non-Hispanic Black persons (49.6), followed by American Indian/Alaska Native persons (44.2), Hispanic persons (31.2), non-Hispanic White persons (25.8), and Asian/Pacific Islander persons (21.8).


[SUB]**In this figure, weekly rates for all seasons prior to the 2023-2024 season reflect end-of-season rates. For the 2023-2024 season, rates for recent hospital admissions are subject to reporting delays and are shown as a dashed line for the current season. As hospitalization data are received each week, prior case counts and rates are updated accordingly.[/SUB]

Additional FluSurv-NET hospitalization surveillance information for current and past seasons and additional age groups:


Surveillance Methods | FluView Interactive: Rates by Age, Sex, and Race/Ethnicity or Data on Patient Characteristics | RESP-NET Interactive

National Healthcare Safety Network (NHSN) Hospital Respiratory Data


Hospitals report to NHSN the weekly number of patients with laboratory-confirmed influenza who were admitted to the hospital. Nationally, during Week 2, 31,379 laboratory confirmed influenza-associated hospitalizations were reported. This is a decrease (change of > 5%) compared to Week 1.

The weekly hospital admission rate observed in Week 2 was 9.3 per 100,000. The weekly rate of hospital admissions in all 10 HHS regions ranged from 6.9 (Region 6) to 15.7 (Region 2). The weekly rate of hospitalizations decreased in all 10 HHS regions. The decrease this week compared to last week could be due to changes in healthcare seeking or reporting during the holidays rather than an indication that influenza activity has peaked.

When examining rates by age for week 2, all age groups decreased this week (change of >5%) compared to the previous week. The highest hospital admission rate per 100,000 population was among those 75+ years (40.4), followed by 65-to-74-year age group (17.6), and 50-to-64-year age group (10.1). View Larger
NHSN02.gif
NHSN week 2 Additional NHSN Hospitalization Surveillance information:


Surveillance Methods | Additional Data | FluView Interactive

Mortality surveillance

National Center for Health Statistics (NCHS)


Based on NCHS mortality surveillance data available on January 16, 2025, 1.5% of the deaths that occurred during the week ending January 11, 2025 (Week 2), were due to influenza. This percentage increased (> 0.1 percentage point change) compared to Week 1. The data presented are preliminary and may change as more data are received and processed.

Additional pneumonia, influenza and COVID-19 mortality surveillance information for current and past seasons:


Surveillance Methods | FluView Interactive

Influenza-Associated Pediatric Mortality


Eleven influenza-associated pediatric deaths occurring during the 2024-2025 season were reported to CDC during Week 2. The deaths occurred during weeks 51 and 52 of 2024 and during weeks 1 and 2 of 2025 (the weeks ending December 21 and December 28 of 2024 and January 4 and January 11 of 2025). All 11 deaths were associated with influenza A viruses. Six of the influenza A viruses had subtyping performed; three were A(H1N1) viruses, and three were A(H3N2) viruses.

A total of 27 influenza-associated pediatric deaths occurring during the 2024-2025 season have been reported to CDC.

Additional pediatric mortality surveillance information for current and past seasons:


Surveillance Methods | FluView Interactive

Additional National and International Influenza Surveillance Information

Indicators Status by System


Increasing:
IncreasingArrow.png

Decreasing:
DecreasingArrow.png

Stable:
StableArrow.png


Clinical Labs: Up or down arrows indicate a change of greater than or equal to 0.5 percentage points in the percent of specimens positive for influenza compared to the previous week.
Outpatient Respiratory Illness (ILINet): Up or down arrows indicate a change of greater than 0.1 percentage points in the percent of visits due to respiratory illness (ILI) compared to the previous week.
NHSN Hospitalizations: Up or down arrows indicate change of greater than or equal to 5% of the number of patients admitted with laboratory-confirmed influenza compared to the previous week.
NCHS Mortality: Up or down arrows indicate change of greater than 0.1 percentage points of the percent of deaths due to influenza compared to the previous week.

Additional surveillance information


FluView Interactive: FluView includes enhanced web-based interactive applications that can provide dynamic visuals of the influenza data collected and analyzed by CDC. These FluView Interactive applications allow people to create customized, visual interpretations of influenza data, as well as make comparisons across flu seasons, regions, age groups and a variety of other demographics.

National Institute for Occupational Safety and Health: Monthly surveillance data on the prevalence of health-related workplace absenteeism among full-time workers in the United States are available from NIOSH.

https://www.cdc.gov/fluview/surveillance/2025-week-02.html
 
Weekly US Influenza Surveillance Report: Key Updates for Week 3, ending January 18, 2025

What to know


Seasonal influenza activity remains elevated across the country and is increasing in most areas.
Summary

Viruses

Clinical Lab 25.0% (Trend
IncreasingArrow.png
)
positive for influenza
this week. Public Health Lab Influenza A(H1N1)pdm09 and A(H3N2)
were the predominant viruses reported this week. Illness

Outpatient Respiratory Illness 5.7% (Trend
IncreasingArrow.png
)
of visits to a health care provider this
week were for respiratory illness
(above baseline). Activity Map 5 moderate jurisdictions 39 high or very high jurisdictions FluSurv-NET 40.8 per 100,000
cumulative hospitalization rate National Healthcare Safety Network (NHSN) Hospital Respiratory Data 31,234 (Trend
StableArrow.png
)
patients admitted to hospitals
with influenza this week. NCHS Mortality 1.5% (Trend
StableArrow.png
)
of deaths attributed to influenza this week. Pediatric Deaths 4 influenza-associated deaths
were reported this week for
a total of 31 deaths this season.
All data are preliminary and may change as more reports are received.

Directional arrows indicate changes between the current week and the previous week. Additional information on the arrows can be found at the bottom of this page.

A description of the CDC influenza surveillance system, including methodology and detailed descriptions of each data component is available on the surveillance methods page.[SUP]1[/SUP]

Additional information on the current and previous influenza seasons for each surveillance component are available on FluView Interactive.

Key Points


• Seasonal influenza activity remains elevated across the country and is increasing in most areas.

• During Week 3, of the 2,304 viruses reported by public health laboratories, 2,252 were influenza A and 52 were influenza B. Of the 1,705 influenza A viruses subtyped during Week 3, 769 (45.1%) were influenza A(H1N1)pdm09, 936 (54.9%) were A(H3N2), and 0 (0%) were A(H5).

• Outpatient respiratory illness is above baseline nationally for the eighth consecutive week and is above baseline in all 10 HHS regions.

• No new influenza A(H5) cases were reported to CDC this week. To date, human-to-human transmission of influenza A(H5) virus has not been identified in the United States.

• Four pediatric deaths associated with seasonal influenza virus infection were reported this week, bringing the 2024-2025 season total to 31 pediatric deaths.

• CDC estimates that there have been at least 16 million illnesses, 190,000 hospitalizations, and 8,300 deaths from flu so far this season.

• CDC recommends that everyone ages 6 months and older get an annual influenza (flu) vaccine.[SUP]1[/SUP]

• There are prescription flu antiviral drugs that can treat flu illness; those should be started as early as possible and are especially important for patients at higher risk for severe illness.[SUP]2[/SUP]

• Influenza viruses are among several viruses contributing to respiratory disease activity. CDC is providing updated, integrated information about COVID-19, flu, and respiratory syncytial virus (RSV) activity on a weekly basis.
COVID-19, flu, and RSV activity

U.S. virologic surveillance


Nationally, the percentage of respiratory specimens testing positive for influenza virus in clinical laboratories increased (change of ≥ 0.5 percentage points) compared to the previous week. Percent positivity is increasing in HHS regions 1, 2, 3, 4, 5, 6, 7, 8, and 9 and stable in Region 10. Region 6 had the highest percent positivity (32.2%) and Region 10 the lowest (16.2%). Influenza A(H1N1)pdm09 and A(H3N2) were the predominant viruses reported this week. For regional and state level data and age group distribution, please visit FluView Interactive. Viruses known to be associated with recent receipt of live attenuated influenza vaccine (LAIV) or found upon further testing to be a vaccine virus are not included, as they are not circulating influenza viruses.

Clinical Laboratories


The results of tests performed by clinical laboratories nationwide are summarized below. Data from clinical laboratories (the percentage of specimens tested that are positive for influenza virus) are used to monitor whether influenza activity is increasing or decreasing.
No. of specimens tested89,4601,499,307
No. of positive specimens (%)22,345 (25.0%)138,468 (9.2%)
Positive specimens by type
Influenza A21,869 (97.9%)134,045 (96.8%)
Influenza B476 (2.1%)4,422 (3.2%)

Public Health Laboratories


The results of tests performed by public health laboratories nationwide are summarized below. Data from public health laboratories are used to monitor the proportion of circulating influenza viruses that belong to each influenza subtype/lineage.
No. of specimens tested3,33242,903
No. of positive specimens2,30424,344
Positive specimens by type/subtype
Influenza A2,252 (97.7%)23,658 (97.2%)
Subtyping Performed1,705 (75.7%)20,674 (87.4%)
(H1N1)pdm09769 (45.1%)9,381 (45.4%)
H3N2936 (54.9%)11,215 (54.2%)
H3N2v[SUP]†[/SUP]00
H5*078 (0.4%)
Subtyping not performed547 (24.3%)2,984 (12.6%)
Influenza B52 (2.3%)686 (2.8%)
Lineage testing performed25 (48.1%)334 (48.7%)
Yamagata lineage00
Victoria lineage25 (100%)334 (100%)
Lineage not performed27 (54.3%)352 (51.3%)
[SUB]*These data reflect specimens tested, and the number determined to be positive for influenza viruses at the public health labs (specimens tested is not the same as cases). The data do not reflect specimens tested only at CDC and could include more than one specimen tested per person. The guidance for influenza A(H5) virus testing recommends testing both a conjunctival and respiratory swab for people with conjunctivitis which has resulted in more specimens testing positive for influenza A(H5) virus than the number of human A(H5) cases. For more information on the number of people infected with A(H5) viruses,[/SUB] [SUB]please visit the [/SUB][SUB]"How CDC is monitoring influenza data among people to better understand the current avian influenza A (H5N1) situation"[/SUB]

[SUB][SUP]†[/SUP]When an influenza virus that normally circulates in swine (but not people) is detected in a person, it is called a "variant" influenza virus. Most human infections with variant influenza viruses occur following exposure to swine, but human-to-human transmission can occur. It is important to note that in most cases, variant influenza viruses have not shown the ability to spread easily and sustainably from human-to-human.[/SUB]


[SUB]*This graph reflects the number of specimens tested and the number determined to be positive for influenza viruses at the public health lab (specimens tested is not the same as cases). It does not reflect specimens tested only at CDC and could include more than one specimen tested per person. Specimens tested as part of routine influenza surveillance as well as those tested as part of targeted testing for people exposed to influenza A(H5) are included.[/SUB]

Additional virologic surveillance information for current and past seasons:


Surveillance Methods | FluView Interactive: National, Regional, and State Data or Age Data

Novel Influenza A Virus


No confirmed human infections with influenza A(H5) virus were reported to CDC this week. To date, human-to-human transmission of influenza A(H5) virus has not been identified in the United States.

The CSTE position statement, which includes updated case definitions for confirmed, probable, and suspected cases is available at http://www.cste.org/resource/resmgr/position_statements_files_2023/24-ID-09_Novel_Influenza_A.pdf

An up-to-date human case summary during the outbreak by state and exposure source is available at www.cdc.gov/bird-flu/situation-summary/index.html

Information about avian influenza is available at https://www.cdc.gov/flu/avianflu/index.htm.

Interim recommendations for Prevention, Monitoring, and Public Health Investigations are available at https://www.cdc.gov/bird-flu/prevention/hpai-interim-recommendations.html.

The latest case reports on avian influenza outbreaks in wild birds, commercial poultry, backyard or hobbyist flocks, and mammals in the United States are available from the USDA at https://www.aphis.usda.gov/aphis/ou...e-information/avian/avian-influenza/2022-hpai.

Additional information regarding human infections with novel influenza A viruses:


Surveillance Methods | FluView Interactive

Influenza Virus Characterization


CDC performs genetic and antigenic characterization of U.S. viruses submitted from state and local public health laboratories according to the Right Size Roadmap submission guidance. These data are used to compare how similar the currently circulating influenza viruses are to the reference viruses representing the current influenza vaccines. The data are also used to monitor evolutionary changes that continually occur in influenza viruses circulating in humans. CDC also tests susceptibility of circulating influenza viruses to antiviral medications including the neuraminidase inhibitors (oseltamivir, zanamivir, and peramivir) and the polymerase acidic protein (PA) endonuclease inhibitor baloxavir. The HA clade and subclades were assigned using Nextclade (https://clades.nextstrain.org).

CDC has genetically characterized 1,094 influenza viruses collected since September 29, 2024.
A/H1406
5a.2a234 (57.6%)C.1.9234 (57.6%)
5a.2a.1172 (42.4%)D12 (3.0%)
D.13 (0.7%)
D.324 (5.9%)
D.5133 (32.8%)
A/H3599
2a.3a5 (0.8%)G.1.3.15 (0.8%)
2a.3a.1594 (99.2%)J.11 (0.2%)
J.1.15 (0.8%)
J.2543 (90.7%)
J.2.111 (1.8%)
J.2.234 (5.7%)
B/Victoria89
3a.289 (100%)C.31 (1.1%)
C.514 (15.7%)
C.5.148 (53.9%)
C.5.612 (13.5%)
C.5.714 (15.7%)
B/Yamagata0
Y30Y30
CDC antigenically characterizes influenza viruses by hemagglutination inhibition (HI) (H1N1pdm09, H3N2, and B/Victoria viruses) or neutralization-based HINT (H3N2 viruses) using antisera that ferrets make after being infected with reference viruses representing the 2024-2025 Northern Hemisphere recommended cell or recombinant-based vaccine viruses. Antigenic differences between viruses are determined by comparing how well the antibodies made against the vaccine reference viruses recognize the circulating viruses that have been grown in cell culture. Ferret antisera are useful because antibodies raised against a particular virus can often recognize small changes in the surface proteins of other viruses. In HI assays, viruses with similar antigenic properties have antibody titer differences of less than or equal to 4-fold when compared to the reference (vaccine) virus. In HINT, viruses with similar antigenic properties have antibody neutralization titer differences of less than or equal to 8-fold. Viruses selected for antigenic characterization are a subset of the recent genetically characterized viruses and are chosen based on the genetic changes in their surface proteins and may not be proportional to the number of such viruses circulating in the United States.

Influenza A Viruses
  • A(H1N1)pdm09: 51 A(H1N1)pdm09 viruses were antigenically characterized by HI, and all were well-recognized (reacting at titers that were within 4-fold of the homologous virus titer) by ferret antisera to cell-grown A/Wisconsin/67/2022-like reference viruses representing the A(H1N1)pdm09 component for the cell- and recombinant-based influenza vaccines.
  • A(H3N2): 95 A(H3N2) viruses were antigenically characterized by HI or HINT, and 40 (42.1%) were well-recognized (reacting at titers that were within 4-fold of the homologous virus titer in HI or reacting at titers that were less than or equal to 8-fold of the homologous virus in HINT) by ferret antisera to cell-grown A/Massachusetts/18/2022-like reference viruses representing the A(H3N2) component for the cell- and recombinant-based influenza vaccines.
Influenza B Viruses
  • B/Victoria: 9 influenza B/Victoria-lineage virus were antigenically characterized by HI, and all were well-recognized (reacting at titers that were within 4-fold of the homologous virus titer) by ferret antisera to cell-grown B/Austria/1359417/2021-like reference viruses representing the B/Victoria component for the cell- and recombinant-based influenza vaccines.
  • B/Yamagata: No influenza B/Yamagata-lineage viruses were available for antigenic characterization.
Assessment of Virus Susceptibility to Antiviral Medications


CDC assesses susceptibility of influenza viruses to the antiviral medications including the neuraminidase inhibitors (oseltamivir, zanamivir, and peramivir) and the PA endonuclease inhibitor baloxavir using next generation sequence analysis supplemented by laboratory assays. Information about antiviral susceptibility test methods can be found at U.S. Influenza Surveillance: Purpose and Methods.

Viruses collected in the U.S. since September 29, 2024, were tested for antiviral susceptibility as follows:
Neuraminidase InhibitorsOseltamivirViruses Tested1,02241152487
Reduced Inhibition1 (<0.1%)1 (0.2%)00
Highly Reduced Inhibition0000
PeramivirViruses Tested1,02241152487
Reduced Inhibition0000
Highly Reduced Inhibition0000
ZanamivirViruses Tested1,02241152487
Reduced Inhibition0000
Highly Reduced Inhibition0000
PA Cap-Dependent Endonuclease InhibitorBaloxavirViruses Tested93033551382
Decreased Susceptibility0000
One A(H1N1)pdm09 virus had NA-I223V and NA-S247N amino acid substitutions and showed reduced inhibition by oseltamivir.

High levels of resistance to the adamantanes (amantadine and rimantadine) persist among influenza A(H1N1)pdm09 and influenza A(H3N2) viruses (the adamantanes are not effective against influenza B viruses). Therefore, use of these antivirals for treatment and prevention of influenza A virus infection is not recommended and data from adamantane resistance testing are not presented.

Outpatient and Emergency Department Illness Surveillance

Outpatient respiratory illness visits


The U.S. Outpatient Influenza-like Illness Surveillance Network (ILINet) monitors outpatient visits for respiratory illness referred to as influenza-like illness [ILI (fever plus cough or sore throat)], not laboratory-confirmed influenza, and will therefore capture respiratory illness visits due to infection with any pathogen that can present with similar symptoms, including influenza virus, SARS-CoV-2, and RSV. It is important to evaluate syndromic surveillance data, including that from ILINet, in the context of other sources of surveillance data to obtain a complete and accurate picture of influenza, SARS-CoV-2, and other respiratory virus activity.

Nationally, during Week 3, 5.7% of patient visits reported through ILINet were due to respiratory illness that included fever plus a cough or sore throat, also referred to as ILI. This week's percentage increased (change of > 0.1 percentage points) compared to Week 2 and remains above the national baseline of 3.0% for the eighth consecutive week. The percentage of visits for ILI remained stable in regions 3 and 8 (change of ≤ 0.1 percentage points), decreased (change of > 0.1 percentage points) in regions 6, 7, 9, and 10, and increased (change of > 0.1 percentage points) in regions 1, 2, 4, and 5 this week compared to last. All regions are above their respective baselines and ILI activity remains elevated across the country. Multiple respiratory viruses are co-circulating, and the relative contribution of influenza virus infections to ILI varies by location.

Outpatient respiratory illness visits by age group


About 70% of ILINet participants provide both the number of patient visits for respiratory illness and the total number of patient visits for the week broken out by age group. Based on these data, the percentage of visits for respiratory illness increased (change of > 0.1 percentage point) in the 0-4 years and 5-24 years age groups, decreased (change of > 0.1 percentage point) in the 50-64 years and 65+ years age groups, and remained stable (change of ≤ 0.1 percentage point) in the 25-49 years age group in Week 3 compared to Week 2.

Outpatient respiratory illness activity map


Data collected in ILINet are used to produce a measure of ILI activity* by state/jurisdiction and Core Based Statistical Areas (CBSA).
Week 3
(Week ending
Jan. 18, 2025)
Week 2
(Week ending
Jan. 11, 2025)
Week 3
(Week ending
Jan. 18, 2025)
Week 2
(Week ending
Jan. 11, 2025)
Very High1591539
High2426153136
Moderate59135140
Low56178189
Minimal54174203
Insufficient Data11234222


*Data collected in ILINet may disproportionally represent certain populations within a jurisdiction or CBSA, and therefore, may not accurately depict the full picture of influenza activity for the entire jurisdiction or CBSA. Differences in the data presented here by CDC and independently by some health departments likely represent differing levels of data completeness with data presented by the health department likely being the more complete.

Additional information about medically attended visits for ILI for current and past seasons:


Surveillance Methods | FluView Interactive: National, Regional, and State Data or ILI Activity Map

National Syndromic Surveillance System (NSSP)


The overall percentage of emergency department (ED) visits with a discharge diagnosis of influenza reported in NSSP was 5.2% during Week 3, an increase (change of > 0.1 percentage point) compared to the previous week. The percentage of ED visits with influenza discharge diagnoses increased in HHS regions 1, 2, 3, 4, 5, 6, and 7, remained stable (change of ≤ 0.1 percentage point) in Region 8 and decreased (change of > 0.1 percentage point) in Regions 9 and 10 from Week 2 to Week 3. Percentages in the 0-4 years, 5-17 years, and 18-64 years age groups increased this week compared to last and remained stable in the 65+ years age group. RegionNationalRegion 1Region 2Region 3Region 4Region 5Region 6Region 7Region 8Region 9Region 10
Season2022-20232023-2024 & 2024-2025 Skip Over Chart Container
2.0%4.0%6.0%8.0%10.0%12.0%14.0%Percent of Emergency Department Visits for InfluenzaWeek 43 of 2023Week 47 of 2023Week 51 of 2023Week 3 of 2024Week 7 of 2024Week 11 of 2024Week 15 of 2024Week 19 of 2024Week 23 of 2024Week 27 of 2024Week 31 of 2024Week 35 of 2024Week 39 of 2024Week 43 of 2024Week 47 of 2024Week 51 of 2024Week 3 of 2025 Age Group


All ages
0-4 years
5-17 years
18-64 years
65+ Skip Data Table
Data Table Download Data (CSV)

Skipped data table. Additional information about emergency department visits for flu for current and past seasons:‎‎‎


Surveillance Methods | Emergency Department Visits for COVID-19, flu, and RSV

Hospitalization surveillance

FluSurv-Net


The Influenza Hospitalization Surveillance Network (FluSurv-NET) conducts population-based surveillance for laboratory-confirmed influenza-related hospitalizations in select counties in 14 states and represents approximately 9% of the U.S. population. FluSurv-NET hospitalization data are preliminary. As data are received each week, prior case counts and rates are updated accordingly.

A total of 12,511 laboratory-confirmed influenza-associated hospitalizations were reported by FluSurv-NET sites between October 1, 2024, and January 18, 2025. The weekly hospitalization rate observed during Week 3 was 6.1 per 100,000 population. The weekly hospitalization rate observed during Week 1 (9.9 per 100,000 population) is the second highest peak weekly rate observed, following the 2017-2018 season, across all seasons since 2010-2011. The cumulative hospitalization rate observed in Week 3 was 40.8 per 100,000 population.

Among all hospitalizations, 12,176 (97.3%) were associated with influenza A virus, 261 (2.1%) with influenza B virus, 14 (0.1%) with influenza A virus and influenza B virus co-infection, and 60 (0.5%) with influenza virus for which the type was not determined. Among those with influenza A subtype information, 1,263 (47.8%) were A(H1N1) pdm09 and 1,378 (52.2%) were A(H3N2).

When examining rates by age, the highest cumulative hospitalization rate per 100,000 population was among adults aged 65 years and older (123.3), followed by adults aged 50-64 years (46.4), children aged 0-4 years (37.5), adults aged 18-49 (18.6), and children aged 5-17 (12.8).

When examining age-adjusted rates by race and ethnicity, the highest cumulative hospitalization rate per 100,000 population was among non-Hispanic Black persons (62.6), followed by American Indian/Alaska Native persons (56.8), Hispanic persons (37.3), non-Hispanic White persons (32.0), and Asian/Pacific Islander persons (27.0).


[SUB]**In this figure, weekly rates for all seasons prior to the 2024-2025 season reflect end-of-season rates. For the 2024-2025 season, rates for recent hospital admissions are subject to reporting delays and are shown as a dashed line for the current season. As hospitalization data are received each week, prior case counts and rates are updated accordingly.[/SUB]
\
Additional FluSurv-NET hospitalization surveillance information for current and past seasons and additional age groups:


Surveillance Methods | FluView Interactive: Rates by Age, Sex, and Race/Ethnicity or Data on Patient Characteristics | RESP-NET Interactive

National Healthcare Safety Network (NHSN) Hospital Respiratory Data


Hospitals report to NHSN the weekly number of patients with laboratory-confirmed influenza who were admitted to the hospital. Nationally, during Week 3, 31,234 laboratory confirmed influenza-associated hospitalizations were reported. This week's influenza-associated hospitalizations remained stabled (change of < 5%) compared to Week 2.

The weekly hospital admission rate observed in Week 3 was 9.3 per 100,000. The weekly rate of hospital admissions in all 10 HHS regions ranged from 6.4 (Region 10) to 13.2 (Region 2). The weekly rate of hospital admissions increased in regions 1, 3, 4, 5, and 6, decreased in regions 2, 7, 8, and 10, and remained stable in region 9.

When examining rates by age for Week 3, the 5-17 years, 18-49 years, and 65-74 year age group increased and the 0-4 years, 50-64 years, and 75 and older age groups remained stable compared to the previous week. The highest hospital admission rate per 100,000 population was among those 75+ years (39.4), followed by 65-74 year age group (18.4), and 50-64 year age group (10.3). View Larger
NHSN03_small.gif
Additional NHSN Hospital Respiratory Data information:


Surveillance Methods | Additional Data | FluView Interactive

Mortality surveillance

National Center for Health Statistics (NCHS) Mortality Surveillance


Based on NCHS mortality surveillance data available on January 23, 2025, 1.5% of the deaths that occurred during the week ending January 18, 2025 (Week 3), were due to influenza. This percentage remained stable (≤0.1 percentage point change) compared to Week 2. The data presented are preliminary and may change as more data are received and processed.

Additional pneumonia, influenza and COVID-19 mortality surveillance information for current and past seasons:


Surveillance Methods | FluView Interactive

Influenza-Associated Pediatric Mortality


Four influenza-associated pediatric deaths occurring during the 2024-2025 season were reported to CDC during Week 3. The deaths occurred during weeks 51 and 52 of 2024 and during weeks 2 and 3 of 2025 (the weeks ending December 21 and December 28 of 2024 and January 11 and January 18 of 2025). All four deaths were associated with influenza A viruses. Three of the influenza A viruses had subtyping performed; one was an A(H1N1) virus and two were A(H3N2) viruses.

A total of 31 influenza-associated pediatric deaths occurring during the 2024-2025 season have been reported to CDC.

Additional pediatric mortality surveillance information for current and past seasons:


Surveillance Methods | FluView Interactive

Additional National and International Influenza Surveillance Information

Indicators Status by System


Increasing:
IncreasingArrow.png

Decreasing:
DecreasingArrow.png

Stable:
StableArrow.png


Clinical Labs: Up or down arrows indicate a change of greater than or equal to 0.5 percentage points in the percent of specimens positive for influenza compared to the previous week.
Outpatient Respiratory Illness (ILINet): Up or down arrows indicate a change of greater than 0.1 percentage points in the percent of visits due to respiratory illness (ILI) compared to the previous week.
NHSN Hospitalizations: Up or down arrows indicate change of greater than or equal to 5% of the number of patients admitted with laboratory-confirmed influenza compared to the previous week.
NCHS Mortality: Up or down arrows indicate change of greater than 0.1 percentage points of the percent of deaths due to influenza compared to the previous week.

Additional surveillance information


FluView Interactive: FluView includes enhanced web-based interactive applications that can provide dynamic visuals of the influenza data collected and analyzed by CDC. These FluView Interactive applications allow people to create customized, visual interpretations of influenza data, as well as make comparisons across flu seasons, regions, age groups and a variety of other demographics.

National Institute for Occupational Safety and Health: Monthly surveillance data on the prevalence of health-related workplace absenteeism among full-time workers in the United States are available from NIOSH.

https://www.cdc.gov/fluview/surveillance/2025-week-03.html
 
January 31, 2025


Weekly US Influenza Surveillance Report: Key Updates for Week 4, ending January 25, 2025

What to know


Seasonal influenza activity remains elevated and continues to increase across the country.
Summary

Viruses

Clinical Lab 29.4% (Trend
IncreasingArrow.png
)
positive for influenza
this week. Public Health Lab Influenza A(H1N1)pdm09 and A(H3N2)
were the predominant viruses reported this week.


Illness

Outpatient Respiratory Illness 6.9% (Trend
IncreasingArrow.png
)
of visits to a health care provider this
week were for respiratory illness
(above baseline). Activity Map 4 moderate jurisdictions 44 high or very high jurisdictions FluSurv-NET 52.0 per 100,000
cumulative hospitalization rate National Healthcare Safety Network (NHSN) Hospital Respiratory Data 38,255 (Trend
IncreasingArrow.png
)
patients admitted to hospitals
with influenza this week. NCHS Mortality 1.6% (Trend
StableArrow.png
)
of deaths attributed to influenza this week. Pediatric Deaths 16 influenza-associated deaths
were reported this week for
a total of 47 deaths this season.
All data are preliminary and may change as more reports are received.

Directional arrows indicate changes between the current week and the previous week. Additional information on the arrows can be found at the bottom of this page.

A description of the CDC influenza surveillance system, including methodology and detailed descriptions of each data component is available on the surveillance methods page.[SUP]1[/SUP]

Additional information on the current and previous influenza seasons for each surveillance component are available on FluView Interactive.


Key Points
  • Seasonal influenza activity remains elevated and continues to increase across the country.
  • During Week 4, of the 2,693 viruses reported by public health laboratories, 2,642 were influenza A and 51 were influenza B. Of the 2,150 influenza A viruses subtyped during Week 4, 1,069 (49.7%) were influenza A(H1N1)pdm09, 1,081 (50.3%) were A(H3N2), and 0 were A(H5).
  • Outpatient respiratory illness is increasing and remains above baseline nationally for the ninth consecutive week. All 10 HHS regions are above their region-specific baseline.
  • No new influenza A(H5) cases were reported to CDC this week. To date, human-to-human transmission of influenza A(H5) virus has not been identified in the United States.
  • Sixteen pediatric deaths associated with seasonal influenza virus infection were reported this week, bringing the 2024-2025 season total to 47 pediatric deaths.
  • CDC estimates that there have been at least 20 million illnesses, 250,000 hospitalizations, and 11,000 deaths from flu so far this season.
  • CDC recommends that everyone ages 6 months and older get an annual influenza (flu) vaccine.[SUP]1[/SUP]
  • There are prescription flu antiviral drugs that can treat flu illness; those should be started as early as possible and are especially important for patients at higher risk for severe illness.[SUP]2[/SUP]
  • Influenza viruses are among several viruses contributing to respiratory disease activity. CDC is providing updated, integrated information about COVID-19, flu, and respiratory syncytial virus (RSV) activity on a weekly basis.
COVID-19, flu, and RSV activity
U.S. virologic surveillance


Nationally and in all 10 HHS regions, the percentage of respiratory specimens testing positive for influenza virus in clinical laboratories increased (change of ≥ 0.5 percentage points) compared to the previous week. Region 6 had the highest percent positivity (38.2%) and Region 10 had the lowest (20.5%). Influenza A(H1N1)pdm09 and A(H3N2) were the predominant viruses reported this week. For regional and state level data and age group distribution, please visit FluView Interactive. Viruses known to be associated with recent receipt of live attenuated influenza vaccine (LAIV) or found upon further testing to be a vaccine virus are not included, as they are not circulating influenza viruses.


Clinical Laboratories


The results of tests performed by clinical laboratories nationwide are summarized below. Data from clinical laboratories (the percentage of specimens tested that are positive for influenza virus) are used to monitor whether influenza activity is increasing or decreasing.
No. of specimens tested129,3781,675,318
No. of positive specimens (%)38,042 (29.4%)186,873 (11.2%)
Positive specimens by type
Influenza A36,471 (95.9%)180,443 (96.6%)
Influenza B1,571 (4.1%)6,429 (3.4%)
Public Health Laboratories


The results of tests performed by public health laboratories nationwide are summarized below. Data from public health laboratories are used to monitor the proportion of circulating influenza viruses that belong to each influenza subtype/lineage.
No. of specimens tested3,49550,454
No. of positive specimens2,69330,273
Positive specimens by type/subtype
Influenza A2,642 (98.1%)29,473 (97.4%)
Subtyping Performed2,150 (81.4%)26,082 (88.5%)
(H1N1)pdm091,069 (49.7%)12,005 (46.0%)
H3N21,081 (50.3%)13,999 (53.7%)
H3N2v00
H5*078 (0.3%)
Subtyping not performed492 (18.6%)3,391 (11.5%)
Influenza B51 (1.9%)800 (2.6%)
Lineage testing performed11 (21.6%)382 (47.8%)
Yamagata lineage00
Victoria lineage11 (100.0%)382 (100.0%)
Lineage not performed40 (78.4%)418 (52.2%)
[SUB]*This data reflects specimens tested and the number determined to be positive for influenza viruses at the public health labs (specimens tested is not the same as cases). It does not reflect specimens tested only at CDC and could include more than one specimen tested per person. The guidance for influenza A/H5 testing recommends testing both a conjunctival and respiratory swab for people with conjunctivitis which has resulted in more specimens testing positive for influenza A/H5 than the number of human H5 cases. For more information on the number of people infected with A/H5, please visit the [/SUB][SUB]"How CDC is monitoring influenza data among people to better understand the current avian influenza A (H5N1) situation"[/SUB]


[SUP]This graph reflects the number of specimens tested and the number determined to be positive for influenza viruses at the public health lab (specimens tested is not the same as cases). It does not reflect specimens tested only at CDC and could include more than one specimen tested per person. Specimens tested as part of routine influenza surveillance as well as those tested as part of targeted testing for people exposed to influenza A(H5) are included.[/SUP]

Additional virologic surveillance information for current and past seasons:


Surveillance Methods | FluView Interactive: National, Regional, and State Data or Age Data

Novel Influenza A Virus


No confirmed human infections with influenza A(H5) virus were reported to CDC this week. To date, human-to-human transmission of influenza A(H5) virus has not been identified in the United States.

The CSTE position statement, which includes updated case definitions for confirmed, probable, and suspected cases is available at http://www.cste.org/resource/resmgr/position_statements_files_2023/24-ID-09_Novel_Influenza_A.pdf

An up-to-date human case summary during the outbreak by state and exposure source is available at www.cdc.gov/bird-flu/situation-summary/index.html

Information about avian influenza is available at https://www.cdc.gov/flu/avianflu/index.htm.

Interim recommendations for Prevention, Monitoring, and Public Health Investigations are available at https://www.cdc.gov/bird-flu/prevention/hpai-interim-recommendations.html.

The latest case reports on avian influenza outbreaks in wild birds, commercial poultry, backyard or hobbyist flocks, and mammals in the United States are available from the USDA at https://www.aphis.usda.gov/aphis/ou...e-information/avian/avian-influenza/2022-hpai.


Additional information regarding human infections with novel influenza A viruses:


Surveillance Methods | FluView Interactive

Influenza Virus Characterization


CDC performs genetic and antigenic characterization of U.S. viruses submitted from state and local public health laboratories according to the Right Size Roadmap submission guidance. These data are used to compare how similar the currently circulating influenza viruses are relative to the reference viruses representing the current influenza vaccines. The data are also used to monitor evolutionary changes that continually occur in influenza viruses circulating in humans. CDC also tests susceptibility of circulating influenza viruses to antiviral medications including the neuraminidase inhibitors (oseltamivir, zanamivir, and peramivir) and the polymerase acidic protein (PA) endonuclease inhibitor baloxavir. The HA clade and subclades were assigned using Nextclade (https://clades.nextstrain.org).

CDC has genetically characterized 1,333 influenza viruses collected since September 29, 2024.
A/H1491
5a.2a216 (57.3%)C.1.9289 (58.9%)
5a.2a.1161 (42.7%)D14 (2.9%)
D.14 (0.8%)
D.343 (8.8%)
D.5141 (28.7%)
A/H3739
2a.3a5 (0.9%)G.1.3.15 (0.7%)
2a.3a.1525 (99.1%)J.11 (0.1%)
J.1.15 (0.7%)
J.2676 (91.5%)
J.2.113 (1.8%)
J.2.239 (5.3%)
B/Victoria103
3a.277 (100%)C.31 (1.0%)
C.515 (14.6%)
C.5.157 (55.3%)
C.5.613 (12.6%)
C.5.717 (16.5%)
B/Yamagata0
Y30Y30
CDC antigenically characterizes influenza viruses by hemagglutination inhibition (HI) assay (H1N1pdm09, H3N2, and B/Victoria viruses) or neutralization-based HINT (H3N2 viruses) using antisera that ferrets make after being infected with reference viruses representing the 2024-2025 Northern Hemisphere recommended cell or recombinant-based vaccine viruses. Antigenic differences between viruses are determined by comparing how well the antibodies made against the vaccine reference viruses recognize the circulating viruses that have been grown in cell culture. Ferret antisera are useful because antibodies raised against a particular virus can often recognize small changes in the surface proteins of other viruses. In HI assays, viruses with similar antigenic properties have antibody titer differences of less than or equal to 4-fold when compared to the reference (vaccine) virus. In HINT, viruses with similar antigenic properties have antibody neutralization titer differences of less than or equal to 8-fold. Viruses selected for antigenic characterization are a subset of the recent genetically characterized viruses and are chosen based on the genetic changes in their surface proteins and may not be proportional to the number of such viruses circulating in the United States.


Influenza A Viruses
  • A (H1N1)pdm09: 51 A(H1N1)pdm09 viruses were antigenically characterized by HI, and 51 (100%) were well-recognized (reacting at titers that were within 4-fold of the homologous virus titer) by ferret antisera to cell-grown A/Wisconsin/67/2022-like reference viruses representing the A(H1N1)pdm09 component for the cell- and recombinant-based influenza vaccines.
  • A (H3N2): 132 A(H3N2) viruses were antigenically characterized by HI or HINT, and 55 (41.7%) were well-recognized (reacting at titers that were within 4-fold of the homologous virus titer in HI or reacting at titers that were less than or equal to 8-fold of the homologous virus in HINT) by ferret antisera to cell-grown A/Massachusetts/18/2022-like reference viruses representing the A(H3N2) component for the cell- and recombinant-based influenza vaccines.
Influenza B Viruses
  • B/Victoria: 15 influenza B/Victoria-lineage virus were antigenically characterized by HI, and all were well-recognized (reacting at titers that were within 4-fold of the homologous virus titer) by ferret antisera to cell-grown B/Austria/1359417/2021-like reference viruses representing the B/Victoria component for the cell- and recombinant-based influenza vaccines.
  • B/Yamagata: No influenza B/Yamagata-lineage viruses were available for antigenic characterization.
Assessment of Virus Susceptibility to Antiviral Medications


CDC assesses susceptibility of influenza viruses to the antiviral medications including the neuraminidase inhibitors (oseltamivir, zanamivir, and peramivir) and the PA endonuclease inhibitor baloxavir using next generation sequence analysis supplemented by laboratory assays. Information about antiviral susceptibility test methods can be found at U.S. Influenza Surveillance: Purpose and Methods | CDC.

Viruses collected in the U.S. since September 29, 2024, were tested for antiviral susceptibility as follows:
Neuraminidase InhibitorsOseltamivirViruses Tested114147357395
Reduced Inhibition1 (<0.1%)1 (0.2%)00
Highly Reduced Inhibition0000
PeramivirViruses Tested114147357395
Reduced Inhibition0000
Highly Reduced Inhibition0000
ZanamivirViruses Tested114147357395
Reduced Inhibition0000
Highly Reduced Inhibition0000
PA Cap-Dependent Endonuclease InhibitorBaloxavirViruses Tested97336052885
Decreased Susceptibility0000
One A(H1N1)pdm09 virus had NA-I223V and NA-S247N amino acid substitutions and showed reduced inhibition by oseltamivir.

High levels of resistance to the adamantanes (amantadine and rimantadine) persist among influenza A(H1N1)pdm09 and influenza A(H3N2) viruses (the adamantanes are not effective against influenza B viruses). Therefore, use of these antivirals for treatment and prevention of influenza A virus infection is not recommended and data from adamantane resistance testing are not presented.

Outpatient and Emergency Department Illness Surveillance

Outpatient respiratory illness visits


The U.S. Outpatient Influenza-like Illness Surveillance Network (ILINet) monitors outpatient visits for respiratory illness referred to as influenza-like illness [ILI (fever plus cough or sore throat)], not laboratory-confirmed influenza, and will therefore capture respiratory illness visits due to infection with any pathogen that can present with similar symptoms, including influenza virus, SARS-CoV-2, and RSV. It is important to evaluate syndromic surveillance data, including that from ILINet, in the context of other sources of surveillance data to obtain a complete and accurate picture of influenza, SARS-CoV-2, and other respiratory virus activity.

Nationally, during Week 4, 6.9% of patient visits reported through ILINet were due to respiratory illness that included fever plus a cough or sore throat, also referred to as ILI. This week's percentage increased (change of > 0.1 percentage points) compared to Week 3 and remains above the national baseline of 3.0% for the ninth consecutive week. The percentage of visits for ILI increased (change of > 0.1 percentage points) in all 10 HHS regions this week compared to last, and all regions remain above their respective baselines. Multiple respiratory viruses are co-circulating, and the relative contribution of influenza virus infections to ILI varies by location.

Outpatient respiratory illness visits by age group


About 70% of ILINet participants provide both the number of patient visits for respiratory illness and the total number of patient visits for the week broken out by age group. Based on these data, the percentage of visits for respiratory illness increased (change of > 0.1 percentage point) in all age groups (0-4 years, 5-24 years, 25-49 years, 50-64 years, and 65+ years) in Week 4 compared to Week 3.

Outpatient respiratory illness activity map


Data collected in ILINet are used to produce a measure of ILI activity* by state/jurisdiction and Core Based Statistical Areas (CBSA). The state of Vermont is working with CDC to ensure that appropriate data are being used to calculate the state's activity level. Vermont's activity level will be reported again after the issue is resolved.
Week 4
(Week ending
Jan. 25, 2025)
Week 3
(Week ending
Jan. 18, 2025)
Week 4
(Week ending
Jan. 25, 2025)
Week 3
(Week ending
Jan. 18, 2025)
Very High29168556
High1524191152
Moderate46139137
Low23157179
Minimal45127186
Insufficient Data11230219


*Data collected in ILINet may disproportionally represent certain populations within a jurisdiction or CBSA, and therefore, may not accurately depict the full picture of influenza activity for the entire jurisdiction or CBSA. Differences in the data presented here by CDC and independently by some health departments likely represent differing levels of data completeness with data presented by the health department likely being the more complete.


Additional information about medically attended visits for ILI for current and past seasons:


Surveillance Methods | FluView Interactive: National, Regional, and State Data or ILI Activity Map


National Syndromic Surveillance System (NSSP)


The overall percentage of emergency department (ED) visits with a discharge diagnosis of influenza reported in NSSP was 7.0% during Week 4, an increase (change of > 0.1 percentage point) compared to the previous week. The percentage of ED visits with influenza discharge diagnoses increased in all ten HHS regions and in all age groups (0-4 yrs, 5-17 yrs, 18-64 yrs, and 65+ yrs) from week 3 to week 4. RegionNationalRegion 1Region 2Region 3Region 4Region 5Region 6Region 7Region 8Region 9Region 10
Season2022-20232023-2024 & 2024-2025 Skip Over Chart Container
2.0%4.0%6.0%8.0%10.0%12.0%14.0%Percent of Emergency Department Visits for InfluenzaWeek 40 of 2023Week 44 of 2023Week 48 of 2023Week 52 of 2023Week 4 of 2024Week 8 of 2024Week 12 of 2024Week 16 of 2024Week 20 of 2024Week 24 of 2024Week 28 of 2024Week 32 of 2024Week 36 of 2024Week 40 of 2024Week 44 of 2024Week 48 of 2024Week 52 of 2024Week 4 of 2025

Age Group


All ages
0-4 years
5-17 years
18-64 years
65+ Skip Data Table
Data Table Download Data (CSV) Skipped data table.


Additional information about emergency department visits for flu for current and past seasons:‎‎‎


Surveillance Methods | Emergency Department Visits for COVID-19, flu, and RSV

Hospitalization surveillance

FluSurv-Net


The Influenza Hospitalization Surveillance Network (FluSurv-NET) conducts population-based surveillance for laboratory-confirmed influenza-related hospitalizations in select counties in 14 states and represents approximately 9% of the U.S. population. FluSurv-NET hospitalization data are preliminary. As data are received each week, prior case counts and rates are updated accordingly.

A total of 15,926 laboratory-confirmed influenza-associated hospitalizations were reported by FluSurv-NET sites between October 1, 2024, and January 25, 2025. The weekly hospitalization rate observed during Week 4 was 8.0 per 100,000 population. The weekly hospitalization rate observed during Week 1 (10.2 per 100,000 population) is tied with the 2017-2018 season as the highest peak weekly rate observed, across all seasons since 2010-2011. The cumulative hospitalization rate observed in Week 4 was 52.0 per 100,000 population.

Among all hospitalizations, 15,543 (97.6%) were associated with influenza A virus, 306 (1.92%) with influenza B virus, 15 (0.1%) with influenza A virus and influenza B virus co-infection, and 62 (0.4%) with influenza virus for which the type was not determined. Among those with influenza A subtype information, 1,773 (50.7%) were A(H1N1) pdm09 and 1,717 (49.1%) were A(H3N2).

When examining rates by age, the highest cumulative hospitalization rate per 100,000 population was among adults aged 65 years and older (157.3), followed by adults aged 50-64 years (60.2), children aged 0-4 years (47.4), adults aged 18-49 (23.1), and children aged 5-17 (16.2).

When examining age-adjusted rates by race and ethnicity, the highest cumulative hospitalization rate per 100,000 population was among non-Hispanic Black persons (79.8), followed by American Indian/Alaska Native persons (72.2), Hispanic persons (45.4), non-Hispanic White persons (40.1), and Asian/Pacific Islander persons (34.0).


[SUB]**In this figure, weekly rates for all seasons prior to the 2023-2024 season reflect end-of-season rates. For the 2023-2024 season, rates for recent hospital admissions are subject to reporting delays and are shown as a dashed line for the current season. As hospitalization data are received each week, prior case counts and rates are updated accordingly.[/SUB]


Additional FluSurv-NET hospitalization surveillance information for current and past seasons and additional age groups:


Surveillance Methods | FluView Interactive: Rates by Age, Sex, and Race/Ethnicity or Data on Patient Characteristics | RESP-NET Interactive

National healthcare Safety Network (NHSN) Hospital Respiratory Data


Hospitals report to NHSN the weekly number of patients with laboratory-confirmed influenza who were admitted to the hospital. Nationally, during Week 4, 38,255 laboratory confirmed influenza-associated hospitalizations were reported. This week's influenza-associated hospitalizations increased (change of > 5%) compared to Week 3.

The weekly hospital admission rate observed in Week 4 was 11.3 per 100,000. The weekly rate of hospital admissions in all 10 HHS regions ranged from 6.1 (Region 10) to 15.0 (Region 3). The weekly rate of hospital admissions increased in regions 1, 2, 3, 4, 5, 6, 7, 8, and 9 and decreased in region 10.

When examining rates by age for Week 4, all age groups increased compared to the previous week. The highest hospital admission rate per 100,000 population was among those 75+ years (48.0), followed by 65-74 year age group (22.5), and 50-64 year age group (12.3). View Larger
NHSN04.gif
NHSN week 4 Additional NHSN Hospitalization Surveillance information:


Surveillance Methods | Additional Data | FluView Interactive

Mortality surveillance

National Center for Health Statistics (NCHS)


Based on NCHS mortality surveillance data available on January 30, 2025, 1.6% of the deaths that occurred during the week ending January 25, 2025 (Week 4), were due to influenza. This percentage remained stable (≤ 0.1 percentage point change) compared to Week 3. The data presented are preliminary and may change as more data are received and processed.

Additional pneumonia, influenza and COVID-19 mortality surveillance information for current and past seasons:


Surveillance Methods | FluView Interactive


Influenza-Associated Pediatric Mortality


Sixteen influenza-associated pediatric deaths occurring during the 2024-2025 season were reported to CDC during week 4. The deaths occurred between week 50 of 2024 (the week ending December 14, 2024) and week 4 of 2025 (the week ending January 25, 2025). All 16 deaths were associated with influenza A viruses. Thirteen of the influenza A viruses had subtyping performed; seven were A(H1N1) viruses and six were A(H3N2) viruses.

A total of 47 influenza-associated pediatric deaths occurring during the 2024-2025 season have been reported to CDC.

Additional pediatric mortality surveillance information for current and past seasons:


Surveillance Methods | FluView Interactive

Additional National and International Influenza Surveillance Information

Indicators Status by System


Increasing:
IncreasingArrow.png

Decreasing:
DecreasingArrow.png

Stable:
StableArrow.png


Clinical Labs: Up or down arrows indicate a change of greater than or equal to 0.5 percentage points in the percent of specimens positive for influenza compared to the previous week.
Outpatient Respiratory Illness (ILINet): Up or down arrows indicate a change of greater than 0.1 percentage points in the percent of visits due to respiratory illness (ILI) compared to the previous week.
NHSN Hospitalizations: Up or down arrows indicate change of greater than or equal to 5% of the number of patients admitted with laboratory-confirmed influenza compared to the previous week.
NCHS Mortality: Up or down arrows indicate change of greater than 0.1 percentage points of the percent of deaths due to influenza compared to the previous week.


Additional surveillance information


FluView Interactive: FluView includes enhanced web-based interactive applications that can provide dynamic visuals of the influenza data collected and analyzed by CDC. These FluView Interactive applications allow people to create customized, visual interpretations of influenza data, as well as make comparisons across flu seasons, regions, age groups and a variety of other demographics.

National Institute for Occupational Safety and Health: Monthly surveillance data on the prevalence of health-related workplace absenteeism among full-time workers in the United States are available from NIOSH.

U.S. State and local influenza surveillance: Select a jurisdiction below to access the latest local influenza information. Public Health Agency of Canada:
The most up-to-date influenza information from Canada is available in Canada's weekly FluWatch report.

Public Health England:
The most up-to-date influenza information from the United Kingdom is available from Public Health England.

Any links provided to non-Federal organizations are provided solely as a service to our users. These links do not constitute an endorsement of these organizations or their programs by CDC or the Federal Government, and none should be inferred. CDC is not responsible for the content of the individual organization web pages found at these links.

A description of the CDC influenza surveillance system, including methodology and detailed descriptions of each data component is available on the surveillance methods page.

On This Page
Related Pages
View AllFluView
Back to Top
Past Weekly Report
Sources

Continued. https://www.cdc.gov/fluview/surveillance/2025-week-04.html


------------------------------------------------------------------

Screenshot 2025-01-31 at 2.54.46 PM.png


Screenshot 2025-01-31 at 2.55.22 PM.png


Screenshot 2025-01-31 at 2.58.35 PM.png
 
Last edited by a moderator:
February 7, 2025

Weekly US Influenza Surveillance Report: Key Updates for Week 5, ending February 1, 2025

What to know


Seasonal influenza activity remains elevated and continues to increase across the country.
Summary

Viruses

Clinical Lab 31.6% (Trend
IncreasingArrow.png
)
positive for influenza
this week. Public Health Lab Influenza A(H1N1)pdm09 and A(H3N2)
were the predominant viruses reported this week.


Illness

Outpatient Respiratory Illness 7.8% (Trend
IncreasingArrow.png
)
of visits to a health care provider this
week were for respiratory illness
(above baseline). Activity Map 2 moderate jurisdictions 45 high or very high jurisdictions FluSurv-NET 64.0 per 100,000
cumulative hospitalization rate National Healthcare Safety Network (NHSN) Hospital Respiratory Data 48,661 (Trend
IncreasingArrow.png
)
patients admitted to hospitals
with influenza this week. NCHS Mortality 2.0% (Trend
IncreasingArrow.png
)
of deaths attributed to influenza this week. Pediatric Deaths 10 influenza-associated deaths
were reported this week for
a total of 57 deaths this season.
All data are preliminary and may change as more reports are received.

Directional arrows indicate changes between the current week and the previous week. Additional information on the arrows can be found at the bottom of this page.

A description of the CDC influenza surveillance system, including methodology and detailed descriptions of each data component is available on the surveillance methods page.[SUP]1[/SUP]

Additional information on the current and previous influenza seasons for each surveillance component are available on FluView Interactive.


Key Points


• Seasonal influenza activity remains elevated and continues to increase across the country.

• During Week 5, of the 4,377 viruses reported by public health laboratories, 4,264 were influenza A and 113 were influenza B. Of the 3,458 influenza A viruses subtyped during Week 5, 1,857 (53.7%) were influenza A(H1N1)pdm09, 1,601 (46.3%) were A(H3N2), and 0 were A(H5).

• Outpatient respiratory illness is increasing and remains above baseline nationally for the tenth consecutive week. All 10 HHS regions are above their region-specific baseline.

• One human infection with an influenza A(H1N2) variant (A(H1N2)v) virus was reported.

• No new influenza A(H5) cases were reported to CDC this week. To date, human-to-human transmission of influenza A(H5) virus has not been identified in the United States.

• Ten pediatric deaths associated with seasonal influenza virus infection were reported this week, bringing the 2024-2025 season total to 57 pediatric deaths.

• CDC estimates that there have been at least 24 million illnesses, 310,000 hospitalizations, and 13,000 deaths from flu so far this season.

• CDC recommends that everyone ages 6 months and older get an annual influenza (flu) vaccine.[SUP]1[/SUP]

• There are prescription flu antiviral drugs that can treat flu illness; those should be started as early as possible and are especially important for patients at higher risk for severe illness.[SUP]2[/SUP]

• Influenza viruses are among several viruses contributing to respiratory disease activity. CDC is providing updated, integrated information about COVID-19, flu, and respiratory syncytial virus (RSV) activity on a weekly basis.
COVID-19, flu, and RSV activity


U.S. virologic surveillance


Nationally and in all 10 HHS regions, the percentage of respiratory specimens testing positive for influenza virus in clinical laboratories increased (change of ≥ 0.5 percentage points) compared to the previous week. Region 6 had the highest percent positivity (37.8%) and Region 10 had the lowest (26.1%). Influenza A(H1N1)pdm09 and A(H3N2) were the predominant viruses reported this week. For regional and state level data and age group distribution, please visit FluView Interactive. Viruses known to be associated with recent receipt of live attenuated influenza vaccine (LAIV) or found upon further testing to be a vaccine virus are not included, as they are not circulating influenza viruses.


Clinical Laboratories


The results of tests performed by clinical laboratories nationwide are summarized below. Data from clinical laboratories (the percentage of specimens tested that are positive for influenza virus) are used to monitor whether influenza activity is increasing or decreasing.
No. of specimens tested148,7471,840,292
No. of positive specimens (%)47,004 (31.6%)236,204 (12.8%)
Positive specimens by type
Influenza A45,157 (96.1%)228,221 (96.6%)
Influenza B1,847 (3.9%)7,982 (3.4%)
Public Health Laboratories


The results of tests performed by public health laboratories nationwide are summarized below. Data from public health laboratories are used to monitor the proportion of circulating influenza viruses that belong to each influenza subtype/lineage.
No. of specimens tested5,61462,760
No. of positive specimens4,37738,289
Positive specimens by type/subtype
Influenza A4,264 (97.4%)37,308 (97.4%)
Subtyping Performed3,458 (81.1%)33,023 (88.5%)
(H1N1)pdm091,857(53.7%)15,685 (47.5%)
H3N21,601 (46.3%)17,260 (52.3%)
H3N2v[SUP]†[/SUP]00
H5*078 (0.2%)
Subtyping not performed806 (18.9%)4,285 (11.5%)
Influenza B113 (2.6%)981 (2.6%)
Lineage testing performed56 (49.6%)474 (48.3%)
Yamagata lineage00
Victoria lineage56 (100%)474 (100%)
Lineage not performed57 (50.4%)507 (51.7%)
[SUB]*These data reflect specimens tested, and the number determined to be positive for influenza viruses at the public health labs (specimens tested is not the same as cases). The data do not reflect specimens tested only at CDC and could include more than one specimen tested per person. The guidance for influenza A(H5) virus testing recommends testing both a conjunctival and respiratory swab for people with conjunctivitis which has resulted in more specimens testing positive for influenza A(H5) virus than the number of human A(H5) cases. For more information on the number of people infected with A(H5) viruses, please visit the[/SUB] [SUB]"How CDC is monitoring influenza data among people to better understand the current avian influenza A (H5N1) situation"[/SUB]

[SUB][SUP]†[/SUP]When an influenza virus that normally circulates in swine (but not people) is detected in a person, it is called a "variant" influenza virus. Most human infections with variant influenza viruses occur following exposure to swine, but human-to-human transmission can occur. It is important to note that in most cases, variant influenza viruses have not shown the ability to spread easily and sustainably from human-to-human.[/SUB]


[SUB]*This graph reflects the number of specimens tested and the number determined to be positive for influenza viruses at the public health lab (specimens tested is not the same as cases). It does not reflect specimens tested only at CDC and could include more than one specimen tested per person. Specimens tested as part of routine influenza surveillance as well as those tested as part of targeted testing for people exposed to influenza A(H5) are included.[/SUB]


Additional virologic surveillance information for current and past seasons:


Surveillance Methods | FluView Interactive: National, Regional, and State Data or Age Data


Novel Influenza A Virus Infections


One human infection with influenza A(H1N2) variant (A(H1N2)v) virus was reported by the Iowa Department of Health and Human Services.

The patient is ≥18 years of age and sought health care during the week ending January 18, 2025 (Week 3), was hospitalized, and has recovered from their illness. An investigation by state public health officials did not identify direct or indirect swine contact by the patent. No illness was identified among the patient's close contacts. No human-to-human transmission has been identified associated with this case.

This is the first human infection with a variant influenza virus reported during the 2024-2025 season in the United States.

When an influenza virus that normally circulates in swine (but not people) is detected in a person, it is called a "variant" influenza virus. Most human infections with variant influenza viruses occur following exposure to swine, but human-to-human transmission can occur. It is important to note that in most cases, variant influenza viruses have not shown the ability to spread easily and sustainably from person to person. Additional information on influenza in swine, variant influenza virus infection in humans, and guidance to interact safely with swine can be found at www.cdc.gov/flu/swineflu/index.htm.

No new human infections with A(H5) were reported to CDC this week. An ongoing outbreak of H5N1 continues in domestic dairy cows and poultry, and monitoring for additional human cases is ongoing.

The CSTE position statement, which includes updated case definitions for confirmed, probable, and suspected cases is available at http://www.cste.org/resource/resmgr/position_statements_files_2023/24-ID-09_Novel_Influenza_A.pdf

An up-to-date human A(H5) case summary during the outbreak by state and exposure source is available at www.cdc.gov/bird-flu/situation-summary/index.html

Information about avian influenza is available at https://www.cdc.gov/flu/avianflu/index.htm.

Interim recommendations for Prevention, Monitoring, and Public Health Investigations are available at https://www.cdc.gov/bird-flu/prevention/hpai-interim-recommendations.html.

The latest case reports on avian influenza outbreaks in wild birds, commercial poultry, backyard or hobbyist flocks, and mammals in the United States are available from the USDA at https://www.aphis.usda.gov/aphis/ou...e-information/avian/avian-influenza/2022-hpai.


Additional information regarding human infections with novel influenza A viruses:


Surveillance Methods | FluView Interactive

Influenza Virus Characterization


CDC performs genetic and antigenic characterization of U.S. viruses submitted from state and local public health laboratories according to the Right Size Roadmap submission guidance. These data are used to compare how similar the currently circulating influenza viruses are to the reference viruses representing the current influenza vaccines. The data are also used to monitor evolutionary changes that continually occur in influenza viruses circulating in humans. CDC also tests susceptibility of circulating influenza viruses to antiviral medications including the neuraminidase inhibitors (oseltamivir, zanamivir, and peramivir) and the polymerase acidic protein (PA) endonuclease inhibitor baloxavir. The HA clade and subclades were assigned using Nextclade (https://clades.nextstrain.org).

CDC has genetically characterized 1,482 influenza viruses collected since September 29, 2024.
A/H1549
5a.2a329 (59.9%)C.1.9329 (59.9%)
5a.2a.1220 (40.1%)D14 (2.6%)
D.14 (0.7%)
D.353 (9.7%)
D.5149 (27.1%)
A/H3822
2a.3a5 (0.6%)G.1.3.15 (0.6%)
2a.3a.1817 (99.4%)J.11 (0.1%)
J.1.16 (0.7%)
J.2754 (91.7%)
J.2.113 (1.6%)
J.2.243 (5.2%)
B/Victoria111
3a.2111 (100%)C.31 (0.9%)
C.515 (13.5%)
C.5.163 (56.8%)
C.5.614 (12.6%)
C.5.718 (16.2%)
B/Yamagata0
Y30Y30
CDC antigenically characterizes influenza viruses by hemagglutination inhibition (HI) (H1N1pdm09, H3N2, and B/Victoria viruses) or neutralization-based HINT (H3N2 viruses) using antisera that ferrets make after being infected with reference viruses representing the 2024-2025 Northern Hemisphere recommended cell or recombinant-based vaccine viruses. Antigenic differences between viruses are determined by comparing how well the antibodies made against the vaccine reference viruses recognize the circulating viruses that have been grown in cell culture. Ferret antisera are useful because antibodies raised against a particular virus can often recognize small changes in the surface proteins of other viruses. In HI assays, viruses with similar antigenic properties have antibody titer differences of less than or equal to 4-fold when compared to the reference (vaccine) virus. In HINT, viruses with similar antigenic properties have antibody neutralization titer differences of less than or equal to 8-fold. Viruses selected for antigenic characterization are a subset of the recent genetically characterized viruses and are chosen based on the genetic changes in their surface proteins and may not be proportional to the number of such viruses circulating in the United States. Influenza A Viruses
  • A(H1N1)pdm09: 95 A(H1N1)pdm09 viruses were antigenically characterized by HI, and all were well-recognized (reacting at titers that were within 4-fold of the homologous virus titer) by ferret antisera to cell-grown A/Wisconsin/67/2022-like reference viruses representing the A(H1N1)pdm09 component for the cell- and recombinant-based influenza vaccines.
  • A(H3N2): 132 A(H3N2) viruses were antigenically characterized by HI or HINT, and 55 (41.7%) were well-recognized (reacting at titers that were within 4-fold of the homologous virus titer in HI or reacting at titers that were less than or equal to 8-fold of the homologous virus in HINT) by ferret antisera to cell-grown A/Massachusetts/18/2022-like reference viruses representing the A(H3N2) component for the cell- and recombinant-based influenza vaccines.
Influenza B Viruses
  • B/Victoria: 39 influenza B/Victoria-lineage virus were antigenically characterized by HI, and all were well-recognized (reacting at titers that were within 4-fold of the homologous virus titer) by ferret antisera to cell-grown B/Austria/1359417/2021-like reference viruses representing the B/Victoria component for the cell- and recombinant-based influenza vaccines.
  • B/Yamagata: No influenza B/Yamagata-lineage viruses were available for antigenic characterization.
Assessment of Virus Susceptibility to Antiviral Medications


CDC assesses susceptibility of influenza viruses to the antiviral medications including the neuraminidase inhibitors (oseltamivir, zanamivir, and peramivir) and the PA endonuclease inhibitor baloxavir using next generation sequence analysis supplemented by laboratory assays. Information about antiviral susceptibility test methods can be found at U.S. Influenza Surveillance: Purpose and Methods.

Viruses collected in the U.S. since September 29, 2024, were tested for antiviral susceptibility as follows:
Neuraminidase InhibitorsOseltamivirViruses Tested1,462551806105
Reduced Inhibition1 (<0.1%)1 (0.2%)00
Highly Reduced Inhibition2 (0.1%)2 (0.4%)00
PeramivirViruses Tested1,462551806105
Reduced Inhibition0000
Highly Reduced Inhibition2 (0.1%)2 (0.4%)00
ZanamivirViruses Tested1,462551806105
Reduced Inhibition0000
Highly Reduced Inhibition0000
PA Cap-Dependent Endonuclease InhibitorBaloxavirViruses Tested1,387485798104
Decreased Susceptibility0000
Two A(H1N1)pdm09 viruses had NA-H275Y amino acid substitution conferring highly reduced inhibition by oseltamivir and peramivir. One A(H1N1)pdm09 virus had NA-I223V and NA-S247N amino acid substitutions and showed reduced inhibition by oseltamivir.

High levels of resistance to the adamantanes (amantadine and rimantadine) persist among influenza A(H1N1)pdm09 and influenza A(H3N2) viruses (the adamantanes are not effective against influenza B viruses). Therefore, use of these antivirals for treatment and prevention of influenza A virus infection is not recommended and data from adamantane resistance testing are not presented.

Outpatient and Emergency Department Illness Surveillance

Outpatient respiratory illness visits


The U.S. Outpatient Influenza-like Illness Surveillance Network (ILINet) monitors outpatient visits for respiratory illness referred to as influenza-like illness [ILI (fever plus cough or sore throat)], not laboratory-confirmed influenza, and will therefore capture respiratory illness visits due to infection with any pathogen that can present with similar symptoms, including influenza virus, SARS-CoV-2, and RSV. It is important to evaluate syndromic surveillance data, including that from ILINet, in the context of other sources of surveillance data to obtain a complete and accurate picture of influenza, SARS-CoV-2, and other respiratory virus activity.

Nationally, during Week 5, 7.8% of patient visits reported through ILINet were due to respiratory illness that included fever plus a cough or sore throat, also referred to as ILI. This week's percentage increased (change of > 0.1 percentage points) compared to Week 4 and remains above the national baseline of 3.0% for the tenth consecutive week. The percentage of visits for ILI increased (change of > 0.1 percentage points) in regions 1, 3, 4, 5, 6, 7, and 10 and remained stable in regions 2, 8, and 9 this week compared to last. All regions remain above their respective baselines. Multiple respiratory viruses are co-circulating, and the relative contribution of influenza virus infections to ILI varies by location.

Outpatient respiratory illness visits by age group


About 70% of ILINet participants provide both the number of patient visits for respiratory illness and the total number of patient visits for the week broken out by age group. Based on these data, the percentage of visits for respiratory illness increased (change of > 0.1 percentage point) in all age groups (0-4 years, 5-24 years, 25-49 years, 50-64 years, and 65+ years) in Week 5 compared to Week 4.

Outpatient respiratory illness activity map


Data collected in ILINet are used to produce a measure of ILI activity* by state/jurisdiction and Core Based Statistical Areas (CBSA).
Week 5
(Week ending
Feb. 1, 2025)
Week 4
(Week ending
Jan. 25, 2025)
Week 5
(Week ending
Feb. 1, 2025)
Week 4
(Week ending
Jan. 25, 2025)
Very High342912287
High1115229194
Moderate24129139
Low22112153
Minimal54109131
Insufficient Data11228225

*Data collected in ILINet may disproportionally represent certain populations within a jurisdiction or CBSA, and therefore, may not accurately depict the full picture of influenza activity for the entire jurisdiction or CBSA. Differences in the data presented here by CDC and independently by some health departments likely represent differing levels of data completeness with data presented by the health department likely being the more complete. Additional information about medically attended visits for ILI for current and past seasons:


Surveillance Methods | FluView Interactive: National, Regional, and State Data or ILI Activity Map


National Syndromic Surveillance System (NSSP)


The overall percentage of emergency department (ED) visits with a discharge diagnosis of influenza reported in NSSP was 8.0% during Week 5, an increase (change of > 0.1 percentage point) compared to the previous week. The percentage of ED visits with influenza discharge diagnoses increased in HHS regions 1, 3, 4, 5, 6, 7, 8, 9 and 10 and remained stable (change of ≤ 0.1 percentage point) in Region 2. The percentage also increased in all age groups from Week 4 to Week 5 except the 5-17 years age group, which remained stable. RegionNationalRegion 1Region 2Region 3Region 4Region 5Region 6Region 7Region 8Region 9Region 10
Season2022-20232023-2024 & 2024-2025 Skip Over Chart Container
02.0%4.0%6.0%8.0%10.0%12.0%14.0%Percent of Emergency Department Visits for InfluenzaWeek 41 of 2023Week 45 of 2023Week 49 of 2023Week 1 of 2024Week 5 of 2024Week 9 of 2024Week 13 of 2024Week 17 of 2024Week 21 of 2024Week 25 of 2024Week 29 of 2024Week 33 of 2024Week 37 of 2024Week 41 of 2024Week 45 of 2024Week 49 of 2024Week 1 of 2025Week 5 of 2025

Age Group


All ages
0-4 years
5-17 years
18-64 years
65+ Skip Data Table
Data Table Download Data (CSV) Skipped data table.


Additional information about emergency department visits for flu for current and past seasons:‎‎‎


Surveillance Methods | Emergency Department Visits for COVID-19, flu, and RSV

Hospitalization surveillance

FluSurv-Net


The Influenza Hospitalization Surveillance Network (FluSurv-NET) conducts population-based surveillance for laboratory-confirmed influenza-related hospitalizations in select counties in 14 states and represents approximately 9% of the U.S. population. FluSurv-NET hospitalization data are preliminary. As data are received each week, prior case counts and rates are updated accordingly.

A total of 19,609 laboratory-confirmed influenza-associated hospitalizations were reported by FluSurv-NET sites between October 1, 2024, and February 1, 2025. The weekly hospitalization rate observed during Week 5 was 9.2 per 100,000 population. The weekly hospitalization rates observed during Week 1 and Week 4 (10.2 per 100,000 population) are tied with the 2017-2018 season as the highest peak weekly rate observed, across all seasons since 2010-2011. The cumulative hospitalization rate observed in Week 5 was 64.0 per 100,000 population.

Among all hospitalizations, 19,175 (97.8%) were associated with influenza A virus, 340 (1.7%) with influenza B virus, 16 (0.1%) with influenza A virus and influenza B virus co-infection, and 78 (0.4%) with influenza virus for which the type was not determined. Among those with influenza A subtype information, 2,177 (52.5%) were A(H1N1)pdm09 and 1,970 (47.5%) were A(H3N2).

When examining rates by age, the highest cumulative hospitalization rate per 100,000 population was among adults aged 65 years and older (196.9), followed by adults aged 50-64 years (74.0), children aged 0-4 years (55.7), adults aged 18-49 (27.8), and children aged 5-17 (19.6).

When examining age-adjusted rates by race and ethnicity, the highest cumulative hospitalization rate per 100,000 population was among non-Hispanic Black persons (95.8), followed by American Indian/Alaska Native persons (85.3), Hispanic persons (54.1), non-Hispanic White persons (49.3), and Asian/Pacific Islander persons (40.5).

Among 1,907 hospitalized adults with information on underlying medical conditions, 95.1% had at least one reported underlying medical condition; the most commonly reported were hypertension, cardiovascular disease, metabolic disease, and obesity. Among 991 hospitalized women of childbearing age (15-49 years) with information on pregnancy status, 30.5% were pregnant. Among 379 hospitalized children with information on underlying medical conditions, 52.8% had at least one reported underlying medical condition; the most commonly reported was asthma, followed by obesity and neurologic disease.


[SUB]**In this figure, weekly rates for all seasons prior to the 2024-2025 season reflect end-of-season rates. For the 2024-2025 season, rates for recent hospital admissions are subject to reporting delays and are shown as a dashed line for the current season. As hospitalization data are received each week, prior case counts and rates are updated accordingly.[/SUB]


Additional FluSurv-NET hospitalization surveillance information for current and past seasons and additional age groups:


Surveillance Methods | FluView Interactive: Rates by Age, Sex, and Race/Ethnicity or Data on Patient Characteristics | RESP-NET Interactive


National Healthcare Safety Network (NHSN) Hospital Respiratory Data


Hospitals report to NHSN the weekly number of patients with laboratory-confirmed influenza who were admitted to the hospital. Nationally, during Week 5, 48,661 laboratory confirmed influenza-associated hospitalizations were reported. This week's influenza-associated hospitalizations increased (change of > 5%) compared to Week 4.

The weekly hospital admission rate observed in Week 5 was 14.4 per 100,000. The weekly rate of hospital admissions in all 10 HHS regions ranged from 8.8 (Region 10) to 19.5 (Region 3). The weekly rate of hospital admissions increased in regions 1, 3, 4, 5, 6, 7, 8, 9 and 10 and remained stable in Region 2.

When examining rates by age for Week 5, all age groups increased compared to the previous week. The highest hospital admission rate per 100,000 population was among those 75+ years (62.8), followed by 65-74 years (29.8), and 50-64 years (15.7). View Larger
NHSN05.gif
Additional NHSN Hospital Respiratory Data information:


Surveillance Methods | Additional Data | FluView Interactive

Mortality surveillance

National Center for Health Statistics (NCHS) Mortality Surveillance


Based on NCHS mortality surveillance data available on February 6, 2025, 2.0% of the deaths that occurred during the week ending February 1, 2025 (Week 5), were due to influenza. This percentage increased (> 0.1 percentage point change) compared to Week 4. The data presented are preliminary and may change as more data are received and processed.

Additional pneumonia, influenza and COVID-19 mortality surveillance information for current and past seasons:


Surveillance Methods | FluView Interactive Influenza-Associated Pediatric Mortality


Ten influenza-associated pediatric deaths occurring during the 2024-2025 season were reported to CDC during Week 5. The deaths occurred between Week 52 of 2024 (the week ending December 28, 2024) and Week 5 of 2025 (the week ending February 1, 2025). Eight deaths were associated with influenza A viruses. Seven of the influenza A viruses had subtyping performed; four were A(H1N1) viruses and three were A(H3N2) viruses. Two deaths were associated with influenza B viruses with no lineage determined.

A total of 57 influenza-associated pediatric deaths occurring during the 2024-2025 season have been reported to CDC.

Additional pediatric mortality surveillance information for current and past seasons:


Surveillance Methods | FluView Interactive

Additional National and International Influenza Surveillance Information

Indicators Status by System


Increasing:
IncreasingArrow.png

Decreasing:
DecreasingArrow.png

Stable:
StableArrow.png


Clinical Labs: Up or down arrows indicate a change of greater than or equal to 0.5 percentage points in the percent of specimens positive for influenza compared to the previous week.
Outpatient Respiratory Illness (ILINet): Up or down arrows indicate a change of greater than 0.1 percentage points in the percent of visits due to respiratory illness (ILI) compared to the previous week.
NHSN Hospitalizations: Up or down arrows indicate change of greater than or equal to 5% of the number of patients admitted with laboratory-confirmed influenza compared to the previous week.
NCHS Mortality: Up or down arrows indicate change of greater than 0.1 percentage points of the percent of deaths due to influenza compared to the previous week.


Additional surveillance information


FluView Interactive: FluView includes enhanced web-based interactive applications that can provide dynamic visuals of the influenza data collected and analyzed by CDC. These FluView Interactive applications allow people to create customized, visual interpretations of influenza data, as well as make comparisons across flu seasons, regions, age groups and a variety of other demographics.

National Institute for Occupational Safety and Health: Monthly surveillance data on the prevalence of health-related workplace absenteeism among full-time workers in the United States are available from NIOSH.

U.S. State and local influenza surveillance: Select a jurisdiction below to access the latest local influenza information. Public Health Agency of Canada:
The most up-to-date influenza information from Canada is available in Canada's weekly FluWatch report.

Public Health England:
The most up-to-date influenza information from the United Kingdom is available from Public Health England.

Any links provided to non-Federal organizations are provided solely as a service to our users. These links do not constitute an endorsement of these organizations or their programs by CDC or the Federal Government, and none should be inferred. CDC is not responsible for the content of the individual organization web pages found at these links.

A description of the CDC influenza surveillance system, including methodology and detailed descriptions of each data component is available on the surveillance methods page.


On This Page
Related Pages
View AllFluView
Back to Top
Past Weekly Report
Sources

https://www.cdc.gov/fluview/surveillance/2025-week-05.html
 
Weekly US Influenza Surveillance Report: Key Updates for Week 6, ending February 8, 2025

What to know


Seasonal influenza activity remains elevated and is higher than it has been all season.

Summary

Viruses

Clinical Lab 31.6% (Trend
StableArrow.png
)
positive for influenza
this week. Public Health Lab Influenza A(H1N1)pdm09 and A(H3N2)
were the predominant viruses reported this week.

Illness

Outpatient Respiratory Illness 7.8% (Trend
StableArrow.png
)
of visits to a health care provider this
week were for respiratory illness
(above baseline). Activity Map 2 moderate jurisdictions 46 high or very high jurisdictions FluSurv-NET 78.1 per 100,000
cumulative hospitalization rate National Healthcare Safety Network (NHSN) Hospital Respiratory Data 50,382 (Trend
StableArrow.png
)
patients admitted to hospitals
with influenza this week. NCHS Mortality 2.6% (Trend
IncreasingArrow.png
)
of deaths attributed to influenza this week. Pediatric Deaths 11 influenza-associated deaths
were reported this week for
a total of 68 deaths this season.
All data are preliminary and may change as more reports are received.

Directional arrows indicate changes between the current week and the previous week. Additional information on the arrows can be found at the bottom of this page.

A description of the CDC influenza surveillance system, including methodology and detailed descriptions of each data component is available on the surveillance methods page.[SUP]1[/SUP]

Additional information on the current and previous influenza seasons for each surveillance component are available on FluView Interactive.

Key Points
  • Nationally, seasonal influenza activity remains elevated and is higher than or similar to the highest it has been all season for each indicator reported in FluView. In addition, the percent of specimens testing positive for influenza at clinical labs and the rate of laboratory confirmed influenza associated hospitalizations reported to FluSurvNet are higher than any peak week going back to the 2015-2016 and 2010-2011 seasons, respectively
  • Based on data available this week, this season is now classified as a high severity season overall and for all age groups (children, adults, older adults) for the first time since 2017-2018.
  • During Week 6, of the 4,214 viruses reported by public health laboratories, 4,079 were influenza A and 135 were influenza B. Of the 3,146 influenza A viruses subtyped during Week 6, 1,742 (55.4%) were influenza A(H1N1)pdm09, 1,404 (44.6%) were A(H3N2), and zero were A(H5).
  • One new avian influenza A(H5) case was reported to CDC this week. To date, human-to-human transmission of avian influenza A(H5) virus (H5 bird flu) has not been identified in the United States.
  • Outpatient respiratory illness is stable compared to last week but is higher than it has been all season and is above the baseline nationally for the eleventh consecutive week. All 10 HHS regions are above their region-specific baselines.
  • The week ending January 25, 2024, was the first time that the percent of deaths for influenza (1.7%) was higher than the percent of deaths for COVID-19. The percent of deaths for influenza has continued to increase and is 2.6% for the week ending February 8, 2025.
  • Eleven pediatric deaths associated with seasonal influenza virus infection were reported this week, bringing the 2024-2025 season total to 68 pediatric deaths.
  • CDC estimates that there have been at least 29 million illnesses, 370,000 hospitalizations, and 16,000 deaths from flu so far this season.
  • CDC recommends that everyone ages 6 months and older get an annual influenza (flu) vaccine.[SUP]1[/SUP]
  • There are prescription flu antiviral drugs that can treat flu illness; those should be started as early as possible and are especially important for patients at higher risk for severe illness.[SUP]2[/SUP]
  • Influenza viruses are among several viruses contributing to respiratory disease activity. CDC is providing updated, integrated information about COVID-19, flu, and respiratory syncytial virus (RSV) activity on a weekly basis.

COVID-19, flu, and RSV activity


U.S. virologic surveillance


Nationally, the percentage of respiratory specimens testing positive for influenza virus in clinical laboratories remained stable (change ≤ 0.5 percentage points) compared to the previous week but is higher than it has been all season. Percent positivity is increasing in HHS regions 1, 2, 3, 5, 7, and 10, and decreasing in HHS regions 4, 6, 8, and 9. Region 5 had the highest percent positivity (35.9%), and Region 4 had the lowest (25.9%). Influenza A(H1N1)pdm09 and A(H3N2) were the predominant viruses reported this week. For regional and state level data and age group distribution, please visit FluView Interactive. Viruses known to be associated with recent receipt of live attenuated influenza vaccine (LAIV) or found upon further testing to be a vaccine virus are not included, as they are not circulating influenza viruses. Clinical Laboratories


The results of tests performed by clinical laboratories nationwide are summarized below. Data from clinical laboratories (the percentage of specimens tested that are positive for influenza virus) are used to monitor whether influenza activity is increasing or decreasing.
No. of specimens tested150,0062,010,657
No. of positive specimens (%)47,328 (31.6%)289,283 (14.4%)
Positive specimens by type
Influenza A44,757 (94.6%)278,541 (96.3%)
Influenza B2,571 (5.4%)10,741 (3.7%)


Public Health Laboratories


The results of tests performed by public health laboratories nationwide are summarized below. Data from public health laboratories are used to monitor the proportion of circulating influenza viruses that belong to each influenza subtype/lineage.
No. of specimens tested5,46973,784
No. of positive specimens4,21446,817
Positive specimens by type/subtype
Influenza A4,079 (96.8%)45,582 (97.4%)
Subtyping Performed3,146 (77.1%)40,278 (88.4%)
(H1N1)pdm091,742 (55.4%)19,511 (48.4%)
H3N21,404 (44.6%)20,688 (51.4%)
H3N2v00
H5*079 (0.2%)
Subtyping not performed933 (22.9%)5,304 (11.6%)
Influenza B135 (3.2%)1,235 (2.6%)
Lineage testing performed22 (16.3%)572 (46.3%)
Yamagata lineage00
Victoria lineage22 (100%)572 (100%)
Lineage not performed113 (83.7%)663 (53.7%)
[SUB]*This data reflects specimens tested and the number determined to be positive for influenza viruses at the public health labs (specimens tested is not the same as cases). It does not reflect specimens tested only at CDC and could include more than one specimen tested per person. The guidance for influenza A/H5 testing recommends testing both a conjunctival and respiratory swab for people with conjunctivitis which has resulted in more specimens testing positive for influenza A/H5 than the number of human H5 cases. For more information on the number of people infected with A/H5, please visit the [/SUB][SUB]"How CDC is monitoring influenza data among people to better understand the current avian influenza A (H5N1) situation"[/SUB]


[SUP]This graph reflects the number of specimens tested and the number determined to be positive for influenza viruses at the public health lab (specimens tested is not the same as cases). It does not reflect specimens tested only at CDC and could include more than one specimen tested per person. Specimens tested as part of routine influenza surveillance as well as those tested as part of targeted testing for people exposed to influenza A(H5) are included.[/SUP]

Additional virologic surveillance information for current and past seasons:


Surveillance Methods | FluView Interactive: National, Regional, and State Data or Age Data

Novel Influenza A Virus


One confirmed human infection with avian influenza A(H5) virus was reported to CDC this week. To date, human-to-human transmission of avian influenza A(H5) virus has not been identified in the United States.

The case was reported by the Nevada Department of Public Health and occurred in a worker aged ≥18 years at a commercial dairy cattle farm in an area where highly pathogenic avian influenza (HPAI) A(H5N1) viruses had been detected in cows. This individual developed conjunctivitis, which they reported to the local health department. Specimens were collected from the individual and initially tested at the state public health laboratory using the CDC influenza A(H5) assay before being sent to CDC for further testing. Avian influenza A(H5N1) virus was confirmed at CDC. This is the first human influenza A(H5) case in Nevada.

Notification to WHO of this case was completed per International Health Regulations (IHR). More information regarding IHR can be found at http://www.who.int/topics/international_health_regulations/en/.

The CSTE position statement, which includes updated case definitions for confirmed, probable, and suspected cases is available at http://www.cste.org/resource/resmgr/position_statements_files_2023/24-ID-09_Novel_Influenza_A.pdf

An up-to-date human case summary during the 2024 outbreak by state and exposure source is available at www.cdc.gov/bird-flu/situation-summary/index.html

Information about avian influenza is available at https://www.cdc.gov/flu/avianflu/index.htm.

Interim recommendations for Prevention, Monitoring, and Public Health Investigations are available at https://www.cdc.gov/bird-flu/prevention/hpai-interim-recommendations.html.

The latest case reports on avian influenza outbreaks in wild birds, commercial poultry, backyard or hobbyist flocks, and mammals in the United States are available from the USDA at https://www.aphis.usda.gov/aphis/ou...e-information/avian/avian-influenza/2022-hpai.

Additional information regarding human infections with novel influenza A viruses:


Surveillance Methods | FluView Interactive

Influenza Virus Characterization


CDC performs genetic and antigenic characterization of U.S. viruses submitted from state and local public health laboratories according to the Right Size Roadmap submission guidance. These data are used to compare how similar the currently circulating influenza viruses are relative to the reference viruses representing the current influenza vaccines. The data are also used to monitor evolutionary changes that continually occur in influenza viruses circulating in humans. CDC also tests susceptibility of circulating influenza viruses to antiviral medications including the neuraminidase inhibitors (oseltamivir, zanamivir, and peramivir) and the polymerase acidic protein (PA) endonuclease inhibitor baloxavir. The HA clade and subclades were assigned using Nextclade (https://clades.nextstrain.org).

CDC has genetically characterized 1,687 influenza viruses collected since September 29, 2024.
A/H1632
5a.2a374 (59.2%)C.1.9374 (59.2%)
5a.2a.1258 (40.8%)D19 (3.0%)
D.14 (0.6%)
D.382 (13.0%)
D.5153 (24.2%)
A/H3928
2a.3a5 (0.5%)G.1.3.15 (0.5%)
2a.3a.1923 (99.5%)J.11 (0.1%)
J.1.16 (0.6%)
J.2847 (91.3%)
J.2.121 (2.3%)
J.2.248 (5.2%)
B/Victoria127
3a.2127 (100%)C.32 (1.6%)
C.515 (11.8%)
C.5.170 (55.1%)
C.5.614 (11.0%)
C.5.726 (20.5%)
B/Yamagata0
Y30Y30
CDC antigenically characterizes influenza viruses by hemagglutination inhibition (HI) (H1N1pdm09, H3N2, B/Victoria, and B/Yamagata viruses) or neutralization-based HINT (H3N2 viruses) using antisera that ferrets make after being infected with reference viruses representing the 2023-2024 Northern Hemisphere recommended cell or recombinant-based vaccine viruses. Antigenic differences between viruses are determined by comparing how well the antibodies made against the vaccine reference viruses recognize the circulating viruses that have been grown in cell culture. Ferret antisera are useful because antibodies raised against a particular virus can often recognize small changes in the surface proteins of other viruses. In HI assays, viruses with similar antigenic properties have antibody titer differences of less than or equal to 4-fold when compared to the reference (vaccine) virus. In HINT, viruses with similar antigenic properties have antibody neutralization titer differences of less than or equal to 8-fold. Viruses selected for antigenic characterization are a subset representing the genetic changes in the surface proteins seen in genetically characterized viruses.

Influenza A Viruses
  • A (H1N1)pdm09: 103 A(H1N1)pdm09 viruses were antigenically characterized by HI, and 103 (100%) were well-recognized (reacting at titers that were within 4-fold of the homologous virus titer) by ferret antisera to cell-grown A/Wisconsin/67/2022-like reference viruses representing the A(H1N1)pdm09 component for the cell- and recombinant-based influenza vaccines.
  • A(H3N2): 169 A(H3N2) viruses were antigenically characterized by HI or HINT, and 86 (50.9%) were well-recognized (reacting at titers that were within 4-fold of the homologous virus titer in HI or reacting at titers that were less than or equal to 8-fold of the homologous virus in HINT) by ferret antisera to cell-grown A/Massachusetts/18/2022-like reference viruses representing the A(H3N2) component for the cell- and recombinant-based influenza vaccines.
Influenza B Viruses
  • B/Victoria: 51 influenza B/Victoria-lineage virus were antigenically characterized by HI, and all were well-recognized (reacting at titers that were within 4-fold of the homologous virus titer) by ferret antisera to cell-grown B/Austria/1359417/2021-like reference viruses representing the B/Victoria component for the cell- and recombinant-based influenza vaccines.
  • B/Yamagata: No influenza B/Yamagata-lineage viruses were available for antigenic characterization.
Assessment of Virus Susceptibility to Antiviral Medications


CDC assesses susceptibility of influenza viruses to the antiviral medications including the neuraminidase inhibitors (oseltamivir, zanamivir, and peramivir) and the PA endonuclease inhibitor baloxavir using next generation sequence analysis supplemented by laboratory assays. Information about antiviral susceptibility test methods can be found at U.S. Influenza Surveillance: Purpose and Methods.

Viruses collected in the U.S. since September 29, 2024, were tested for antiviral susceptibility as follows:
Neuraminidase InhibitorsOseltamivirViruses Tested1,627612892123
Reduced Inhibition1 (<0.1%)1 (0.2%)00
Highly Reduced Inhibition3 (0.2%)3 (0.5%)00
PeramivirViruses Tested1,627612892123
Reduced Inhibition0000
Highly Reduced Inhibition3 (0.2%)3 (0.5%)00
ZanamivirViruses Tested1,627612892123
Reduced Inhibition1 (0.02%)000
Highly Reduced Inhibition0 (0%)000
PA Cap-Dependent Endonuclease InhibitorBaloxavirViruses Tested1,541538886117
Decreased Susceptibility0000
Three A(H1N1)pdm09 viruses had NA-H275Y amino acid substitution conferring highly reduced inhibition by oseltamivir and peramivir. One A(H1N1)pdm09 virus had NA-I223V and NA-S247N amino acid substitutions and showed reduced inhibition by oseltamivir.

High levels of resistance to the adamantanes (amantadine and rimantadine) persist among influenza A(H1N1)pdm09 and influenza A(H3N2) viruses (the adamantanes are not effective against influenza B viruses). Therefore, use of these antivirals for treatment and prevention of influenza A virus infection is not recommended and data from adamantane resistance testing are not presented.

Outpatient and Emergency Department Illness Surveillance

Outpatient respiratory illness visits


The U.S. Outpatient Influenza-like Illness Surveillance Network (ILINet) monitors outpatient visits for respiratory illness referred to as influenza-like illness [ILI (fever plus cough or sore throat)], not laboratory-confirmed influenza, and will therefore capture respiratory illness visits due to infection with any pathogen that can present with similar symptoms, including influenza virus, SARS-CoV-2, and RSV. It is important to evaluate syndromic surveillance data, including that from ILINet, in the context of other sources of surveillance data to obtain a complete and accurate picture of influenza, SARS-CoV-2, and other respiratory virus activity.

Nationally, during Week 6, 7.8% of patient visits reported through ILINet were due to respiratory illness that included fever plus a cough or sore throat, also referred to as ILI. This week's percentage remained stable (change of ≤ 0.1 percentage points) compared to Week 5 but is higher than it has been all season and remains above the national baseline of 3.0% for the eleventh consecutive week. The percentage of visits for ILI increased (change of > 0.1 percentage points) in HHS regions 1, 3, 5, 7, 8, and 10, decreased in HHS regions 2, 4, and 6, and remained stable in Region 9 this week compared to last. All regions remain above their respective baselines. Multiple respiratory viruses are co-circulating, and the relative contribution of influenza virus infections to ILI varies by location.

Outpatient respiratory illness visits by age group


About 70% of ILINet participants provide both the number of patient visits for respiratory illness and the total number of patient visits for the week broken out by age group. Based on these data, the percentage of visits for respiratory illness increased (change of > 0.1 percentage point) in the 0-4 years, 5-24 years, and 65+ years and remained stable (change of ≤ 0.1 percentage point) in the 25-49 years and 50-64 years in Week 6 compared to Week 5.

Outpatient respiratory illness activity map


Data collected in ILINet are used to produce a measure of ILI activity* by state/jurisdiction and Core Based Statistical Areas (CBSA). The state of Vermont is working with CDC to ensure that appropriate data are being used to calculate the state's activity level. Vermont's activity level will be reported again after the issue is resolved.
Week 6
(Week ending
Feb. 8, 2025)
Week 5
(Week ending
Feb. 1, 2025)
Week 6
(Week ending
Feb. 8, 2025)
Week 5
(Week ending
Feb. 1, 2025)
Very High3734125123
High911254228
Moderate23113130
Low31117114
Minimal3593111
Insufficient Data11227223


*Data collected in ILINet may disproportionally represent certain populations within a jurisdiction or CBSA, and therefore, may not accurately depict the full picture of influenza activity for the entire jurisdiction or CBSA. Differences in the data presented here by CDC and independently by some health departments likely represent differing levels of data completeness with data presented by the health department likely being the more complete.

Additional information about medically attended visits for ILI for current and past seasons:


Surveillance Methods | FluView Interactive: National, Regional, and State Data or ILI Activity Map

National Syndromic Surveillance System (NSSP)


The overall percentage of emergency department (ED) visits with a discharge diagnosis of influenza reported in NSSP was 7.9% during Week 6, a slight decrease (change of > 0.1 percentage point) compared to the previous week. The percentage of ED visits with influenza discharge diagnoses decreased in HHS regions 2, 4, 6, and 9, and increased (change of > 0.1 percentage point) in HHS regions 1, 3, 5, 7, 8, and 10. The percentage also decreased in the 5-17 and 18-64 years age groups and remained stable (change of ≤ 0.1 percentage point) in the 0-4 and 65+ years age groups. RegionNationalRegion 1Region 2Region 3Region 4Region 5Region 6Region 7Region 8Region 9Region 10
Season2022-20232023-2024 & 2024-2025 Skip Over Chart Container
02.0%4.0%6.0%8.0%10.0%12.0%14.0%Percent of Emergency Department Visits for InfluenzaWeek 42 of 2023Week 46 of 2023Week 50 of 2023Week 2 of 2024Week 6 of 2024Week 10 of 2024Week 14 of 2024Week 18 of 2024Week 22 of 2024Week 26 of 2024Week 30 of 2024Week 34 of 2024Week 38 of 2024Week 42 of 2024Week 46 of 2024Week 50 of 2024Week 2 of 2025Week 6 of 2025

Age Group


All ages
0-4 years
5-17 years
18-64 years
65+ Skip Data Table
Data Table Download Data (CSV) Skipped data table.

Additional information about emergency department visits for flu for current and past seasons:‎‎‎


Surveillance Methods | Emergency Department Visits for COVID-19, flu, and RSV

Hospitalization surveillance

FluSurv-Net


The Influenza Hospitalization Surveillance Network (FluSurv-NET) conducts population-based surveillance for laboratory-confirmed influenza-related hospitalizations in select counties in 14 states and represents approximately 9% of the U.S. population. FluSurv-NET hospitalization data are preliminary. As data are received each week, prior case counts and rates are updated accordingly.

A total of 23,917 laboratory-confirmed influenza-associated hospitalizations were reported by FluSurv-NET sites between October 1, 2024, and February 8, 2025. The weekly hospitalization rate observed during Week 6 was 9.6 per 100,000 population. The weekly hospitalization rate observed during Week 5 (12.8 per 100,000 population) is the highest peak weekly rate observed across all seasons since 2010-2011. The cumulative hospitalization rate observed in Week 6 was 78.1 per 100,000 population, which is the highest cumulative hospitalization rate for Week 6 across all seasons since 2010-11.

Among all hospitalizations, 23,399 (97.8%) were associated with influenza A virus, 387 (1.6%) with influenza B virus, 20 (0.1%) with influenza A virus and influenza B virus co-infection, and 111 (0.5%) with influenza virus for which the type was not determined. Among those with influenza A subtype information, 2,921 (53.5%) were A(H1N1) pdm09 and 2,539 (46.5%) were A(H3N2).

When examining rates by age, the highest cumulative hospitalization rate per 100,000 population was among adults aged 65 years and older (241.1), followed by adults aged 50-64 years (92.0), children aged 0-4 years (66.4), adults aged 18-49 (33.2), and children aged 5-17 (23.4).

When examining age-adjusted rates by race and ethnicity, the highest cumulative hospitalization rate per 100,000 population was among non-Hispanic Black persons (115.1), followed by American Indian/Alaska Native persons (102.9), Hispanic persons (63.4), non-Hispanic White persons (59.5), and Asian/Pacific Islander persons (47.8).

Among 2,192 hospitalized adults with information on underlying medical conditions, 95.1% had at least one reported underlying medical condition; the most commonly reported were hypertension, cardiovascular disease, metabolic disease, and obesity. Among 1,161 hospitalized women of childbearing age (15-49 years) with information on pregnancy status, 28.9% were pregnant. Among 379 hospitalized children with information on underlying medical conditions, 53.1% had at least one reported underlying medical condition; the most commonly reported was asthma, followed by neurologic disease and obesity.


[SUB]**In this figure, weekly rates for all seasons prior to the 2023-2024 season reflect end-of-season rates. For the 2023-2024 season, rates for recent hospital admissions are subject to reporting delays and are shown as a dashed line for the current season. As hospitalization data are received each week, prior case counts and rates are updated accordingly.[/SUB]

Additional FluSurv-NET hospitalization surveillance information for current and past seasons and additional age groups:


Surveillance Methods | FluView Interactive: Rates by Age, Sex, and Race/Ethnicity or Data on Patient Characteristics | RESP-NET Interactive

National Healthcare Safety Network (NHSN) Hospital Respiratory Data


Hospitals report to NHSN the weekly number of patients with laboratory-confirmed influenza who were admitted to the hospital. Nationally, during Week 6, 50,382 laboratory confirmed influenza-associated hospitalizations were reported. This week's influenza-associated hospitalizations remained stable (change of < 5%) compared to Week 5 and is higher than it has been all season.

The weekly hospital admission rate observed in Week 6 was 14.9 per 100,000. The weekly rate of hospital admissions in all 10 HHS regions ranged from 8.8 (Region 10) to 19.5 (Region 3). The weekly rate of hospital admissions increased in HHS regions 1, 3, 5, 8, and 10, remained stable in HHS regions 2, 4, and 7, and decreased in HHS regions 6 and 9.

When examining rates by age for Week 6, the 0-4 age group increased, the 18-49 age group decreased, and all other age groups remained stable compared to the previous week. The highest hospital admission rate per 100,000 population was among those 75+ years (65.1), followed by 65-74 years (31.1), and 50-64 years (16.2). View Larger
NHSN06.gif
NHSN week 6 Additional NHSN Hospitalization Surveillance information:


Surveillance Methods | Additional Data | FluView Interactive

Mortality surveillance

National Center for Health Statistics (NCHS)


Based on NCHS mortality surveillance data available on February 13, 2025, 2.6% of the deaths that occurred during the week ending February 8, 2025 (Week 6), were due to influenza. This percentage increased (> 0.1 percentage point change) compared to Week 5 and is higher than it has been all season. The data presented are preliminary and may change as more data are received and processed.

Additional pneumonia, influenza and COVID-19 mortality surveillance information for current and past seasons:


Surveillance Methods | FluView Interactive

Influenza-Associated Pediatric Mortality


Eleven influenza-associated pediatric deaths occurring during the 2024-2025 season were reported to CDC during Week 6. The deaths occurred between Week 51 of 2024 (the week ending December 21, 2024) and Week 6 of 2025 (the week ending February 8, 2025). Ten deaths were associated with influenza A viruses. Six of the influenza A viruses had subtyping performed; three were A(H1N1) viruses and three were A(H3N2) viruses. One death was associated with an influenza B/Victoria virus.

A total of 68 influenza-associated pediatric deaths occurring during the 2024-2025 season have been reported to CDC.

Additional pediatric mortality surveillance information for current and past seasons:


Surveillance Methods | FluView Interactive

Additional National and International Influenza Surveillance Information

Indicators Status by System


Increasing:
IncreasingArrow.png

Decreasing:
DecreasingArrow.png

Stable:
StableArrow.png


Clinical Labs: Up or down arrows indicate a change of greater than or equal to 0.5 percentage points in the percent of specimens positive for influenza compared to the previous week.
Outpatient Respiratory Illness (ILINet): Up or down arrows indicate a change of greater than 0.1 percentage points in the percent of visits due to respiratory illness (ILI) compared to the previous week.
NHSN Hospitalizations: Up or down arrows indicate change of greater than or equal to 5% of the number of patients admitted with laboratory-confirmed influenza compared to the previous week.
NCHS Mortality: Up or down arrows indicate change of greater than 0.1 percentage points of the percent of deaths due to influenza compared to the previous week.

Additional surveillance information


FluView Interactive: FluView includes enhanced web-based interactive applications that can provide dynamic visuals of the influenza data collected and analyzed by CDC. These FluView Interactive applications allow people to create customized, visual interpretations of influenza data, as well as make comparisons across flu seasons, regions, age groups and a variety of other demographics.

National Institute for Occupational Safety and Health: Monthly surveillance data on the prevalence of health-related workplace absenteeism among full-time workers in the United States are available from NIOSH.

https://www.cdc.gov/fluview/surveillance/2025-week-06.html
 
Weekly US Influenza Surveillance Report: Key Updates for Week 7, ending February 15, 2025

What to know


Seasonal influenza activity remains elevated.
Summary

Viruses

Clinical Lab 26.9% (Trend
DecreasingArrow.png
)
positive for influenza
this week. Public Health Lab Influenza A(H1N1)pdm09 and A(H3N2)
were the predominant viruses reported this week. Illness

Outpatient Respiratory Illness 6.8% (Trend
DecreasingArrow.png
)
of visits to a health care provider this
week were for respiratory illness
(above baseline). Activity Map 5 moderate jurisdictions 44 high or very high jurisdictions FluSurv-NET 88.9 per 100,000
cumulative hospitalization rate National Healthcare Safety Network (NHSN) Hospital Respiratory Data 43,367 (Trend
DecreasingArrow.png
)
patients admitted to hospitals
with influenza this week. NCHS Mortality 3.0% (Trend
IncreasingArrow.png
)
of deaths attributed to influenza this week. Pediatric Deaths 18 influenza-associated deaths
were reported this week for
a total of 86 deaths this season.
All data are preliminary and may change as more reports are received.

Directional arrows indicate changes between the current week and the previous week. Additional information on the arrows can be found at the bottom of this page.

A description of the CDC influenza surveillance system, including methodology and detailed descriptions of each data component is available on the surveillance methods page.[SUP]1[/SUP]

Additional information on the current and previous influenza seasons for each surveillance component are available on FluView Interactive.

Key Points


• Nationally, seasonal influenza activity remains elevated. This season is now classified as a high severity season overall and for all age groups (children, adults, older adults) and is the first high severity season since 2017-2018.

• During Week 7, of the 2,486 viruses reported by public health laboratories, 2,383 were influenza A and 103 were influenza B. Of the 1,788 influenza A viruses subtyped during Week 7, 1,115 (62.4%) were influenza A(H1N1)pdm09, 673 (37.6%) were A(H3N2), and zero were A(H5).

• Two new confirmed cases of avian influenza A(H5) were reported to CDC this week. To date, human-to-human transmission of avian influenza A(H5) virus (H5 bird flu) has not been identified in the United States.

• Outpatient respiratory illness decreased slightly this week compared to last week, but remains above the national baseline for the twelfth consecutive week. All 10 HHS regions are above their region-specific baselines.

• Eighteen pediatric deaths associated with seasonal influenza virus infection were reported this week, bringing the 2024-2025 season total to 86 pediatric deaths.

• CDC estimates that there have been at least 33 million illnesses, 430,000 hospitalizations, and 19,000 deaths from flu so far this season.

• CDC recommends that everyone ages 6 months and older get an annual influenza (flu) vaccine.[SUP]1[/SUP]

• There are prescription flu antiviral drugs that can treat flu illness; those should be started as early as possible and are especially important for patients at higher risk for severe illness.[SUP]2[/SUP]

• Influenza viruses are among several viruses contributing to respiratory disease activity. CDC is providing updated, integrated information about COVID-19, flu, and respiratory syncytial virus (RSV) activity on a weekly basis.
COVID-19, flu, and RSV activity

U.S. virologic surveillance


Nationally, the percentage of respiratory specimens testing positive for influenza virus in clinical laboratories decreased (change ≥ 0.5 percentage points) compared to the previous week. Region 2 experienced a slight increase and the remaining regions (regions 1, 3, 4, 5, 6, 7, 8, 9, and 10) decreased in Week 7 compared to Week 6. Region 7 had the highest percent positivity (33.2%) and Region 4 had the lowest (19.8%). Influenza A(H1N1)pdm09 and A(H3N2) were the predominant viruses reported this week. For regional and state level data and age group distribution, please visit FluView Interactive. Viruses known to be associated with recent receipt of live attenuated influenza vaccine (LAIV) or found upon further testing to be a vaccine virus are not included, as they are not circulating influenza viruses.

Clinical Laboratories


The results of tests performed by clinical laboratories nationwide are summarized below. Data from clinical laboratories (the percentage of specimens tested that are positive for influenza virus) are used to monitor whether influenza activity is increasing or decreasing.
No. of specimens tested118,6632,151,450
No. of positive specimens (%)31,862 (26.9%)327,124 (15.2%)
Positive specimens by type
Influenza A29,301 (92.0%)313,534 (95.8%)
Influenza B2,561 (8.0%)13,589 (4.2%)
Public Health Laboratories


The results of tests performed by public health laboratories nationwide are summarized below. Data from public health laboratories are used to monitor the proportion of circulating influenza viruses that belong to each influenza subtype/lineage.
No. of specimens tested3,51982,545
No. of positive specimens2,48653,734
Positive specimens by type/subtype
Influenza A2,383 (95.9%)52,323 (97.4%)
Subtyping Performed1,788 (75.0%)44,963 (85.9%)
(H1N1)pdm091,115 (62.4%)22,262 (49.5%)
H3N2673 (37.6%)22,622 (50.3%)
H3N2v[SUP]†[/SUP]00
H5*079 (0.2%)
Subtyping not performed595 (25.0%)7,360 (14.1%)
Influenza B103 (4.1%)1,411 (2.6%)
Lineage testing performed9 (8.7%)620 (43.9%)
Yamagata lineage00
Victoria lineage9 (100%)620 (100%)
Lineage not performed94 (91.3%)791 (56.1%)
[SUB]*These data reflect specimens tested, and the number determined to be positive for influenza viruses at the public health labs (specimens tested is not the same as cases). The data do not reflect specimens tested only at CDC and could include more than one specimen tested per person. The guidance for influenza A(H5) virus testing recommends testing both a conjunctival and respiratory swab for people with conjunctivitis which has resulted in more specimens testing positive for influenza A(H5) virus than the number of human A(H5) cases. For more information on the number of people infected with A(H5) viruses, please visit the[/SUB] [SUB]"How CDC is monitoring influenza data among people to better understand the current avian influenza A (H5N1) situation"[/SUB]

[SUB][SUP]†[/SUP]When an influenza virus that normally circulates in swine (but not people) is detected in a person, it is called a "variant" influenza virus. Most human infections with variant influenza viruses occur following exposure to swine, but human-to-human transmission can occur. It is important to note that in most cases, variant influenza viruses have not shown the ability to spread easily and sustainably from human-to-human.[/SUB]


[SUB]*This graph reflects the number of specimens tested and the number determined to be positive for influenza viruses at the public health lab (specimens tested is not the same as cases). It does not reflect specimens tested only at CDC and could include more than one specimen tested per person. Specimens tested as part of routine influenza surveillance as well as those tested as part of targeted testing for people exposed to influenza A(H5) are included.[/SUB]

Additional virologic surveillance information for current and past seasons:


Surveillance Methods | FluView Interactive: National, Regional, and State Data or Age Data

Novel Influenza A Virus Infections


Two confirmed human infections with avian influenza A(H5) virus were reported to CDC this week. To date, human-to-human transmission of avian influenza A(H5) virus has not been identified in the United States.

One case was reported by the Wyoming Department of Health. It occurred in an individual aged ≥18 years who had exposure to a backyard flock that was positive for highly pathogenic avian influenza (HPAI) A(H5N1) virus. This individual developed respiratory and non-respiratory symptoms, was hospitalized, and remains so at the time of this report.

The second case was reported by the Ohio Department of Health. It occurred in an individual aged ≥18 years who worked at a commercial poultry facility where HPAI A(H5N1) virus had been detected in birds; the individual was involved in depopulation activities. This individual also developed respiratory and non-respiratory symptoms, was hospitalized, and is now recovering at home.

Specimens were collected from the individuals and initially tested at state public health laboratories using the CDC influenza A(H5) assay before being sent to CDC for further testing. Avian influenza A(H5N1) virus was confirmed at CDC for both cases. These are the first human influenza A(H5) cases in Wyoming and Ohio.

Notification to WHO of these cases has been initiated per International Health Regulations (IHR). More information regarding IHR can be found at http://www.who.int/topics/international_health_regulations/en/.

The CSTE position statement, which includes updated case definitions for confirmed, probable, and suspected cases is available at http://www.cste.org/resource/resmgr/position_statements_files_2023/24-ID-09_Novel_Influenza_A.pdf

An up-to-date human case summary during the 2024 outbreak by state and exposure source is available at www.cdc.gov/bird-flu/situation-summary/index.html

Information about avian influenza is available at https://www.cdc.gov/flu/avianflu/index.htm.

Interim recommendations for Prevention, Monitoring, and Public Health Investigations are available at https://www.cdc.gov/bird-flu/prevention/hpai-interim-recommendations.html.

The latest case reports on avian influenza outbreaks in wild birds, commercial poultry, backyard or hobbyist flocks, and mammals in the United States are available from the USDA at https://www.aphis.usda.gov/aphis/ou...e-information/avian/avian-influenza/2022-hpai.

Additional information regarding human infections with novel influenza A viruses:


Surveillance Methods | FluView Interactive

Influenza Virus Characterization


CDC performs genetic and antigenic characterization of U.S. viruses submitted from state and local public health laboratories according to the Right Size Roadmap submission guidance. These data are used to compare how similar the currently circulating influenza viruses are to the reference viruses representing the current influenza vaccines. The data are also used to monitor evolutionary changes that continually occur in influenza viruses circulating in humans. CDC also tests susceptibility of circulating influenza viruses to antiviral medications including the neuraminidase inhibitors (oseltamivir, zanamivir, and peramivir) and the polymerase acidic protein (PA) endonuclease inhibitor baloxavir. The HA clade and subclades were assigned using Nextclade (https://clades.nextstrain.org).

CDC has genetically characterized 2,008 influenza viruses collected since September 29, 2024
A/H1745
5a.2a437 (58.7%)C.1.971 (9.5%)
C.1.9.154 (7.2%)
C.1.9.25 (0.7%)
C.1.9.3302 (40.5%)
C.1.9.45 (0.7%)
5a.2a.1308 (41.3%)D21 (2.8%)
D.16 (0.8%)
D.3118 (15.8%)
D.5163 (21.9%)
A/H31,098
2a.3a5 (0.5%)G.1.3.15 (0.5%)
2a.3a.11,093 (99.5%)J.11 (0.1%)
J.1.16 (0.5%)
J.21,005 (91.5%)
J.2.127 (2.5%)
J.2.254 (4.9%)
B/Victoria165
3a.2165 (100%)C.32 (1.2%)
C.519 (11.5%)
C.5.194 (57.0%)
C.5.619 (11.5%)
C.5.731 (18.8%)
B/Yamagata0
Y30Y30
CDC antigenically characterizes influenza viruses by hemagglutination inhibition (HI) (H1N1pdm09, H3N2, and B/Victoria viruses) or neutralization-based HINT (H3N2 viruses) using antisera that ferrets make after being infected with reference viruses representing the 2024-2025 Northern Hemisphere recommended cell or recombinant-based vaccine viruses. Antigenic differences between viruses are determined by comparing how well the antibodies made against the vaccine reference viruses recognize the circulating viruses that have been grown in cell culture. Ferret antisera are useful because antibodies raised against a particular virus can often recognize small changes in the surface proteins of other viruses. In HI assays, viruses with similar antigenic properties have antibody titer differences of less than or equal to 4-fold when compared to the reference (vaccine) virus. In HINT, viruses with similar antigenic properties have antibody neutralization titer differences of less than or equal to 8-fold. Viruses selected for antigenic characterization are a subset of the recent genetically characterized viruses and are chosen based on the genetic changes in their surface proteins and may not be proportional to the number of such viruses circulating in the United States.

Influenza A Viruses
  • A(H1N1)pdm09: 132 A(H1N1)pdm09 viruses were antigenically characterized by HI, and all were well-recognized (reacting at titers that were within 4-fold of the homologous virus titer) by ferret antisera to cell-grown A/Wisconsin/67/2022-like reference viruses representing the A(H1N1)pdm09 component for the cell- and recombinant-based influenza vaccines.
  • A(H3N2): 169 A(H3N2) viruses were antigenically characterized by HI or HINT, and 86 (50.9%) were well-recognized (reacting at titers that were within 4-fold of the homologous virus titer in HI or reacting at titers that were less than or equal to 8-fold of the homologous virus in HINT) by ferret antisera to cell-grown A/Massachusetts/18/2022-like reference viruses representing the A(H3N2) component for the cell- and recombinant-based influenza vaccines.
Influenza B Viruses
  • B/Victoria: 51 influenza B/Victoria-lineage virus were antigenically characterized by HI, and all were well-recognized (reacting at titers that were within 4-fold of the homologous virus titer) by ferret antisera to cell-grown B/Austria/1359417/2021-like reference viruses representing the B/Victoria component for the cell- and recombinant-based influenza vaccines.
  • B/Yamagata: No influenza B/Yamagata-lineage viruses were available for antigenic characterization.
Assessment of Virus Susceptibility to Antiviral Medications


CDC assesses susceptibility of influenza viruses to the antiviral medications including the neuraminidase inhibitors (oseltamivir, zanamivir, and peramivir) and the PA endonuclease inhibitor baloxavir using next generation sequence analysis supplemented by laboratory assays. Information about antiviral susceptibility test methods can be found at U.S. Influenza Surveillance: Purpose and Methods.

Viruses collected in the U.S. since September 29, 2024, were tested for antiviral susceptibility as follows:
Neuraminidase InhibitorsOseltamivirViruses Tested1,9267441,044138
Reduced Inhibition1 (<0.1%)1 (0.1%)00
Highly Reduced Inhibition3 (0.2%)3 (0.4%)00
PeramivirViruses Tested1,9267441,044138
Reduced Inhibition0000
Highly Reduced Inhibition3 (0.2%)3 (0.4%)00
ZanamivirViruses Tested1,9267441,044138
Reduced Inhibition0000
Highly Reduced Inhibition0000
PA Cap-Dependent Endonuclease InhibitorBaloxavirViruses Tested1,8246341,034156
Decreased Susceptibility0000
Three A(H1N1)pdm09 viruses had NA-H275Y amino acid substitution conferring highly reduced inhibition by oseltamivir and peramivir. One A(H1N1)pdm09 virus had NA-I223V and NA-S247N amino acid substitutions and showed reduced inhibition by oseltamivir.

High levels of resistance to the adamantanes (amantadine and rimantadine) persist among influenza A(H1N1)pdm09 and influenza A(H3N2) viruses (the adamantanes are not effective against influenza B viruses). Therefore, use of these antivirals for treatment and prevention of influenza A virus infection is not recommended and data from adamantane resistance testing are not presented.

Outpatient and Emergency Department Illness Surveillance

Outpatient respiratory illness visits


The U.S. Outpatient Influenza-like Illness Surveillance Network (ILINet) monitors outpatient visits for respiratory illness referred to as influenza-like illness [ILI (fever plus cough or sore throat)], not laboratory-confirmed influenza, and will therefore capture respiratory illness visits due to infection with any pathogen that can present with similar symptoms, including influenza virus, SARS-CoV-2, and RSV. It is important to evaluate syndromic surveillance data, including that from ILINet, in the context of other sources of surveillance data to obtain a complete and accurate picture of influenza, SARS-CoV-2, and other respiratory virus activity.

Nationally, during Week 7, 6.8% of patient visits reported through ILINet were due to respiratory illness that included fever plus a cough or sore throat, also referred to as ILI. This week's percentage decreased (change of > 0.1 percentage points) compared to Week 6 and remains above the national baseline of 3.0% for the twelfth consecutive week. The percentage of visits for ILI increased (change of > 0.1 percentage points) in HHS Region 5 and decreased in all other regions (1, 2, 3, 4, 6, 7, 8, 9, and 10) this week compared to last. All regions remain above their respective baselines. Multiple respiratory viruses are co-circulating, and the relative contribution of influenza virus infections to ILI varies by location.

Outpatient respiratory illness visits by age group


About 70% of ILINet participants provide both the number of patient visits for respiratory illness and the total number of patient visits for the week broken out by age group. Based on these data, the percentage of visits for respiratory illness decreased (change of > 0.1 percentage point) in the 0-4 years, 5-24 years, 25-49 years, and 50-64 years age groups and remained stable (change of ≤ 0.1 percentage point) in the 65+ years age group in Week 7 compared to Week 6.

Outpatient respiratory illness activity map


Data collected in ILINet are used to produce a measure of ILI activity* by state/jurisdiction and Core Based Statistical Areas (CBSA).
Week 7
(Week ending
Feb. 15, 2025)
Week 6
(Week ending
Feb. 8, 2025)
Week 7
(Week ending
Feb. 15, 2025)
Week 6
(Week ending
Feb. 8, 2025)
Very High283891125
High168225258
Moderate54147116
Low32143117
Minimal229493
Insufficient Data11229220


*Data collected in ILINet may disproportionally represent certain populations within a jurisdiction or CBSA, and therefore, may not accurately depict the full picture of influenza activity for the entire jurisdiction or CBSA. Differences in the data presented here by CDC and independently by some health departments likely represent differing levels of data completeness with data presented by the health department likely being the more complete.

Additional information about medically attended visits for ILI for current and past seasons:


Surveillance Methods | FluView Interactive: National, Regional, and State Data or ILI Activity Map

National Syndromic Surveillance System (NSSP)


The overall percentage of emergency department (ED) visits with a discharge diagnosis of influenza reported in NSSP was 6.4% during Week 7, a decrease (change of > 0.1 percentage point) compared to the previous week. The percentage of ED visits with influenza discharge diagnoses also decreased in all 10 HHS regions and across all age groups. RegionNationalRegion 1Region 10Region 2Region 3Region 4Region 5Region 6Region 7Region 8Region 9
Season2022-20232023-2024 & 2024-2025 Skip Over Chart Container
2.0%4.0%6.0%8.0%10.0%12.0%14.0%16.0%Percent of Emergency Department Visits for InfluenzaWeek 43 of 2023Week 47 of 2023Week 51 of 2023Week 3 of 2024Week 7 of 2024Week 11 of 2024Week 15 of 2024Week 19 of 2024Week 23 of 2024Week 27 of 2024Week 31 of 2024Week 35 of 2024Week 39 of 2024Week 43 of 2024Week 47 of 2024Week 51 of 2024Week 3 of 2025Week 7 of 2025

Age Group


All ages
0-4 years
5-17 years
18-64 years
65+ Skip Data Table
Data Table Download Data (CSV) Skipped data table.

Additional information about emergency department visits for flu for current and past seasons:‎‎‎


Surveillance Methods | Emergency Department Visits for COVID-19, flu, and RSV

Hospitalization surveillance

FluSurv-Net


The Influenza Hospitalization Surveillance Network (FluSurv-NET) conducts population-based surveillance for laboratory-confirmed influenza-related hospitalizations in select counties in 14 states and represents approximately 9% of the U.S. population. FluSurv-NET hospitalization data are preliminary. As data are received each week, prior case counts and rates are updated accordingly.

A total of 27,227 laboratory-confirmed influenza-associated hospitalizations were reported by FluSurv-NET sites between October 1, 2024, and February 15, 2025. The weekly hospitalization rate observed during Week 7 was 7.2 per 100,000 population. The weekly hospitalization rate observed during Week 5 (13.2 per 100,000 population) is the highest peak weekly rate observed across all seasons since 2010-2011. The cumulative hospitalization rate observed in Week 7 was 88.9 per 100,000 population, which is the highest cumulative hospitalization rate for Week 7 across all seasons since 2010-11.

Among all hospitalizations, 26,653 (97.9%) were associated with influenza A virus, 436 (1.6%) with influenza B virus, 22 (0.1%) with influenza A virus and influenza B virus co-infection, and 116 (0.4%) with influenza virus for which the type was not determined. Among those with influenza A subtype information, 3,403 (54.4%) were A(H1N1) pdm09 and 2,847 (45.5%) were A(H3N2).

When examining rates by age, the highest cumulative hospitalization rate per 100,000 population was among adults aged 65 years and older (276.2), followed by adults aged 50-64 years (103.8), children aged 0-4 years (74.7), adults aged 18-49 (37.4), and children aged 5-17 (27.3).

When examining age-adjusted rates by race and ethnicity, the highest cumulative hospitalization rate per 100,000 population was among non-Hispanic Black persons (127.2), followed by American Indian/Alaska Native persons (115.0), Hispanic persons (70.8), non-Hispanic White persons (68.1), and Asian/Pacific Islander persons (54.3).

Among 2,406 hospitalized adults with information on underlying medical conditions, 95.1% had at least one reported underlying medical condition; the most commonly reported were hypertension, cardiovascular disease, metabolic disease, and obesity. Among 1,286 hospitalized women of childbearing age (15-49 years) with information on pregnancy status, 28.8% were pregnant. Among 446 hospitalized children with information on underlying medical conditions, 51.7% had at least one reported underlying medical condition; the most commonly reported was asthma, followed by neurologic disease and obesity.


[SUB]**In this figure, weekly rates for all seasons prior to the 2024-2025 season reflect end-of-season rates. For the 2024-2025 season, rates for recent hospital admissions are subject to reporting delays and are shown as a dashed line for the current season. As hospitalization data are received each week, prior case counts and rates are updated accordingly.[/SUB]

Additional FluSurv-NET hospitalization surveillance information for current and past seasons and additional age groups:


Surveillance Methods | FluView Interactive: Rates by Age, Sex, and Race/Ethnicity or Data on Patient Characteristics | RESP-NET Interactive

National Healthcare Safety Network (NHSN) Hospital Respiratory Data


Hospitals report to NHSN the weekly number of patients with laboratory-confirmed influenza who were admitted to the hospital. Nationally, during Week 7, 43,367 laboratory confirmed influenza-associated hospitalizations were reported. This week's influenza-associated hospitalizations decreased (change of > 5%) compared to Week 6.

The weekly hospital admission rate observed in Week 7 was 12.9 per 100,000. The weekly rate of hospital admissions in all 10 HHS regions ranged from 7.0 (Region 9) to 23.4 (Region 3). The weekly rate of hospital admissions remained stable in HHS regions 3 and 5 and decreased in all other regions (1, 2, 4, 6, 7, 8, 9, and 10) this week compared to Week 6.

When examining rates by age for Week 7, all age groups decreased compared to the previous week. The highest hospital admission rate per 100,000 population was among those 75+ years (56.4), followed by 65-74 years (27.6), and 50-64 years (13.9).
NHSN07.gif
Additional NHSN Hospital Respiratory Data information


Surveillance Methods | Additional Data | FluView Interactive

Mortality surveillance

National Center for Health Statistics (NCHS) Mortality Surveillance


Based on NCHS mortality surveillance data available on February 20, 2025, 3.0% of the deaths that occurred during the week ending February 15, 2025 (Week 7), were due to influenza. This percentage increased (> 0.1 percentage point change) compared to Week 6 and is higher than it has been all season. The data presented are preliminary and may change as more data are received and processed.

Additional pneumonia, influenza and COVID-19 mortality surveillance information for current and past seasons:


Surveillance Methods | FluView Interactive

Influenza-Associated Pediatric Mortality


Eighteen influenza-associated pediatric deaths occurring during the 2024-2025 season were reported to CDC during Week 7. The deaths occurred between weeks 2 and 7 (the weeks ending January 11, 2025, and February 15, 2025). Seventeen deaths were associated with influenza A viruses. Twelve of the influenza A viruses had subtyping performed; nine were A(H1N1) viruses and three were A(H3N2) viruses. One death was associated with an influenza B virus with no lineage determined.

A total of 86 influenza-associated pediatric deaths occurring during the 2024-2025 season have been reported to CDC.

Additional pediatric mortality surveillance information for current and past seasons:


Surveillance Methods | FluView Interactive

Additional National and International Influenza Surveillance Information

Indicators Status by System


Increasing:
IncreasingArrow.png

Decreasing:
DecreasingArrow.png

Stable:
StableArrow.png


Clinical Labs: Up or down arrows indicate a change of greater than or equal to 0.5 percentage points in the percent of specimens positive for influenza compared to the previous week.
Outpatient Respiratory Illness (ILINet): Up or down arrows indicate a change of greater than 0.1 percentage points in the percent of visits due to respiratory illness (ILI) compared to the previous week.
NHSN Hospitalizations: Up or down arrows indicate change of greater than or equal to 5% of the number of patients admitted with laboratory-confirmed influenza compared to the previous week.
NCHS Mortality: Up or down arrows indicate change of greater than 0.1 percentage points of the percent of deaths due to influenza compared to the previous week.


https://www.cdc.gov/fluview/surveillance/2025-week-07.html
 
Weekly US Influenza Surveillance Report: Key Updates for Week 11, ending March 15, 2025

What to know


Seasonal influenza activity remains elevated nationally but has decreased for five consecutive weeks.
Summary

Viruses

Clinical Lab 13.3% (Trend
DecreasingArrow.png
)
positive for influenza
this week. Public Health Lab Influenza A(H1N1)pdm09 and A(H3N2)
were the predominant viruses reported this week.

Illness

Outpatient Respiratory Illness 3.9% (Trend
DecreasingArrow.png
)
of visits to a health care provider this
week were for respiratory illness
(above baseline). Activity Map 13 moderate jurisdictions 20 high or very high jurisdictions FluSurv-NET 116.5 per 100,000
cumulative hospitalization rate National Healthcare Safety Network (NHSN) Hospital Respiratory Data 17,722 (Trend
DecreasingArrow.png
)
patients admitted to hospitals
with influenza this week. NCHS Mortality 1.5% (Trend
DecreasingArrow.png
)
of deaths attributed to influenza this week. Pediatric Deaths 17 influenza-associated deaths
were reported this week for
a total of 151 deaths this season.
All data are preliminary and may change as more reports are received.

Directional arrows indicate changes between the current week and the previous week. Additional information on the arrows can be found at the bottom of this page.

A description of the CDC influenza surveillance system, including methodology and detailed descriptions of each data component is available on the surveillance methods page.[SUP]1[/SUP]

Additional information on the current and previous influenza seasons for each surveillance component are available on FluView Interactive.

Key Points
  • Seasonal influenza (flu) activity remains elevated nationally but has decreased for five consecutive weeks. The season has peaked; however, flu-related medical visits, hospitalizations, and deaths remain elevated, and CDC expects several more weeks of flu activity.
  • This season is classified as a high severity season overall and for all age groups (children, adults, older adults) and is the first high severity season since 2017-2018.
  • During Week 11, of the 2,063 viruses reported by public health laboratories, 1,932 were influenza A and 131 were influenza B. Of the 1,777 influenza A viruses subtyped during Week 11, 1,013 (57.0%) were influenza A(H1N1)pdm09, 764 (43.0%) were A(H3N2), and 0 (0%) were A(H5).
  • No new influenza A(H5) cases were reported to CDC this week. To date, human-to-human transmission of avian influenza A(H5) virus (H5 bird flu) has not been identified in the United States.
  • Outpatient respiratory illness decreased this week but remains above the national baseline for the sixteenth consecutive week. Nine out of 10 HHS regions are above their region-specific baselines; Region 8 is below its baseline.
  • Based on data from FluSurv-NET, the cumulative hospitalization rate for this season is the highest observed since the 2010-2011 season.
  • Seventeen pediatric deaths associated with seasonal influenza virus infection were reported this week, bringing the 2024-2025 season total to 151 pediatric deaths.
  • CDC estimates that there have been at least 43 million illnesses, 560,000 hospitalizations, and 24,000 deaths from flu so far this season.
  • CDC continues to recommend that everyone ages 6 months and older get an annual flu vaccine as long as influenza viruses are circulating.[SUP]1[/SUP]
  • There are prescription flu antiviral drugs that can treat flu illness; those should be started as early as possible and are especially important for patients at higher risk for severe illness.[SUP]2[/SUP]
  • Influenza viruses are among several viruses contributing to respiratory disease activity. CDC is providing updated, integrated information about COVID-19, flu, and respiratory syncytial virus (RSV) activity on a weekly basis.
COVID-19, flu, and RSV activity

U.S. virologic surveillance


Nationally, and in regions 1, 2, 5, 6, 7, 8, 9 and 10, the percentage of respiratory specimens testing positive for influenza virus in clinical laboratories decreased (change ≥ 0.5 percentage points), while in regions 3 and 4 the percentage remained stable compared to the previous week. Influenza A(H1N1)pdm09 and A(H3N2) were the predominant viruses reported this week. For regional and state level data and age group distribution, please visit FluView Interactive. Viruses known to be associated with recent receipt of live attenuated influenza vaccine (LAIV) or found upon further testing to be a vaccine virus are not included, as they are not circulating influenza viruses.

Clinical Laboratories


The results of tests performed by clinical laboratories nationwide are summarized below. Data from clinical laboratories (the percentage of specimens tested that are positive for influenza virus) are used to monitor whether influenza activity is increasing or decreasing.
No. of specimens tested78,4692,687,675
No. of positive specimens (%)10,397 (13.2%)436,592 (16.2%)
Positive specimens by type
Influenza A7,330 (70.5%)408,482 (93.6%)
Influenza B3,067 (29.5%)28,110 (6.4%)


Public Health Laboratories


The results of tests performed by public health laboratories nationwide are summarized below. Data from public health laboratories are used to monitor the proportion of circulating influenza viruses that belong to each influenza subtype/lineage.
No. of specimens tested2,772113,284
No. of positive specimens2,06376,882
Positive specimens by type/subtype
Influenza A1,932 (93.7%)74,533 (96.9%)
Subtyping Performed1,777 (92.0%)65,486 (87.9%)
(H1N1)pdm091,013 (57.0%)34,087 (52.1%)
H3N2764 (43.0%)31,319 (47.8%)
H3N2v00
H5*080 (0.1%)
Subtyping not performed155 (8.0%)9,047 (12.1%)
Influenza B131 (6.3%)2,349 (3.1%)
Lineage testing performed69 (52.7%)1,092 (46.5%)
Yamagata lineage00
Victoria lineage69 (100%)1,092 (100%)
Lineage not performed62 (47.3%)1,257 (53.5%)
[SUB]*This data reflects specimens tested and the number determined to be positive for influenza viruses at the public health labs (specimens tested is not the same as cases). It does not reflect specimens tested only at CDC and could include more than one specimen tested per person. The guidance for influenza A/H5 testing recommends testing both a conjunctival and respiratory swab for people with conjunctivitis which has resulted in more specimens testing positive for influenza A/H5 than the number of human H5 cases. For more information on the number of people infected with A/H5, please visit the [/SUB][SUB]"How CDC is monitoring influenza data among people to better understand the current avian influenza A (H5N1) situation"[/SUB]


[SUP]This graph reflects the number of specimens tested and the number determined to be positive for influenza viruses at the public health lab (specimens tested is not the same as cases). It does not reflect specimens tested only at CDC and could include more than one specimen tested per person. Specimens tested as part of routine influenza surveillance as well as those tested as part of targeted testing for people exposed to influenza A(H5) are included.[/SUP]

Additional virologic surveillance information for current and past seasons:


Surveillance Methods | FluView Interactive: National, Regional, and State Data or Age Data

Novel Influenza A Virus


No confirmed human infections with influenza A(H5) virus were reported to CDC this week. To date, human-to-human transmission of avian influenza A(H5) virus (H5 bird flu) has not been identified in the United States.

The CSTE position statement, which includes updated case definitions for confirmed, probable, and suspected cases is available at http://www.cste.org/resource/resmgr/position_statements_files_2023/24-ID-09_Novel_Influenza_A.pdf

An up-to-date human case summary during the current outbreak by state and exposure source is available at www.cdc.gov/bird-flu/situation-summary/index.html

Information about avian influenza is available at https://www.cdc.gov/flu/avianflu/index.htm.

A(H5N1) virus interim recommendations for Prevention, Monitoring, and Public Health Investigations are available at https://www.cdc.gov/bird-flu/prevention/hpai-interim-recommendations.html.

The latest case reports on avian influenza outbreaks in wild birds, commercial poultry, backyard or hobbyist flocks, and mammals in the United States are available from the USDA at https://www.aphis.usda.gov/aphis/ou...e-information/avian/avian-influenza/2022-hpai.

Additional information regarding human infections with novel influenza A viruses:


Surveillance Methods | FluView Interactive

Influenza Virus Characterization


CDC performs genetic and antigenic characterization of U.S. viruses submitted from state and local public health laboratories according to the Right Size Roadmap submission guidance. These data are used to compare how similar the currently circulating influenza viruses are relative to the reference viruses representing the current influenza vaccines. The data are also used to monitor evolutionary changes that continually occur in influenza viruses circulating in humans. CDC also tests susceptibility of circulating influenza viruses to antiviral medications including the neuraminidase inhibitors (oseltamivir, zanamivir, and peramivir) and the polymerase acidic protein (PA) endonuclease inhibitor baloxavir. The HA clade and subclades were assigned using Nextclade (https://clades.nextstrain.org).

CDC has genetically characterized 2,816 influenza viruses collected since September 29, 2024.
A/H11,055
5a.2a553 (52.4%)C.1.974 (7.0%)
C.1.9.166 (6.3%)
C.1.9.25 (0.5%)
C.1.9.3403 (38.2%)
C.1.9.45 (0.5%)
5a.2a.1502 (47.6%)D30 (2.8%)
D.19 (0.9%)
D.3285 (27.0%)
D.5178 (16.9%)
A/H31,518
2a.3a5 (0.3%)G.1.3.15 (0.3%)
2a.3a.11,513 (99.7 %)J.11 (0.1%)
J.1.16 (0.4%)
J.21,395 (91.9%)
J.2.135 (2.3%)
J.2.276 (5.0%)
B/Victoria243
3a.2243 (100%)C.33 (1.2%)
C.526 (10.7%)
C.5.1128 (52.7%)
C.5.51 (0.4%)
C.5.632 (13.2%)
C.5.753 (21.8%)
B/Yamagata0
CDC antigenically characterizes influenza viruses by hemagglutination inhibition (HI) assay (H1N1pdm09, H3N2, and B/Victoria viruses) or neutralization-based HINT (H3N2 viruses) using antisera that ferrets make after being infected with reference viruses representing the 2024-2025 Northern Hemisphere recommended cell or recombinant-based vaccine viruses. Antigenic differences between viruses are determined by comparing how well the antibodies made against the vaccine reference viruses recognize the circulating viruses that have been grown in cell culture. Ferret antisera are useful because antibodies raised against a particular virus can often recognize small changes in the surface proteins of other viruses. In HI assays, viruses with similar antigenic properties have antibody titer differences of less than or equal to 4-fold when compared to the reference (vaccine) virus. In HINT, viruses with similar antigenic properties have antibody neutralization titer differences of less than or equal to 8-fold. Viruses selected for antigenic characterization are a subset of the recent genetically characterized viruses and are chosen based on the genetic changes in their surface proteins and may not be proportional to the number of such viruses circulating in the United States.

Influenza A Viruses
  • A (H1N1)pdm09: 197 A(H1N1)pdm09 viruses were antigenically characterized by HI, and 196 (99.5%) were well-recognized (reacting at titers that were within 4-fold of the homologous virus titer) by ferret antisera to cell-grown A/Wisconsin/67/2022-like reference viruses representing the A(H1N1)pdm09 component for the cell- and recombinant-based influenza vaccines.
  • A (H3N2): 263 A(H3N2) viruses were antigenically characterized by HI or HINT, and 153 (58.2%) were well-recognized (reacting at titers that were within 4-fold of the homologous virus titer in HI or reacting at titers that were less than or equal to 8-fold of the homologous virus in HINT) by ferret antisera to cell-grown A/Massachusetts/18/2022-like reference viruses representing the A(H3N2) component for the cell- and recombinant-based influenza vaccines.
Influenza B Viruses
  • B/Victoria: 96 influenza B/Victoria-lineage virus were antigenically characterized by HI, and all were well-recognized (reacting at titers that were within 4-fold of the homologous virus titer) by ferret antisera to cell-grown B/Austria/1359417/2021-like reference viruses representing the B/Victoria component for the cell- and recombinant-based influenza vaccines.
  • B/Yamagata: No influenza B/Yamagata-lineage viruses were available for antigenic characterization.
Assessment of Virus Susceptibility to Antiviral Medications


CDC assesses susceptibility of influenza viruses to the antiviral medications including the neuraminidase inhibitors (oseltamivir, zanamivir, and peramivir) and the PA endonuclease inhibitor baloxavir using next generation sequence analysis supplemented by laboratory assays. Information about antiviral susceptibility test methods can be found at U.S. Influenza Surveillance: Purpose and Methods | CDC.

Viruses collected in the United States since September 29, 2024, were tested for antiviral susceptibility as follows:
Neuraminidase InhibitorsOseltamivirViruses Tested2,7731,0501,499224
Reduced Inhibition1 (<0.1%)1 (0.1%)00
Highly Reduced Inhibition5 (0.2%)5 (0.5%)00
PeramivirViruses Tested2,7731,0501,499224
Reduced Inhibition0000
Highly Reduced Inhibition5 (0.2%)5 (0.5%)00
ZanamivirViruses Tested2,7731,0501,499224
Reduced Inhibition0000
Highly Reduced Inhibition0000
PA Cap-Dependent Endonuclease InhibitorBaloxavirViruses Tested2,6409471,478215
Decreased Susceptibility1 (<0.1%)01 (0.1%)0
Five A(H1N1)pdm09 viruses had NA-H275Y amino acid substitution conferring highly reduced inhibition by oseltamivir and peramivir. One A(H1N1)pdm09 virus had NA-I223V and NA-S247N amino acid substitutions and showed reduced inhibition by oseltamivir. One A(H3N2) virus had PA-I38T amino acid substitution associated with reduced susceptibility to baloxavir.

High levels of resistance to the adamantanes (amantadine and rimantadine) persist among influenza A(H1N1)pdm09 and influenza A(H3N2) viruses (the adamantanes are not effective against influenza B viruses). Therefore, use of these antivirals for treatment and prevention of influenza A virus infection is not recommended and data from adamantane resistance testing are not presented.

Outpatient and Emergency Department Illness Surveillance

Outpatient respiratory illness visits


The U.S. Outpatient Influenza-like Illness Surveillance Network (ILINet) monitors outpatient visits for respiratory illness referred to as influenza-like illness [ILI (fever plus cough or sore throat)], not laboratory-confirmed influenza, and will therefore capture respiratory illness visits due to infection with any pathogen that can present with similar symptoms, including influenza virus, SARS-CoV-2, and RSV. It is important to evaluate syndromic surveillance data, including that from ILINet, in the context of other sources of surveillance data to obtain a complete and accurate picture of influenza, SARS-CoV-2, and other respiratory virus activity.

Nationally, during Week 11, 3.9% of patient visits reported through ILINet were due to respiratory illness that included fever plus a cough or sore throat, also referred to as ILI. This week's percentage decreased (change of > 0.1 percentage points) compared to Week 10 but remains above the national baseline of 3.0% for the sixteenth consecutive week. The percentage of visits for ILI remained stable (change of ≤ 0.1 percentage points) in Region 9 and decreased (change of > 0.1 percentage points) in all other regions (1, 2, 3, 4, 5, 6, 7, 8, and 10) this week compared to last. Region 8 is below its baseline while all other regions (1, 2, 3, 4, 5, 6, 7, 9, and 10) are above their respective baselines. Multiple respiratory viruses are co-circulating, and the relative contribution of influenza virus infections to ILI varies by location.

Outpatient respiratory illness visits by age group


About 70% of ILINet participants provide both the number of patient visits for respiratory illness and the total number of patient visits for the week broken out by age group. Based on these data, the percentage of visits for respiratory illness decreased (change of > 0.1 percentage point) in all age groups (0-4 years, 5-24 years, 25-49 years, 50-64 years, and 65+ years) in Week 11 compared to Week 10.

Outpatient respiratory illness activity map


Data collected in ILINet are used to produce a measure of ILI activity* by state/jurisdiction and Core Based Statistical Areas (CBSA). The state of Vermont is working with CDC to ensure that appropriate data are being used to calculate the state's activity level. Vermont's activity level will be reported again after the issue is resolved.
Week 11
(Week ending
Mar. 15, 2025)
Week 10
(Week ending
Mar. 8, 2025)
Week 11
(Week ending
Mar. 15, 2025)
Week 10
(Week ending
Mar. 8, 2025)
Very High06918
High202082119
Moderate1313123153
Low117206190
Minimal108274223
Insufficient Data11235226


*Data collected in ILINet may disproportionally represent certain populations within a jurisdiction or CBSA, and therefore, may not accurately depict the full picture of influenza activity for the entire jurisdiction or CBSA. Differences in the data presented here by CDC and independently by some health departments likely represent differing levels of data completeness with data presented by the health department likely being the more complete.

Additional information about medically attended visits for ILI for current and past seasons:


Surveillance Methods | FluView Interactive: National, Regional, and State Data or ILI Activity Map

National Syndromic Surveillance System (NSSP)


The overall percentage of emergency department (ED) visits with a discharge diagnosis of influenza reported in NSSP was 2.4% during Week 11, a decrease (change of > 0.1 percentage point) compared to the previous week. The percentage of ED visits with influenza discharge diagnoses decreased in all 10 HHS regions and across all age groups. RegionNationalRegion 1Region 2Region 3Region 4Region 5Region 6Region 7Region 8Region 9Region 10
Season2023-2024 & 2024-20252022-2023 Skip Over Chart Container
2.0%4.0%6.0%8.0%10.0%12.0%14.0%16.0%Percent of Emergency Department Visits for InfluenzaWeek 43 of 2023Week 47 of 2023Week 51 of 2023Week 3 of 2024Week 7 of 2024Week 11 of 2024Week 15 of 2024Week 19 of 2024Week 23 of 2024Week 27 of 2024Week 31 of 2024Week 35 of 2024Week 39 of 2024Week 43 of 2024Week 47 of 2024Week 51 of 2024Week 3 of 2025Week 7 of 2025Week 11 of 2025

Age Group


All ages
0-4 years
5-17 years
18-64 years
65+ Skip Data Table
Data Table Download Data (CSV) Skipped data table.

Additional information about emergency department visits for flu for current and past seasons:‎‎‎


Surveillance Methods | Emergency Department Visits for COVID-19, flu, and RSV

Hospitalization surveillance

FluSurv-Net


The Influenza Hospitalization Surveillance Network (FluSurv-NET) conducts population-based surveillance for laboratory-confirmed influenza-related hospitalizations in select counties in 14 states and represents approximately 9% of the U.S. population. FluSurv-NET hospitalization data are preliminary. As data are received each week, prior case counts and rates are updated accordingly.

A total of 35,689 laboratory-confirmed influenza-associated hospitalizations were reported by FluSurv-NET sites between October 1, 2024, and March 15, 2025. The weekly hospitalization rate observed during Week 11 was 2.6 per 100,000 population. The weekly hospitalization rate observed during Week 6 (13.6 per 100,000 population) was the highest peak weekly rate observed across all seasons since 2010-2011. The cumulative hospitalization rate observed in Week 11 was 116.5 per 100,000 population, which is the highest cumulative hospitalization rate for Week 11 across all seasons since 2010-2011.

Among all hospitalizations 34,745 (97.4%) were associated with influenza A virus, 765 (2.1%) with influenza B virus, 29 (0.1%) with influenza A virus and influenza B virus co-infection, and 150 (0.4%) with influenza virus for which the type was not determined. Among those with influenza A subtype information, 5,455 (56.7%) had A(H1N1) pdm09 and 4,167 (43.3%) had A(H3N2).

When examining rates by age, the highest cumulative hospitalization rate per 100,000 population was among adults aged 65 years and older (365.6), followed by adults aged 50-64 years (137.0), children aged 0-4 years (96.2), adults aged 18-49 years (47.4), and children aged 5-17 years (36.1).

When examining age-adjusted rates by race and ethnicity, the highest cumulative hospitalization rate per 100,000 population was among non-Hispanic Black persons (197.6), followed by American Indian/Alaska Native persons (142.6), non-Hispanic White persons (100.4), Hispanic persons (95.1), and Asian/Pacific Islander persons (72.5).

Among 3,631 hospitalized adults with information on underlying medical conditions, 95.1% had at least one reported underlying medical condition; the most commonly reported were hypertension, cardiovascular disease, metabolic disease, and obesity. Among 1,709 hospitalized women of childbearing age (15-49 years) with information on pregnancy status, 28.3% were pregnant. Among 1,237 hospitalized children with information on underlying medical conditions, 53.0% had at least one reported underlying medical condition; the most commonly reported was asthma, followed by neurologic disease and obesity.


[SUB]**In this figure, weekly rates for all seasons prior to the 2023-2024 season reflect end-of-season rates. For the 2023-2024 season, rates for recent hospital admissions are subject to reporting delays and are shown as a dashed line for the current season. As hospitalization data are received each week, prior case counts and rates are updated accordingly.[/SUB]

Additional FluSurv-NET hospitalization surveillance information for current and past seasons and additional age groups:


Surveillance Methods | FluView Interactive: Rates by Age, Sex, and Race/Ethnicity or Data on Patient Characteristics | RESP-NET Interactive

National Healthcare Safety Network (NHSN) Hospital Respiratory Data


Hospitals report to NHSN the weekly number of patients with laboratory-confirmed influenza who were admitted to the hospital. Nationally, during Week 11, 17,722 laboratory confirmed influenza-associated hospitalizations were reported. This week's influenza-associated hospitalizations decreased (change of > 5%) compared to Week 10.

The weekly hospital admission rate observed in Week 11 was 5.3 per 100,000. The weekly rate of hospital admissions in all 10 HHS regions ranged from 2.8 (Region 9) to 9.2 (Region 3). The weekly rate of hospital admissions decreased in all 10 HHS regions.

When examining rates by age for Week 11, all age groups decreased compared to the previous week. The highest hospital admission rate per 100,000 population was among those 65+ years (16.8), followed by 50-64 years (5.6), and 0-4 years (4.0).

Additional NHSN Hospitalization Surveillance information:


Surveillance Methods | Additional Data | FluView Interactive

Mortality surveillance

National Center for Health Statistics (NCHS)


Based on NCHS mortality surveillance data available on March 20, 2025, 1.5% of the deaths that occurred during the week ending March 15, 2025 (Week 11), were due to influenza. This percentage decreased (≥ 0.1 percentage point change) compared to Week 10. The data presented are preliminary and may change as more data are received and processed.

Additional pneumonia, influenza and COVID-19 mortality surveillance information for current and past seasons:


Surveillance Methods | FluView Interactive

Influenza-Associated Pediatric Mortality


Seventeen influenza-associated pediatric deaths occurring during the 2024-2025 season were reported to CDC during Week 11. The deaths occurred between Week 51 of 2024 (the week ending December 21, 2024) and Week 10 of 2025 (the week March 8, 2025). Fifteen deaths were associated with influenza A viruses. Ten of the influenza A viruses had subtyping performed; five were A(H1N1) viruses and five were A(H3N2) viruses. Two deaths were associated with influenza B viruses with no lineage determined.

A total of 151 influenza-associated pediatric deaths occurring during the 2024-2025 season have been reported to CDC.

Additional pediatric mortality surveillance information for current and past seasons:


Surveillance Methods | FluView Interactive

Additional National and International Influenza Surveillance Information

Indicators Status by System


Increasing:
IncreasingArrow.png

Decreasing:
DecreasingArrow.png

Stable:
StableArrow.png


Clinical Labs: Up or down arrows indicate a change of greater than or equal to 0.5 percentage points in the percent of specimens positive for influenza compared to the previous week.
Outpatient Respiratory Illness (ILINet): Up or down arrows indicate a change of greater than 0.1 percentage points in the percent of visits due to respiratory illness (ILI) compared to the previous week.
NHSN Hospitalizations: Up or down arrows indicate change of greater than or equal to 5% of the number of patients admitted with laboratory-confirmed influenza compared to the previous week.
NCHS Mortality: Up or down arrows indicate change of greater than 0.1 percentage points of the percent of deaths due to influenza compared to the previous week.

Additional surveillance information


FluView Interactive: FluView includes enhanced web-based interactive applications that can provide dynamic visuals of the influenza data collected and analyzed by CDC. These FluView Interactive applications allow people to create customized, visual interpretations of influenza data, as well as make comparisons across flu seasons, regions, age groups and a variety of other demographics.

National Institute for Occupational Safety and Health: Monthly surveillance data on the prevalence of health-related workplace absenteeism among full-time workers in the United States are available from NIOSH.

https://www.cdc.gov/fluview/surveillance/2025-week-11.html
 
Weekly US Influenza Surveillance Report: Key Updates for Week 12, ending March 22, 2025

What to know


Seasonal influenza activity continues to decline.
Summary

Viruses

Clinical Lab 10.7% (Trend
DecreasingArrow.png
)
positive for influenza
this week. Public Health Lab Influenza A(H1N1)pdm09 and A(H3N2)
were the predominant viruses reported this week.

Illness

Outpatient Respiratory Illness 3.3% (Trend
DecreasingArrow.png
)
of visits to a health care provider this
week were for respiratory illness
(above baseline). Activity Map 13 moderate jurisdictions 7 high or very high jurisdictions FluSurv-NET 119.9 per 100,000
cumulative hospitalization rate National Healthcare Safety Network (NHSN) Hospital Respiratory Data 12,990 (Trend
DecreasingArrow.png
)
patients admitted to hospitals
with influenza this week. NCHS Mortality 1.3% (Trend
DecreasingArrow.png
)
of deaths attributed to influenza this week. Pediatric Deaths 8 influenza-associated deaths
were reported this week for
a total of 159 deaths this season.
All data are preliminary and may change as more reports are received.

Directional arrows indicate changes between the current week and the previous week. Additional information on the arrows can be found at the bottom of this page.

A description of the CDC influenza surveillance system, including methodology and detailed descriptions of each data component is available on the surveillance methods page.[SUP]1[/SUP]

Additional information on the current and previous influenza seasons for each surveillance component are available on FluView Interactive.

Key Points


• Seasonal influenza (flu) activity continues to decline; however, CDC expects several more weeks of flu activity.

• This season is classified as a high severity season overall and for all age groups (children, adults, older adults) and is the first high severity season since 2017-2018.

• During Week 12, of the 1,952 viruses reported by public health laboratories, 1,827 were influenza A and 125 were influenza B. Of the 1,616 influenza A viruses subtyped during Week 12, 844 (52.2%) were influenza A(H1N1)pdm09, 772 (47.8%) were A(H3N2), and 0 (0%) were A(H5).

• No new influenza A(H5) cases were reported to CDC this week. To date, human-to-human transmission of avian influenza A(H5) virus (H5 bird flu) has not been identified in the United States.

• Nationally, outpatient respiratory illness decreased this week but remains above baseline for the seventeenth consecutive week. Activity decreased in all ten HHS regions and fell below the region-specific baseline in regions 4, 6, 7, 8, and 9.

• Based on data from FluSurv-NET, the cumulative hospitalization rate for this season is the highest observed since the 2010-2011 season.

• Eight pediatric deaths associated with seasonal influenza virus infection were reported this week, bringing the 2024-2025 season total to 159 pediatric deaths.

• CDC estimates that there have been at least 44 million illnesses, 580,000 hospitalizations, and 25,000 deaths from flu so far this season.

• CDC continues to recommend that everyone ages 6 months and older get an annual flu vaccine as long as influenza viruses are circulating.[SUP]1[/SUP]

• There are prescription flu antiviral drugs that can treat flu illness; those should be started as early as possible and are especially important for patients at higher risk for severe illness.[SUP]2[/SUP]

• Influenza viruses are among several viruses contributing to respiratory disease activity. CDC is providing updated, integrated information about COVID-19, flu, and respiratory syncytial virus (RSV) activity on a weekly basis.
COVID-19, flu, and RSV activity

U.S. virologic surveillance


Nationally, and in all 10 HHS regions, the percentage of respiratory specimens testing positive for influenza virus in clinical laboratories decreased (change ≥ 0.5 percentage points) compared to the previous week. Influenza A(H1N1)pdm09 and A(H3N2) were the predominant viruses reported this week. For regional and state level data and age group distribution, please visit FluView Interactive. Viruses known to be associated with recent receipt of live attenuated influenza vaccine (LAIV) or found upon further testing to be a vaccine virus are not included, as they are not circulating influenza viruses.

Clinical Laboratories


The results of tests performed by clinical laboratories nationwide are summarized below. Data from clinical laboratories (the percentage of specimens tested that are positive for influenza virus) are used to monitor whether influenza activity is increasing or decreasing.
No. of specimens tested78,0622,785,139
No. of positive specimens (%)8,358 (10.7%)447,473 (16.1%)
Positive specimens by type
Influenza A4,961 (59.4%)415,255 (92.8%)
Influenza B3,397 (40.6%)32,218 (7.2%)
Public Health Laboratories


The results of tests performed by public health laboratories nationwide are summarized below. Data from public health laboratories are used to monitor the proportion of circulating influenza viruses that belong to each influenza subtype/lineage.
No. of specimens tested2,759118,723
No. of positive specimens1,95280,759
Positive specimens by type/subtype
Influenza A1,827 (93.6%)78,118 (96.7%)
Subtyping Performed1,616 (88.5%)68,764 (88.0%)
(H1N1)pdm09844 (52.2%)35,953 (52.3%)
H3N2772 (47.8%)32,731 (47.6%)
H3N2v[SUP]†[/SUP]0 (0.0%)0 (0.0%)
H5*0 (0.0%)80 (0.1%)
Subtyping not performed211 (11.5%)9,354 (12.0%)
Influenza B125 (6.4%)2,641 (3.3%)
Lineage testing performed62 (49.6%)1,228 (46.5%)
Yamagata lineage0 (0.0%)0 (0.0%)
Victoria lineage62 (100.0%)1,228 (100.0%)
Lineage not performed63 (50.4%)1,413 (53.5%)
[SUB]*These data reflect specimens tested, and the number determined to be positive for influenza viruses at the public health labs (specimens tested is not the same as cases). The data do not reflect specimens tested only at CDC and could include more than one specimen tested per person. The guidance for influenza A(H5) virus testing recommends testing both a conjunctival and respiratory swab for people with conjunctivitis which has resulted in more specimens testing positive for influenza A(H5) virus than the number of human A(H5) cases. For more information on the number of people infected with A(H5) viruses, please[/SUB][SUB] visit the [/SUB][SUB]"How CDC is monitoring influenza data among people to better understand the current avian influenza A (H5N1) situation"[/SUB]

[SUB][SUP]†[/SUP]When an influenza virus that normally circulates in swine (but not people) is detected in a person, it is called a "variant" influenza virus. Most human infections with variant influenza viruses occur following exposure to swine, but human-to-human transmission can occur. It is important to note that in most cases, variant influenza viruses have not shown the ability to spread easily and sustainably from human-to-human.[/SUB]


[SUB]*This graph reflects the number of specimens tested and the number determined to be positive for influenza viruses at the public health lab (specimens tested is not the same as cases). It does not reflect specimens tested only at CDC and could include more than one specimen tested per person. Specimens tested as part of routine influenza surveillance as well as those tested as part of targeted testing for people exposed to influenza A(H5) are included.[/SUB]

Additional virologic surveillance information for current and past seasons:


Surveillance Methods | FluView Interactive: National, Regional, and State Data or Age Data

Novel Influenza A Virus Infections


No confirmed human infections with influenza A(H5) virus were reported to CDC this week. To date, human-to-human transmission of avian influenza A(H5) virus (H5 bird flu) has not been identified in the United States.

The CSTE position statement, which includes updated case definitions for confirmed, probable, and suspected cases is available at http://www.cste.org/resource/resmgr/position_statements_files_2023/24-ID-09_Novel_Influenza_A.pdf

An up-to-date human case summary during the current outbreak by state and exposure source is available at www.cdc.gov/bird-flu/situation-summary/index.html

Information about avian influenza is available at https://www.cdc.gov/flu/avianflu/index.htm.

A(H5N1) virus interim recommendations for Prevention, Monitoring, and Public Health Investigations are available at https://www.cdc.gov/bird-flu/prevention/hpai-interim-recommendations.html.

The latest case reports on avian influenza outbreaks in wild birds, commercial poultry, backyard or hobbyist flocks, and mammals in the United States are available from the USDA at https://www.aphis.usda.gov/aphis/ou...e-information/avian/avian-influenza/2022-hpai.

Additional information regarding human infections with novel influenza A viruses:


Surveillance Methods | FluView Interactive

Influenza Virus Characterization


CDC performs genetic and antigenic characterization of U.S. viruses submitted from state and local public health laboratories according to the Right Size Roadmap submission guidance. These data are used to compare how similar the currently circulating influenza viruses are relative to the reference viruses representing the current influenza vaccines. The data are also used to monitor evolutionary changes that continually occur in influenza viruses circulating in humans. CDC also tests susceptibility of circulating influenza viruses to antiviral medications including the neuraminidase inhibitors (oseltamivir, zanamivir, and peramivir) and the polymerase acidic protein (PA) endonuclease inhibitor baloxavir. The HA clade and subclades were assigned using Nextclade (https://clades.nextstrain.org).

CDC has genetically characterized 3,067 influenza viruses collected since September 29, 2024.
A/H11,155
5a.2a576 (49.9%)C.1.975 (6.5%)
C.1.9.168 (5.9%)
C.1.9.25 (0.4%)
C.1.9.3422 (36.5%)
C.1.9.46 (0.5%)
5a.2a.1579 (50.1%)D30 (2.6%)
D.19 (0.8%)
D.3362 (31.3%)
D.5178 (15.4%)
A/H31,642
2a.3a6 (0.4%)G.1.3.16 (0.4%)
2a.3a.11,636 (99.6%)J.11 (0.1%)
J.1.17 (0.4%)
J.21,503 (91.5%)
J.2.142 (2.6%)
J.2.283 (5.1%)
B/Victoria270
3a.2270 (100%)C.34 (1.5%)
C.530 (11.1%)
C.5.1132 (48.9%)
C.5.51 (0.4%)
C.5.637 (13.7%)
C.5.766 (24.4%)
B/Yamagata0
Y30Y30
CDC antigenically characterizes influenza viruses by hemagglutination inhibition (HI) assay (H1N1pdm09, H3N2, and B/Victoria viruses) or neutralization-based HINT (H3N2 viruses) using antisera that ferrets make after being infected with reference viruses representing the 2024-2025 Northern Hemisphere recommended cell or recombinant-based vaccine viruses. Antigenic differences between viruses are determined by comparing how well the antibodies made against the vaccine reference viruses recognize the circulating viruses that have been grown in cell culture. Ferret antisera are useful because antibodies raised against a particular virus can often recognize small changes in the surface proteins of other viruses. In HI assays, viruses with similar antigenic properties have antibody titer differences of less than or equal to 4-fold when compared to the reference (vaccine) virus. In HINT, viruses with similar antigenic properties have antibody neutralization titer differences of less than or equal to 8-fold. Viruses selected for antigenic characterization are a subset of the recent genetically characterized viruses and are chosen based on the genetic changes in their surface proteins and may not be proportional to the number of such viruses circulating in the United States.

Influenza A Viruses
  • A(H1N1)pdm09: 280 A(H1N1)pdm09 viruses were antigenically characterized by HI, and 278 (99.3%) were well-recognized (reacting at titers that were within 4-fold of the homologous virus titer) by ferret antisera to cell-grown A/Wisconsin/67/2022-like reference viruses representing the A(H1N1)pdm09 component for the cell- and recombinant-based influenza vaccines.
  • A(H3N2): 263 A(H3N2) viruses were antigenically characterized by HI or HINT, and 153 (58.2%) were well-recognized (reacting at titers that were within 4-fold of the homologous virus titer in HI or reacting at titers that were less than or equal to 8-fold of the homologous virus in HINT) by ferret antisera to cell-grown A/Massachusetts/18/2022-like reference viruses representing the A(H3N2) component for the cell- and recombinant-based influenza vaccines.
Influenza B Viruses
  • B/Victoria: 112 influenza B/Victoria-lineage virus were antigenically characterized by HI, and all were well-recognized (reacting at titers that were within 4-fold of the homologous virus titer) by ferret antisera to cell-grown B/Austria/1359417/2021-like reference viruses representing the B/Victoria component for the cell- and recombinant-based influenza vaccines.
  • B/Yamagata: No influenza B/Yamagata-lineage viruses were available for antigenic characterization.
Assessment of Virus Susceptibility to Antiviral Medications


CDC assesses susceptibility of influenza viruses to the antiviral medications including the neuraminidase inhibitors (oseltamivir, zanamivir, and peramivir) and the PA endonuclease inhibitor baloxavir using next generation sequence analysis supplemented by laboratory assays. Information about antiviral susceptibility test methods can be found at U.S. Influenza Surveillance: Purpose and Methods.

Viruses collected in the U.S. since September 29, 2024, were tested for antiviral susceptibility as follows:
Neuraminidase InhibitorsOseltamivirViruses Tested3,0281,1491,613266
Reduced Inhibition1 (<0.1%)1 (<0.1%)00
Highly Reduced Inhibition6 (0.2%)5 (0.4%)1 (<0.1%)0
PeramivirViruses Tested3,0281,1491,613266
Reduced Inhibition0000
Highly Reduced Inhibition5 (0.2%)5 (0.4%)00
ZanamivirViruses Tested3,0281,1491,613266
Reduced Inhibition0000
Highly Reduced Inhibition0000
PA Cap-Dependent Endonuclease InhibitorBaloxavirViruses Tested2,9031,0421,604257
Decreased Susceptibility1 (<0.1%)01 (0.1%)0
Five A(H1N1)pdm09 viruses had NA-H275Y amino acid substitution conferring highly reduced inhibition by oseltamivir and peramivir. One A(H1N1)pdm09 virus had NA-I223V and NA-S247N amino acid substitutions and showed reduced inhibition by oseltamivir. One A(H3N2) virus had NA-E119V amino acid substitution and showed highly reduced inhibition by oseltamivir. One A(H3N2) virus had PA-I38T amino acid substitution associated with reduced susceptibility to baloxavir.

High levels of resistance to the adamantanes (amantadine and rimantadine) persist among influenza A(H1N1)pdm09 and influenza A(H3N2) viruses (the adamantanes are not effective against influenza B viruses). Therefore, use of these antivirals for treatment and prevention of influenza A virus infection is not recommended and data from adamantane resistance testing are not presented.

Outpatient and Emergency Department Illness Surveillance

Outpatient respiratory illness visits


The U.S. Outpatient Influenza-like Illness Surveillance Network (ILINet) monitors outpatient visits for respiratory illness referred to as influenza-like illness [ILI (fever plus cough or sore throat)], not laboratory-confirmed influenza, and will therefore capture respiratory illness visits due to infection with any pathogen that can present with similar symptoms, including influenza virus, SARS-CoV-2, and RSV. It is important to evaluate syndromic surveillance data, including that from ILINet, in the context of other sources of surveillance data to obtain a complete and accurate picture of influenza, SARS-CoV-2, and other respiratory virus activity.

Nationally, during Week 12, 3.3% of patient visits reported through ILINet were due to respiratory illness that included fever plus a cough or sore throat, also referred to as ILI. This week's percentage decreased (change of > 0.1 percentage points) compared to Week 11 but remains above the national baseline of 3.0% for the seventeenth consecutive week. The percentage of visits for ILI decreased (change of > 0.1 percentage points) in all 10 HHS regions this week compared to last. Regions 1, 2, 3, 5, and 10 are above their respective baselines while regions 4, 6, 7, 8, and 9 are below their respective baselines. Multiple respiratory viruses are co-circulating, and the relative contribution of influenza virus infections to ILI varies by location.

Outpatient respiratory illness visits by age group


About 70% of ILINet participants provide both the number of patient visits for respiratory illness and the total number of patient visits for the week broken out by age group. Based on these data, the percentage of visits for respiratory illness decreased (change of > 0.1 percentage point) in all age groups (0-4 years, 5-24 years, 25-49 years, 50-64 years, and 65+ years) in Week 12 compared to Week 11.

Outpatient respiratory illness activity map


Data collected in ILINet are used to produce a measure of ILI activity* by state/jurisdiction and Core Based Statistical Areas (CBSA).
Week 12
(Week ending
Mar. 22, 2025)
Week 11
(Week ending
Mar. 15, 2025)
Week 12
(Week ending
Mar. 22, 2025)
Week 11
(Week ending
Mar. 15, 2025)
Very High0029
High7204484
Moderate131377122
Low1612192202
Minimal179372283
Insufficient Data21242229


*Data collected in ILINet may disproportionally represent certain populations within a jurisdiction or CBSA, and therefore, may not accurately depict the full picture of influenza activity for the entire jurisdiction or CBSA. Differences in the data presented here by CDC and independently by some health departments likely represent differing levels of data completeness with data presented by the health department likely being the more complete.

Additional information about medically attended visits for ILI for current and past seasons:


Surveillance Methods | FluView Interactive: National, Regional, and State Data or ILI Activity Map

National Syndromic Surveillance System (NSSP)


The overall percentage of emergency department (ED) visits with a discharge diagnosis of influenza reported in NSSP was 1.7% during Week 12, a decrease (change of > 0.1 percentage point) compared to the previous week. The percentage of ED visits with influenza discharge diagnoses decreased in all 10 HHS regions and across all age groups. RegionNationalRegion 1Region 2Region 3Region 4Region 5Region 6Region 7Region 8Region 9Region 10
Season2023-2024 & 2024-20252022-2023 Skip Over Chart Container
2.0%4.0%6.0%8.0%10.0%12.0%14.0%16.0%Percent of Emergency Department Visits for InfluenzaWeek 40 of 2023Week 44 of 2023Week 48 of 2023Week 52 of 2023Week 4 of 2024Week 8 of 2024Week 12 of 2024Week 16 of 2024Week 20 of 2024Week 24 of 2024Week 28 of 2024Week 32 of 2024Week 36 of 2024Week 40 of 2024Week 44 of 2024Week 48 of 2024Week 52 of 2024Week 4 of 2025Week 8 of 2025Week 12 of 2025

Age Group


All ages
0-4 years
5-17 years
18-64 years
65+ Skip Data Table
Data Table Download Data (CSV) Skipped data table.

Additional information about emergency department visits for flu for current and past seasons:‎‎‎


Surveillance Methods | Emergency Department Visits for COVID-19, flu, and RSV

Hospitalization surveillance

FluSurv-Net


The Influenza Hospitalization Surveillance Network (FluSurv-NET) conducts population-based surveillance for laboratory-confirmed influenza-related hospitalizations in select counties in 14 states and represents approximately 9% of the U.S. population. FluSurv-NET hospitalization data are preliminary. As data are received each week, prior case counts and rates are updated accordingly.

A total of 36,748 laboratory-confirmed influenza-associated hospitalizations were reported by FluSurv-NET sites between October 1, 2024 and March 22, 2025. The weekly hospitalization rate observed during Week 12 was 2.0 per 100,000 population. The weekly hospitalization rate observed during Week 6 (13.6 per 100,000 population) was the highest peak weekly rate observed across all seasons since 2010-2011. The cumulative hospitalization rate observed in Week 12 was 119.9 per 100,000 population, which is the highest cumulative hospitalization rate for Week 12 across all seasons since 2010-2011.

Among all hospitalizations 35,693 (97.1%) were associated with influenza A virus, 873 (2.4%) with influenza B virus, 31 (0.1%) with influenza A virus and influenza B virus co-infection, and 151 (0.4%) with influenza virus for which the type was not determined. Among those with influenza A subtype information, 5,756 (57.1%) had A(H1N1) pdm09 and 4,328 (42.9%) had A(H3N2).

When examining rates by age, the highest cumulative hospitalization rate per 100,000 population was among adults aged 65 years and older (377.1), followed by adults aged 50-64 years (140.5), children aged 0-4 years (99.3), adults aged 18-49 years (48.6), and children aged 5-17 years (37.5).

When examining age-adjusted rates by race and ethnicity, the highest cumulative hospitalization rate per 100,000 population was among non-Hispanic Black persons (202.5), followed by American Indian/Alaska Native persons (146.7), non-Hispanic White persons (103.4), Hispanic persons (99.0), and Asian/Pacific Islander persons (75.0).

Among 3,826 hospitalized adults with information on underlying medical conditions, 95.2% had at least one reported underlying medical condition; the most commonly reported were hypertension, cardiovascular disease, metabolic disease, and obesity. Among 1,757 hospitalized women of childbearing age (15-49 years) with information on pregnancy status, 28.6% were pregnant. Among 1,379 hospitalized children with information on underlying medical conditions, 52.9% had at least one reported underlying medical condition; the most commonly reported was asthma, followed by neurologic disease and obesity.


[SUB]**In this figure, weekly rates for all seasons prior to the 2024-2025 season reflect end-of-season rates. For the 2024-2025 season, rates for recent hospital admissions are subject to reporting delays and are shown as a dashed line for the current season. As hospitalization data are received each week, prior case counts and rates are updated accordingly.[/SUB]

Additional FluSurv-NET hospitalization surveillance information for current and past seasons and additional age groups:


Surveillance Methods | FluView Interactive: Rates by Age, Sex, and Race/Ethnicity or Data on Patient Characteristics | RESP-NET Interactive

National Healthcare Safety Network (NHSN) Hospital Respiratory Data


Hospitals report to NHSN the weekly number of patients with laboratory-confirmed influenza who were admitted to the hospital. Nationally, during Week 12, 12,990 laboratory confirmed influenza-associated hospitalizations were reported. This week's influenza-associated hospitalizations decreased (change of > 5%) compared to Week 11.

The weekly hospital admission rate observed in Week 12 was 3.9 per 100,000. The weekly rate of hospital admissions decreased in all 10 HHS regions and ranged from 2.1 (Region 9) to 6.8 (Region 3).

When examining rates by age for Week 12, all age groups decreased compared to the previous week. The highest hospital admission rate per 100,000 population was among those 65+ years (12.3), followed by 50-64 years (3.9), and 0-4 years (3.2).

Additional NHSN Hospital Respiratory Data information:


Surveillance Methods | Additional Data | FluView Interactive

Mortality surveillance

National Center for Health Statistics (NCHS) Mortality Surveillance


Based on NCHS mortality surveillance data available on March 27, 2025, 1.3% of the deaths that occurred during the week ending March 22, 2025 (Week 12), were due to influenza. This percentage decreased (≥ 0.1 percentage point change) compared to Week 11. The data presented are preliminary and may change as more data are received and processed.

Additional pneumonia, influenza and COVID-19 mortality surveillance information for current and past seasons:


Surveillance Methods | FluView Interactive

Influenza-Associated Pediatric Mortality


Eight influenza-associated pediatric deaths occurring during the 2024-2025 season were reported to CDC during Week 12. The deaths occurred during Week 50 of 2024 (the week ending December 14, 2024) and during Weeks 8 through 11 of 2025 (the weeks ending February 22, 2025 and March 15, 2025). Seven deaths were associated with influenza A viruses. Six of the influenza A viruses had subtyping performed; three were A(H1N1) viruses and three were A(H3N2) viruses. One death was associated with an influenza B virus with no lineage determined.

A total of 159 influenza-associated pediatric deaths occurring during the 2024-2025 season have been reported to CDC.

Additional pediatric mortality surveillance information for current and past seasons:


Surveillance Methods | FluView Interactive

Additional National and International Influenza Surveillance Information

Indicators Status by System


Increasing:
IncreasingArrow.png

Decreasing:
DecreasingArrow.png

Stable:
StableArrow.png


Clinical Labs: Up or down arrows indicate a change of greater than or equal to 0.5 percentage points in the percent of specimens positive for influenza compared to the previous week.
Outpatient Respiratory Illness (ILINet): Up or down arrows indicate a change of greater than 0.1 percentage points in the percent of visits due to respiratory illness (ILI) compared to the previous week.
NHSN Hospitalizations: Up or down arrows indicate change of greater than or equal to 5% of the number of patients admitted with laboratory-confirmed influenza compared to the previous week.
NCHS Mortality: Up or down arrows indicate change of greater than 0.1 percentage points of the percent of deaths due to influenza compared to the previous week.

Additional surveillance information


FluView Interactive: FluView includes enhanced web-based interactive applications that can provide dynamic visuals of the influenza data collected and analyzed by CDC. These FluView Interactive applications allow people to create customized, visual interpretations of influenza data, as well as make comparisons across flu seasons, regions, age groups and a variety of other demographics.

National Institute for Occupational Safety and Health: Monthly surveillance data on the prevalence of health-related workplace absenteeism among full-time workers in the United States are available from NIOSH.
https://www.cdc.gov/fluview/surveillance/2025-week-12.html
 
Back
Top