JimO
Well-known member
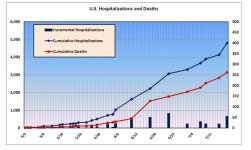
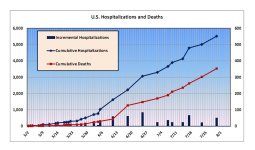
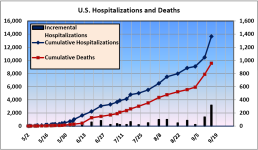
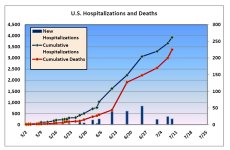
In order to get the hospitalization and death data on the same graph, I had to interpolate some of the data points provided by CDC since I couldn't get Excel to connect the data points otherwise. Also, the last hospitalization data point is based on my count, which includes estimates in many states, but is an underestimation because I have been conservative with my estimates. The last two death counts are from FT, since the most current CDC number is based on reports received through last Thursday morning.
Sorry, but I still haven't had time to figure out how to post the graph directly into the thread, so it's attached.
View attachment Hospitalizations and Deaths 7-9-09.pdf
Sorry, but I still haven't had time to figure out how to post the graph directly into the thread, so it's attached.
View attachment Hospitalizations and Deaths 7-9-09.pdf
 em
em