gsgs
Registered User
can we stickify this ?
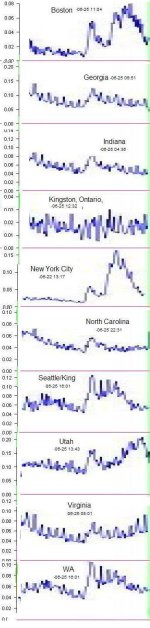
I think ISDS-charts give the most actual and informative picture
which is available from the outbreak in USA
see attachment for expansion.
I think one bar are 2 days , ignore the last bar (being updated...)
(this should be updated automatically ?)
https://isds.cirg.washington.edu/distribute/dailycountstimeseries.php
Boston

New York

North Carolina:

Utah:

expanded last few months in the attachment
I think ISDS-charts give the most actual and informative picture
which is available from the outbreak in USA
see attachment for expansion.
I think one bar are 2 days , ignore the last bar (being updated...)
(this should be updated automatically ?)
https://isds.cirg.washington.edu/distribute/dailycountstimeseries.php
Boston
New York
North Carolina:
Utah:
expanded last few months in the attachment