Re: CDC Director's Update Brief - July 7, 2009
Re: CDC Director's Update Brief - July 7, 2009
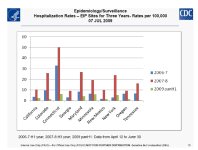
This chart from the brief is new and crazy. It appears to say that the hospitalization rate for seasonal type A-H1N1 in 06/07 and A-H3N2 in 07/08 was significantly higher than the current observed hospitalization rate for Pandemic H1N1...
View attachment 3662
If this chart is true, then this virus is very mild, and indeed there may actually be 1,000,000 cases like the CDC says.
Is this chart a joke, or am I interpreting it wrong?
That caught my eye as well pflu.
The chart displays rates which are: influenza hospitalizations per 100,000 influenza cases per time period. They don't specify the actual time period except for PanH1 which is April 12 - June 30, 2009. So the first point is that it is a misleading chart, because they compare different time period denominators with bars next to each other as if they were comparable.
So, a quick adjustment can be made if you assume that influenza hospitalizations occurred over 12 months for 2006 -7 and 2007 -8 whereas PanH1 hospitalizations occurred over 2.5 months. Multiply the PanH1 bars by 4.8 for a rough approximation.
However, we know that influenza surveillance slows down in the US during the summer months. So, for a more conservative estimate, you could assume that the flu ?year? for influenza hospitalizations includes the months of October through May, or 8 months. In that case you could multiply the PanH1 bars by 3.2 for a rough estimate of hospitalizations.
Limitations:
1) They do not have comprehensive data for all US hospitalizations through June 30. This chart was prepared before July 7. They are working with incomplete data for PanH1 time period, whereas most of the seasonal data should be finalized by now.
2) We are working with very different time periods/seasons. Historically in the US, we expect influenza to be more widespread in the fall through early spring. They are comparing these seasonal hospitalizations to a summertime flu outbreak. Potentially very different. Given a full year of PanH1data that includes the traditional flu season, we may indeed see a very different clinical picture.
3) We are working with very different age distributions. Seasonal influenza is most severe in the elderly. PanH1 severity peaks at a younger age. How does that affect hospitalization rates?
4) There are unknown detection/reporting biases associated with influenza diagnosis that make these data potentially not easily comparable. We have all heard about diagnosis problems (false negatives) related to the low sensitivity of the PanH1 rapid tests. Testing among states and locales is performed differently. Detection bias that differs among years of data is a potential problem.
In summary, this is a poor choice of graphic representation as it is not adjusted for time, and there are multiple differences in the underlying epidemiology. I await a more complete data set to really get a sense of how PanH1 hospitalization rates may compare to seasonal influenza hospitalization rates.