• FluTrackers.com Inc. does not provide medical advice. Information on this web site is collected from various internet resources, and the FluTrackers board of directors makes no warranty to the safety, efficacy, correctness or completeness of the information posted on this site by any author or poster. The information collated here is for instructional and/or discussion purposes only and is NOT intended to diagnose or treat any disease, illness, or other medical condition. Every individual reader or poster should seek advice from their personal physician/healthcare practitioner before considering or using any interventions that are discussed on this website. By continuing to access this website you agree to consult your personal physican before using any interventions posted on this website, and you agree to hold harmless FluTrackers.com Inc., the board of directors, the members, and all authors and posters for any effects from use of any medication, supplement, vitamin or other substance, device, intervention, etc. mentioned in posts on this website, or other internet venues referenced in posts on this website.
  • We are not asking for any donations. Do not donate to any entity who says they are raising funds for us.

CDC & White House Media Briefings on Swine Flu Epidemic

Re: CDC Director's Update Brief - July 7, 2009

Re: CDC Director's Update Brief - July 7, 2009

Thank you!! I notice that they are stating that they should send the message to people to "Make a plan." It remains to be seen how that message will be communicated.
 
Re: CDC Director's Update Brief - July 7, 2009

Re: CDC Director's Update Brief - July 7, 2009

thanks Thebes. Interesting how the document file name format has changed, the time of the update is included. I wonder if they are anticipating the need to have multiple updates per day?

Page 12:
Key DHHS/DHS Messages:

1. Government has a plan to prepare for significant flu outbreak in the fall and is taking action
 
Re: CDC Director's Update Brief - July 7, 2009

Re: CDC Director's Update Brief - July 7, 2009

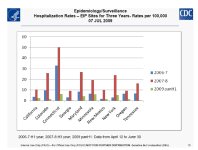
This chart from the brief is new and crazy. It appears to say that the hospitalization rate for seasonal type A-H1N1 in 06/07 and A-H3N2 in 07/08 was significantly higher than the current observed hospitalization rate for Pandemic H1N1...


hh1.jpg


If this chart is true, then this virus is very mild, and indeed there may actually be 1,000,000 cases like the CDC says.

Is this chart a joke, or am I interpreting it wrong?
 
Re: CDC Director's Update Brief - July 7, 2009

Re: CDC Director's Update Brief - July 7, 2009

Thanks Thebes. I've been looking for this since yesterday, but the file format is so different that it didn't come up on any searches.
 
Re: CDC Director's Update Brief - July 7, 2009

Re: CDC Director's Update Brief - July 7, 2009

Another Thanks,

I did the same thing as JimO earlier today and it didn't show for me either.
 
Re: CDC Director's Update Brief - July 7, 2009

Re: CDC Director's Update Brief - July 7, 2009

thanks Thebes. Interesting how the document file name format has changed, the time of the update is included. I wonder if they are anticipating the need to have multiple updates per day?

I wonder if the posting of the director's update bulletin links here recently caused this change to occur.

It may help to preserve the availability of this resource if the PDF bulletin file is attached and posted instead of the link.
 
Re: CDC Director's Update Brief - July 7, 2009

Re: CDC Director's Update Brief - July 7, 2009

I wonder if the posting of the director's update bulletin links here recently caused this change to occur.

The new link has a query string with a PHP session ID...

?PHPSESSID=e285568d45b31093708c078412156888

This indicates that this document was likely linked to someone logged into the astho.org PHP web server as a user. They probably just changed the way in which these documents are posted to astho.org., maybe someone new is doing it, looks like a legit IT move.
 
Re: CDC Director's Update Brief - July 7, 2009

Re: CDC Director's Update Brief - July 7, 2009

Just FYI - I found it the old-fashioned way - by going to the ASTHO recent publications page and looking under "july". It may have been posted there by someone different because it is titled in a slightly different way than the June briefs.
 
Re: CDC Director's Update Brief - July 7, 2009

Re: CDC Director's Update Brief - July 7, 2009

This chart from the brief is new and crazy. It appears to say that the hospitalization rate for seasonal type A-H1N1 in 06/07 and A-H3N2 in 07/08 was significantly higher than the current observed hospitalization rate for Pandemic H1N1...


View attachment 3662


If this chart is true, then this virus is very mild, and indeed there may actually be 1,000,000 cases like the CDC says.

Is this chart a joke, or am I interpreting it wrong?

That caught my eye as well pflu.

The chart displays rates which are: influenza hospitalizations per 100,000 influenza cases per time period. They don't specify the actual time period except for PanH1 which is April 12 - June 30, 2009. So the first point is that it is a misleading chart, because they compare different time period denominators with bars next to each other as if they were comparable.

So, a quick adjustment can be made if you assume that influenza hospitalizations occurred over 12 months for 2006 -7 and 2007 -8 whereas PanH1 hospitalizations occurred over 2.5 months. Multiply the PanH1 bars by 4.8 for a rough approximation.

However, we know that influenza surveillance slows down in the US during the summer months. So, for a more conservative estimate, you could assume that the flu ?year? for influenza hospitalizations includes the months of October through May, or 8 months. In that case you could multiply the PanH1 bars by 3.2 for a rough estimate of hospitalizations.

Limitations:
1) They do not have comprehensive data for all US hospitalizations through June 30. This chart was prepared before July 7. They are working with incomplete data for PanH1 time period, whereas most of the seasonal data should be finalized by now.
2) We are working with very different time periods/seasons. Historically in the US, we expect influenza to be more widespread in the fall through early spring. They are comparing these seasonal hospitalizations to a summertime flu outbreak. Potentially very different. Given a full year of PanH1data that includes the traditional flu season, we may indeed see a very different clinical picture.
3) We are working with very different age distributions. Seasonal influenza is most severe in the elderly. PanH1 severity peaks at a younger age. How does that affect hospitalization rates?
4) There are unknown detection/reporting biases associated with influenza diagnosis that make these data potentially not easily comparable. We have all heard about diagnosis problems (false negatives) related to the low sensitivity of the PanH1 rapid tests. Testing among states and locales is performed differently. Detection bias that differs among years of data is a potential problem.

In summary, this is a poor choice of graphic representation as it is not adjusted for time, and there are multiple differences in the underlying epidemiology. I await a more complete data set to really get a sense of how PanH1 hospitalization rates may compare to seasonal influenza hospitalization rates.

 
Re: CDC Director's Update Brief - July 7, 2009

Re: CDC Director's Update Brief - July 7, 2009

They didn't report the underlying conditions like they did in June!

I don't get it. Isn't that the information we need? Healthy people are looking at a mild illness; people with certain underlying conditions are at much greater risk. So what are they, as the virus evloves?

The issue now is not counting the cases, but counting the fatalities.

J.
 
Re: CDC Director's Update Brief - July 7, 2009

Re: CDC Director's Update Brief - July 7, 2009

Multiply the PanH1 bars by 4.8 for a rough approximation.

Hi farmer,

I don't think you can multiple it for a rough estimate due to the fact it's a rate of infection vs. a hard number.

I agree with your post, the chart is basically useless.


3) We are working with very different age distributions. Seasonal influenza is most severe in the elderly. PanH1 severity peaks at a younger age. How does that affect hospitalization rates?

The is a good point and will be the real game changer once other demographics are infected come the fall.
 
Re: CDC Director's Update Brief - July 7, 2009

Re: CDC Director's Update Brief - July 7, 2009

Just FYI - I found it the old-fashioned way - by going to the ASTHO recent publications page and looking under "july". It may have been posted there by someone different because it is titled in a slightly different way than the June briefs.

How do you navigate to the Recent Publications Page? Also, what is this ASTHO organization's relationship to the CDC?
 
Re: CDC Director's Update Brief - July 7, 2009

Re: CDC Director's Update Brief - July 7, 2009

I agree with your post, the chart is basically useless.

It's not much use for analyzing the data properly, and it paints a rosier picture than what the data show.
 
Re: CDC Director's Update Brief - July 7, 2009

Re: CDC Director's Update Brief - July 7, 2009

I would assume there is a version that is classified. As for the file name I do not think it is coincidence
 
Re: CDC Director's Update Brief - July 10, 2009

Re: CDC Director's Update Brief - July 10, 2009

lets hope there is a classified version that we're not seeing. this deck is worthless
 
Re: CDC Director's Update Brief - July 10, 2009

Re: CDC Director's Update Brief - July 10, 2009

lets hope there is a classified version that we're not seeing. this deck is worthless

I thought it was rather sparse, certainly less in it that usual.
 
Re: CDC director's update brief 7/14/09

Re: CDC director's update brief 7/14/09

Thanks Zac.
Finally a decent deck. I found the precautions taken by those infected interesting, as well as the vaccination plans.
 
Back
Top