Ronan Kelly
Retired 2020
Re: Australia Influenza Surveillance 2014
Updated information is indicated with a *
*New South Wales
Week 36 Ending 7 September 2014
Summary:
For the week ending 7 September 2014, influenza activity in the community across
NSW remained high but continues to trend downward.
Emergency Department (ED) surveillance ? influenza-like illness (ILI) presentations to ED
decreased further this week but remained high. ILI and pneumonia admissions to critical
care wards decreased again this week and were within the usual range.
Laboratory surveillance ? influenza activity eased slightly this week but remains well above
the usual range for this time of year, with the influenza A(H3N2) strain predominating.
Reporting of laboratory-confirmed influenza outbreaks in aged care facilities has
decreased.
Community illness surveillance ? data collected from eGPS, ASPREN and FluTracking
indicated continuing high ILI activity in NSW however decreasing.
Hospitalisations surveillance (FluCAN) ? eleven new confirmed influenza admissions were
reported.
National and International influenza surveillance ? the influenza A(H1N1)pdm09 strain is
the predominant strain in most jurisdictions (unlike NSW). Moderate influenza activity was
reported across the southern hemisphere. Two new human cases of infection with the
avian influenza A(H7N9) strain from China; otherwise low influenza activity worldwide.
For more information: NSW Health - Infectious Diseases
*Queensland
For Period 1-7 September 2014
There were 1,157 notifications reported this week. Of these cases, 170 were attributed to influenza B virus. Of the 987 Influenza A samples, 60 were identified as A(H1N1)pdm09 and 31 as A/H3N2. There were 120 hospital admissions including 8 to ICU.
YTD there were 13,386 notifications reported. Of these cases, 1,552 were attributed to influenza B virus. Of the 11,834 Influenza A samples, 1,804 were identified as A(H1N1)pdm09 and 314 as A/H3N2.
There have been 1,739 hospital admissions including 215 to ICU.
For more information: QLD Health
*South Australia
31 August to 6 September 2014
One thousand and thirty-eight cases of influenza were reported this week. Of these, 970 were
characterised as influenza A and 68 were characterised as influenza B. There have been 6,038
influenza cases notified year-to-date, compared with 2,245 cases reported for the same period last
year.
Cases comprised of 495 males and 543 females, with a median age of 37 years. Two hundred and
fifty-two (24%) notifications were for children aged less than 10 years and 172 (17%) notifications
were for persons aged over 65 years.
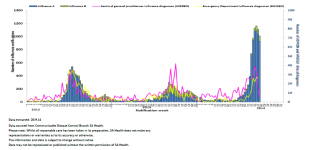
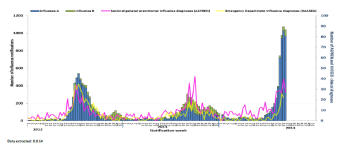
The influenza chart shows continuing influenza activity in South Australia.
For more information: SA Health
Tasmania
Issue 5 | 5 August 2014
This report describes influenza activity within Tasmanian during August 2014 up to and including Sunday 31
August 2014. Available data indicate:
The 2014 influenza season is underway.
Notifications of laboratory-diagnosed influenza during August were more than three times higher than
during July.
The majority of influenza notifications continue to be Influenza A infections. The most frequently reported
Influenza A subtype within Tasmania is A(H1N1)pdm09.
Data on general respiratory pathogen testing indicate Influenza A virus as currently being the pathogen most
frequently causing influenza-like illness within Tasmania.
Influenza notifications
Tasmanian laboratories are required to notify the Director of Public Health of evidence of influenza infection in
specimens collected from patients. These specimens are usually nose or throat swabs but can also include a blood
sample. The best test for influenza involves PCR1 to detect influenza virus RNA present in a nose or throat swab.
In the five weeks since the last report a further 245 notifications of laboratory-diagnosed influenza have been
notified, taking the 2014 total to 439 notifications. The number of weekly notifications has increased since July, with
the latest peak in activity occurring during the last three weeks of August (see Figure 1). The current level of
notification within Tasmania is consistent with levels during a typical winter influenza season.
Residents from the more populous southern region of Tasmania made up the largest proportion (61%) of influenza
notifications since the last report (see Table 1).
...
Of the 439 influenza notifications received since the start of 2014, 400 (91%) were due to Influenza A virus
infections. The remaining 39 (9%) notifications were infections with Influenza B virus (see Table 2). Some influenza
laboratory isolates undergo further testing to identify subtypes. The most frequently identified Influenza A subtype of
2014 is currently the A(H1N1)pdm09 subtype2.
...
For more information: DHHS Tasmania
*Victoria
Report No 19 Week ending 07/09/14
Summary
Influenza-like illness (ILI) activity remained above baseline levels this week with 7.5 cases per 1000 patients seen.
Data from the National Home Doctor Service (Victorian data) remained above the seasonal threshold at 14.4.
From the 391 swabs received from surveillance GPs this season (28/4/14 ? 7/9/14) 155 (40%) have been positive
for influenza A, 94 A(H1N1)pdm2009, 46 A(H3N2), 9 untyped, 3 influenza B and 3 influenza C. This week we
received 25 surveillance swabs of which 10 (40%) were positive for influenza A, 2 A(H1N1)pdm 2009, 6 H3N2 and
2 untyped.
The majority of viruses detected through routine testing this week were influenza A. Of the 315 influenza viruses
detected so far this year 153 were A(H1N1)pdm09, 128 were A(H3N2), 22 are untyped and 12 were influenza B.
This week the Influenza Complications Network (FluCAN) reported 7 hospitalisations, 3 with influenza A (untyped),
2 influenza A(H3N2) and 2 with influenza A(H1N1)pdm2009. Since 11/4/2014 FluCAN have reported 247
hospitalisations with confirmed influenza, of which 127 were untyped influenza A patients, 27 were influenza
A(H3N2), 84 were A(H1N1)pdm09 and 9 were influenza B, from the 4 Victorian sentinel hospitals.
Of the 205 influenza viruses analysed at the WHO Collaborating Centre for Reference and Research on Influenza
year to date from Victoria, 183 were A(H1N1)pdm09 and 22 A(H3N2).
The total number of laboratory confirmed notifications to the National Notifiable Diseases Surveillance System
(NNDSS) to date was 47,476, of which 5,942 (12.5%) were from Victoria.
For more information: Victorian Infectious Diseases Reference Laboratory
*Western Australia
WEEK ENDING 07TH SEPTEMBER 2014
Summary: Influenza activity is declining. Non-influenza respiratory virus activity was relatively stable
this week.
? Indicators of influenza activity, including notifications, proportion of positive laboratory tests for
influenza, ILI presentations to sentinel general practitioners (GPs), Emergency Department ILI
presentations and influenza-associated hospitalisations decreased this week.
? The majority of influenza viruses subtyped were influenza A/H1N1; epidemic A/H3N2 activity in
the West Kimberley region continues to decrease. Influenza B continues to circulate at a low
level.
? Detections of non-influenza respiratory viruses decreased or remained stable this week.
For more information: WA Dept.of Health
*Nationally
For the period to Jan 1- September 13th, 2014 there were 49,812 confirmed Influenza cases. (Ro's note: only 2009 with 59,029 has been higher)
The majority of notifications have been in NSW with 17,038 (higher than 2009 - Ro), QLD had 14,033, SA 6,774, VIC 6,199, WA had 3,737, ACT 951, NT 568 and TAS 512.
For national data: National Notifiable Diseases Surveillance System
*Australian Sentinel Practices Research Network (ASPREN)
No. 16, 2014
28th July 2014 ? 10th August 2014
INFLUENZA-LIKE-ILLNESS (ILI)
Nationally, ILI notifications largely increased over the period
with 292 and 282 notifications in week 31 and 32
respectively. ILI rates reported in this period largely
increased with 18 cases per 1000 consultations in weeks 31
and 32, compared to 7 and 10 cases per 1000
consultations in weeks 29 and 30 respectively. For the
same reporting period in 2013, ILI rates were lower at 13
and 10 cases per 1000 consultations respectively (see
Figure 5). On a state-by-state basis, it is important to note
the increased ILI rate in Urban QLD (see Figure 2).
For more information: ASPREN
*Flu Tracking
Flutracking Weekly Interim Report
Week ending 07 September 2014
Low levels of influenza-like illness activity
This survey was sent on Monday, 08 September 2014 at 01:13 AM and by 09:00 AM, Thursday 11 September we had
received 15771 responses (15918 last week) from 9861 people responding for themselves and 5910 household
members across Australia.
Across Australia, fever and cough was reported by 3.3% of
vaccinated participants and 3.9% of unvaccinated
participants. Fever, cough and absence from normal duties
was reported by 2.1% of vaccinated participants and 2.8%
of unvaccinated participants.
For participants this week, 9246/15771 (58.6 %) have
received the seasonal vaccine so far. Of the 3132
participants who identified as working face-to-face with
patients, 2445 (78.1%) have received the vaccine.
For more information: Flu Tracking
Australian influenza report 2013 - Current report:
Australian Influenza Surveillance Report No 05 - 16 August to 29 August 2014
Across most jurisdictions, seasonal influenza activity appears to have peaked in recent weeks with the exception of South Australia and the Northern Territory where activity continues to rise.
As at 29 August 2014, there have been 42,354 cases of laboratory confirmed influenza reported, with 12,279 notifications occurring during the report fortnight.
Nationally influenza A is the predominant influenza virus type. Of those viruses where subtyping data are available, A(H1N1)pdm09 remains the predominant influenza virus type in most jurisdictions. In New South Wales and the Australian Capital Territory, influenza A(H3N2) is the most common virus type.
The influenza vaccine is likely to provide good coverage against the currently circulating viruses.
The rate of influenza associated hospitalisations has remained stable over the past fortnight, with around 11% of cases admitted directly to ICU. The majority of hospital admissions have been associated influenza A infections and the median age of cases is 45 years.
The severity of the 2014 influenza season appears to be moderate across most jurisdictions. However, more severe activity is noted in NSW, where influenza A(H3N2) is circulating at higher levels and affecting people in older age-groups, which has led to a substantial number of outbreaks in aged care facilities.
The WHO has reported that globally influenza activity has continued to increase in the southern hemisphere and has remained low elsewhere.
For more information: Department of Health
Updated information is indicated with a *
*New South Wales
Week 36 Ending 7 September 2014
Summary:
For the week ending 7 September 2014, influenza activity in the community across
NSW remained high but continues to trend downward.
Emergency Department (ED) surveillance ? influenza-like illness (ILI) presentations to ED
decreased further this week but remained high. ILI and pneumonia admissions to critical
care wards decreased again this week and were within the usual range.
Laboratory surveillance ? influenza activity eased slightly this week but remains well above
the usual range for this time of year, with the influenza A(H3N2) strain predominating.
Reporting of laboratory-confirmed influenza outbreaks in aged care facilities has
decreased.
Community illness surveillance ? data collected from eGPS, ASPREN and FluTracking
indicated continuing high ILI activity in NSW however decreasing.
Hospitalisations surveillance (FluCAN) ? eleven new confirmed influenza admissions were
reported.
National and International influenza surveillance ? the influenza A(H1N1)pdm09 strain is
the predominant strain in most jurisdictions (unlike NSW). Moderate influenza activity was
reported across the southern hemisphere. Two new human cases of infection with the
avian influenza A(H7N9) strain from China; otherwise low influenza activity worldwide.
For more information: NSW Health - Infectious Diseases
*Queensland
For Period 1-7 September 2014
There were 1,157 notifications reported this week. Of these cases, 170 were attributed to influenza B virus. Of the 987 Influenza A samples, 60 were identified as A(H1N1)pdm09 and 31 as A/H3N2. There were 120 hospital admissions including 8 to ICU.
YTD there were 13,386 notifications reported. Of these cases, 1,552 were attributed to influenza B virus. Of the 11,834 Influenza A samples, 1,804 were identified as A(H1N1)pdm09 and 314 as A/H3N2.
There have been 1,739 hospital admissions including 215 to ICU.
For more information: QLD Health
*South Australia
31 August to 6 September 2014
One thousand and thirty-eight cases of influenza were reported this week. Of these, 970 were
characterised as influenza A and 68 were characterised as influenza B. There have been 6,038
influenza cases notified year-to-date, compared with 2,245 cases reported for the same period last
year.
Cases comprised of 495 males and 543 females, with a median age of 37 years. Two hundred and
fifty-two (24%) notifications were for children aged less than 10 years and 172 (17%) notifications
were for persons aged over 65 years.
The influenza chart shows continuing influenza activity in South Australia.
For more information: SA Health
Tasmania
Issue 5 | 5 August 2014
This report describes influenza activity within Tasmanian during August 2014 up to and including Sunday 31
August 2014. Available data indicate:
The 2014 influenza season is underway.
Notifications of laboratory-diagnosed influenza during August were more than three times higher than
during July.
The majority of influenza notifications continue to be Influenza A infections. The most frequently reported
Influenza A subtype within Tasmania is A(H1N1)pdm09.
Data on general respiratory pathogen testing indicate Influenza A virus as currently being the pathogen most
frequently causing influenza-like illness within Tasmania.
Influenza notifications
Tasmanian laboratories are required to notify the Director of Public Health of evidence of influenza infection in
specimens collected from patients. These specimens are usually nose or throat swabs but can also include a blood
sample. The best test for influenza involves PCR1 to detect influenza virus RNA present in a nose or throat swab.
In the five weeks since the last report a further 245 notifications of laboratory-diagnosed influenza have been
notified, taking the 2014 total to 439 notifications. The number of weekly notifications has increased since July, with
the latest peak in activity occurring during the last three weeks of August (see Figure 1). The current level of
notification within Tasmania is consistent with levels during a typical winter influenza season.
Residents from the more populous southern region of Tasmania made up the largest proportion (61%) of influenza
notifications since the last report (see Table 1).
...
Of the 439 influenza notifications received since the start of 2014, 400 (91%) were due to Influenza A virus
infections. The remaining 39 (9%) notifications were infections with Influenza B virus (see Table 2). Some influenza
laboratory isolates undergo further testing to identify subtypes. The most frequently identified Influenza A subtype of
2014 is currently the A(H1N1)pdm09 subtype2.
...
For more information: DHHS Tasmania
*Victoria
Report No 19 Week ending 07/09/14
Summary
Influenza-like illness (ILI) activity remained above baseline levels this week with 7.5 cases per 1000 patients seen.
Data from the National Home Doctor Service (Victorian data) remained above the seasonal threshold at 14.4.
From the 391 swabs received from surveillance GPs this season (28/4/14 ? 7/9/14) 155 (40%) have been positive
for influenza A, 94 A(H1N1)pdm2009, 46 A(H3N2), 9 untyped, 3 influenza B and 3 influenza C. This week we
received 25 surveillance swabs of which 10 (40%) were positive for influenza A, 2 A(H1N1)pdm 2009, 6 H3N2 and
2 untyped.
The majority of viruses detected through routine testing this week were influenza A. Of the 315 influenza viruses
detected so far this year 153 were A(H1N1)pdm09, 128 were A(H3N2), 22 are untyped and 12 were influenza B.
This week the Influenza Complications Network (FluCAN) reported 7 hospitalisations, 3 with influenza A (untyped),
2 influenza A(H3N2) and 2 with influenza A(H1N1)pdm2009. Since 11/4/2014 FluCAN have reported 247
hospitalisations with confirmed influenza, of which 127 were untyped influenza A patients, 27 were influenza
A(H3N2), 84 were A(H1N1)pdm09 and 9 were influenza B, from the 4 Victorian sentinel hospitals.
Of the 205 influenza viruses analysed at the WHO Collaborating Centre for Reference and Research on Influenza
year to date from Victoria, 183 were A(H1N1)pdm09 and 22 A(H3N2).
The total number of laboratory confirmed notifications to the National Notifiable Diseases Surveillance System
(NNDSS) to date was 47,476, of which 5,942 (12.5%) were from Victoria.
For more information: Victorian Infectious Diseases Reference Laboratory
*Western Australia
WEEK ENDING 07TH SEPTEMBER 2014
Summary: Influenza activity is declining. Non-influenza respiratory virus activity was relatively stable
this week.
? Indicators of influenza activity, including notifications, proportion of positive laboratory tests for
influenza, ILI presentations to sentinel general practitioners (GPs), Emergency Department ILI
presentations and influenza-associated hospitalisations decreased this week.
? The majority of influenza viruses subtyped were influenza A/H1N1; epidemic A/H3N2 activity in
the West Kimberley region continues to decrease. Influenza B continues to circulate at a low
level.
? Detections of non-influenza respiratory viruses decreased or remained stable this week.
For more information: WA Dept.of Health
*Nationally
For the period to Jan 1- September 13th, 2014 there were 49,812 confirmed Influenza cases. (Ro's note: only 2009 with 59,029 has been higher)
The majority of notifications have been in NSW with 17,038 (higher than 2009 - Ro), QLD had 14,033, SA 6,774, VIC 6,199, WA had 3,737, ACT 951, NT 568 and TAS 512.
For national data: National Notifiable Diseases Surveillance System
*Australian Sentinel Practices Research Network (ASPREN)
No. 16, 2014
28th July 2014 ? 10th August 2014
INFLUENZA-LIKE-ILLNESS (ILI)
Nationally, ILI notifications largely increased over the period
with 292 and 282 notifications in week 31 and 32
respectively. ILI rates reported in this period largely
increased with 18 cases per 1000 consultations in weeks 31
and 32, compared to 7 and 10 cases per 1000
consultations in weeks 29 and 30 respectively. For the
same reporting period in 2013, ILI rates were lower at 13
and 10 cases per 1000 consultations respectively (see
Figure 5). On a state-by-state basis, it is important to note
the increased ILI rate in Urban QLD (see Figure 2).
For more information: ASPREN
*Flu Tracking
Flutracking Weekly Interim Report
Week ending 07 September 2014
Low levels of influenza-like illness activity
This survey was sent on Monday, 08 September 2014 at 01:13 AM and by 09:00 AM, Thursday 11 September we had
received 15771 responses (15918 last week) from 9861 people responding for themselves and 5910 household
members across Australia.
Across Australia, fever and cough was reported by 3.3% of
vaccinated participants and 3.9% of unvaccinated
participants. Fever, cough and absence from normal duties
was reported by 2.1% of vaccinated participants and 2.8%
of unvaccinated participants.
For participants this week, 9246/15771 (58.6 %) have
received the seasonal vaccine so far. Of the 3132
participants who identified as working face-to-face with
patients, 2445 (78.1%) have received the vaccine.
For more information: Flu Tracking
Australian influenza report 2013 - Current report:
Australian Influenza Surveillance Report No 05 - 16 August to 29 August 2014
Across most jurisdictions, seasonal influenza activity appears to have peaked in recent weeks with the exception of South Australia and the Northern Territory where activity continues to rise.
As at 29 August 2014, there have been 42,354 cases of laboratory confirmed influenza reported, with 12,279 notifications occurring during the report fortnight.
Nationally influenza A is the predominant influenza virus type. Of those viruses where subtyping data are available, A(H1N1)pdm09 remains the predominant influenza virus type in most jurisdictions. In New South Wales and the Australian Capital Territory, influenza A(H3N2) is the most common virus type.
The influenza vaccine is likely to provide good coverage against the currently circulating viruses.
The rate of influenza associated hospitalisations has remained stable over the past fortnight, with around 11% of cases admitted directly to ICU. The majority of hospital admissions have been associated influenza A infections and the median age of cases is 45 years.
The severity of the 2014 influenza season appears to be moderate across most jurisdictions. However, more severe activity is noted in NSW, where influenza A(H3N2) is circulating at higher levels and affecting people in older age-groups, which has led to a substantial number of outbreaks in aged care facilities.
The WHO has reported that globally influenza activity has continued to increase in the southern hemisphere and has remained low elsewhere.
For more information: Department of Health