
• FluTrackers.com Inc. does not provide medical advice. Information on this web site is collected from various internet resources, and the FluTrackers board of directors makes no warranty to the safety, efficacy, correctness or completeness of the information posted on this site by any author or poster. The information collated here is for instructional and/or discussion purposes only and is NOT intended to diagnose or treat any disease, illness, or other medical condition. Every individual reader or poster should seek advice from their personal physician/healthcare practitioner before considering or using any interventions that are discussed on this website. By continuing to access this website you agree to consult your personal physican before using any interventions posted on this website, and you agree to hold harmless FluTrackers.com Inc., the board of directors, the members, and all authors and posters for any effects from use of any medication, supplement, vitamin or other substance, device, intervention, etc. mentioned in posts on this website, or other internet venues referenced in posts on this website.
  • We are not asking for any donations. Do not donate to any entity who says they are raising funds for us.

Australia Influenza Surveillance 2014

Re: Australia Influenza Surveillance 2014

Updated information is indicated with a *

*New South Wales

Week 36 Ending 7 September 2014

Summary:
For the week ending 7 September 2014, influenza activity in the community across
NSW remained high but continues to trend downward.

 Emergency Department (ED) surveillance ? influenza-like illness (ILI) presentations to ED
decreased further this week but remained high. ILI and pneumonia admissions to critical
care wards decreased again this week and were within the usual range.
 Laboratory surveillance ? influenza activity eased slightly this week but remains well above
the usual range for this time of year, with the influenza A(H3N2) strain predominating.
Reporting of laboratory-confirmed influenza outbreaks in aged care facilities has
decreased.
 Community illness surveillance ? data collected from eGPS, ASPREN and FluTracking
indicated continuing high ILI activity in NSW however decreasing.
 Hospitalisations surveillance (FluCAN) ? eleven new confirmed influenza admissions were
reported.
 National and International influenza surveillance ? the influenza A(H1N1)pdm09 strain is
the predominant strain in most jurisdictions (unlike NSW). Moderate influenza activity was
reported across the southern hemisphere. Two new human cases of infection with the
avian influenza A(H7N9) strain from China; otherwise low influenza activity worldwide.

For more information: NSW Health - Infectious Diseases

*Queensland

For Period 1-7 September 2014

There were 1,157 notifications reported this week. Of these cases, 170 were attributed to influenza B virus. Of the 987 Influenza A samples, 60 were identified as A(H1N1)pdm09 and 31 as A/H3N2. There were 120 hospital admissions including 8 to ICU.

YTD there were 13,386 notifications reported. Of these cases, 1,552 were attributed to influenza B virus. Of the 11,834 Influenza A samples, 1,804 were identified as A(H1N1)pdm09 and 314 as A/H3N2.

There have been 1,739 hospital admissions including 215 to ICU.

For more information: QLD Health

*South Australia

31 August to 6 September 2014

One thousand and thirty-eight cases of influenza were reported this week. Of these, 970 were
characterised as influenza A and 68 were characterised as influenza B. There have been 6,038
influenza cases notified year-to-date, compared with 2,245 cases reported for the same period last
year.
Cases comprised of 495 males and 543 females, with a median age of 37 years. Two hundred and
fifty-two (24%) notifications were for children aged less than 10 years and 172 (17%) notifications
were for persons aged over 65 years.
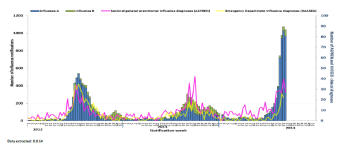
The influenza chart shows continuing influenza activity in South Australia.
SA.png

For more information: SA Health

Tasmania
Issue 5 | 5 August 2014

This report describes influenza activity within Tasmanian during August 2014 up to and including Sunday 31

August 2014. Available data indicate:
 The 2014 influenza season is underway.
Notifications of laboratory-diagnosed influenza during August were more than three times higher than
during July.

 The majority of influenza notifications continue to be Influenza A infections. The most frequently reported
Influenza A subtype within Tasmania is A(H1N1)pdm09.
 Data on general respiratory pathogen testing indicate Influenza A virus as currently being the pathogen most
frequently causing influenza-like illness within Tasmania.

Influenza notifications
Tasmanian laboratories are required to notify the Director of Public Health of evidence of influenza infection in
specimens collected from patients. These specimens are usually nose or throat swabs but can also include a blood
sample. The best test for influenza involves PCR1 to detect influenza virus RNA present in a nose or throat swab.

In the five weeks since the last report a further 245 notifications of laboratory-diagnosed influenza have been
notified, taking the 2014 total to 439 notifications. The number of weekly notifications has increased since July, with
the latest peak in activity occurring during the last three weeks of August (see Figure 1). The current level of
notification within Tasmania is consistent with levels during a typical winter influenza season.

Residents from the more populous southern region of Tasmania made up the largest proportion (61%) of influenza
notifications since the last report (see Table 1).
...
Of the 439 influenza notifications received since the start of 2014, 400 (91%) were due to Influenza A virus
infections. The remaining 39 (9%) notifications were infections with Influenza B virus (see Table 2). Some influenza
laboratory isolates undergo further testing to identify subtypes. The most frequently identified Influenza A subtype of
2014 is currently the A(H1N1)pdm09 subtype2.
...

For more information: DHHS Tasmania

*Victoria

Report No 19 Week ending 07/09/14
Summary
 Influenza-like illness (ILI) activity remained above baseline levels this week with 7.5 cases per 1000 patients seen.
Data from the National Home Doctor Service (Victorian data) remained above the seasonal threshold at 14.4.
 From the 391 swabs received from surveillance GPs this season (28/4/14 ? 7/9/14) 155 (40%) have been positive
for influenza A, 94 A(H1N1)pdm2009, 46 A(H3N2), 9 untyped, 3 influenza B and 3 influenza C. This week we
received 25 surveillance swabs of which 10 (40%) were positive for influenza A, 2 A(H1N1)pdm 2009, 6 H3N2 and
2 untyped.
 The majority of viruses detected through routine testing this week were influenza A. Of the 315 influenza viruses
detected so far this year 153 were A(H1N1)pdm09, 128 were A(H3N2), 22 are untyped and 12 were influenza B.
 This week the Influenza Complications Network (FluCAN) reported 7 hospitalisations, 3 with influenza A (untyped),
2 influenza A(H3N2) and 2 with influenza A(H1N1)pdm2009. Since 11/4/2014 FluCAN have reported 247
hospitalisations with confirmed influenza, of which 127 were untyped influenza A patients, 27 were influenza
A(H3N2), 84 were A(H1N1)pdm09 and 9 were influenza B, from the 4 Victorian sentinel hospitals.
 Of the 205 influenza viruses analysed at the WHO Collaborating Centre for Reference and Research on Influenza
year to date from Victoria, 183 were A(H1N1)pdm09 and 22 A(H3N2).
 The total number of laboratory confirmed notifications to the National Notifiable Diseases Surveillance System
(NNDSS) to date was 47,476, of which 5,942 (12.5%) were from Victoria.

For more information: Victorian Infectious Diseases Reference Laboratory

*Western Australia

WEEK ENDING 07TH SEPTEMBER 2014

Summary: Influenza activity is declining. Non-influenza respiratory virus activity was relatively stable
this week.
? Indicators of influenza activity, including notifications, proportion of positive laboratory tests for
influenza, ILI presentations to sentinel general practitioners (GPs), Emergency Department ILI
presentations and influenza-associated hospitalisations decreased this week.
? The majority of influenza viruses subtyped were influenza A/H1N1; epidemic A/H3N2 activity in
the West Kimberley region continues to decrease. Influenza B continues to circulate at a low
level.
? Detections of non-influenza respiratory viruses decreased or remained stable this week.

For more information: WA Dept.of Health

*Nationally

For the period to Jan 1- September 13th, 2014 there were 49,812 confirmed Influenza cases. (Ro's note: only 2009 with 59,029 has been higher)

The majority of notifications have been in NSW with 17,038 (higher than 2009 - Ro), QLD had 14,033, SA 6,774, VIC 6,199, WA had 3,737, ACT 951, NT 568 and TAS 512.

For national data: National Notifiable Diseases Surveillance System

*Australian Sentinel Practices Research Network (ASPREN)

No. 16, 2014
28th July 2014 ? 10th August 2014

INFLUENZA-LIKE-ILLNESS (ILI)
Nationally, ILI notifications largely increased over the period
with 292 and 282 notifications in week 31 and 32
respectively. ILI rates reported in this period largely
increased with 18 cases per 1000 consultations in weeks 31
and 32, compared to 7 and 10 cases per 1000
consultations in weeks 29 and 30 respectively. For the
same reporting period in 2013, ILI rates were lower at 13
and 10 cases per 1000 consultations respectively (see
Figure 5). On a state-by-state basis, it is important to note
the increased ILI rate in Urban QLD (see Figure 2).

For more information: ASPREN

*Flu Tracking

Flutracking Weekly Interim Report
Week ending 07 September 2014

Low levels of influenza-like illness activity

This survey was sent on Monday, 08 September 2014 at 01:13 AM and by 09:00 AM, Thursday 11 September we had
received 15771 responses (15918 last week) from 9861 people responding for themselves and 5910 household
members across Australia.

Across Australia, fever and cough was reported by 3.3% of
vaccinated participants and 3.9% of unvaccinated
participants. Fever, cough and absence from normal duties
was reported by 2.1% of vaccinated participants and 2.8%
of unvaccinated participants.

For participants this week, 9246/15771 (58.6 %) have
received the seasonal vaccine so far. Of the 3132
participants who identified as working face-to-face with
patients, 2445 (78.1%) have received the vaccine.

For more information: Flu Tracking

Australian influenza report 2013 - Current report:

Australian Influenza Surveillance Report No 05 - 16 August to 29 August 2014

Across most jurisdictions, seasonal influenza activity appears to have peaked in recent weeks with the exception of South Australia and the Northern Territory where activity continues to rise.
As at 29 August 2014, there have been 42,354 cases of laboratory confirmed influenza reported, with 12,279 notifications occurring during the report fortnight.
Nationally influenza A is the predominant influenza virus type. Of those viruses where subtyping data are available, A(H1N1)pdm09 remains the predominant influenza virus type in most jurisdictions. In New South Wales and the Australian Capital Territory, influenza A(H3N2) is the most common virus type.
The influenza vaccine is likely to provide good coverage against the currently circulating viruses.
The rate of influenza associated hospitalisations has remained stable over the past fortnight, with around 11% of cases admitted directly to ICU. The majority of hospital admissions have been associated influenza A infections and the median age of cases is 45 years.
The severity of the 2014 influenza season appears to be moderate across most jurisdictions. However, more severe activity is noted in NSW, where influenza A(H3N2) is circulating at higher levels and affecting people in older age-groups, which has led to a substantial number of outbreaks in aged care facilities.
The WHO has reported that globally influenza activity has continued to increase in the southern hemisphere and has remained low elsewhere.

For more information: Department of Health
 
Re: Australia Influenza Surveillance 2014

Updated information is indicated with a *

*New South Wales

Week 37 Ending 14 September 2014

Summary:
For the week ending 14 September 2014, influenza activity in the community across
NSW was moderate and continues to trend downward.
 Emergency Department (ED) surveillance ? influenza-like illness (ILI) presentations to ED
decreased further this week to moderate levels. ILI and pneumonia admissions to critical
care wards increased slightly this week but were within the usual range.
 Laboratory surveillance ? influenza activity eased further this week but remains above the
usual range for this time of year, with the influenza A(H3N2) strain predominating.

Reporting of laboratory-confirmed influenza outbreaks in aged care facilities decreased.
 Community illness surveillance ? data collected from eGPS, ASPREN and FluTracking all
showed slight increases this week, consistent with continuing ILI activity in NSW.
 Hospitalisations surveillance (FluCAN) ? no new influenza admissions were reported.
 National and international influenza surveillance ? the influenza A(H1N1)pdm09 strain is
the predominant strain in most jurisdictions (apart from NSW and ACT). Moderate
influenza activity was reported across the southern hemisphere. No new reports of human
cases of infection with the avian influenza A(H7N9) strain from China.

For more information: NSW Health - Infectious Diseases

*Queensland

For Period 8-14 September 2014

There were 1,051 notifications reported this week. Of these cases, 181 were attributed to influenza B virus. Of the 870 Influenza A samples, 34 were identified as A(H1N1)pdm09 and 38 as A/H3N2. There were 107 hospital admissions including 9 to ICU.

YTD there were 14,493 notifications reported. Of these cases, 1,740 were attributed to influenza B virus. Of the 12,753 Influenza A samples, 1,859 were identified as A(H1N1)pdm09 and 366 as A/H3N2.

There have been 1,863 hospital admissions including 225 to ICU.

For more information: QLD Health

*South Australia

7 September to 13 September 2014

One thousand and sixteen cases of influenza were reported this week. Of these, 951 were
characterised as influenza A and 65 were characterised as influenza B. There have been 7,179
influenza cases notified year-to-date, compared with 2,524 cases reported for the same period last
year.
Cases comprised of 464 males and 552 females, with a median age of 35 years. Two hundred and
ninety-five (29%) notifications were for children aged less than 10 years and 180 (18%) notifications
were for persons aged over 65 years.
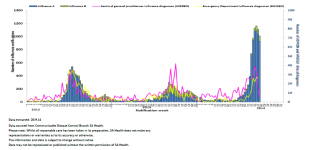
The influenza chart shows continuing influenza activity in South Australia.

For more information: SA Health

Tasmania
Issue 5 | 5 August 2014

This report describes influenza activity within Tasmanian during August 2014 up to and including Sunday 31

August 2014. Available data indicate:
 The 2014 influenza season is underway.
Notifications of laboratory-diagnosed influenza during August were more than three times higher than
during July.

 The majority of influenza notifications continue to be Influenza A infections. The most frequently reported
Influenza A subtype within Tasmania is A(H1N1)pdm09.
 Data on general respiratory pathogen testing indicate Influenza A virus as currently being the pathogen most
frequently causing influenza-like illness within Tasmania.

Influenza notifications
Tasmanian laboratories are required to notify the Director of Public Health of evidence of influenza infection in
specimens collected from patients. These specimens are usually nose or throat swabs but can also include a blood
sample. The best test for influenza involves PCR1 to detect influenza virus RNA present in a nose or throat swab.

In the five weeks since the last report a further 245 notifications of laboratory-diagnosed influenza have been
notified, taking the 2014 total to 439 notifications. The number of weekly notifications has increased since July, with
the latest peak in activity occurring during the last three weeks of August (see Figure 1). The current level of
notification within Tasmania is consistent with levels during a typical winter influenza season.

Residents from the more populous southern region of Tasmania made up the largest proportion (61%) of influenza
notifications since the last report (see Table 1).
...
Of the 439 influenza notifications received since the start of 2014, 400 (91%) were due to Influenza A virus
infections. The remaining 39 (9%) notifications were infections with Influenza B virus (see Table 2). Some influenza
laboratory isolates undergo further testing to identify subtypes. The most frequently identified Influenza A subtype of
2014 is currently the A(H1N1)pdm09 subtype2.
...

For more information: DHHS Tasmania

Victoria

Report No 19 Week ending 07/09/14
Summary
 Influenza-like illness (ILI) activity remained above baseline levels this week with 7.5 cases per 1000 patients seen.
Data from the National Home Doctor Service (Victorian data) remained above the seasonal threshold at 14.4.
 From the 391 swabs received from surveillance GPs this season (28/4/14 ? 7/9/14) 155 (40%) have been positive
for influenza A, 94 A(H1N1)pdm2009, 46 A(H3N2), 9 untyped, 3 influenza B and 3 influenza C. This week we
received 25 surveillance swabs of which 10 (40%) were positive for influenza A, 2 A(H1N1)pdm 2009, 6 H3N2 and
2 untyped.
 The majority of viruses detected through routine testing this week were influenza A. Of the 315 influenza viruses
detected so far this year 153 were A(H1N1)pdm09, 128 were A(H3N2), 22 are untyped and 12 were influenza B.
 This week the Influenza Complications Network (FluCAN) reported 7 hospitalisations, 3 with influenza A (untyped),
2 influenza A(H3N2) and 2 with influenza A(H1N1)pdm2009. Since 11/4/2014 FluCAN have reported 247
hospitalisations with confirmed influenza, of which 127 were untyped influenza A patients, 27 were influenza
A(H3N2), 84 were A(H1N1)pdm09 and 9 were influenza B, from the 4 Victorian sentinel hospitals.
 Of the 205 influenza viruses analysed at the WHO Collaborating Centre for Reference and Research on Influenza
year to date from Victoria, 183 were A(H1N1)pdm09 and 22 A(H3N2).
 The total number of laboratory confirmed notifications to the National Notifiable Diseases Surveillance System
(NNDSS) to date was 47,476, of which 5,942 (12.5%) were from Victoria.

For more information: Victorian Infectious Diseases Reference Laboratory

*Western Australia

WEEK ENDING 14TH SEPTEMBER 2014

Summary: Influenza and non-influenza respiratory virus activity continues to decline.
 Most indicators of influenza activity, including notifications, proportion of positive laboratory tests
for influenza, ILI presentations to Emergency Departments (ED) and influenza-associated
hospitalisations decreased this week.
 The majority of influenza viruses subtyped were influenza A/H1N1, although influenza A/H3N2
and influenza B continue to co-circulate.
 Overall detections of non-influenza respiratory viruses declined this week.

For more information: WA Dept.of Health

*Nationally

For the period to Jan 1- September 20th, 2014 there were 54,834 confirmed Influenza cases. (Ro's note: only 2009 with 59,029 has been higher)

The majority of notifications have been in NSW with 18,244 (higher than 2009 - Ro), QLD had 15,056, SA 7,997, VIC 7,227 (higher than 2009 - Ro), WA had 4,056, ACT 1,052, NT 639 and TAS 563.

For national data: National Notifiable Diseases Surveillance System

Australian Sentinel Practices Research Network (ASPREN)

No. 16, 2014
28th July 2014 ? 10th August 2014

INFLUENZA-LIKE-ILLNESS (ILI)
Nationally, ILI notifications largely increased over the period
with 292 and 282 notifications in week 31 and 32
respectively. ILI rates reported in this period largely
increased with 18 cases per 1000 consultations in weeks 31
and 32, compared to 7 and 10 cases per 1000
consultations in weeks 29 and 30 respectively. For the
same reporting period in 2013, ILI rates were lower at 13
and 10 cases per 1000 consultations respectively (see
Figure 5). On a state-by-state basis, it is important to note
the increased ILI rate in Urban QLD (see Figure 2).

For more information: ASPREN

*Flu Tracking

Flutracking Weekly Interim Report
Week ending 14 September 2014

Low levels of influenza-like illness activity

This survey was sent on Monday, 15 September 2014 at 01:13 AM and by 09:00 AM, Thursday 18 September we had
received 15675 responses (15771 last week) from 9775 people responding for themselves and 5900 household
members across Australia.

Across Australia, fever and cough was reported by 3.5% of
vaccinated participants and 3.5% of unvaccinated
participants. Fever, cough and absence from normal duties
was reported by 2.2% of vaccinated participants and 2.3%
of unvaccinated participants.

For participants this week, 9201/15675 (58.7 %) have
received the seasonal vaccine so far. Of the 3115
participants who identified as working face-to-face with
patients, 2455 (78.8%) have received the vaccine.

For more information: Flu Tracking

*Australian influenza report 2013 - Current report:

Australian Influenza Surveillance Report No 06 - 30 August to 12 September 2014

Across almost all jurisdictions, seasonal influenza activity appears to have peaked in recent weeks with the exception of South Australia where activity has been plateauing.
As at 12 September 2014, there have been 52,746 cases of laboratory confirmed influenza reported, with 9,088 notifications occurring during the report fortnight.
Nationally influenza A is the predominant influenza virus type. Of those viruses where subtyping data are available, A(H1N1)pdm09 remains the predominant influenza virus type in most jurisdictions. In New South Wales and the Australian Capital Territory, influenza A(H3N2) is the most common virus type.
The influenza vaccine is likely to provide good coverage against the currently circulating viruses.
The rate of influenza associated hospitalisations has remained stable over the past fortnight, with around 10% of cases admitted directly to ICU. The majority of hospital admissions have been associated influenza A infections and the median age of cases is 50 years.
The severity of the 2014 influenza season appears to be moderate across most jurisdictions. However, more severe activity is noted in NSW, where influenza A(H3N2) is circulating at higher levels and affecting people in older age-groups, which has led to a substantial number of outbreaks in aged care facilities.
The WHO has reported that globally influenza activity has continued in the southern hemisphere and has remained low elsewhere.

For more information: Department of Health
 
Re: Australia Influenza Surveillance 2014

Updated information is indicated with a *

*New South Wales

Week 38 Ending 21 September 2014

Summary:
For the week ending 21 September 2014, influenza activity in the community across
NSW was moderate and continues to trend downward.

 Emergency Department (ED) surveillance ? influenza-like illness (ILI) presentations to ED
decreased slightly this week and remained at moderate levels. ILI and pneumonia
admissions to critical care wards decreased slightly this week but were still at the upper
end of the usual range for this time of year.
 Laboratory surveillance ? influenza activity eased further this week but remains above the
usual range for this time of year, with the influenza A(H3N2) strain predominating.
Reporting of laboratory-confirmed influenza outbreaks in aged care facilities decreased.
 Community illness surveillance ? data collected from eGPS, ASPREN and FluTracking
show ILI activity trending downward, although still higher than usual for this time of year.
 Hospitalisations surveillance (FluCAN) ? three new influenza admissions were reported.
 National and international influenza surveillance ? the influenza A(H1N1)pdm09 strain is
the predominant strain in most jurisdictions (apart from NSW and ACT). Moderate
influenza activity was reported across the southern hemisphere. No new reports of human
cases of infection with the avian influenza A(H7N9) strain from China.

For more information: NSW Health - Infectious Diseases

Queensland

For Period 8-14 September 2014

There were 1,051 notifications reported this week. Of these cases, 181 were attributed to influenza B virus. Of the 870 Influenza A samples, 34 were identified as A(H1N1)pdm09 and 38 as A/H3N2. There were 107 hospital admissions including 9 to ICU.

YTD there were 14,493 notifications reported. Of these cases, 1,740 were attributed to influenza B virus. Of the 12,753 Influenza A samples, 1,859 were identified as A(H1N1)pdm09 and 366 as A/H3N2.

There have been 1,863 hospital admissions including 225 to ICU.

For more information: QLD Health

*South Australia

14 September to 20 September 2014

One thousand and ten cases of influenza were reported this week. Of these, 929 were characterised
as influenza A and 81 were characterised as influenza B. There have been 8,293 influenza cases
notified year-to-date, compared with 2,766 cases reported for the same period last year.
Cases comprised of 419 males and 591 females, with a median age of 37 years. Two hundred and
twenty-six (22%) notifications were for children aged less than 10 years and 215 (21%) notifications
were for persons aged over 65 years.
The influenza chart shows continuing influenza activity in South Australia.

SA.png

For more information: SA Health

Tasmania
Issue 5 | 5 August 2014

This report describes influenza activity within Tasmanian during August 2014 up to and including Sunday 31

August 2014. Available data indicate:
 The 2014 influenza season is underway.
Notifications of laboratory-diagnosed influenza during August were more than three times higher than
during July.

 The majority of influenza notifications continue to be Influenza A infections. The most frequently reported
Influenza A subtype within Tasmania is A(H1N1)pdm09.
 Data on general respiratory pathogen testing indicate Influenza A virus as currently being the pathogen most
frequently causing influenza-like illness within Tasmania.

Influenza notifications
Tasmanian laboratories are required to notify the Director of Public Health of evidence of influenza infection in
specimens collected from patients. These specimens are usually nose or throat swabs but can also include a blood
sample. The best test for influenza involves PCR1 to detect influenza virus RNA present in a nose or throat swab.

In the five weeks since the last report a further 245 notifications of laboratory-diagnosed influenza have been
notified, taking the 2014 total to 439 notifications. The number of weekly notifications has increased since July, with
the latest peak in activity occurring during the last three weeks of August (see Figure 1). The current level of
notification within Tasmania is consistent with levels during a typical winter influenza season.

Residents from the more populous southern region of Tasmania made up the largest proportion (61%) of influenza
notifications since the last report (see Table 1).
...
Of the 439 influenza notifications received since the start of 2014, 400 (91%) were due to Influenza A virus
infections. The remaining 39 (9%) notifications were infections with Influenza B virus (see Table 2). Some influenza
laboratory isolates undergo further testing to identify subtypes. The most frequently identified Influenza A subtype of
2014 is currently the A(H1N1)pdm09 subtype2.
...

For more information: DHHS Tasmania

*Victoria

Report No 21 Week ending 21/09/14

Summary
Influenza-like illness (ILI) activity remained above baseline levels this week with 5.5 cases per 1000 patients seen.
Data from the National Home Doctor Service (Victorian data) remained above the seasonal threshold at 22.6.
 From the 451 swabs received from surveillance GPs this season (28/4/14 ? 21/9/14) 183 (41%) have been
positive for influenza A, 102 A(H1N1)pdm2009, 57 A(H3N2), 17 untyped, 4 influenza B and 3 influenza C. This
week we received 22 surveillance swabs of which 9 (41%) were positive for influenza A, 1 A(H1N1)pdm 2009, 4
H3N2, 3 untyped and 1 influenza B.
 The majority of viruses detected through routine testing this week were influenza A. Of the 399 influenza viruses
detected so far this year 174 were A(H1N1)pdm09, 167 were A(H3N2), 46 are untyped and 12 were influenza B.
 This week the Influenza Complications Network (FluCAN) reported 11 hospitalisations, 10 with influenza A
(untyped) and 1 influenza A(H3N2). Since 11/4/2014 FluCAN have reported 297 hospitalisations with confirmed
influenza, of which 168 were untyped influenza A patients, 31 were influenza A(H3N2), 89 were A(H1N1)pdm09
and 9 were influenza B, from the 4 Victorian sentinel hospitals.

 Of the 244 influenza viruses analysed at the WHO Collaborating Centre for Reference and Research on Influenza
year to date from Victoria, 217 were A(H1N1)pdm09, 24 A(H3N2) and 3 influenza B.
 The total number of laboratory confirmed notifications to the National Notifiable Diseases Surveillance System
(NNDSS) to date was 57,039, of which 7,689 (14%) were from Victoria.

For more information: Victorian Infectious Diseases Reference Laboratory

*Western Australia

WEEK ENDING 21ST SEPTEMBER 2014

Summary: Influenza and non-influenza respiratory virus activity continues to decline.
 Most indicators of influenza activity, including notifications, detections of influenza virus,
proportion of positive laboratory tests for influenza, and influenza-associated hospitalisations
decreased this week.
 Influenza A/H1N1, influenza A/H3N2 and influenza B viruses continue to co-circulate.
 Detections of non-influenza respiratory viruses continued to decline this week.

For more information: WA Dept.of Health

*Nationally

For the period to Jan 1- September 27th, 2014 there were 58,155 confirmed Influenza cases. (Ro's note: only 2009 with 59,029 has been higher)

The majority of notifications have been in NSW with 18,988 (higher than 2009 - Ro), QLD had 15,754, SA 8,858, VIC 7,870 (higher than 2009 - Ro), WA had 4,325, ACT 1,107, NT 676 and TAS 577.

For national data: National Notifiable Diseases Surveillance System

Australian Sentinel Practices Research Network (ASPREN)

No. 16, 2014
28th July 2014 ? 10th August 2014

INFLUENZA-LIKE-ILLNESS (ILI)
Nationally, ILI notifications largely increased over the period
with 292 and 282 notifications in week 31 and 32
respectively. ILI rates reported in this period largely
increased with 18 cases per 1000 consultations in weeks 31
and 32, compared to 7 and 10 cases per 1000
consultations in weeks 29 and 30 respectively. For the
same reporting period in 2013, ILI rates were lower at 13
and 10 cases per 1000 consultations respectively (see
Figure 5). On a state-by-state basis, it is important to note
the increased ILI rate in Urban QLD (see Figure 2).

For more information: ASPREN

*Flu Tracking

Flutracking Weekly Interim Report
Week ending 21 September 2014

Low levels of influenza-like illness activity

This survey was sent on Monday, 22 September 2014 at 01:13 AM and by 09:00 AM, Thursday 25 September we had
received 15310 responses (15675 last week) from 9619 people responding for themselves and 5691 household
members across Australia.

Across Australia, fever and cough was reported by 2.4% of
vaccinated participants and 3.1% of unvaccinated
participants. Fever, cough and absence from normal duties
was reported by 1.4% of vaccinated participants and 2.1%
of unvaccinated participants.

For participants this week, 9018/15310 (58.9 %) have
received the seasonal vaccine so far. Of the 3054
participants who identified as working face-to-face with
patients, 2395 (78.4%) have received the vaccine.

For more information: Flu Tracking

Australian influenza report 2013 - Current report:

Australian Influenza Surveillance Report No 06 - 30 August to 12 September 2014

Across almost all jurisdictions, seasonal influenza activity appears to have peaked in recent weeks with the exception of South Australia where activity has been plateauing.
As at 12 September 2014, there have been 52,746 cases of laboratory confirmed influenza reported, with 9,088 notifications occurring during the report fortnight.
Nationally influenza A is the predominant influenza virus type. Of those viruses where subtyping data are available, A(H1N1)pdm09 remains the predominant influenza virus type in most jurisdictions. In New South Wales and the Australian Capital Territory, influenza A(H3N2) is the most common virus type.
The influenza vaccine is likely to provide good coverage against the currently circulating viruses.
The rate of influenza associated hospitalisations has remained stable over the past fortnight, with around 10% of cases admitted directly to ICU. The majority of hospital admissions have been associated influenza A infections and the median age of cases is 50 years.
The severity of the 2014 influenza season appears to be moderate across most jurisdictions. However, more severe activity is noted in NSW, where influenza A(H3N2) is circulating at higher levels and affecting people in older age-groups, which has led to a substantial number of outbreaks in aged care facilities.
The WHO has reported that globally influenza activity has continued in the southern hemisphere and has remained low elsewhere.

For more information: Department of Health
 
Re: Australia Influenza Surveillance 2014

Updated information is indicated with a *

*New South Wales

Week 39 Ending 28 September 2014

Summary:
For the week ending 28 September 2014, influenza activity in the community across
NSW was moderate and continues to trend downward.

 Emergency Department (ED) surveillance ? influenza-like illness (ILI) presentations to ED
decreased further this week but remained at moderate levels. ILI and pneumonia
admissions to critical care wards decreased this week and were below the usual range for
this time of year.
 Laboratory surveillance ? influenza activity eased further this week but remains above the
usual range for this time of year, with the influenza A(H3N2) strain predominating. There
were no reports of laboratory-confirmed influenza outbreaks occurring in aged care
facilities.
 Community illness surveillance ? data collected from eGPS, ASPREN and FluTracking
show ILI activity trending downward and returning to inter-season levels.
 Hospitalisations surveillance (FluCAN) ? one new influenza admission was reported.
 National and international influenza surveillance ? the influenza A(H1N1)pdm09 strain is
the predominant strain in most jurisdictions (apart from NSW and ACT). Moderate
influenza activity was reported across the southern hemisphere.
 Recommended composition of 2015 influenza vaccines ? The World Health Organization
(WHO) has provided recommendations for the 2015 southern hemisphere winter
influenza season including two strain changes.

For more information: NSW Health - Infectious Diseases

*Queensland

For Period 22-28 September 2014

There were 524 notifications reported this week. Of these cases, 119 were attributed to influenza B virus. Of the 405 Influenza A samples, 18 were identified as A(H1N1)pdm09 and 15 as A/H3N2. There were 43 hospital admissions including 5 to ICU.

YTD there were 15,979 notifications reported. Of these cases, 2,059 were attributed to influenza B virus. Of the 13,920 Influenza A samples, 1,964 were identified as A(H1N1)pdm09 and 470 as A/H3N2.

There have been 2,028 hospital admissions including 251 to ICU.

For more information: QLD Health

*South Australia

21 September to 27 September 2014

Seven hundred and forty-one cases of influenza were reported this week. Of these, 697 were
characterised as influenza A and 44 were characterised as influenza B. There have been 9,127
influenza cases notified year-to-date, compared with 2,990 cases reported for the same period last
year.
Cases comprised of 333 males and 408 females, with a median age of 36 years. One hundred and
sixty-nine (22%) notifications were for children aged less than 10 years and 154 (23%) notifications
were for persons aged over 65 years.
The influenza chart shows continuing influenza activity in South Australia.

For more information: SA Health

*Tasmania

Issue 6 | 2 October 2014

This report describes influenza activity within Tasmanian during September 2014 up to and including Sunday 28
September 2014. Available data indicate:
 The 2014 influenza season has peaked.
 Notifications of laboratory-diagnosed influenza declined during late September.
 The majority of influenza notifications continue to be Influenza A infections.
 The most frequently reported Influenza A subtype within Tasmania is A(H1N1)pdm09.
...
Influenza Notifications
Tasmanian laboratories are required to notify the Director of Public Health of evidence of influenza infection in
specimens collected from patients. These specimens are usually nose or throat swabs, less often a blood sample. The
best test for influenza involves PCR1 to detect influenza virus RNA present in a nose or throat swab.
In the four weeks since the last report a further 169 notifications of laboratory-diagnosed influenza have been
notified, taking the 2014 total to 608 notifications. The number of weekly notifications has steadily declined during
September, following the peak week in mid- August (see Figure 1). The current level of notification within Tasmania
is consistent with the final weeks of a typical influenza season.
...

For more information: DHHS Tasmania

*Victoria

Report No 22 Week ending 28/09/14

Summary
 Influenza-like illness (ILI) activity fell below baseline levels this week with 2.9 cases per 1000 patients seen. Data
from the National Home Doctor Service (Victorian data) remained above the seasonal threshold at 16.9.
 From the 469 swabs received from surveillance GPs this season (28/4/14 ? 28/9/14) 182 (41%) have been
positive for influenza A, 106 A(H1N1)pdm2009, 69 A(H3N2), 7 untyped, 4 influenza B and 3 influenza C. This
week we received 18 surveillance swabs of which 6 (33%) were positive for influenza A, all A(H1N1)pdm 2009.
 The majority of viruses detected through routine testing this week were influenza A. Of the 423 influenza viruses
detected so far this year 196 were A(H1N1)pdm09, 199 were A(H3N2), 16 are untyped and 12 were influenza B.
 This week the Influenza Complications Network (FluCAN) reported 3 hospitalisations, all with influenza A
(untyped). Since 11/4/2014 FluCAN have reported 308 hospitalisations with confirmed influenza, of which 170
were untyped influenza A patients, 35 were influenza A(H3N2), 94 were A(H1N1)pdm09 and 9 were influenza B,
from the 4 Victorian sentinel hospitals.
 Of the 244 influenza viruses analysed at the WHO Collaborating Centre for Reference and Research on Influenza
year to date from Victoria, 249 were A(H1N1)pdm09, 25 A(H3N2) and 5 influenza B.
 The total number of laboratory confirmed notifications to the National Notifiable Diseases Surveillance System
(NNDSS) to date was 60,019, of which 8,432 (14%) were from Victoria.

For more information: Victorian Infectious Diseases Reference Laboratory

Western Australia

WEEK ENDING 21ST SEPTEMBER 2014

Summary: Influenza and non-influenza respiratory virus activity continues to decline.
 Most indicators of influenza activity, including notifications, detections of influenza virus,
proportion of positive laboratory tests for influenza, and influenza-associated hospitalisations
decreased this week.
 Influenza A/H1N1, influenza A/H3N2 and influenza B viruses continue to co-circulate.
 Detections of non-influenza respiratory viruses continued to decline this week.

For more information: WA Dept.of Health

*Nationally

For the period to Jan 1- October 4th, 2014 there were 60,805 confirmed Influenza cases. (Ro's note: Highest ever recorded)

The majority of notifications have been in NSW with 19,522 (higher than 2009 - Ro), QLD had 16,265, SA 9,486, VIC 8,587 (higher than 2009 - Ro), WA had 4,497, ACT 1,138, NT 700 and TAS 610.

For national data: National Notifiable Diseases Surveillance System

Australian Sentinel Practices Research Network (ASPREN)

No. 16, 2014
28th July 2014 ? 10th August 2014

INFLUENZA-LIKE-ILLNESS (ILI)
Nationally, ILI notifications largely increased over the period
with 292 and 282 notifications in week 31 and 32
respectively. ILI rates reported in this period largely
increased with 18 cases per 1000 consultations in weeks 31
and 32, compared to 7 and 10 cases per 1000
consultations in weeks 29 and 30 respectively. For the
same reporting period in 2013, ILI rates were lower at 13
and 10 cases per 1000 consultations respectively (see
Figure 5). On a state-by-state basis, it is important to note
the increased ILI rate in Urban QLD (see Figure 2).

For more information: ASPREN

*Flu Tracking

Flutracking Weekly Interim Report
Week ending 28 September 2014

Low levels of influenza-like illness activity

This survey was sent on Monday, 29 September 2014 at 01:13 AM and by 09:00 AM, Thursday 02 October we had
received 14907 responses (15310 last week) from 9423 people responding for themselves and 5484 household
members across Australia.

Across Australia, fever and cough was reported by 2.2% of
vaccinated participants and 2.3% of unvaccinated
participants. Fever, cough and absence from normal duties
was reported by 1.2% of vaccinated participants and 1.5%
of unvaccinated participants.

For participants this week, 8838/14907 (59.3 %) have
received the seasonal vaccine so far. Of the 3030
participants who identified as working face-to-face with
patients, 2367 (78.1%) have received the vaccine.

For more information: Flu Tracking

Australian influenza report 2013 - Current report:

Australian Influenza Surveillance Report No 06 - 30 August to 12 September 2014

Across almost all jurisdictions, seasonal influenza activity appears to have peaked in recent weeks with the exception of South Australia where activity has been plateauing.
As at 12 September 2014, there have been 52,746 cases of laboratory confirmed influenza reported, with 9,088 notifications occurring during the report fortnight.
Nationally influenza A is the predominant influenza virus type. Of those viruses where subtyping data are available, A(H1N1)pdm09 remains the predominant influenza virus type in most jurisdictions. In New South Wales and the Australian Capital Territory, influenza A(H3N2) is the most common virus type.
The influenza vaccine is likely to provide good coverage against the currently circulating viruses.
The rate of influenza associated hospitalisations has remained stable over the past fortnight, with around 10% of cases admitted directly to ICU. The majority of hospital admissions have been associated influenza A infections and the median age of cases is 50 years.
The severity of the 2014 influenza season appears to be moderate across most jurisdictions. However, more severe activity is noted in NSW, where influenza A(H3N2) is circulating at higher levels and affecting people in older age-groups, which has led to a substantial number of outbreaks in aged care facilities.
The WHO has reported that globally influenza activity has continued in the southern hemisphere and has remained low elsewhere.

For more information: Department of Health
 
Re: Australia Influenza Surveillance 2014

Updated information is indicated with a *

*New South Wales

Week 40 Ending 5 October 2014

Summary:
For the week ending 5 October 2014, influenza activity in the community across
NSW was low and continues to trend downward
.
 Emergency Department (ED) surveillance ? influenza-like illness (ILI) presentations to ED
decreased further this week and are now at low levels. ILI and pneumonia admissions to
critical care wards increased this week but were within the usual range for this time of
year.
 Laboratory surveillance ? influenza activity eased further this week but remains above the
usual range for this time of year. There was one report of laboratory-confirmed influenza
outbreak occurring in aged care facility.
 Community illness surveillance ? data collected from eGPS, ASPREN and FluTracking
show ILI activity trending downward and returning to inter-season levels.
 Hospitalisations surveillance (FluCAN) ? one new influenza admission was reported.
 National and international influenza surveillance ? the influenza A(H1N1)pdm09 strain
remains the predominant strain in most jurisdictions (apart from NSW and ACT), although
the proportion of influenza A(H3N2) has increased in recent weeks in Queensland and
Western Australia. Decreasing influenza activity was reported across the southern
hemisphere.
 Recommended composition of 2015 influenza vaccines ? the World Health Organization
(WHO) has provided recommendations for the 2015 southern hemisphere winter
influenza season including two strain changes.

For more information: NSW Health - Infectious Diseases

Queensland

For Period 22-28 September 2014

There were 524 notifications reported this week. Of these cases, 119 were attributed to influenza B virus. Of the 405 Influenza A samples, 18 were identified as A(H1N1)pdm09 and 15 as A/H3N2. There were 43 hospital admissions including 5 to ICU.

YTD there were 15,979 notifications reported. Of these cases, 2,059 were attributed to influenza B virus. Of the 13,920 Influenza A samples, 1,964 were identified as A(H1N1)pdm09 and 470 as A/H3N2.

There have been 2,028 hospital admissions including 251 to ICU.

For more information: QLD Health

*South Australia

28 September to 4 October 2014

Four hundred and seventy-two cases of influenza were reported this week. Of these, 426 were
characterised as influenza A and 46 were characterised as influenza B. There have been 9,641
influenza cases notified year-to-date, compared with 3,173 cases reported for the same period last
year.
Cases comprised of 196 males and 276 females, with a median age of 47 years. Seventy-four (16%)
notifications were for children aged less than 10 years and 126 (27%) notifications were for persons
aged over 65 years.
The influenza chart shows continuing influenza activity in South Australia

For more information: SA Health

Tasmania

Issue 6 | 2 October 2014

This report describes influenza activity within Tasmanian during September 2014 up to and including Sunday 28
September 2014. Available data indicate:
 The 2014 influenza season has peaked.
 Notifications of laboratory-diagnosed influenza declined during late September.
 The majority of influenza notifications continue to be Influenza A infections.
 The most frequently reported Influenza A subtype within Tasmania is A(H1N1)pdm09.
...
Influenza Notifications
Tasmanian laboratories are required to notify the Director of Public Health of evidence of influenza infection in
specimens collected from patients. These specimens are usually nose or throat swabs, less often a blood sample. The
best test for influenza involves PCR1 to detect influenza virus RNA present in a nose or throat swab.
In the four weeks since the last report a further 169 notifications of laboratory-diagnosed influenza have been
notified, taking the 2014 total to 608 notifications. The number of weekly notifications has steadily declined during
September, following the peak week in mid- August (see Figure 1). The current level of notification within Tasmania
is consistent with the final weeks of a typical influenza season.
...

For more information: DHHS Tasmania

*Victoria

Report No 23 Week ending 05/10/14

Summary
Influenza-like illness (ILI) activity remained below baseline levels this week with 3.1 cases per 1000 patients seen.
Data from the National Home Doctor Service (Victorian data) remained above the seasonal threshold at 11.9.
 From the 491 swabs received from surveillance GPs this season (28/4/14 ? 5/10/14) 195 (40%) have been
positive for influenza A, 107 A(H1N1)pdm2009, 72 A(H3N2), 9 untyped, 4 influenza B and 3 influenza C. This
week we received 17 surveillance swabs of which 5 (29%) were positive for influenza A, 1 A(H1N1)pdm 2009, 2
A(H3N2) and 2 A(untyped).
 The majority of viruses detected through routine testing this week were influenza A. Of the 443 influenza viruses
detected so far this year 199 were A(H1N1)pdm09, 214 were A(H3N2), 16 are untyped and 14 were influenza B.
 This week the Influenza Complications Network (FluCAN) reported 13 hospitalisations, 11 with influenza A
(untyped), 1 influenza B and one pending a result. Since 11/4/2014 FluCAN have reported 331 hospitalisations
with confirmed influenza, of which 191 were untyped influenza A patients, 35 were influenza A(H3N2), 94 were
A(H1N1)pdm09 and 10 were influenza B, from the 4 Victorian sentinel hospitals.
 Of the 279 influenza viruses analysed at the WHO Collaborating Centre for Reference and Research on Influenza
year to date from Victoria, 249 were A(H1N1)pdm09, 25 A(H3N2) and 5 influenza B.
 The total number of laboratory confirmed notifications to the National Notifiable Diseases Surveillance System
(NNDSS) to date was 61,597, of which 8,740 (14%) were from Victoria.

For more information: Victorian Infectious Diseases Reference Laboratory

*Western Australia

WEEK ENDING 5TH OCTOBER 2014
KEY POINTS
INFLUENZA AND INFLUENZA-LIKE ILLNESSES (ILI)
Summary: Influenza activity continues to decline.
? Most indicators of influenza activity, including notifications, detections of influenza virus,
proportion of positive laboratory tests for influenza, and influenza-associated hospitalisations
decreased this week, with the exception of emergency department ILI presentations which
increased.
? Influenza A/H1N1, A/H3N2 and B viruses continue to co-circulate.
? Detections of all non-influenza respiratory viruses decreased.

For more information: WA Dept.of Health

*Nationally

For the period to Jan 1- October 11th, 2014 there were 62,189 confirmed Influenza cases. (Ro's note: Highest ever recorded)

The majority of notifications have been in NSW with 19,805 (higher than 2009 - Ro), QLD had 16,607, SA 9,798, VIC 8,804 (higher than 2009 - Ro), WA had 4,676, ACT 1,152, NT 723 and TAS 624.

For national data: National Notifiable Diseases Surveillance System

Australian Sentinel Practices Research Network (ASPREN)

No. 16, 2014
28th July 2014 ? 10th August 2014

INFLUENZA-LIKE-ILLNESS (ILI)
Nationally, ILI notifications largely increased over the period
with 292 and 282 notifications in week 31 and 32
respectively. ILI rates reported in this period largely
increased with 18 cases per 1000 consultations in weeks 31
and 32, compared to 7 and 10 cases per 1000
consultations in weeks 29 and 30 respectively. For the
same reporting period in 2013, ILI rates were lower at 13
and 10 cases per 1000 consultations respectively (see
Figure 5). On a state-by-state basis, it is important to note
the increased ILI rate in Urban QLD (see Figure 2).

For more information: ASPREN

*Flu Tracking

Flutracking Weekly Interim Report
Week ending 05 October 2014

Low levels of influenza-like illness activity

This survey was sent on Monday, 06 October 2014 at 01:13 AM and by 09:00 AM, Thursday 09 October we had
received 15023 responses (14907 last week) from 9495 people responding for themselves and 5528 household
members across Australia.

Across Australia, fever and cough was reported by 2.0% of
vaccinated participants and 2.0% of unvaccinated
participants. Fever, cough and absence from normal duties
was reported by 1.0% of vaccinated participants and 0.9%
of unvaccinated participants.

For participants this week, 8857/15023 (59.0 %) have
received the seasonal vaccine so far. Of the 2995
participants who identified as working face-to-face with
patients, 2348 (78.4%) have received the vaccine.

For more information: Flu Tracking

*Australian influenza report 2013 - Current report:

AUSTRALIAN INFLUENZA
SURVEILLANCE REPORT

No. 7, 2014, REPORTING PERIOD:
13 September to 26 September 2014

SUMMARY

? Across all jurisdictions, seasonal influenza activity has continued to decline following recent peaks in activity. In South Australia, where activity has plateaued for several weeks, there has been a decline in the most recent week.
? As at 26 September 2014, there have been 59,867 cases of laboratory confirmed influenza reported, with 5,900 notifications occurring during the report fortnight.
? Nationally influenza A is the predominant influenza virus type. Influenza A(H1N1)pdm09 continues to be the dominant circulating virus subtype in the Northern Territory, South Australia, Tasmania and Victoria while in New South Wales and the Australian Capital Territory , influenza A(H3N2) is the most common virus type. The proportion of influenza A(H3N2) has increased in recent weeks in Queensland and Western Australia where both strains now co-circulate in similar proportions. The usual, late season increase in influenza B infections has also been noted in recent weeks.
? The influenza vaccine is likely to provide good coverage against the currently circulating viruses.
? The number of influenza associated hospitalisations to sentinel sites has declined over the past fortnight, with around 10% of cases admitted directly to ICU. The majority of hospital admissions have been associated influenza A infections and the median age of cases is 51 years.
? The severity of the 2014 influenza season appears to be moderate across most jurisdictions. However, more severe activity was noted in NSW, where influenza A(H3N2) circulated at higher levels and affected people in older age-groups, which has led to a substantial number of outbreaks in aged care facilities.
? The WHO released its recommendations for the composition of the 2015 southern hemisphere influenza season vaccine which includes changes to the A(H3N2) and B vaccine strains.

For more information: Department of Health
 
Re: Australia Influenza Surveillance 2014

Updated information is indicated with a *

*New South Wales

Week 41 Ending 12 October 2014

Summary:
For the week ending 12 October 2014, influenza activity in the community across
NSW was low and continues to trend downward.
 Emergency Department (ED) surveillance ? influenza-like illness (ILI) presentations to ED
decreased further this week and were at low levels. ILI and pneumonia admissions to
critical care wards decreased and were within the usual range for this time of year.
 Laboratory surveillance ? influenza activity eased further this week and is within the usual
range for this time of year. There were three reports of laboratory-confirmed influenza
outbreaks occurring in aged care facilities.
 Community illness surveillance ? data collected from eGPS, ASPREN and FluTracking
show ILI activity trending downward and returning to inter-season levels.
 Hospitalisations surveillance (FluCAN) ? no new influenza admissions were reported.
 National and international influenza surveillance ? the influenza A(H1N1)pdm09 strain
remains the predominant strain in most jurisdictions (apart from NSW and ACT).
Decreasing influenza activity was reported across the southern hemisphere.
 Recommended composition of 2015 influenza vaccines ? the World Health Organization
(WHO) has provided recommendations for the 2015 southern hemisphere winter
influenza season including two strain changes.

For more information: NSW Health - Infectious Diseases

*Queensland

For Period 29 September -5 October 2014

There were 327 notifications reported this week. Of these cases, 82 were attributed to influenza B virus. Of the 245 Influenza A samples, 9 were identified as A(H1N1)pdm09 and 11 as A/H3N2. There were 26 hospital admissions including 1 to ICU.

YTD there were 16,395 notifications reported. Of these cases, 2,161 were attributed to influenza B virus. Of the 14,234 Influenza A samples, 1,994 were identified as A(H1N1)pdm09 and 505 as A/H3N2.

There have been 2,062 hospital admissions including 255 to ICU.

For more information: QLD Health

*South Australia

5 October to 11 October 2014

Two hundred and seventy cases of influenza were reported this week. Of these, 241 were
characterised as influenza A and 29 were characterised as influenza B. There have been 9,928
influenza cases notified year-to-date, compared with 3,336 cases reported for the same period last
year.
Cases comprised of 125 males and 145 females, with a median age of 46 years. Forty-three (16%)
notifications were for children aged less than 10 years and 76 (28%) notifications were for persons
aged over 65 years.
The influenza chart shows that influenza activity in South Australia is now decreasing.

For more information: SA Health

Tasmania

Issue 6 | 2 October 2014

This report describes influenza activity within Tasmanian during September 2014 up to and including Sunday 28
September 2014. Available data indicate:
 The 2014 influenza season has peaked.
 Notifications of laboratory-diagnosed influenza declined during late September.
 The majority of influenza notifications continue to be Influenza A infections.
 The most frequently reported Influenza A subtype within Tasmania is A(H1N1)pdm09.
...
Influenza Notifications
Tasmanian laboratories are required to notify the Director of Public Health of evidence of influenza infection in
specimens collected from patients. These specimens are usually nose or throat swabs, less often a blood sample. The
best test for influenza involves PCR1 to detect influenza virus RNA present in a nose or throat swab.
In the four weeks since the last report a further 169 notifications of laboratory-diagnosed influenza have been
notified, taking the 2014 total to 608 notifications. The number of weekly notifications has steadily declined during
September, following the peak week in mid- August (see Figure 1). The current level of notification within Tasmania
is consistent with the final weeks of a typical influenza season.
...

For more information: DHHS Tasmania

*Victoria

Report No 24 Week ending 12/10/14

Summary
Influenza-like illness (ILI) activity remained below baseline levels this week with 1.2 cases per 1000 patients seen.
Data from the National Home Doctor Service (Victorian data) fell below the seasonal threshold with a proportion of
9.5.
 From the 497 swabs received from surveillance GPs this season (28/4/14 ? 12/10/14) 195 (40%) have been
positive for influenza, 107 A(H1N1)pdm2009, 76 A(H3N2), 7 untyped, 4 influenza B and 3 influenza C. This week
we received 6 surveillance swabs of which2 (29%) were positive for influenza A (H3N2).
 The majority of viruses detected through routine testing this week were influenza A and picornavirus. Of the 451
influenza viruses detected so far this year 201 were A(H1N1)pdm09, 218 were A(H3N2), 16 are untyped and 16
were influenza B.
 This week the Influenza Complications Network (FluCAN) reported 3 hospitalisations, 1 with influenza A (untyped),
1 A(H3N2) and 1 influenza B. Since 11/4/2014 FluCAN have reported 356 hospitalisations with confirmed
influenza, of which 198 were untyped influenza A patients, 39 were influenza A(H3N2), 106 were A(H1N1)pdm09
and 13 were influenza B, from the 4 Victorian sentinel hospitals.
 Of the 343 influenza viruses analysed at the WHO Collaborating Centre for Reference and Research on Influenza
year to date from Victoria, 283 were A(H1N1)pdm09, 53 A(H3N2) and 7 influenza B.
 The total number of laboratory confirmed notifications to the National Notifiable Diseases Surveillance System
(NNDSS) to date was 62,810, of which 8,804 (14%) were from Victoria.

For more information: Victorian Infectious Diseases Reference Laboratory

*Western Australia

WEEK ENDING 12TH OCTOBER 2014
KEY POINTS
INFLUENZA AND INFLUENZA-LIKE ILLNESSES (ILI)
Summary: Influenza activity continues to decline.
 Presentations of influenza-like illness to sentinel general practitioners (GPs) and sentinel
emergency departments (EDs) decreased this week.
Detections of influenza virus continue to decrease.
 Detections of non-influenza respiratory viruses decreased, with the exception of human
metapneumovirus and adenovirus.

For more information: WA Dept.of Health

*Nationally

For the period to Jan 1- October 18th, 2014 there were 63,133 confirmed Influenza cases. (Ro's note: Highest ever recorded)

The majority of notifications have been in NSW with 20,064 (higher than 2009 - Ro), QLD had 16,837, SA 10,096, VIC 8,804 (higher than 2009 - Ro), WA had 4,782, ACT 1,170, NT 740 and TAS 640.

For national data: National Notifiable Diseases Surveillance System

*Australian Sentinel Practices Research Network (ASPREN)

No. 19, 2014
8th September 2014 ? 21st September 2014

Nationally, ILI notifications decreased over the period with
351 and 253 notifications in week 37 and 38 respectively.
ILI rates reported in this period decreased with 20 and 14
cases per 1000 consultations in weeks 37 and 38
respectively, compared to 21 and 19 cases per 1000
consultations in weeks 35 and 36 respectively. For the
same reporting period in 2013, ILI rates were lower at 12
and 13 cases per 1000 consultations respectively (see
Figure 5). On a state-by-state basis, it is important to note
the increased ILI rate in Urban VIC (see Figure 2).

For more information: ASPREN

*Flu Tracking

Flutracking Weekly Interim Report
Week ending 12 October 2014

Low levels of influenza-like illness activity

This survey was sent on Monday, 13 October 2014 at 01:13 AM and by 09:00 AM, Thursday 16 October we had
received 15489 responses (15023 last week) from 9713 people responding for themselves and 5776 household
members across Australia.

Across Australia, fever and cough was reported by 1.7% of
vaccinated participants and 1.4% of unvaccinated
participants. Fever, cough and absence from normal duties
was reported by 1.0% of vaccinated participants and 0.7%
of unvaccinated participants

For participants this week, 9131/15489 (59.0 %) have
received the seasonal vaccine so far. Of the 3050
participants who identified as working face-to-face with
patients, 2388 (78.3%) have received the vaccine.

For more information: Flu Tracking

*Australian influenza report 2013 - Current report:

AUSTRALIAN INFLUENZA
SURVEILLANCE REPORT

No. 7, 2014, REPORTING PERIOD:
13 September to 26 September 2014

SUMMARY

? Across all jurisdictions, seasonal influenza activity has continued to decline following recent peaks in activity. In South Australia, where activity has plateaued for several weeks, there has been a decline in the most recent week.
? As at 26 September 2014, there have been 59,867 cases of laboratory confirmed influenza reported, with 5,900 notifications occurring during the report fortnight.
? Nationally influenza A is the predominant influenza virus type. Influenza A(H1N1)pdm09 continues to be the dominant circulating virus subtype in the Northern Territory, South Australia, Tasmania and Victoria while in New South Wales and the Australian Capital Territory , influenza A(H3N2) is the most common virus type. The proportion of influenza A(H3N2) has increased in recent weeks in Queensland and Western Australia where both strains now co-circulate in similar proportions. The usual, late season increase in influenza B infections has also been noted in recent weeks.
? The influenza vaccine is likely to provide good coverage against the currently circulating viruses.
? The number of influenza associated hospitalisations to sentinel sites has declined over the past fortnight, with around 10% of cases admitted directly to ICU. The majority of hospital admissions have been associated influenza A infections and the median age of cases is 51 years.
? The severity of the 2014 influenza season appears to be moderate across most jurisdictions. However, more severe activity was noted in NSW, where influenza A(H3N2) circulated at higher levels and affected people in older age-groups, which has led to a substantial number of outbreaks in aged care facilities.
? The WHO released its recommendations for the composition of the 2015 southern hemisphere influenza season vaccine which includes changes to the A(H3N2) and B vaccine strains.

For more information: Department of Health
 
Re: Australia Influenza Surveillance 2014

Updated information is indicated with a *

*New South Wales

Week 43 Ending 26 October 2014

Summary:
For the week ending 26 October 2014, influenza activity in the community across
NSW was low and continues to trend downward.
 Emergency Department (ED) surveillance ? influenza-like illness (ILI) presentations to ED
decreased further this week and were at low levels. ILI and pneumonia admissions to
critical care wards decreased and were within the usual range for this time of year.
 Laboratory surveillance ? influenza activity eased further this week and is within the usual
range for this time of year. There were no reports of a laboratory-confirmed influenza
outbreak occurring in an aged care facilities.
 Community illness surveillance ? data collected from eGPS, ASPREN and FluTracking
show ILI activity trending downward and returning to inter-season levels.
 Hospitalisations surveillance (FluCAN) ? two new influenza admissions were reported.
 National and international influenza surveillance ? National summary of the 2014 influenza
season. No new reports of human cases of infection with the avian influenza A(H7N9)
strain from China.
 Recommended composition of 2015 influenza vaccines ? the World Health Organization
(WHO) has provided recommendations for the 2015 southern hemisphere winter
influenza season including two strain changes.


For more information: NSW Health - Infectious Diseases

*Queensland

For Period 13 October -19 October 2014

There were 168 notifications reported this week. Of these cases, 59 were attributed to influenza B virus. Of the 109 Influenza A samples, 7 were identified as A(H1N1)pdm09 and 4 as A/H3N2. There were 14 hospital admissions including 1 to ICU.

YTD there were 16,951 notifications reported. Of these cases, 2,309 were attributed to influenza B virus. Of the 14,642 Influenza A samples, 2,032 were identified as A(H1N1)pdm09 and 550 as A/H3N2.

There have been 2,115 hospital admissions including 261 to ICU.

For more information: QLD Health

*South Australia

23 November to 29 November 2014

Seventy-one cases of influenza were reported this week, a decrease from 93 cases reported last
week. Of these, 62 were characterised as influenza A and nine were characterised as influenza B.
Cases comprised of 38 males and 33 females, with a median age of 49 years. There have been
10,925 influenza cases notified year-to-date, compared with 4,358 cases reported for the same period
last year.
The influenza chart shows that influenza activity in South Australia is still decreasing.

For more information: SA Health

Tasmania

Issue 6 | 2 October 2014

This report describes influenza activity within Tasmanian during September 2014 up to and including Sunday 28
September 2014. Available data indicate:
 The 2014 influenza season has peaked.
 Notifications of laboratory-diagnosed influenza declined during late September.
 The majority of influenza notifications continue to be Influenza A infections.
 The most frequently reported Influenza A subtype within Tasmania is A(H1N1)pdm09.
...
Influenza Notifications
Tasmanian laboratories are required to notify the Director of Public Health of evidence of influenza infection in
specimens collected from patients. These specimens are usually nose or throat swabs, less often a blood sample. The
best test for influenza involves PCR1 to detect influenza virus RNA present in a nose or throat swab.
In the four weeks since the last report a further 169 notifications of laboratory-diagnosed influenza have been
notified, taking the 2014 total to 608 notifications. The number of weekly notifications has steadily declined during
September, following the peak week in mid- August (see Figure 1). The current level of notification within Tasmania
is consistent with the final weeks of a typical influenza season.
...

For more information: DHHS Tasmania

*Victoria

Report No 26 Week ending 26/10/14
Summary
 Influenza-like illness (ILI) activity remained below baseline levels this week with 1.2 cases per 1000 patients seen.
Data from the National Home Doctor Service (Victorian data) remained below the seasonal threshold with a
proportion of 5.8.
 From the 514 swabs received from surveillance GPs this season (28/4/14 ? 26/10/14) 201 (39% have been
positive for influenza, 108 A(H1N1)pdm2009, 76 A(H3N2), 7 A(untyped), 7 influenza B and 3 influenza C. This
week we received 7 surveillance swabs of which 3 (43%) was positive for influenza B.
 The majority of viruses detected through routine testing this week were influenza A and picornavirus. Of the 478
influenza viruses detected so far this year 205 were A(H1N1)pdm09, 236 were A(H3N2), 16 are untyped and 21
were influenza B.
 This week the Influenza Complications Network (FluCAN) reported 3 hospitalisations, 1 influenza A (H1N1)pdm09,
1 influenza A(H3N2) and 1 influenza B. Since 11/4/2014 FluCAN have reported 372 hospitalisations with
confirmed influenza, of which 202 were untyped influenza A patients, 44 were influenza A(H3N2), 109 were
A(H1N1)pdm09 and 15 were influenza B, from the 4 Victorian sentinel hospitals.
 Of the 343 influenza viruses analysed at the WHO Collaborating Centre for Reference and Research on Influenza
year to date from Victoria, 283 were A(H1N1)pdm09, 53 A(H3N2) and 7 influenza B.
 The total number of laboratory confirmed notifications to the National Notifiable Diseases Surveillance System
(NNDSS) to date was 64,114, of which 8,804 (14%) were from Victoria.

For more information: Victorian Infectious Diseases Reference Laboratory

*Western Australia

WEEK ENDING 30TH NOVEMBER 2014
KEY POINTS
INFLUENZA AND INFLUENZA-LIKE ILLNESSES (ILI)
Summary: Influenza activity is low and at inter-seasonal level.
 ILI presentations to sentinel general practitioners (GPs) and emergency departments (EDs)
remain low.
 Routine and sentinel detections of influenza virus remain low.
 Influenza A/H3N2 and influenza B continue to co-circulate at low levels.
 Detections of non-influenza respiratory viruses decreased this week.

For more information: WA Dept.of Health

*Nationally

For the period to Jan 1- December 13th, 2014 there were 66,950 confirmed Influenza cases. (Ro's note: Highest ever recorded. Previous high was 2009 with 59,028. Average for 2009-2013 is 34,524 confirmed cases per year.)

The majority of notifications have been in NSW with 20,680 (higher than 2009 - Ro), QLD had 17,720, SA 10,949 (higher than 2009 - Ro), VIC 9,753 (higher than 2009 - Ro), WA had 5,155, ACT 1,230, NT 796 and TAS 659.

For national data: National Notifiable Diseases Surveillance System

*Australian Sentinel Practices Research Network (ASPREN)

No. 23, 2014
3rd November 2014 ? 16th November 2014

SYNDROMIC SURVEILLANCE
REPORTING
Reports were received from 191 GPs from 8
states and territories during the reporting
period. During weeks 45 and 46 a total of
16,151 and 15,453 consultations were
made, respectively.

INFLUENZA-LIKE-ILLNESS (ILI)
Nationally, ILI notifications increased over the period with
129 and 166 notifications in week 45 and 46 respectively.
ILI rates reported in this period increased with 8 and 11
cases per 1000 consultations in weeks 45 and 46
respectively, compared to 3 and 7 cases per 1000
consultations in weeks 43 and 44 respectively. For the
same reporting period in 2013, ILI rates were slightly lower
at 5 and 7 cases per 1000 consultations respectively (see
Figure 5). On a state-by-state basis, it is important to note
the increased ILI rate in Urban NSW

For more information: ASPREN

*Flu Tracking

Flutracking Weekly Interim Report
Week ending 19 October 2014

Low levels of influenza-like illness activity

This survey was sent on Monday, 20 October 2014 at 01:13 AM and by 09:00 AM, Thursday 23 October we had
received 15653 responses (15489 last week) from 9686 people responding for themselves and 5967 household
members across Australia.

Across Australia, fever and cough was reported by 1.5% of
vaccinated participants and 1.4% of unvaccinated
participants. Fever, cough and absence from normal duties
was reported by 0.8% of vaccinated participants and 0.8%
of unvaccinated participants.

For participants this week, 9163/15653 (58.5 %) have
received the seasonal vaccine so far. Of the 3142
participants who identified as working face-to-face with
patients, 2470 (78.6%) have received the vaccine.

For more information: Flu Tracking

*Australian influenza report 2013 - Current report:

AUSTRALIAN INFLUENZA
SURVEILLANCE REPORT

No. 8, 2014, REPORTING PERIOD:
27 September to 10 October 2014

SUMMARY
 Nationally, influenza activity continued to decrease this fortnight with no regions reporting widespread
activity.
 As at 10 October 2014, there have been 62,918 cases of laboratory confirmed influenza reported, which is
almost three times the notifications received for the same period in 2013.
 Over the 2013-14 interseasonal period, higher than usual numbers of influenza notifications were reported
from most jurisdictions. Rates of interseasonal influenza have been generally increasing since the 2009
influenza pandemic. Notification data trends for 2014, show a sharp increase in mid-July, a peak in midAugust
followed by a rapid decline to interseasonal levels in early October. Overall influenza activity
remained elevated for approximately 12 weeks. Nationally, the timing of the season peak was similar to
2013 and 2011.
 Across jurisdictions, influenza activity peaked in mid to late August and was followed by rapid declines.
However in South Australia (SA) and Victoria (Vic), there was sustained peak activity for up to five weeks.
While the majority of notifications this year were from New South Wales (NSW) (31%) and Queensland
(Qld)(27%), two of the most populous jurisdictions, notification rates were highest in SA.
 Nationally influenza A was the predominant influenza virus type, however the distribution of influenza
types and subtypes was variable between jurisdictions and changed as the season progressed. Influenza
A(H1N1)pdm09 predominated across most jurisdictions throughout the season, however influenza A(H3N2)
was predominant in New South Wales and the Australian Capital Territory*
, with late season increases
noted in Qld, Western Australia (WA), the Northern Territory (NT) and Tasmania (Tas). In recent weeks, the
typical, late season increase in influenza B infections has also been noted.
 Notification rates have had a bimodal age distribution trend, with rates highest in those aged less than 5
years and in those aged 80 years and over, with a smaller peak among those aged 30-44 years. This age
distribution trend, especially in the younger to middle aged populations is consistent with previous years
dominated by influenza A(H1N1)pdm09, whereas infections in older age groups is typical of influenza
A(H3N2).
 The rate of influenza associated hospitalisations has declined steadily over the past month. The overall rate
of influenza cases admitted directly to ICU was 10% which was less than the rate from 2012 and 2013
(around 12%). The majority of influenza associated hospitalisations in 2014 were due to influenza A
infections, with very few associated with influenza B infection. Three quarters of hospitalisations had
known medical co-morbidities reported. In Australia it has been estimated that there have been over 8,500
adult influenza-associated hospitalisations since April 2014. The age distribution of hospital admissions
shows a peak in the 0-4 year age group, with hospitalisations increasing with increasing age, especially
among those aged 65 years and over.
 The severity of the 2014 influenza season was moderate across most jurisdictions. However, more severe
activity was noted in NSW, where influenza A(H3N2) circulated at higher levels and affected people in older
age-groups, which has led to a substantial number of outbreaks in aged care facilities.
 The WHO has reported that the southern hemisphere influenza season seems to be coming to an end, with
areas of high activity persisting in Oceania. Elsewhere influenza activity remained low, except for some
tropical countries in the Americas.

For more information: Department of Health
 
Last edited:
Back
Top