
Install the app
How to install the app on iOS
Follow along with the video below to see how to install our site as a web app on your home screen.
Note: This feature may not be available in some browsers.
-
FluTrackers.com Inc. does not provide medical advice. Information on this web site is collected from various internet resources, and the FluTrackers board of directors makes no warranty to the safety, efficacy, correctness or completeness of the information posted on this site by any author or poster. The information collated here is for instructional and/or discussion purposes only and is NOT intended to diagnose or treat any disease, illness, or other medical condition. Every individual reader or poster should seek advice from their personal physician/healthcare practitioner before considering or using any interventions that are discussed on this website. By continuing to access this website you agree to consult your personal physican before using any interventions posted on this website, and you agree to hold harmless FluTrackers.com Inc., the board of directors, the members, and all authors and posters for any effects from use of any medication, supplement, vitamin or other substance, device, intervention, etc. mentioned in posts on this website, or other internet venues referenced in posts on this website.
-
We are not asking for any donations. Do not donate to any entity who says they are raising funds for us.
You are using an out of date browser. It may not display this or other websites correctly.
You should upgrade or use an alternative browser.
You should upgrade or use an alternative browser.
2012-13 Selected Flu Indicator Charts Week 1 - current
- Thread starter JimO
- Start date
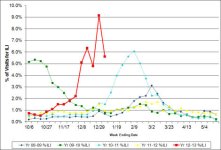
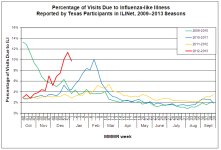
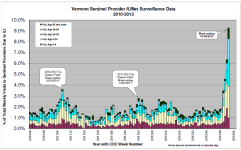
Re: 2012-13 Selected Flu Indicator Charts Week 1 - current
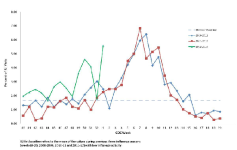
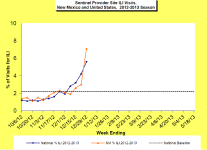
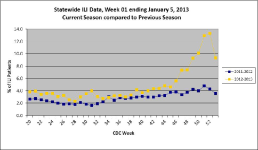
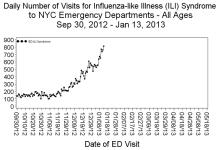
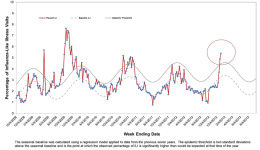
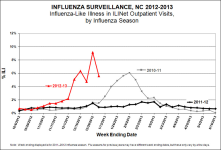
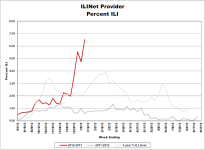
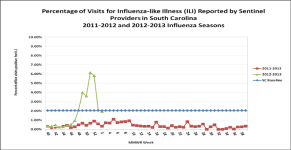
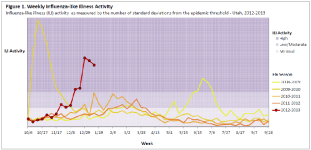
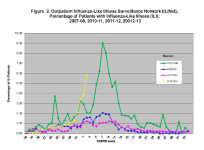
I think care must be taken with rates apparently turning down after an apparent "peak" in Week 52. Note this from the current CDC Flu Report: "The increase observed in week 52 may be attributed in part to a reduced number of routine health care visits during the end of year holidays, which has been observed in previous seasons"
We shall see what the stats for this week show. Google (as I posted in another thread) doesn't "believe" the CDC reported national surge/drop (but then I don't think the CDC does either considering their "disclaimer" i quoted). If Google Flu Trends has it right the reported US national ILI rate will jump back up in Friday's report.
I think care must be taken with rates apparently turning down after an apparent "peak" in Week 52. Note this from the current CDC Flu Report: "The increase observed in week 52 may be attributed in part to a reduced number of routine health care visits during the end of year holidays, which has been observed in previous seasons"
We shall see what the stats for this week show. Google (as I posted in another thread) doesn't "believe" the CDC reported national surge/drop (but then I don't think the CDC does either considering their "disclaimer" i quoted). If Google Flu Trends has it right the reported US national ILI rate will jump back up in Friday's report.

JimO
Well-known member
Re: 2012-13 Selected Flu Indicator Charts Week 1 - current
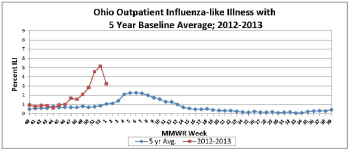
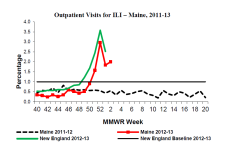
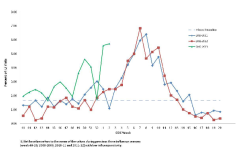
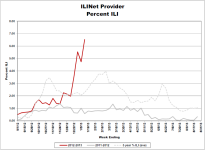
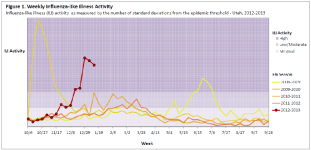
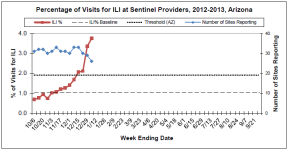
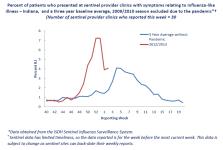
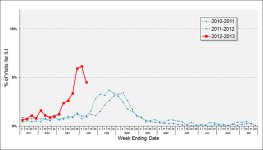
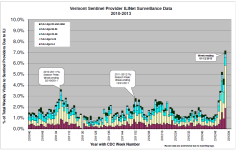
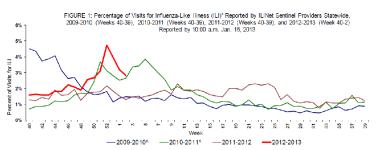
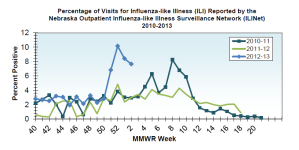
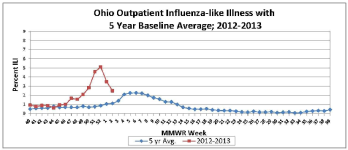
ILI is down in some states, but others show a dip and then an increase again, so it's hard to predict the peak.
California - Week 2 ILI
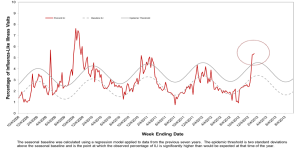
Massachusetts - Week 2 ILI
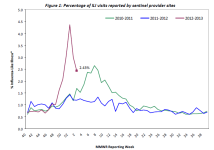
Maryland - Week 2 ILI
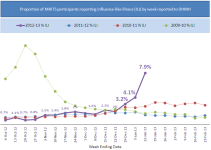
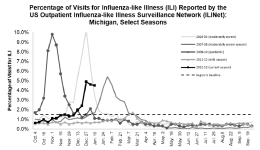
Michigan - Week 2 ILI
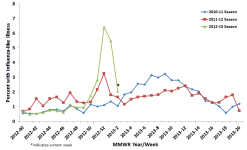
Minnesota - Week 2 ILI
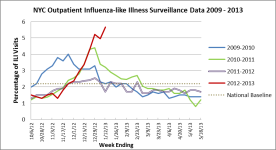
New York City - Week 2 ILI
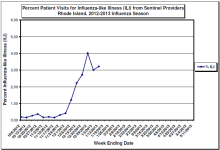
Rhode Island - Week 2 ILI
Tennessee - Week 2 ILI
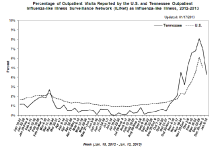
West Virginia - Week 2 ILI
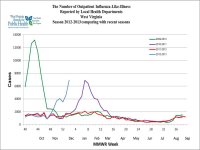
ILI is down in some states, but others show a dip and then an increase again, so it's hard to predict the peak.
California - Week 2 ILI
Massachusetts - Week 2 ILI
Maryland - Week 2 ILI
Michigan - Week 2 ILI
Minnesota - Week 2 ILI
New York City - Week 2 ILI
Rhode Island - Week 2 ILI
Tennessee - Week 2 ILI
West Virginia - Week 2 ILI
JimO
Well-known member
Re: 2012-13 Selected Flu Indicator Charts Week 1 - current
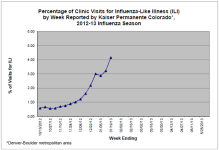
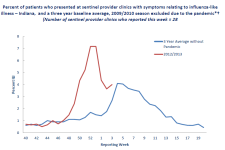
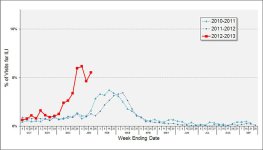
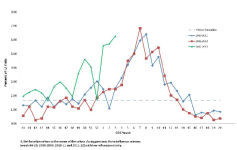
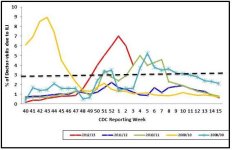
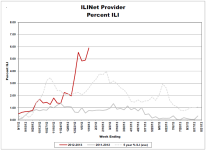
Although some states appear to be post peak, others that have been hit hard showed a decreasing trend over the past two weeks only to have ILI increase again in Week 3. We shouldn't let our guard down because ILI is an early indicator and fatalities trail by as much as 4 to 6 weeks.
Colorado ILI - Week 3
Indiana ILI - Week 3
Kansas ILI - Week 3
Missouri ILI - Week 3
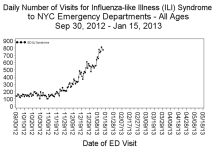
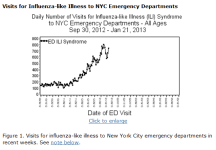
New York City Daily ED ILI - through 1/21/13
Pennsylvania ILI - Week 3
New Jersey ILI - Week 3
Although some states appear to be post peak, others that have been hit hard showed a decreasing trend over the past two weeks only to have ILI increase again in Week 3. We shouldn't let our guard down because ILI is an early indicator and fatalities trail by as much as 4 to 6 weeks.
Colorado ILI - Week 3
Indiana ILI - Week 3
Kansas ILI - Week 3
Missouri ILI - Week 3
New York City Daily ED ILI - through 1/21/13
Pennsylvania ILI - Week 3
New Jersey ILI - Week 3
JimO
Well-known member
Re: 2012-13 Selected Flu Indicator Charts Week 1 - current
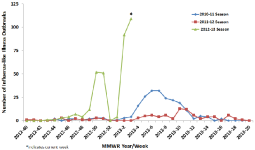
Here are more ILI charts from Week 3, including ILI outbreaks in schools in Minnesota, which has risen sharply as overall ILI in the state is decreasing significantly.
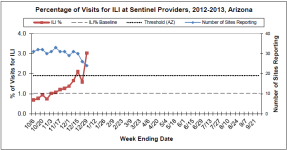
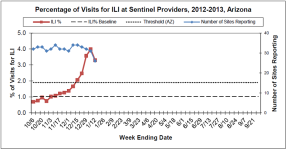
Arizona - Week 3 ILI
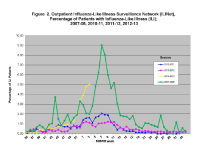
Connecticut - Week 3 ILI
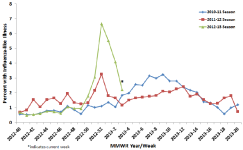
Minnesota - Week 3 ILI
Minnesota - Week 3 ILI Outbreaks in Schools
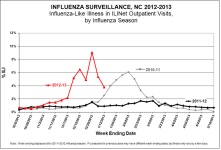
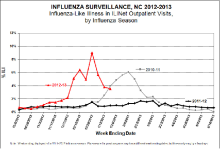
North Carolina - Week 3 ILI
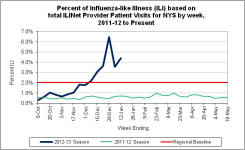
New York State - Week 3 ILI
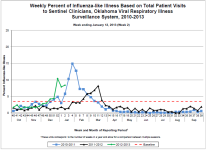
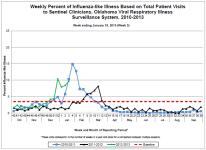
Oklahoma - Week 3 ILI
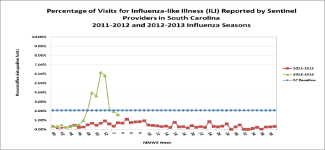
South Carolina - Week 3 ILI
Virginia - Week 3 ILI
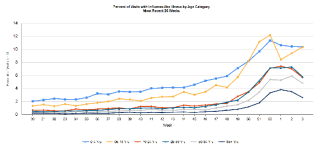
West Virginia - Week 3 ILI
Here are more ILI charts from Week 3, including ILI outbreaks in schools in Minnesota, which has risen sharply as overall ILI in the state is decreasing significantly.
Arizona - Week 3 ILI
Connecticut - Week 3 ILI
Minnesota - Week 3 ILI
Minnesota - Week 3 ILI Outbreaks in Schools
North Carolina - Week 3 ILI
New York State - Week 3 ILI
Oklahoma - Week 3 ILI
South Carolina - Week 3 ILI
Virginia - Week 3 ILI
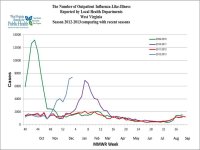
West Virginia - Week 3 ILI