 Tweet
Tweet
February 7, 2025
Weekly US Influenza Surveillance Report: Key Updates for Week 5, ending February 1, 2025
What to know
Seasonal influenza activity remains elevated and continues to increase across the country.
Summary
Viruses
Clinical Lab 31.6% (Trend
 )
)positive for influenza
this week. Public Health Lab Influenza A(H1N1)pdm09 and A(H3N2)
were the predominant viruses reported this week.
Illness
Outpatient Respiratory Illness 7.8% (Trend
)of visits to a health care provider this
week were for respiratory illness
(above baseline). Activity Map 2 moderate jurisdictions 45 high or very high jurisdictions FluSurv-NET 64.0 per 100,000
cumulative hospitalization rate National Healthcare Safety Network (NHSN) Hospital Respiratory Data 48,661 (Trend
)patients admitted to hospitals
with influenza this week. NCHS Mortality 2.0% (Trend
)of deaths attributed to influenza this week. Pediatric Deaths 10 influenza-associated deaths
were reported this week for
a total of 57 deaths this season.
All data are preliminary and may change as more reports are received.
Directional arrows indicate changes between the current week and the previous week. Additional information on the arrows can be found at the bottom of this page.
A description of the CDC influenza surveillance system, including methodology and detailed descriptions of each data component is available on the surveillance methods page.1
Additional information on the current and previous influenza seasons for each surveillance component are available on FluView Interactive.
Key Points
• Seasonal influenza activity remains elevated and continues to increase across the country.
• During Week 5, of the 4,377 viruses reported by public health laboratories, 4,264 were influenza A and 113 were influenza B. Of the 3,458 influenza A viruses subtyped during Week 5, 1,857 (53.7%) were influenza A(H1N1)pdm09, 1,601 (46.3%) were A(H3N2), and 0 were A(H5).
• Outpatient respiratory illness is increasing and remains above baseline nationally for the tenth consecutive week. All 10 HHS regions are above their region-specific baseline.
• One human infection with an influenza A(H1N2) variant (A(H1N2)v) virus was reported.
• No new influenza A(H5) cases were reported to CDC this week. To date, human-to-human transmission of influenza A(H5) virus has not been identified in the United States.
• Ten pediatric deaths associated with seasonal influenza virus infection were reported this week, bringing the 2024-2025 season total to 57 pediatric deaths.
• CDC estimates that there have been at least 24 million illnesses, 310,000 hospitalizations, and 13,000 deaths from flu so far this season.
• CDC recommends that everyone ages 6 months and older get an annual influenza (flu) vaccine.1
• There are prescription flu antiviral drugs that can treat flu illness; those should be started as early as possible and are especially important for patients at higher risk for severe illness.2
• Influenza viruses are among several viruses contributing to respiratory disease activity. CDC is providing updated, integrated information about COVID-19, flu, and respiratory syncytial virus (RSV) activity on a weekly basis.
COVID-19, flu, and RSV activity
U.S. virologic surveillance
Nationally and in all 10 HHS regions, the percentage of respiratory specimens testing positive for influenza virus in clinical laboratories increased (change of ≥ 0.5 percentage points) compared to the previous week. Region 6 had the highest percent positivity (37.8%) and Region 10 had the lowest (26.1%). Influenza A(H1N1)pdm09 and A(H3N2) were the predominant viruses reported this week. For regional and state level data and age group distribution, please visit FluView Interactive. Viruses known to be associated with recent receipt of live attenuated influenza vaccine (LAIV) or found upon further testing to be a vaccine virus are not included, as they are not circulating influenza viruses.
Clinical Laboratories
The results of tests performed by clinical laboratories nationwide are summarized below. Data from clinical laboratories (the percentage of specimens tested that are positive for influenza virus) are used to monitor whether influenza activity is increasing or decreasing.
| No. of specimens tested | 148,747 | 1,840,292 |
| No. of positive specimens (%) | 47,004 (31.6%) | 236,204 (12.8%) |
| Positive specimens by type | ||
| Influenza A | 45,157 (96.1%) | 228,221 (96.6%) |
| Influenza B | 1,847 (3.9%) | 7,982 (3.4%) |
The results of tests performed by public health laboratories nationwide are summarized below. Data from public health laboratories are used to monitor the proportion of circulating influenza viruses that belong to each influenza subtype/lineage.
| No. of specimens tested | 5,614 | 62,760 |
| No. of positive specimens | 4,377 | 38,289 |
| Positive specimens by type/subtype | ||
| Influenza A | 4,264 (97.4%) | 37,308 (97.4%) |
| Subtyping Performed | 3,458 (81.1%) | 33,023 (88.5%) |
| (H1N1)pdm09 | 1,857(53.7%) | 15,685 (47.5%) |
| H3N2 | 1,601 (46.3%) | 17,260 (52.3%) |
| H3N2v† | 0 | 0 |
| H5* | 0 | 78 (0.2%) |
| Subtyping not performed | 806 (18.9%) | 4,285 (11.5%) |
| Influenza B | 113 (2.6%) | 981 (2.6%) |
| Lineage testing performed | 56 (49.6%) | 474 (48.3%) |
| Yamagata lineage | 0 | 0 |
| Victoria lineage | 56 (100%) | 474 (100%) |
| Lineage not performed | 57 (50.4%) | 507 (51.7%) |
†When an influenza virus that normally circulates in swine (but not people) is detected in a person, it is called a "variant" influenza virus. Most human infections with variant influenza viruses occur following exposure to swine, but human-to-human transmission can occur. It is important to note that in most cases, variant influenza viruses have not shown the ability to spread easily and sustainably from human-to-human.
*This graph reflects the number of specimens tested and the number determined to be positive for influenza viruses at the public health lab (specimens tested is not the same as cases). It does not reflect specimens tested only at CDC and could include more than one specimen tested per person. Specimens tested as part of routine influenza surveillance as well as those tested as part of targeted testing for people exposed to influenza A(H5) are included.
Additional virologic surveillance information for current and past seasons:
Surveillance Methods | FluView Interactive: National, Regional, and State Data or Age Data
Novel Influenza A Virus Infections
One human infection with influenza A(H1N2) variant (A(H1N2)v) virus was reported by the Iowa Department of Health and Human Services.
The patient is ≥18 years of age and sought health care during the week ending January 18, 2025 (Week 3), was hospitalized, and has recovered from their illness. An investigation by state public health officials did not identify direct or indirect swine contact by the patent. No illness was identified among the patient's close contacts. No human-to-human transmission has been identified associated with this case.
This is the first human infection with a variant influenza virus reported during the 2024-2025 season in the United States.
When an influenza virus that normally circulates in swine (but not people) is detected in a person, it is called a "variant" influenza virus. Most human infections with variant influenza viruses occur following exposure to swine, but human-to-human transmission can occur. It is important to note that in most cases, variant influenza viruses have not shown the ability to spread easily and sustainably from person to person. Additional information on influenza in swine, variant influenza virus infection in humans, and guidance to interact safely with swine can be found at www.cdc.gov/flu/swineflu/index.htm.
No new human infections with A(H5) were reported to CDC this week. An ongoing outbreak of H5N1 continues in domestic dairy cows and poultry, and monitoring for additional human cases is ongoing.
The CSTE position statement, which includes updated case definitions for confirmed, probable, and suspected cases is available at http://www.cste.org/resource/resmgr/...nfluenza_A.pdf
An up-to-date human A(H5) case summary during the outbreak by state and exposure source is available at www.cdc.gov/bird-flu/situation-summary/index.html
Information about avian influenza is available at https://www.cdc.gov/flu/avianflu/index.htm.
Interim recommendations for Prevention, Monitoring, and Public Health Investigations are available at https://www.cdc.gov/bird-flu/prevent...endations.html.
The latest case reports on avian influenza outbreaks in wild birds, commercial poultry, backyard or hobbyist flocks, and mammals in the United States are available from the USDA at https://www.aphis.usda.gov/aphis/our...enza/2022-hpai.
Additional information regarding human infections with novel influenza A viruses:
Surveillance Methods | FluView Interactive
Influenza Virus Characterization
CDC performs genetic and antigenic characterization of U.S. viruses submitted from state and local public health laboratories according to the Right Size Roadmap submission guidance. These data are used to compare how similar the currently circulating influenza viruses are to the reference viruses representing the current influenza vaccines. The data are also used to monitor evolutionary changes that continually occur in influenza viruses circulating in humans. CDC also tests susceptibility of circulating influenza viruses to antiviral medications including the neuraminidase inhibitors (oseltamivir, zanamivir, and peramivir) and the polymerase acidic protein (PA) endonuclease inhibitor baloxavir. The HA clade and subclades were assigned using Nextclade (https://clades.nextstrain.org).
CDC has genetically characterized 1,482 influenza viruses collected since September 29, 2024.
| A/H1 | 549 | ||||
| 5a.2a | 329 (59.9%) | C.1.9 | 329 (59.9%) | ||
| 5a.2a.1 | 220 (40.1%) | D | 14 (2.6%) | ||
| D.1 | 4 (0.7%) | ||||
| D.3 | 53 (9.7%) | ||||
| D.5 | 149 (27.1%) | ||||
| A/H3 | 822 | ||||
| 2a.3a | 5 (0.6%) | G.1.3.1 | 5 (0.6%) | ||
| 2a.3a.1 | 817 (99.4%) | J.1 | 1 (0.1%) | ||
| J.1.1 | 6 (0.7%) | ||||
| J.2 | 754 (91.7%) | ||||
| J.2.1 | 13 (1.6%) | ||||
| J.2.2 | 43 (5.2%) | ||||
| B/Victoria | 111 | ||||
| 3a.2 | 111 (100%) | C.3 | 1 (0.9%) | ||
| C.5 | 15 (13.5%) | ||||
| C.5.1 | 63 (56.8%) | ||||
| C.5.6 | 14 (12.6%) | ||||
| C.5.7 | 18 (16.2%) | ||||
| B/Yamagata | 0 | ||||
| Y3 | 0 | Y3 | 0 |
- A(H1N1)pdm09: 95 A(H1N1)pdm09 viruses were antigenically characterized by HI, and all were well-recognized (reacting at titers that were within 4-fold of the homologous virus titer) by ferret antisera to cell-grown A/Wisconsin/67/2022-like reference viruses representing the A(H1N1)pdm09 component for the cell- and recombinant-based influenza vaccines.
- A(H3N2): 132 A(H3N2) viruses were antigenically characterized by HI or HINT, and 55 (41.7%) were well-recognized (reacting at titers that were within 4-fold of the homologous virus titer in HI or reacting at titers that were less than or equal to 8-fold of the homologous virus in HINT) by ferret antisera to cell-grown A/Massachusetts/18/2022-like reference viruses representing the A(H3N2) component for the cell- and recombinant-based influenza vaccines.
- B/Victoria: 39 influenza B/Victoria-lineage virus were antigenically characterized by HI, and all were well-recognized (reacting at titers that were within 4-fold of the homologous virus titer) by ferret antisera to cell-grown B/Austria/1359417/2021-like reference viruses representing the B/Victoria component for the cell- and recombinant-based influenza vaccines.
- B/Yamagata: No influenza B/Yamagata-lineage viruses were available for antigenic characterization.
CDC assesses susceptibility of influenza viruses to the antiviral medications including the neuraminidase inhibitors (oseltamivir, zanamivir, and peramivir) and the PA endonuclease inhibitor baloxavir using next generation sequence analysis supplemented by laboratory assays. Information about antiviral susceptibility test methods can be found at U.S. Influenza Surveillance: Purpose and Methods.
Viruses collected in the U.S. since September 29, 2024, were tested for antiviral susceptibility as follows:
| Neuraminidase Inhibitors | Oseltamivir | Viruses Tested | 1,462 | 551 | 806 | 105 |
| Reduced Inhibition | 1 (<0.1%) | 1 (0.2%) | 0 | 0 | ||
| Highly Reduced Inhibition | 2 (0.1%) | 2 (0.4%) | 0 | 0 | ||
| Peramivir | Viruses Tested | 1,462 | 551 | 806 | 105 | |
| Reduced Inhibition | 0 | 0 | 0 | 0 | ||
| Highly Reduced Inhibition | 2 (0.1%) | 2 (0.4%) | 0 | 0 | ||
| Zanamivir | Viruses Tested | 1,462 | 551 | 806 | 105 | |
| Reduced Inhibition | 0 | 0 | 0 | 0 | ||
| Highly Reduced Inhibition | 0 | 0 | 0 | 0 | ||
| PA Cap-Dependent Endonuclease Inhibitor | Baloxavir | Viruses Tested | 1,387 | 485 | 798 | 104 |
| Decreased Susceptibility | 0 | 0 | 0 | 0 |
High levels of resistance to the adamantanes (amantadine and rimantadine) persist among influenza A(H1N1)pdm09 and influenza A(H3N2) viruses (the adamantanes are not effective against influenza B viruses). Therefore, use of these antivirals for treatment and prevention of influenza A virus infection is not recommended and data from adamantane resistance testing are not presented.
Outpatient and Emergency Department Illness Surveillance
Outpatient respiratory illness visits
The U.S. Outpatient Influenza-like Illness Surveillance Network (ILINet) monitors outpatient visits for respiratory illness referred to as influenza-like illness [ILI (fever plus cough or sore throat)], not laboratory-confirmed influenza, and will therefore capture respiratory illness visits due to infection with any pathogen that can present with similar symptoms, including influenza virus, SARS-CoV-2, and RSV. It is important to evaluate syndromic surveillance data, including that from ILINet, in the context of other sources of surveillance data to obtain a complete and accurate picture of influenza, SARS-CoV-2, and other respiratory virus activity.
Nationally, during Week 5, 7.8% of patient visits reported through ILINet were due to respiratory illness that included fever plus a cough or sore throat, also referred to as ILI. This week's percentage increased (change of > 0.1 percentage points) compared to Week 4 and remains above the national baseline of 3.0% for the tenth consecutive week. The percentage of visits for ILI increased (change of > 0.1 percentage points) in regions 1, 3, 4, 5, 6, 7, and 10 and remained stable in regions 2, 8, and 9 this week compared to last. All regions remain above their respective baselines. Multiple respiratory viruses are co-circulating, and the relative contribution of influenza virus infections to ILI varies by location.
Outpatient respiratory illness visits by age group
About 70% of ILINet participants provide both the number of patient visits for respiratory illness and the total number of patient visits for the week broken out by age group. Based on these data, the percentage of visits for respiratory illness increased (change of > 0.1 percentage point) in all age groups (0-4 years, 5-24 years, 25-49 years, 50-64 years, and 65+ years) in Week 5 compared to Week 4.
Outpatient respiratory illness activity map
Data collected in ILINet are used to produce a measure of ILI activity* by state/jurisdiction and Core Based Statistical Areas (CBSA).
| Week 5 (Week ending Feb. 1, 2025) |
Week 4 (Week ending Jan. 25, 2025) |
Week 5 (Week ending Feb. 1, 2025) |
Week 4 (Week ending Jan. 25, 2025) |
|
| Very High | 34 | 29 | 122 | 87 |
| High | 11 | 15 | 229 | 194 |
| Moderate | 2 | 4 | 129 | 139 |
| Low | 2 | 2 | 112 | 153 |
| Minimal | 5 | 4 | 109 | 131 |
| Insufficient Data | 1 | 1 | 228 | 225 |
Surveillance Methods | FluView Interactive: National, Regional, and State Data or ILI Activity Map
National Syndromic Surveillance System (NSSP)
The overall percentage of emergency department (ED) visits with a discharge diagnosis of influenza reported in NSSP was 8.0% during Week 5, an increase (change of > 0.1 percentage point) compared to the previous week. The percentage of ED visits with influenza discharge diagnoses increased in HHS regions 1, 3, 4, 5, 6, 7, 8, 9 and 10 and remained stable (change of ≤ 0.1 percentage point) in Region 2. The percentage also increased in all age groups from Week 4 to Week 5 except the 5-17 years age group, which remained stable. RegionNationalRegion 1Region 2Region 3Region 4Region 5Region 6Region 7Region 8Region 9Region 10
Season2022-20232023-2024 & 2024-2025 Skip Over Chart Container
02.0%4.0%6.0%8.0%10.0%12.0%14.0%Percent of Emergency Department Visits for InfluenzaWeek 41 of 2023Week 45 of 2023Week 49 of 2023Week 1 of 2024Week 5 of 2024Week 9 of 2024Week 13 of 2024Week 17 of 2024Week 21 of 2024Week 25 of 2024Week 29 of 2024Week 33 of 2024Week 37 of 2024Week 41 of 2024Week 45 of 2024Week 49 of 2024Week 1 of 2025Week 5 of 2025
Age Group
All ages
0-4 years
5-17 years
18-64 years
65+ Skip Data Table
Data Table Download Data (CSV) Skipped data table.
Additional information about emergency department visits for flu for current and past seasons:
Surveillance Methods | Emergency Department Visits for COVID-19, flu, and RSV
Hospitalization surveillance
FluSurv-Net
The Influenza Hospitalization Surveillance Network (FluSurv-NET) conducts population-based surveillance for laboratory-confirmed influenza-related hospitalizations in select counties in 14 states and represents approximately 9% of the U.S. population. FluSurv-NET hospitalization data are preliminary. As data are received each week, prior case counts and rates are updated accordingly.
A total of 19,609 laboratory-confirmed influenza-associated hospitalizations were reported by FluSurv-NET sites between October 1, 2024, and February 1, 2025. The weekly hospitalization rate observed during Week 5 was 9.2 per 100,000 population. The weekly hospitalization rates observed during Week 1 and Week 4 (10.2 per 100,000 population) are tied with the 2017-2018 season as the highest peak weekly rate observed, across all seasons since 2010-2011. The cumulative hospitalization rate observed in Week 5 was 64.0 per 100,000 population.
Among all hospitalizations, 19,175 (97.8%) were associated with influenza A virus, 340 (1.7%) with influenza B virus, 16 (0.1%) with influenza A virus and influenza B virus co-infection, and 78 (0.4%) with influenza virus for which the type was not determined. Among those with influenza A subtype information, 2,177 (52.5%) were A(H1N1)pdm09 and 1,970 (47.5%) were A(H3N2).
When examining rates by age, the highest cumulative hospitalization rate per 100,000 population was among adults aged 65 years and older (196.9), followed by adults aged 50-64 years (74.0), children aged 0-4 years (55.7), adults aged 18-49 (27.8), and children aged 5-17 (19.6).
When examining age-adjusted rates by race and ethnicity, the highest cumulative hospitalization rate per 100,000 population was among non-Hispanic Black persons (95.8), followed by American Indian/Alaska Native persons (85.3), Hispanic persons (54.1), non-Hispanic White persons (49.3), and Asian/Pacific Islander persons (40.5).
Among 1,907 hospitalized adults with information on underlying medical conditions, 95.1% had at least one reported underlying medical condition; the most commonly reported were hypertension, cardiovascular disease, metabolic disease, and obesity. Among 991 hospitalized women of childbearing age (15-49 years) with information on pregnancy status, 30.5% were pregnant. Among 379 hospitalized children with information on underlying medical conditions, 52.8% had at least one reported underlying medical condition; the most commonly reported was asthma, followed by obesity and neurologic disease.
**In this figure, weekly rates for all seasons prior to the 2024-2025 season reflect end-of-season rates. For the 2024-2025 season, rates for recent hospital admissions are subject to reporting delays and are shown as a dashed line for the current season. As hospitalization data are received each week, prior case counts and rates are updated accordingly.
Additional FluSurv-NET hospitalization surveillance information for current and past seasons and additional age groups:
Surveillance Methods | FluView Interactive: Rates by Age, Sex, and Race/Ethnicity or Data on Patient Characteristics | RESP-NET Interactive
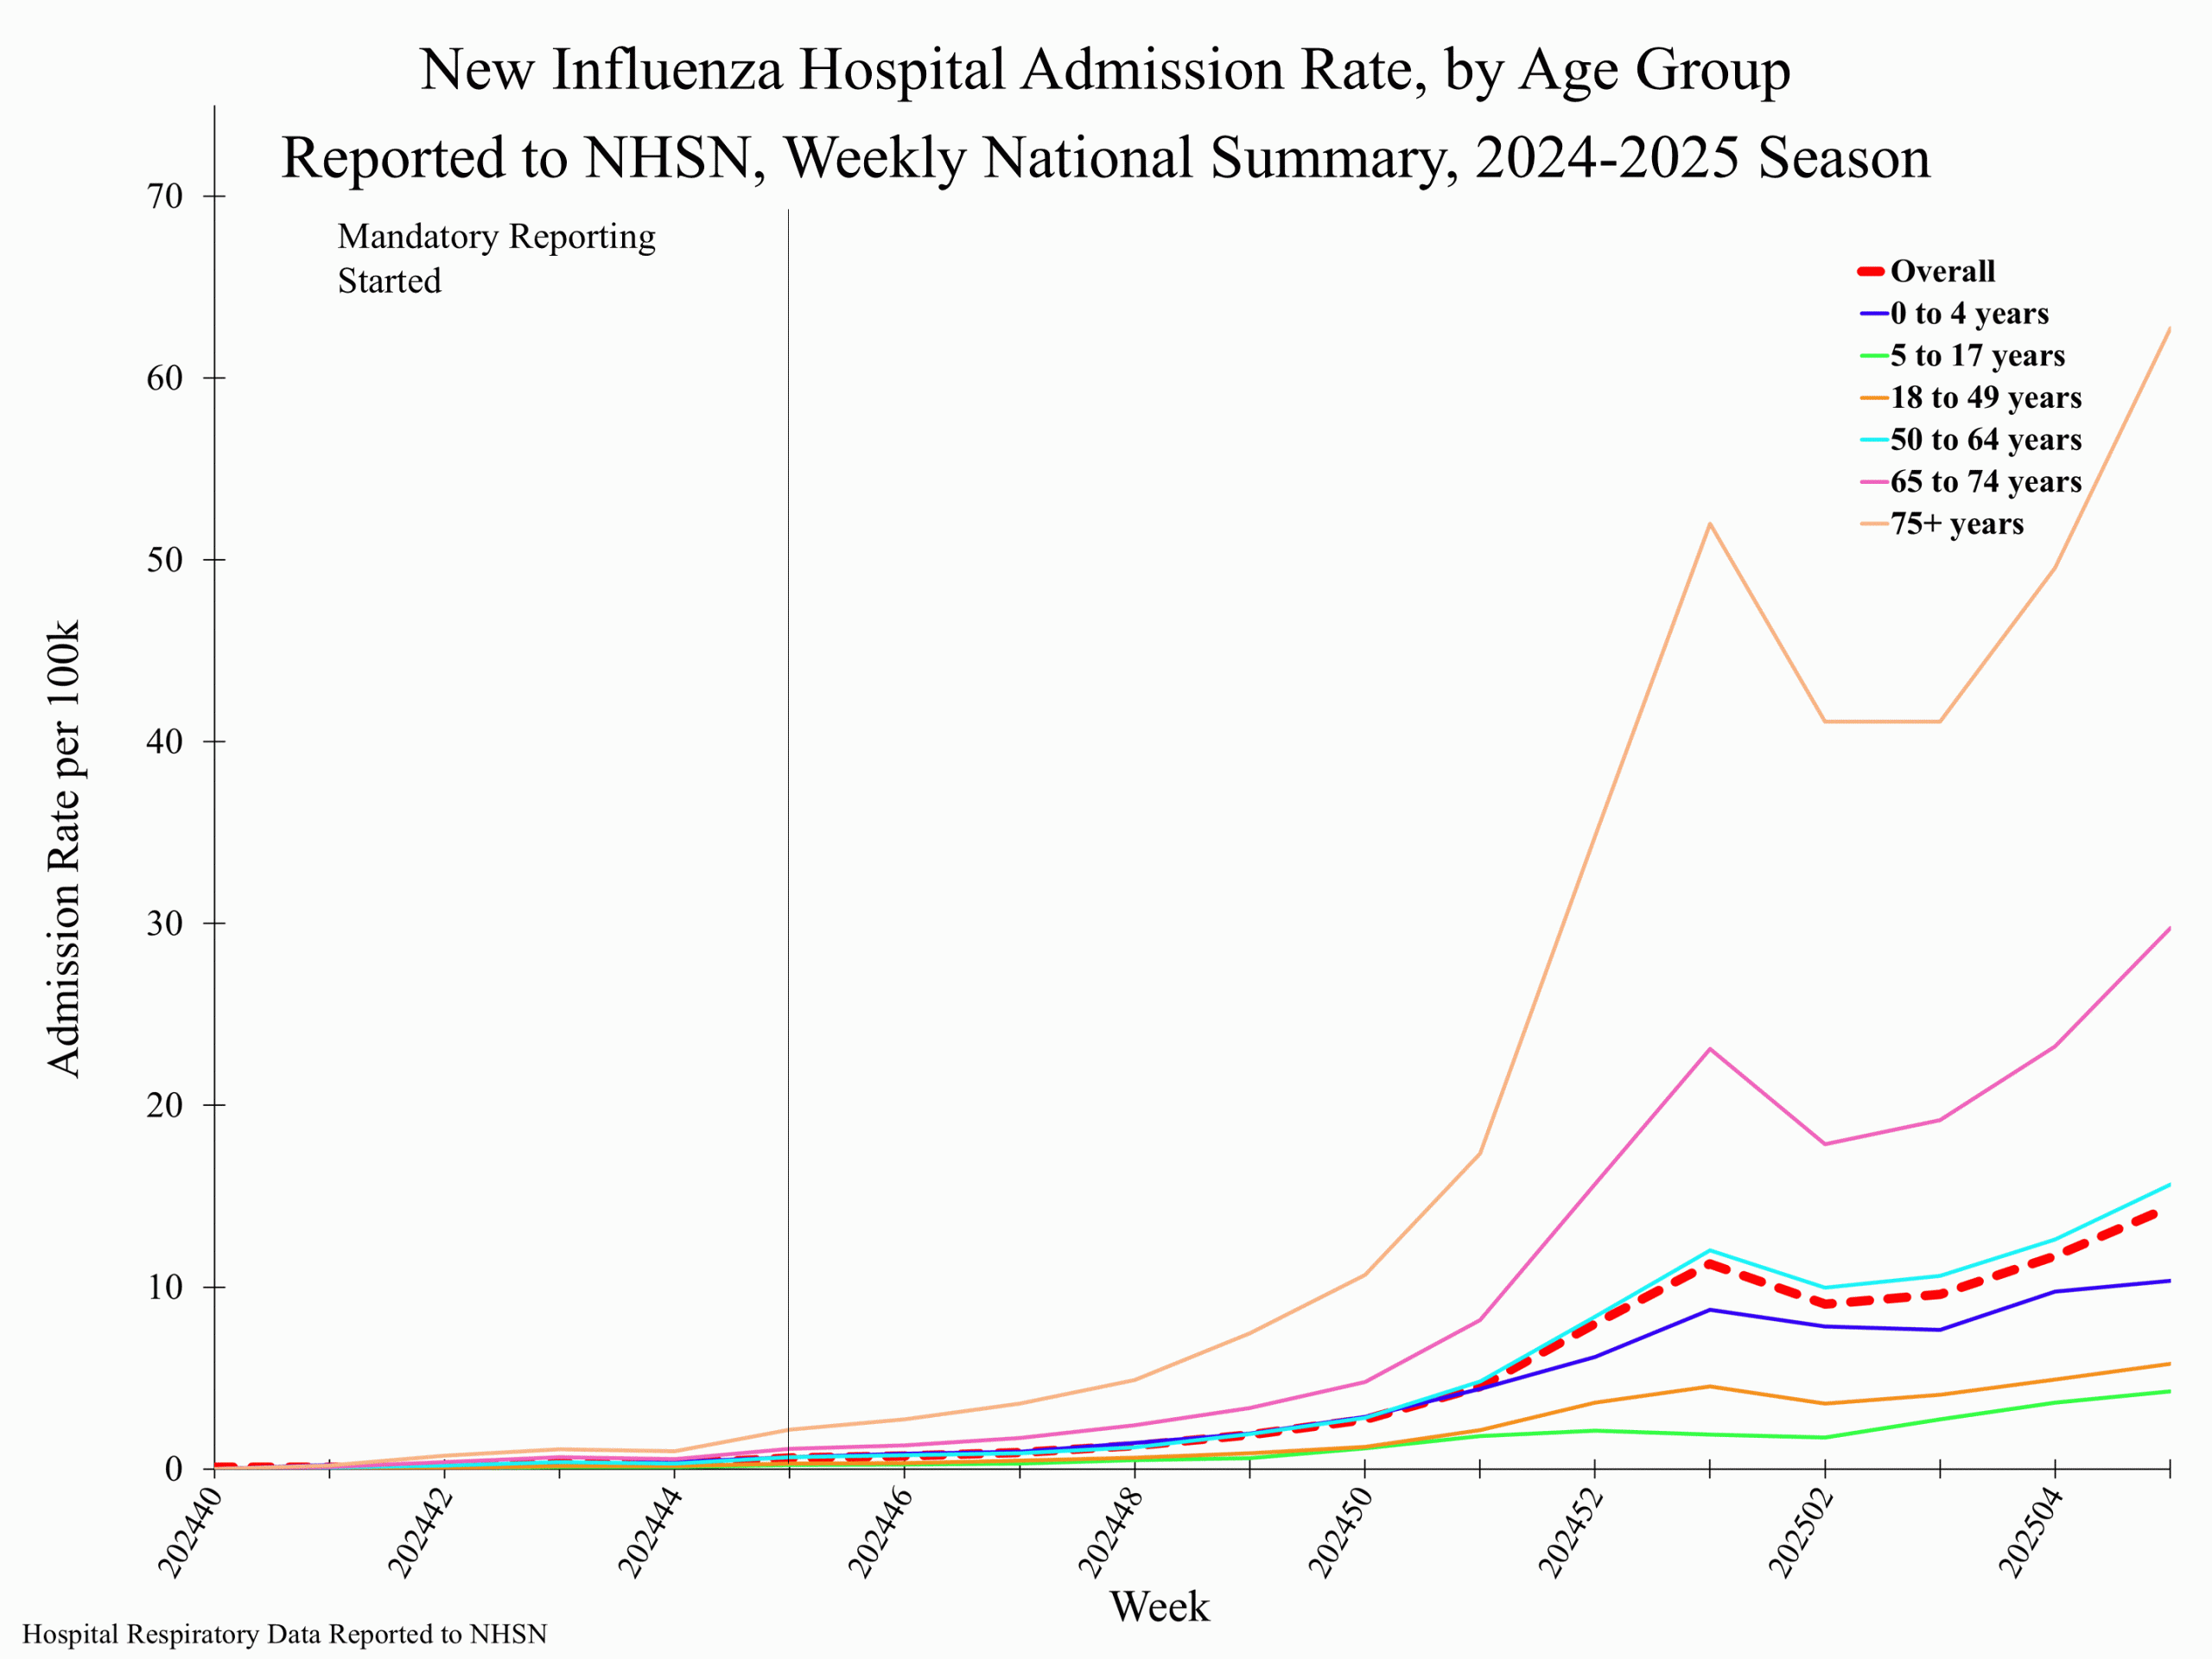
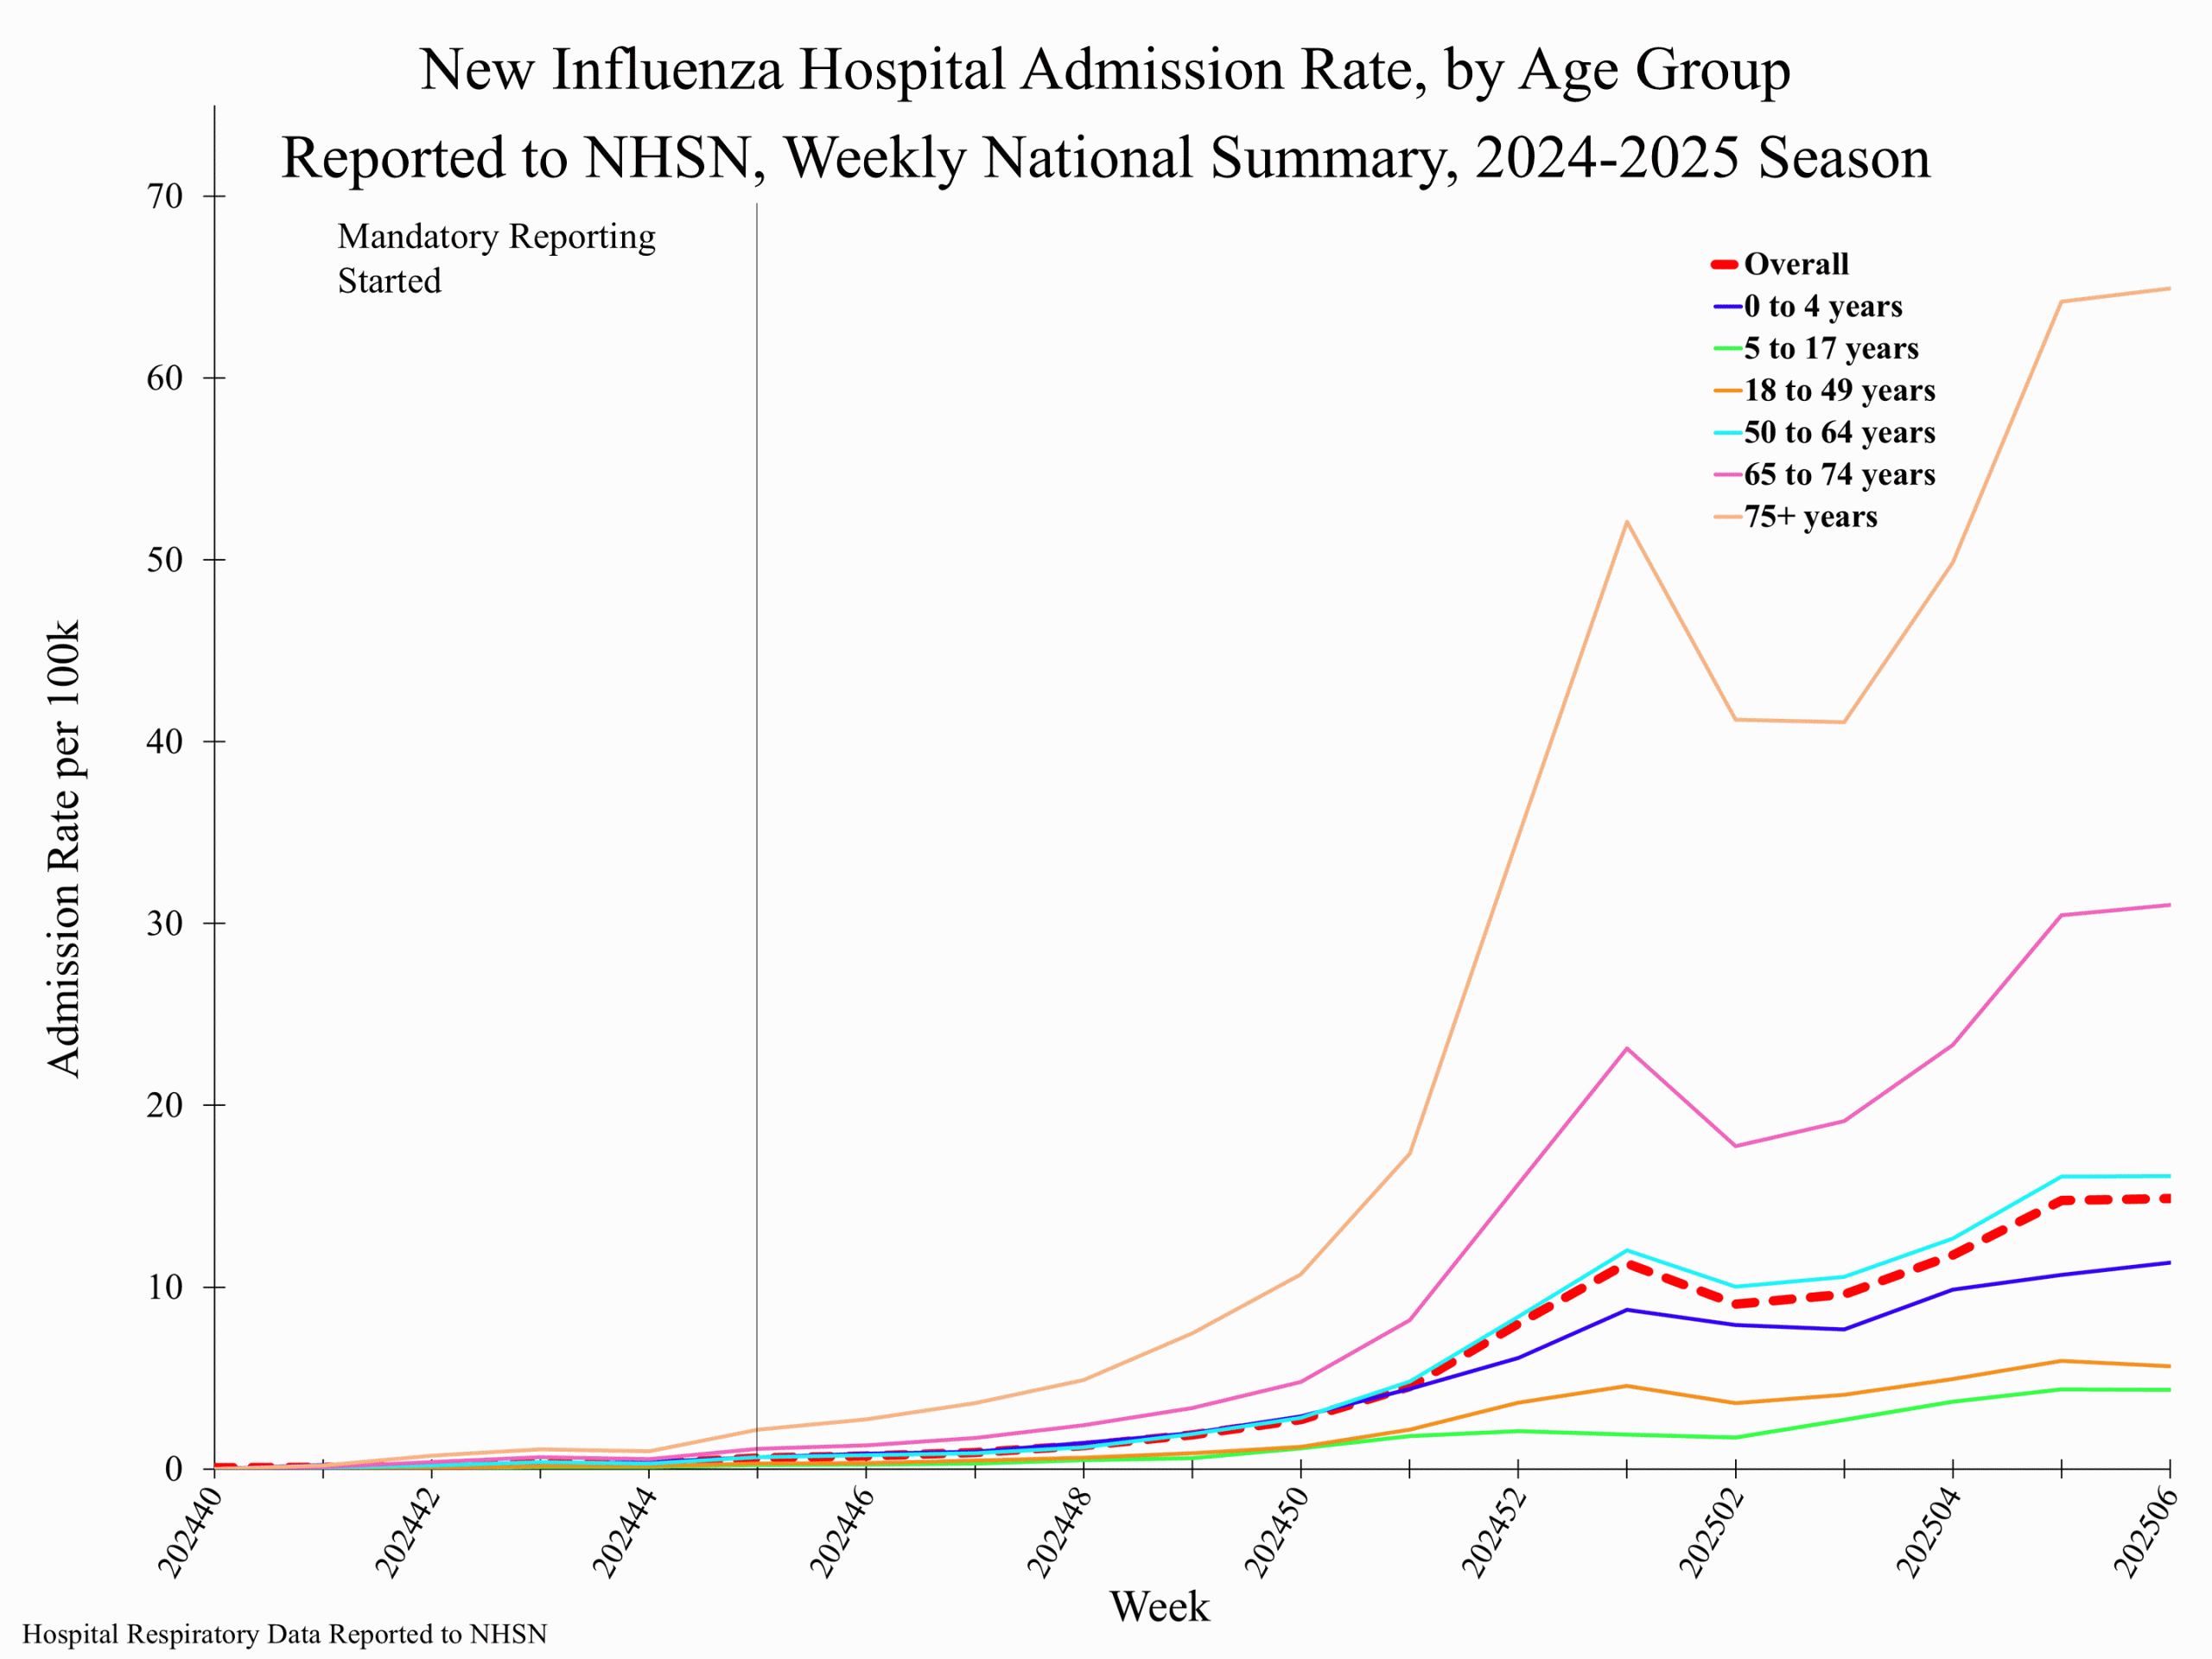
National Healthcare Safety Network (NHSN) Hospital Respiratory Data
Hospitals report to NHSN the weekly number of patients with laboratory-confirmed influenza who were admitted to the hospital. Nationally, during Week 5, 48,661 laboratory confirmed influenza-associated hospitalizations were reported. This week's influenza-associated hospitalizations increased (change of > 5%) compared to Week 4.
The weekly hospital admission rate observed in Week 5 was 14.4 per 100,000. The weekly rate of hospital admissions in all 10 HHS regions ranged from 8.8 (Region 10) to 19.5 (Region 3). The weekly rate of hospital admissions increased in regions 1, 3, 4, 5, 6, 7, 8, 9 and 10 and remained stable in Region 2.
When examining rates by age for Week 5, all age groups increased compared to the previous week. The highest hospital admission rate per 100,000 population was among those 75+ years (62.8), followed by 65-74 years (29.8), and 50-64 years (15.7). View Larger
 Additional NHSN Hospital Respiratory Data information:
Surveillance Methods | Additional Data | FluView Interactive
Mortality surveillance
National Center for Health Statistics (NCHS) Mortality Surveillance
Based on NCHS mortality surveillance data available on February 6, 2025, 2.0% of the deaths that occurred during the week ending February 1, 2025 (Week 5), were due to influenza. This percentage increased (> 0.1 percentage point change) compared to Week 4. The data presented are preliminary and may change as more data are received and processed.
Additional pneumonia, influenza and COVID-19 mortality surveillance information for current and past seasons:
Surveillance Methods | FluView Interactive Influenza-Associated Pediatric Mortality
Ten influenza-associated pediatric deaths occurring during the 2024-2025 season were reported to CDC during Week 5. The deaths occurred between Week 52 of 2024 (the week ending December 28, 2024) and Week 5 of 2025 (the week ending February 1, 2025). Eight deaths were associated with influenza A viruses. Seven of the influenza A viruses had subtyping performed; four were A(H1N1) viruses and three were A(H3N2) viruses. Two deaths were associated with influenza B viruses with no lineage determined.
A total of 57 influenza-associated pediatric deaths occurring during the 2024-2025 season have been reported to CDC.
Additional pediatric mortality surveillance information for current and past seasons:
Surveillance Methods | FluView Interactive
Additional National and International Influenza Surveillance Information
Indicators Status by System
Increasing:
Decreasing:

Stable:

Clinical Labs: Up or down arrows indicate a change of greater than or equal to 0.5 percentage points in the percent of specimens positive for influenza compared to the previous week.
Outpatient Respiratory Illness (ILINet): Up or down arrows indicate a change of greater than 0.1 percentage points in the percent of visits due to respiratory illness (ILI) compared to the previous week.
NHSN Hospitalizations: Up or down arrows indicate change of greater than or equal to 5% of the number of patients admitted with laboratory-confirmed influenza compared to the previous week.
NCHS Mortality: Up or down arrows indicate change of greater than 0.1 percentage points of the percent of deaths due to influenza compared to the previous week.
Additional surveillance information
FluView Interactive: FluView includes enhanced web-based interactive applications that can provide dynamic visuals of the influenza data collected and analyzed by CDC. These FluView Interactive applications allow people to create customized, visual interpretations of influenza data, as well as make comparisons across flu seasons, regions, age groups and a variety of other demographics.
National Institute for Occupational Safety and Health: Monthly surveillance data on the prevalence of health-related workplace absenteeism among full-time workers in the United States are available from NIOSH.
U.S. State and local influenza surveillance: Select a jurisdiction below to access the latest local influenza information.
Public Health Agency of Canada:
The most up-to-date influenza information from Canada is available in Canada's weekly FluWatch report.
Public Health England:
The most up-to-date influenza information from the United Kingdom is available from Public Health England.
Any links provided to non-Federal organizations are provided solely as a service to our users. These links do not constitute an endorsement of these organizations or their programs by CDC or the Federal Government, and none should be inferred. CDC is not responsible for the content of the individual organization web pages found at these links.
A description of the CDC influenza surveillance system, including methodology and detailed descriptions of each data component is available on the surveillance methods page.
On This Page
- Summary
- U.S. virologic surveillance
- Influenza Virus Characterization
- Outpatient and Emergency Department Illness Surveillance
- Hospitalization surveillance
- Mortality surveillance
- Additional National and International Influenza Surveillance Information
- Current Week: U.S. Influenza Surveillance Report
- Weekly US Influenza Surveillance Report: Key Updates for Week 2, ending January 11, 2025
- Weekly US Influenza Surveillance Report: Key Updates for Week 3, ending January 18, 2025
- Weekly US Influenza Surveillance Report: Key Updates for Week 4, ending January 25, 2025
- Past Weekly Report
- Weekly US Map: Influenza Summary Update
View AllFluView
Back to Top
Past Weekly Report
Sources

 NHSN week 6 Additional NHSN Hospitalization Surveillance information:
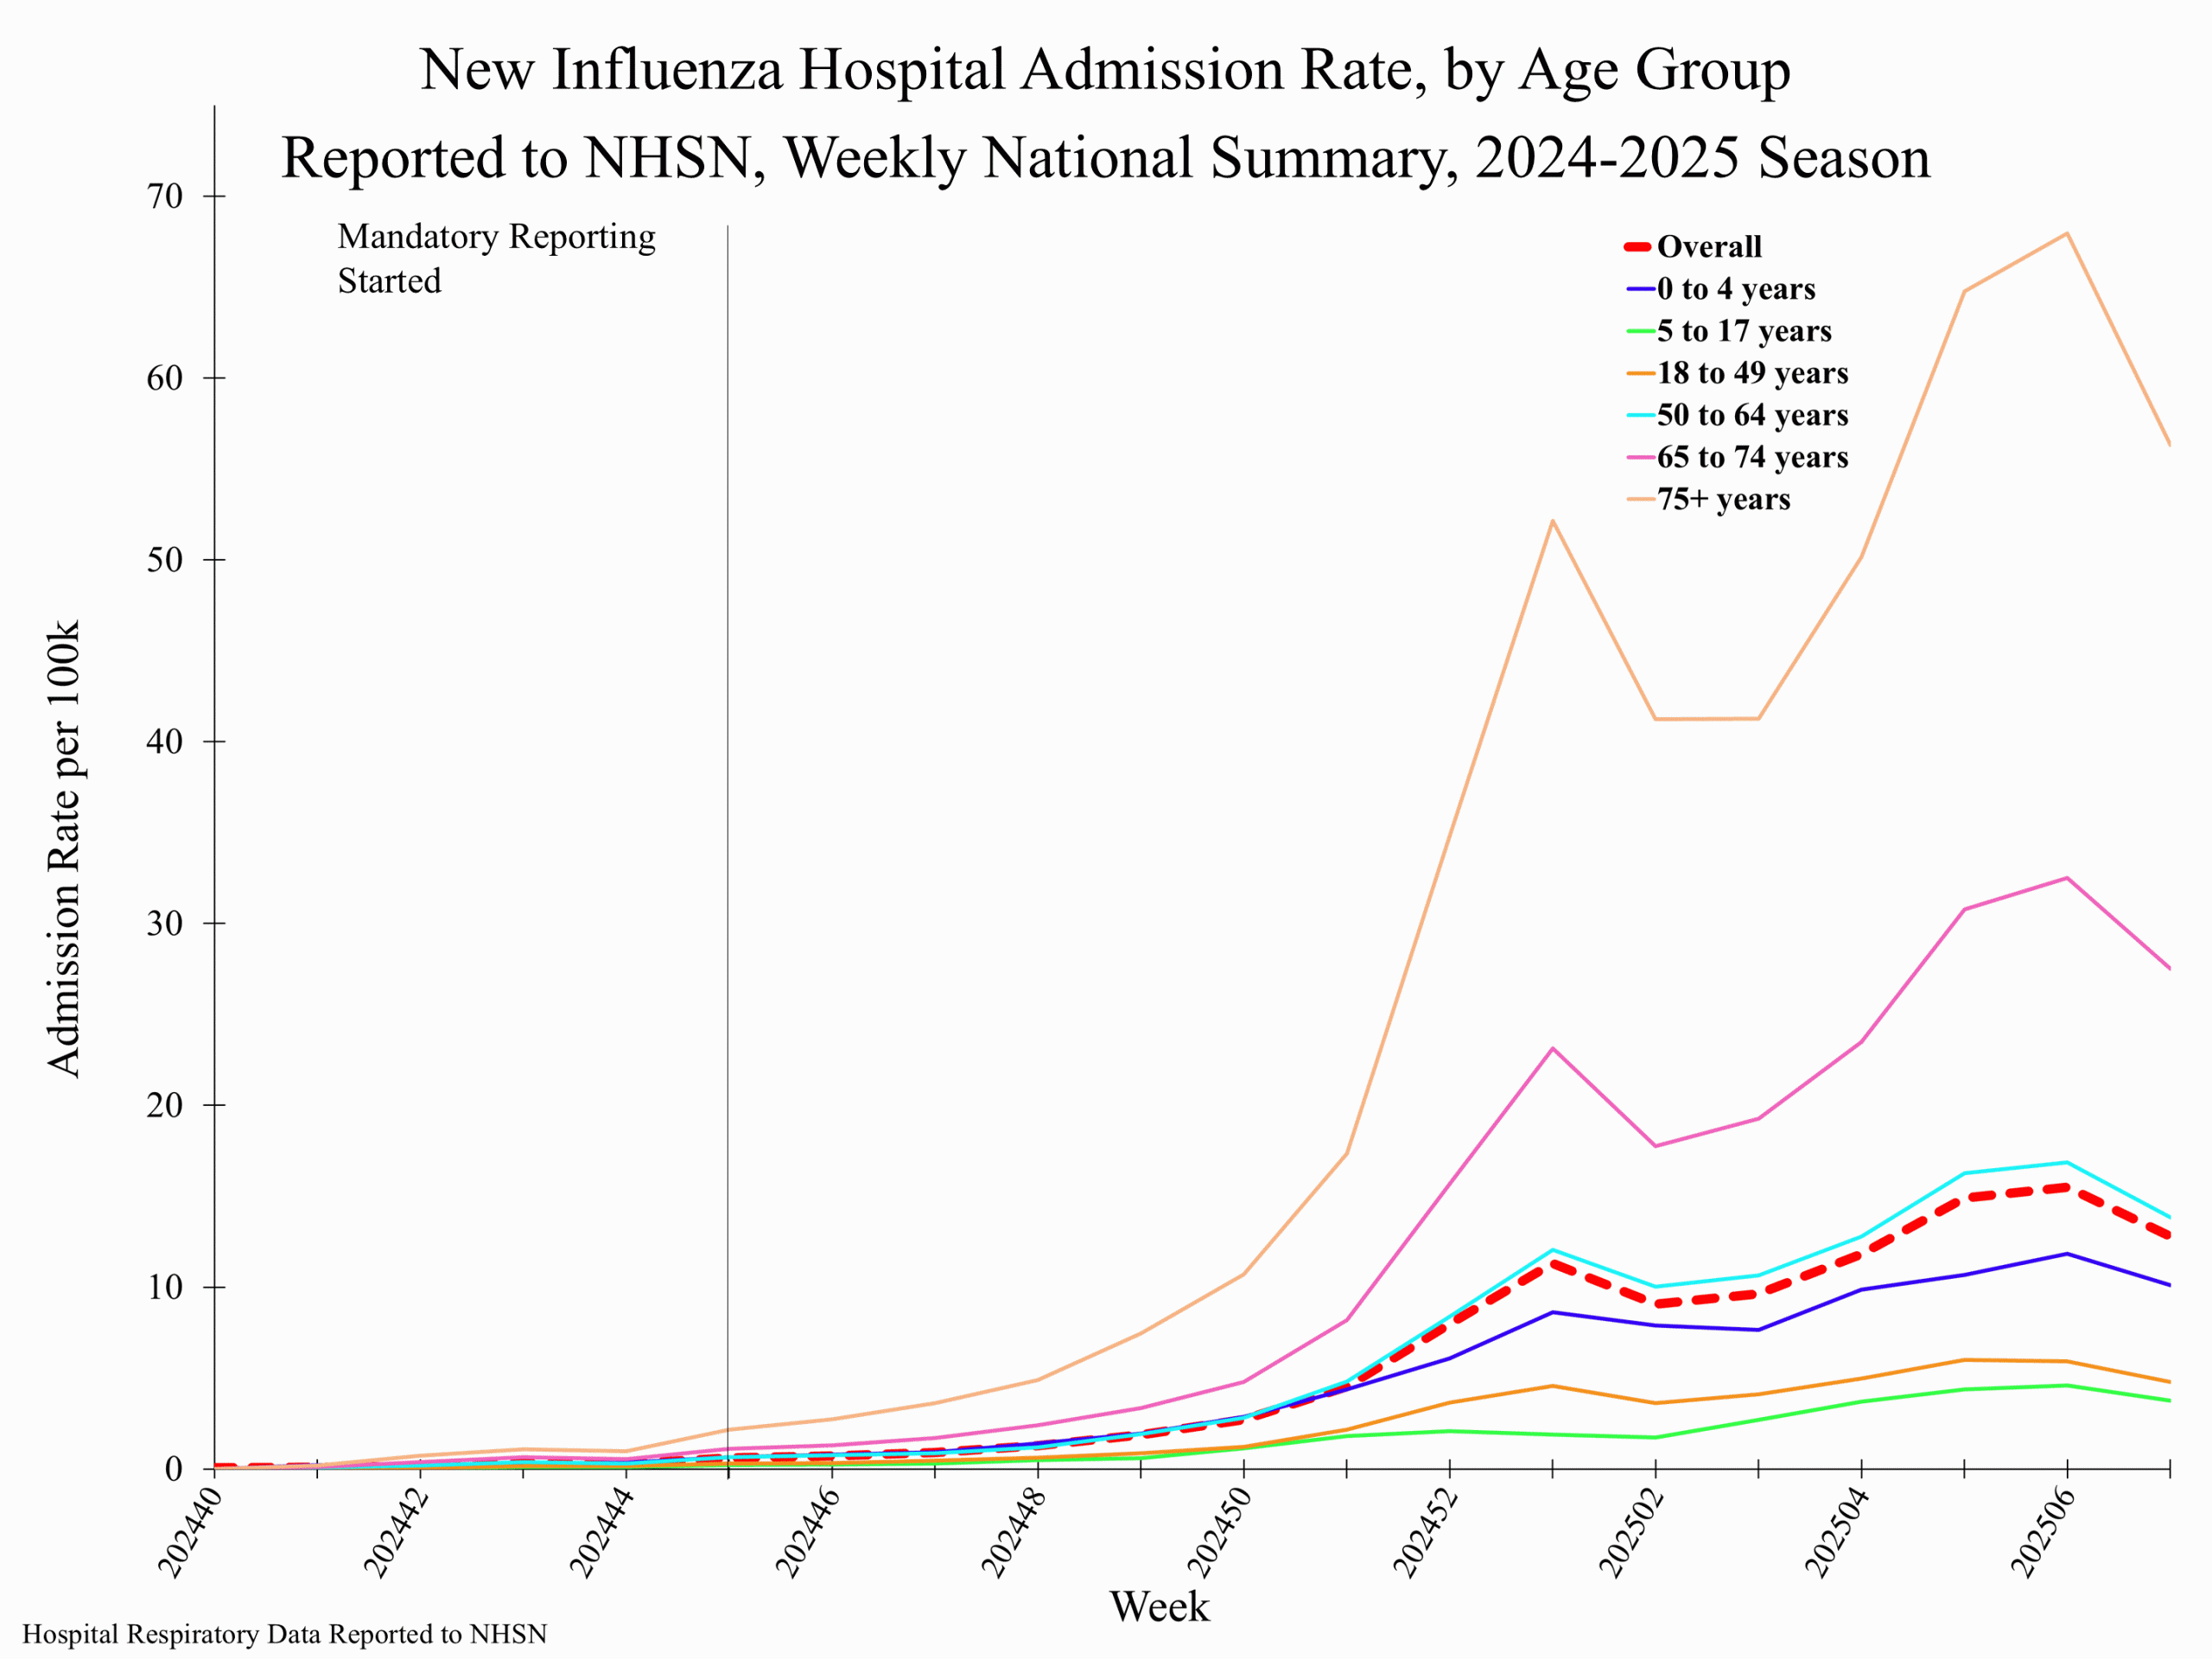 Additional NHSN Hospital Respiratory Data information
Comment