 Tweet
Tweet
Weekly U.S. Influenza Surveillance Report

Key Updates for Week 4, ending January 25, 2020
Key indicators that track flu activity remain high and, after falling during the first two weeks of the year, increased over the last two weeks. Indicators that track severity (hospitalizations and deaths) are not high at this point in the season. Viruses
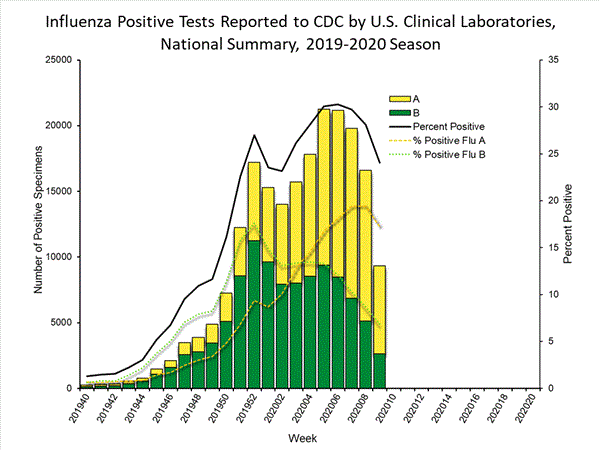
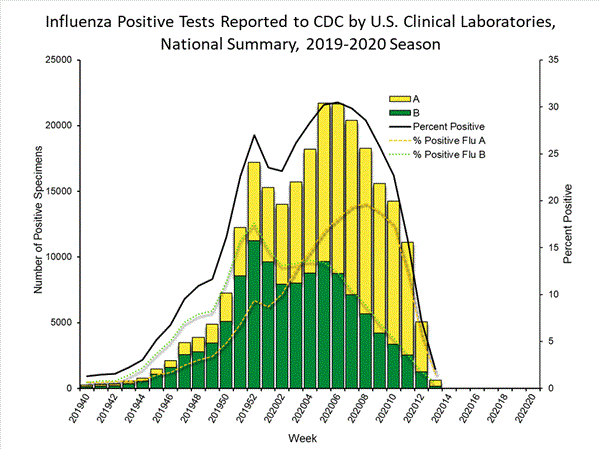
Clinical Labs
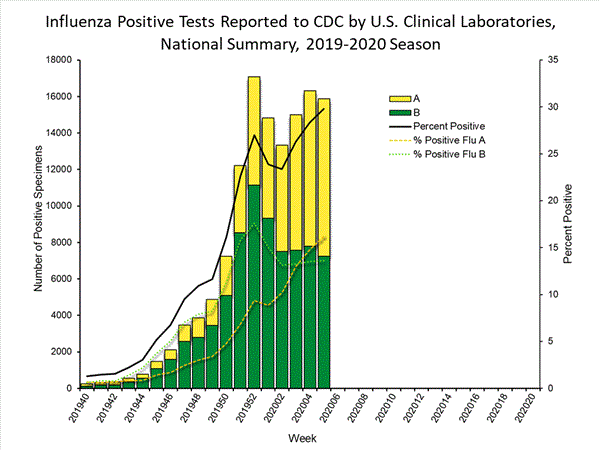
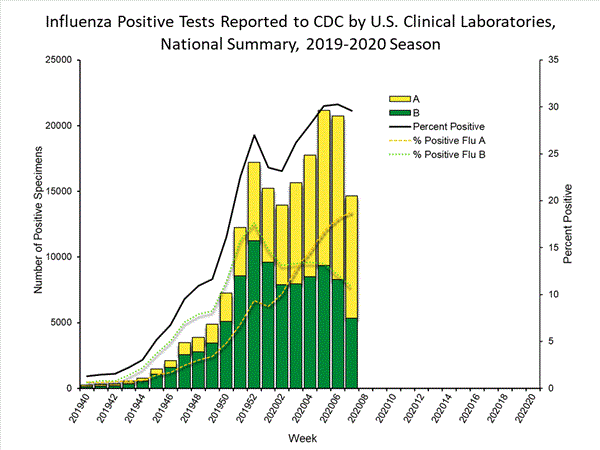
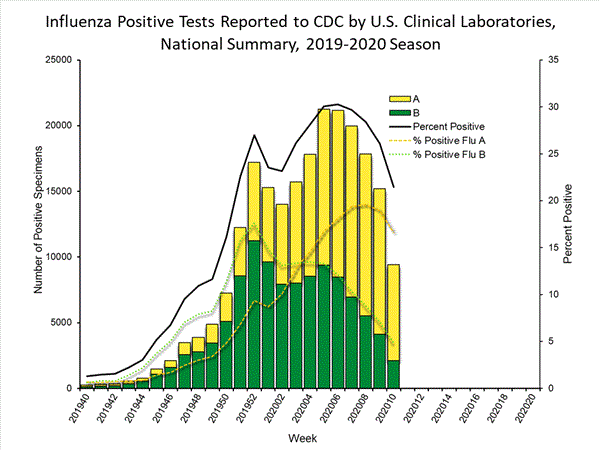
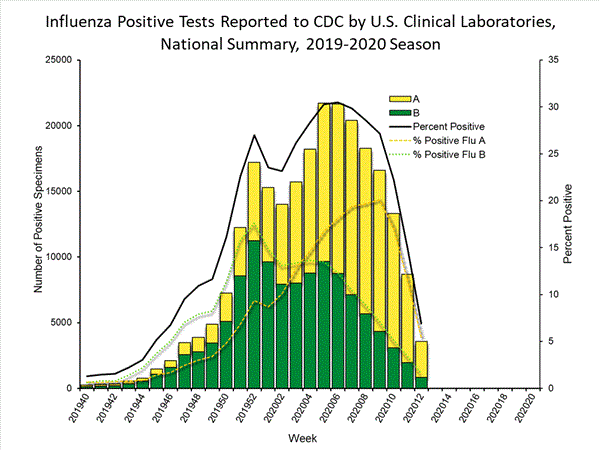
The percentage of respiratory specimens testing positive for influenza at clinical laboratories increased from 25.7% last week to 27.7% this week.
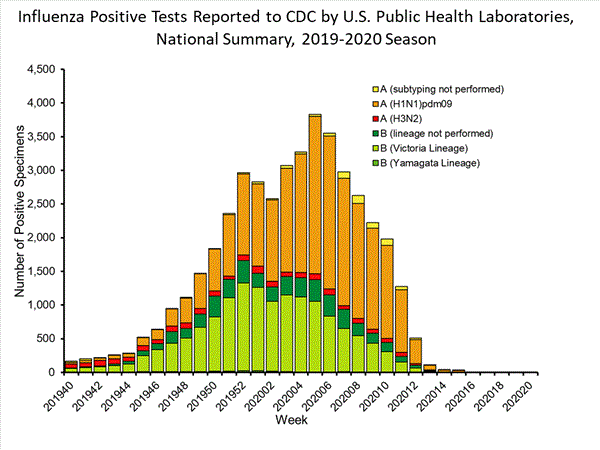
Public Health Labs
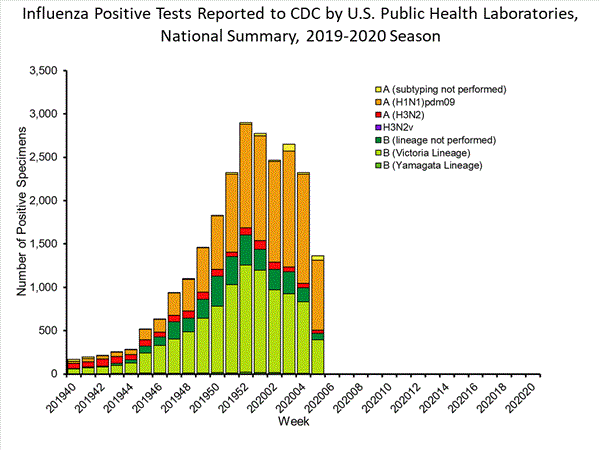
Nationally, B/Victoria viruses are the predominant virus this season; however, during recent weeks, slightly more A(H1N1)pdm09 than B/Victoria viruses have been reported.
Virus Characterization
Genetic and antigenic characterization and antiviral susceptibility of influenza viruses collected in the U.S. are summarized in this report. Illness
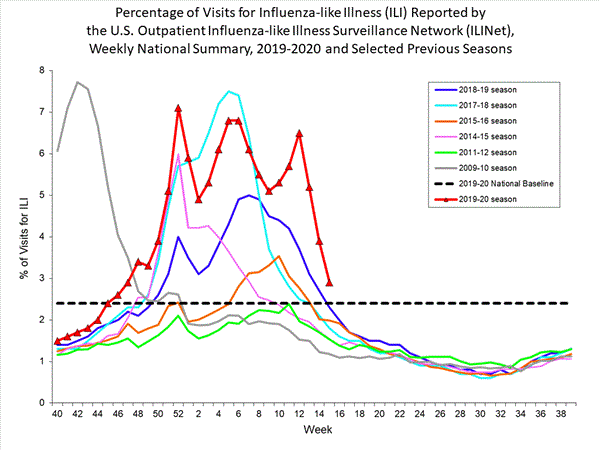
Outpatient Illness: ILINet
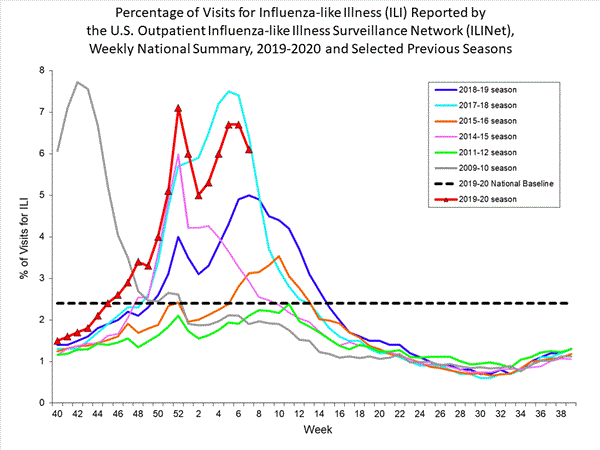
Visits to health care providers for influenza-like illness (ILI) increased from 5.1% last week to 5.7% this week. All regions remain above their baselines.
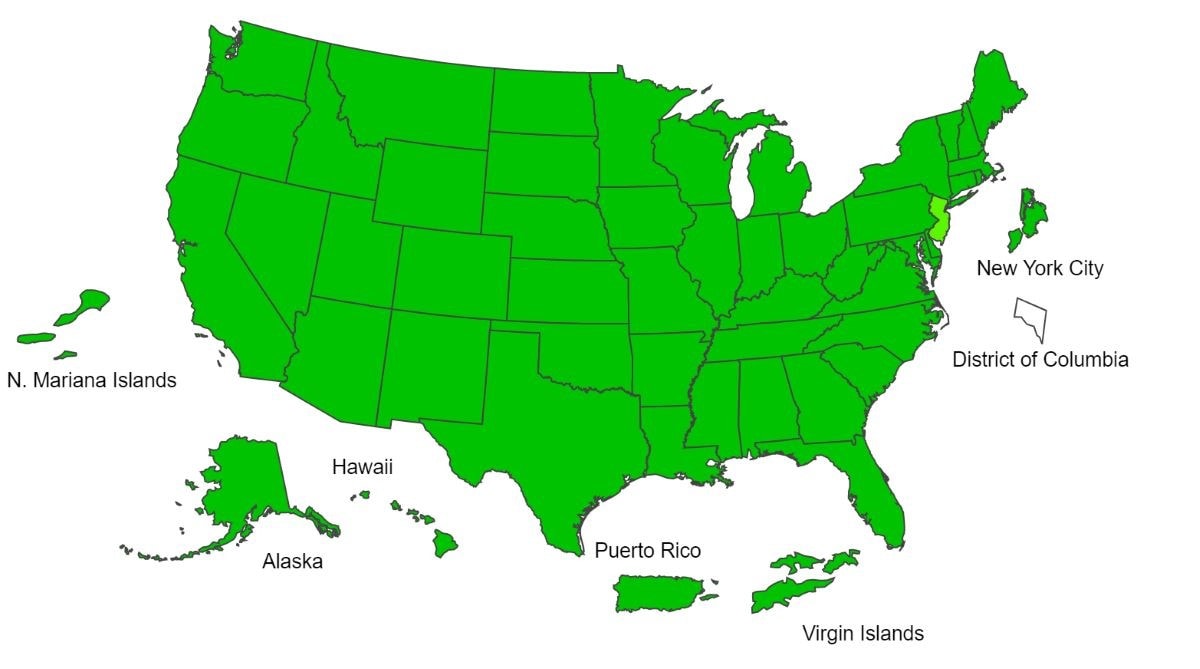
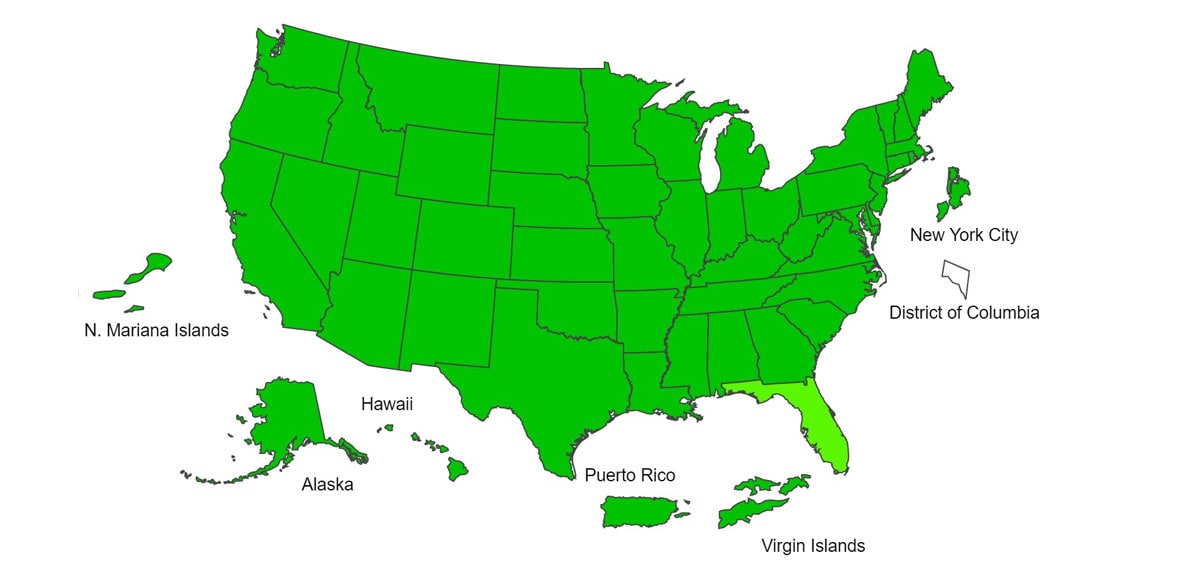
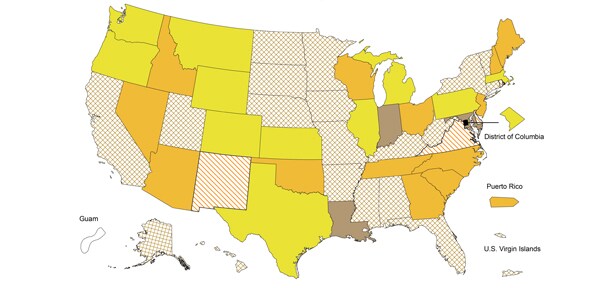
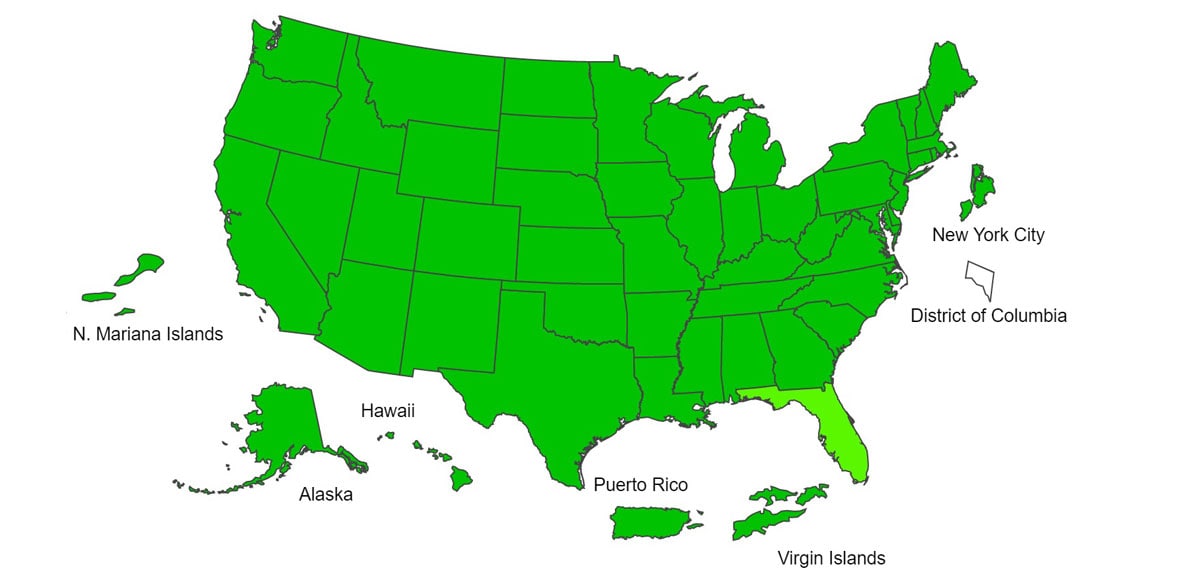
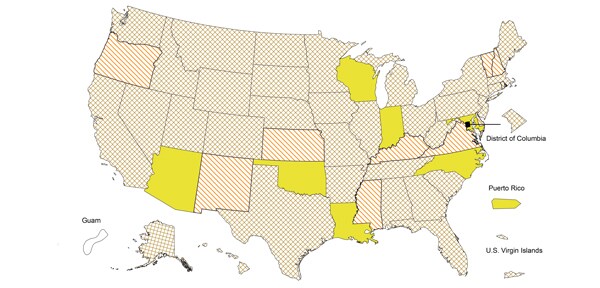
Outpatient Illness: ILI Activity Map

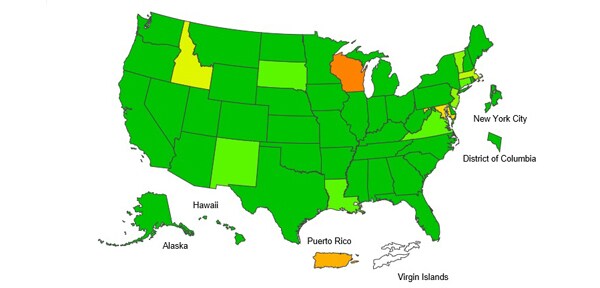
The number of jurisdictions experiencing high ILI activity increased from 37 last week to 44 this week.
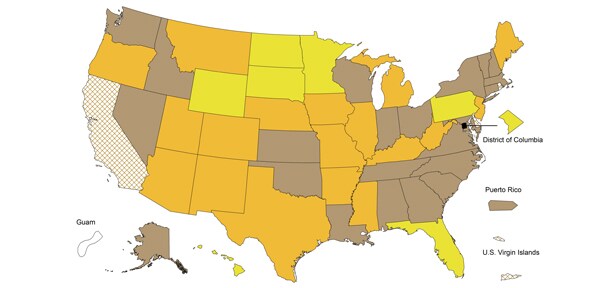
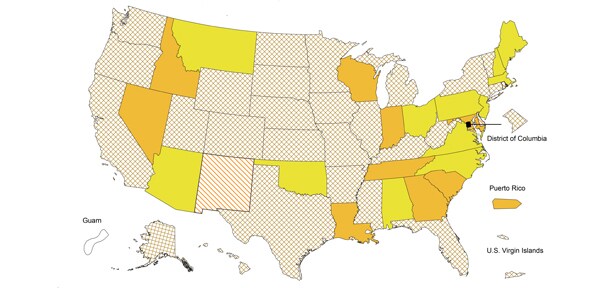
Geographic Spread

The number of jurisdictions reporting regional or widespread influenza activity increased to 51 this week. Severe Disease
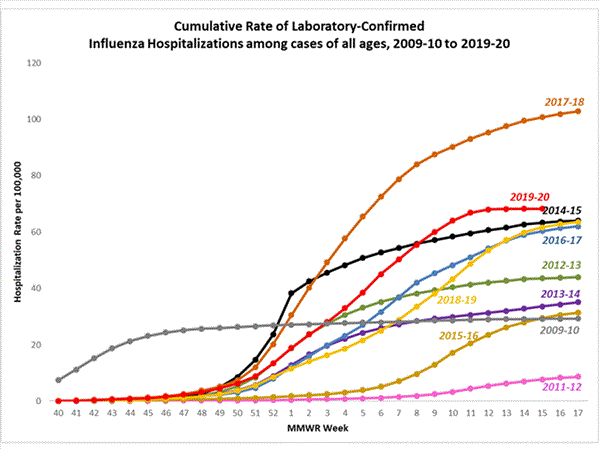
Hospitalizations
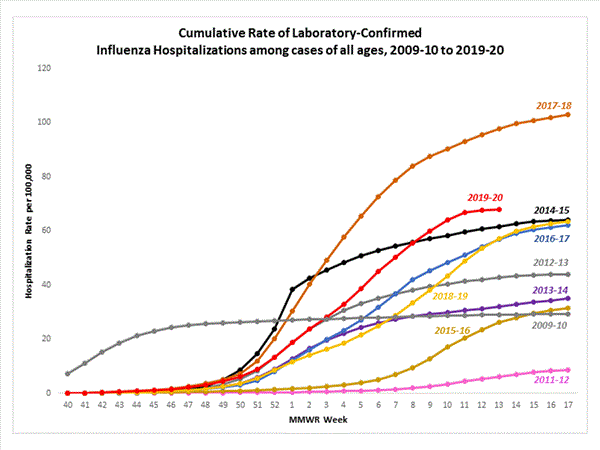
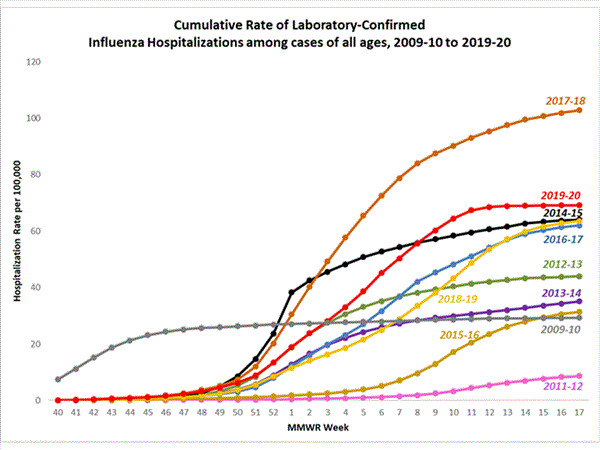
The overall hospitalization rate for the season increased to 29.7 per 100,000. This is similar to what has been seen at this time during recent seasons.
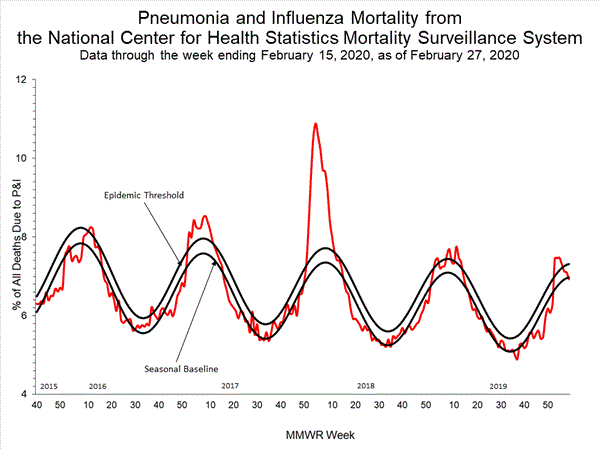
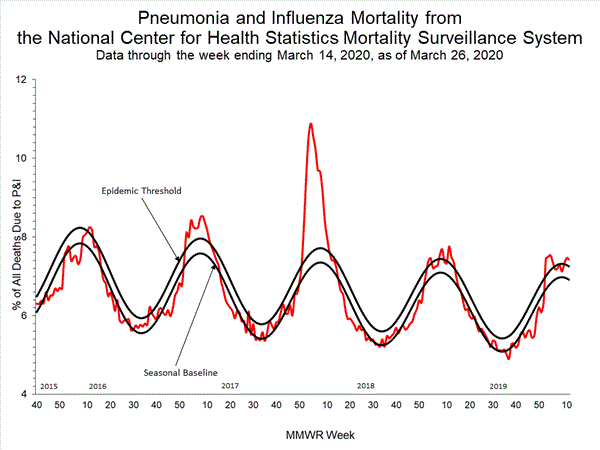
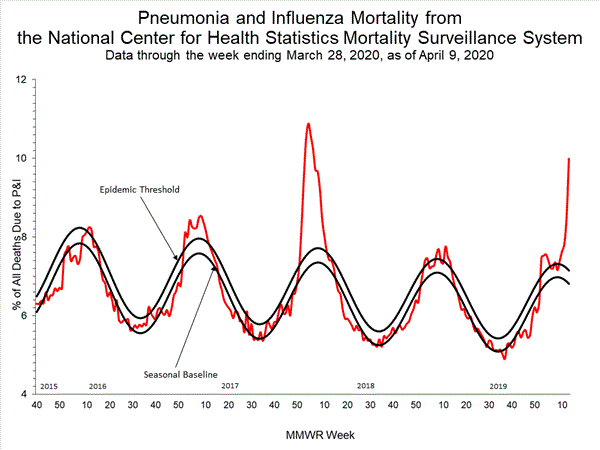
P&I Mortality
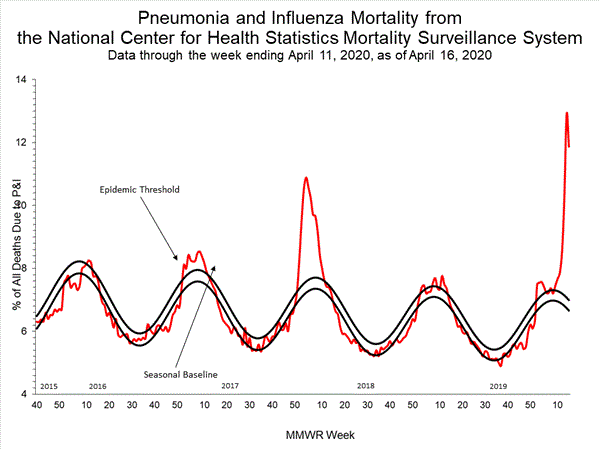
The percentage of deaths attributed to pneumonia and influenza is 6.7%, below the epidemic threshold of 7.2%.
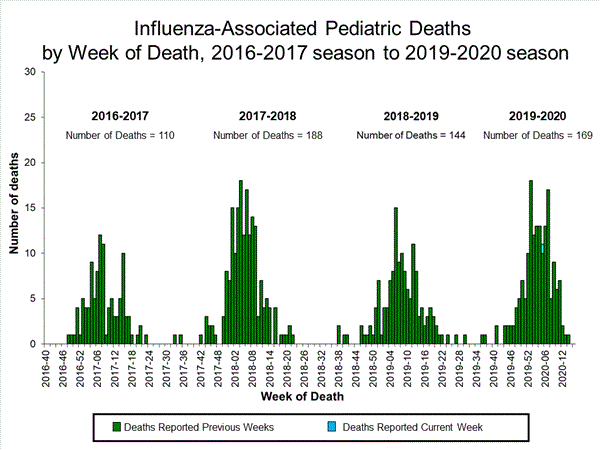
Pediatric Deaths
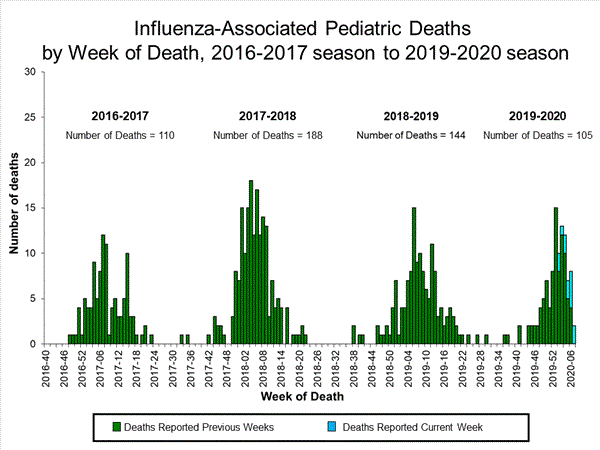
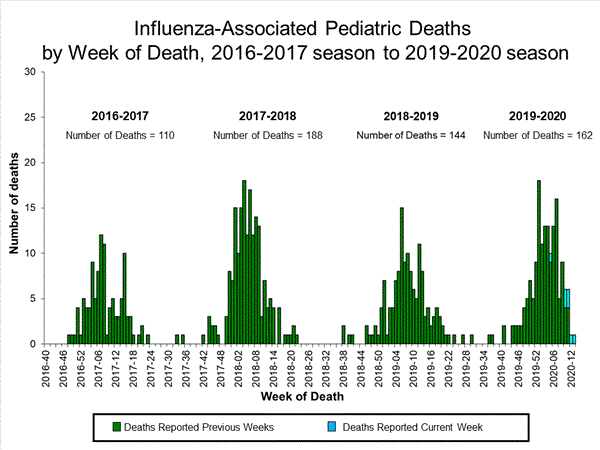
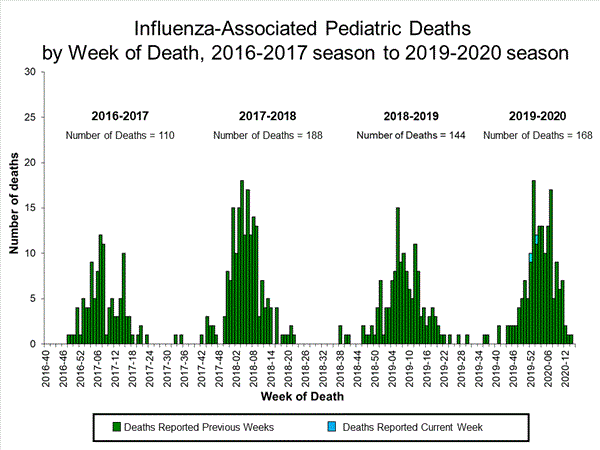
Fourteen new influenza-associated pediatric deaths occurring during the 2019-2020 season were reported this week. The total for the season is 68.
All data are preliminary and may change as more reports are received.
A description of the CDC influenza surveillance system, including methodology and detailed descriptions of each data component is available on the surveillance methods page.
Additional information on the current and previous influenza seasons for each surveillance component are available on FluView Interactive.
Key Points
U.S. Virologic Surveillance
Clinical Laboratories
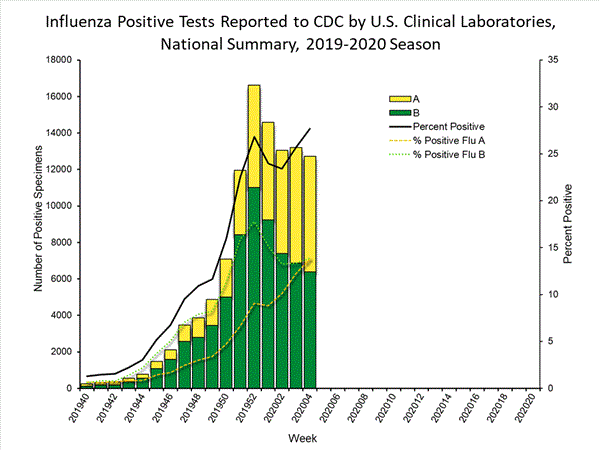
The results of tests performed by clinical laboratories nationwide are summarized below. Data from clinical laboratories (the percentage of specimens tested that are positive for influenza) are used to monitor whether influenza activity is increasing or decreasing.
View Chart Data | View Full Screen Public Health Laboratories
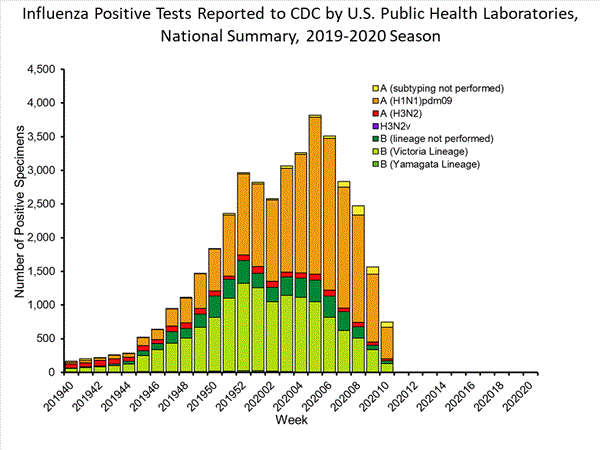
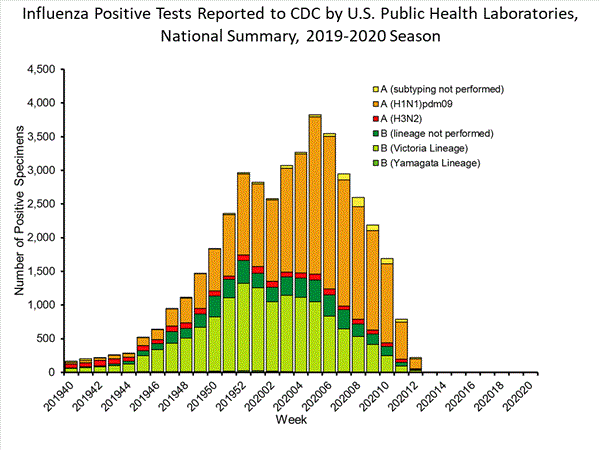
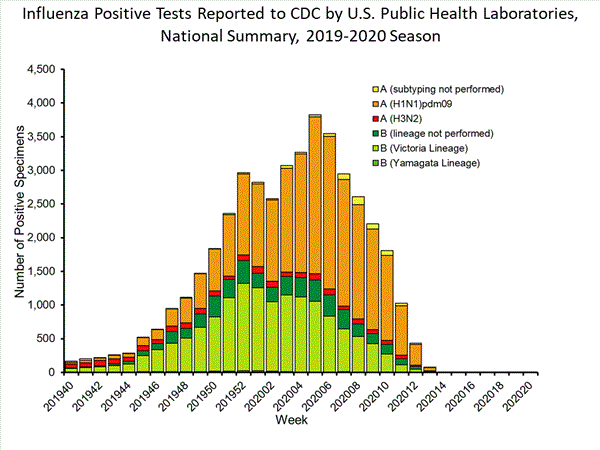
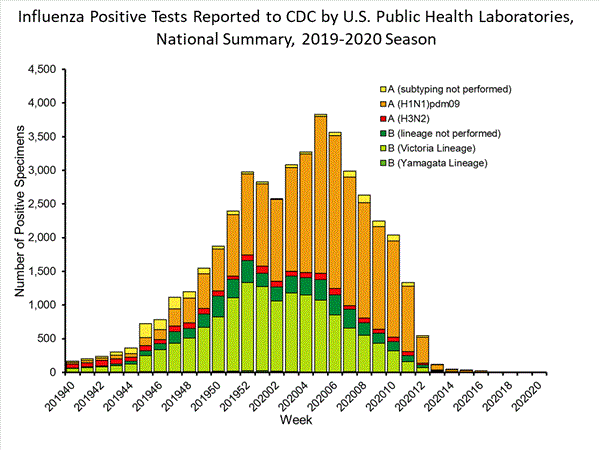
The results of tests performed by public health laboratories nationwide are summarized below. Data from public health laboratories are used to monitor the proportion of circulating viruses that belong to each influenza subtype/lineage.
Nationally influenza B/Victoria viruses have been reported more frequently than other influenza viruses this season. However, during recent weeks, influenza A(H1N1)pdm09 viruses have been reported more frequently than B/Victoria viruses. The predominant virus varies by region. Regional and state level data about circulating influenza viruses can be found on FluView Interactive.
The predominant virus also varies by age group. Nationally, influenza B viruses are the most commonly reported influenza viruses among children and young adults age 0-4 years (58% of reported viruses) and 5-24 years (72% of reported viruses), while A(H1N1)pdm09 viruses are the most commonly reported influenza viruses among persons 25-64 years (50% of reported viruses) and 65 years of age and older (57% of reported viruses). For this season, 53% of influenza positive specimens reported by public health laboratories were among persons less than 25 years of age and only 12% were from persons age 65 and older.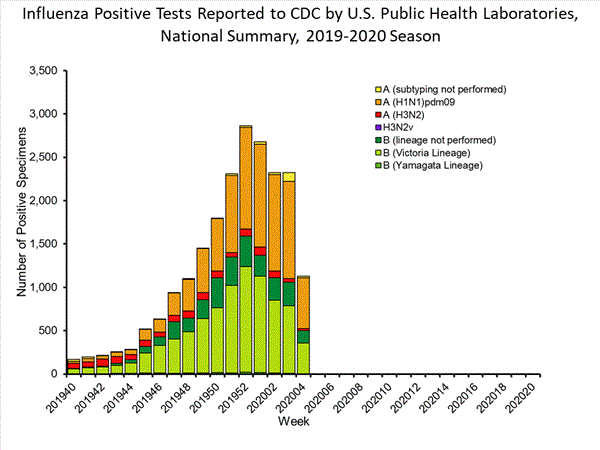
View Chart Data | View Full Screen
Additional virologic surveillance information for current and past seasons:
Surveillance Methods | FluView Interactive: National, Regional, and State Data or Age Data
Influenza Virus Characterization
CDC performs genetic and antigenic characterization of U.S. viruses submitted from state and local health laboratories using Right Size Roadmap submission guidance. These data are used to compare how similar the currently circulating influenza viruses are to the reference viruses used for developing new influenza vaccines and to monitor evolutionary changes that continually occur in circulating influenza. Antigenic characterization data are based on an animal model (influenza-naive ferrets), and do not reflect pre-existing protection provided by past influenza infections and vaccinations. Additional antigenic characterization studies involving people vaccinated with current influenza vaccines are conducted later in the season; these data account for pre-existing protection in different populations against circulating influenza viruses. Genetic and antigenic characterization data are not used to make calculations about vaccine effectiveness (VE). CDC conducts VE studies each year to measure the benefits of flu vaccines in people.
CDC genetically characterized 1,128 influenza viruses collected in the U.S. from September 29, 2019, to January 25, 2020.
CDC antigenically characterizes a subset of influenza viruses by hemagglutination inhibition (HI) or neutralization based Focus Reduction assays (FRA). Antigenic drift is evaluated by comparing antigenic properties of cell-propagated reference viruses representing currently recommended vaccine components with those of cell-propagated circulating viruses. CDC antigenically characterized 225 influenza viruses collected in the United States from September 29, 2019, to January 25, 2020. These data are not used to make calculations about vaccine effectiveness (VE). CDC conducts VE studies each year to measure the benefits of flu vaccines in people.
Influenza A Viruses
Influenza B Viruses
CDC assesses susceptibility of influenza viruses to the antiviral medications including the neuraminidase inhibitors (oseltamivir, zanamivir, and peramivir) and the PA endonuclease inhibitor baloxavir using next generation sequence analysis supplemented by laboratory assays. Viruses collected in the United States since September 29, 2019, were tested for antiviral susceptibility as follows:
Outpatient Illness Surveillance
ILINet
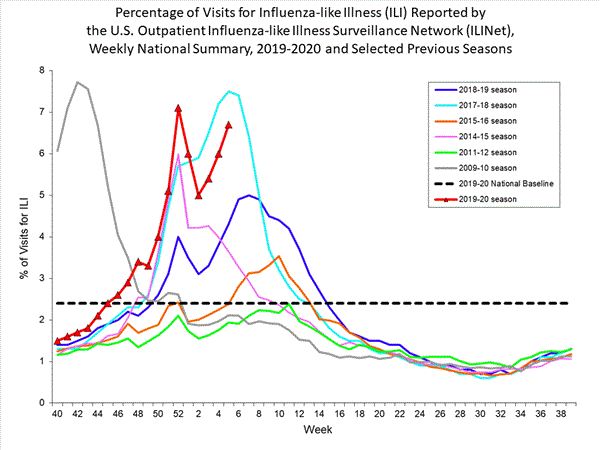
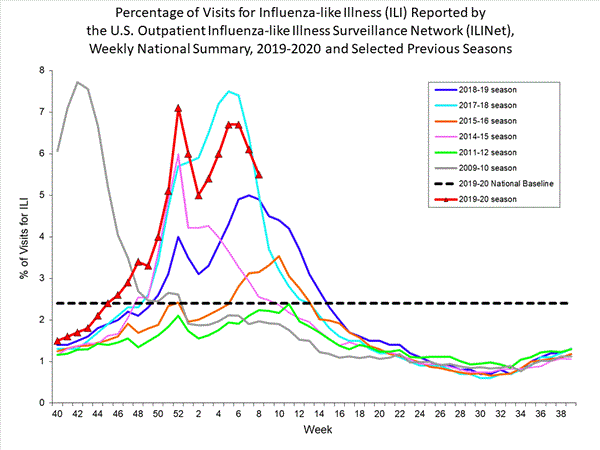
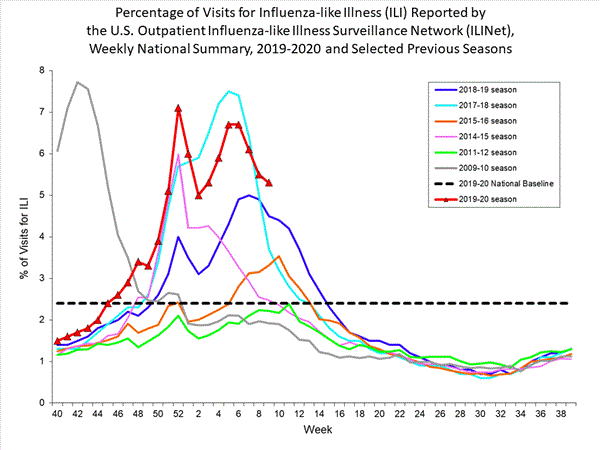
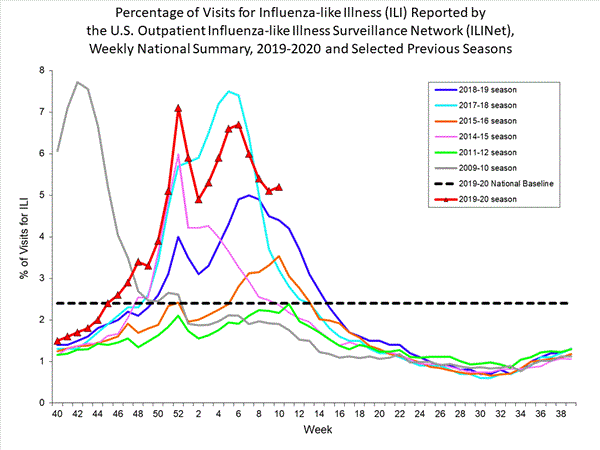
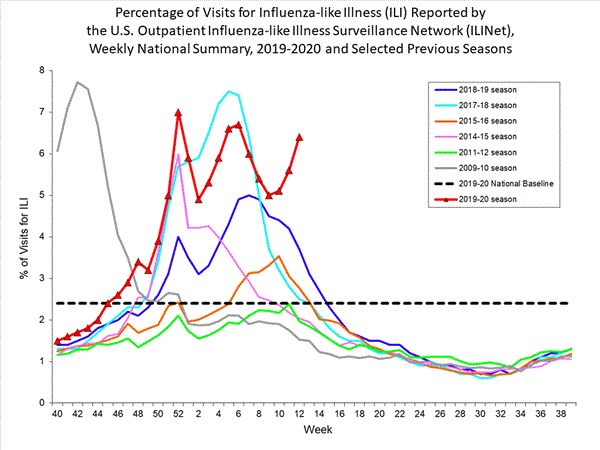
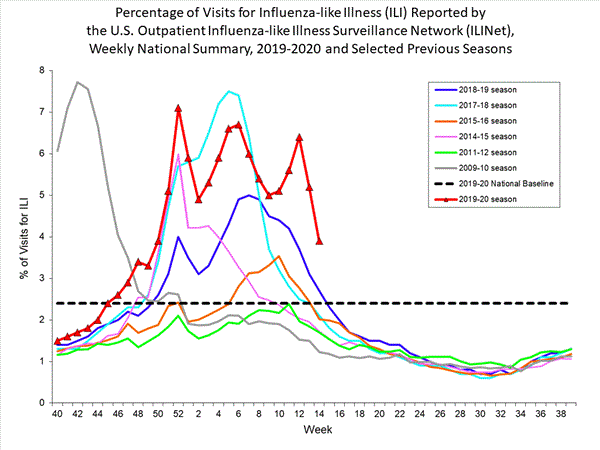
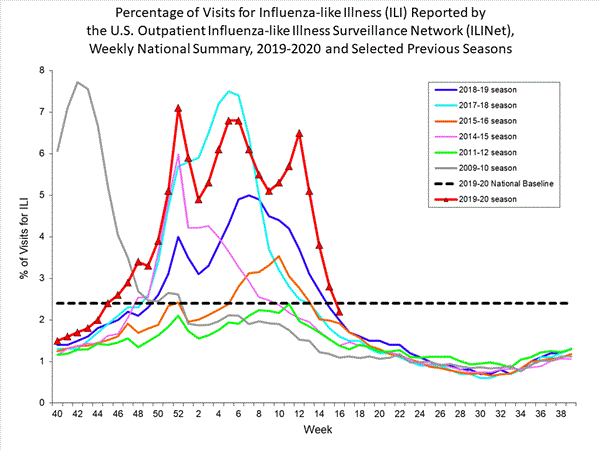
Nationwide during week 4, 5.7% of patient visits reported through the U.S. Outpatient Influenza-like Illness Surveillance Network (ILINet) were due to influenza-like illness (ILI). This percentage is above the national baseline of 2.4%.
View Chart Data (current season only) | View Full Screen
On a regional level, the percentage of outpatient visits for ILI ranged from 4.1% to 7.7% during week 4. All regions reported a percentage of outpatient visits for ILI which is above their region-specific baselines. ILI Activity Map
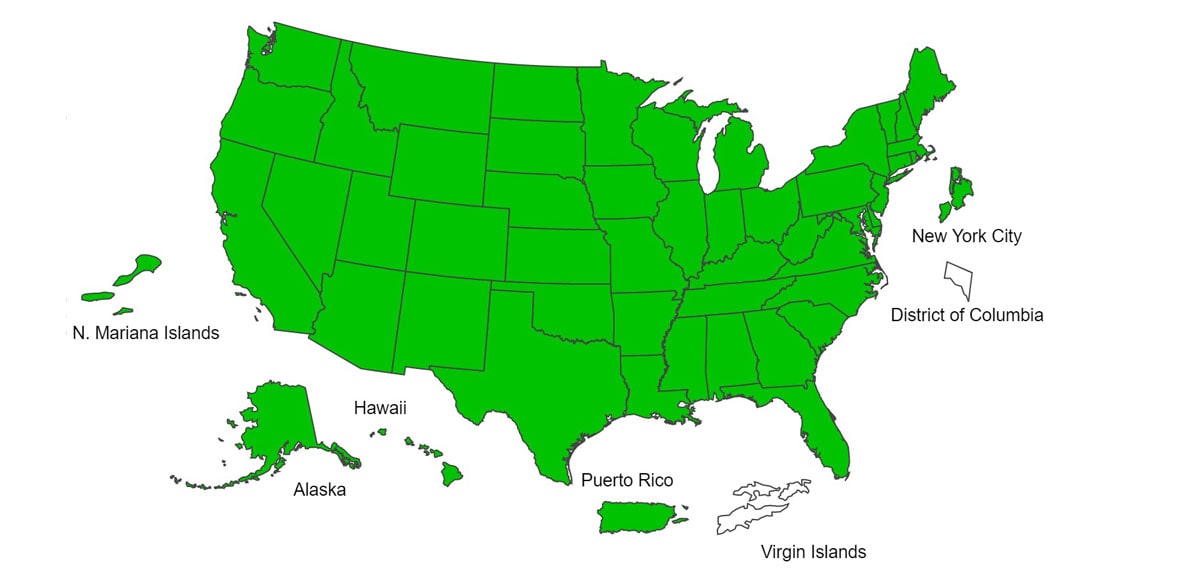
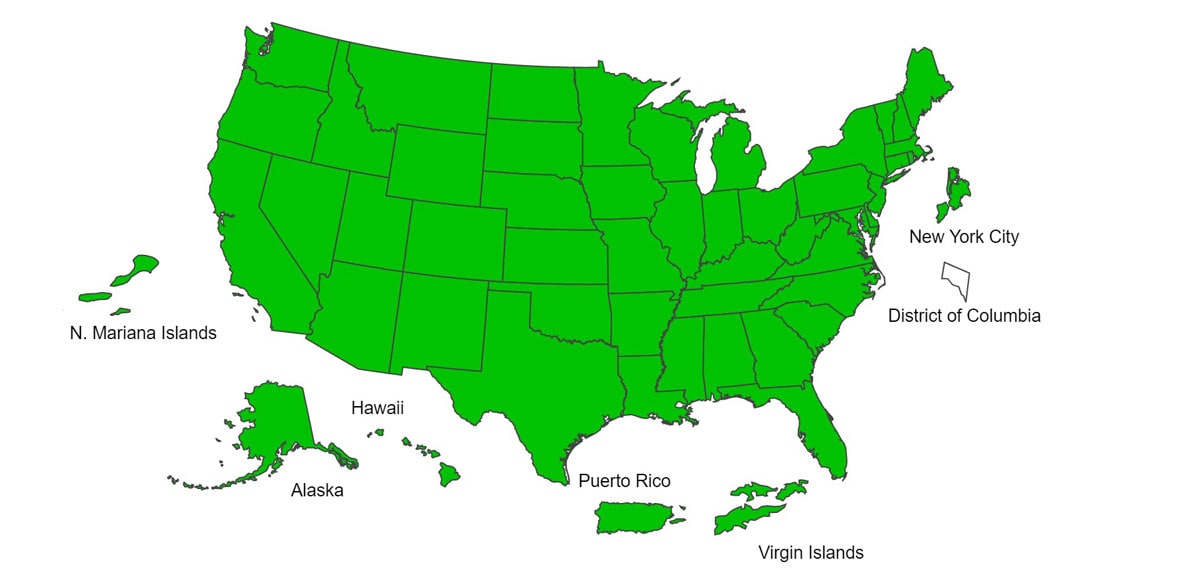
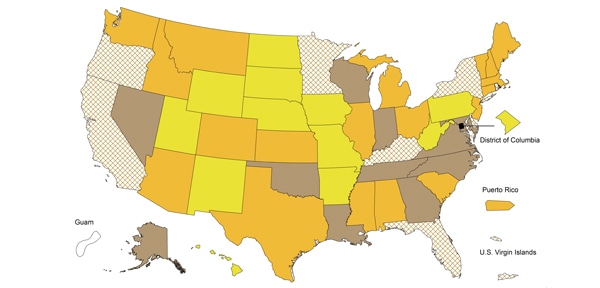
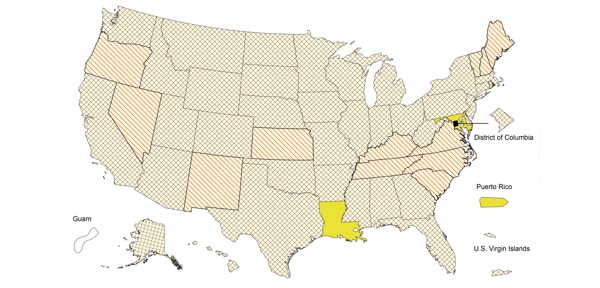
Data collected in ILINet are used to produce a measure of ILI activity* by state.
During week 4, the following ILI activity levels were experienced:
*Data collected in ILINet may disproportionally represent certain populations within a state, and therefore, may not accurately depict the full picture of influenza activity for the whole state. Differences in the data presented here by CDC and independently by some state health departments likely represent differing levels of data completeness with data presented by the state likely being the more complete.
Additional information about medically attended visits for ILI for current and past seasons:
Surveillance Methods | FluView Interactive: National, Regional, and State Data or ILI Activity Map
Geographic Spread of Influenza as Assessed by State and Territorial Epidemiologists
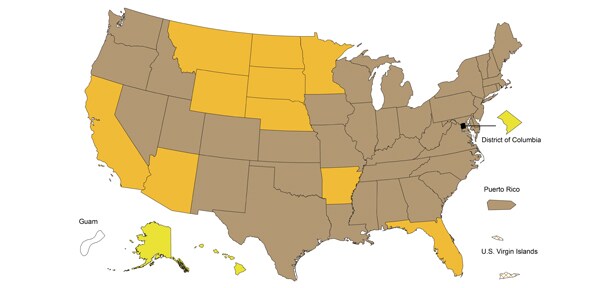
The influenza activity reported by state and territorial epidemiologists indicates geographic spread of influenza viruses but does not measure the severity of influenza activity.
During week 4 the following influenza activity was reported:
Additional geographic spread surveillance information for current and past seasons:
Surveillance Methods | FluView Interactive
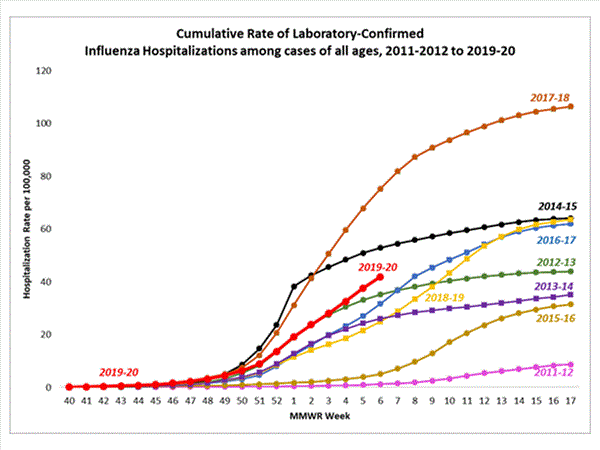
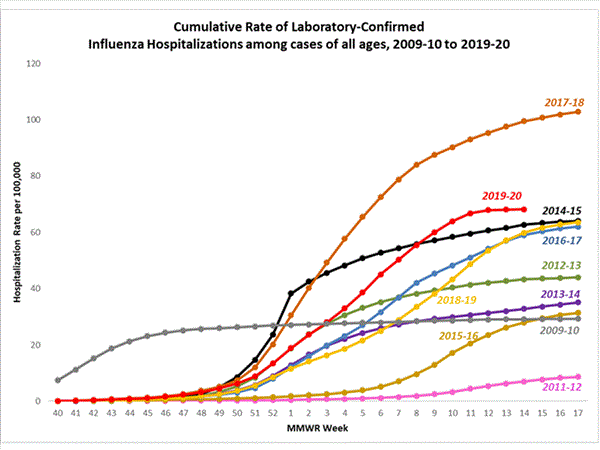
Influenza-Associated Hospitalizations
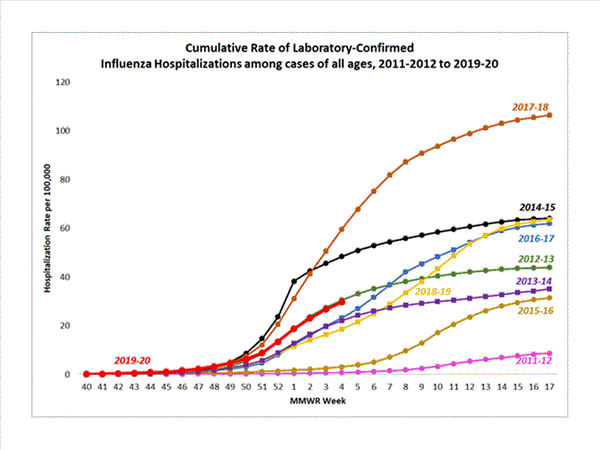
The Influenza Hospitalization Surveillance Network (FluSurv-NET) conducts population-based surveillance for laboratory-confirmed influenza-related hospitalizations in select counties in the Emerging Infections Program (EIP) states and Influenza Hospitalization Surveillance Project (IHSP) states.
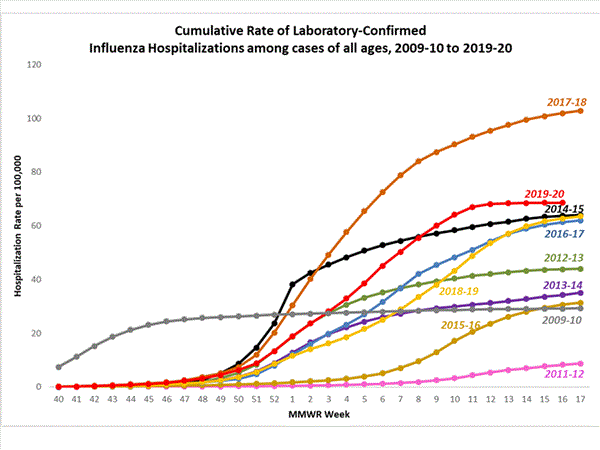
A total of 8,633 laboratory-confirmed influenza-associated hospitalizations were reported by FluSurv-NET sites between October 1, 2019 and January 25, 2020; 5,173 (59.9%) were associated with influenza A virus, 3,401 (39.4%) with influenza B virus, 27 (0.3%) with influenza A virus and influenza B virus co-infection, and 32 (0.4%) with influenza virus for which the type was not determined. Among those with influenza A subtype information, 1,080 (91.1%) were A(H1N1)pdm09 virus and 106 (8.9%) were A(H3N2).
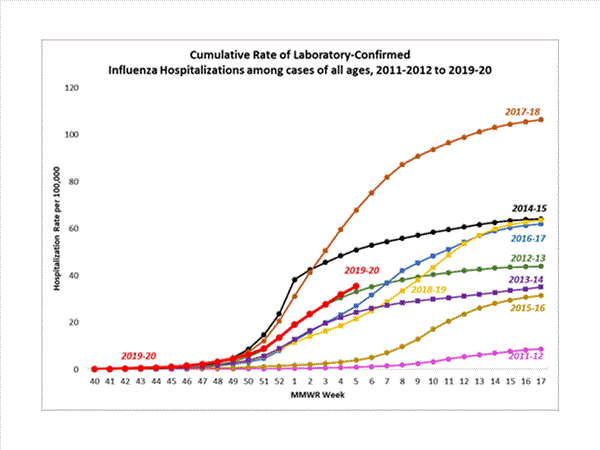
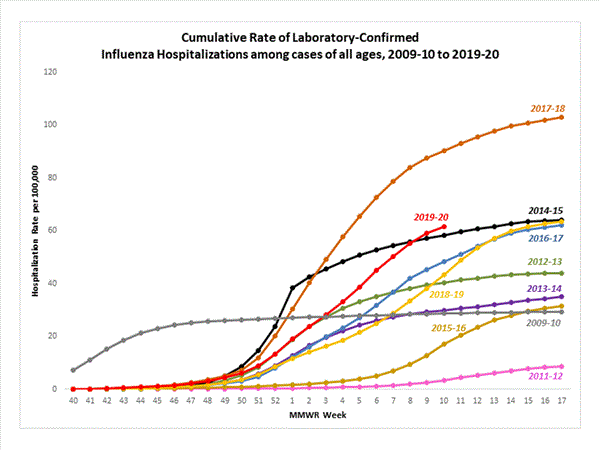
The overall cumulative hospitalization rate was 29.7 per 100,000 population which is similar to what has been seen during recent previous influenza seasons at this time of year. Rates in children and young adults are higher than at this time in recent seasons.
 View Full Screen
The highest rate of hospitalization is among adults aged ≥65, followed by children aged 0-4 years and adults aged 50-64 years.
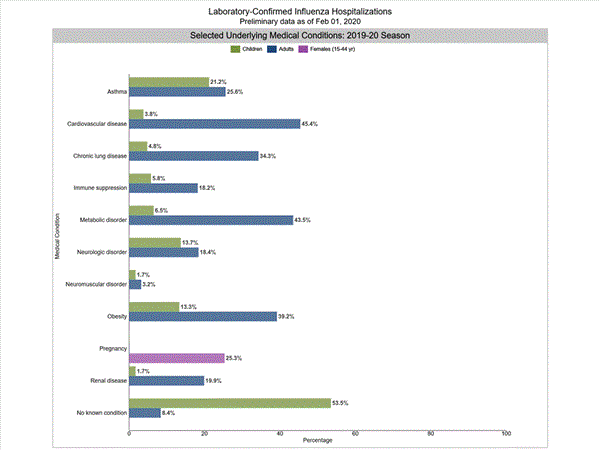
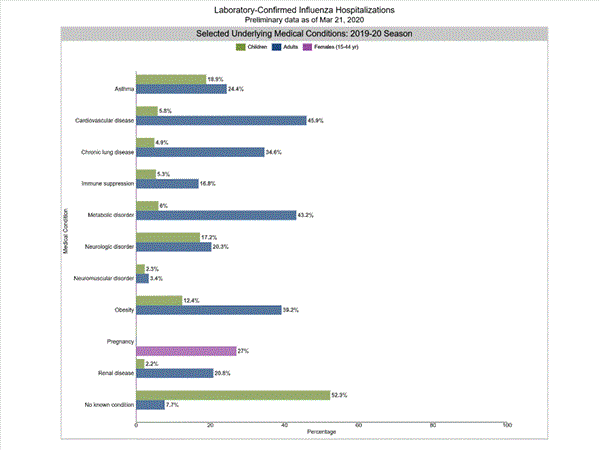
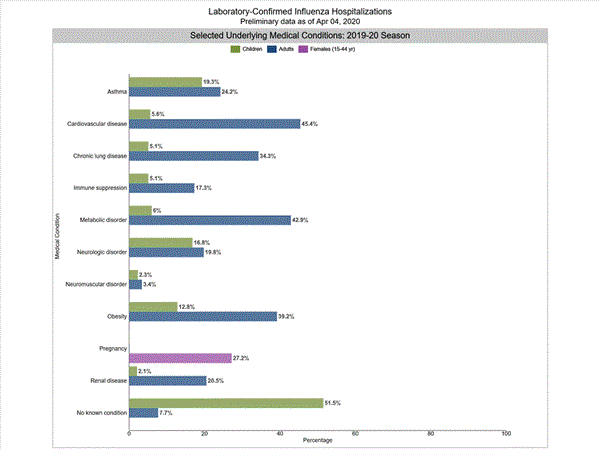
Among 1,108 hospitalized adults with information on underlying medical conditions, 91.5% had at least one reported underlying medical condition, the most commonly reported were cardiovascular disease, metabolic disorder, obesity, and chronic lung disease. Among 271 hospitalized children with information on underlying medical conditions, 46.5% had at least one underlying medical condition; the most commonly reported was asthma. Among 216 hospitalized women of childbearing age (15-44 years) with information on pregnancy status, 26.4% were pregnant.
 View Full Screen
Additional hospitalization surveillance information for current and past seasons and additional age groups:
Surveillance Methods | FluView Interactive
Pneumonia and Influenza (P&I) Mortality Surveillance
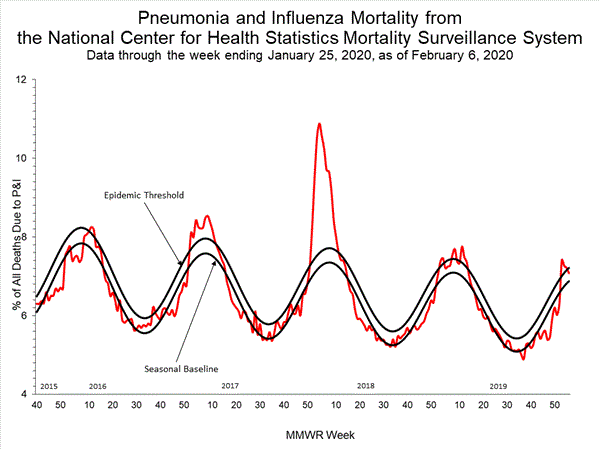
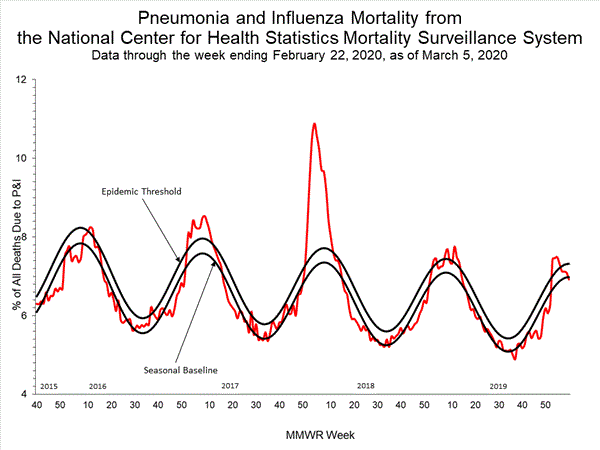
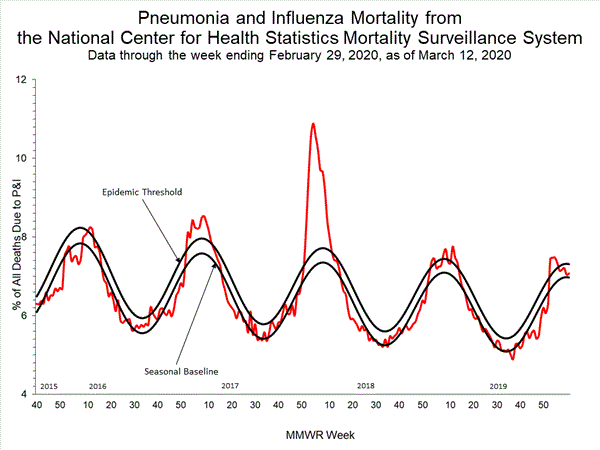
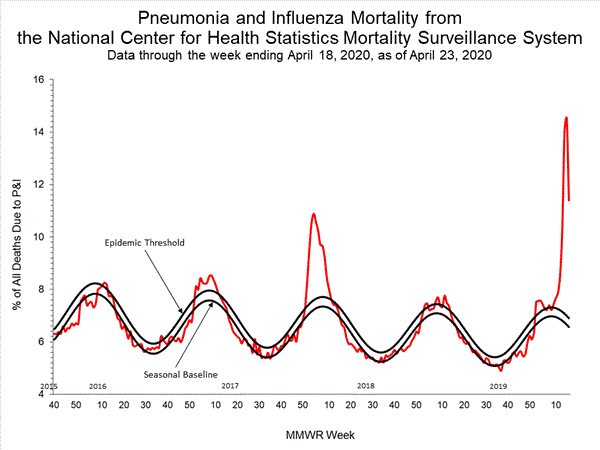
Based on National Center for Health Statistics (NCHS) mortality surveillance data available on January 30, 2020, 6.7% of the deaths occurring during the week ending January 18, 2020 (week 3) were due to P&I. This percentage is below the epidemic threshold of 7.2% for week 3.
View Chart Data | View Full Screen
Additional pneumonia and influenza mortality surveillance information for current and past seasons:
Surveillance Methods | FluView Interactive
Influenza-Associated Pediatric Mortality
Fourteen influenza-associated pediatric deaths occurring during the 2019-2020 season between weeks 45 and 4 (the weeks ending November 9, 2019 and January 25, 2020) were reported to CDC during week 4. Eight were associated with influenza B viruses; one had a lineage determined and was a B/Victoria virus. Six were associated with influenza A viruses, and three were subtyped; all were A(H1N1)pdm09 viruses.
Of the 68 influenza-associated pediatric deaths occurring during the 2019-2020 season and reported to CDC: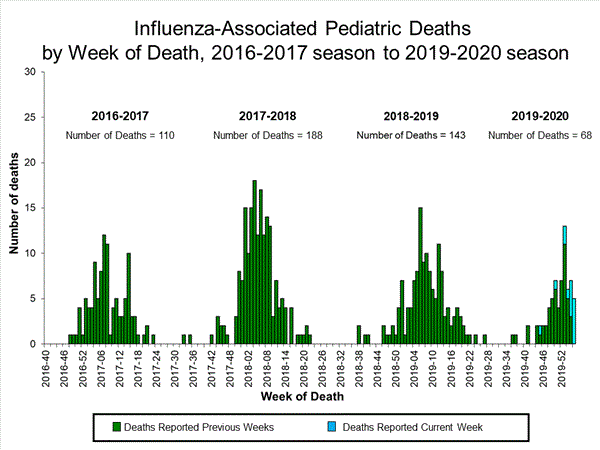
View Full Screen
Additional pediatric mortality surveillance information for current and past seasons:
Surveillance Methods | FluView Interactive
Additional National and International Influenza Surveillance Information
FluView Interactive: FluView includes enhanced web-based interactive applications that can provide dynamic visuals of the influenza data collected and analyzed by CDC. These FluView Interactive applications allow people to create customized, visual interpretations of influenza data, as well as make comparisons across flu seasons, regions, age groups and a variety of other demographics. To access these tools, visit http://www.cdc.gov/flu/weekly/fluviewinteractive.htm
National Institute for Occupational Safety and Health: Monthly surveillance data on the prevalence of health-related workplace absenteeism among full-time workers in the United States are available from NIOSH at https://www.cdc.gov/niosh/topics/absences/default.html
U.S. State and local influenza surveillance:Select a jurisdiction below to access the latest local influenza information
World Health Organization: Additional influenza surveillance information from participating WHO member nations is available through FluNet and the Global Epidemiology Reports.
WHO Collaborating Centers for Influenza located in Australia, China, Japan, the United Kingdom, and the United States (CDC in Atlanta, Georgia).
Europe: For the most recent influenza surveillance information from Europe, please see WHO/Europe and the European Centre for Disease Prevention and Control at http://www.flunewseurope.org/.
Public Health Agency of Canada: The most up-to-date influenza information from Canada is available at http://www.phac-aspc.gc.ca/fluwatch/
Public Health England: The most up-to-date influenza information from the United Kingdom is available at https://www.gov.uk/government/statistics/weekly-national-flu-reports
Any links provided to non-Federal organizations are provided solely as a service to our users. These links do not constitute an endorsement of these organizations or their programs by CDC or the Federal Government, and none should be inferred. CDC is not responsible for the content of the individual organization web pages found at these links.
An overview of the CDC influenza surveillance system, including methodology and detailed descriptions of each data component, is available at: http://www.cdc.gov/flu/weekly/overview.htm.
--------------------------------------------------------------------------------
Page last reviewed: January 31, 2020, 11:00 AM
Content source: Centers for Disease Control and Prevention, National Center for Immunization and Respiratory Diseases (NCIRD)Seasonal Influenza (Flu)
email_03Get Email Updates
To receive weekly email updates about Seasonal Flu, enter your email address: Email Address
What's this?
Submit

Influenza Types
Key Updates for Week 4, ending January 25, 2020
Key indicators that track flu activity remain high and, after falling during the first two weeks of the year, increased over the last two weeks. Indicators that track severity (hospitalizations and deaths) are not high at this point in the season. Viruses
Clinical Labs
The percentage of respiratory specimens testing positive for influenza at clinical laboratories increased from 25.7% last week to 27.7% this week.
Public Health Labs
Nationally, B/Victoria viruses are the predominant virus this season; however, during recent weeks, slightly more A(H1N1)pdm09 than B/Victoria viruses have been reported.
Virus Characterization
Genetic and antigenic characterization and antiviral susceptibility of influenza viruses collected in the U.S. are summarized in this report. Illness
Outpatient Illness: ILINet
Visits to health care providers for influenza-like illness (ILI) increased from 5.1% last week to 5.7% this week. All regions remain above their baselines.
Outpatient Illness: ILI Activity Map
The number of jurisdictions experiencing high ILI activity increased from 37 last week to 44 this week.
Geographic Spread
The number of jurisdictions reporting regional or widespread influenza activity increased to 51 this week. Severe Disease
Hospitalizations
The overall hospitalization rate for the season increased to 29.7 per 100,000. This is similar to what has been seen at this time during recent seasons.
P&I Mortality
The percentage of deaths attributed to pneumonia and influenza is 6.7%, below the epidemic threshold of 7.2%.
Pediatric Deaths
Fourteen new influenza-associated pediatric deaths occurring during the 2019-2020 season were reported this week. The total for the season is 68.
All data are preliminary and may change as more reports are received.
A description of the CDC influenza surveillance system, including methodology and detailed descriptions of each data component is available on the surveillance methods page.
Additional information on the current and previous influenza seasons for each surveillance component are available on FluView Interactive.
Key Points
- Outpatient ILI and laboratory data remain elevated and increased again this week. Nationally and in some regions the proportion of influenza A(H1N1)pdm09 viruses compared to influenza B viruses is increasing.
- Overall, hospitalization rates remain similar to what has been seen at this time during recent seasons, but rates among children and young adults are higher at this time than in recent seasons.
- Pneumonia and influenza mortality has been low, but 68 influenza-associated deaths in children have been reported so far this season.
- CDC estimates that so far this season there have been at least 19 million flu illnesses, 180,000 hospitalizations and 10,000 deaths from flu.
- Flu vaccine effectiveness estimates are not available yet this season, but vaccination is always the best way to prevent flu and its potentially serious complications.
- Antiviral medications are an important adjunct to flu vaccine in the control of influenza. Almost all (>99%) of the influenza viruses tested this season are susceptible to the four FDA-approved influenza antiviral medications recommended for use in the U.S. this season.
U.S. Virologic Surveillance
Clinical Laboratories
The results of tests performed by clinical laboratories nationwide are summarized below. Data from clinical laboratories (the percentage of specimens tested that are positive for influenza) are used to monitor whether influenza activity is increasing or decreasing.
| 45,949 | 662,536 |
| 12,715 (27.7%) | 107,343 (16.2%) |
| 6,335 (49.8%) | 40,123 (37.4%) |
| 6,380 (50.2%) | 67,220 (62.6%) |
View Chart Data | View Full Screen Public Health Laboratories
The results of tests performed by public health laboratories nationwide are summarized below. Data from public health laboratories are used to monitor the proportion of circulating viruses that belong to each influenza subtype/lineage.
| 1,801 | 41,527 |
| 1,129 | 21,184 |
| 629 (55.7%) | 9,738 (46.0%) |
| 585 (96.1%) | 8,261 (87.5%) |
| 24 (3.9%) | 1,175 (12.5%) |
| 20 | 302 |
| 500 (44.3%) | 11,445 (54.0%) |
| 1 (0.3%) | 154 (1.8%) |
| 357 (99.7%) | 8,539 (98.2%) |
| 142 | 2,752 |
The predominant virus also varies by age group. Nationally, influenza B viruses are the most commonly reported influenza viruses among children and young adults age 0-4 years (58% of reported viruses) and 5-24 years (72% of reported viruses), while A(H1N1)pdm09 viruses are the most commonly reported influenza viruses among persons 25-64 years (50% of reported viruses) and 65 years of age and older (57% of reported viruses). For this season, 53% of influenza positive specimens reported by public health laboratories were among persons less than 25 years of age and only 12% were from persons age 65 and older.
View Chart Data | View Full Screen
Additional virologic surveillance information for current and past seasons:
Surveillance Methods | FluView Interactive: National, Regional, and State Data or Age Data
Influenza Virus Characterization
CDC performs genetic and antigenic characterization of U.S. viruses submitted from state and local health laboratories using Right Size Roadmap submission guidance. These data are used to compare how similar the currently circulating influenza viruses are to the reference viruses used for developing new influenza vaccines and to monitor evolutionary changes that continually occur in circulating influenza. Antigenic characterization data are based on an animal model (influenza-naive ferrets), and do not reflect pre-existing protection provided by past influenza infections and vaccinations. Additional antigenic characterization studies involving people vaccinated with current influenza vaccines are conducted later in the season; these data account for pre-existing protection in different populations against circulating influenza viruses. Genetic and antigenic characterization data are not used to make calculations about vaccine effectiveness (VE). CDC conducts VE studies each year to measure the benefits of flu vaccines in people.
CDC genetically characterized 1,128 influenza viruses collected in the U.S. from September 29, 2019, to January 25, 2020.
| 354 | |||||
| 6B.1A | 354 (100%) | ||||
| 276 | |||||
| 3C.2a | 268 (97.1%) | 2a1 | 268 (97.1%) | ||
| 2a2 | 0 | ||||
| 2a3 | 0 | ||||
| 2a4 | 0 | ||||
| 3C.3a | 8 (2.9%) | 3a | 8 (2.9%) | ||
| 451 | |||||
| V1A | 451 (100%) | V1A | 0 | ||
| V1A.1 | 40 (8.9%) | ||||
| V1A.3 | 411 (91.1%) | ||||
| 47 | |||||
| Y3 | 47 (100%) |
Influenza A Viruses
- A (H1N1)pdm09: 74 A(H1N1)pdm09 viruses were antigenically characterized by HI with ferret antisera, and all were antigenically similar (reacting at titers that were within 4-fold of the homologous virus titer) to cell-propagated A/Brisbane/02/2018-like reference viruses representing the A(H1N1)pdm09 component for the 2019-20 Northern Hemisphere influenza vaccines.
- A (H3N2): 53 A(H3N2) viruses were antigenically characterized by FRA with ferret antisera, and 22 (41.5%) were antigenically similar to cell-propagated A/Kansas/14/2017-like reference viruses representing the A(H3N2) component for the 2019-20 Northern Hemisphere influenza vaccines.
Influenza B Viruses
- B/Victoria: 88 B/Victoria lineage viruses, including viruses from both co-circulating sub-clades, were antigenically characterized by HI with ferret antisera, and 53 (60.2%) were antigenically similar to cell-propagated B/Colorado/06/2017-like reference viruses representing the B/Victoria component for the 2019-20 Northern Hemisphere influenza vaccines.
- B/Yamagata: 10 B/Yamagata lineage viruses were antigenically characterized by HI with ferret antisera, and all 10 (100%) were antigenically similar to cell-propagated B/Phuket/3073/2013-like reference viruses representing the B/Yamagata component for the 2019-20 Northern Hemisphere influenza vaccines.
CDC assesses susceptibility of influenza viruses to the antiviral medications including the neuraminidase inhibitors (oseltamivir, zanamivir, and peramivir) and the PA endonuclease inhibitor baloxavir using next generation sequence analysis supplemented by laboratory assays. Viruses collected in the United States since September 29, 2019, were tested for antiviral susceptibility as follows:
| 1,119 | 355 | 270 | 447 | 47 |
| (0.0%) | (0.0%) | (0.0%) | (0.0%) | (0.0%) |
| 1 (0.1%) | 1 (0.3%) | (0.0%) | (0.0%) | (0.0%) |
| 1,119 | 355 | 270 | 447 | 47 |
| (0.0%) | (0.0%) | (0.0%) | (0.0%) | (0.0%) |
| 1 (0.1%) | 1 (0.3%) | (0.0%) | (0.0%) | (0.0%) |
| 1,119 | 355 | 270 | 447 | 47 |
| 1 (0.1%) | (0.0%) | (0.0%) | 1 (0.2%) | (0.0%) |
| (0.0%) | (0.0%) | (0.0%) | (0.0%) | (0.0%) |
| 1,115 | 352 | 270 | 446 | 47 |
| (0.0%) | (0.0%) | (0.0%) | (0.0%) | (0.0%) |
ILINet
Nationwide during week 4, 5.7% of patient visits reported through the U.S. Outpatient Influenza-like Illness Surveillance Network (ILINet) were due to influenza-like illness (ILI). This percentage is above the national baseline of 2.4%.
View Chart Data (current season only) | View Full Screen
On a regional level, the percentage of outpatient visits for ILI ranged from 4.1% to 7.7% during week 4. All regions reported a percentage of outpatient visits for ILI which is above their region-specific baselines. ILI Activity Map
Data collected in ILINet are used to produce a measure of ILI activity* by state.
During week 4, the following ILI activity levels were experienced:
- High – the District of Columbia, New York City, Puerto Rico, and 41 states (Alabama, Arizona, Arkansas, California, Colorado, Connecticut, Florida, Georgia, Hawaii, Illinois, Indiana, Kansas, Kentucky, Louisiana, Maine, Maryland, Massachusetts, Minnesota, Mississippi, Missouri, Nebraska, New Jersey, New Mexico, New York, North Carolina, North Dakota, Oklahoma, Oregon, Pennsylvania, Rhode Island, South Carolina, South Dakota, Tennessee, Texas, Utah, Vermont, Virginia, Washington, West Virginia, Wisconsin, and Wyoming)
- Moderate – seven states (Alaska, Iowa, Michigan, Montana, Nevada, New Hampshire, and Ohio)
- Data were insufficient to calculate an ILI activity level from the U.S. Virgin Islands and two states (Delaware and Idaho).
*Data collected in ILINet may disproportionally represent certain populations within a state, and therefore, may not accurately depict the full picture of influenza activity for the whole state. Differences in the data presented here by CDC and independently by some state health departments likely represent differing levels of data completeness with data presented by the state likely being the more complete.
Additional information about medically attended visits for ILI for current and past seasons:
Surveillance Methods | FluView Interactive: National, Regional, and State Data or ILI Activity Map
Geographic Spread of Influenza as Assessed by State and Territorial Epidemiologists
The influenza activity reported by state and territorial epidemiologists indicates geographic spread of influenza viruses but does not measure the severity of influenza activity.
During week 4 the following influenza activity was reported:
- Widespread – Puerto Rico and 49 states (Alabama, Alaska, Arizona, Arkansas, California, Colorado, Connecticut, Delaware, Florida, Georgia, Idaho, Illinois, Indiana, Iowa, Kansas, Kentucky, Louisiana, Maine, Maryland, Massachusetts, Michigan, Minnesota, Mississippi, Missouri, Montana, Nebraska, Nevada, New Hampshire, New Jersey, New Mexico, New York, North Carolina, North Dakota, Ohio, Oklahoma, Oregon, Pennsylvania, Rhode Island, South Carolina, South Dakota, Tennessee, Texas, Utah, Vermont, Virginia, Washington, West Virginia, Wisconsin, and Wyoming)
- Regional – one state (Hawaii)
- Local – the District of Columbia
- Sporadic – the U.S. Virgin Islands
- Guam did not report.
Additional geographic spread surveillance information for current and past seasons:
Surveillance Methods | FluView Interactive
Influenza-Associated Hospitalizations
The Influenza Hospitalization Surveillance Network (FluSurv-NET) conducts population-based surveillance for laboratory-confirmed influenza-related hospitalizations in select counties in the Emerging Infections Program (EIP) states and Influenza Hospitalization Surveillance Project (IHSP) states.
A total of 8,633 laboratory-confirmed influenza-associated hospitalizations were reported by FluSurv-NET sites between October 1, 2019 and January 25, 2020; 5,173 (59.9%) were associated with influenza A virus, 3,401 (39.4%) with influenza B virus, 27 (0.3%) with influenza A virus and influenza B virus co-infection, and 32 (0.4%) with influenza virus for which the type was not determined. Among those with influenza A subtype information, 1,080 (91.1%) were A(H1N1)pdm09 virus and 106 (8.9%) were A(H3N2).
The overall cumulative hospitalization rate was 29.7 per 100,000 population which is similar to what has been seen during recent previous influenza seasons at this time of year. Rates in children and young adults are higher than at this time in recent seasons.
View Full Screen The highest rate of hospitalization is among adults aged ≥65, followed by children aged 0-4 years and adults aged 50-64 years.
| Overall | 29.7 |
| 0-4 years | 48.8 |
| 5-17 years | 13.4 |
| 18-49 years | 16.9 |
| 50-64 years | 36.7 |
| 65+ years | 71.3 |
Among 1,108 hospitalized adults with information on underlying medical conditions, 91.5% had at least one reported underlying medical condition, the most commonly reported were cardiovascular disease, metabolic disorder, obesity, and chronic lung disease. Among 271 hospitalized children with information on underlying medical conditions, 46.5% had at least one underlying medical condition; the most commonly reported was asthma. Among 216 hospitalized women of childbearing age (15-44 years) with information on pregnancy status, 26.4% were pregnant.
View Full Screen Additional hospitalization surveillance information for current and past seasons and additional age groups:
Surveillance Methods | FluView Interactive
Pneumonia and Influenza (P&I) Mortality Surveillance
Based on National Center for Health Statistics (NCHS) mortality surveillance data available on January 30, 2020, 6.7% of the deaths occurring during the week ending January 18, 2020 (week 3) were due to P&I. This percentage is below the epidemic threshold of 7.2% for week 3.
View Chart Data | View Full Screen
Additional pneumonia and influenza mortality surveillance information for current and past seasons:
Surveillance Methods | FluView Interactive
Influenza-Associated Pediatric Mortality
Fourteen influenza-associated pediatric deaths occurring during the 2019-2020 season between weeks 45 and 4 (the weeks ending November 9, 2019 and January 25, 2020) were reported to CDC during week 4. Eight were associated with influenza B viruses; one had a lineage determined and was a B/Victoria virus. Six were associated with influenza A viruses, and three were subtyped; all were A(H1N1)pdm09 viruses.
Of the 68 influenza-associated pediatric deaths occurring during the 2019-2020 season and reported to CDC:
- 45 deaths were associated with influenza B viruses, and eight had a lineage determined; all were B/Victoria viruses.
- 23 deaths were associated with influenza A viruses, and 13 were subtyped; all were A(H1N1)pdm09 viruses.
View Full Screen
Additional pediatric mortality surveillance information for current and past seasons:
Surveillance Methods | FluView Interactive
Additional National and International Influenza Surveillance Information
FluView Interactive: FluView includes enhanced web-based interactive applications that can provide dynamic visuals of the influenza data collected and analyzed by CDC. These FluView Interactive applications allow people to create customized, visual interpretations of influenza data, as well as make comparisons across flu seasons, regions, age groups and a variety of other demographics. To access these tools, visit http://www.cdc.gov/flu/weekly/fluviewinteractive.htm
National Institute for Occupational Safety and Health: Monthly surveillance data on the prevalence of health-related workplace absenteeism among full-time workers in the United States are available from NIOSH at https://www.cdc.gov/niosh/topics/absences/default.html
U.S. State and local influenza surveillance:Select a jurisdiction below to access the latest local influenza information
World Health Organization: Additional influenza surveillance information from participating WHO member nations is available through FluNet and the Global Epidemiology Reports.
WHO Collaborating Centers for Influenza located in Australia, China, Japan, the United Kingdom, and the United States (CDC in Atlanta, Georgia).
Europe: For the most recent influenza surveillance information from Europe, please see WHO/Europe and the European Centre for Disease Prevention and Control at http://www.flunewseurope.org/.
Public Health Agency of Canada: The most up-to-date influenza information from Canada is available at http://www.phac-aspc.gc.ca/fluwatch/
Public Health England: The most up-to-date influenza information from the United Kingdom is available at https://www.gov.uk/government/statistics/weekly-national-flu-reports
Any links provided to non-Federal organizations are provided solely as a service to our users. These links do not constitute an endorsement of these organizations or their programs by CDC or the Federal Government, and none should be inferred. CDC is not responsible for the content of the individual organization web pages found at these links.
An overview of the CDC influenza surveillance system, including methodology and detailed descriptions of each data component, is available at: http://www.cdc.gov/flu/weekly/overview.htm.
--------------------------------------------------------------------------------
Page last reviewed: January 31, 2020, 11:00 AM
Content source: Centers for Disease Control and Prevention, National Center for Immunization and Respiratory Diseases (NCIRD)Seasonal Influenza (Flu)
- About Fluplus icon
- Who is at High Risk for Flu Complicationsplus icon
- Flu Seasonplus icon
- Prevent Fluplus icon
- Flu Vaccines Workplus icon
- Symptoms & Diagnosisplus icon
- Treatmentplus icon
- Schools, Businesses & Travelersplus icon
- Flu Activity & Surveillanceplus icon
- Health Professionalsplus icon
- Flu News & Spotlightsplus icon
- What’s New
email_03Get Email Updates
To receive weekly email updates about Seasonal Flu, enter your email address: Email Address
What's this?
Submit
Influenza Types


Comment