Check out the FAQ,Terms of Service & Disclaimers by clicking the
link. Please register
to be able to post. By viewing this site you are agreeing to our Terms of Service and Acknowledge our Disclaimers.
FluTrackers.com Inc. does not provide medical advice. Information on this web site is collected from various internet resources, and the FluTrackers board of directors makes no warranty to the safety, efficacy, correctness or completeness of the information posted on this site by any author or poster.
The information collated here is for instructional and/or discussion purposes only and is NOT intended to diagnose or treat any disease, illness, or other medical condition. Every individual reader or poster should seek advice from their personal physician/healthcare practitioner before considering or using any interventions that are discussed on this website.
By continuing to access this website you agree to consult your personal physican before using any interventions posted on this website, and you agree to hold harmless FluTrackers.com Inc., the board of directors, the members, and all authors and posters for any effects from use of any medication, supplement, vitamin or other substance, device, intervention, etc. mentioned in posts on this website, or other internet venues referenced in posts on this website.
We are not asking for any donations. Do not donate to any entity who says they are raising funds for us.
Announcement
Collapse
No announcement yet.
Tracking the World Wide Age Distribution of Swine Flu
How have different age groups in the United States been impacted by novel H1N1 flu in terms of infection rates?
When the novel H1N1 outbreak was first detected in mid-April 2009, CDC began working with states to collect, compile and analyze information regarding the novel H1N1 flu outbreak, including the numbers of confirmed and probable cases and the ages of these people. The information analyzed by CDC supports the conclusion that novel H1N1 flu has caused greater disease burden on people younger than 25 years of age than older people.
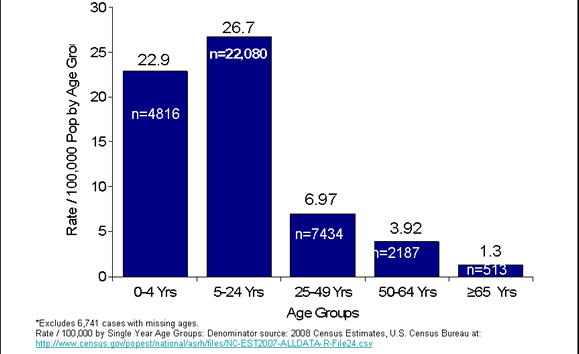
Graph A (below) shows the estimated rate of novel H1N1 cases per 100,000 people reported to CDC in the United States by age group from April 15 to July 24, 2009. Over this time period, 43,771* probable and confirmed cases of novel H1N1 infection were reported to CDC. The number of reported cases per 100,000 population** was highest among people in the 5 years to 24 years of age group (26.7 per 100,000). This was followed by those in the 0 to 4 years of age group, whose case rate was 22.9 per 100,000 people. The rate declined further to 6.97 people per 100,000 in the 25 years to 49 years of age group. The rate was 3.9 per 100,000 people in the 50 years to 64 years of age group. At 1.3 people per 100,000, the novel H1N1 flu infection rate was lowest in people 65 years and older.
This epidemiological data supports laboratory serology studies that indicate that older people may have pre-existing immunity to the novel H1N1 flu virus. This age distribution is very different from what is normally seen for seasonal flu, where older people are more heavily impacted.
*Of the total number of cases reported to CDC, 6,741cases were omitted from this analysis due to missing ages.
**The denominator in these calculations is derived from national population census data, and is not adjusted for the actual geographic distribution of cases. This thus reflects a national average. Because only a fraction of persons with influenza symptoms are likely to have been tested for novel H1N1, these rate estimates are underestimation of the actual rates. However, the relative difference in rates between age groups is what is most important about these data.
Graph A: Novel H1N1 Confirmed and Probable Case Rate in the United States, By Age Group How have different age groups been impacted by novel H1N1 flu in terms of hospitalization rates in the United States?
When the novel H1N1 flu outbreak was first detected in mid-April 2009, CDC began working with states to collect, compile and analyze information regarding the novel H1N1 flu outbreak, including information on hospitalizations and the ages of people hospitalized with confirmed and probable novel H1N1 flu infection.
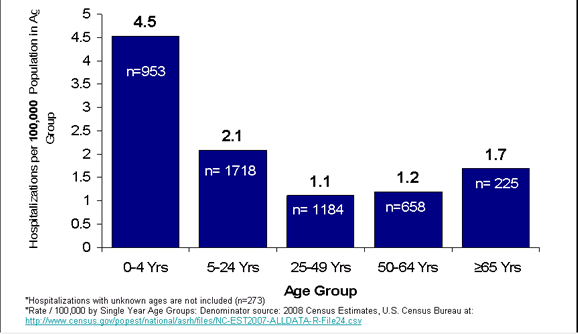
Graph B (below) shows the estimated novel H1N1 flu hospitalization rate in the United States by age group from April 15 to July 24, 2009. These estimates are based on the 4,738* hospitalizations that were reported to CDC during this time period. The reported hospitalization rate per 100,000** people was highest among children in the 0 to 4 years of age group. The hospitalization rate of children in the 0 to 4 age group with novel H1N1 flu illness was 4.5 children per 100,000. The next highest reported hospitalization rate was in the 5 to 24 years of age group, which had a hospitalization rate of 2.1 per 100,000 people. The hospitalization rate for people in the 25 to 49 years of age group was lowest at 1.1 per 100,000 people. The hospitalization rate for people 50 to 64 years of age was 1.2 per 100,000 people, and the hospitalization rate for people 65 years and older was 1.7 per 100,000.
While people 65 years and older are much less likely to become ill with novel H1N1 flu, the increase in the hospitalization rate for people in this age groups indicates that if they do become sick, their risk of hospitalization is increased. This is not surprising given that people 65 and older are generally considered at higher risk of serious flu-related complications, including those requiring hospitalization, from seasonal flu illness.
*Of the total population of hospitalizations (n=4,738) 273 cases were omitted from this analysis due to missing ages.
**The denominator in these calculations is derived from national population census data and is not adjusted for the actual geographic distribution of cases. This reflects a national average. Because only a fraction of people with influenza symptoms are likely to have been tested for novel H1N1, these rate estimates are underestimation of the actual rates. However, the relative difference in rates between age groups is what is most important about these data.
Graph B: Novel H1N1 U.S. Hospitalization Rate per 100,000 Population, By Age Group
Re: Tracking the World Wide Age Distribution of Swine Flu
From ECDC report
Fourth meeting of the SSiaP working group Stockholm, 14?15 July
3.3 The pandemic (H1N1) 2009 experience in the United
States
Lynnette Brammer, Centers for Disease Control and Prevention (US CDC), presented the epidemiology of the
pandemic influenza in the United States.
Main results
? Secondary ILI attack rate in household contacts: 12 %.
? Overall proportion of hospitalisations: 8 %.
? Overall case fatality: 0.2 %.
? Most cases (58 %) and highest incidence in 5?24 years age group, but second highest incidence in children
under five years of age.
? Most hospitalisations (34 %) in 5?24 years age group, but highest age-specific hospitalisation rate per
100 000 population in children under five years of age.
? Highest age-specific proportion of hospitalisations in cases of influenza A(H1N1)v infection is 65 years of
age and older.
? Most deaths in 5?24 years age group, but highest case-fatality ratio in persons 65 years of age and older.
? Evidence of higher prevalence of the following underlying conditions among hospitalised or deceased
A(H1N1)v influenza patients, compared with the general US population:
− Diabetes.
− Chronic cardio-vascular disease (excluding hypertension).
− Neuromuscular disorder.
− Pregnancy.
− Seizure disorder and other neurodegenerative disease.
Also evidence of higher prevalence of the following underlying conditions among deceased influenza
A(H1N1)v patients, compared with the general US population:
− Chronic renal disease stages III and IV.
− Cancer.
− Obesity.
? Persons who died from influenza A(H1N1)v virus infection and suffered from underlying neurocognitive,
neuromuscular or seizure disorders tended to be 18 years of age or younger.
Conclusions
? The pandemic has proven many expectations wrong.
? Change in scenario required flexible surveillance: focus on outpatient ILI, rather than hospitalisation and
death.
? Pandemic planning and exercises proved valuable.
? Some of the biggest surveillance challenges were related to IT/data management.
? Pandemic activity is currently declining in the US, but transmission is persisting, and an increase in
infections is expected in the autumn.
? Vaccine priority groups will be finalised in an ACIP meeting.
? The focus of surveillance will shift toward:
− monitoring of changes in risk groups;
− the severe end of the disease spectrum;
− vaccine effectiveness and adverse events;
− more focused virological surveillance; and
− putting an end to the production of numbers (exception: estimates from modelling).
? The level of surveillance carried out in the spring of 2009 will not be sustainable during peak activity.
− Need to change expectations now.
− Build a level of understanding for the data that will be available.
Surveillance and studies in a pandemic: Fourth meeting, 14?15 July 2009
MEETING REPORT
Plenary discussion
Question: Has the US seen a clear cut-off in pandemic influenza-related morbidity and mortality between age
cohorts born before and after 1957?
Answer: The assumption of a partial or relative immunity in the elderly rests on serological findings. The US
epidemiology of the current pandemic suggests that the elderly may be less susceptible to infection than younger
persons but more prone to severe disease and death if they do get infected.
Question: Have there been many severe cases without underlying illness? Answer: This has not been specifically addressed yet, but there is no evidence of higher mortality in previously
healthy children.
Question: What has the impact of the pandemic influenza been on society, especially the healthcare system? Answer: There has been a huge increase in hospital emergency department visits, and both surveillance and
laboratory systems have been severely stressed. Participants from Canada and Australia added that some patients
required massive sedation, ventilation and even extracorporeal membrane oxygenation, which had an impact on
both ICU staff and equipment.
JERUSALEM, Aug. 12 (Xinhua) -- About half of the over 2,100 A/H1N1 influenza patients in Israel are under the age of 30, local news service Ynet on Wednesday quoted the Health Ministry as saying.
Data from the ministry showed that 2,148 cases of A/H1N1 influenza had been found across the nation till Tuesday, and about 50 percent of them are under 30, said the report, adding that only about 5 percent are aged 50 and above.
Five local patients of the global pandemic have so far died, and about 25 others were hospitalized in serious conditions, according to the report.
Israeli health experts have warned that some one quarter of the Israeli population, or over 1.5 million Israelis, would contract the virus during a possible outbreak this winter, among whom around 700 would die.
The Israeli government has initiated a plan for precaution, including purchasing a large amount of vaccines.
Re: Tracking the World Wide Age Distribution of Swine Flu
? Most deaths in 5?24 years age group, but highest case-fatality ratio in persons 65 years of age and older.
This is similar to what I saw when I looked at the 1918 & 1957 pandemics - the older people may not have had a high death rate initially, but after awhile they had the typical age-group high CFR.
One difference between 1918 and now, is that due to better health care during their lifetimes, many over 65 are still active in corporate life and perform an enormous amount of necessary volunteer work. Their deaths may have a higher economic impact than in 1918.
.
"The next major advancement in the health of American people will be determined by what the individual is willing to do for himself"-- John Knowles, Former President of the Rockefeller Foundation
Re: Tracking the World Wide Age Distribution of Swine Flu
H1N1 catching them young in city
Kounteya Sinha, TNN 19 August 2009,
NEW DELHI: The H1N1 swine flu virus seems to be infecting youngsters more often. Those within the age group of 10-25 years have been worst affected by the virus in Delhi.
An analysis made by the state health departmentof303 swine flu cases has shown that the majority of those infected -- nearly 52% or 158 cases -- are in this age group.
The largest number of those infected are in the 10-18 (94 cases) and 18-25 (64 cases) age groups.
Delhi also saw the virus infecting three people over the age of 65, all of whom were women. The oldest among them was a 75-year-old.
The analysis showed that the state witnessed 15 cases of infection in children below 5 years of age followed by 37 cases in the 5-10-year-old bracket.
Around 62 people in the age group of 26-40 got infected by the H1N1 virus that has spread across 168 countries in the globe. The infection rate in the 41-65 year bracket saw 28 positive cases.
The analysis also looked at the gender pattern. The maximum number of males who got infected (46) belonged to the age group of 10-18. Interestingly, the same was in the case of females with the maximum number of those infected (48) belonging to the age group of 10-18 years.
Of the 303 cases studied, 176 infections were among males and the rest 127 in females.
"The analysis clearly shows that the pediatric age group is worst affected.
That's also because they stay in groups in schools, while playing games and attending social events. Interestingly, our analysis also showed that in a vast majority of cases, symptoms of H1N1 infection disappeared within two days of treatment with Tamiflu," state health minister Kiran Walia told TOI.
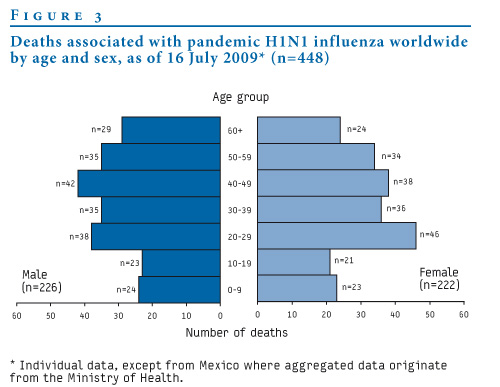
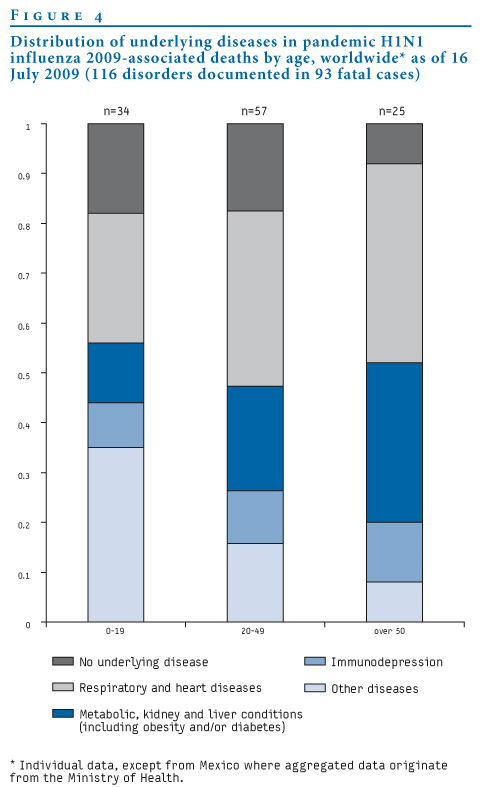
This article describes the characteristics of 574 deaths associated with pandemic H1N1 influenza up to 16 July 2009. Data (except from Canada and Australia) suggest that the elderly may to some extent be protected from infection. There was underlying disease in at least half of the fatal cases. Two risk factors seem of particular importance: pregnancy and metabolic condition (including obesity which has not been considered as risk factor in previous pandemics or seasonal influenza).
snip:
As in previous pandemics, available data show that age groups are not equally affected.
Compared to younger age groups, the elderly seem to be protected from infection to some extent, perhaps due to previous exposure to strains akin to influenza A(H1N1)v virus [11-13].
When infection does occur, however, the percentage of deaths in elderly cases seems to be higher than in others.
Initial estimates available from Mexico for the period until 16 July 2009 showed that the risk of death in aged cases (over 50 years) was higher (6% deaths among cases) than in children (0-1% deaths among cases aged 0-19 years) and young adults (2-4% deaths among cases aged 20-49 years) [3].
Quote "While cases under 15 years of age have the highest hospitalization rate, they have a comparatively low mortality rate except for children under 1 year of age. Adults over 65 years of age have a low hospitalization rate, but a comparatively higher mortality rate.
...
The age distribution was available for 1,298 hospitalized cases and 65 deaths from the abbreviated line-list. The highest hospitalization rate is among the cases below 1 year of age (27.5 per 100,000) followed by the cases between 1 and 4 years of age (11.2 per 100,000). In comparison, the highest mortality rate is among the cases over 65 years of age (0.39 per 100,000), followed by the cases below 1 year of age (0.27 per 100,000) and cases between 45 and 64 years old (0.26 per 100,000).
...
Overall cases reported (n=6,966) Hospitalizated cases (n=1,341) Cases admitted to ICU (n=240) Deaths (n=65)
Females, % 51.8 51.3 58.8 63.1
Median age 18 23 40 51
Aboriginal status, % 11.1 15.6 15.0 12.3
Underlying medical conditions1, % 35.4 (585/1,577) 54.3 (485/894) 65.6 (122/186) 81.3 (39/48)
Pregnancy2, % 3.6 (61/1,676) 21.8 (52/238) 15.6 (10/64) 18.2 (2/11)
1 Among those for whom information was provided. Pregnancy is no longer considered as an underlying medical condition which may explain the lower percentage this week.
2 Among women between 15 and 44 years old." End quote.
The median age increases with the severity of the event.
Twitter: @RonanKelly13
The views expressed are mine alone and do not represent the views of my employer or any other person or organization.
Re: Tracking the World Wide Age Distribution of Swine Flu
Thanks RoRo
Descriptive characteristics of laboratory-confirmed Canadian Pandemic (H1N1) 2009 cases, hospitalized cases, cases admitted to ICU and deaths with core information available, reported to the Public Health Agency of Canada as of 8<SUP>st</SUP> August 2009
<TABLE class=widthFull border=1 cellSpacing=0 cellPadding=2><TBODY><TR><TH></TH><TD class=bg-colour-blue>Overall cases reported (n=6,966)</TD><TD class=bg-colour-blue>Hospitalizated cases (n=1,341)</TD><TD class=bg-colour-blue>Cases admitted to ICU (n=240)</TD><TD class=bg-colour-blue>Deaths (n=65)</TD></TR><TR><TH class="bg-colour-blue alignLeft">Females, %</TH><TD class=alignCenter>51.8</TD><TD class=alignCenter>51.3</TD><TD class=alignCenter>58.8</TD><TD class=alignCenter>63.1</TD></TR><TR><TH class="bg-colour-blue alignLeft">Median age</TH><TD class=alignCenter>18</TD><TD class=alignCenter>23</TD><TD class=alignCenter>40</TD><TD class=alignCenter>51</TD></TR><TR><TH class="bg-colour-blue alignLeft">Aboriginal status, %</TH><TD class=alignCenter>11.1</TD><TD class=alignCenter>15.6</TD><TD class=alignCenter>15.0</TD><TD class=alignCenter>12.3</TD></TR><TR><TH class="bg-colour-blue alignLeft">Underlying medical conditions<SUP>1</SUP>, %</TH><TD class=alignCenter>35.4 (585/1,577)</TD><TD class=alignCenter>54.3 (485/894)</TD><TD class=alignCenter>65.6 (122/186)</TD><TD class=alignCenter>81.3 (39/48)</TD></TR><TR><TH class="bg-colour-blue alignLeft">Pregnancy<SUP>2</SUP>, %</TH><TD class=alignCenter>3.6 (61/1,676)</TD><TD class=alignCenter>21.8 (52/238)</TD><TD class=alignCenter>15.6 (10/64)</TD><TD class=alignCenter>18.2 (2/11)</TD></TR><TR><TD colSpan=5><SUP>1</SUP> Among those for whom information was provided. Pregnancy is no longer considered as an underlying medical condition which may explain the lower percentage this week.
<SUP>2</SUP> Among women between 15 and 44 years old.
</TD></TR></TBODY></TABLE>
 Tweet
Tweet


Comment