Overall Summary
- Overall, the slow decline in influenza activity in Canada has continued in week 11.However, many parts of Canada, particulary the Eastern and Atlantic regions are still reporting elevated activity in week 11.
- In week 11, the number of laboratory detections, outbreaks and the number of geographic regions with influenza activity, decreased from the previous week.
- Although adult sentinel hospitalizations decreased from the previous week, the number of hospitalizations and deaths reported by participating provinces and territories increased.
- Influenza B detections and outbreaks in Canada are slowly increasing.
- Although declining for most indicators, influenza A(H3N2) continues to be the most common subtype of influenza affecting Canadians.
- The majority of laboratory detections, hospitalizations and deaths have been among adults aged 65+ years.
- For more information on the flu, see our Flu(influenza) web page.
On this page
- Influenza/ILI Activity (geographic spread)
- Laboratory Confirmed Influenza Detections
- Syndromic/Influenza-like Illness Surveillance
- Influenza Outbreak Surveillance
- Provincial/Territorial Influenza Hospitalizations and Deaths
- Sentinel Hospital Influenza Surveillance
- Influenza Strain Characterizations
- Antiviral Resistance
- Provincial and International Influenza Reports
- FluWatch definitions for the 2016-2017 season
Influenza/Influenza-like Illness Activity (geographic spread)
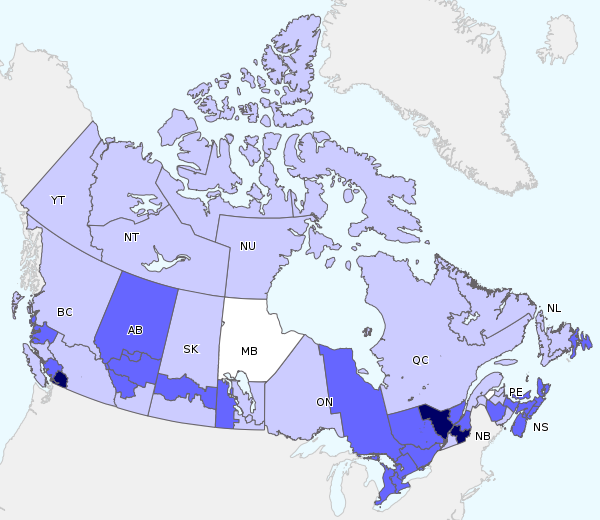
In week 11, one region in NL, reported no influenza or influenza-like illness activity. Sporadic influenza activity was reported in 29 regions across 11 provinces and territories. Localized activity was reported in 21 regions across nine provinces.No regions reported any widespread activity in week 11. For more details on a specific region, click on the map.

Download the alternative format
(PDF format, 805KB, 9 pages)
Organization:
Public Health Agency of Canada
Date published: 2017-03-24
Related Topics
Figure 1 ? Map of overall influenza/ILI activity level by province and territory, Canada, week 11
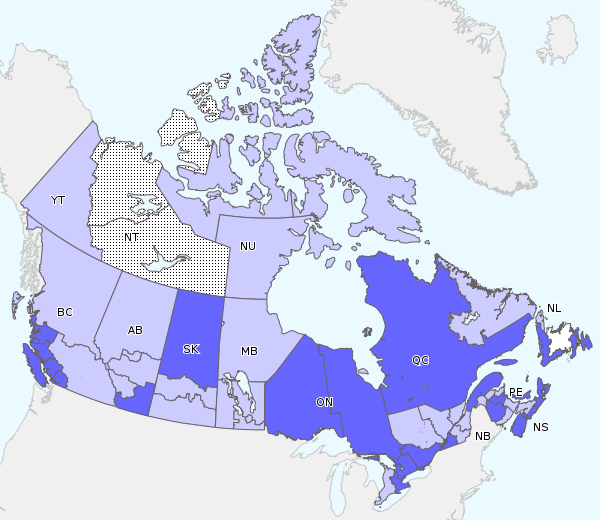
Note: Influenza/ILI activity levels, as represented on this map, are assigned and reported by Provincial and Territorial Ministries of Health, based on laboratory confirmations, sentinel ILI rates and reported outbreaks. Please refer to detailed definitions at the end of the report. Maps from previous weeks, including any retrospective updates, are available in the mapping feature found in the Weekly Influenza Reports.
Figure 1 - Text Description
Laboratory Confirmed Influenza Detections
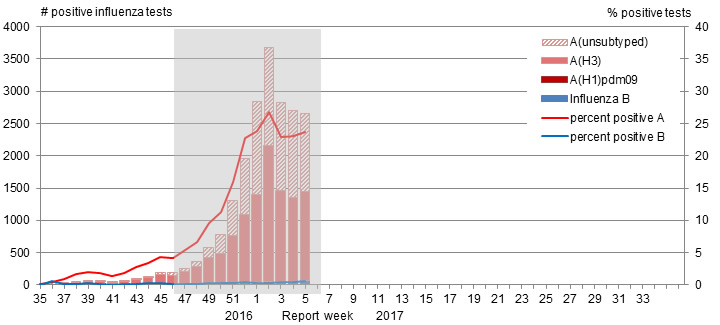
In week 11, the number (1,197) and the percentage of tests positive for influenza (16%) decreased from the previous week. Peak influenza detections occurred in week 02 at 27%. Although declining, influenza A continues to account for the majority of detections; however, influenza B detections have been steadily increasing for the past few weeks. Influenza B activity is very low compared to the same time period in the previous two seasons. For data on other respiratory virus detections, see the Respiratory Virus Detections in Canada Report on the Public Health Agency of Canada (PHAC) website.
Figure 2 ? Number of positive influenza tests and percentage of tests positive, by type, subtype and report week, Canada, 2016-17, week 11
 The shaded area indicates weeks where the positivity rate was at least 5% and a minimum of 15 positive tests were observed, signalling the start and end of seasonal influenza activity.
Figure 2 - Text Description
To date this season, 32,836 laboratory confirmed influenza detections have been reported, of which 96% have been influenza A. Influenza A(H3N2) is the most common subtype detected. For more detailed weekly and cumulative influenza data, see the text descriptions for Figures 2 and 3 or the Respiratory Virus Detections in Canada Report.
Figure 3 ? Cumulative numbers of positive influenza specimens by type/subtype and province/territory, Canada, 2016-17, week 11
 Figure 3 - Text Description
 To date, detailed information on age and type/subtype has been received for 23,013 laboratory-confirmed influenza cases (Table 1). Among cases with reported age and type/subtype information, adults aged 65+ accounted for almost half of the reported influenza cases. Among cases of influenza A(H3N2), adults aged 65+ represented 49% of cases, followed by adults aged 20-64 (34% of cases). In the previous influenza A(H3N2)-predominant season in 2014-15, adults aged 65+ represented 58% of cases and adults aged 20-64 represented 27% of cases.
| Table 1 - Footnote 1 Table 1 includes specimens for which demographic information was reported. These represent a subset of all positive influenza cases reported. Cumulative data include updates to previous weeks. Return to Table 1 - Footnote1referrer Table 1 - Footnote 2 Percentage of tests positive for sub-types of influenza A are a percentage of all influenza A detections. Return to Table 1 - Footnote2referrer Table 1 - Footnote UnS Unsubtyped: The specimen was typed as influenza A, but no result for subtyping was available. Specimens from NT, YT, and NU are sent to reference laboratories in the provinces. Return to Table 1 - FootnoteUnSreferrer x Supressed to prevent residual disclosure |
||||||||||||
| >87 | <5 | 10 | 77 | 7 | 2068 | 14 | 799 | 1255 | 102 | 2170 | 9% | |
| >24 | 0 | <5 | 24 | 21 | 2076 | 13 | 1038 | 1025 | 172 | 2248 | 10% | |
| 64 | 0 | 7 | 57 | 32 | 3233 | 27 | 1751 | 1455 | 177 | 3410 | 15% | |
| 85 | 0 | 17 | 68 | 19 | 3595 | 23 | 1871 | 1701 | 210 | 3805 | 17% | |
| >321 | <5 | 64 | 257 | 43 | 11063 | 13 | 5204 | 5846 | 317 | 11380 | 49% | |
| 586 | <5 | >98 | 483 | 122 | 22035 | 90 | 10663 | 11282 | 978 | 23013 | 100% | |
| 83% | x% | x% | 82% | 17% | 96% | 0% | 48% | 51% | 4% | |||
Syndromic/Influenza-like Illness Surveillance
Healthcare Professionals Sentinel Syndromic Surveillance
In week 11, 1.7% of visits to healthcare professionals were due to influenza-like illness, compared to 1.8% in the previous week.
Figure 4 - Percentage of visits for ILI reported by sentinels by report week, Canada, 2016-17, week 11
Number of Sentinels Reporting Week 11: 101
 Delays in the reporting of data may cause data to change retrospectively. In BC, AB, and SK, data are compiled by a provincial sentinel surveillance program for reporting to FluWatch. Not all sentinel physicians report every week.
Figure 4 - Text Description
Are you a primary healthcare practitioner (General Practitioner, Nurse Practitioner or Registered Nurse) interested in becoming a FluWatch sentinel?
Please visit our Influenza Sentinel page for more details.
Influenza Outbreak Surveillance
In week 11, 42 laboratory confirmed influenza outbreaks were reported (three less than the previous week). Among the reported outbreaks: 21 were in long-term care (LTC) facilities, seven in hospitals and 12 in institutional or community (other) settings. Of the outbreaks with known strains or subtypes, 11 were due to influenza A(H3N2), eight were due to influenza A(UnS) and seven outbreaks were due to influenza B. An additional two outbreaks due to ILI were reported in a school.
To date this season, 991 outbreaks have been reported and the majority (66%) have occurred in LTC facilities. Compared to the same period in the most recent previous A(H3N2) predominant season (2014-15), 1,552 outbreaks were reported, of which 74% occurred in LTC facilities.
Figure 5 - Overall number of new laboratory-confirmed influenza outbreaksFigure 5 - Footnote1 by report week, Canada, 2016-17, week 11
 Figure 5 - Footnote 1 All provinces and territories except NU report influenza outbreaks in long-term care facilities. All provinces and territories with the exception of NU and QC report outbreaks in hospitals. Outbreaks of influenza or influenza-like-illness in other facilities are reported to FluWatch but reporting varies between jurisdictions. Outbreak definitions are included at the end of this report.
Return to Figure 5 - Footnote1referrer
Figure 5 - Text Description
Provincial/Territorial Influenza Hospitalizations and Deaths
In week 11, 261 influenza-associated hospitalizations were reported by participating provinces and territories, up from 254 reported in the previous week *. Influenza A accounted for 88% of hospitalizations. The weekly percentage of influenza B associated hospitalizations has been steadily increasing for the past few weeks (from 1.2% in week 02 to 11.5% in week 11). The largest proportion of hospitalizations were among adults aged 65+ years (71%). A total of ten intensive care unit (ICU) admissions were reported in week 11. An increase in the number of deaths was reported in week 11, with 35 deaths reported. All deaths were reported in adults aged 65+ years.
To date this season, 5,139 hospitalizations have been reported, of which 97% were due to influenza A. Among cases for which the subtype of influenza A was reported, almost all (2770/2787) were influenza A(H3N2). Adults 65+ accounted for 69% of the hospitalizations. A total of 193 ICU admissions and 277 deaths have been reported. The majority of deaths was reported in adults aged 65+ years.
| * Note: Influenza-associated hospitalizations are not reported to PHAC by BC, NU, and QC. Only hospitalizations that require intensive medical care are reported by SK. ICU admissions are not distinguished among hospital admissions reported from ON. The hospitalization or death does not have to be attributable to influenza, a positive laboratory test is sufficient for reporting. x Supressed to prevent residual disclosure |
|||||||
| 395 | 17 | 412 (8%) | 11 | 6% | <5 | x% | |
| 217 | 21 | 238 (5%) | 13 | 7% | <5 | x% | |
| 263 | 8 | 271 (5%) | 18 | 9% | <5 | x% | |
| 666 | 30 | 696 (14%) | 52 | 27% | 32 | 12% | |
| 3433 | 89 | 3522 (68%) | 99 | 51% | 238 | 86% | |
| 4974 | 165 | 5139 (100%) | 193 | 100% | 277 | 100% | |
Sentinel Hospital Influenza Surveillance
Pediatric Influenza Hospitalizations and Deaths
In week 11, 17 laboratory-confirmed influenza-associated pediatric (≤16 years of age) hospitalizations were reported by the Immunization Monitoring Program Active (IMPACT) network. All but three cases were due to influenza A. The number of weekly hospitalizations reported since week 05 have been below the six year average for the same time period (Figure 7).
To date this season, 458 laboratory-confirmed influenza-associated pediatric hospitalizations were reported by the IMPACT network. Children aged 0-23 months accounted for approximately 39% of hospitalizations. Influenza A accounted for 91% (n=419) of the reported hospitalizations, of which 34% (n=141) were influenza A(H3N2) and the remainder were A(UnS). Additionally, 74 intensive care unit (ICU) admissions have been reported. Children aged 10-16 years accounted for 30% of ICU cases followed by children aged 0-23 months (27%). A total of 47 ICU cases reported at least one underlying condition or comorbidity. Less than five deaths have been reported this season.
Figure 6 - Cumulative numbers of pediatric hospitalizations (≤16 years of age) with influenza by type and age-group reported by the IMPACT network, Canada, 2016-17, week 11
 Figure 6 - Text Description
 Figure 7 ? Number of pediatric hospitalizations (≤16 years of age) with influenza reported by the IMPACT network, by week, Canada, 2016-17, week 11
 The shaded area represents the maximum and minimum number of cases reported by week from seasons 2010-11 to 2015-16.
The number of hospitalizations reported through IMPACT represents a subset of all influenza-associated pediatric and adult hospitalizations in Canada. Delays in the reporting of data may cause data to change retrospectively.
Figure 7 - Text Description
Adult Influenza Hospitalizations and Deaths
In week 11, 42 laboratory-confirmed influenza-associated adult (≥20 years of age) hospitalizations were reported by the Canadian Immunization Research Network (CIRN). All but nine cases were due to influenza A and the majority of cases (69%) occurred in adults aged 65+. The number of hospitalizations due to influenza B has been increasing since week 05.
To date this season, 1,222 laboratory-confirmed influenza-associated adult (≥20 years of age) hospitalizations have been reported by CIRN. Influenza A accounted for 98% of hospitalizations. Adults aged 65+ accounted for 78% of hospitalizations. To date, 81 intensive care unit (ICU) admissions have been reported. A total of 55 ICU cases reported at least one underlying condition or comorbidity. The median age of patients admitted to the ICU was 69 years. Approximately 51 deaths have been reported this season, the majority in adults aged 65+. The median age of reported deaths was 85 years.
Figure 8 - Cumulative numbers of adult hospitalizations (≥20 years of age) with influenza by type and age-group reported by CIRN, Canada, 2016-17, week 11
 Figure 8 - Text Description
 Figure 9 ? Percentage of hospitalizations, ICU admissions and deaths with influenza by age-group (≥20 years of age) reported by CIRN, Canada 2016-17, week 11
 The number of hospitalizations reported through CIRN represents a subset of all influenza-associated adult hospitalizations in Canada. Delays in the reporting of data may cause data to change retrospectively.
Figure 9 - Text Description
Influenza Strain Characterizations
During the 2016-17 influenza season, the National Microbiology Laboratory (NML) has characterized 1,420 influenza viruses [1272 A(H3N2), 28 A(H1N1), 120 influenza B]. All but one influenza A virus (n=1271) and 40 influenza B viruses characterized were antigenically or genetically similar to the vaccine strains included in both the trivalent and quadrivalent vaccines. Eighty influenza B viruses were similar to the strain which is only included in the quadrivalent vaccine.
The World Health Organization (WHO) has released the recommended composition of the influenza vaccine for use in the 2017-2018 northern hemisphere influenza season. Trivalent vaccines are recommended to contain: 1) an A/Michigan/45/2015 (H1N1)pdm09-like virus; 2) an A/Hong Kong/4801/2014 (H3N2)-like virus; and 3) a B/Brisbane/60/2008-like virus (Victoria lineage). Quadrivalent vaccines are recommended to contain the above three viruses and a B/Phuket/3073/2013-like virus (Yamagata lineage).
| Table 3 - Footnote 1 The NML receives a proportion of the influenza positive specimens from provincial laboratories for strain characterization and antiviral resistance testing. Strain characterization data reflect the results of hemagglutination inhibition (HI) testing compared to the reference influenza strains recommended by WHO. Return to Table 3 - Footnote1referrer Table 3 - Footnote 2 Determined by sequence analysis Return to Table 3 - Footnote2referrer Table 3 - Footnote 3 WHO - Recommended composition of the influenza virus vaccines for use in the 2016-17 northern hemisphere influenza season. Return to Table 3 - Footnote3referrer Table 3 - Footnote 4 Detected in epidemiological week 50. For more details, see Week 50 report Return to Table 3 - Footnote4referrer |
||
| Antigenically A/Hong Kong/4801/2014-like |
319 | Viruses antigenically similar to A/Hong Kong/4801/2014, the A(H3N2) component of the 2016-17 Northern Hemisphere's trivalent and quadrivalent vaccine. |
| GeneticallyTable 3 - Footnote2 A/Hong Kong/4801/2014-like |
952 | Viruses belonging to genetic group 3C.2a. A/Hong Kong/4801/2014-like virus belongs to genetic group 3C.2a and is the influenza A(H3N2) component of the 2016-17 Northern Hemisphere's trivalent and quadrivalent vaccine. Additionally, genetic characterization of the 319 influenza A (H3N2) viruses that underwent HI testing determined that 272 viruses belonged to genetic group 3C.2a and 47 viruses belonged to genetic group 3C.3a. The majority of viruses belonging to genetic group 3C.3a are inhibited by antisera raised against A/Hong Kong/4801/2014Table 3 - Footnote3. |
| Antigenically A/Indiana/10/2011-likeTable 3 - Footnote4 |
1 | Viruses antigenically similar to A/Indiana/10/2011, a candidate H3N2v vaccine virus. |
| A/California/7/2009-like | 28 | Viruses antigenically similar to A/California/7/2009, the A(H1N1) component of the 2016-17 Northern Hemisphere's trivalent and quadrivalent vaccine influenza vaccine. |
| B/Brisbane/60/2008-like (Victoria lineage) |
40 | Viruses antigenically similar to B/Brisbane/60/2008, the influenza B component of the 2016-17 Northern Hemisphere's trivalent and quadrivalent influenza vaccine |
| B/Phuket/3073/2013-like (Yamagata lineage) |
80 | Viruses antigenically similar to B/Phuket/3073/2013, the additional influenza B component of the 2016-17 Northern Hemisphere quadrivalent influenza vaccine. |
Antiviral Resistance
During the 2016-17 season, the National Microbiology Laboratory (NML) has tested 760 influenza viruses for resistance to oseltamivir and zanamivir and 180 influenza viruses for resistance to amantadine. All but one influenza A(H3N2) virus were sensitive to oseltamivir and all viruses were sensitive to zanamivir. All 180 influenza A viruses were resistant to amantadine (Table 4).
| Table 4 - Footnote * N/A - not applicable Return to Table 4 - Footnote*referrer |
||||||
| 635 | 1 (0.2%) | 635 | 0 (0%) | 155 | 155 (100%) | |
| 1 | 0 (0%) | 1 | 0 (0%) | 1 | 1 (100%) | |
| 25 | 0 (0%) | 24 | 0 (0%) | 24 | 24 (100%) | |
| 99 | 0 (0%) | 100 | 0 (0%) | N/ATable 4 - Footnote* | N/ATable 4 - Footnote* | |
| 760 | 1 (0.1%) | 760 | 0 (0%) | 180 | 180 (100%) | |
...
https://www.canada.ca/en/public-heal...2-18-2017.html

 The shaded area indicates weeks where the positivity rate was at least 5% and a minimum of 15 positive tests were observed, signalling the start and end of
  Figure 3 - Text Description
  Delays in the reporting of data may cause data to change retrospectively. In BC, AB, and SK, data are compiled by a provincial sentinel surveillance program for reporting to FluWatch. Not all sentinel physicians report every week.
 Figure 5 - Footnote 1 All provinces and territories except NU report influenza outbreaks in long-term care facilities. All provinces and territories with the exception of NU and QC report outbreaks in hospitals. Outbreaks of influenza or influenza-like-illness in other facilities are reported to FluWatch but reporting varies between jurisdictions. Outbreak definitions are included at the end of this report.
 Figure 6 - Text Description
  The shaded area represents the maximum and minimum number of cases reported by week from seasons 2010-11 to 2015-16.
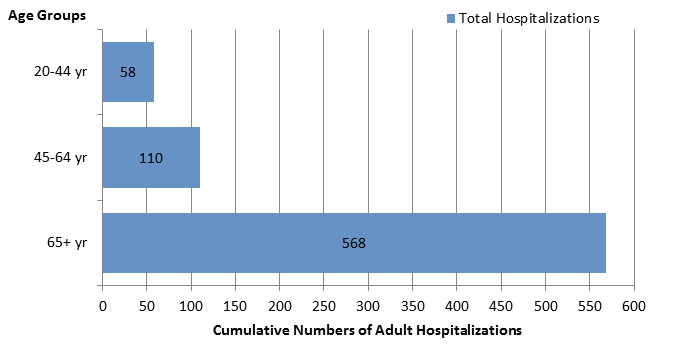 Figure 8 - Text Description
 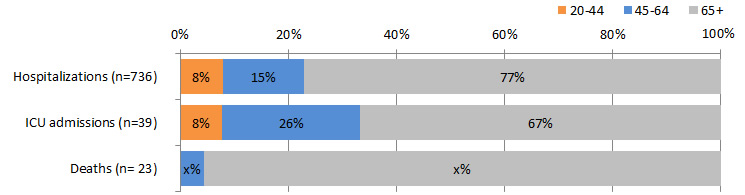 The number of hospitalizations reported through CIRN represents a subset of all influenza-associated adult hospitalizations in Canada. Delays in the reporting of data may cause data to change retrospectively.


 The shaded area indicates weeks where the positivity rate was at least 5% and a minimum of 15 positive tests were observed, signalling the start and end of
 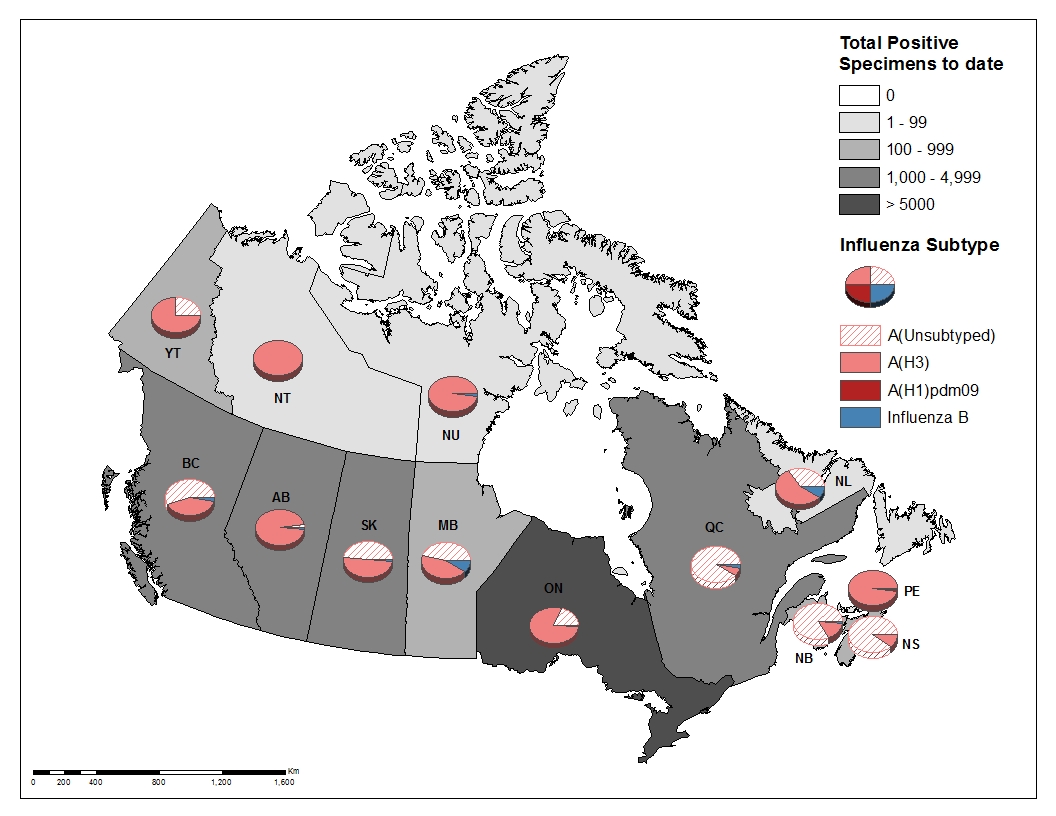 Figure 3 - Text Description
  Delays in the reporting of data may cause data to change retrospectively. In BC, AB, and SK, data are compiled by a provincial sentinel surveillance program for reporting to FluWatch. Not all sentinel physicians report every week.
 Figure 5 - Footnote 1 All provinces and territories except NU report influenza outbreaks in long-term care facilities. All provinces and territories with the exception of NU and QC report outbreaks in hospitals. Outbreaks of influenza or influenza-like-illness in other facilities are reported to FluWatch but reporting varies between jurisdictions. Outbreak definitions are included at the end of this report.
 Figure 6 - Text Description
  The shaded area represents the maximum and minimum number of cases reported by week from seasons 2010-11 to 2015-16.
 Figure 8 - Text Description
  The number of hospitalizations reported through CIRN represents a subset of all influenza-associated adult hospitalizations in Canada. Delays in the reporting of data may cause data to change retrospectively.


 The shaded area indicates weeks where the positivity rate was at least 5% and a minimum of 15 positive tests were observed, signalling the start and end of
  Figure 3 - Text Description To date this season, detailed information on age and type/subtype has been received for 6,879 laboratory confirmed influenza cases. Adults aged 65+ were the age group that accounted for the largest proportion of reported influenza cases (>45%) and the largest proportion of influenza A (H3N2) cases. Compared to the cases reported in the 2014-15 season at week 53, adults aged 65+ account for a smaller proportion of cases this season (approximately 45% in 2016-17 compared to 62% in 2014-15). Adults aged 45-64 account for a greater proportion of cases this season (approximately 46% in 2016-17 compared to 63% in 2014-15).
 Figure 5 - Footnote 1 All provinces and territories except NU report influenza outbreaks in long-term care facilities. All provinces and territories with the exception of NU and QC report outbreaks in hospitals. Outbreaks of influenza or influenza-like-illness in other facilities are reported to FluWatch but reporting varies between jurisdictions. Outbreak definitions are included at the end of this report.
 Figure 6 - Text Description Figure 7 - Number of pediatric (≤16 years of age) hospitalizations reported by IMPACT sentinel hospital network, by week, Canada, 2016-17, Week 1
  The shaded area represents the maximum and minimum number of cases reported by week from seasons 2010-11 to 2015-16.
 Figure 8 - Text Description Figure 9 - Percentage of hospitalizations, ICU admissions and deaths with influenza reported by age-group (≥16 year of age), Canada 2015-16, Week 1
  The number of hospitalizations reported through CIRN represents a subset of all influenza-associated adult hospitalizations in Canada. Delays in the reporting of data may cause data to change retrospectively.

 The shaded area indicates weeks where the positivity rate was at least 5% and a minimum of 15 positive tests were observed, signalling the start and end of
  Figure 3 - Text Description To date this season, detailed information on age and type/subtype has been received for 5,008 laboratory confirmed influenza cases. Adults aged 65+ were the age group that accounted for the largest proportion of reported influenza cases (>45%) and the largest proportion of influenza A (H3N2) cases. Compared to the cases reported in the 2014-15 season at week 52, adults aged 65+ account for a smaller proportion of cases this season (approximately 45% in 2016-17 compared to 62% in 2014-15). Adults aged 45-64 account for a greater proportion of cases this season (approximately 23% in 2016-17 compared to 12% in 2014-15).
 Figure 5 - Footnote 1 All provinces and territories except NU report influenza outbreaks in long-term care facilities. All provinces and territories with the exception of NU and QC report outbreaks in hospitals. Outbreaks of influenza or influenza-like-illness in other facilities are reported to FluWatch but reporting varies between jurisdictions. Outbreak definitions are included at the end of this report.
 Figure 6 - Text Description Figure 7 - Number of pediatric (≤16 years of age) hospitalizations reported by IMPACT sentinel hospital network, by week, Canada, 2016-17, Weeks 51 & 52
  The shaded area represents the maximum and minimum number of cases reported by week from seasons 2010-11 to 2015-16.
 Figure 8 - Text Description Figure 9 - Percentage of hospitalizations, ICU admissions and deaths with influenza reported by age-group (≥16 year of age), Canada 2015-16, Week 52
  The number of hospitalizations reported through CIRN represents a subset of all influenza-associated adult hospitalizations in Canada. Delays in the reporting of data may cause data to change retrospectively.


 Figure 3 - Text Description To date this season, detailed information on age and type/subtype has been received for less than five cases.
 Figure 5 - Footnote 1 All provinces and territories except NU report influenza outbreaks in long-term care facilities. All provinces and territories with the exception of NU and QC report outbreaks in hospitals. Outbreaks of influenza or influenza-like-illness in other facilities are reported to FluWatch but reporting varies between jurisdictions. Outbreak definitions are included at the end of this report.
Leave a comment: