
Install the app
How to install the app on iOS
Follow along with the video below to see how to install our site as a web app on your home screen.
Note: This feature may not be available in some browsers.
-
FluTrackers.com Inc. does not provide medical advice. Information on this web site is collected from various internet resources, and the FluTrackers board of directors makes no warranty to the safety, efficacy, correctness or completeness of the information posted on this site by any author or poster. The information collated here is for instructional and/or discussion purposes only and is NOT intended to diagnose or treat any disease, illness, or other medical condition. Every individual reader or poster should seek advice from their personal physician/healthcare practitioner before considering or using any interventions that are discussed on this website. By continuing to access this website you agree to consult your personal physican before using any interventions posted on this website, and you agree to hold harmless FluTrackers.com Inc., the board of directors, the members, and all authors and posters for any effects from use of any medication, supplement, vitamin or other substance, device, intervention, etc. mentioned in posts on this website, or other internet venues referenced in posts on this website.
-
We are not asking for any donations. Do not donate to any entity who says they are raising funds for us.
You are using an out of date browser. It may not display this or other websites correctly.
You should upgrade or use an alternative browser.
You should upgrade or use an alternative browser.
Yearly Averaged Sunspot Numbers 1610 to 2000
- Thread starter Snowy Owl
- Start date

Snowy Owl
Retired in 2010, In Memoriam
Re: Yearly Averaged Sunspot Numbers 1610 to 2000
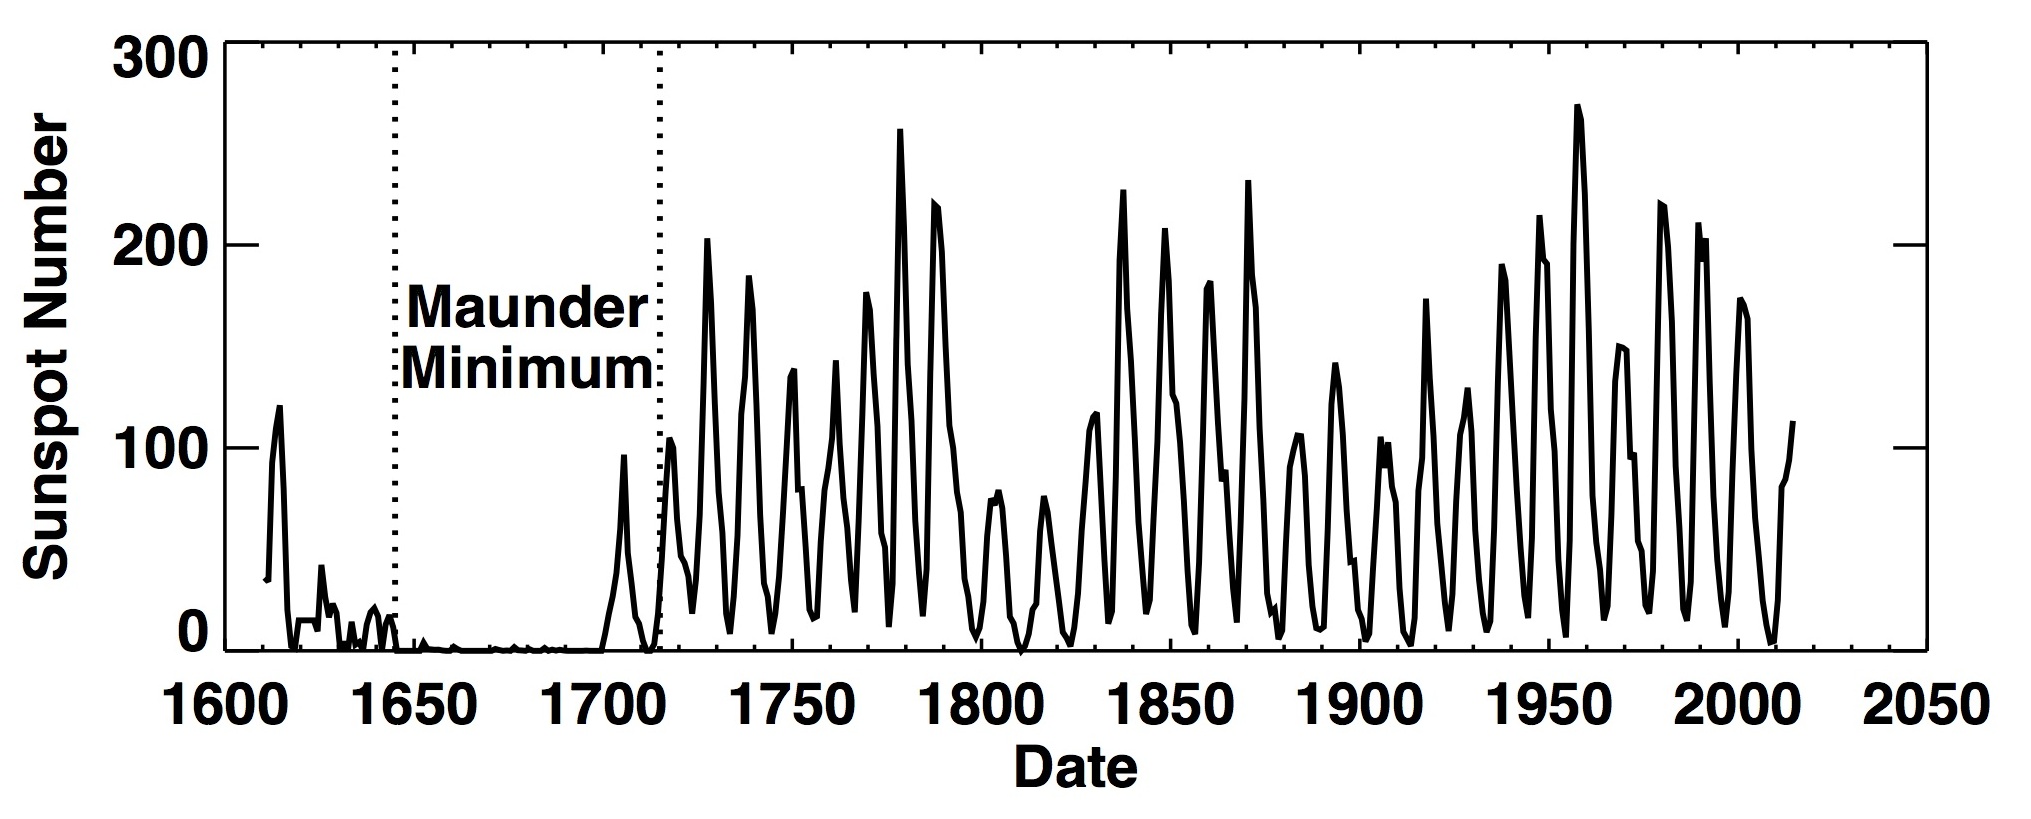
The Maunder Minimum
The Maunder Minimum
Early records of sunspots indicate that the Sun went through a period of inactivity in the late 17th century. Very few sunspots were seen on the Sun from about 1645 to 1715 (38 kb JPEG image). Although the observations were not as extensive as in later years, the Sun was in fact well observed during this time and this lack of sunspots is well documented. This period of solar inactivity also corresponds to a climatic period called the "Little Ice Age" when rivers that are normally ice-free froze and snow fields remained year-round at lower altitudes. There is evidence that the Sun has had similar periods of inactivity in the more distant past. The connection between solar activity and terrestrial climate is an area of on-going research.
http://solarscience.msfc.nasa.gov/SunspotCycle.shtml
http://solarscience.msfc.nasa.gov/SunspotCycle.shtml
Snowy Owl
Retired in 2010, In Memoriam
Re: Yearly Averaged Sunspot Numbers 1610 to 2000
cf: http://www.flutrackers.com/forum/showthread.php?t=6020&highlight=defoe
cf: http://www.flutrackers.com/forum/showthread.php?t=6020&highlight=defoe

Commonground
Senior Moderator
Re: Yearly Averaged Sunspot Numbers 1610 to 2000
2008 outbreak of avian flu four conditions
2008-04-06
Sunspots, relatively few Valley is 2006 m or 2007 ?
-- 2008 outbreak of bird flu four conditions Yang Xuexiang
In the spring of 2005 disaster forecast Professional Committee, the astronomers believe that Mr. Zhang Yuandong sunspot 23 weeks in the Valley (m) in around 2007, then 2006 is likely to phase m-1, or m. Sunspots, relatively few Valley is 2006 m or
2007 significant, relevant forecast is necessary.
Recent studies show that not only influenza outbreak occurred in the strongest period of solar activity, but also in the weakest period of solar activity. 1889-1890, the world's first influenza pandemic in sunspot activity is low period (1889 to 6.3;
In 1890 to 7.1) ,1918-1919 "Spanish flu" that is the second time the world influenza pandemic of sunspot activity, high-value period (1917 to 103.9; 1918 was 80.6; 1919 was 63.6), 1957-1958 "Asian flu" as the highest value of sunspot activity period (1957 to 190.2; in 1958 to 184.8), 1968-1969 "Hong Kong flu" as the highest value of sunspot activity period (1968 to 105.9; 1969 For 105.5), 1977, "Russian flu"
The low sunspot activity for the period (1976 to 12.6; 1977 to 27.5) [1].
Sunspot period of extreme northeast China and the chilling damage a very good relationship. 1918-1919, ,1957-1958,
1968-1969 the corresponding period of sunspot high value in 1917, 1957 and 1969 the serious chilling damage, ,1976-1977
In the corresponding period of low sunspot in 1976 a serious chilling damage, [2].
Avian influenza in La Nina years gestation, the outbreak of the El Nino years. 1889-1890 (the first time the world of influenza pandemic),
1918-1919 (second world influenza pandemic) ,1957-1958 (Asian flu), 1968-1969 (Hong Kong influenza), 1972-1973 and 1976-1977 (Russian influenza), are El Nino (which, 1888 --
1889 is the El Nino), and 1886-1887, ,1916-1917 ,1955-1956 ,1967-1968,
1975-1976 La Nina are in [3].
1886-1887, 1988-90, is La Nina, El Nino year-1889, 1889, for the sunspot-m ,1889-1890
The influenza outbreak of 1916-1917, is La Nina, 1917 for the sunspot peak, M, cold, influenza孕育; 1918
As the M +1 years, El Nino, the influenza outbreak of 1954-1956, is La Nina years, respectively-year sunspot m, m +1
Years, M-1, ,1957-1958 as the El Nino and the outbreak of influenza, which are the sunspot peak, M and M +1, 1957
In cold, the flu outbreak; 1967-1968 is La Nina years, influenza孕育; 1968-1969 El Nino is,
1968 for the sunspot peak, M, influenza outbreak in 1969 for the low-temperature; 1975-1976 are La Nina years, 1975 is m-1; 1976-1977 El Nino is, in 1976, is the sunspot-m , Low temperature, 1977 is m +1, the influenza outbreak.
Influenza outbreak in the following characteristics: a year or two years ago for La Nina, the previous year or the year after the low temperature, then to El Nino years, when the sunspot peak or valley, m, M, m +1, Or M +1 years.
If 2007 is the year sunspot-m ,2006-2007-year forecast for La Nina years, 2008 is m +1, is forecast to El Nino, the cold phase in Lamadelei during the El Nino years (2000-2030 year) Sunspots, and prone to extreme chilling damage. In this way, in 2008 to have a high probability of an influenza outbreak.
If 2006 is the year sunspot-m, 2008 outbreak of influenza on the possibility of smaller. 2007, is the sunspot-m,
2006-2007 for La Nina, El Nino events occurred in 2008 and chilling damage, is the 2008 outbreak of avian flu as the four conditions.
http://64.233.179.104/translate_c?h...jshealth.com/jscdcnew/ShowZtNews.aspx?Id=2952
2008 outbreak of avian flu four conditions
2008-04-06
Sunspots, relatively few Valley is 2006 m or 2007 ?
-- 2008 outbreak of bird flu four conditions Yang Xuexiang
In the spring of 2005 disaster forecast Professional Committee, the astronomers believe that Mr. Zhang Yuandong sunspot 23 weeks in the Valley (m) in around 2007, then 2006 is likely to phase m-1, or m. Sunspots, relatively few Valley is 2006 m or
2007 significant, relevant forecast is necessary.
Recent studies show that not only influenza outbreak occurred in the strongest period of solar activity, but also in the weakest period of solar activity. 1889-1890, the world's first influenza pandemic in sunspot activity is low period (1889 to 6.3;
In 1890 to 7.1) ,1918-1919 "Spanish flu" that is the second time the world influenza pandemic of sunspot activity, high-value period (1917 to 103.9; 1918 was 80.6; 1919 was 63.6), 1957-1958 "Asian flu" as the highest value of sunspot activity period (1957 to 190.2; in 1958 to 184.8), 1968-1969 "Hong Kong flu" as the highest value of sunspot activity period (1968 to 105.9; 1969 For 105.5), 1977, "Russian flu"
The low sunspot activity for the period (1976 to 12.6; 1977 to 27.5) [1].
Sunspot period of extreme northeast China and the chilling damage a very good relationship. 1918-1919, ,1957-1958,
1968-1969 the corresponding period of sunspot high value in 1917, 1957 and 1969 the serious chilling damage, ,1976-1977
In the corresponding period of low sunspot in 1976 a serious chilling damage, [2].
Avian influenza in La Nina years gestation, the outbreak of the El Nino years. 1889-1890 (the first time the world of influenza pandemic),
1918-1919 (second world influenza pandemic) ,1957-1958 (Asian flu), 1968-1969 (Hong Kong influenza), 1972-1973 and 1976-1977 (Russian influenza), are El Nino (which, 1888 --
1889 is the El Nino), and 1886-1887, ,1916-1917 ,1955-1956 ,1967-1968,
1975-1976 La Nina are in [3].
1886-1887, 1988-90, is La Nina, El Nino year-1889, 1889, for the sunspot-m ,1889-1890
The influenza outbreak of 1916-1917, is La Nina, 1917 for the sunspot peak, M, cold, influenza孕育; 1918
As the M +1 years, El Nino, the influenza outbreak of 1954-1956, is La Nina years, respectively-year sunspot m, m +1
Years, M-1, ,1957-1958 as the El Nino and the outbreak of influenza, which are the sunspot peak, M and M +1, 1957
In cold, the flu outbreak; 1967-1968 is La Nina years, influenza孕育; 1968-1969 El Nino is,
1968 for the sunspot peak, M, influenza outbreak in 1969 for the low-temperature; 1975-1976 are La Nina years, 1975 is m-1; 1976-1977 El Nino is, in 1976, is the sunspot-m , Low temperature, 1977 is m +1, the influenza outbreak.
Influenza outbreak in the following characteristics: a year or two years ago for La Nina, the previous year or the year after the low temperature, then to El Nino years, when the sunspot peak or valley, m, M, m +1, Or M +1 years.
If 2007 is the year sunspot-m ,2006-2007-year forecast for La Nina years, 2008 is m +1, is forecast to El Nino, the cold phase in Lamadelei during the El Nino years (2000-2030 year) Sunspots, and prone to extreme chilling damage. In this way, in 2008 to have a high probability of an influenza outbreak.
If 2006 is the year sunspot-m, 2008 outbreak of influenza on the possibility of smaller. 2007, is the sunspot-m,
2006-2007 for La Nina, El Nino events occurred in 2008 and chilling damage, is the 2008 outbreak of avian flu as the four conditions.
http://64.233.179.104/translate_c?h...jshealth.com/jscdcnew/ShowZtNews.aspx?Id=2952
Re: Yearly Averaged Sunspot Numbers 1610 to 2000
June 11, 2008
The Sunspot Enigma: The Sun is ?Dead??What Does it Mean for Earth?
Dark spots, some as large as 50,000 miles in diameter, typically move across the surface of the sun, contracting and expanding as they go. These strange and powerful phenomena are known as sunspots, but now they are all gone. Not even solar physicists know why it?s happening and what this odd solar silence might be indicating for our future.
Although periods of inactivity are normal for the sun, this current period has gone on much longer than usual and scientists are starting to worry?at least a little bit. Recently 100 scientists from Europe, Asia, Latin America, Africa and North America gathered to discuss the issue at an international solar conference at Montana State University. Today's sun is as inactive as it was two years ago, and solar physicists don?t have a clue as to why.
"It continues to be dead," said Saku Tsuneta with the National Astronomical Observatory of Japan, program manager for the Hinode solar mission, noting that it is at least a little bit worrisome for scientists.
Dana Longcope, a solar physicist at MSU, said the sun usually operates on an 11-year cycle with maximum activity occurring in the middle of the cycle. The last cycle reached its peak in 2001 and is believed to be just ending now, Longcope said. The next cycle is just beginning and is expected to reach its peak sometime around 2012. But so far nothing is happening.
"It's a dead face," Tsuneta said of the sun's appearance.
Tsuneta said solar physicists aren't weather forecasters and they can't predict the future. They do have the ability to observe, however, and they have observed a longer-than-normal period of solar inactivity. In the past, they observed that the sun once went 50 years without producing sunspots. That period coincided with a little ice age on Earth that lasted from 1650 to 1700. Coincidence? Some scientists say it was, but many worry that it wasn?t.
Geophysicist Phil Chapman, the first Australian to become an astronaut with NASA, said pictures from the US Solar and Heliospheric Observatory also show that there are currently no spots on the sun. He also noted that the world cooled quickly between January last year and January this year, by about 0.7C.
"This is the fastest temperature change in the instrumental record, and it puts us back to where we were in 1930," Dr Chapman noted in The Australian recently.
If the world does face another mini Ice Age, it could come without warning. Evidence for abrupt climate change is readily found in ice cores taken from Greenland and Antarctica. One of the best known examples of such an event is the Younger Dryas cooling, which occurred about 12,000 years ago, named after the arctic wildflower found in northern European sediments. This event began and ended rather abruptly, and for its entire 1000 year duration the North Atlantic region was about 5?C colder. Could something like this happen again? There?s no way to tell, and because the changes can happen all within one decade?we might not even see it coming.
The Younger Dryas occurred at a time when orbital forcing should have continued to drive climate to the present warm state. The unexplained phenomenon has been the topic of much intense scientific debate, as well as other millennial scale events.
Now this 11-year low in Sunspot activity has raised fears among a small but growing number of scientists that rather than getting warmer, the Earth could possibly be about to return to another cooling period. The idea is especially intriguing considering that most of the world is in preparation for global warming.
Canadian scientist Kenneth Tapping of the National Research Council has also noted that solar activity has entered into an unusually inactive phase, but what that means?if anything?is still anyone?s guess. Another solar scientist, Oleg Sorokhtin, a fellow of the Russian Academy of Natural Sciences, however, is certain that it?s an indication of a coming cooling period.
Sorokhtin believes that a lack of sunspots does indicate a coming cooling period based on certain past trends and early records. In fact, he calls manmade climate change "a drop in the bucket" compared to the fierce and abrupt cold that can potentially be brought on by inactive solar phases.
Sorokhtin?s advice: "Stock up on fur coats"?just in case.
Posted by Rebecca Sato
Sources:
http://www.montana.edu/cpa/news/nwview.php?article=5982&log
http://solarscience.msfc.nasa.gov/SunspotCycle.shtml
http://www.theaustralian.news.com.au/story/0,25197,23584524-11949,00.html
http://www.dailygalaxy.com/my_weblog/2008/06/the-sunspot-mys.html
June 11, 2008
The Sunspot Enigma: The Sun is ?Dead??What Does it Mean for Earth?
Dark spots, some as large as 50,000 miles in diameter, typically move across the surface of the sun, contracting and expanding as they go. These strange and powerful phenomena are known as sunspots, but now they are all gone. Not even solar physicists know why it?s happening and what this odd solar silence might be indicating for our future.
Although periods of inactivity are normal for the sun, this current period has gone on much longer than usual and scientists are starting to worry?at least a little bit. Recently 100 scientists from Europe, Asia, Latin America, Africa and North America gathered to discuss the issue at an international solar conference at Montana State University. Today's sun is as inactive as it was two years ago, and solar physicists don?t have a clue as to why.
"It continues to be dead," said Saku Tsuneta with the National Astronomical Observatory of Japan, program manager for the Hinode solar mission, noting that it is at least a little bit worrisome for scientists.
Dana Longcope, a solar physicist at MSU, said the sun usually operates on an 11-year cycle with maximum activity occurring in the middle of the cycle. The last cycle reached its peak in 2001 and is believed to be just ending now, Longcope said. The next cycle is just beginning and is expected to reach its peak sometime around 2012. But so far nothing is happening.
"It's a dead face," Tsuneta said of the sun's appearance.
Tsuneta said solar physicists aren't weather forecasters and they can't predict the future. They do have the ability to observe, however, and they have observed a longer-than-normal period of solar inactivity. In the past, they observed that the sun once went 50 years without producing sunspots. That period coincided with a little ice age on Earth that lasted from 1650 to 1700. Coincidence? Some scientists say it was, but many worry that it wasn?t.
Geophysicist Phil Chapman, the first Australian to become an astronaut with NASA, said pictures from the US Solar and Heliospheric Observatory also show that there are currently no spots on the sun. He also noted that the world cooled quickly between January last year and January this year, by about 0.7C.
"This is the fastest temperature change in the instrumental record, and it puts us back to where we were in 1930," Dr Chapman noted in The Australian recently.
If the world does face another mini Ice Age, it could come without warning. Evidence for abrupt climate change is readily found in ice cores taken from Greenland and Antarctica. One of the best known examples of such an event is the Younger Dryas cooling, which occurred about 12,000 years ago, named after the arctic wildflower found in northern European sediments. This event began and ended rather abruptly, and for its entire 1000 year duration the North Atlantic region was about 5?C colder. Could something like this happen again? There?s no way to tell, and because the changes can happen all within one decade?we might not even see it coming.
The Younger Dryas occurred at a time when orbital forcing should have continued to drive climate to the present warm state. The unexplained phenomenon has been the topic of much intense scientific debate, as well as other millennial scale events.
Now this 11-year low in Sunspot activity has raised fears among a small but growing number of scientists that rather than getting warmer, the Earth could possibly be about to return to another cooling period. The idea is especially intriguing considering that most of the world is in preparation for global warming.
Canadian scientist Kenneth Tapping of the National Research Council has also noted that solar activity has entered into an unusually inactive phase, but what that means?if anything?is still anyone?s guess. Another solar scientist, Oleg Sorokhtin, a fellow of the Russian Academy of Natural Sciences, however, is certain that it?s an indication of a coming cooling period.
Sorokhtin believes that a lack of sunspots does indicate a coming cooling period based on certain past trends and early records. In fact, he calls manmade climate change "a drop in the bucket" compared to the fierce and abrupt cold that can potentially be brought on by inactive solar phases.
Sorokhtin?s advice: "Stock up on fur coats"?just in case.
Posted by Rebecca Sato
Sources:
http://www.montana.edu/cpa/news/nwview.php?article=5982&log
http://solarscience.msfc.nasa.gov/SunspotCycle.shtml
http://www.theaustralian.news.com.au/story/0,25197,23584524-11949,00.html
http://www.dailygalaxy.com/my_weblog/2008/06/the-sunspot-mys.html
Re: Yearly Averaged Sunspot Numbers 1610 to 2000
(Link to the actual paper is in the article)
http://wattsupwiththat.wordpress.co...n-and-penn-paper-sunspots-may-vanish-by-2015/
Livingston and Penn paper: ?Sunspots may vanish by 2015″
[snip] The ordinate is chosen so that 1500 G is the minimum. A linear fit to the changing magnetic field produces a slope of 77 Gauss per year, and intercepts the abscissa at 2015. If the present trend continues, this date is when sunspots will disappear from the solar surface.
Let us all hope that they are wrong, for a solar epoch period like the Maunder Minimum inducing a Little Ice Age will be a worldwide catastrophe economically, socially, environmentally, and morally.
I?m still very much concerned about the apparent step change in 2005 to a lower plateau of the Geomagnetic Average Planetary (Ap) index, that I?ve plotted below. This is something that does not appear in the previous cycle:

What is most interesting about the Geomagnetic Average Planetary Index graph above is what happened around October 2005. Notice the sharp drop in the magnetic index and the continuance at low levels, almost as if something ?switched off?.
(Link to the actual paper is in the article)
http://wattsupwiththat.wordpress.co...n-and-penn-paper-sunspots-may-vanish-by-2015/
Livingston and Penn paper: ?Sunspots may vanish by 2015″
[snip] The ordinate is chosen so that 1500 G is the minimum. A linear fit to the changing magnetic field produces a slope of 77 Gauss per year, and intercepts the abscissa at 2015. If the present trend continues, this date is when sunspots will disappear from the solar surface.
Let us all hope that they are wrong, for a solar epoch period like the Maunder Minimum inducing a Little Ice Age will be a worldwide catastrophe economically, socially, environmentally, and morally.
I?m still very much concerned about the apparent step change in 2005 to a lower plateau of the Geomagnetic Average Planetary (Ap) index, that I?ve plotted below. This is something that does not appear in the previous cycle:
What is most interesting about the Geomagnetic Average Planetary Index graph above is what happened around October 2005. Notice the sharp drop in the magnetic index and the continuance at low levels, almost as if something ?switched off?.

Oracle
Well-known member
Re: Yearly Averaged Sunspot Numbers 1610 to 2000
A decrease in sunspot activity is NOT the same as an absence of sunspot activity. The former, not the latter, describes inter-cycle nominal activity of the last year.
There hasn't been any indication of a total cessation of solar activity. In fact, we have observed large, short-term spikes of sunspot activity that hint at the strength of the upcoming cycle 24, over the last seven months. Solar cycle length and peak SS number are well-known to vary over much longer periods of cyclic solar variation. The average solar cycle recently has been 11 years, but it can be as short as 8-9 and as long as 14 years.
A decrease in sunspot activity is NOT the same as an absence of sunspot activity. The former, not the latter, describes inter-cycle nominal activity of the last year.
There hasn't been any indication of a total cessation of solar activity. In fact, we have observed large, short-term spikes of sunspot activity that hint at the strength of the upcoming cycle 24, over the last seven months. Solar cycle length and peak SS number are well-known to vary over much longer periods of cyclic solar variation. The average solar cycle recently has been 11 years, but it can be as short as 8-9 and as long as 14 years.
Re: Yearly Averaged Sunspot Numbers 1610 to 2000
Sun goes longer than normal without producing sunspots
[snips]
BOZEMAN -- The sun has been laying low for the past couple of years, producing no sunspots and giving a break to satellites.
The scientists said periods of inactivity are normal for the sun, but this period has gone on longer than usual.
"It continues to be dead," said Saku Tsuneta with the National Astronomical Observatory of Japan, program manager for the Hinode solar mission. "That's a small concern, a very small concern."
Today's sun, however, is as inactive as it was two years ago, and scientists aren't sure why.
"It's a dead face," Tsuneta said of the sun's appearance.
http://www.montana.edu/cpa/news/nwview.php?article=5982&log
-------------------------------------------------------------------------
As I interpret these articles, it isn't a decreased activity that is of interest; it's *no* activity. On the prediction graphs, it looks like there are multiple sunspots occurring in every year regardless of what part of the cycle they are in. (Edited to add: unless the monthly values are not indications of the numbers of sunspots?)

http://www.swpc.noaa.gov/SolarCycle/SC24/index.html
Sun goes longer than normal without producing sunspots
[snips]
BOZEMAN -- The sun has been laying low for the past couple of years, producing no sunspots and giving a break to satellites.
The scientists said periods of inactivity are normal for the sun, but this period has gone on longer than usual.
"It continues to be dead," said Saku Tsuneta with the National Astronomical Observatory of Japan, program manager for the Hinode solar mission. "That's a small concern, a very small concern."
Today's sun, however, is as inactive as it was two years ago, and scientists aren't sure why.
"It's a dead face," Tsuneta said of the sun's appearance.
http://www.montana.edu/cpa/news/nwview.php?article=5982&log
-------------------------------------------------------------------------
As I interpret these articles, it isn't a decreased activity that is of interest; it's *no* activity. On the prediction graphs, it looks like there are multiple sunspots occurring in every year regardless of what part of the cycle they are in. (Edited to add: unless the monthly values are not indications of the numbers of sunspots?)
http://www.swpc.noaa.gov/SolarCycle/SC24/index.html

sharon sanders
Editor-in-Chief & President
Re: Yearly Averaged Sunspot Numbers 1610 to 2000
Hat-Tip to ElDotDa
At solarcycle24.forumco.com
The year 1889 was very near to a solar minimum. Have you heard of Svensmark's recent research showing that higher amounts of cosmic rays reach the surface of the earth at times when the sun is quiet (few or no sunspots). When cosmic rays do that, the tend to cause the formation of greater numbers of clouds at lower levels, which leads to more precipitation events. We are in a solar minimum now. The sun has been very quiet for most of the last 2 years. Precipitation patterns have changed since the sun got so quiet. We have had much more precipitation in Oklahoma (as have many other areas), although the Desert Southwest has had less.
Celtic
<!-- / message --><!-- sig -->
Hat-Tip to ElDotDa
At solarcycle24.forumco.com
The year 1889 was very near to a solar minimum. Have you heard of Svensmark's recent research showing that higher amounts of cosmic rays reach the surface of the earth at times when the sun is quiet (few or no sunspots). When cosmic rays do that, the tend to cause the formation of greater numbers of clouds at lower levels, which leads to more precipitation events. We are in a solar minimum now. The sun has been very quiet for most of the last 2 years. Precipitation patterns have changed since the sun got so quiet. We have had much more precipitation in Oklahoma (as have many other areas), although the Desert Southwest has had less.
Celtic
<!-- / message --><!-- sig -->
Last edited:
sharon sanders
Editor-in-Chief & President
Re: Yearly Averaged Sunspot Numbers 1610 to 2000
Hat tip Celtic -
According to http://www.spaceweather.com/java/sunspot.html, those years were classified as either sunspot minima or maxima:
1889-1890 ... minimum
1918-1920 ... maximum (complicated by "disposal" of chemical weapons)*
1957 ... maximum
1968 ... maximum
2008-2009 ... minimum
Hat tip Celtic -
According to http://www.spaceweather.com/java/sunspot.html, those years were classified as either sunspot minima or maxima:
1889-1890 ... minimum
1918-1920 ... maximum (complicated by "disposal" of chemical weapons)*
1957 ... maximum
1968 ... maximum
2008-2009 ... minimum
Oracle
Well-known member
What's Wrong with the Sun? (Nothing)
What's Wrong with the Sun? (Nothing)

July 11, 2008
http://www.physorg.com/news134996857.html
Stop the presses! The sun is behaving normally. So says NASA solar physicist David Hathaway. "There have been some reports lately that Solar Minimum is lasting longer than it should. That's not true. The ongoing lull in sunspot number is well within historic norms for the solar cycle."
This report, that there's nothing to report, is newsworthy because of a growing buzz in lay and academic circles that something is wrong with the sun. Sun Goes Longer Than Normal Without Producing Sunspots declared one recent press release. A careful look at the data, however, suggests otherwise.
But first, a status report: "The sun is now near the low point of its 11-year activity cycle," says Hathaway. "We call this 'Solar Minimum.' It is the period of quiet that separates one Solar Max from another."
During Solar Max, huge sunspots and intense solar flares are a daily occurance. Auroras appear in Florida. Radiation storms knock out satellites. Radio blackouts frustrate hams. The last such episode took place in the years around 2000-2001.
During Solar Minimum, the opposite occurs. Solar flares are almost non-existant while whole weeks go by without a single, tiny sunspot to break the monotony of the blank sun. This is what we are experiencing now.
Although minima are a normal aspect of the solar cycle, some observers are questioning the length of the ongoing minimum, now slogging through its 3rd year.
"It does seem like it's taking a long time," allows Hathaway, "but I think we're just forgetting how long a solar minimum can last." In the early 20th century there were periods of quiet lasting almost twice as long as the current spell. Most researchers weren't even born then.
Hathaway has studied international sunspot counts stretching all the way back to 1749 and he offers these statistics: "The average period of a solar cycle is 131 months with a standard deviation of 14 months. Decaying solar cycle 23 (the one we are experiencing now) has so far lasted 142 months--well within the first standard deviation and thus not at all abnormal. The last available 13-month smoothed sunspot number was 5.70. This is bigger than 12 of the last 23 solar minimum values."
In summary, "the current minimum is not abnormally low or long."
The longest minimum on record, the Maunder Minimum of 1645-1715, lasted an incredible 70 years. Sunspots were rarely observed and the solar cycle seemed to have broken down completely. The period of quiet coincided with the Little Ice Age, a series of extraordinarily bitter winters in Earth's northern hemisphere. Many researchers are convinced that low solar activity, acting in concert with increased volcanism and possible changes in ocean current patterns, played a role in that 17th century cooling.
For reasons no one understands, the sunspot cycle revived itself in the early 18th century and has carried on since with the familiar 11-year period. Because solar physicists do not understand what triggered the Maunder Minimum or exactly how it influenced Earth's climate, they are always on the look-out for signs that it might be happening again.
The quiet of 2008 is not the second coming of the Maunder Minimum, believes Hathaway. "We have already observed a few sunspots from the next solar cycle," he says. "This suggests the solar cycle is progressing normally."
What's next? Hathaway anticipates more spotless days, maybe even hundreds, followed by a return to Solar Max conditions in the years around 2012.
Source: Science@NASA, by Dr. Tony Phillips
The large graph of sunspot activity (posted by Mixin) clearly shows the expected minimum running from 2007-2009.
"no hocus-pokus required" (Niman, 2008)
What's Wrong with the Sun? (Nothing)
July 11, 2008
http://www.physorg.com/news134996857.html
Stop the presses! The sun is behaving normally. So says NASA solar physicist David Hathaway. "There have been some reports lately that Solar Minimum is lasting longer than it should. That's not true. The ongoing lull in sunspot number is well within historic norms for the solar cycle."
This report, that there's nothing to report, is newsworthy because of a growing buzz in lay and academic circles that something is wrong with the sun. Sun Goes Longer Than Normal Without Producing Sunspots declared one recent press release. A careful look at the data, however, suggests otherwise.
But first, a status report: "The sun is now near the low point of its 11-year activity cycle," says Hathaway. "We call this 'Solar Minimum.' It is the period of quiet that separates one Solar Max from another."
During Solar Max, huge sunspots and intense solar flares are a daily occurance. Auroras appear in Florida. Radiation storms knock out satellites. Radio blackouts frustrate hams. The last such episode took place in the years around 2000-2001.
During Solar Minimum, the opposite occurs. Solar flares are almost non-existant while whole weeks go by without a single, tiny sunspot to break the monotony of the blank sun. This is what we are experiencing now.
Although minima are a normal aspect of the solar cycle, some observers are questioning the length of the ongoing minimum, now slogging through its 3rd year.
"It does seem like it's taking a long time," allows Hathaway, "but I think we're just forgetting how long a solar minimum can last." In the early 20th century there were periods of quiet lasting almost twice as long as the current spell. Most researchers weren't even born then.
Hathaway has studied international sunspot counts stretching all the way back to 1749 and he offers these statistics: "The average period of a solar cycle is 131 months with a standard deviation of 14 months. Decaying solar cycle 23 (the one we are experiencing now) has so far lasted 142 months--well within the first standard deviation and thus not at all abnormal. The last available 13-month smoothed sunspot number was 5.70. This is bigger than 12 of the last 23 solar minimum values."
In summary, "the current minimum is not abnormally low or long."
The longest minimum on record, the Maunder Minimum of 1645-1715, lasted an incredible 70 years. Sunspots were rarely observed and the solar cycle seemed to have broken down completely. The period of quiet coincided with the Little Ice Age, a series of extraordinarily bitter winters in Earth's northern hemisphere. Many researchers are convinced that low solar activity, acting in concert with increased volcanism and possible changes in ocean current patterns, played a role in that 17th century cooling.
For reasons no one understands, the sunspot cycle revived itself in the early 18th century and has carried on since with the familiar 11-year period. Because solar physicists do not understand what triggered the Maunder Minimum or exactly how it influenced Earth's climate, they are always on the look-out for signs that it might be happening again.
The quiet of 2008 is not the second coming of the Maunder Minimum, believes Hathaway. "We have already observed a few sunspots from the next solar cycle," he says. "This suggests the solar cycle is progressing normally."
What's next? Hathaway anticipates more spotless days, maybe even hundreds, followed by a return to Solar Max conditions in the years around 2012.
Source: Science@NASA, by Dr. Tony Phillips
The large graph of sunspot activity (posted by Mixin) clearly shows the expected minimum running from 2007-2009.
"no hocus-pokus required" (Niman, 2008)