gsgs
Registered User
Re: Weekly MMWR (2011-2012) - Weeks 40-16 (Three Pediatric Deaths; Total 18)
Re: Weekly MMWR (2011-2012) - Weeks 40-16 (Three Pediatric Deaths; Total 18)
2012 links
http://wonder.cdc.gov/mmwr/mmwrmort.asp
New York:http://wonder.cdc.gov/mmwr/mmwr_rep...wr_location=New+York+City,+N.Y.&mmwr_table=4A
Boston:http://wonder.cdc.gov/mmwr/mmwr_rep...012&mmwr_location=Boston,+Mass.&mmwr_table=4A
Atlanta: http://wonder.cdc.gov/mmwr/mmwr_rep...2012&mmwr_location=Atlanta,+Ga.&mmwr_table=4A
El Paso: http://wonder.cdc.gov/mmwr/mmwr_rep...012&mmwr_location=El+Paso,+Tex.&mmwr_table=4A
USA:http://wonder.cdc.gov/mmwr/mmwr_rep...r_year=2012&mmwr_location=TOTAL&mmwr_table=4A
New England: http://wonder.cdc.gov/mmwr/mmwr_rep...=2012&mmwr_location=New+England&mmwr_table=4A
Mid-Atlantic:http://wonder.cdc.gov/mmwr/mmwr_rep...012&mmwr_location=MID.+ATLANTIC&mmwr_table=4A
S.Atlantic: http://wonder.cdc.gov/mmwr/mmwr_rep...=2012&mmwr_location=S.+ATLANTIC&mmwr_table=4A
W.N.Central: http://wonder.cdc.gov/mmwr/mmwr_rep...2012&mmwr_location=W.N.+CENTRAL&mmwr_table=4A
W.S.Central: http://wonder.cdc.gov/mmwr/mmwr_rep...2012&mmwr_location=W.S.+CENTRAL&mmwr_table=4A
E.N.Central: http://wonder.cdc.gov/mmwr/mmwr_rep...2012&mmwr_location=E.N.+CENTRAL&mmwr_table=4A
E.S.Central: http://wonder.cdc.gov/mmwr/mmwr_rep...2012&mmwr_location=E.S.+CENTRAL&mmwr_table=4A
Mountain: http://wonder.cdc.gov/mmwr/mmwr_rep...ear=2012&mmwr_location=Mountain&mmwr_table=4A
Pacific: http://wonder.cdc.gov/mmwr/mmwr_rep...year=2012&mmwr_location=Pacific&mmwr_table=4A
-------------------------------
adjusted (non-reports are estimated) MMWR-deaths
summer=weeks 17-42
winter= weeks 43-52(44-53) and weeks 1-16 the next year
year,season,all,>64,45-64,25-44,1-24,<1,P+I,(P+I)-ratio
total final deaths as reported by NCHS:
summer=May-Oct
winter=Nov-Apr next year
so we have the lowest adjusted 122-city winter-mortality (x1) since 1996, since when the data are
available at CDC-wonder. But the population of these 122-cities did presumably decline since 1996,
dying people are leaving the big cities.
Then we have the lowest 122-cities winter/summer draths-ratio (x2), which is unaffected by
such movements (unless they are just seasonal)
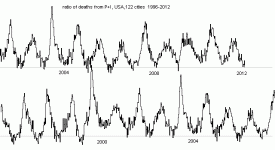
Then we had a very low P+I ratio this winter in the 122 cities (x3) and the lowest P+I winter/summer
ratio since 1996 (x4)
the MMWR P+I numbers are larger than the NCHS numbers, since they include all
death-certificates, where pneumonia or influenza is mentioned, even if only as secondary condition.
The NCHS numbers include only those which have pneumonia or influenza as primary
reason of death.
Re: Weekly MMWR (2011-2012) - Weeks 40-16 (Three Pediatric Deaths; Total 18)
2012 links
http://wonder.cdc.gov/mmwr/mmwrmort.asp
New York:http://wonder.cdc.gov/mmwr/mmwr_rep...wr_location=New+York+City,+N.Y.&mmwr_table=4A
Boston:http://wonder.cdc.gov/mmwr/mmwr_rep...012&mmwr_location=Boston,+Mass.&mmwr_table=4A
Atlanta: http://wonder.cdc.gov/mmwr/mmwr_rep...2012&mmwr_location=Atlanta,+Ga.&mmwr_table=4A
El Paso: http://wonder.cdc.gov/mmwr/mmwr_rep...012&mmwr_location=El+Paso,+Tex.&mmwr_table=4A
USA:http://wonder.cdc.gov/mmwr/mmwr_rep...r_year=2012&mmwr_location=TOTAL&mmwr_table=4A
New England: http://wonder.cdc.gov/mmwr/mmwr_rep...=2012&mmwr_location=New+England&mmwr_table=4A
Mid-Atlantic:http://wonder.cdc.gov/mmwr/mmwr_rep...012&mmwr_location=MID.+ATLANTIC&mmwr_table=4A
S.Atlantic: http://wonder.cdc.gov/mmwr/mmwr_rep...=2012&mmwr_location=S.+ATLANTIC&mmwr_table=4A
W.N.Central: http://wonder.cdc.gov/mmwr/mmwr_rep...2012&mmwr_location=W.N.+CENTRAL&mmwr_table=4A
W.S.Central: http://wonder.cdc.gov/mmwr/mmwr_rep...2012&mmwr_location=W.S.+CENTRAL&mmwr_table=4A
E.N.Central: http://wonder.cdc.gov/mmwr/mmwr_rep...2012&mmwr_location=E.N.+CENTRAL&mmwr_table=4A
E.S.Central: http://wonder.cdc.gov/mmwr/mmwr_rep...2012&mmwr_location=E.S.+CENTRAL&mmwr_table=4A
Mountain: http://wonder.cdc.gov/mmwr/mmwr_rep...ear=2012&mmwr_location=Mountain&mmwr_table=4A
Pacific: http://wonder.cdc.gov/mmwr/mmwr_rep...year=2012&mmwr_location=Pacific&mmwr_table=4A
-------------------------------
adjusted (non-reports are estimated) MMWR-deaths
summer=weeks 17-42
winter= weeks 43-52(44-53) and weeks 1-16 the next year
year,season,all,>64,45-64,25-44,1-24,<1,P+I,(P+I)-ratio
Code:
 1996 summer: 307475  203718  59419  28283  8543  7064  17550  571
 1996 winter: 332842  230047  61265  26179  7985  6884  24006  721

 1997 summer: 301458  202877  58272  24757  8425  6700  17550  582
 1997 winter: 333799  232648  62022  23985  7743  6856  24565  736

 1998 summer: 304827  206072  59378  23972  8034  6909  17997  590
 1998 winter: 335000  234653  62437  23420  7466  6633  24650  736

 1999 summer: 299149  202258  59424  22890  7676  6644  17665  591
 1999 winter: 338855  235737  65075  23494  7528  6827  28338  836

 2000 summer: 307059  207499  60879  23305  8248  6729  20272  660
 2000 winter: 333287  230587  64882  23244  7687  6586  24776  743

 2001 summer: 310175  209276  62242  23690  8221  6519  20015  645
 2001 winter: 329312  224959  65596  23919  7929  6675  24790  753

 2002 summer: 301505  200155  63219  22956  8213  6686  18887  626
 2002 winter: 322491  218949  65895  22358  8184  6738  23474  728

 2003 summer: 294364  194589  62689  21859  8027  6459  18563  631
 2003 winter: 337608  231020  69759  21916  7572  6652  26549  786

 2004 summer: 291705  193071  63947  20536  7705  6267  18236  625
 2004 winter: 321697  218941  68521  20444  7039  6367  24608  765

 2005 summer: 290894  190895  65325  20334  7737  6451  18054  621
 2005 winter: 315906  212137  69270  20466  7341  6492  22391  709

 2006 summer: 292471  191080  66763  20218  7674  6535  17388  595
 2006 winter: 314254  209872  70410  19962  7221  6675  21393  681

 2007 summer: 290717  189377  66462  20344  7644  6708  17437  600
 2007 winter: 316904  213532  70453  18906  6933  6895  23485  741

 2008 summer: 289320  188522  67685  19186  7256  6492  18283  632
 2008 winter: 312840  209294  71360  18841  6748  6503  21836  698

 2009 summer: 288347  187476  68618  18802  7070  6247  18407  638
 2009 winter: 305194  205143  70031  17682  6367  5693  22924  751

 2010 summer: 280336  184912  66487  16698  6564  5459  17934  640
 2010 winter: 309626  209420  71224  17349  6217  5272  23473  758

 2011 summer: 284801  187836  67573  17300  6562  5401  18333  644
 2011 winter: 298126  201173  68154  16950  6258  5420  20862  700

 2012 summer: (274070 ... 642 )
total final deaths as reported by NCHS:
summer=May-Oct
winter=Nov-Apr next year
Code:
year s(NCHS) w(NCHS)  w/s  sM     wM       w/s psM pwM pw/ps psN pwN pw/ps
--------------------------------------------------------------------------
1996 1094858 1227320 1.120 307475 332842 1.082 571 721 1.262 303 439 1.449
1997 1097784 1236451 1.126 301458 333799 1.107 582 736 1.264 311 463 1.487
1998 1110243 1259356 1.134 304827 335000 1.098 590 736 1.247 316 340 1.076
1999 1119077 1260203 1.126 299149 338855 1.132 591 836 1.414 204 312 1.531
2000 1142182 1265075 1.107 307059 333287 1.085 660 743 1.125 216 284 1.314
2001 1167124 1270837 1.088 310175 329312 1.061 645 753 1.167 228 302 1.322
2002 1161116 1261698 1.086 301505 322491 1.069 626 728 1.162 225 275 1.219
2003 1170091 1292784 1.104 294364 337608 1.146 631 786 1.245 223 300 1.346
2004 1145411 1283584 1.120 291705 321697 1.102 625 765 1.224 209 286 1.368
2005 1156150 1266169 1.095 290894 315906 1.085 621 709 1.141 207 260 1.253
2006 1167154 1266023 1.084 292471 314254 1.074 595 681 1.144 200 243 1.216
2007 1161398 1306103 1.124 290717 316904 1.090 600 741 1.235 189 253 1.338
2008 1167596 1264179 1.082 289320 312840 1.081 632 698 1.104 187 223 1.196
2009 1177474               288347 305194 1.058 638 751 1.177 191 215 1.125
2010                       280336 309626 1.104 640 758 1.184
2011                       284801 298126 1.046 644 700 1.086
                                    x1    x2        x3  x4
so we have the lowest adjusted 122-city winter-mortality (x1) since 1996, since when the data are
available at CDC-wonder. But the population of these 122-cities did presumably decline since 1996,
dying people are leaving the big cities.
Then we have the lowest 122-cities winter/summer draths-ratio (x2), which is unaffected by
such movements (unless they are just seasonal)
Then we had a very low P+I ratio this winter in the 122 cities (x3) and the lowest P+I winter/summer
ratio since 1996 (x4)
the MMWR P+I numbers are larger than the NCHS numbers, since they include all
death-certificates, where pneumonia or influenza is mentioned, even if only as secondary condition.
The NCHS numbers include only those which have pneumonia or influenza as primary
reason of death.