• FluTrackers.com Inc. does not provide medical advice. Information on this web site is collected from various internet resources, and the FluTrackers board of directors makes no warranty to the safety, efficacy, correctness or completeness of the information posted on this site by any author or poster. The information collated here is for instructional and/or discussion purposes only and is NOT intended to diagnose or treat any disease, illness, or other medical condition. Every individual reader or poster should seek advice from their personal physician/healthcare practitioner before considering or using any interventions that are discussed on this website. By continuing to access this website you agree to consult your personal physican before using any interventions posted on this website, and you agree to hold harmless FluTrackers.com Inc., the board of directors, the members, and all authors and posters for any effects from use of any medication, supplement, vitamin or other substance, device, intervention, etc. mentioned in posts on this website, or other internet venues referenced in posts on this website.
  • We are not asking for any donations. Do not donate to any entity who says they are raising funds for us.

Weekly MMWR (2010-11): Weeks 40-39 (No Pediatric Deaths)

Re: Weekly MMWR (2010-11): Weeks 40-4 (Six Pediatric Deaths)

Re: Weekly MMWR (2010-11): Weeks 40-4 (Six Pediatric Deaths)

Testing results in the UK indicate that pH1N1 still predominantly affects <65. However, it was disturbing to learn (and I can't recall the numbers exactly), but at one point England reported 17 Influenza B deaths and the rest were pH1N1. But, there were at least twice that number (35-40) deaths of people >65, which could indicate that it has mutated away from the immunity that the older population had from a similar virus many years ago. If so, we might see fatalities in the coming weeks increase in that age group, along with younger people. I really hope I'm wrong, but based on the data, I believe that a mutated pH1N1 will peak near the end of the month and prior infection or vaccination might not prevent people from getting it.
RoRo;391018The CDC does provide a weekly Fluview report that details the ages of confirmed hospitalized cases (purple and white table about half way down this link [url said:
http://www.cdc.gov/flu/weekly/index.htm[/url] ) It also has gender and virus type information. Unfortunately it does not provide the extra dimension of correlating virus type to age group. I still assume that H1N1 affects under 65's more, but there is a lack of US based data this year.
 
Re: Weekly MMWR (2010-11): Weeks 40-4 (Six Pediatric Deaths)

Re: Weekly MMWR (2010-11): Weeks 40-4 (Six Pediatric Deaths)

Fluview information on pediatric deaths:

"Seven of the 13 deaths reported were associated with influenza A (H3) virus infection, four deaths were associated with influenza B virus infection, and two were associated with an influenza A virus for which the subtype was not determined."

Today, Fluview will list the new six deaths and associated influenza. This should be the most telling, considering 2009 A(H1N1) is now moving to the forefront, although AZ Department of Health listed their pediatric death as A/H3.

Some states breakdown adult deaths. So far, few have been 2009 A(H1N1).
http://www.cdc.gov/flu/weekly/
 
Re: Weekly MMWR (2010-11): Weeks 40-6 (Five New Pediatric Deaths)

Re: Weekly MMWR (2010-11): Weeks 40-6 (Five New Pediatric Deaths)

P&I mortality in week 6:
5 influenza-associated pediatric deaths: NC (1), NV (1), VA (2), WI (1)

8,9%


12147 total deaths and 1080 P&I deaths

Increase in measles beyond historical limits
 
Re: Weekly MMWR (2010-11): Weeks 40-6

Re: Weekly MMWR (2010-11): Weeks 40-6

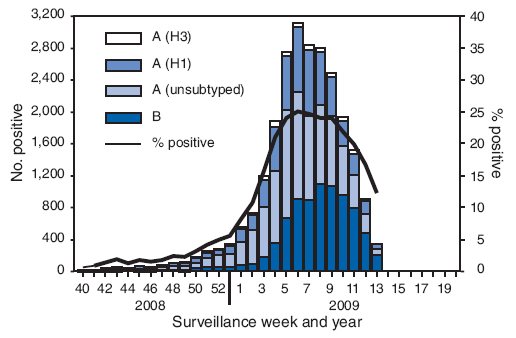
Given that the 2009-2010 flu season was an anomaly, I looked at 2008-2009 for comparision. It appears that week 6 is the height of the traditional flu season:


m814a4f1.gif


We will have to see what happens next week to draw any conclusions about the trend.

http://www.flutrackers.com/forum/showpost.php?p=220087&postcount=454
 
Re: Weekly MMWR (2010-11): Weeks 40-6

Re: Weekly MMWR (2010-11): Weeks 40-6

This year's curve might turn out to be odd - with either a double hump or a protracted peak. The reason I say this is that states that have experienced very high %ILI have mostly not seen much pH1N1. As seasonal flu drops, it seems that pH1N1 increases.
Given that the 2009-2010 flu season was an anomaly, I looked at 2008-2009 for comparision. It appears that week 6 is the height of the traditional flu season:...

We will have to see what happens next week to draw any conclusions about the trend.

http://www.flutrackers.com/forum/showpost.php?p=220087&postcount=454
 
Re: Weekly MMWR (2010-11): Weeks 40-6

Re: Weekly MMWR (2010-11): Weeks 40-6

This year's curve might turn out to be odd - with either a double hump or a protracted peak. The reason I say this is that states that have experienced very high %ILI have mostly not seen much pH1N1. As seasonal flu drops, it seems that pH1N1 increases.

Sure. That is possible. I thought I would post a graph of a "normal" year on this thread so that we can more easily compare.

:)
 
Re: Weekly MMWR (2010-11): Weeks 40-6 (Five New Pediatric Deaths)

Re: Weekly MMWR (2010-11): Weeks 40-6 (Five New Pediatric Deaths)

NOTE: I have revised some of original data after finding updates

Looking back on previous seasons (from final reports in Fluview) I found that: http://www.cdc.gov/flu/weekly/pastreports.htm
Nationally (when P&I deaths exceeded threshold):
1. ~4 weeks after peak PP (percent positive), P&I deaths reach peak
2. Peak ILI and peak PP often occur in the same week
3. When PP is >30, ILI peak is ~6-8% (1999-00, 03-04, 07-08, 09-10)

Below are flu seasons where P&I exceeded threshold. Peak PP (percent positives), peak ILI (week that they occurred) and week of peak P&I deaths:
1999-00 peaks: 33PP and 6% ILI (week 51); 11.2% P&I (week 3)
2001-02 peaks: 25.9PP and 3.2%ILI (week 8); 9.1% P&I (week 11)
2003-04 peaks: 35.2PP (week 49/51) and 7.6% ILI (week 52); 10.3% P&I (week 2)
2004-05 peaks: 27PP (week 5) and 5.4%ILI (week 7) and 8.9%P&I (week 9) A(H3N2) viruses predominated but influenza A(H1N1), A(H1N2) and B viruses also circulated
2007-08 peaks: 32PP and 6%ILI (week 7); 9.1% P&I (week 11)
2009-10 peaks: 38.09PP and 7.7%ILI (week 42); 8.2% P&I (week 46)

Current season, up until week 4, A/H3N2 had been the most predominant virus.

Here's what a study that CDC has listed states:
"The MMWR study found that during seasons when influenza A (H3N2) viruses were prominent death rates were more than double what they were during seasons when influenza A (H1N1) or influenza B viruses predominated. In addition, the study confirmed previous findings that about 90% of influenza associated deaths occur among adults 65 years and older.

Does CDC think that influenza causes most P&I deaths?
No, only a small proportion of deaths in either of these two categories are estimated to be influenza-related. CDC estimated that only 8.5% of all pneumonia and influenza deaths and only 2.1% of all respiratory and circulatory deaths were influenza-related." http://www.cdc.gov/flu/about/disease/us_flu-related_deaths.htm

"During the seasons (1997-98, 1998-99, and 1999-2000), the peak percentages of respiratory specimens testing positive for influenza viruses ranged from 28% to 32%...the peak percentage of patient visits for ILI ranged between 5% and 7%." (P&I thresholds were exceeded). http://www.cdc.gov/flu/weekly/weeklyarchives2000-2001/00-01summary.htm

Seasons where P&I didn't exceed threshold:
2000-01 peaks: 24PP and 4% ILI; A(H3N2) viruses did not predominate
2002-03 peaks: 24.7 PP and 3.2% ILI; 8.3% P&I; A(H1N1), A(H1N2) and B viruses circulated widely, and the predominant virus varied by region and time of season
2005-06 peaks: 22.7PP(week 7) and 3.3%ILI (week 52), 3.2%ILI (week 9); A(H3N2) viruses predominated overall, but late in the season influenza B viruses
2006-07 peaks: 28PP (week 6) and 3%ILI (week 52), 3.5%ILI (week 7) and P&I ~7.7% (peaked 3 times) A (H1) viruses were most commonly isolated. One case of human infection with swine influenza virus was reported.
2008-09 peaks: 42.8PP (week 24) and 5.1% ILI and rising (week 39) *This was an odd season, perhaps data is still being entered.
 
Re: Weekly MMWR (2010-11): Weeks 40-12 (Twelve Pediatric deaths)

Re: Weekly MMWR (2010-11): Weeks 40-12 (Twelve Pediatric deaths)

The following cities among the 122 cities report have reported percent P&I deaths at levels exceeding 11%, with total P&I deaths mostly exceeding 10. For some reason, the cities in Minnesota reported only P&I deaths.

Canton, OH - 42.9%
Long Beach, CA - 20.4%
Grand Rapids, MI - 18.5%
Los Angeles, CA - 15.0%
Erie, PA - 14.9%
Richmond, VA - 14.2%
Spokane, CA - 14.3%
Fresno, CA - 13.0%
Peoria, IL - 12.5%
Indianapolis, IN - 12.0%
Seattle, WA - 12.0%
Memphis, TN - 11.8%
Chattanooga, TN - 11.7%
San Jose, CA - 11.7%
Milwaukee, WI - 11.7%
Lexington, KY - 11.6%
 
Re: Weekly MMWR (2010-11): Weeks 40-12 (Twelve Pediatric deaths)

Re: Weekly MMWR (2010-11): Weeks 40-12 (Twelve Pediatric deaths)

2011 links


http://wonder.cdc.gov/mmwr/mmwrmort.asp

New York:http://wonder.cdc.gov/mmwr/mmwr_rep...wr_location=New+York+City,+N.Y.&mmwr_table=4A
Boston:http://wonder.cdc.gov/mmwr/mmwr_rep...011&mmwr_location=Boston,+Mass.&mmwr_table=4A
Atlanta: http://wonder.cdc.gov/mmwr/mmwr_rep...2011&mmwr_location=Atlanta,+Ga.&mmwr_table=4A

USA:http://wonder.cdc.gov/mmwr/mmwr_rep...r_year=2011&mmwr_location=TOTAL&mmwr_table=4A
New England: http://wonder.cdc.gov/mmwr/mmwr_rep...=2011&mmwr_location=New+England&mmwr_table=4A
Mid-Atlantic:http://wonder.cdc.gov/mmwr/mmwr_rep...011&mmwr_location=MID.+ATLANTIC&mmwr_table=4A
S.Atlantic: http://wonder.cdc.gov/mmwr/mmwr_rep...=2011&mmwr_location=S.+ATLANTIC&mmwr_table=4A
W.N.Central: http://wonder.cdc.gov/mmwr/mmwr_rep...2011&mmwr_location=W.N.+CENTRAL&mmwr_table=4A
W.S.Central: http://wonder.cdc.gov/mmwr/mmwr_rep...2011&mmwr_location=W.S.+CENTRAL&mmwr_table=4A
E.N.Central: http://wonder.cdc.gov/mmwr/mmwr_rep...2011&mmwr_location=E.N.+CENTRAL&mmwr_table=4A
E.S.Central: http://wonder.cdc.gov/mmwr/mmwr_rep...2011&mmwr_location=E.S.+CENTRAL&mmwr_table=4A
Mountain: http://wonder.cdc.gov/mmwr/mmwr_rep...ear=2011&mmwr_location=Mountain&mmwr_table=4A
Pacific: http://wonder.cdc.gov/mmwr/mmwr_rep...year=2011&mmwr_location=Pacific&mmwr_table=4A


unfortunately the MMWR and CDC/ILI regions do not
match, so I made 6 regions from them

http://magictour.free.fr/panflu/cdce00.GIF

it is not clear whether the currently increased
deaths from P+I in USA are induced by flu


weeks 1-12 , total deaths in the MMWR reports and deaths from P+I :

2008:151613,12247
2009:146758,10495
2010:140117,10765
2011:145990,11991

multiply by ~4 to get the deaths in whole USA


----------------------------------------------------

01 13341 9157 3002 733 260 183 1025 768
02 12263 8357 2842 618 233 208 0915 746
03 12153 8348 2737 685 196 185 0911 750
04 11627 7879 2756 624 195 171 0983 845
05 11636 7969 2651 602 201 208 0934 803
06 12147 8228 2828 666 239 182 1080 889
07 12267 8327 2841 667 223 206 1012 825
08 12444 8367 2930 709 250 186 0989 795
09 12137 8239 2792 672 230 199 1034 852
10 12013 8130 2810 649 239 182 1038 864
11 11625 7832 2717 632 232 209 1001 861
12 12337 8293 2917 674 240 207 1069 866
13 11938 8026 2790 676 224 213 0955 800
14 12241 8374 2775 631 253 204 0975 797
15 10,928 7,372 2,509 662 222 163 851
16 10,743 7,209 2,470 617 227 188 857
17 10,826 7,270 2,504 626 224 200 778
18 11,251 7,523 2,662 633 232 196 842
19 11,300 7,581 2,629 649 223 214 825
20 11,132 7,423 2,595 659 228 224 819
21 10,839 7,237 2,529 639 236 196 773
22 9,538 6,366 2,236 573 209 152 674
23 10,770 7,156 2,569 617 251 174 776

last year:
22 10,046 6,722 2,266 622 253 182 672
23 10,950 7,272 2,618 604 239 212 739
24 10,333 6,880 2,469 575 206 198 670
 
Re: Weekly MMWR (2010-11): Weeks 40-12 (Twelve Pediatric deaths)

Re: Weekly MMWR (2010-11): Weeks 40-12 (Twelve Pediatric deaths)

2011 links

it is not clear whether the currently increased
deaths from P+I in USA are induced by flu

Possibly due to limited data?

Couldn't one assume it is flu because of the high number of influenza-associated pediatric deaths?
 
Re: Weekly MMWR (2010-11): Weeks 40-12 (Twelve Pediatric deaths)

Re: Weekly MMWR (2010-11): Weeks 40-12 (Twelve Pediatric deaths)

pediatric deaths are not seasonal AFAIK
 
Back
Top