• FluTrackers.com Inc. does not provide medical advice. Information on this web site is collected from various internet resources, and the FluTrackers board of directors makes no warranty to the safety, efficacy, correctness or completeness of the information posted on this site by any author or poster. The information collated here is for instructional and/or discussion purposes only and is NOT intended to diagnose or treat any disease, illness, or other medical condition. Every individual reader or poster should seek advice from their personal physician/healthcare practitioner before considering or using any interventions that are discussed on this website. By continuing to access this website you agree to consult your personal physican before using any interventions posted on this website, and you agree to hold harmless FluTrackers.com Inc., the board of directors, the members, and all authors and posters for any effects from use of any medication, supplement, vitamin or other substance, device, intervention, etc. mentioned in posts on this website, or other internet venues referenced in posts on this website.
  • We are not asking for any donations. Do not donate to any entity who says they are raising funds for us.

USA FluView Reports - Week 48 (2009) - Week 20 (2010)

Re: Fluview Week 48 (2009) - Week 9 (2010)

Re: Fluview Week 48 (2009) - Week 9 (2010)

*

FluView: A Weekly Influenza Surveillance Report Prepared by the Influenza Division
2009-2010 Influenza Season Week 9 ending March 6, 2010

All data are preliminary and may change as more reports are received.
Synopsis:

During week 9 (February 28 ? March 6, 2010), influenza activity remained at approximately the same levels as last week in the U.S

* 174 (5.1%) specimens tested by U.S. World Health Organization (WHO) and National Respiratory and Enteric Virus Surveillance System (NREVSS) collaborating laboratories and reported to CDC/Influenza Division were positive for influenza.
* All subtyped influenza A viruses reported to CDC were 2009 influenza A (H1N1) viruses.
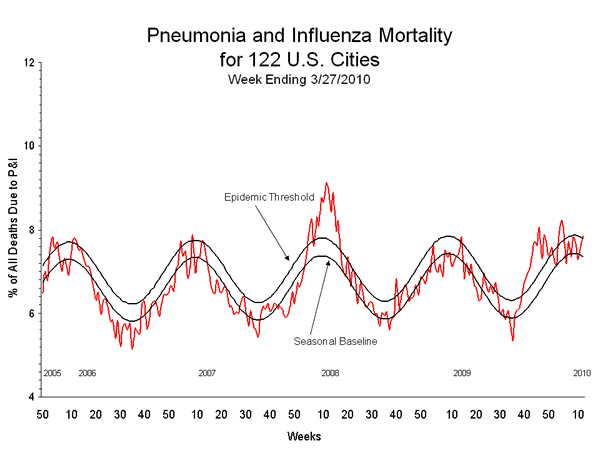
* The proportion of deaths attributed to pneumonia and influenza (P&I) was below the epidemic threshold.
* No influenza-associated pediatric deaths were reported.
* The proportion of outpatient visits for influenza-like illness (ILI) was 1.9% which is below the national baseline of 2.3%. Three of 10 regions (Regions 4, 7, and 9) reported ILI at or above region-specific baseline levels.
* No states reported widespread influenza activity, five states reported regional influenza activity, Puerto Rico and six states reported local influenza activity, Guam, and 33 states reported sporadic influenza activity, the U.S. Virgin Islands and six states reported no influenza activity, and the District of Columbia did not report.
 
Re: Fluview Week 48 (2009) - Week 9 (2010)

Re: Fluview Week 48 (2009) - Week 9 (2010)

links to the 10 region-charts:

http://www.cdc.gov/flu/weekly/regions2009-2010/senreg1.htm
http://www.cdc.gov/flu/weekly/regions2009-2010/senreg2.htm
http://www.cdc.gov/flu/weekly/regions2009-2010/senreg3.htm
http://www.cdc.gov/flu/weekly/regions2009-2010/senreg4.htm
http://www.cdc.gov/flu/weekly/regions2009-2010/senreg5.htm
http://www.cdc.gov/flu/weekly/regions2009-2010/senreg6.htm
http://www.cdc.gov/flu/weekly/regions2009-2010/senreg7.htm
http://www.cdc.gov/flu/weekly/regions2009-2010/senreg8.htm
http://www.cdc.gov/flu/weekly/regions2009-2010/senreg9.htm
http://www.cdc.gov/flu/weekly/regions2009-2010/senreg10.htm

6,7,9 going up, rest normal or down

at ISDS:
http://isds.cirg.washington.edu/distribute/images/daily_counts_fever.ratio_wa_32_54.png
http://isds.cirg.washington.edu/distribute/images/daily_counts_fever.ratio_wa_32_55.png
http://isds.cirg.washington.edu/distribute/images/daily_counts_fever.ratio_wa_32_56.png
http://isds.cirg.washington.edu/distribute/images/daily_counts_fever.ratio_wa_32_57.png
http://isds.cirg.washington.edu/distribute/images/daily_counts_fever.ratio_wa_32_58.png
http://isds.cirg.washington.edu/distribute/images/daily_counts_fever.ratio_wa_32_59.png
http://isds.cirg.washington.edu/distribute/images/daily_counts_fever.ratio_wa_32_60.png
http://isds.cirg.washington.edu/distribute/images/daily_counts_fever.ratio_wa_32_61.png
http://isds.cirg.washington.edu/distribute/images/daily_counts_fever.ratio_wa_32_62.png
http://isds.cirg.washington.edu/distribute/images/daily_counts_fever.ratio_wa_32_63.png
 
Re: Fluview Week 48 (2009) - Week 9 (2010)

Re: Fluview Week 48 (2009) - Week 9 (2010)

2009-2010 Influenza Season Week 9 ending March 6, 2010

All data are preliminary and may change as more reports are received.
Synopsis:

During week 9 (February 28 – March 6, 2010), influenza activity remained at approximately the same levels as last week in the U.S

  • 174 (5.1%) specimens tested by U.S. World Health Organization (WHO) and National Respiratory and Enteric Virus Surveillance System (NREVSS) collaborating laboratories and reported to CDC/Influenza Division were positive for influenza.
  • All subtyped influenza A viruses reported to CDC were 2009 influenza A (H1N1) viruses.
  • The proportion of deaths attributed to pneumonia and influenza (P&I) was below the epidemic threshold.
  • No influenza-associated pediatric deaths were reported.
  • The proportion of outpatient visits for influenza-like illness (ILI) was 1.9% which is below the national baseline of 2.3%. Three of 10 regions (Regions 4, 7, and 9) reported ILI at or above region-specific baseline levels.
  • No states reported widespread influenza activity, five states reported regional influenza activity, Puerto Rico and six states reported local influenza activity, Guam, and 33 states reported sporadic influenza activity, the U.S. Virgin Islands and six states reported no influenza activity, and the District of Columbia did not report.
<table class="table" border="0" cellpadding="3" cellspacing="0" width="100%"> <caption>National and Regional Summary of Select Surveillance Components

</caption> <tbody><tr style="vertical-align: top;"> <th rowspan="2" style="vertical-align: bottom;" width="12%">HHS Surveillance Regions*</th> <th colspan="3" style="text-align: center;" width="34%" nowrap="nowrap">Data for current week</th> <th colspan="7" style="text-align: center;" width="54%" nowrap="nowrap">Data cumulative since August 30, 2009 (Week 35)*</th> </tr> <tr style="vertical-align: middle;"> <th style="text-align: center;" width="8%">Out-patient ILI†</th> <th style="text-align: center;" width="8%">% positive for flu‡</th> <th style="text-align: center;" width="15%">Number of jurisdictions reporting regional or widespread activity§</th> <th style="text-align: center;" width="5%" nowrap="nowrap">A (H1)</th> <th style="text-align: center;" width="5%" nowrap="nowrap">A (H3)</th> <th style="text-align: center;" width="7%">2009 A (H1N1)</th> <th style="text-align: center;" width="15%">A (unable to sub-type)¥</th> <th style="text-align: center;" width="13%">A(Subtyping not performed)</th> <th style="text-align: center;" width="5%" nowrap="nowrap">B</th> <th style="text-align: center;" width="7%">Pediatric Deaths</th> </tr> <tr> <td style="text-align: left;" width="12%">Nation</td> <td style="text-align: center;" width="8%" nowrap="nowrap">Normal</td> <td style="text-align: center;" width="8%" nowrap="nowrap">5.1 % </td> <td style="text-align: center;" width="15%" nowrap="nowrap">5 of 54</td> <td style="text-align: center;" width="5%" nowrap="nowrap">34</td> <td style="text-align: center;" width="5%" nowrap="nowrap">62</td> <td style="text-align: center;" width="7%" nowrap="nowrap">65,379</td> <td style="text-align: center;" width="15%" nowrap="nowrap">289</td> <td style="text-align: center;" width="13%" nowrap="nowrap">21,699</td> <td style="text-align: center;" width="5%" nowrap="nowrap">273</td> <td style="text-align: center;" width="7%" nowrap="nowrap">265</td> </tr> <tr> <td style="text-align: left;" width="12%">Region 1</td> <td style="text-align: center;" width="8%" nowrap="nowrap">Normal </td> <td style="text-align: center;" width="8%" nowrap="nowrap">3.0 % </td> <td style="text-align: center;" width="15%" nowrap="nowrap">1 of 6</td> <td style="text-align: center;" width="5%" nowrap="nowrap">4</td> <td style="text-align: center;" width="5%" nowrap="nowrap">4</td> <td style="text-align: center;" width="7%" nowrap="nowrap">3,391</td> <td style="text-align: center;" width="15%" nowrap="nowrap">14</td> <td style="text-align: center;" width="13%" nowrap="nowrap">501</td> <td style="text-align: center;" width="5%" nowrap="nowrap">11</td> <td style="text-align: center;" width="7%" nowrap="nowrap">6</td> </tr> <tr> <td style="text-align: left;" width="12%">Region 2</td> <td style="text-align: center;" width="8%" nowrap="nowrap">Normal</td> <td style="text-align: center;" width="8%" nowrap="nowrap">1.9 % </td> <td style="text-align: center;" width="15%" nowrap="nowrap">0 of 4</td> <td style="text-align: center;" width="5%" nowrap="nowrap">8</td> <td style="text-align: center;" width="5%" nowrap="nowrap">5</td> <td style="text-align: center;" width="7%" nowrap="nowrap">1,777</td> <td style="text-align: center;" width="15%" nowrap="nowrap">0</td> <td style="text-align: center;" width="13%" nowrap="nowrap">2,389</td> <td style="text-align: center;" width="5%" nowrap="nowrap">12</td> <td style="text-align: center;" width="7%" nowrap="nowrap">18</td> </tr> <tr> <td style="text-align: left;" width="12%">Region 3</td> <td style="text-align: center;" width="8%" nowrap="nowrap">Normal</td> <td style="text-align: center;" width="8%" nowrap="nowrap">1.9 % </td> <td style="text-align: center;" width="15%" nowrap="nowrap">0 of 6</td> <td style="text-align: center;" width="5%" nowrap="nowrap">3</td> <td style="text-align: center;" width="5%" nowrap="nowrap">10</td> <td style="text-align: center;" width="7%" nowrap="nowrap">10,670</td> <td style="text-align: center;" width="15%" nowrap="nowrap">48</td> <td style="text-align: center;" width="13%" nowrap="nowrap">1,449</td> <td style="text-align: center;" width="5%" nowrap="nowrap">18</td> <td style="text-align: center;" width="7%" nowrap="nowrap">14</td> </tr> <tr> <td style="text-align: left;" width="12%">Region 4</td> <td style="text-align: center;" width="8%" nowrap="nowrap">Elevated</td> <td style="text-align: center;" width="8%" nowrap="nowrap">15.1 % </td> <td style="text-align: center;" width="15%" nowrap="nowrap">4 of 8</td> <td style="text-align: center;" width="5%" nowrap="nowrap">0</td> <td style="text-align: center;" width="5%" nowrap="nowrap">7</td> <td style="text-align: center;" width="7%" nowrap="nowrap">9,048</td> <td style="text-align: center;" width="15%" nowrap="nowrap">95</td> <td style="text-align: center;" width="13%" nowrap="nowrap">4,477</td> <td style="text-align: center;" width="5%" nowrap="nowrap">78</td> <td style="text-align: center;" width="7%" nowrap="nowrap">50</td> </tr> <tr> <td style="text-align: left;" width="12%">Region 5</td> <td style="text-align: center;" width="8%" nowrap="nowrap">Normal</td> <td style="text-align: center;" width="8%" nowrap="nowrap">3.4 % </td> <td style="text-align: center;" width="15%" nowrap="nowrap">0 of 6</td> <td style="text-align: center;" width="5%" nowrap="nowrap">8</td> <td style="text-align: center;" width="5%" nowrap="nowrap">25</td> <td style="text-align: center;" width="7%" nowrap="nowrap">9,440</td> <td style="text-align: center;" width="15%" nowrap="nowrap">47</td> <td style="text-align: center;" width="13%" nowrap="nowrap">1,574</td> <td style="text-align: center;" width="5%" nowrap="nowrap">19</td> <td style="text-align: center;" width="7%" nowrap="nowrap">36</td> </tr> <tr> <td style="text-align: left;" width="12%">Region 6</td> <td style="text-align: center;" width="8%" nowrap="nowrap">Normal</td> <td style="text-align: center;" width="8%" nowrap="nowrap">4.5 % </td> <td style="text-align: center;" width="15%" nowrap="nowrap">0 of 5</td> <td style="text-align: center;" width="5%" nowrap="nowrap">2</td> <td style="text-align: center;" width="5%" nowrap="nowrap">3</td> <td style="text-align: center;" width="7%" nowrap="nowrap">4,874</td> <td style="text-align: center;" width="15%" nowrap="nowrap">19</td> <td style="text-align: center;" width="13%" nowrap="nowrap">5,303</td> <td style="text-align: center;" width="5%" nowrap="nowrap">50</td> <td style="text-align: center;" width="7%" nowrap="nowrap">69</td> </tr> <tr> <td style="text-align: left;" width="12%">Region 7</td> <td style="text-align: center;" width="8%" nowrap="nowrap">Elevated</td> <td style="text-align: center;" width="8%" nowrap="nowrap">4.9 % </td> <td style="text-align: center;" width="15%" nowrap="nowrap">0 of 4</td> <td style="text-align: center;" width="5%" nowrap="nowrap">3</td> <td style="text-align: center;" width="5%" nowrap="nowrap">1</td> <td style="text-align: center;" width="7%" nowrap="nowrap">3,423</td> <td style="text-align: center;" width="15%" nowrap="nowrap">3</td> <td style="text-align: center;" width="13%" nowrap="nowrap">548</td> <td style="text-align: center;" width="5%" nowrap="nowrap">9</td> <td style="text-align: center;" width="7%" nowrap="nowrap">8</td> </tr> <tr> <td style="text-align: left;" width="12%">Region 8</td> <td style="text-align: center;" width="8%" nowrap="nowrap">Normal</td> <td style="text-align: center;" width="8%" nowrap="nowrap">0.8 % </td> <td style="text-align: center;" width="15%" nowrap="nowrap">0 of 6</td> <td style="text-align: center;" width="5%" nowrap="nowrap">4</td> <td style="text-align: center;" width="5%" nowrap="nowrap">2</td> <td style="text-align: center;" width="7%" nowrap="nowrap">9,830</td> <td style="text-align: center;" width="15%" nowrap="nowrap">0</td> <td style="text-align: center;" width="13%" nowrap="nowrap">3,926</td> <td style="text-align: center;" width="5%" nowrap="nowrap">56</td> <td style="text-align: center;" width="7%" nowrap="nowrap">16</td> </tr> <tr> <td style="text-align: left;" width="12%">Region 9</td> <td style="text-align: center;" width="8%" nowrap="nowrap">Elevated</td> <td style="text-align: center;" width="8%" nowrap="nowrap">1.1 % </td> <td style="text-align: center;" width="15%" nowrap="nowrap">0 of 5</td> <td style="text-align: center;" width="5%" nowrap="nowrap">0</td> <td style="text-align: center;" width="5%" nowrap="nowrap">4</td> <td style="text-align: center;" width="7%" nowrap="nowrap">8,323</td> <td style="text-align: center;" width="15%" nowrap="nowrap">49</td> <td style="text-align: center;" width="13%" nowrap="nowrap">1,208</td> <td style="text-align: center;" width="5%" nowrap="nowrap">17</td> <td style="text-align: center;" width="7%" nowrap="nowrap">38</td> </tr> <tr> <td style="text-align: left;" width="12%">Region 10</td> <td style="text-align: center;" width="8%" nowrap="nowrap">Normal</td> <td style="text-align: center;" width="8%" nowrap="nowrap">0.5 % </td> <td style="text-align: center;" width="15%" nowrap="nowrap">0 of 4</td> <td style="text-align: center;" width="5%" nowrap="nowrap">2</td> <td style="text-align: center;" width="5%" nowrap="nowrap">1</td> <td style="text-align: center;" width="7%" nowrap="nowrap">4,603</td> <td style="text-align: center;" width="15%" nowrap="nowrap">14</td> <td style="text-align: center;" width="13%" nowrap="nowrap">324</td> <td style="text-align: center;" width="5%" nowrap="nowrap">3</td> <td style="text-align: center;" width="7%" nowrap="nowrap">10</td> </tr> </tbody></table>​
*Influenza season officially begins each year at week 40. This season data from week 35 will be included to show the trend of influenza activity before the official start of the 2009-10 influenza season.
**HHS regions (Region 1 CT, ME, MA, NH, RI, VT; Region 2: NJ, NY, Puerto Rico, US Virgin Islands; Region 3: DE, DC, MD, PA, VA, WV; Region 4: AL, FL, GA, KY, MS, NC, SC, TN; Region 5: IL, IN, MI, MN, OH, WI; Region 6: AR, LA, NM, OK, TX; Region 7: IA, KS, MO, NE; Region 8: CO, MT, ND, SD, UT, WY; Region 9: AZ, CA, Guam, HI, NV; and Region 10: AK, ID, OR, WA).
† Elevated means the % of visits for ILI is at or above the national or region-specific baseline
‡ National data are for current week; regional data are for the most recent three weeks
§ Includes all 50 states, the District of Columbia, Guam, Puerto Rico, and U.S. Virgin Islands
¥ Subtyping results for the majority of specimens in this category were inconclusive because of low virus titers.
U.S. Virologic Surveillance:

WHO and NREVSS collaborating laboratories located in all 50 states and Washington, D.C. report to CDC the number of respiratory specimens tested for influenza and the number positive by influenza type and subtype. The results of tests performed during the current week are summarized in the table below.
<table class="table" align="center" border="0" cellpadding="2" cellspacing="0"> <tbody><tr> <th style="text-align: left;" width="270">
</th> <th style="text-align: center;" width="150" nowrap="nowrap">Week 9</th> </tr> <tr> <td style="text-align: left;" width="270">No. of specimens tested</td> <td style="text-align: center;" width="150" nowrap="nowrap">3,419</td> </tr> <tr> <td style="text-align: left;" width="270">No. of positive specimens (%)</td> <td style="text-align: center;" width="150" nowrap="nowrap">174 (5.1%)</td> </tr> <tr> <td style="text-align: left;" colspan="2">Positive specimens by type/subtype</td> </tr> <tr> <td style="text-align: left;" width="270"> Influenza A</td> <td style="text-align: center;" width="150" nowrap="nowrap">173 (99.4%)</td> </tr> <tr> <td style="text-align: left;" width="270"> A (2009 H1N1)</td> <td align="right" width="150" nowrap="nowrap">127 (73.4%) </td> </tr> <tr> <td style="text-align: left;" width="270"> A (subtyping not performed)</td> <td align="right" width="150" nowrap="nowrap">46 (26.6%) </td> </tr> <tr> <td style="text-align: left;" width="270"> A (unable to subtype)</td> <td align="right" width="150" nowrap="nowrap">0 (0.0%) </td> </tr> <tr> <td style="text-align: left;" width="270"> A (H3)</td> <td align="right" width="150" nowrap="nowrap">0 (0.0%) </td> </tr> <tr> <td style="text-align: left;" width="270"> A (H1)</td> <td align="right" width="150" nowrap="nowrap">0 (0.0%) </td> </tr> <tr> <td style="text-align: left;" width="270"> Influenza B</td> <td style="text-align: center;" width="150" nowrap="nowrap">1 (0.6%)</td> </tr> </tbody></table> <!--*Subtyping results for both specimens in this category were inconclusive because of low levels of viral RNA.
--> During week 9, one influenza B virus was reported and all subtyped influenza A viruses reported to CDC this week were 2009 influenza A (H1N1) viruses.

<center>
image091.gif

View WHO-NREVSS Regional Bar Charts | View Chart Data | View Full Screen | View PowerPoint Presentation </center>
Pneumonia and Influenza Hospitalization and Death Tracking:

The Aggregate Hospitalization and Death Reporting Activity (AHDRA) system was implemented on August 30, 2009, and replaces the weekly report of laboratory confirmed 2009 H1N1-related hospitalizations and deaths that began in April 2009. Jurisdictions report to CDC the number of hospitalizations and deaths resulting from all types or subtypes of influenza, not just those associated with 2009 H1N1. Counts were reset to zero on August 30, 2009. From August 30, 2009 – March 6, 2010, 41,113 laboratory-confirmed influenza-associated hospitalizations and 2,042 laboratory-confirmed influenza-associated deaths were reported to CDC.

<center>
AHDR09_small.gif

View Full Screen
| View Chart Data <!-- --> | View PowerPoint Presentation </center>
Antigenic Characterization:

CDC has antigenically characterized one seasonal influenza A (H1N1), 11 influenza A (H3N2), 22 influenza B, and 1,539 2009 influenza A (H1N1) viruses collected since September 1, 2009.
One seasonal influenza A (H1N1) virus was tested and is related to the influenza A (H1N1) component of the 2009-10 Northern Hemisphere influenza vaccine (A/Brisbane/59/2007).
The 12 influenza A (H3N2) viruses tested showed reduced titers with antisera produced against A/Brisbane/10/2007, the 2009-2010 Northern Hemisphere influenza A (H3N2) vaccine component, and were antigenically related to A/Perth/16/2009, the WHO recommended influenza A (H3N2) component of the 2010 Southern Hemisphere and 2010-11 Northern Hemisphere vaccine formulations.
Influenza B viruses currently circulating globally can be divided into two distinct lineages represented by the B/Yamagata/16/88 and B/Victoria/02/87 viruses. The influenza B component of the 2009-10 and 2010-11 Northern Hemisphere vaccines belongs to the B/Victoria lineage. The 22 influenza B viruses tested belong to the B/Victoria lineage and are related to the influenza vaccine component for the 2009-10 and 2010-11 Northern Hemisphere influenza B vaccine strain (B/Brisbane/60/2008).
One thousand five hundred thirty-four (99.7%) of 1,539 2009 influenza A (H1N1) viruses tested are related to the A/California/07/2009 (H1N1) reference virus selected by WHO as the 2009 H1N1 vaccine virus, and as a component in the 2010-11 Northern Hemisphere vaccine. Five viruses (0.3%) tested showed reduced titers with antiserum produced against A/California/07/2009.
Annual influenza vaccination is expected to provide the best protection against those virus strains that are related to the vaccine strains, but limited to no protection may be expected when the vaccine and circulating virus strains are so different as to be from different lineages. Antigenic characterization of 2009 influenza A (H1N1) viruses indicates that these viruses are only distantly related antigenically and genetically to seasonal influenza A (H1N1) viruses, suggesting that little to no protection would be expected from vaccination with seasonal influenza vaccine.
Composition of the 2010-11 Influenza Vaccine:

WHO has recommended vaccine strains for the 2010-11 Northern Hemisphere trivalent influenza vaccine, and FDA has made the same recommendations for the U.S. influenza vaccine. Both agencies recommend that the vaccine contain A/California/7/2009-like (2009 H1N1), A/Perth/16/2009-like (H3N2), and B/Brisbane/60/2008-like (B/Victoria lineage) viruses. A seasonal influenza A (H1N1) component is not included in the 2010-11 formulation and the A (H3N2) component has been changed from the 2009-10 Northern Hemisphere vaccine formulation. This recommendation was based on surveillance data related to epidemiology and antigenic characteristics, serological responses to 2009-10 trivalent seasonal and 2009 H1N1 monovalent vaccines, and the availability of candidate strains and reagents.
Antiviral Resistance:

Since September 1, 2009, one seasonal influenza A (H1N1), 12 influenza A (H3N2), 11 influenza B, and 1,494 2009 influenza A (H1N1) virus isolates have been tested for resistance to the neuraminidase inhibitors (oseltamivir and zanamivir), and 2,542 2009 influenza A (H1N1) original clinical samples were tested for a single known mutation in the virus that confers oseltamivir resistance. In addition, one seasonal influenza A (H1N1), 12 influenza A (H3N2), and 1,495 2009 influenza A (H1N1) virus isolates have been tested for resistance to the adamantanes (amantadine and rimantadine). The results of antiviral resistance testing performed on these viruses are summarized in the table below. Additional laboratories perform antiviral testing and report their results to CDC, and positive results from that testing are included in the footnote.
Antiviral Resistance Testing Results on Samples Collected Since September 1, 2009.

<table class="table" style="text-align: center;" border="0" cellpadding="3" cellspacing="0"> <tbody><tr> <th style="text-align: left;" rowspan="1" width="160">
</th> <th style="text-align: center;" width="100" nowrap="nowrap">Samples tested (n)</th> <th style="text-align: center;" width="100" nowrap="nowrap">Resistant Viruses, Number (%)</th> <th style="text-align: center;" width="100" nowrap="nowrap">Samples tested (n)</th> <th style="text-align: center;" width="100" nowrap="nowrap">Resistant Viruses, Number (%)</th> <th style="text-align: center;" width="100" nowrap="nowrap">Samples tested (n)</th> <th style="text-align: center;" width="100" nowrap="nowrap">Resistant Viruses, Number (%)</th> </tr> <tr> <th style="text-align: left;" width="160">
</th> <th style="text-align: center;" width="100" nowrap="nowrap">
</th> <th style="text-align: center;" width="100" nowrap="nowrap">Oseltamivir</th> <th style="text-align: center;" width="100" nowrap="nowrap">
</th> <th style="text-align: center;" width="100" nowrap="nowrap">Zanamivir</th> <th style="text-align: center;" width="100" nowrap="nowrap">
</th> <th style="text-align: center;" width="100" nowrap="nowrap">Adamantanes</th> </tr> <tr> <td style="text-align: left;" width="160" nowrap="nowrap">Seasonal Influenza A (H1N1)</td> <td style="text-align: center;" width="100" nowrap="nowrap">1</td> <td style="text-align: center;" width="100" nowrap="nowrap">1 (100.0)</td> <td style="text-align: center;" width="100" nowrap="nowrap">0</td> <td style="text-align: center;" width="100" nowrap="nowrap">0 (0)</td> <td style="text-align: center;" width="100" nowrap="nowrap">1</td> <td style="text-align: center;" width="100" nowrap="nowrap">0 (0)</td> </tr> <tr> <td style="text-align: left;" width="160" nowrap="nowrap">Influenza A (H3N2)</td> <td style="text-align: center;" width="100" nowrap="nowrap">12</td> <td style="text-align: center;" width="100" nowrap="nowrap">0 (0)</td> <td style="text-align: center;" width="100" nowrap="nowrap">0</td> <td style="text-align: center;" width="100" nowrap="nowrap">0 (0)</td> <td style="text-align: center;" width="100" nowrap="nowrap">12</td> <td style="text-align: center;" width="100" nowrap="nowrap">12 (100.0)</td> </tr> <tr> <td style="text-align: left;" width="160" nowrap="nowrap">Influenza B</td> <td style="text-align: center;" width="100" nowrap="nowrap">11</td> <td style="text-align: center;" width="100" nowrap="nowrap">0 (0)</td> <td style="text-align: center;" width="100" nowrap="nowrap">0</td> <td style="text-align: center;" width="100" nowrap="nowrap">0 (0)</td> <td style="text-align: center;" width="100" nowrap="nowrap">N/A*</td> <td style="text-align: center;" width="100" nowrap="nowrap">N/A*</td> </tr> <tr> <td style="text-align: left;" width="160" nowrap="nowrap">2009 Influenza A (H1N1)</td> <td style="text-align: center;" width="100" nowrap="nowrap">4,036</td> <td style="text-align: center;" width="100" nowrap="nowrap">49†‡ (1.2)</td> <td style="text-align: center;" width="100" nowrap="nowrap">1,494</td> <td style="text-align: center;" width="100" nowrap="nowrap">0 (0)</td> <td style="text-align: center;" width="100" nowrap="nowrap">1,495</td> <td style="text-align: center;" width="100" nowrap="nowrap">1,491 (99.7)</td> </tr> </tbody></table> *The adamantanes (amantadine and rimantadine) are not effective against influenza B viruses.
†Two screening tools were used to determine oseltamivir resistance: sequence analysis of viral genes or a neuraminidase inhibition assay.
‡Additional laboratories perform antiviral resistance testing and report their results to CDC. Three additional oseltamivir resistant 2009 influenza A (H1N1) virus has been identified by these laboratories since September 1, 2009, bringing the total number to 52.
All subtyped influenza A viruses reported during week 9 were 2009 influenza A (H1N1) viruses, and nearly all of 2009 H1N1 viruses tested since April 2009 have been resistant to the adamantanes (amantadine and rimantadine).
Antiviral treatment with oseltamivir or zanamivir is recommended for all patients with confirmed or suspected influenza virus infection who are hospitalized or who are at higher risk for influenza complications. Additional information on antiviral recommendations for treatment and chemoprophylaxis of influenza virus infection is available at http://www.cdc.gov/h1n1flu/recommendations.htm.
2009 influenza A (H1N1) viruses were tested for oseltamivir resistance by a neuraminidase inhibition assay and/or detection of genetic sequence mutation, depending on the type of specimen tested. Original clinical samples were examined for a single known mutation in the virus that confers oseltamivir resistance in currently circulating seasonal influenza A (H1N1) viruses, while influenza virus isolates were tested using a neuraminidase inhibition assay that determines the presence or absence of neuraminidase inhibitor resistance, followed by neuraminidase gene sequence analysis of resistant viruses.
The majority of 2009 influenza A (H1N1) viruses are susceptible to the neuraminidase inhibitor antiviral medication oseltamivir; however, rare sporadic cases of oseltamivir resistant 2009 influenza A (H1N1) viruses have been detected worldwide. A total of 61 cases of oseltamivir resistant 2009 influenza A (H1N1) viruses have been identified in the United States since April 2009. This total includes one newly identified case since last week. Fifty-two of these specimens were collected after September 1, 2009. The proportion of oseltamivir-resistant 2009 H1N1 viruses does not represent the prevalence of oseltamivir-resistant 2009 H1N1 in the U.S. Most cases were tested because drug resistance was suspected. All tested viruses retain their sensitivity to the neuraminidase inhibitor zanamivir. Of the 61 total cases identified since April 2009, 48 patients had documented exposure to oseltamivir through either treatment or chemoprophylaxis, nine patients are under investigation to determine exposure to oseltamivir, three patients had no documented oseltamivir exposure, and in one patient exposure cannot be determined. Occasional development of oseltamivir resistance during treatment or prophylaxis is not unexpected. Enhanced surveillance, an increased availability of testing performed at CDC, and an increasing number of public health and other clinical laboratories performing antiviral resistance testing increase the number of cases of oseltamivir resistant 2009 influenza A (H1N1) viruses detected. All cases are investigated to assess the spread of resistant strains in the community.
To prevent the spread of antiviral resistant virus strains, CDC reminds clinicians and the public of the need to continue hand and cough hygiene measures for the duration of any symptoms of influenza, even while taking antiviral medications (http://www.cdc.gov/mmwr/preview/mmwrhtml/mm5832a3.htm).
Pneumonia and Influenza (P&I) Mortality Surveillance

During week 9, 7.7% of all deaths reported through the 122-Cities Mortality Reporting System were due to P&I. This percentage was below the epidemic threshold of 7.9% for week 9.
<center>
picurve09.gif

View Full Screen | View PowerPoint Presentation </center> Influenza-Associated Pediatric Mortality

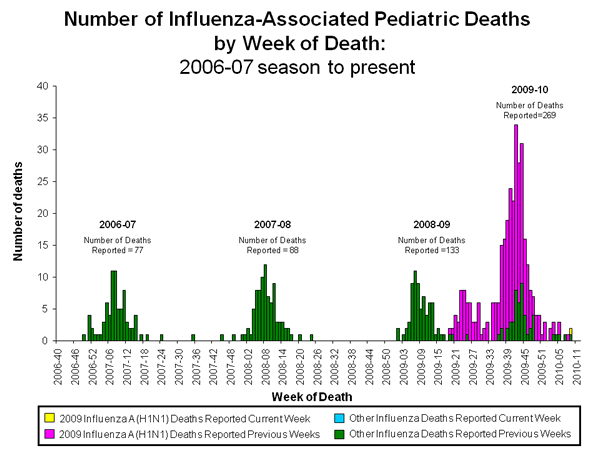
No influenza-associated pediatric deaths were reported to CDC during week 9.
Since August 30, 2009, CDC has received 265 reports of influenza-associated pediatric deaths that occurred during the current influenza season (48 deaths in children less than 2 years old, 30 deaths in children 2-4 years old, 98 deaths in children 5-11 years old, and 89 deaths in children 12-17 years old). Two hundred seventeen (82%) of the 265 deaths were due to 2009 influenza A (H1N1) virus infections, 47 were associated with an influenza A virus for which the subtype is undetermined, and one was associated with an influenza B virus infection. A total of 277 deaths in children associated with 2009 influenza A (H1N1) virus infection have been reported to CDC.
Among the 265 deaths in children, 139 children had specimens collected for bacterial culture from normally sterile sites and 47 (33.8%) of the 139 were positive; Streptococcus pneumoniae was identified in 11 (23.4%) of the 47 children and Staphylococcus aureus was identified in 14 (29.8%) of the 47 children. Four S. aureus isolates were sensitive to methicillin, nine were methicillin resistant, and one did not have sensitivity testing performed. Thirty (63.8%) of the 47 children with bacterial coinfections were five years of age or older, and 16 (34.0%) of the 47 children were 12 years of age or older.
Laboratory-Confirmed Influenza-Associated Pediatric Deaths by Date and Type/Subtype of Influenza.

<table class="table" align="center" border="0" cellpadding="3" cellspacing="0"> <tbody><tr> <th style="text-align: center;" rowspan="1" width="160">Date</th> <th style="text-align: center;" width="100">2009 H1N1 Influenza</th> <th style="text-align: center;" width="100">Influenza A-Subtype Unknown</th> <th style="text-align: center;" width="100">Seasonal Influenza</th> <th style="text-align: center;" width="100">Total</th> </tr> <tr> <th style="text-align: center;" width="160">Number of Deaths REPORTED for Current Week – Week 9 (Week ending March 6, 2010)</th> <td style="text-align: center;" width="100" nowrap="nowrap">0</td> <td style="text-align: center;" width="100" nowrap="nowrap">0</td> <td style="text-align: center;" width="100" nowrap="nowrap">0</td> <td style="text-align: center;" width="100" nowrap="nowrap">0</td> </tr> <tr> <td style="text-align: center;" width="160">Number of Deaths OCCURRED since August 30, 2009</td> <td style="text-align: center;" width="100" nowrap="nowrap">217</td> <td style="text-align: center;" width="100" nowrap="nowrap">47</td> <td style="text-align: center;" width="100" nowrap="nowrap">1</td> <td style="text-align: center;" width="100" nowrap="nowrap">265</td> </tr> <tr> <td style="text-align: center;" width="160">Number of Deaths OCCURRED since April 26, 2009</td> <td style="text-align: center;" width="100" nowrap="nowrap">277</td> <td style="text-align: center;" width="100" nowrap="nowrap">50</td> <td style="text-align: center;" width="100" nowrap="nowrap">2</td> <td style="text-align: center;" width="100" nowrap="nowrap">329</td> </tr> </tbody></table>
<center>
IPD09_small.gif

View Full Screen | View PowerPoint Presentation </center> Influenza-Associated Hospitalizations

Laboratory-confirmed influenza-associated hospitalizations are monitored using a population-based surveillance network that includes the 10 Emerging Infections Program (EIP) sites (CA, CO, CT, GA, MD, MN, NM, NY, OR and TN) and 6 new sites (IA, ID, MI, ND, OK and SD).
During September 1, 2009 – March 6, 2010, the following preliminary laboratory-confirmed overall influenza associated hospitalization rates were reported by EIP and the new sites (rates include influenza A, influenza B, and 2009 influenza A (H1N1)):
Rates [EIP (new sites)] for children aged 0-4 years and 5-17 years were 6.5 (10.4) and 2.5 (3.6) per 10,000, respectively. Rates [EIP (new sites)] for adults aged 18-49 years, 50-64 years, and ≥ 65 years were 2.4 (1.7), 3.1 (1.9) and 2.6 (1.8) per 10,000, respectively.
<center>
EIP09_small.gif

</center> <center> *The 2008-09 EIP rate ended as of April 14, 2009 due to the onset of the 2009 H1N1 season.


View Full Screen | View PowerPoint Presentation </center> Outpatient Illness Surveillance:

Nationwide during week 9, 1.9% of patient visits reported through the U.S. Outpatient Influenza-like Illness Surveillance Network (ILINet) were due to influenza-like illness (ILI). This percentage is below the national baseline of 2.3%.
<center>
image092.gif

View ILINet Regional Charts | View Chart Data | View Full Screen | View PowerPoint Presentation
</center>
On a regional level, the percentage of outpatient visits for ILI ranged from 0.6% to 3.6% during week 9. Three of the 10 regions (Regions 4, 7, and 9) reported ILI at or above their region-specific baselines. (Note: Use of the national baseline for regional ILI data or regional baselines for state-level data is not appropriate.)
Geographic Spread of Influenza as Assessed by State and Territorial Epidemiologists:

The influenza activity reported by state and territorial epidemiologists indicates geographic spread of both seasonal influenza and 2009 influenza A (H1N1) viruses and does not measure the severity of influenza activity.

  • During week 9, the following influenza activity was reported:
    • No states reported widespread influenza activity.
    • Regional influenza activity was reported by five states (Alabama, Georgia, Maine, Mississippi, and South Carolina).
    • Local influenza activity was reported by Puerto Rico and six states (Hawaii, Louisiana, North Carolina, Oklahoma, Tennessee, and Texas).
    • Sporadic influenza activity was reported by Guam and 33 states (Alaska, Arizona, Arkansas, California, Colorado, Connecticut, Delaware, Florida, Illinois, Indiana, Iowa, Kansas, Kentucky, Maryland, Massachusetts, Michigan, Minnesota, Missouri, Nevada, New Jersey, New Mexico, New York, Ohio, Pennsylvania, Rhode Island, South Dakota, Utah, Vermont, Virginia, Washington, West Virginia, Wisconsin, and Wyoming).
    • The U.S. Virgin Islands and six states (Idaho, Montana, Nebraska, New Hampshire, North Dakota, and Oregon) reported no influenza activity.
    • The District of Columbia did not report.

 
Re: Fluview Week 48 (2009) - Week 9 (2010)

Re: Fluview Week 48 (2009) - Week 9 (2010)

"2009-2010 Influenza Season Week 9 ending March 6, 2010

All data are preliminary and may change as more reports are received."


I think this is an important proviso because this report relies on the states' data. Some of this data may be reports from as much as 2 weeks previous flu status in the U.S.

We have current media reports and local/regional data here for consideration.

http://www.flutrackers.com/forum/forumdisplay.php?f=48
 
Re: Fluview Week 48 (2009) - Week 10 (2010)

Re: Fluview Week 48 (2009) - Week 10 (2010)

Week 10:

Synopsis:

During week 10 (March 7-13, 2010), influenza activity remained at approximately the same levels as last week in the U.S.

* 200 (5.6%) specimens tested by U.S. World Health Organization (WHO) and National Respiratory and Enteric Virus Surveillance System (NREVSS) collaborating laboratories and reported to CDC/Influenza Division were positive for influenza.
* All subtyped influenza A viruses reported to CDC were 2009 influenza A (H1N1) viruses.
* The proportion of deaths attributed to pneumonia and influenza (P&I) was below the epidemic threshold.
* Two influenza-associated pediatric deaths were reported. One death was associated with 2009 influenza A (H1N1) virus infection and one death was associated with an influenza A virus for which the subtype was undetermined.
* The proportion of outpatient visits for influenza-like illness (ILI) was 1.8%, which is below the national baseline of 2.3%. One of 10 regions (Region 4) reported ILI above its region-specific baseline level.
* No states reported widespread influenza activity. Three states reported regional influenza activity. Puerto Rico and eight states reported local influenza activity. The District of Columbia, Guam and 31 states reported sporadic influenza activity. Eight states reported no influenza activity, and the U.S. Virgin Islands did not report.
http://www.cdc.gov/flu/weekly/
 
Re: Fluview Week 48 (2009) - Week 11 (2010)

Re: Fluview Week 48 (2009) - Week 11 (2010)

FluView: A Weekly Influenza Surveillance Report Prepared by the Influenza Division
2009-2010 Influenza Season Week 11 ending March 20, 2010

All data are preliminary and may change as more reports are received.
Synopsis:

During week 11 (March 14-20, 2010), influenza activity remained at approximately the same levels as last week in the U.S.

* 139 (4.6%) specimens tested by U.S. World Health Organization (WHO) and National Respiratory and Enteric Virus Surveillance System (NREVSS) collaborating laboratories and reported to CDC/Influenza Division were positive for influenza.
* Approximately 99% of all subtyped influenza A viruses reported to CDC were 2009 influenza A (H1N1) viruses.
* The proportion of deaths attributed to pneumonia and influenza (P&I) was below the epidemic threshold.
* One influenza-associated pediatric death was reported and was associated with an influenza A virus for which the subtype was undetermined.
* The proportion of outpatient visits for influenza-like illness (ILI) was 1.8%, which is below the national baseline of 2.3%. Three of 10 regions (Regions 4, 7, and 9) reported ILI at or above region-specific baseline levels.
* No states reported widespread influenza activity. Three states reported regional influenza activity. Puerto Rico and eight states reported local influenza activity. The District of Columbia, Guam and 31 states reported sporadic influenza activity. Eight states reported no influenza activity, and the U.S. Virgin Islands did not report.
http://www.cdc.gov/flu/weekly/
 
Re: Fluview Week 48 (2009) - Week 11 (2010)

Re: Fluview Week 48 (2009) - Week 11 (2010)

US-state-activity levels in computer-readable format:

0:No Activity
-:No Report
3:Sporadic
4:Local Activity
5:Regional
6:Widespread


Code:
        MNVMRCNNPVPDMDVWNSGFKTAMOIIMWMALOTNIMNKNSMWCUANCHGIWOA
        EHTAITYJRIAEDCAVCCALYNLSHNLIINRAKXMAOESDDTYOTZVAIUDARK
--------------------------------------------------------------
40,2008,00000330--0000000003000000000000000000000-3000033-3300
41,2008,000003303-000000000300000000000000000000003000033-0003
42,2008,000003003-000303000300000300000003000000000330033-0303
43,2008,000303303-300000000300000300000003000000003030033-3003
44,2008,000303303-330300000000000330000003000000000330333-3003
45,2008,000303303-300000000000000330300003000000003330334-3003
46,2008,000333303-303300000300000333300003000000003330334-3303
47,2008,00033330--303300000300000303300003000000003333334-3033
48,2008,030333303-303003000300000303303003000000300333034-3033
49,2008,000433333-303303000300030333300004003300030333034-3333
50,2008,333333333-333340033300030333333004033333330333034-3333
51,2008,333533353-303043333403430343333334033333333304334-3333
5-,2008,443533353-334350433403430343330304033333333434334-3333
53,2008,453434353-435353533403433333430304033333333434334-3333
01,2009,353434553-434363533433333343333334333333343534334-3333
0-,2009,353434553-434363533434303344333305333333343534334-3333
03,2009,554555563-534363543435433544343346333333353535444-3333
04,2009,554555653-565463555535544554343346453444354645545-3333
05,2009,564665663-665463666546556545454346454544455645655-3443
06,2009,664666663-666463666646656635554446564545455646655-5445
07,2009,666666663-666465666656666645554446664555555646655-5555
08,2009,666566663-666463666656666655555556664565665646655-6556
09,2009,566566663-665466666656666655555566665566665646656-6666
10,2009,566566663-565364666656656655655555565566665646656-6666
11,2009,566556663-565363645556655644645545555666665646565-6666
12,2009,454555663-564364653555644344544535445655554646565-6663
13,2009,45445565--534363543455634344443434444545454545555-5655
14,2009,343444653-434343453445503334433344544534444535555-5554
15,2009,33343455--403333453344403334333333334535444345445-5544
16,2009,5334343-3-4433333533333033333333343333343433454-5-4434
17,2009,553544453-463463465533633534333345643343344536565-4445
18,2009,55354556--465463446535533344433346643343344556565-4445
19,2009,45354556--534460455435533354433446533343333446565-3444
20,2009,43354556--535460454335533354333445433343333336465-3444
21,2009,43354556--664463454334533354343345333343334356455-3443
22,2009,544666664-664453454334533354443345433343334356455-3433
23,2009,634566665-664464455334433354453344433333334466356-3333
24,2009,633566663-665465445434433354453344333333334566366-3343
25,2009,643566663-665-65556534433354454344535433334465466-3444
26,2009,643566665-565464556534333353454334433333334355566-3544
27,2009,643555665-5664545465343333444453344336333-3345566-3554
28,2009,643455565-566455556534333344445344433333333345566-3544
29,2009,643444566-534444555534333334345334343333344335466-3444
30,2009,633344556-534445535534333334345334343333353335566-4446
31,2009,633434356-435445565534333333344334333333354335556-3436
32,2009,633433355-434444545554433333334434333333344334555-3336
33,2009,503333356-433443556554553333334454433533343334555-3436
34,2009,033303356-435454566655664333334554433543343535554-3436
35,2009,403403345-43645366665656535345566554354334343655463546
36,2009,533404455-63646366666666536356666564456344454665434536
37,2009,553444454-66646566666666556456666665456455464666434646
38,2009,553554554-66646565666666666556666665556555665656455656
39,2009,564555654-66646566666666666556666666666565665666456666
40,2009,565555654-66646665666666666566666666666666666666456666
41,2009,666665654-66646665666666666666666666666666666666456666
42,2009,666666664-66646665666666666666666666666666666666556666
43,2009,666666663-66646666666665666666666666666666666666536666
44,2009,666666665-66646666666665666666666566656666666666536666
45,2009,666666665366646665666665666666666566656566566666536666
46,2009,666666665366646665566665666655556565556555456666536566
47,2009,666666664366646465566565665644555564545545336666535556
48,2009,666566665356446555556564555544555554534435335656535556
49,2009,665455664346446555556564555444454553533334335566503456
50,2009,655455564346446544555564354433354453503334335566503445
51,2009,634445564-46446344555554354433344453303334344555533444
52,2009,554444554343345343533564354433344453303333334455533444
01,2010,534434554033345344533454333333344453303333033454533444
02,2010,543333354033335345533453333333344443303333334453433333
03,2010,333333354043335345533453333333344343303333334343430303
04,2010,533343354033335344533454333333344353303330334433430333
05,2010,504344354033334345533354333333344353303330334343430333
06,2010,304334344033334345533354333333343343303330333333433333
07,2010,403344334033333345533354333333343343303330333333430333
08,2010,433334334033333045543355333333344343303330333333430333
09,2010,503333334033333345533455333333344433303030333333430303
10,2010,003303334-33333344533455333333444433303030333333430303
11,2010,303003334-33334345533454333333443343303033033333430303
--------------------------------------------------------------
        MNVMRCNNPVPDMDVWNSGFKTAMOIIMWMALOTNIMNKNSMWCUANCHGIWOA
        EHTAITYJRIAEDCAVCCALYNLSHNLIINRAKXMAOESDDTYOTZVAIUDARK
 
Re: Fluview Week 48 (2009) - Week 11 (2010)

Re: Fluview Week 48 (2009) - Week 11 (2010)

2009-2010 Influenza Season Week 12 ending March 27, 2010

All data are preliminary and may change as more reports are received.
Synopsis:

During week 12 (March 20-27, 2010), influenza activity remained at approximately the same levels as last week in the U.S.

  • 139 (4.6%) specimens tested by U.S. World Health Organization (WHO) and National Respiratory and Enteric Virus Surveillance System (NREVSS) collaborating laboratories and reported to CDC/Influenza Division were positive for influenza.
  • Approximately 99% of all subtyped influenza A viruses reported to CDC were 2009 influenza A (H1N1) viruses.
  • The proportion of deaths attributed to pneumonia and influenza (P&I) was below the epidemic threshold.
  • One influenza-associated pediatric death was reported and was associated with an influenza A virus for which the subtype was undetermined.
  • The proportion of outpatient visits for influenza-like illness (ILI) was 1.8%, which is below the national baseline of 2.3%. Three of 10 regions (Regions 4, 7, and 9) reported ILI at or above region-specific baseline levels.
  • No states reported widespread influenza activity. Three states reported regional influenza activity. Puerto Rico and eight states reported local influenza activity. The District of Columbia, Guam and 31 states reported sporadic influenza activity. Eight states reported no influenza activity, and the U.S. Virgin Islands did not report.
<table class="table" border="0" cellpadding="3" cellspacing="0" width="100%"> <caption>National and Regional Summary of Select Surveillance Components

</caption> <tbody><tr style="vertical-align: top;" bgcolor="#c5bee1"> <th rowspan="2" style="vertical-align: bottom;" width="12%">HHS Surveillance Regions*</th> <th colspan="3" style="text-align: center;" width="34%" nowrap="nowrap">Data for current week</th> <th colspan="7" style="text-align: center;" width="54%" nowrap="nowrap">Data cumulative since August 30, 2009 (Week 35)*</th> </tr> <tr style="vertical-align: middle; background-image: url(images/purplegrad.jpg); background-repeat: repeat-x;"> <th style="text-align: center;" width="8%">Out-patient ILI?</th> <th style="text-align: center;" width="8%">% positive for flu?</th> <th style="text-align: center;" width="15%">Number of jurisdictions reporting regional or widespread activity?</th> <th style="text-align: center;" width="5%" nowrap="nowrap">A (H1)</th> <th style="text-align: center;" width="5%" nowrap="nowrap">A (H3)</th> <th style="text-align: center;" width="7%">2009 A (H1N1)</th> <th style="text-align: center;" width="15%">A (unable to sub-type)?</th> <th style="text-align: center;" width="13%">A(Subtyping not performed)</th> <th style="text-align: center;" width="5%" nowrap="nowrap">B</th> <th style="text-align: center;" width="7%">Pediatric Deaths</th> </tr> <tr> <td style="text-align: left;" width="12%">Nation</td> <td style="text-align: center;" width="8%" nowrap="nowrap">Normal</td> <td style="text-align: center;" width="8%" nowrap="nowrap">3.5 % </td> <td style="text-align: center;" width="15%" nowrap="nowrap">3 of 54</td> <td style="text-align: center;" width="5%" nowrap="nowrap">35</td> <td style="text-align: center;" width="5%" nowrap="nowrap">65</td> <td style="text-align: center;" width="7%" nowrap="nowrap">66,589</td> <td style="text-align: center;" width="15%" nowrap="nowrap">289</td> <td style="text-align: center;" width="13%" nowrap="nowrap">22,320</td> <td style="text-align: center;" width="5%" nowrap="nowrap">287</td> <td style="text-align: center;" width="7%" nowrap="nowrap">269</td> </tr> <tr> <td style="text-align: left;" width="12%">Region 1</td> <td style="text-align: center;" width="8%" nowrap="nowrap">Normal </td> <td style="text-align: center;" width="8%" nowrap="nowrap">0.6 % </td> <td style="text-align: center;" width="15%" nowrap="nowrap">0 of 6</td> <td style="text-align: center;" width="5%" nowrap="nowrap">4</td> <td style="text-align: center;" width="5%" nowrap="nowrap">4</td> <td style="text-align: center;" width="7%" nowrap="nowrap">3,402</td> <td style="text-align: center;" width="15%" nowrap="nowrap">14</td> <td style="text-align: center;" width="13%" nowrap="nowrap">503</td> <td style="text-align: center;" width="5%" nowrap="nowrap">11</td> <td style="text-align: center;" width="7%" nowrap="nowrap">6</td> </tr> <tr> <td style="text-align: left;" width="12%">Region 2</td> <td style="text-align: center;" width="8%" nowrap="nowrap">Normal</td> <td style="text-align: center;" width="8%" nowrap="nowrap">1.0 % </td> <td style="text-align: center;" width="15%" nowrap="nowrap">0 of 4</td> <td style="text-align: center;" width="5%" nowrap="nowrap">8</td> <td style="text-align: center;" width="5%" nowrap="nowrap">6</td> <td style="text-align: center;" width="7%" nowrap="nowrap">1,797</td> <td style="text-align: center;" width="15%" nowrap="nowrap">0</td> <td style="text-align: center;" width="13%" nowrap="nowrap">2,394</td> <td style="text-align: center;" width="5%" nowrap="nowrap">12</td> <td style="text-align: center;" width="7%" nowrap="nowrap">19</td> </tr> <tr> <td style="text-align: left;" width="12%">Region 3</td> <td style="text-align: center;" width="8%" nowrap="nowrap">Normal</td> <td style="text-align: center;" width="8%" nowrap="nowrap">2.1 % </td> <td style="text-align: center;" width="15%" nowrap="nowrap">0 of 6</td> <td style="text-align: center;" width="5%" nowrap="nowrap">3</td> <td style="text-align: center;" width="5%" nowrap="nowrap">11</td> <td style="text-align: center;" width="7%" nowrap="nowrap">10,697</td> <td style="text-align: center;" width="15%" nowrap="nowrap">48</td> <td style="text-align: center;" width="13%" nowrap="nowrap">1,453</td> <td style="text-align: center;" width="5%" nowrap="nowrap">18</td> <td style="text-align: center;" width="7%" nowrap="nowrap">14</td> </tr> <tr> <td style="text-align: left;" width="12%">Region 4</td> <td style="text-align: center;" width="8%" nowrap="nowrap">Normal</td> <td style="text-align: center;" width="8%" nowrap="nowrap">13.8 % </td> <td style="text-align: center;" width="15%" nowrap="nowrap">3 of 8</td> <td style="text-align: center;" width="5%" nowrap="nowrap">1</td> <td style="text-align: center;" width="5%" nowrap="nowrap">8</td> <td style="text-align: center;" width="7%" nowrap="nowrap">9,950</td> <td style="text-align: center;" width="15%" nowrap="nowrap">95</td> <td style="text-align: center;" width="13%" nowrap="nowrap">4,645</td> <td style="text-align: center;" width="5%" nowrap="nowrap">87</td> <td style="text-align: center;" width="7%" nowrap="nowrap">51</td> </tr> <tr> <td style="text-align: left;" width="12%">Region 5</td> <td style="text-align: center;" width="8%" nowrap="nowrap">Normal</td> <td style="text-align: center;" width="8%" nowrap="nowrap">2.6 % </td> <td style="text-align: center;" width="15%" nowrap="nowrap">0 of 6</td> <td style="text-align: center;" width="5%" nowrap="nowrap">8</td> <td style="text-align: center;" width="5%" nowrap="nowrap">25</td> <td style="text-align: center;" width="7%" nowrap="nowrap">9,479</td> <td style="text-align: center;" width="15%" nowrap="nowrap">47</td> <td style="text-align: center;" width="13%" nowrap="nowrap">1,577</td> <td style="text-align: center;" width="5%" nowrap="nowrap">19</td> <td style="text-align: center;" width="7%" nowrap="nowrap">36</td> </tr> <tr> <td style="text-align: left;" width="12%">Region 6</td> <td style="text-align: center;" width="8%" nowrap="nowrap">Normal</td> <td style="text-align: center;" width="8%" nowrap="nowrap">6.0 % </td> <td style="text-align: center;" width="15%" nowrap="nowrap">0 of 5</td> <td style="text-align: center;" width="5%" nowrap="nowrap">2</td> <td style="text-align: center;" width="5%" nowrap="nowrap">3</td> <td style="text-align: center;" width="7%" nowrap="nowrap">5,137</td> <td style="text-align: center;" width="15%" nowrap="nowrap">19</td> <td style="text-align: center;" width="13%" nowrap="nowrap">5,372</td> <td style="text-align: center;" width="5%" nowrap="nowrap">54</td> <td style="text-align: center;" width="7%" nowrap="nowrap">71</td> </tr> <tr> <td style="text-align: left;" width="12%">Region 7</td> <td style="text-align: center;" width="8%" nowrap="nowrap">Normal</td> <td style="text-align: center;" width="8%" nowrap="nowrap">6.2 % </td> <td style="text-align: center;" width="15%" nowrap="nowrap">0 of 4</td> <td style="text-align: center;" width="5%" nowrap="nowrap">3</td> <td style="text-align: center;" width="5%" nowrap="nowrap">1</td> <td style="text-align: center;" width="7%" nowrap="nowrap">3,261</td> <td style="text-align: center;" width="15%" nowrap="nowrap">3</td> <td style="text-align: center;" width="13%" nowrap="nowrap">849</td> <td style="text-align: center;" width="5%" nowrap="nowrap">9</td> <td style="text-align: center;" width="7%" nowrap="nowrap">8</td> </tr> <tr> <td style="text-align: left;" width="12%">Region 8</td> <td style="text-align: center;" width="8%" nowrap="nowrap">Normal</td> <td style="text-align: center;" width="8%" nowrap="nowrap">1.4 % </td> <td style="text-align: center;" width="15%" nowrap="nowrap">0 of 6</td> <td style="text-align: center;" width="5%" nowrap="nowrap">4</td> <td style="text-align: center;" width="5%" nowrap="nowrap">2</td> <td style="text-align: center;" width="7%" nowrap="nowrap">9,851</td> <td style="text-align: center;" width="15%" nowrap="nowrap">0</td> <td style="text-align: center;" width="13%" nowrap="nowrap">3,936</td> <td style="text-align: center;" width="5%" nowrap="nowrap">56</td> <td style="text-align: center;" width="7%" nowrap="nowrap">16</td> </tr> <tr> <td style="text-align: left;" width="12%">Region 9</td> <td style="text-align: center;" width="8%" nowrap="nowrap">Elevated</td> <td style="text-align: center;" width="8%" nowrap="nowrap">0.9 % </td> <td style="text-align: center;" width="15%" nowrap="nowrap">0 of 5</td> <td style="text-align: center;" width="5%" nowrap="nowrap">0</td> <td style="text-align: center;" width="5%" nowrap="nowrap">4</td> <td style="text-align: center;" width="7%" nowrap="nowrap">8,335</td> <td style="text-align: center;" width="15%" nowrap="nowrap">49</td> <td style="text-align: center;" width="13%" nowrap="nowrap">1,244</td> <td style="text-align: center;" width="5%" nowrap="nowrap">18</td> <td style="text-align: center;" width="7%" nowrap="nowrap">38</td> </tr> <tr> <td style="text-align: left;" width="12%">Region 10</td> <td style="text-align: center;" width="8%" nowrap="nowrap">Normal</td> <td style="text-align: center;" width="8%" nowrap="nowrap">0.5 % </td> <td style="text-align: center;" width="15%" nowrap="nowrap">0 of 4</td> <td style="text-align: center;" width="5%" nowrap="nowrap">2</td> <td style="text-align: center;" width="5%" nowrap="nowrap">1</td> <td style="text-align: center;" width="7%" nowrap="nowrap">4,680</td> <td style="text-align: center;" width="15%" nowrap="nowrap">14</td> <td style="text-align: center;" width="13%" nowrap="nowrap">347</td> <td style="text-align: center;" width="5%" nowrap="nowrap">3</td> <td style="text-align: center;" width="7%" nowrap="nowrap">10</td> </tr> </tbody></table>​
*Influenza season officially begins each year at week 40. This season data from week 35 will be included to show the trend of influenza activity before the official start of the 2009-10 influenza season.
**HHS regions (Region 1 CT, ME, MA, NH, RI, VT; Region 2: NJ, NY, Puerto Rico, US Virgin Islands; Region 3: DE, DC, MD, PA, VA, WV; Region 4: AL, FL, GA, KY, MS, NC, SC, TN; Region 5: IL, IN, MI, MN, OH, WI; Region 6: AR, LA, NM, OK, TX; Region 7: IA, KS, MO, NE; Region 8: CO, MT, ND, SD, UT, WY; Region 9: AZ, CA, Guam, HI, NV; and Region 10: AK, ID, OR, WA).
? Elevated means the % of visits for ILI is at or above the national or region-specific baseline
? National data are for current week; regional data are for the most recent three weeks
? Includes all 50 states, the District of Columbia, Guam, Puerto Rico, and U.S. Virgin Islands
? Subtyping results for the majority of specimens in this category were inconclusive because of low virus titers.
U.S. Virologic Surveillance:

WHO and NREVSS collaborating laboratories located in all 50 states and Washington, D.C. report to CDC the number of respiratory specimens tested for influenza and the number positive by influenza type and subtype. The results of tests performed during the current week are summarized in the table below.
<table class="table" align="center" border="0" cellpadding="2" cellspacing="0"> <tbody><tr style="background-image: url(images/purplegrad.jpg); background-repeat: repeat-x;"> <th style="text-align: left;" width="270">
</th> <th style="text-align: center;" width="150" nowrap="nowrap">Week 12</th> </tr> <tr> <td style="text-align: left;" width="270">No. of specimens tested</td> <td style="text-align: center;" width="150" nowrap="nowrap">2,775</td> </tr> <tr> <td style="text-align: left;" width="270">No. of positive specimens (%)</td> <td style="text-align: center;" width="150" nowrap="nowrap">97 (3.5%)</td> </tr> <tr> <td style="text-align: left;" colspan="2">Positive specimens by type/subtype</td> </tr> <tr> <td style="text-align: left;" width="270"> Influenza A</td> <td style="text-align: center;" width="150" nowrap="nowrap">97 (100.0%)</td> </tr> <tr> <td style="text-align: left;" width="270"> A (2009 H1N1)</td> <td align="right" width="150" nowrap="nowrap">59 (60.8%) </td> </tr> <tr> <td style="text-align: left;" width="270"> A (subtyping not performed)</td> <td align="right" width="150" nowrap="nowrap">37 (38.1%) </td> </tr> <tr> <td style="text-align: left;" width="270"> A (unable to subtype)</td> <td align="right" width="150" nowrap="nowrap">0 (0.0%) </td> </tr> <tr> <td style="text-align: left;" width="270"> A (H3)</td> <td align="right" width="150" nowrap="nowrap">1 (1.0%) </td> </tr> <tr> <td style="text-align: left;" width="270"> A (H1)</td> <td align="right" width="150" nowrap="nowrap">0 (0.0%) </td> </tr> <tr> <td style="text-align: left;" width="270"> Influenza B</td> <td style="text-align: center;" width="150" nowrap="nowrap">0 (0.0%)</td> </tr> </tbody></table> <!--*Subtyping results for both specimens in this category were inconclusive because of low levels of viral RNA.
--> During week 12, two influenza B viruses and one influenza A (H3N2) virus were reported, although approximately 99% of all subtyped influenza A viruses reported to CDC this week were 2009 influenza A (H1N1) viruses.

<center>
image121.gif

View WHO-NREVSS Regional Bar Charts | View Chart Data | View Full Screen | View PowerPoint Presentation </center>
Pneumonia and Influenza Hospitalization and Death Tracking:

The Aggregate Hospitalization and Death Reporting Activity (AHDRA) system was implemented on August 30, 2009, and replaces the weekly report of laboratory confirmed 2009 H1N1-related hospitalizations and deaths that began in April 2009. Jurisdictions report to CDC the number of hospitalizations and deaths resulting from all types or subtypes of influenza, not just those associated with 2009 H1N1. Counts were reset to zero on August 30, 2009. From August 30, 2009 ? March 20, 2010, 41,551 laboratory-confirmed influenza-associated hospitalizations and 2,077 laboratory-confirmed influenza-associated deaths were reported to CDC.

<center>
AHDR12_small.gif

View Full Screen
| View Chart Data <!-- --> | View PowerPoint Presentation </center>
Antigenic Characterization:

CDC has antigenically characterized two seasonal influenza A (H1N1), 12 influenza A (H3N2), 23 influenza B, and 1,608 2009 influenza A (H1N1) viruses collected since September 1, 2009.
Both seasonal influenza A (H1N1) viruses tested were related to the influenza A (H1N1) component of the 2009-10 Northern Hemisphere influenza vaccine (A/Brisbane/59/2007).
The 12 influenza A (H3N2) viruses tested showed reduced titers with antisera produced against A/Brisbane/10/2007, the 2009-2010 Northern Hemisphere influenza A (H3N2) vaccine component, and were antigenically related to A/Perth/16/2009, the WHO recommended influenza A (H3N2) component of the 2010 Southern Hemisphere and 2010-11 Northern Hemisphere vaccine formulations.
Influenza B viruses currently circulating globally can be divided into two distinct lineages represented by the B/Yamagata/16/88 and B/Victoria/02/87 viruses. The influenza B component of the 2009-10 and 2010-11 Northern Hemisphere vaccines belongs to the B/Victoria lineage. The 23 influenza B viruses tested belong to the B/Victoria lineage and are related to the influenza vaccine component for the 2009-10 and 2010-11 Northern Hemisphere influenza B vaccine strain (B/Brisbane/60/2008).
One thousand six hundred three (99.7%) of 1,608 2009 influenza A (H1N1) viruses tested are related to the A/California/07/2009 (H1N1) reference virus selected by WHO as the 2009 H1N1 vaccine virus, and as a component in the 2010-11 Northern Hemisphere vaccine. Five viruses (0.3%) tested showed reduced titers with antiserum produced against A/California/07/2009.
Annual influenza vaccination is expected to provide the best protection against those virus strains that are related to the vaccine strains, but limited to no protection may be expected when the vaccine and circulating virus strains are so different as to be from different lineages. Antigenic characterization of 2009 influenza A (H1N1) viruses indicates that these viruses are only distantly related antigenically and genetically to seasonal influenza A (H1N1) viruses, suggesting that little to no protection would be expected from vaccination with seasonal influenza vaccine.
Composition of the 2010-11 Influenza Vaccine:

WHO has recommended vaccine strains for the 2010-11 Northern Hemisphere trivalent influenza vaccine, and FDA has made the same recommendations for the U.S. influenza vaccine. Both agencies recommend that the vaccine contain A/California/7/2009-like (2009 H1N1), A/Perth/16/2009-like (H3N2), and B/Brisbane/60/2008-like (B/Victoria lineage) viruses. A seasonal influenza A (H1N1) component is not included in the 2010-11 formulation and the A (H3N2) component has been changed from the 2009-10 Northern Hemisphere vaccine formulation. This recommendation was based on surveillance data related to epidemiology and antigenic characteristics, serological responses to 2009-10 trivalent seasonal and 2009 H1N1 monovalent vaccines, and the availability of candidate strains and reagents.
Antiviral Resistance:

Since September 1, 2009, one seasonal influenza A (H1N1), 13 influenza A (H3N2), 17 influenza B, and 1,588 2009 influenza A (H1N1) virus isolates have been tested for resistance to the neuraminidase inhibitors (oseltamivir and zanamivir), and 2,573 2009 influenza A (H1N1) original clinical samples were tested for a single known mutation in the virus that confers oseltamivir resistance. In addition, one seasonal influenza A (H1N1), 13 influenza A (H3N2), and 1,608 2009 influenza A (H1N1) virus isolates have been tested for resistance to the adamantanes (amantadine and rimantadine). The results of antiviral resistance testing performed on these viruses are summarized in the table below. Additional laboratories perform antiviral testing and report their results to CDC, and positive results from that testing are included in the footnote.
Antiviral Resistance Testing Results on Samples Collected Since September 1, 2009.

<table class="table" style="text-align: center;" border="0" cellpadding="3" cellspacing="0"> <tbody><tr style="background-image: url(images/purplegrad.jpg); background-repeat: repeat-x;"> <th style="text-align: left;" rowspan="1" width="160">
</th> <th style="text-align: center;" width="100" nowrap="nowrap">Samples tested (n)</th> <th style="text-align: center;" width="100" nowrap="nowrap">Resistant Viruses, Number (%)</th> <th style="text-align: center;" width="100" nowrap="nowrap">Samples tested (n)</th> <th style="text-align: center;" width="100" nowrap="nowrap">Resistant Viruses, Number (%)</th> <th style="text-align: center;" width="100" nowrap="nowrap">Samples tested (n)</th> <th style="text-align: center;" width="100" nowrap="nowrap">Resistant Viruses, Number (%)</th> </tr> <tr bgcolor="#dad5eb"> <th style="text-align: left;" width="160">
</th> <th style="text-align: center;" width="100" nowrap="nowrap">
</th> <th style="text-align: center;" width="100" nowrap="nowrap">Oseltamivir</th> <th style="text-align: center;" width="100" nowrap="nowrap">
</th> <th style="text-align: center;" width="100" nowrap="nowrap">Zanamivir</th> <th style="text-align: center;" width="100" nowrap="nowrap">
</th> <th style="text-align: center;" width="100" nowrap="nowrap">Adamantanes</th> </tr> <tr> <th style="text-align: left;" bgcolor="#dad5eb" width="160" nowrap="nowrap">Seasonal Influenza A (H1N1)</th> <td style="text-align: center;" width="100" nowrap="nowrap">1</td> <td style="text-align: center;" width="100" nowrap="nowrap">1 (100.0)</td> <td style="text-align: center;" width="100" nowrap="nowrap">0</td> <td style="text-align: center;" width="100" nowrap="nowrap">0 (0)</td> <td style="text-align: center;" width="100" nowrap="nowrap">1</td> <td style="text-align: center;" width="100" nowrap="nowrap">0 (0)</td> </tr> <tr> <th style="text-align: left;" bgcolor="#dad5eb" width="160" nowrap="nowrap">Influenza A (H3N2)</th> <td style="text-align: center;" width="100" nowrap="nowrap">13</td> <td style="text-align: center;" width="100" nowrap="nowrap">0 (0)</td> <td style="text-align: center;" width="100" nowrap="nowrap">0</td> <td style="text-align: center;" width="100" nowrap="nowrap">0 (0)</td> <td style="text-align: center;" width="100" nowrap="nowrap">13</td> <td style="text-align: center;" width="100" nowrap="nowrap">13 (100.0)</td> </tr> <tr> <th style="text-align: left;" bgcolor="#dad5eb" width="160" nowrap="nowrap">Influenza B</th> <td style="text-align: center;" width="100" nowrap="nowrap">23</td> <td style="text-align: center;" width="100" nowrap="nowrap">0 (0)</td> <td style="text-align: center;" width="100" nowrap="nowrap">0</td> <td style="text-align: center;" width="100" nowrap="nowrap">0 (0)</td> <td style="text-align: center;" width="100" nowrap="nowrap">N/A*</td> <td style="text-align: center;" width="100" nowrap="nowrap">N/A*</td> </tr> <tr> <th style="text-align: left;" bgcolor="#dad5eb" width="160" nowrap="nowrap">2009 Influenza A (H1N1)</th> <td style="text-align: center;" width="100" nowrap="nowrap">4,289</td> <td style="text-align: center;" width="100" nowrap="nowrap">52?? (1.2)</td> <td style="text-align: center;" width="100" nowrap="nowrap">1,617</td> <td style="text-align: center;" width="100" nowrap="nowrap">0 (0)</td> <td style="text-align: center;" width="100" nowrap="nowrap">1,608</td> <td style="text-align: center;" width="100" nowrap="nowrap">1,604 (99.8)</td> </tr> </tbody></table> *The adamantanes (amantadine and rimantadine) are not effective against influenza B viruses.
?Two screening tools were used to determine oseltamivir resistance: sequence analysis of viral genes or a neuraminidase inhibition assay.
?Additional laboratories perform antiviral resistance testing and report their results to CDC. Three additional oseltamivir resistant 2009 influenza A (H1N1) virus has been identified by these laboratories since September 1, 2009, bringing the total number to 53.
Approximately 99% of all subtyped influenza A viruses reported during week 12 were 2009 influenza A (H1N1) viruses, and nearly all of 2009 H1N1 viruses tested since April 2009 have been resistant to the adamantanes (amantadine and rimantadine).
Antiviral treatment with oseltamivir or zanamivir is recommended for all patients with confirmed or suspected influenza virus infection who are hospitalized or who are at higher risk for influenza complications. Additional information on antiviral recommendations for treatment and chemoprophylaxis of influenza virus infection is available at http://www.cdc.gov/h1n1flu/recommendations.htm.
2009 influenza A (H1N1) viruses were tested for oseltamivir resistance by a neuraminidase inhibition assay and/or detection of genetic sequence mutation, depending on the type of specimen tested. Original clinical samples were examined for a single known mutation in the virus that confers oseltamivir resistance in currently circulating seasonal influenza A (H1N1) viruses, while influenza virus isolates were tested using a neuraminidase inhibition assay that determines the presence or absence of neuraminidase inhibitor resistance, followed by neuraminidase gene sequence analysis of resistant viruses.
The majority of 2009 influenza A (H1N1) viruses are susceptible to the neuraminidase inhibitor antiviral medication oseltamivir; however, rare sporadic cases of oseltamivir resistant 2009 influenza A (H1N1) viruses have been detected worldwide. A total of 62 cases of oseltamivir resistant 2009 influenza A (H1N1) viruses have been identified in the United States since April 2009. This total includes one newly identified case since last week. Fifty-three of these specimens were collected after September 1, 2009. The proportion of oseltamivir-resistant 2009 H1N1 viruses does not represent the prevalence of oseltamivir-resistant 2009 H1N1 in the United States Most cases were tested because drug resistance was suspected. All tested viruses retain their sensitivity to the neuraminidase inhibitor zanamivir. Of the 62 total cases identified since April 2009, 50 patients had documented exposure to oseltamivir through either treatment or chemoprophylaxis, eight patients are under investigation to determine exposure to oseltamivir, three patients had no documented oseltamivir exposure, and in one patient, exposure cannot be determined. Occasional development of oseltamivir resistance during treatment or prophylaxis is not unexpected. Enhanced surveillance, an increased availability of testing performed at CDC, and an increasing number of public health and other clinical laboratories performing antiviral resistance testing increase the number of cases of oseltamivir resistant 2009 influenza A (H1N1) viruses detected. All cases are investigated to assess the spread of resistant strains in the community.
To prevent the spread of antiviral resistant virus strains, CDC reminds clinicians and the public of the need to continue hand and cough hygiene measures for the duration of any symptoms of influenza, even while taking antiviral medications (http://www.cdc.gov/mmwr/preview/mmwrhtml/mm5832a3.htm).
Pneumonia and Influenza (P&I) Mortality Surveillance

During week 12, 7.7% of all deaths reported through the 122-Cities Mortality Reporting System were due to P&I. This percentage was below the epidemic threshold of 7.8% for week 12.
<center>
picurve12.gif

View Full Screen | View PowerPoint Presentation </center> Influenza-Associated Pediatric Mortality

One influenza-associated pediatric death was reported to CDC during week 12 (Mississippi) and was associated with an influenza A virus for which the subtype was undetermined. This death occurred during week 9 (the week ending March 6, 2010).
Since August 30, 2009, CDC has received 268 reports of influenza-associated pediatric deaths that occurred during the current influenza season (48 deaths in children less than 2 years old, 30 deaths in children 2-4 years old, 100 deaths in children 5-11 years old, and 90 deaths in children 12-17 years old). Two hundred eighteen (81%) of the 268 deaths were due to 2009 influenza A (H1N1) virus infections, 49 were associated with an influenza A virus for which the subtype is undetermined, and one was associated with an influenza B virus infection. A total of 278 deaths in children associated with 2009 influenza A (H1N1) virus infection have been reported to CDC.
Among the 268 deaths in children, 143 children had specimens collected for bacterial culture from normally sterile sites and 49 (34.3%) of the 143 were positive; Streptococcus pneumoniae was identified in 11 (22.4%) of the 49 children, and Staphylococcus aureus was identified in 14 (28.6%) of the 49 children. Four S. aureus isolates were sensitive to methicillin, nine were methicillin resistant, and one did not have sensitivity testing performed. Thirty-two (65.3%) of the 49 children with bacterial coinfections were five years of age or older, and 17 (34.7%) of the 49 children were 12 years of age or older.
Laboratory-Confirmed Influenza-Associated Pediatric Deaths by Date and Type/Subtype of Influenza.

<table class="table" align="center" border="0" cellpadding="3" cellspacing="0"> <tbody><tr style="background-image: url(images/purplegrad.jpg); background-repeat: repeat-x;"> <th style="text-align: center;" rowspan="1" width="160">Date</th> <th style="text-align: center;" width="100">2009 H1N1 Influenza</th> <th style="text-align: center;" width="100">Influenza A-Subtype Unknown</th> <th style="text-align: center;" width="100">Seasonal Influenza</th> <th style="text-align: center;" width="100">Total</th> </tr> <tr bgcolor="#dad5eb"> <th style="text-align: center;" width="160">Number of Deaths REPORTED for Current Week ? Week 12 (Week ending March 27, 2010)</th> <td style="text-align: center;" width="100" nowrap="nowrap">1</td> <td style="text-align: center;" width="100" nowrap="nowrap">0</td> <td style="text-align: center;" width="100" nowrap="nowrap">0</td> <td style="text-align: center;" width="100" nowrap="nowrap">1</td> </tr> <tr> <td style="text-align: center;" bgcolor="#dad5eb" width="160">Number of Deaths OCCURRED since August 30, 2009</td> <td style="text-align: center;" width="100" nowrap="nowrap">219</td> <td style="text-align: center;" width="100" nowrap="nowrap">49</td> <td style="text-align: center;" width="100" nowrap="nowrap">1</td> <td style="text-align: center;" width="100" nowrap="nowrap">269</td> </tr> <tr> <td style="text-align: center;" bgcolor="#dad5eb" width="160">Number of Deaths OCCURRED since April 26, 2009</td> <td style="text-align: center;" width="100" nowrap="nowrap">279</td> <td style="text-align: center;" width="100" nowrap="nowrap">52</td> <td style="text-align: center;" width="100" nowrap="nowrap">2</td> <td style="text-align: center;" width="100" nowrap="nowrap">333</td> </tr> </tbody></table>
<center>
IPD12_small.gif

View Full Screen | View PowerPoint Presentation </center> Influenza-Associated Hospitalizations

Laboratory-confirmed influenza-associated hospitalizations are monitored using a population-based surveillance network that includes the 10 Emerging Infections Program (EIP) sites (CA, CO, CT, GA, MD, MN, NM, NY, OR and TN) and 6 new sites (IA, ID, MI, ND, OK and SD).
During September 1, 2009 ? March 20, 2010, the following preliminary laboratory-confirmed overall influenza associated hospitalization rates were reported by EIP and the new sites (rates include influenza A, influenza B, and 2009 influenza A (H1N1)):
Rates [EIP (new sites)] for children aged 0-4 years and 5-17 years were 6.5 (10.4) and 2.5 (3.6) per 10,000, respectively. Rates [EIP (new sites)] for adults aged 18-49 years, 50-64 years, and ≥ 65 years were 2.4 (1.7), 3.1 (2.0) and 2.7 (1.8) per 10,000, respectively.
<center>
EIP12_small.gif

</center> <center> *The 2008-09 EIP rate ended as of April 14, 2009 due to the onset of the 2009 H1N1 season.


View Full Screen | View PowerPoint Presentation </center> Outpatient Illness Surveillance:

Nationwide during week 12, 1.8% of patient visits reported through the U.S. Outpatient Influenza-like Illness Surveillance Network (ILINet) were due to influenza-like illness (ILI). This percentage is below the national baseline of 2.3%
<center>
image122.gif

View ILINet Regional Charts | View Chart Data | View Full Screen | View PowerPoint Presentation
</center>
On a regional level, the percentage of outpatient visits for ILI ranged from 0.5% to 3.5% during week 10. Three of the 10 regions (Region 4, 7, and 9) reported ILI at or above region-specific baseline levels. (Note: Use of the national baseline for regional ILI data or regional baselines for state-level data is not appropriate)
Geographic Spread of Influenza as Assessed by State and Territorial Epidemiologists:

The influenza activity reported by state and territorial epidemiologists indicates geographic spread of both seasonal influenza and 2009 influenza A (H1N1) viruses and does not measure the severity of influenza activity.

  • During week 12, the following influenza activity was reported:
    • No states reported widespread influenza activity.
    • Regional influenza activity was reported by three states (Alabama, Georgia, and South Carolina).
    • Local influenza activity was reported by Puerto Rico and eight states (Arkansas, Hawaii, Louisiana, Mississippi, New Mexico, North Carolina, Tennessee, and Virginia).
    • Sporadic influenza activity was reported by the District of Columbia, Guam, and 31 states (Alaska, Arizona, California, Colorado, Connecticut, Delaware, Florida, Illinois, Indiana, Iowa, Kansas, Kentucky, Maine, Maryland, Michigan, Minnesota, Missouri, Montana, Nevada, New Jersey, New York, Ohio, Oklahoma, Pennsylvania, South Dakota, Texas, Utah, Vermont, Washington, West Virginia, and Wisconsin).
    • Eight states (Idaho, Massachusetts, Nebraska, New Hampshire, North Dakota, Oregon, Rhode Island, and Wyoming) reported no influenza activity.
    • The U.S. Virgin Islands did not report.
 
Re: USA FluView Reports - Week 48 (2009) - Week 12 (2010)

Re: USA FluView Reports - Week 48 (2009) - Week 12 (2010)

Just for the record, I want to reiterate that the %P&I in the above report is incorrect. The raw figures are 878 P&I deaths from a total of 11189 = 7.847%, not the 7.7% stated. If rounded to 7.8%, this figure is at the epidemic threshold.
http://www.cdc.gov/mmwr/preview/mmwrhtml/mm5912md.htm#tab3
 
Re: USA FluView Reports - Week 48 (2009) - Week 12 (2010)

Re: USA FluView Reports - Week 48 (2009) - Week 12 (2010)

:applause: Thanks for pointing that out.
 
Re: USA FluView Reports - Week 48 (2009) - Week 12 (2010)

Re: USA FluView Reports - Week 48 (2009) - Week 12 (2010)

The correct report:

* 97 (3.5%) specimens tested by U.S. World Health Organization (WHO) and National Respiratory and Enteric Virus Surveillance System (NREVSS) collaborating laboratories and reported to CDC/Influenza Division were positive for influenza.
* Approximately 98% of all subtyped influenza A viruses reported to CDC were 2009 influenza A (H1N1) viruses.
* The proportion of deaths attributed to pneumonia and influenza (P&I) was slightly above the epidemic threshold..
* One influenza-associated pediatric death was reported and was associated with 2009 influenza A (H1N1) virus infection.
* The proportion of outpatient visits for influenza-like illness (ILI) was 1.6%, which is below the national baseline of 2.3%. One of 10 regions (Region 9) reported ILI above its regionspecific baseline.
* No states reported widespread influenza activity. Three states reported regional influenza activity. Puerto Rico and seven states reported local influenza activity. The District of Columbia, Guam and 30 states reported sporadic influenza activity. Ten states reported no influenza activity, and the U.S. Virgin Islands did not report.
 
Re: USA FluView Reports - Week 48 (2009) - Week 12 (2010)

Re: USA FluView Reports - Week 48 (2009) - Week 12 (2010)

During week 12, 7.9% (?) of all deaths reported through the 122-Cities Mortality Reporting System were due to P&I. This percentage was above the epidemic threshold of 7.8% for week 12.
 
Re: USA FluView Reports - Week 48 (2009) - Week 12 (2010)

Re: USA FluView Reports - Week 48 (2009) - Week 12 (2010)

this is going since many weeks now.
High P+I mortality depite there being almost no flu.
Still I haven't heard any plausible explanation or even
speculation what this might be due to.

Note, that total deaths are smaller than average,
just P+I deaths are strangely high. And apparantly
nobody has an idea, why.

It would be interesting to compare with other countries
but none have this weekly city-mortality system as
in USA, AFAIK

--------edit---------
ok, there must be weekly mortality data in Sweden
http://www.springerlink.com/content/m806458064rv0432/

but I can't find it online. Maybe someone has an idea how to find it,
good keywords ?

--------edit-----------
I found EURO MOMO
http://www.euromomo.eu/

but

> No EURO MOMO data are available yet.

at least not to the public

Denmark,Ireland,Spain,France,Belgium
------------------------

HongKong mortality is seasonal in the age groups >45,
but not <45, nor Cancer mortality

-----edit,Apr.9---------
Each Monday a file is sent with information on all deaths that were registered by the Belgian
municipalities during the previous week
keyword : be-momo

http://www4.iph.fgov.be/Epidemio/Be-Momo/1 ILI-ARI.htm
 
Re: USA FluView Reports - Week 48 (2009) - Week 12 (2010)

Re: USA FluView Reports - Week 48 (2009) - Week 12 (2010)

HenryN has a good commentary on how US Surveillance is failing because docs are failing to test (less samples sent to lab), rapid tests failing to detect and news downplayed. All this, he points to, is a gross underestimate of cases and reporting. Rising P&I = H1N1.
 
Last edited by a moderator:
Re: USA FluView Reports - Week 48 (2009) - Week 12 (2010)

Re: USA FluView Reports - Week 48 (2009) - Week 12 (2010)

P&I mortality is high despite total mortality ( expecially of the elderly) is low. This is a sign of this pandemic from the beginning and this pattern is lasting.
 
Re: USA FluView Reports - Week 48 (2009) - Week 12 (2010)

Re: USA FluView Reports - Week 48 (2009) - Week 12 (2010)

Naval Health Research Center: Influenza & Adenovirus, shows little H1N1 and:

Type 4 adenovirus remains the predominant cause of FRI among recruits at most training centers.
Type 14 adenovirus is now predominant at CGTC Cape May and is present with lower prevalence at MCRD San Diego.
Type 7 adenovirus is present at Ft. Leonard Wood.
http://www.med.navy.mil/sites/nhrc/geis/Documents/FRIUpdate.pdf

Taiwan surveillance:
http://www.cdc.gov.tw/public/Data/0429293571.pdf
 
Re: USA FluView Reports - Week 48 (2009) - Week 13 (2010)

Re: USA FluView Reports - Week 48 (2009) - Week 13 (2010)

2009-2010 Influenza Season Week 13 ending April 3, 2010

All data are preliminary and may change as more reports are received.
Synopsis:

During week 13 (March 28-April 3, 2010), influenza activity decreased slightly in the U.S.

* 105 (3.7%) specimens tested by U.S. World Health Organization (WHO) and National Respiratory and Enteric Virus Surveillance System (NREVSS) collaborating laboratories and reported to CDC/Influenza Division were positive for influenza.
* All subtyped influenza A viruses reported to CDC were 2009 influenza A (H1N1) viruses.
* The proportion of deaths attributed to pneumonia and influenza (P&I) was below the epidemic threshold.
* One pediatric death associated with laboratory confirmed influenza A was reported; the subtype was undetermined.
* The proportion of outpatient visits for influenza-like illness (ILI) was 1.1%, which is below the national baseline of 2.3%. All 10 regions reported ILI below region-specific baseline levels.
* No states reported widespread influenza activity. Three states reported regional influenza activity. Puerto Rico and three states reported local influenza activity. The District of Columbia, Guam and 33 states reported sporadic influenza activity. Eleven states reported no influenza activity, and the U.S. Virgin Islands did not report.
http://www.cdc.gov/flu/weekly/
 
Last edited by a moderator:
Re: USA FluView Reports - Week 48 (2009) - Week 13 (2010)

Re: USA FluView Reports - Week 48 (2009) - Week 13 (2010)

pretty much down in the ILI-chart
 
Re: USA FluView Reports - Week 48 (2009) - Week 13 (2010)

Re: USA FluView Reports - Week 48 (2009) - Week 13 (2010)

During week 14 (April 4-10, 2010), influenza activity decreased in the U.S.

* 52 (2.7%) specimens tested by U.S. World Health Organization (WHO) and National Respiratory and Enteric Virus Surveillance System (NREVSS) collaborating laboratories and reported to CDC/Influenza Division were positive for influenza.
* Among 34 subtyped influenza A viruses, 33 were 2009 influenza A (H1N1) and one was influenza A (H3).
* The proportion of deaths attributed to pneumonia and influenza (P&I) was below the epidemic threshold.
* Three influenza-associated pediatric deaths were reported. One was associated with 2009 influenza A (H1N1) virus infection, one was associated with an influenza A virus for which the subtype was undetermined, and one death was associated with a seasonal influenza A (H1) virus infection, but occurred during the 2008-09 season.
* The proportion of outpatient visits for influenza-like illness (ILI) was 0.9%, which is below the national baseline of 2.3%. All 10 regions reported ILI below region-specific baseline levels.
* No states reported widespread influenza activity. Two states reported regional influenza activity. Puerto Rico and one state reported local influenza activity. The District of Columbia, Guam and 37 states reported sporadic influenza activity. The U.S. Virgin Islands and nine states reported no influenza activity, and one state did not report.
 
Back
Top