• FluTrackers.com Inc. does not provide medical advice. Information on this web site is collected from various internet resources, and the FluTrackers board of directors makes no warranty to the safety, efficacy, correctness or completeness of the information posted on this site by any author or poster. The information collated here is for instructional and/or discussion purposes only and is NOT intended to diagnose or treat any disease, illness, or other medical condition. Every individual reader or poster should seek advice from their personal physician/healthcare practitioner before considering or using any interventions that are discussed on this website. By continuing to access this website you agree to consult your personal physican before using any interventions posted on this website, and you agree to hold harmless FluTrackers.com Inc., the board of directors, the members, and all authors and posters for any effects from use of any medication, supplement, vitamin or other substance, device, intervention, etc. mentioned in posts on this website, or other internet venues referenced in posts on this website.
  • We are not asking for any donations. Do not donate to any entity who says they are raising funds for us.

USA FluView Reports - Week 48 (2009) - Week 20 (2010)

Re: Fluview week 2

Re: Fluview week 2

Update to Week 2:

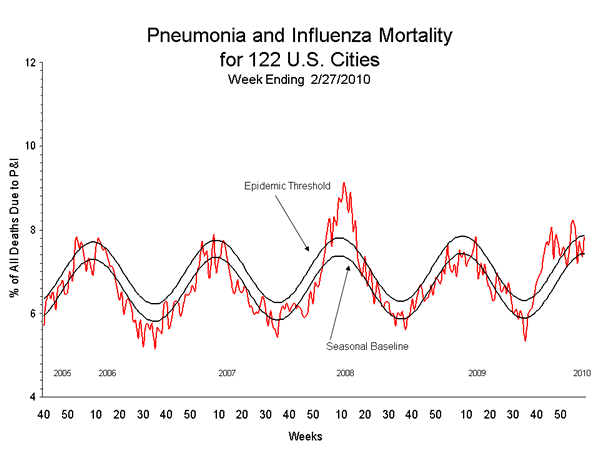
The proportion of deaths attributed to pneumonia and influenza (P&I) based on the 122 Cities Report increased over the previous week and is higher than expected for this time of year. This increase in P&I is thought to result from an increase in reports of pneumonia-associated deaths in older people. These deaths are not necessarily related to flu illness.

International Situation:
For the most recent period reported by WHO FluNet, January 3, 2010 to January 9, 2010, 74.6% of influenza positive specimens were typed as influenza A and 18.2% as influenza B. Out of all subtyped influenza A viruses, 97.2% were 2009 H1N1 positive.

China showing increase in H1N1 cases.
http://www.cdc.gov/h1n1flu/updates/international/
 
Fluview Week3

Fluview Week3

During week 3 (January 17-23, 2010), influenza activity remained at approximately the same levels this week in the U.S.

* 164 (4.6%) specimens tested by U.S. World Health Organization (WHO) and National Respiratory and Enteric Virus Surveillance System (NREVSS) collaborating laboratories and reported to CDC/Influenza Division were positive for influenza.
* All subtyped influenza A viruses reported to CDC were 2009 influenza A (H1N1) viruses.
* The proportion of deaths attributed to pneumonia and influenza (P&I) was above the epidemic threshold.
* Five influenza-associated pediatric deaths were reported. Four deaths were associated with 2009 influenza A (H1N1) virus infection and one was associated with an influenza A virus for which the subtype was undetermined.
* The proportion of outpatient visits for influenza-like illness (ILI) was 1.7% which is below the national baseline of 2.3%. Two of the 10 regions (Regions 4 and 9) reported ILI equal to their region-specific baseline.
* No states reported widespread influenza activity, five states reported regional influenza activity, Puerto Rico and nine states reported local influenza activity, the District of Columbia, Guam, and 33 states reported sporadic influenza activity, and the U.S. Virgin Islands and three states reported no influenza activity.

During week 3, 8.3% of all deaths reported through the 122-Cities Mortality Reporting System were due to P&I. This percentage was above the epidemic threshold of 7.7% for week 3, and is the second consecutive week that the percentage of P&I deaths has been above the epidemic threshold.

Five influenza-associated pediatric deaths were reported to CDC during week 3 (New York [4] and Wisconsin). Four deaths were associated with 2009 influenza A (H1N1) virus infection and one was associated with an influenza A virus for which the subtype was undetermined. The deaths reported during week 3 occurred between November 8, 2009 and January 2, 2010.

The U.S. Virgin Islands and three states (Idaho, Nebraska, and Oregon) reported no influenza activity.
http://www.cdc.gov/flu/weekly/
 
Re: Fluview Week3

Re: Fluview Week3

What is the consensus here regarding the P&I rate? Plus the uptick in Tennessee children? Do you think we are going into Wave 3? I was wondering what ages that the P&I were from, was it from the over 65 or under.
Any info or input would be great.
Thanks in advance.
 
Re: Fluview Week3

Re: Fluview Week3

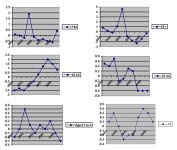
I took the fatality data from the MMWrs week 3 for the past 10 years, expressed the numbers as % rather than fatality count to minimise for missing city data. I got the average for each grouping, and plotted the deviation from average for each of the last 10 years. 2004 stands out as a severe year for P&I with 2010 second highest in the past ten years. However a P&I of 8.2 % represents an increase of about 50-70 fatalities above average in this category, which would translate to around 2-300 nationally.
Age groups from 1-44 are at or about 10 yr lows, 65+ is average, Age groups <1 and 45-64 are above average as a % of total deaths.

week 3 graphs.JPG

week 3 data.JPG
 
Re: Fluview Week3

Re: Fluview Week3

Source: http://www.nytimes.com/2010/01/30/health/30flu.htmlRise Seen in Deaths From Pneumonia and Flu

* Sign in to Recommend
* Twitter
* Sign In to E-Mail
* Print
* Reprints
* ShareClose
o Linkedin
o Digg
o Facebook
o Mixx
o MySpace
o Yahoo! Buzz
o Permalink
o

By DONALD G. McNEIL Jr.
Published: January 29, 2010

Deaths from pneumonia and influenza across the country rose sharply in the weekly flu report released Friday by the Centers for Disease Control and Prevention, but a spokesman for the agency called it merely ?a blip we?re checking out.?

It was premature to conclude that any third wave of swine flu was emerging, said the spokesman, Thomas Skinner.

Underscoring his point, all the other data in the weekly C.D.C. report, along with New York City hospital admission records and visits to campus health centers tracked by the American College Health Association, found that flu activity was still declining across the country, so the rise in deaths was a mystery.

The weekly report showed that 8.3 percent of all deaths in 122 cities were caused by pneumonia or flu, while the normal midwinter level is about 7.7 percent. That 8.3 percent was slightly higher than it was even in late November, when the flu?s fall wave peaked, although the normal level for late fall is about 6 percent.

Lyn Finelli, the disease centers? chief flu epidemiologist, said most of the deaths were from pneumonia and were among the elderly. It was possible, she said, that some cities had delayed reporting deaths over the holidays, which would make later data look artificially high.

No states reported widespread flu activity. What flu exists is clustered in the Southeast, as it was when the second wave began last fall. Nearly all the samples tested have been swine flu, which appears to be crowding out seasonal strains this year. In the panic over swine flu last fall, millions more Americans than usual got seasonal flu shots.
 
Re: Fluview Week3

Re: Fluview Week3

> The deaths reported during week 3 occurred between
> November 8, 2009 and January 2, 2010

they are reporting deaths from Nov. only now ?

-----------edit-------------
ahh, only for the 5 pediatric deaths.
but maybe it happens for deaths in the elderly too

maybe reporting has changed since last year
(Obama,financial crisis
 
Re: Fluview Week3

Re: Fluview Week3

I took the fatality data from the MMWrs week 3 for the past 10 years, expressed the numbers as % rather than fatality count to minimise for missing city data. I got the average for each grouping, and plotted the deviation from average for each of the last 10 years. 2004 stands out as a severe year for P&I with 2010 second highest in the past ten years. However a P&I of 8.2 % represents an increase of about 50-70 fatalities above average in this category, which would translate to around 2-300 nationally.
Age groups from 1-44 are at or about 10 yr lows, 65+ is average, Age groups <1 and 45-64 are above average as a % of total deaths.

View attachment 5661

View attachment 5662

Wow, what great graphs and work. This is very interesting. I wonder what is causing the P&I? If flu numbers are down, what is causing the deaths? Maybe as CDC said, late posting with numbers due to holidays? Thank you so much for your work.
 
Fluview Week 5

Fluview Week 5

Synopsis:

During week 4 (January 24-30, 2010), influenza activity remained at approximately the same levels as last week in the U.S.

* 119 (3.2%) specimens tested by U.S. World Health Organization (WHO) and National Respiratory and Enteric Virus Surveillance System (NREVSS) collaborating laboratories and reported to CDC/Influenza Division were positive for influenza.
* All subtyped influenza A viruses reported to CDC were 2009 influenza A (H1N1) viruses.
* The proportion of deaths attributed to pneumonia and influenza (P&I) was 8.1%
* Nine influenza-associated pediatric deaths were reported. Eight deaths were associated with 2009 influenza A (H1N1) virus infection and one was associated with an influenza A virus for which the subtype was undetermined.(Occuring from Oct 18- Jan 23)
* The proportion of outpatient visits for influenza-like illness (ILI) was 1.8% which is below the national baseline of 2.3%. All regions reported ILI below their region-specific baseline.
* No states reported widespread influenza activity, six states reported regional influenza activity, Puerto Rico and 10 states reported local influenza activity, the District of Columbia, Guam, and 31 states reported sporadic influenza activity, and the U.S. Virgin Islands and three states reported no influenza activity.
http://www.cdc.gov/flu/weekly/
 
Re: Fluview Week 5

Re: Fluview Week 5

Week 5:

During week 5 (January 31-February 6, 2010), influenza activity remained at approximately the same levels as last week in the U.S.

* 206 (4.8%) specimens tested by U.S. World Health Organization (WHO) and National Respiratory and Enteric Virus Surveillance System (NREVSS) collaborating laboratories and reported to CDC/Influenza Division were positive for influenza.
* All subtyped influenza A viruses reported to CDC were 2009 influenza A (H1N1) viruses.
* The proportion of deaths attributed to pneumonia and influenza (P&I) was below the epidemic threshold.
* Three influenza-associated pediatric deaths were reported. Two deaths were associated with 2009 influenza A (H1N1) virus infection and one was associated with an influenza A virus for which the subtype was undetermined.
* The proportion of outpatient visits for influenza-like illness (ILI) was 2.1% which is below the national baseline of 2.3%. Three of 10 regions (Regions 4, 7, and 9) reported ILI above region-specific baseline levels.
* No states reported widespread influenza activity, six states reported regional influenza activity, Puerto Rico and 11 states reported local influenza activity, the District of Columbia, Guam, and 28 states reported sporadic influenza activity, four states reported no influenza activity, and the U.S. Virgin Islands and one state did not report.

Region 4, 7, 8 & 9: elevated outpatient ILI
Regions 7 & 9 are above baseline.

Percent positive specimens increasing
http://www.cdc.gov/flu/weekly/regions2009-2010/hhssenusmap.htm
http://www.cdc.gov/flu/weekly/
 
Fluview Week 6

Fluview Week 6

During week 6 (February 7-13, 2010), influenza activity remained at approximately the same levels as last week in the U.S.

* 129 (3.5%) specimens tested by U.S. World Health Organization (WHO) and National Respiratory and Enteric Virus Surveillance System (NREVSS) collaborating laboratories and reported to CDC/Influenza Division were positive for influenza.
* All subtyped influenza A viruses reported to CDC were 2009 influenza A (H1N1) viruses.
* The proportion of deaths attributed to pneumonia and influenza (P&I) was below the epidemic threshold.
* Two influenza-associated pediatric deaths were reported. Both deaths were associated with 2009 influenza A (H1N1) virus infection.
* The proportion of outpatient visits for influenza-like illness (ILI) was 2.1% which is below the national baseline of 2.3%. Three of 10 regions (Regions 4, 7, and 9) reported ILI above region-specific baseline levels.
* No states reported widespread influenza activity, three states reported regional influenza activity, Puerto Rico and nine states reported local influenza activity, the District of Columbia and 35 states reported sporadic influenza activity, the U.S. Virgin Islands and three states reported no influenza activity, and Guam did not report.
http://www.cdc.gov/flu/weekly/
 
Flu-Related Hospitalizations and Deaths in the United States from April 2009 ? January 30, 2010

Flu-Related Hospitalizations and Deaths in the United States from April 2009 ? January 30, 2010

This Q&A provides updated information about flu-related hospitalizations and deaths in the United States reported to CDC from April 2009 – January 30, 2010.

Deaths per 100,000
ages 0-4: .47
5-24: .5
25-49: 1.03
50-64: 1.69
65+: 1.02
All ages: .97
http://www.cdc.gov/h1n1flu/hosp_deaths_ahdra.htm
 
Fluview Week 7 ending February 20, 2010

Fluview Week 7 ending February 20, 2010

Synopsis:

During week 7 (February 14-20, 2010), influenza activity remained at approximately the same levels as last week in the U.S.

* 185 (4.4%) specimens tested by U.S. World Health Organization (WHO) and National Respiratory and Enteric Virus Surveillance System (NREVSS) collaborating laboratories and reported to CDC/Influenza Division were positive for influenza.
* All subtyped influenza A viruses reported to CDC were 2009 influenza A (H1N1) viruses.
* The proportion of deaths attributed to pneumonia and influenza (P&I) was below the epidemic threshold.
* Three influenza-associated pediatric deaths were reported. One death was associated with 2009 influenza A (H1N1) virus infection and two deaths were associated with an influenza A virus for which the subtype was undetermined.
* The proportion of outpatient visits for influenza-like illness (ILI) was 1.8% which is below the national baseline of 2.3%. Three of 10 regions (Regions 1, 4, and 7) reported ILI above region-specific baseline levels.
* No states reported widespread influenza activity, three states reported regional influenza activity, Puerto Rico and eight states reported local influenza activity, the District of Columbia, Guam, and 35 states reported sporadic influenza activity, the U.S. Virgin Islands and four states reported no influenza activity.
 
Re: Fluview Week 48 (2009) - Week 8 (2010)

Re: Fluview Week 48 (2009) - Week 8 (2010)

Synopsis:

During week 8 (February 21-27, 2010), influenza activity remained at approximately the same levels as last week in the U.S.

* 263 (6.4%) specimens tested by U.S. World Health Organization (WHO) and National Respiratory and Enteric Virus Surveillance System (NREVSS) collaborating laboratories and reported to CDC/Influenza Division were positive for influenza.
* Over 99% of all subtyped influenza A viruses reported to CDC were 2009 influenza A (H1N1) viruses.
* The proportion of deaths attributed to pneumonia and influenza (P&I) was below the epidemic threshold.
* One influenza-associated pediatric death was reported and was associated with an influenza B virus infection. This death occurred during the 2008-09 influenza season.
* The proportion of outpatient visits for influenza-like illness (ILI) was 1.7% which is below the national baseline of 2.3%. Two of 10 regions (Regions 4 and 9) reported ILI above region-specific baseline levels.
* No states reported widespread influenza activity, four states reported regional influenza activity, Puerto Rico and eight states reported local influenza activity, the District of Columbia, Guam, and 34 states reported sporadic influenza activity, four states reported no influenza activity, and the U.S. Virgin Islands did not report
http://www.cdc.gov/flu/weekly/
 
Re: Fluview Week 48 (2009) - Week 8 (2010)

Re: Fluview Week 48 (2009) - Week 8 (2010)

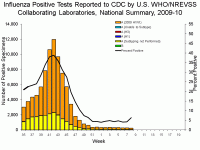
There appears to be a 45% increase in the specimens tested by U.S. World Health Organization (WHO) and National Respiratory and Enteric Virus Surveillance System (NREVSS) collaborating laboratories and reported to CDC/Influenza Division that were positive for influenza from week 7 to 8. (of which 99% were A/H1N1).


Week 8 -

"263 (6.4%) specimens tested by U.S. World Health Organization (WHO) and National Respiratory and Enteric Virus Surveillance System (NREVSS) collaborating laboratories and reported to CDC/Influenza Division were positive for influenza."

Week 7 -

"185 (4.4%) specimens tested by U.S. World Health Organization (WHO) and National Respiratory and Enteric Virus Surveillance System (NREVSS) collaborating laboratories and reported to CDC/Influenza Division were positive for influenza."


The week over week change (4.4% increased to 6.4%) is a 45% increase (rounded).

Is this a trend? We will need to see more than 1 week of data.

This data still at or below epidemic curve for this time of year.


<center>
picurve08.gif

View Full Screen | View PowerPoint Presentation </center>
 
Re: Fluview Week 48 (2009) - Week 8 (2010)

Re: Fluview Week 48 (2009) - Week 8 (2010)

International situation as of Feb28:

"Based on FluNet data collected by 28 countries from February 14 to February 20, 2010, 75% of all subtyped influenza A viruses were 2009 H1N1 positive. 40.6% of specimens testing positive for influenza were typed as influenza A and 59.4% as influenza B."

NOTE: This is primary due to China with large portion of B (In week 7 China shows 89.1% B)
http://www.cdc.gov/h1n1flu/updates/international/
 
Re: Fluview Week 48 (2009) - Week 8 (2010)

Re: Fluview Week 48 (2009) - Week 8 (2010)

The week 8 fluview has updates on week 7 surveillance which make the jump even greater.
View attachment 5881

Week 7: The update has 271 positive flu tests from 6417 samples (4.22%) of which 185 (2.88%) were definitively identified as H1N1.

http://www.cdc.gov/flu/weekly/weeklyarchives2009-2010/data/whoAllregt08.htm


Yes, thanks for pointing this out. So we are actually in the 2nd week of increases. Not unexpected for this time of year. Week 10 is traditionally the peak of the US flu season.

If we have a steep increase for the 3rd week then this is a possible trend and we should copy the data from weeks 6,7,8, and 9 to a new thread specific to this phenomena.
 
Back
Top