• FluTrackers.com Inc. does not provide medical advice. Information on this web site is collected from various internet resources, and the FluTrackers board of directors makes no warranty to the safety, efficacy, correctness or completeness of the information posted on this site by any author or poster. The information collated here is for instructional and/or discussion purposes only and is NOT intended to diagnose or treat any disease, illness, or other medical condition. Every individual reader or poster should seek advice from their personal physician/healthcare practitioner before considering or using any interventions that are discussed on this website. By continuing to access this website you agree to consult your personal physican before using any interventions posted on this website, and you agree to hold harmless FluTrackers.com Inc., the board of directors, the members, and all authors and posters for any effects from use of any medication, supplement, vitamin or other substance, device, intervention, etc. mentioned in posts on this website, or other internet venues referenced in posts on this website.
  • We are not asking for any donations. Do not donate to any entity who says they are raising funds for us.

USA FluView Reports - Week 48 (2009) - Week 20 (2010)

Re: Influenza-associated pediatric mortality--Week 43

Re: Influenza-associated pediatric mortality--Week 43

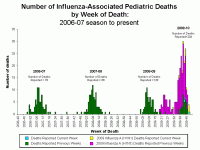
Bringing the total number of influenza associated pediatric fatalities in 2009 to 210.
 
Re: Influenza-associated pediatric mortality--Week 43

Re: Influenza-associated pediatric mortality--Week 43

"Since April 26, 2009, a total of 129 influenza-associated pediatric deaths associated with 2009 pandemic influenza A (H1N1) virus infection have been reported. Since August 30, 2009, a total of 85 influenza-associated pediatric deaths occurring during the 2009--10 influenza season have been reported. A total of 124 influenza-associated pediatric death occurring during the 2008-09 influenza season have been reported."
 
USA FluView Reports - Week 48 (2009) - Week 20 (2010)

"Synopsis:

During week 48 (November 29-December 5, 2009), influenza activity continued to decrease in the U.S

* 478 (8.9%) specimens tested by U.S. World Health Organization (WHO) and National Respiratory and Enteric Virus Surveillance System (NREVSS) collaborating laboratories and reported to CDC/Influenza Division were positive for influenza.
* Over 99% of all subtyped influenza A viruses being reported to CDC were 2009 influenza A (H1N1) viruses.
* The proportion of deaths attributed to pneumonia and influenza (P&I) was above the epidemic threshold for the tenth consecutive week.
* Sixteen influenza-associated pediatric deaths were reported. Thirteen of these deaths were associated with 2009 influenza A (H1N1) virus infection, two were associated with an influenza A virus for which the subtype was undetermined, and one was associated with an influenza B virus infection.
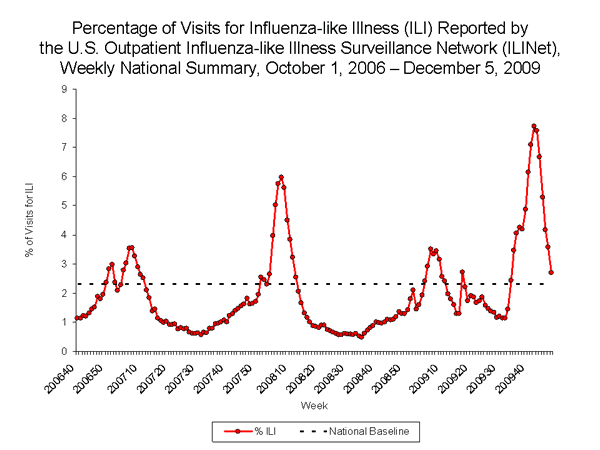
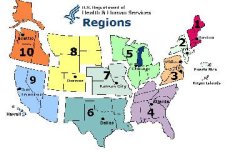
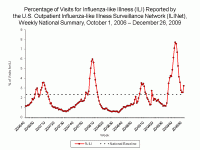
* The proportion of outpatient visits for influenza-like illness (ILI) was 2.7% which is above the national baseline of 2.3%. Six of the 10 regions reported ILI at or above region-specific baseline levels. Regions 3, 6, 8 and 10 reported ILI below their region specific baselines.
* Fourteen states reported geographically widespread influenza activity, Puerto Rico and 25 states reported regional influenza activity, the District of Columbia and seven states reported local influenza activity, and the U.S. Virgin Islands, Guam and four states reported sporadic influenza activity.

During week 48, seasonal influenza A (H1N1) and influenza B viruses co-circulated at low levels with 2009 influenza A (H1N1) viruses. Over 99% of all subtyped influenza A viruses reported to CDC this week were 2009 influenza A (H1N1) viruses.

During week 48, 7.8% of all deaths reported through the 122-Cities Mortality Reporting System were due to P&I. This percentage was above the epidemic threshold of 7.1% for week 48. Including week 48, P&I mortality has been above threshold for 10 consecutive weeks.

Sixteen influenza-associated pediatric deaths were reported to CDC during week 48 (Alabama, Arizona [2], California [3], Colorado, Minnesota [4], Missouri [2], New Mexico, North Carolina, and Virginia). Thirteen of these deaths were associated with 2009 influenza A (H1N1) virus infection, two were associated with an influenza A virus for which the subtype is undetermined, and one was associated with an influenza B virus infection. The deaths reported during week 48 occurred between August 9 and December 5, 2009."
http://www.cdc.gov/flu/weekly/

 
Last edited:
Re: CDC Week 48

Re: CDC Week 48

falls like a stone. Faster than it did rise.
So similar curves: New Zealand,Hongkong,Netherlands,Argentina...
It can't be the weather.
What is it, that makes the waves end abruptly but still allows another wave
some months later {some short-term immunity !?!}
Deaths are still high, there is usualy a delay in the deaths-curve


image482.gif
 
Re: CDC Week 48

Re: CDC Week 48

ped fat.gif

CDC estimated number of children killed by influenza up to Nov 14: 1,090
This included 550 pediatric fatalities between Oct 17 and Nov 14.
138 children each week.

This is Dec 11, a reasonable estimate of pediatric fatalities at this time is 1,650.
 
Weekly Flu Report Week 49

Weekly Flu Report Week 49

During week 49 (December 6-12, 2009), influenza activity continued to decrease in the U.S.

* 391 (6.9%) specimens tested by U.S. World Health Organization (WHO) and National Respiratory and Enteric Virus Surveillance System (NREVSS) collaborating laboratories and reported to CDC/Influenza Division were positive for influenza.
* Over 99% of all subtyped influenza A viruses being reported to CDC were 2009 influenza A (H1N1) viruses.
* The proportion of deaths attributed to pneumonia and influenza (P&I) was above the epidemic threshold for the eleventh consecutive week.
* Nine influenza-associated pediatric deaths were reported. Eight of these deaths were associated with 2009 influenza A (H1N1) virus infection and one was associated with an influenza A virus for which the subtype was undetermined.
* The proportion of outpatient visits for influenza-like illness (ILI) was 2.6% which is above the national baseline of 2.3%. Five of the 10 regions reported ILI at or above region-specific baseline levels. Regions 3, 6, 7, 8 and 10 reported ILI below their region specific baselines.
* Eleven states reported geographically widespread influenza activity, 20 states reported regional influenza activity, the District of Columbia, Puerto Rico, and 11 states reported local influenza activity, the U.S. Virgin Islands and eight states reported sporadic influenza activity, and Guam reported no influenza activity
http://www.cdc.gov/flu/weekly/
 
Re: Weekly Flu Report Week 49

Re: Weekly Flu Report Week 49

Six hundred ten (99.7%) of 612 2009 influenza A (H1N1) viruses tested are related to the A/California/07/2009 (H1N1) reference virus selected by WHO as the 2009 H1N1 vaccine virus and two viruses (0.3%) tested showed a reduced titer with antiserum produced against A/California/07/2009

That's up one from last week.
 
CDC Week 50

CDC Week 50

"Synopsis:

During week 50 (December 13-19, 2009), influenza activity continued to decrease in the U.S.

* 306 (6.9%) specimens tested by U.S. World Health Organization (WHO) and National Respiratory and Enteric Virus Surveillance System (NREVSS) collaborating laboratories and reported to CDC/Influenza Division were positive for influenza.
* All subtyped influenza A viruses being reported to CDC were 2009 influenza A (H1N1) viruses.
* The proportion of deaths attributed to pneumonia and influenza (P&I) was below the epidemic threshold.
* Nine influenza-associated pediatric deaths were reported. Eight of these deaths were associated with 2009 influenza A (H1N1) virus infection and one was associated with an influenza A virus for which the subtype was undetermined.
* The proportion of outpatient visits for influenza-like illness (ILI) was 2.3% which is at the national baseline of 2.3%. Seven of the 10 regions (1, 3, 5, 6, 7, 8 and 10) reported ILI below region-specific baseline levels.
* Seven states reported geographically widespread influenza activity, 18 states reported regional influenza activity, the District of Columbia, Puerto Rico, and 13 states reported local influenza activity, the U.S. Virgin Islands and 11 states reported sporadic influenza activity, Guam and one state reported no influenza activity.

During week 50, 7.2% of all deaths reported through the 122-Cities Mortality Reporting System were due to P&I. This percentage was below the epidemic threshold of 7.3% for week 50.

Nine influenza-associated pediatric deaths were reported to CDC during week 50 (Iowa [3], New Jersey, New York [2], Ohio, South Carolina, and West Virginia). Eight of these deaths were associated with 2009 influenza A (H1N1) virus infection and one was associated with an influenza A virus for which the subtype is undetermined. The deaths reported during week 50 occurred between October 11 and December 12, 2009."
http://www.cdc.gov/flu/weekly/
 
Re: CDC Week 50

Re: CDC Week 50

92 viruses tested for H274Y last week. Two viruses positive. That's 2.2% of tested samples.
 
Re: CDC Week 50

Re: CDC Week 50

Proportion of Emergency Department Visits For Influenza-Like Illness (ILI) per Week:

More specifically, within those regions, 9 are going up. And it also appears that AZ,MN and GA have a trend upwards, even though they are listed as stable.

http://www.isdsdistribute.org/
 
Re: CDC Week 50

Re: CDC Week 50

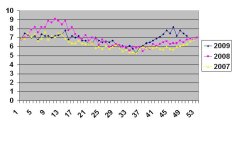
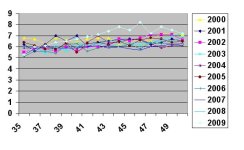
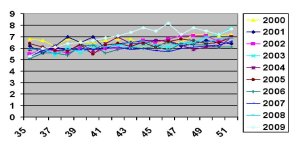
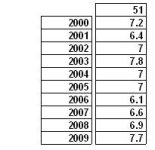
P&I up to 7.7% second highest in the last 10 years.

P&I 10 yr.JPG
week 51 P&I.JPG

Four influenza-associated pediatric deaths were reported to CDC during week 51 (Florida [2], Massachusetts, and Texas). Two of these deaths were associated with 2009 influenza A (H1N1) virus infection and two were associated with an influenza A virus for which the subtype is undetermined. The deaths reported during week 51 occurred between August 30 and December 19, 2009.

Since August 30, 2009, CDC has received 225 reports of influenza-associated pediatric deaths that occurred during the current influenza season (42 deaths in children less than 2 years old, 25 deaths in children 2-4 years old, 83 deaths in children 5-11 years old, and 75 deaths in children 12-17 years old). One hundred eighty-three (81%) of the 225 deaths were due to 2009 influenza A (H1N1) virus infections, 41 were associated with influenza A virus for which the subtype is undetermined, and one was associated with an influenza B virus infection. A total of 243 deaths in children associated with 2009 influenza A (H1N1) virus infection have been reported to CDC.
http://www.cdc.gov/flu/weekly/
 
Re: CDC Week 51 fluview

Re: CDC Week 51 fluview

Synopsis:
During week 51 (December 20-26, 2009), influenza activity decreased slightly in the U.S.

?154 (3.9%) specimens tested by U.S. World Health Organization (WHO) and National Respiratory and Enteric Virus Surveillance System (NREVSS) collaborating laboratories and reported to CDC/Influenza Division were positive for influenza.
?All subtyped influenza A viruses reported to CDC were 2009 influenza A (H1N1) viruses.
?The proportion of deaths attributed to pneumonia and influenza (P&I) was above the epidemic threshold.
?Four influenza-associated pediatric deaths were reported. Two of these deaths were associated with 2009 influenza A (H1N1) virus infection and two were associated with an influenza A virus for which the subtype was undetermined.
?The proportion of outpatient visits for influenza-like illness (ILI) was 3.2% which is above the national baseline of 2.3%. Two of the 10 regions (1 and 10) reported ILI below region-specific baseline levels.
?o Four states reported geographically widespread influenza activity, 13 states reported regional influenza activity, the District of Columbia, Puerto Rico, and 19 states reported local influenza activity, Guam and 13 states reported sporadic influenza activity, and one state reported no influenza activity, the U.S. Virgin Islands did not report.
http://www.cdc.gov/flu/weekly/
 
Re: CDC Week 51 fluview

Re: CDC Week 51 fluview

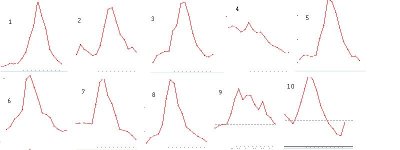
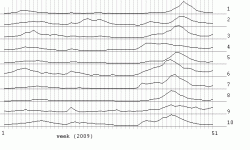
Code:
region
   relative amount of ILI in wave 1
       relative amount of ILI in wave 2
             total
--------------------------
 2  53  70  123
 9  41  86  127
10  31  80  111
 3  29  84  113
 6  28 125  153
 4  22  83  105
 5  19  67   86
 8  11  54   65
 1  10  52   62
 7   9  94  103


attachment.php
 

Attachments

  • usili9.gif
    usili9.gif
    6.8 KB · Views: 1
Back
Top