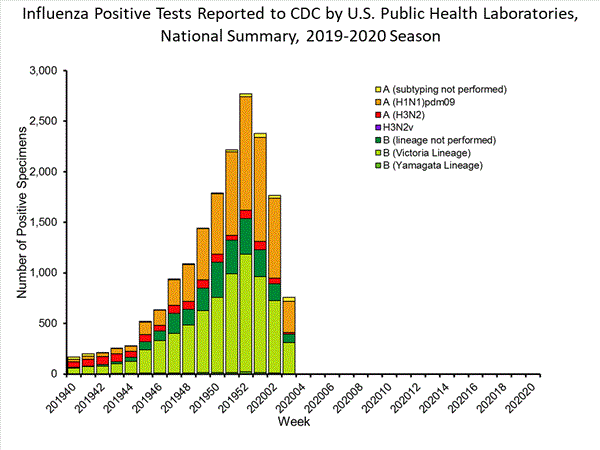
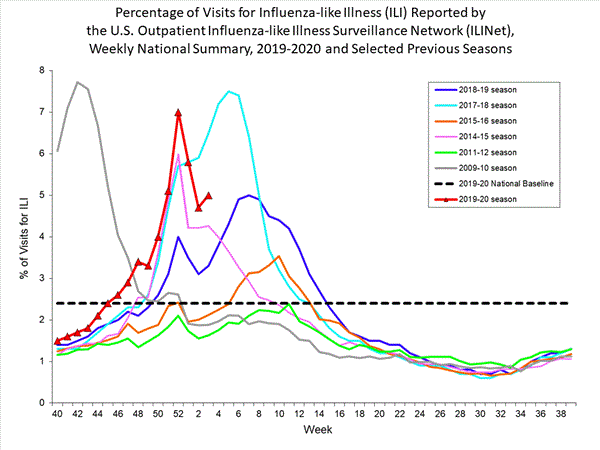
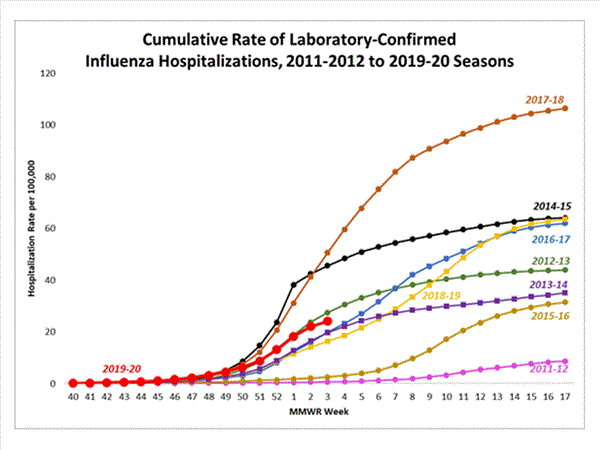
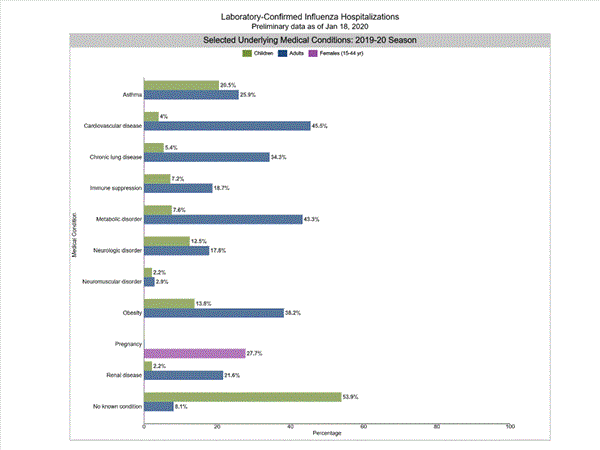
• FluTrackers.com Inc. does not provide medical advice. Information on this web site is collected from various internet resources, and the FluTrackers board of directors makes no warranty to the safety, efficacy, correctness or completeness of the information posted on this site by any author or poster. The information collated here is for instructional and/or discussion purposes only and is NOT intended to diagnose or treat any disease, illness, or other medical condition. Every individual reader or poster should seek advice from their personal physician/healthcare practitioner before considering or using any interventions that are discussed on this website. By continuing to access this website you agree to consult your personal physican before using any interventions posted on this website, and you agree to hold harmless FluTrackers.com Inc., the board of directors, the members, and all authors and posters for any effects from use of any medication, supplement, vitamin or other substance, device, intervention, etc. mentioned in posts on this website, or other internet venues referenced in posts on this website.
  • We are not asking for any donations. Do not donate to any entity who says they are raising funds for us.

USA FluView 2019-20

Ronan Kelly

Retired 2020
[h=1]Weekly U.S. Influenza Surveillance Report[/h]
Espa?ol

FluView_header.jpg

Key Updates for Week 40 ending October 5, 2019

According to this week’s FluView report, seasonal influenza activity remains low in the United States. [h=4]Viruses[/h]
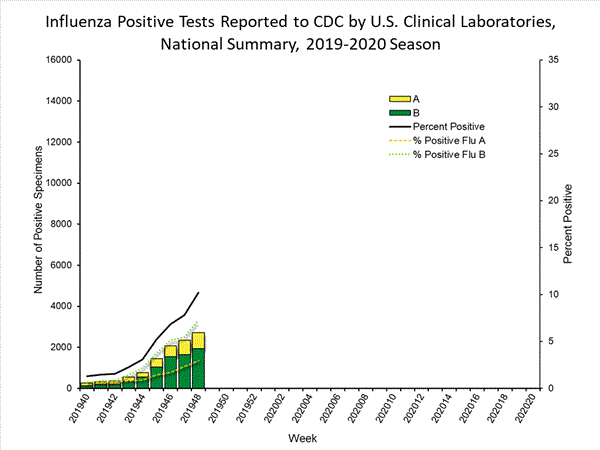
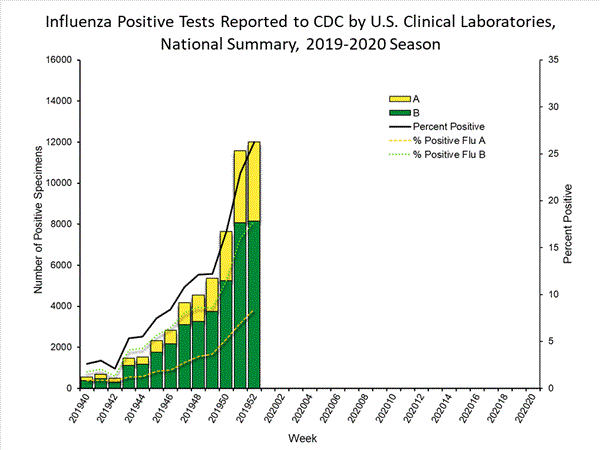
Clinical Lab
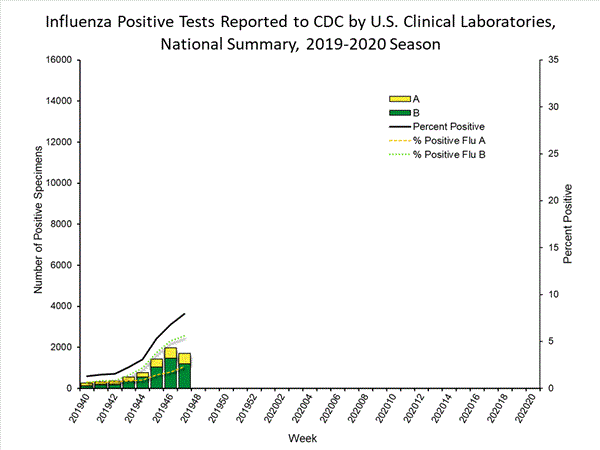
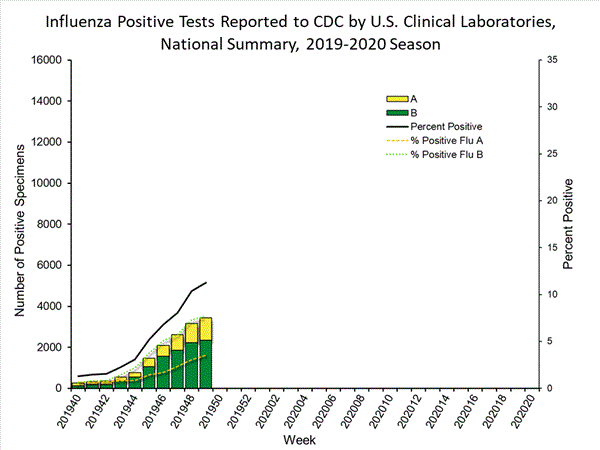
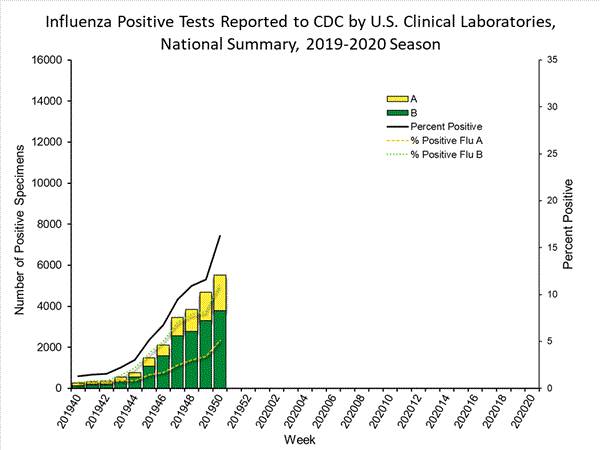
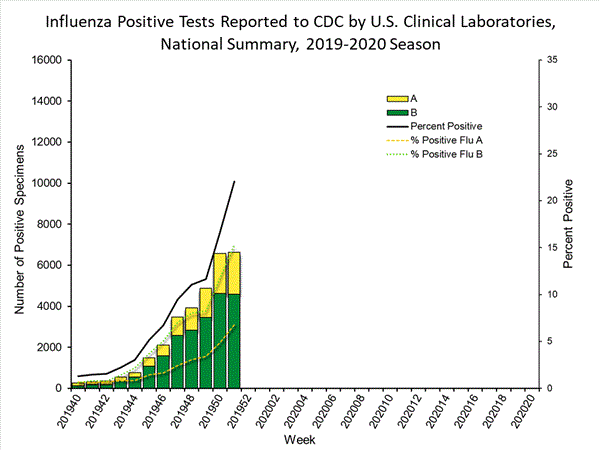
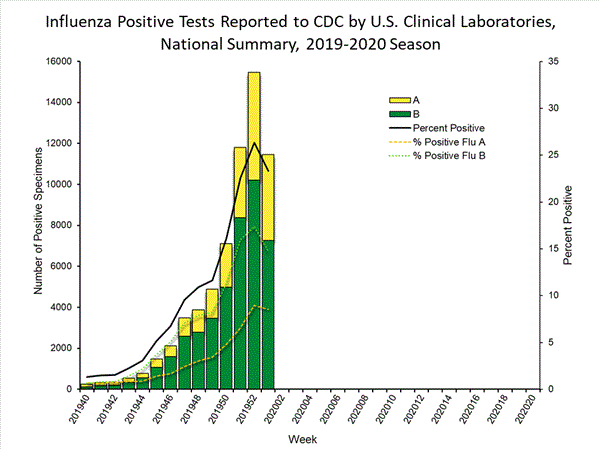
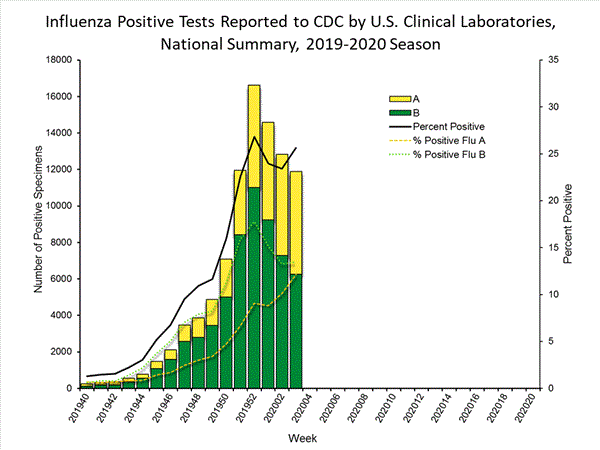
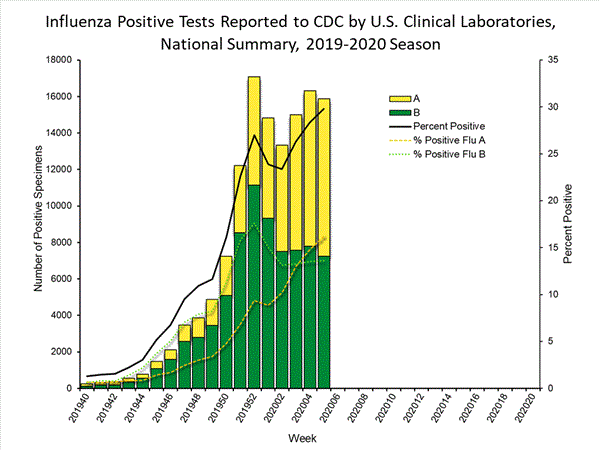
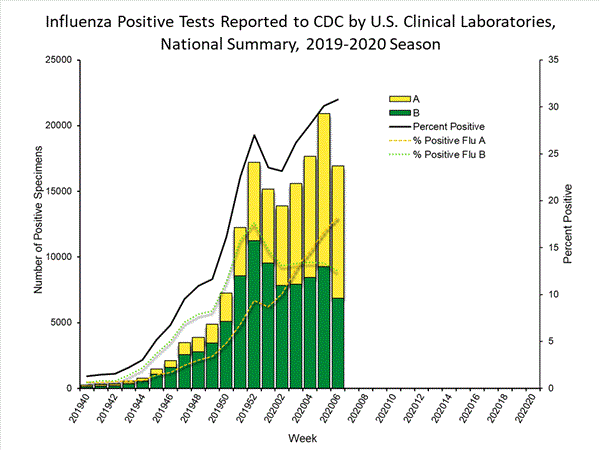
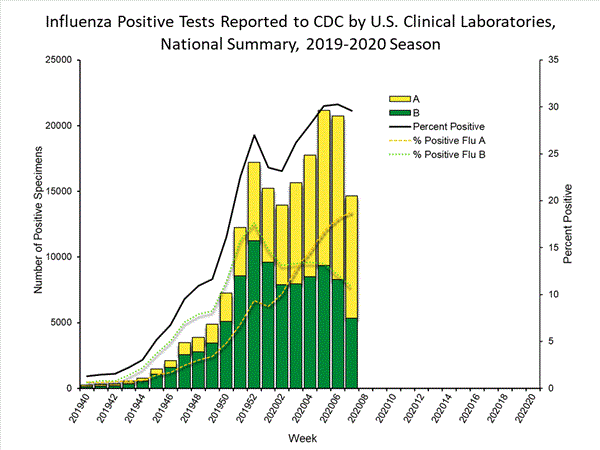
3.1% of respiratory specimens tested in clinical laboratories were positive for influenza viruses. This is approximately the same as the previous week.

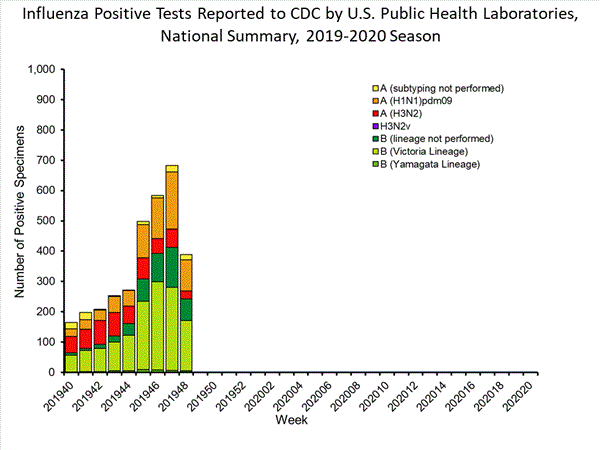
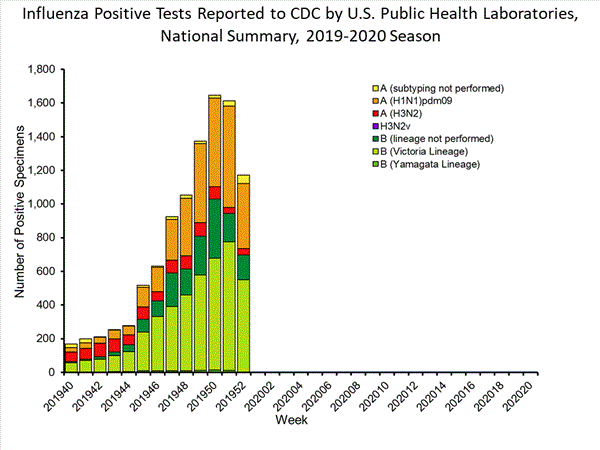
Public Health Lab
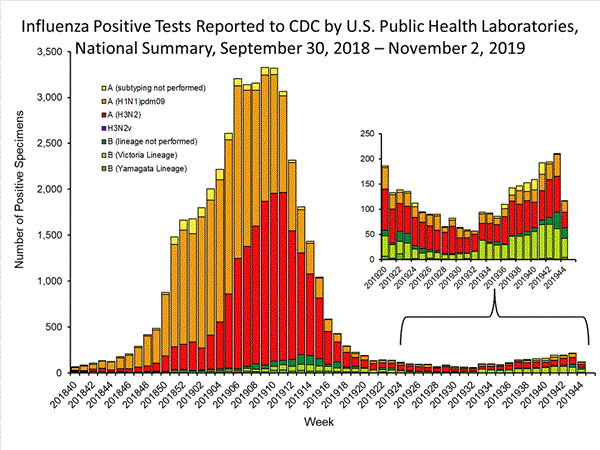
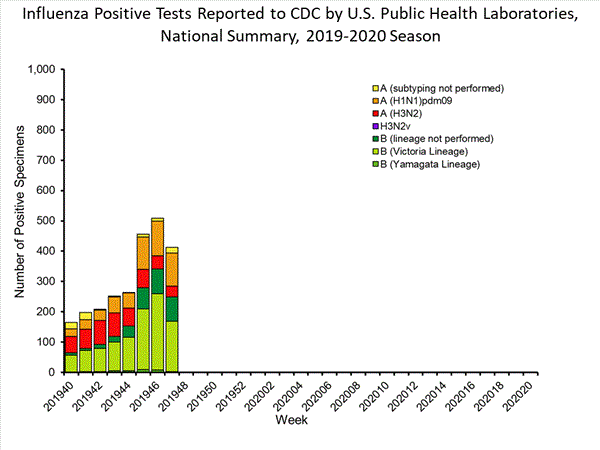
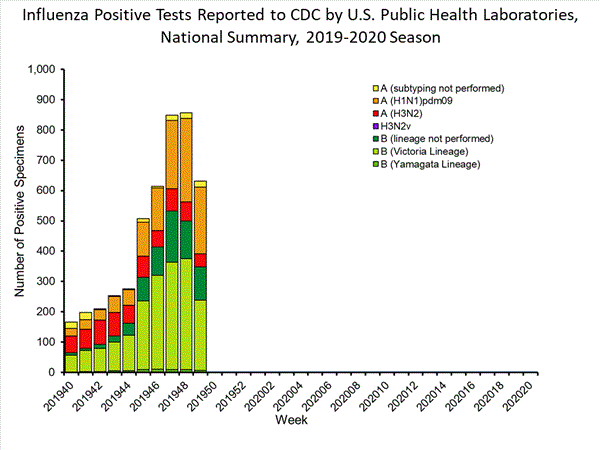
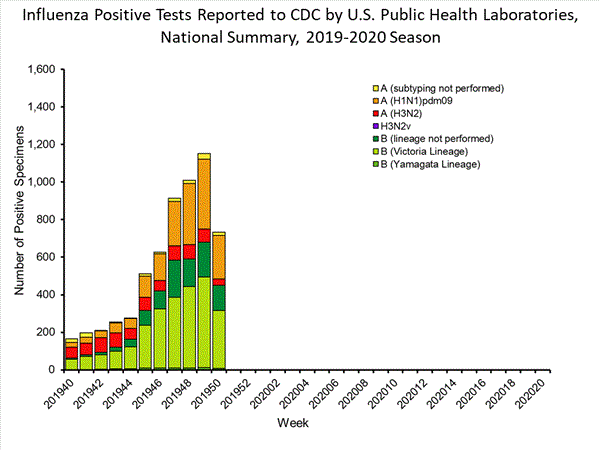
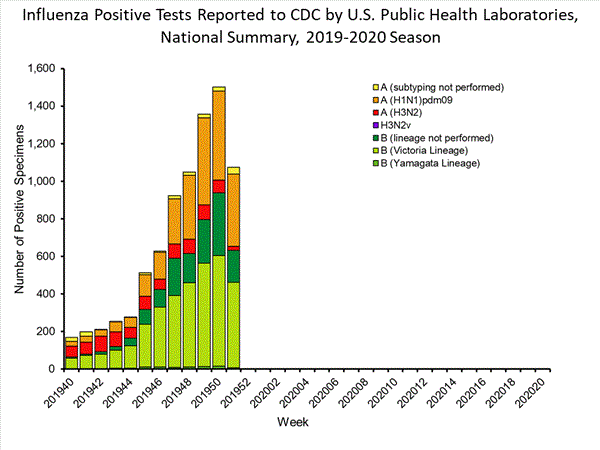
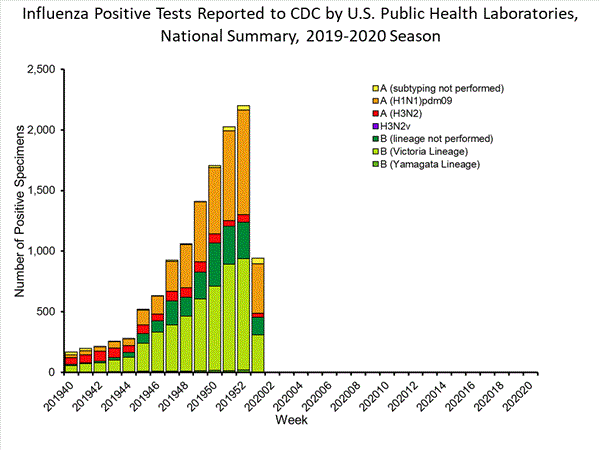
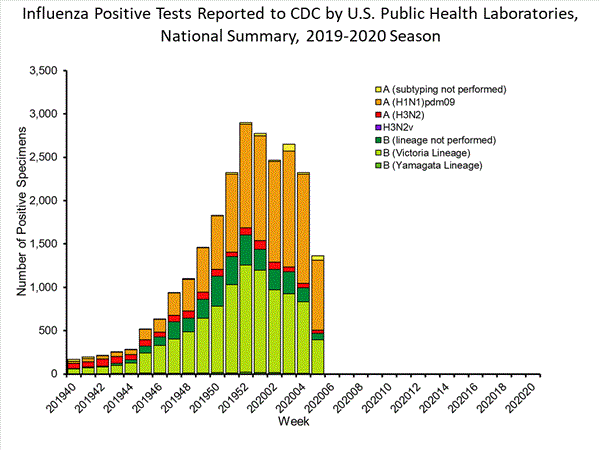
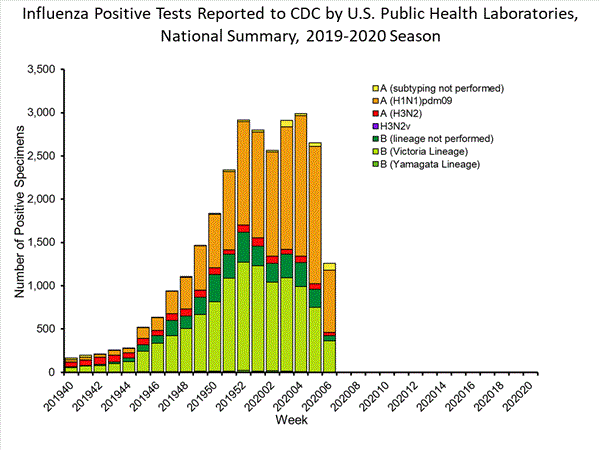
Influenza A viruses predominated this week with equal numbers of (H3N2) and (H1N1)pdm09 viruses reported.

Virus Characterization

Reporting for 2019-2020 will begin when a sufficient number of viruses have been characterized. A summary of influenza virus characterization data through September 28 is available. [h=4]Illness[/h] Outpatient Illness: ILINet
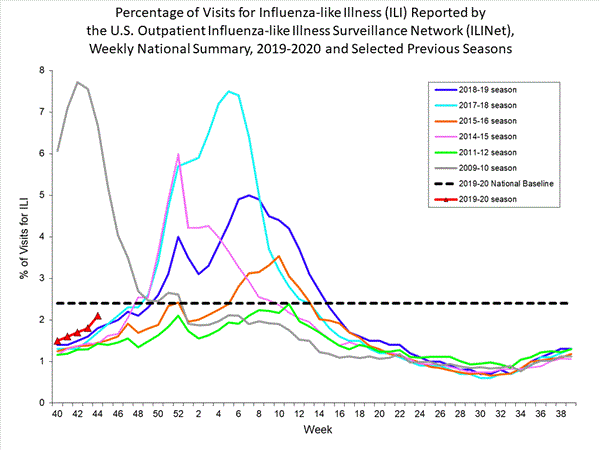
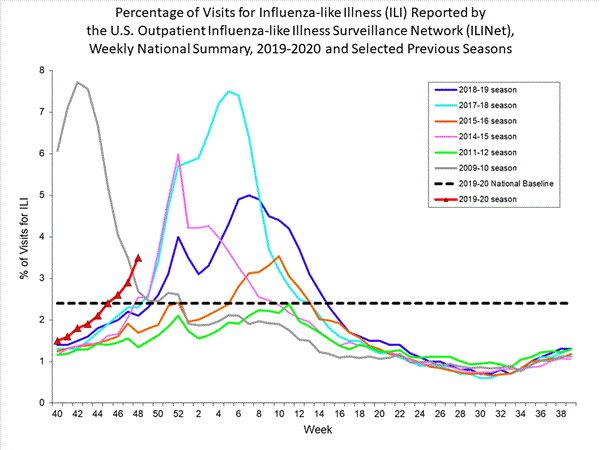
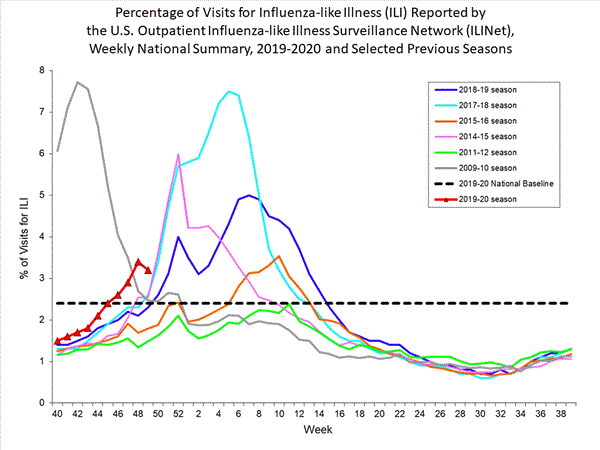
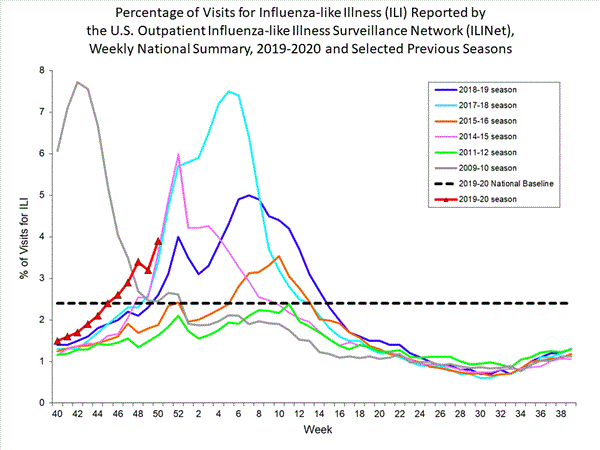
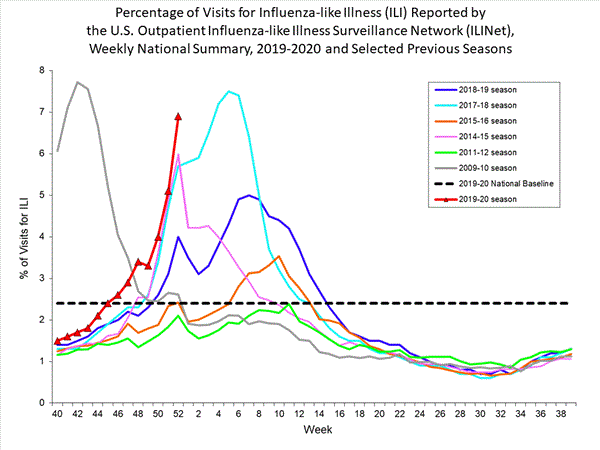
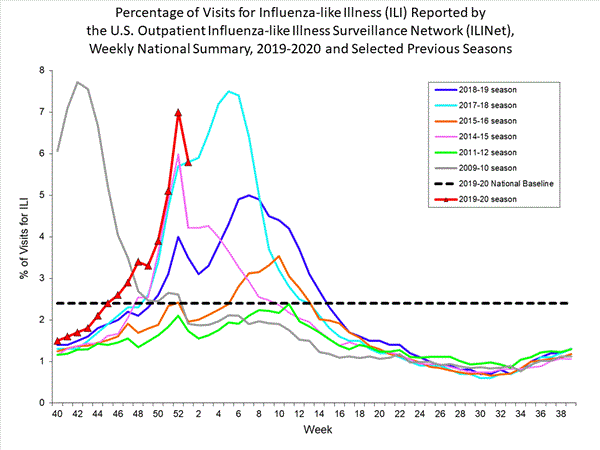
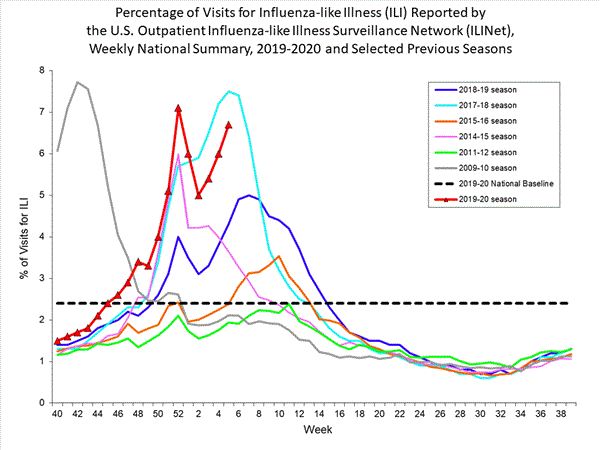
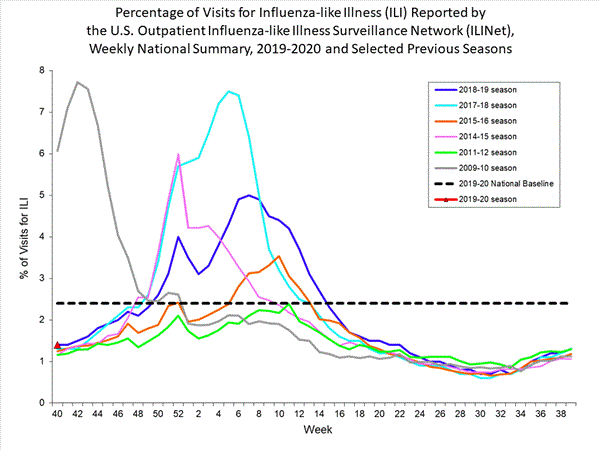
1.4% of visits to a health care provider were for ILI. ILI activity remains below the national baseline of 2.4% but increased slightly from the previous week.

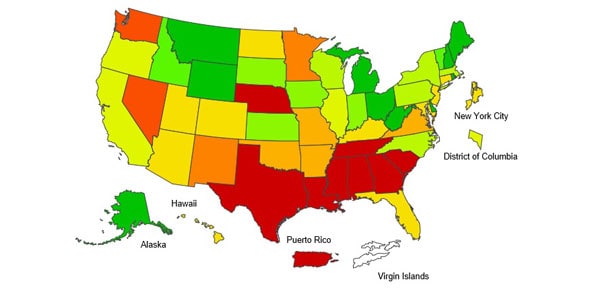
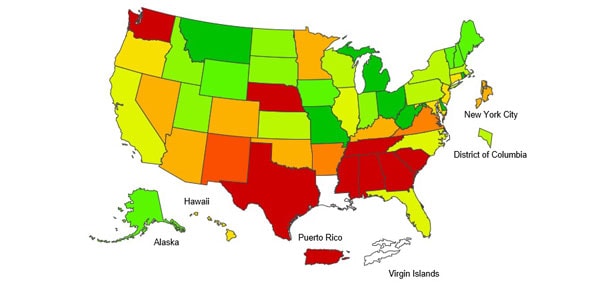
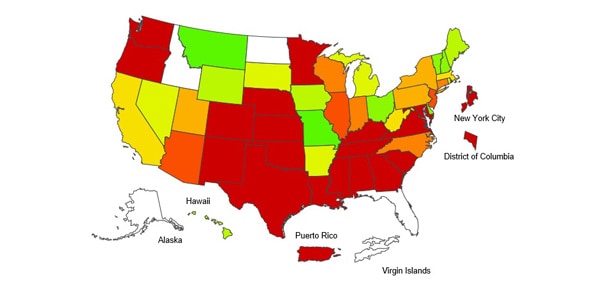
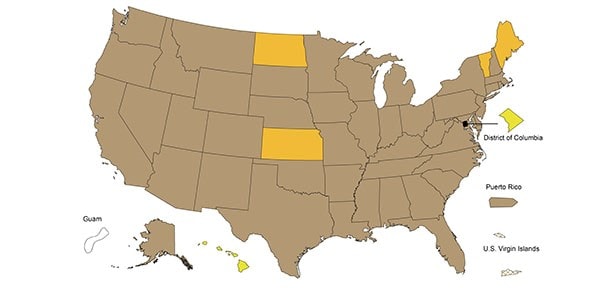
Outpatient Illness: ILI Activity Map
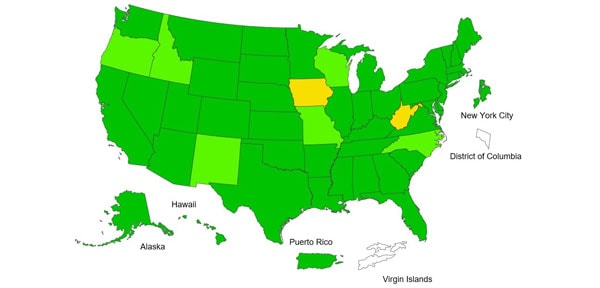
Flu-Survey-Map - Flu Activity & Surveillance


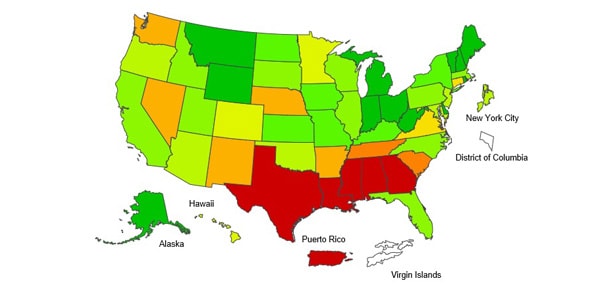
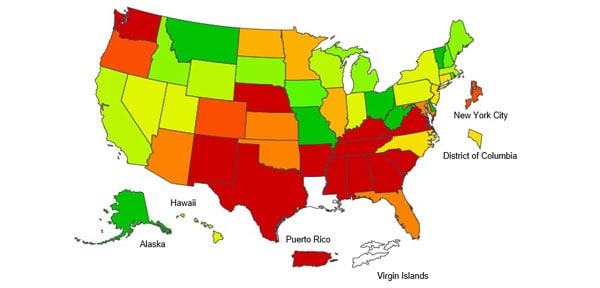
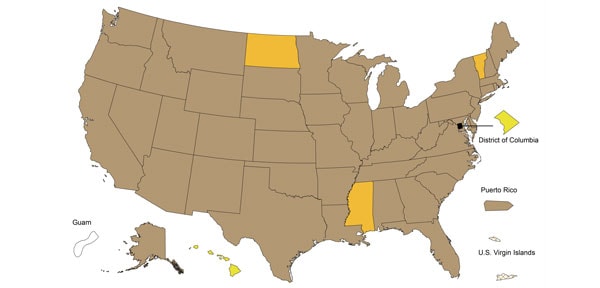
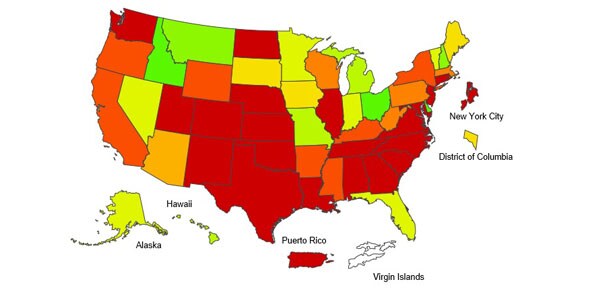
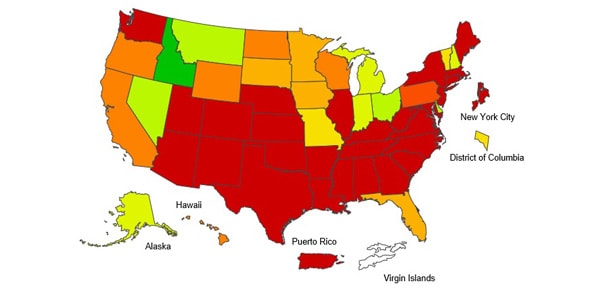
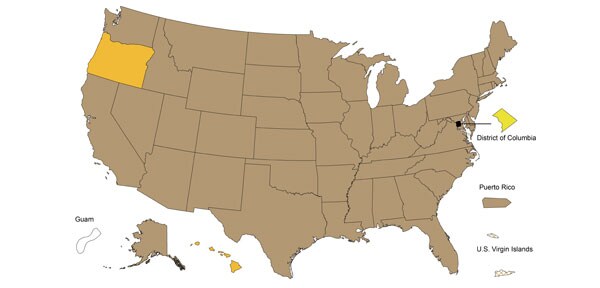
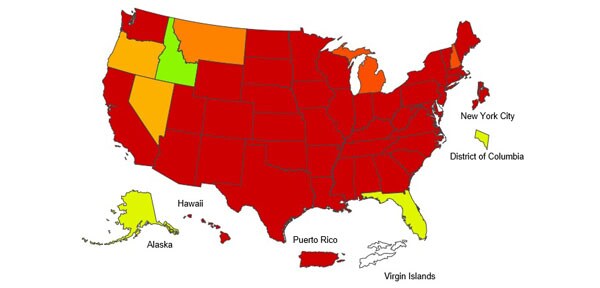
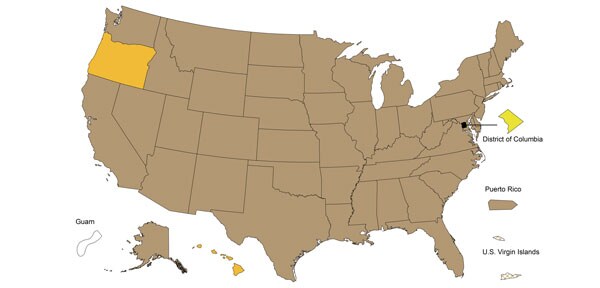
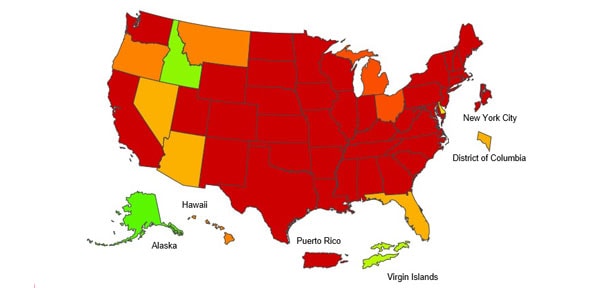
The majority of jurisdictions experienced minimal ILI activity; however, Louisiana experienced moderate ILI activity.

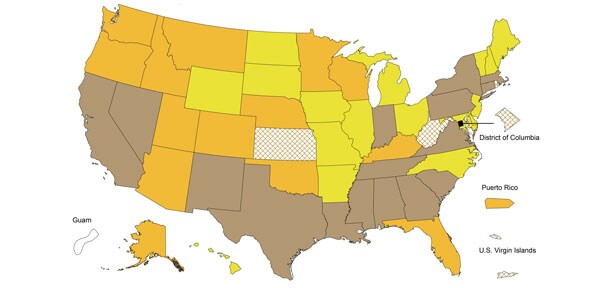
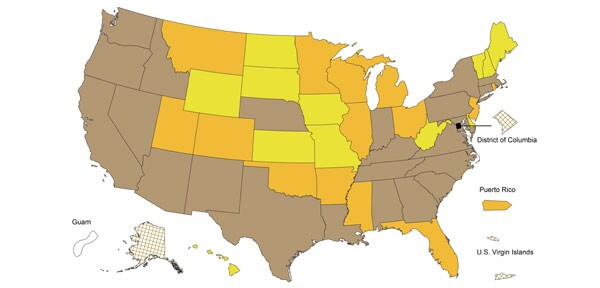
Geographic Spread
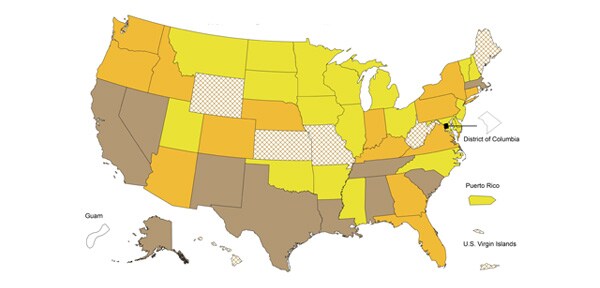
FluWeeklyReport - Flu Weekly Report


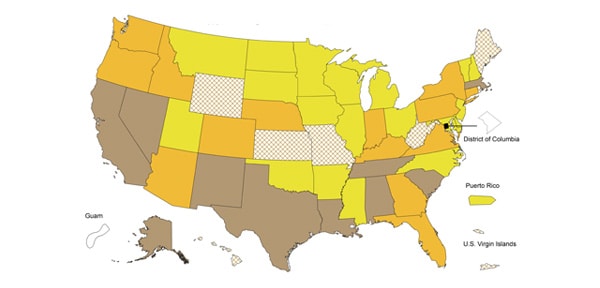
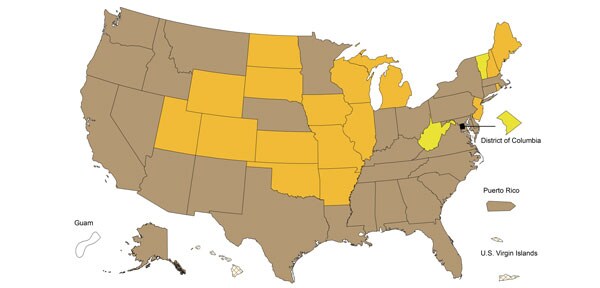
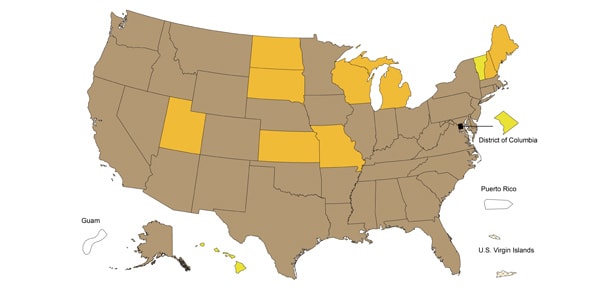
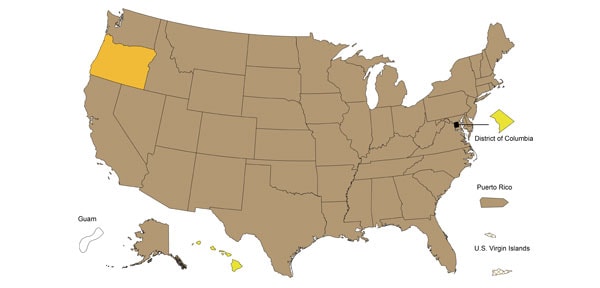
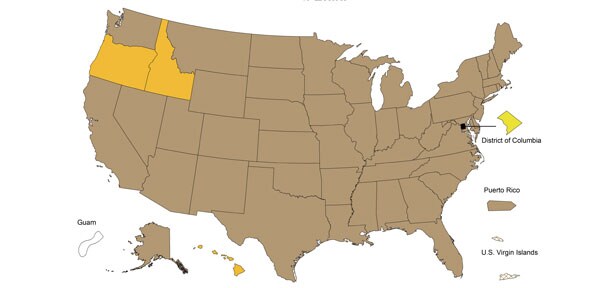
4 out of 53 jurisdictions reported local flu activity; the remainder reported sporadic or no flu activity. [h=4]Severe Disease[/h]
Hospitalizations
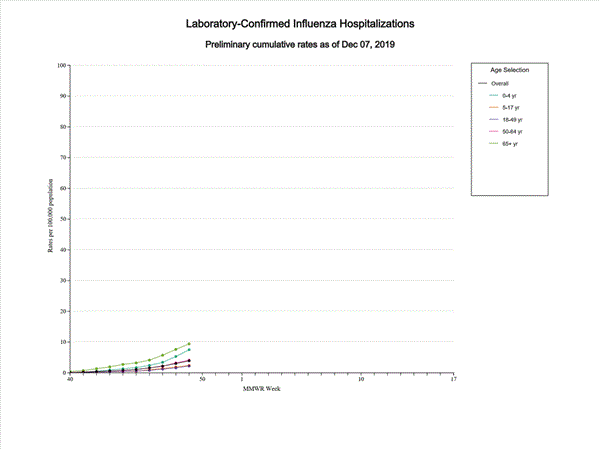
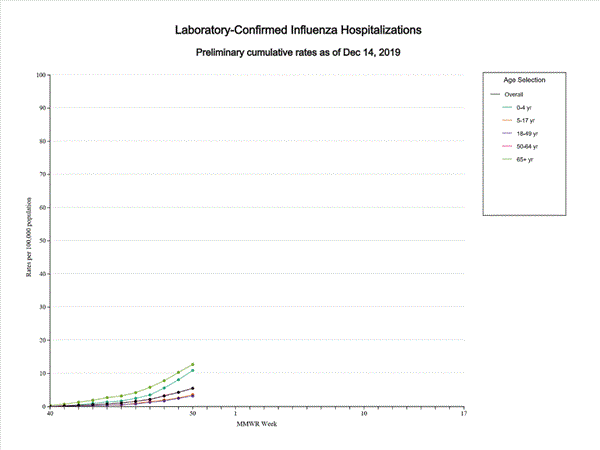
Reporting for 2019-2020 will begin when a sufficient number of hospitalizations have been reported.

P&I Mortality
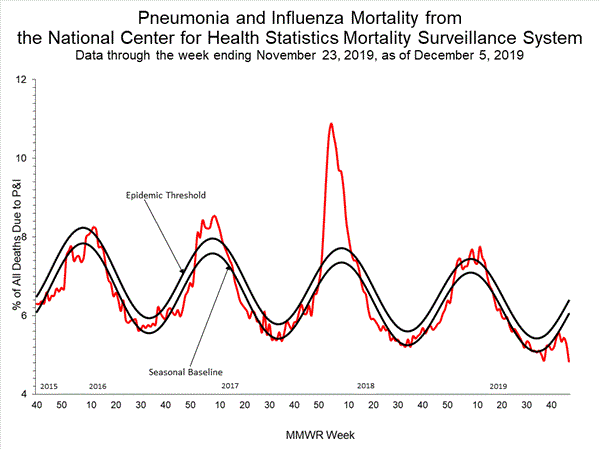
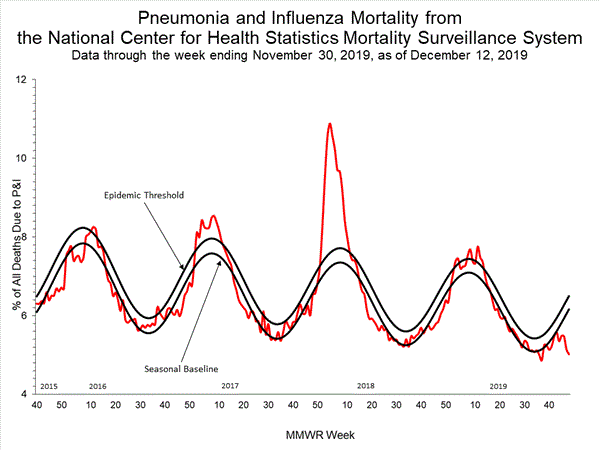
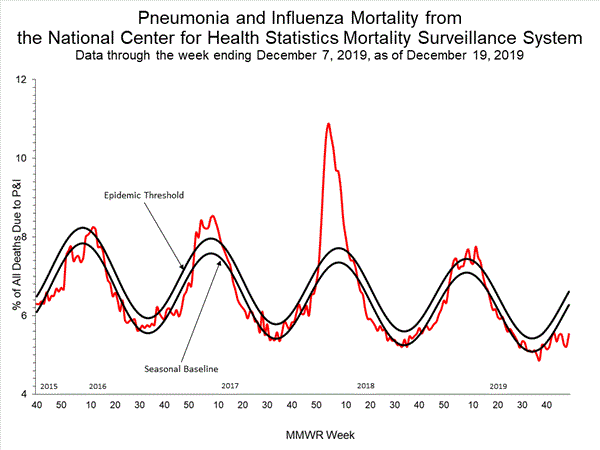
5.0 % of deaths were attributed to pneumonia and influenza (P&I). This is below the epidemic threshold of 5.6%.

Pediatric Deaths
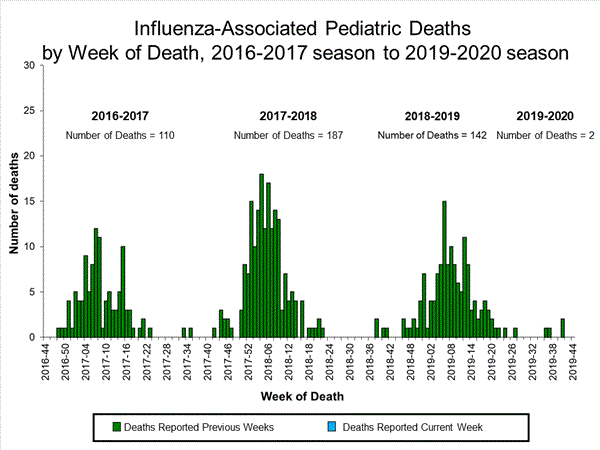
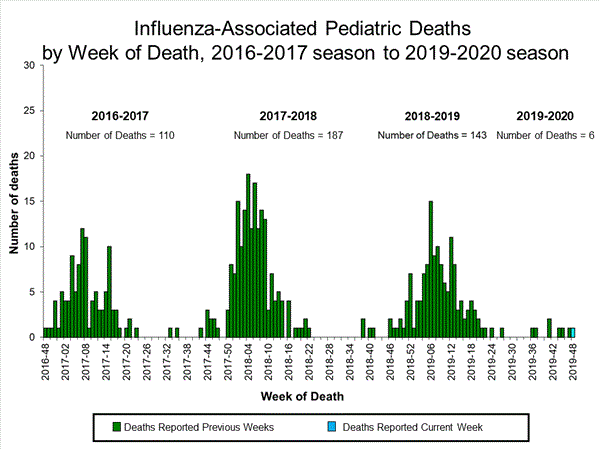
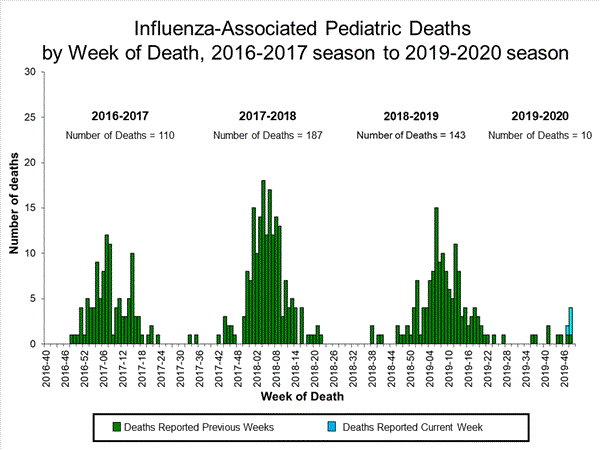
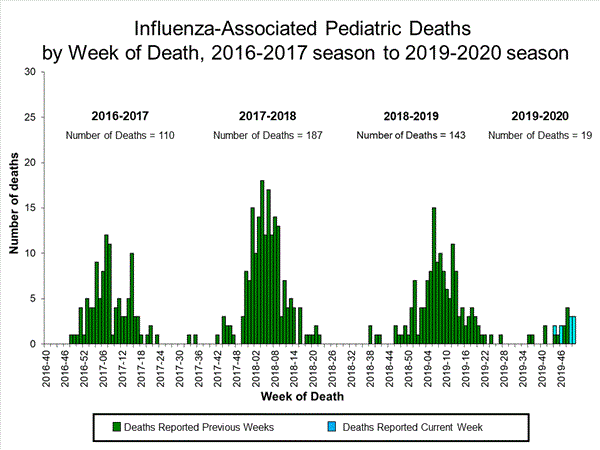
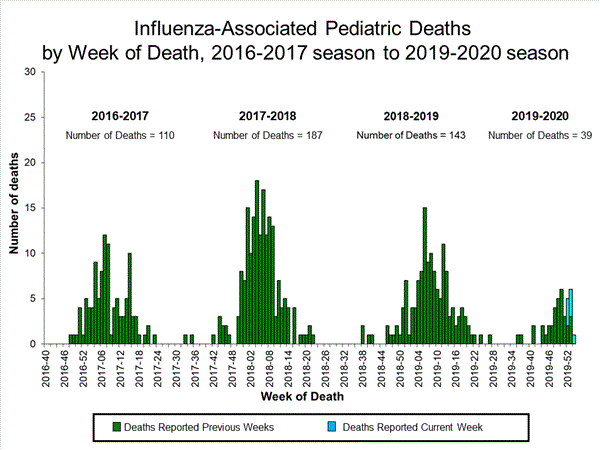
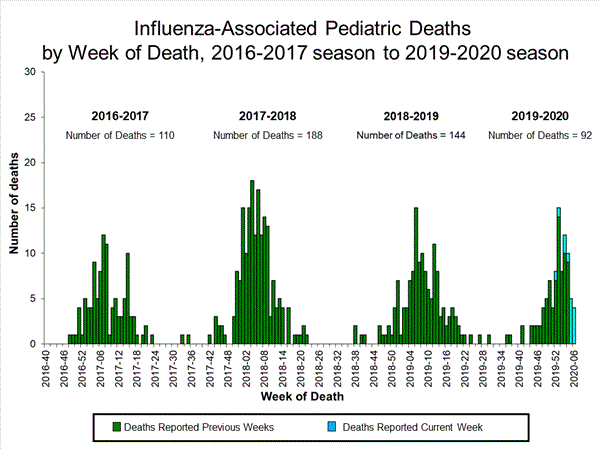
No influenza-associated pediatric deaths occurring during the 2019-20 season have been reported to CDC. 138 pediatric deaths occurring during the 2018-2019 season have been reported.

Key Messages from CDC
  • CDC expects flu activity to remain low but increase in the coming weeks.
  • An annual flu vaccine is the best way to protect against influenza and its potentially serious complications.
  • CDC recommends everyone 6 months or older gets a flu vaccine by the end of October.
  • There also are flu antiviral drugs that can be used to treat flu illness.
All data are preliminary and may change as more reports are received.

An overview of the CDC influenza surveillance system, including methodology and detailed descriptions of each data component, is available at http://www.cdc.gov/flu/weekly/overview.htm.

[h=2]U.S. Virologic Surveillance:[/h]
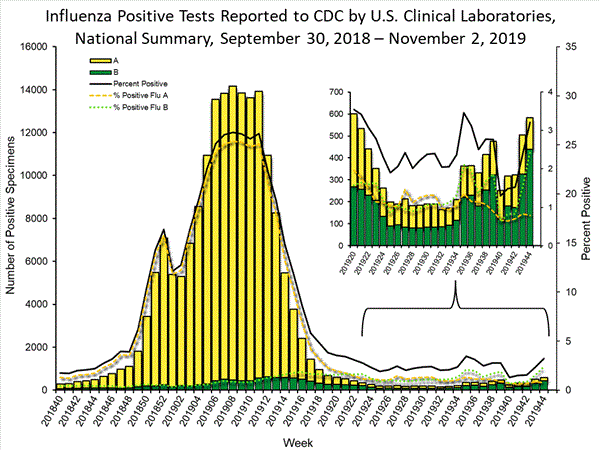
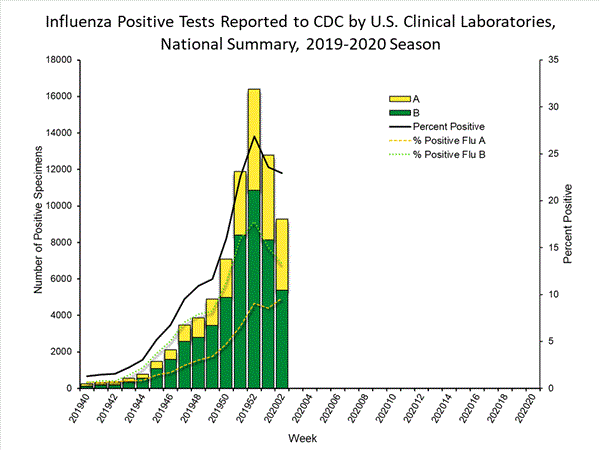
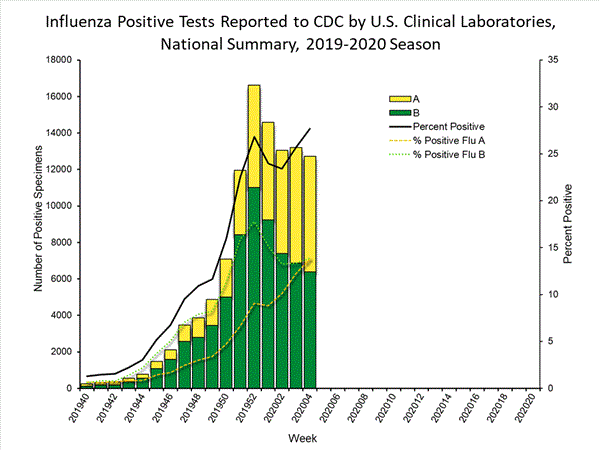
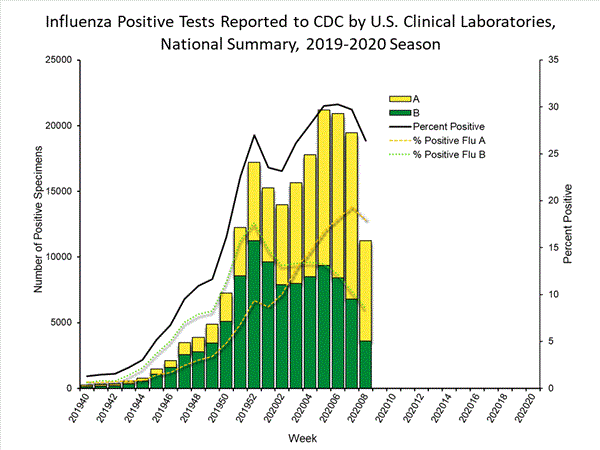
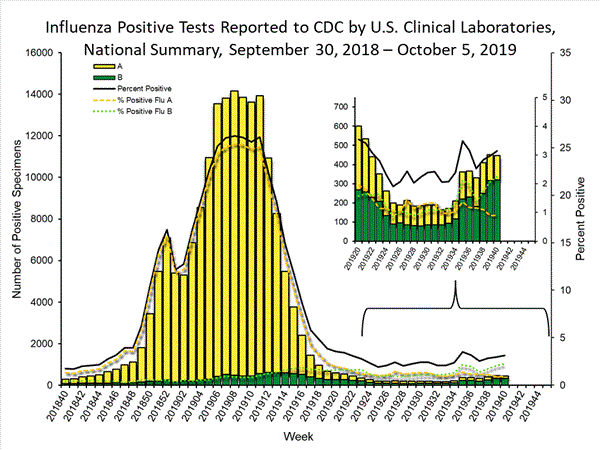
The results of tests performed by clinical laboratories nationwide are summarized below. Data from clinical laboratories (the percent of specimens tested that are positive for influenza) are used to monitor whether influenza activity is increasing or decreasing.
14,227
447 (3.1%)
127 (28.4%)
320 (71.6%)
Week 40 No. of specimens tested No. of positive specimens (%) Positive specimens by type Influenza A Influenza B
INFLUENZA Virus Isolated

View National and Regional Level Graphs and Data | View Chart Data | View Full Screen | View PowerPoint Presentation


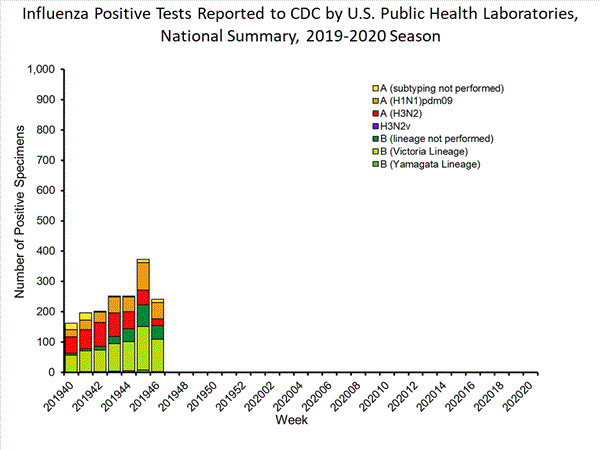
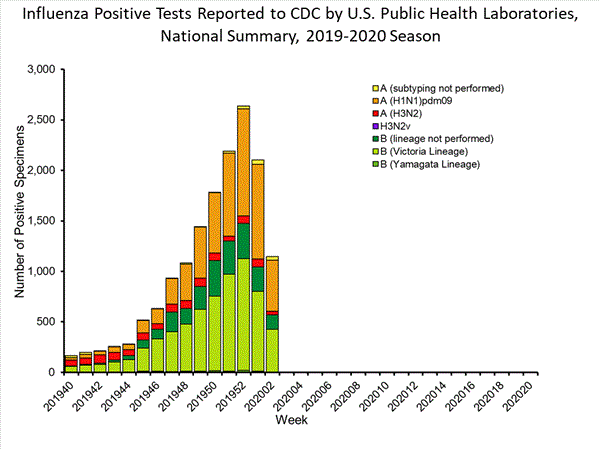
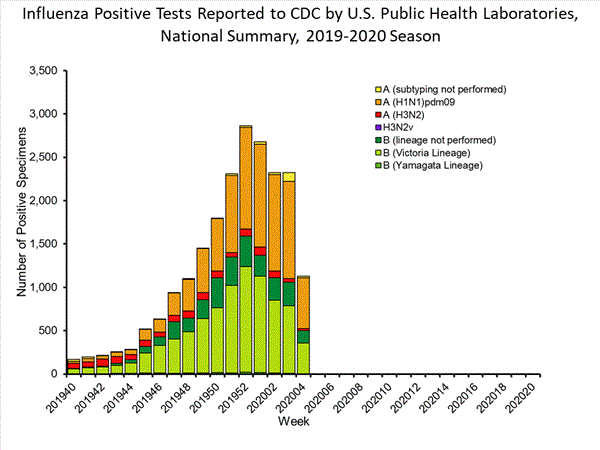
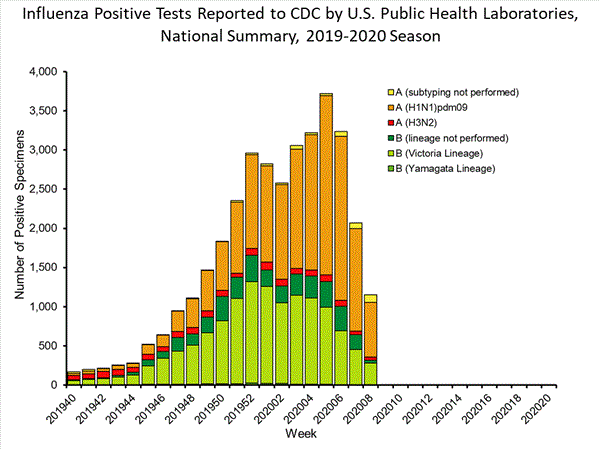
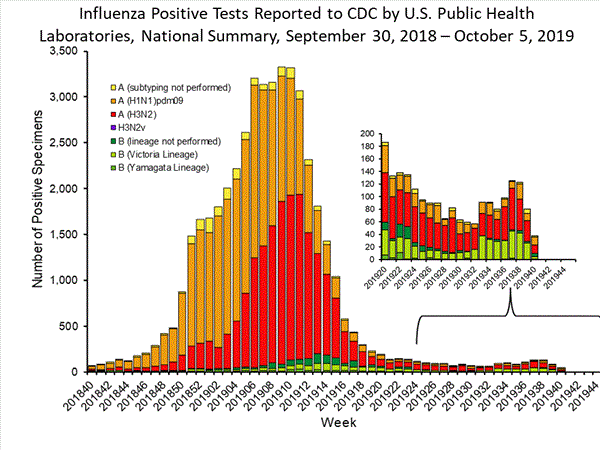
The results of tests performed by public health laboratories nationwide are summarized below. Data from public health laboratories are used to monitor the proportion of circulating viruses that belong to each influenza subtype/lineage.
352
38
28 (73.7%)
13 (50.0%)
13 (50.0%)
2
10 (26.3%)
1 (20.0%)
4 (80.0%)
5
Week 40 No. of specimens tested No. of positive specimens Positive specimens by type/subtype Influenza A A(H1N1)pdm09 H3 Subtyping not performed Influenza B Yamagata lineage Victoria lineage Lineage not performed
INFLUENZA Virus Isolated

View National and Regional Level Graphs and Data | View Chart Data | View Full Screen | View PowerPoint Presentation

Additional virologic surveillance information for this season and past seasons:
Surveillance methods - http://www.cdc.gov/flu/weekly/overview.htm.
National, regional and state data - http://gis.cdc.gov/grasp/fluview/fluportaldashboard.html.
Age group data - http://gis.cdc.gov/grasp/fluview/flu_by_age_virus.html.
[h=2]Influenza Virus Characterization:[/h]
CDC performs genetic and antigenic characterization of U.S. viruses submitted from state and local health laboratories using Right Size Roadmap submission guidance. These data are used to compare how similar the currently circulating influenza viruses are to the reference viruses used for developing new influenza vaccines and to monitor evolutionary changes that continually occur in influenza viruses circulating in humans. CDC also tests susceptibility of influenza viruses to antiviral medications including the neuraminidase inhibitors (oseltamivir, zanamivir, and peramivir) and the PA endonuclease inhibitor baloxavir.

Virus characterization data will be updated weekly starting later this season when sufficient numbers of specimens have been tested.
[h=2]Outpatient Illness Surveillance:[/h]
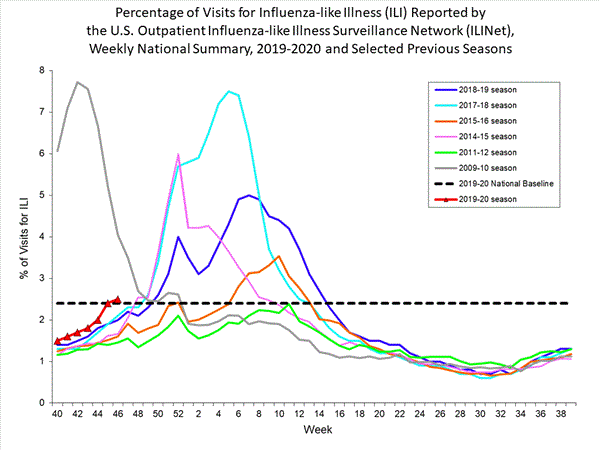
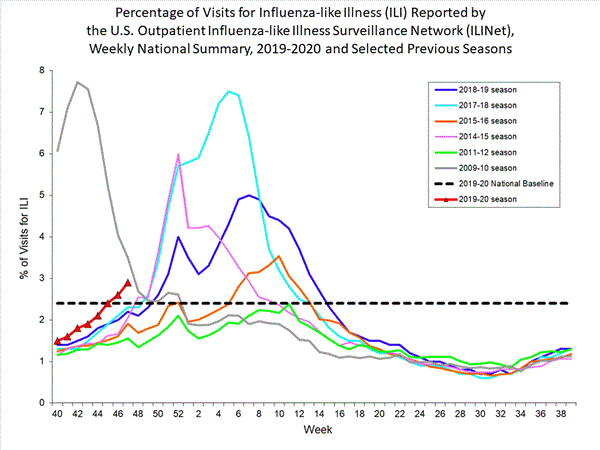
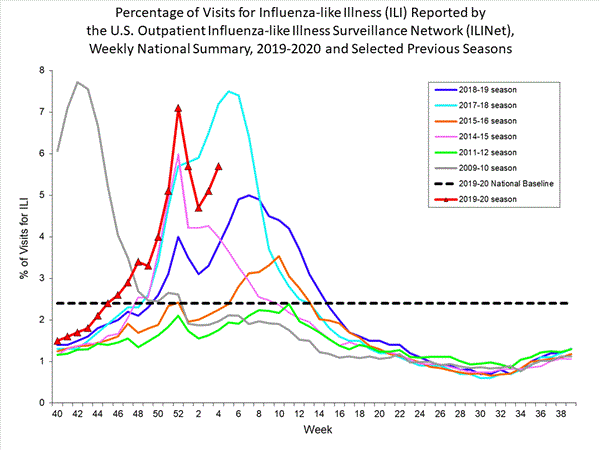
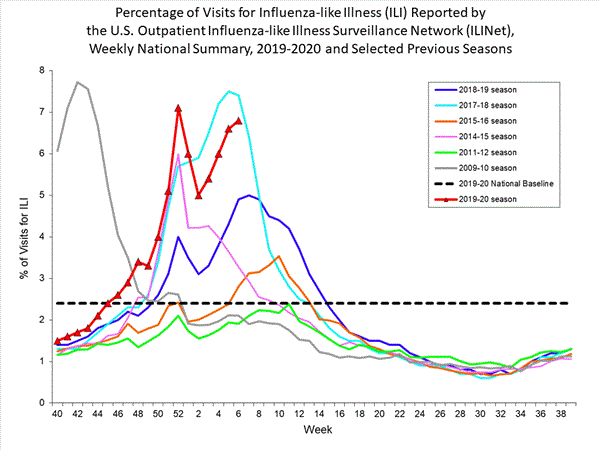
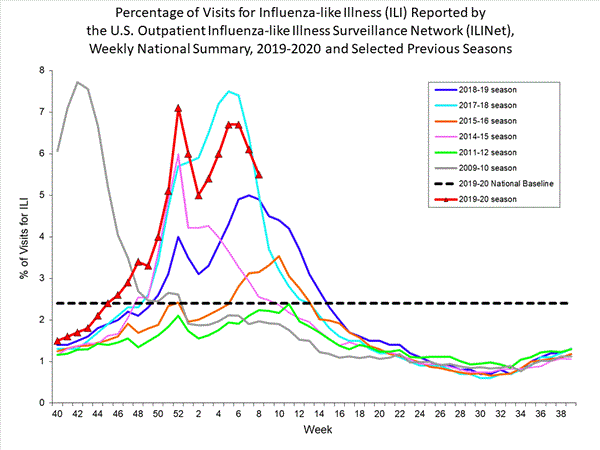
Nationwide during week 40, 1.4% of patient visits reported through the U.S. Outpatient Influenza-like Illness Surveillance Network (ILINet) were due to influenza-like illness (ILI). This percentage is below the national baseline of 2.4%. (ILI is defined as fever (temperature of 100?F [37.8?C] or greater) and cough and/or sore throat.)

On a regional level, the percentage of outpatient visits for ILI ranged from 0.8% to 2.2% during week 40. All regions reported a percentage of outpatient visits for ILI below their region-specific baselines
national levels of ILI and ARI

View National and Regional Level Graphs and Data | View Chart Data | View Full Screen | View PowerPoint Presentation


[h=2]ILINet State Activity Indicator Map:[/h]
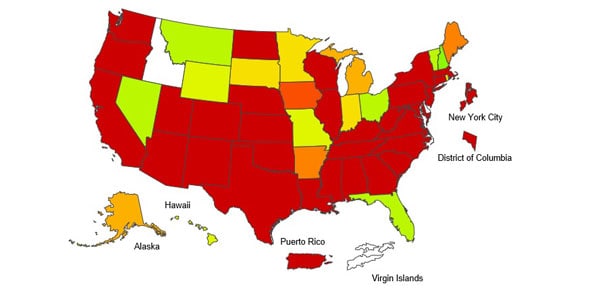
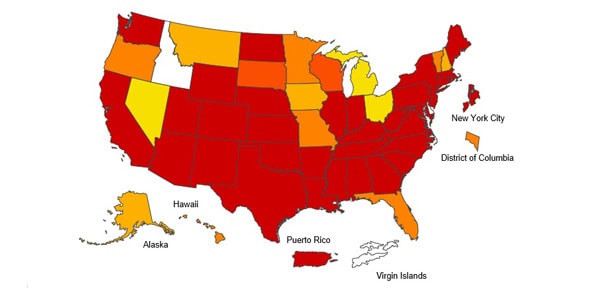
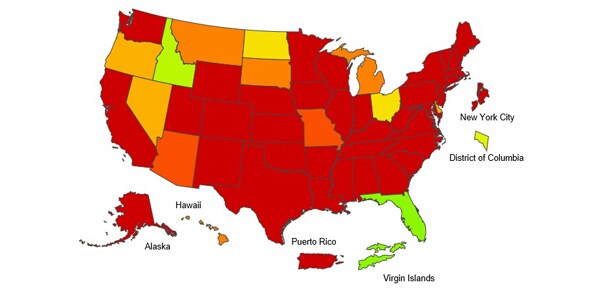
Data collected in ILINet are used to produce a measure of ILI activity* by state. During week 40, the following ILI activity levels were experienced:
  • Moderate – 1 state (Louisiana)
  • Minimal – District of Columbia, New York City, Puerto Rico and 49 states (Alabama, Alaska, Arizona, Arkansas, California, Colorado, Connecticut, Delaware, Florida, Georgia, Hawaii, Idaho, Illinois, Indiana, Iowa, Kansas, Kentucky, Maine, Maryland, Massachusetts, Michigan, Minnesota, Mississippi, Missouri, Montana, Nebraska, Nevada, New Hampshire, New Jersey, New Mexico, New York, North Carolina, North Dakota, Ohio, Oklahoma, Oregon, Pennsylvania, Rhode Island, South Carolina, South Dakota, Tennessee, Texas, Utah, Vermont, Virginia, Washington, West Virginia, Wisconsin and Wyoming)
  • Data were Insufficient to calculate an ILI activity level from the U.S. Virgin Islands
*Data collected in ILINet may disproportionally represent certain populations within a state, and therefore, may not accurately depict the full picture of influenza activity for the whole state. Differences in the data presented here by CDC and independently by some state health departments likely represent differing levels of data completeness with data presented by the state likely being the more complete.

Additional information about medically attended visits for ILI this season and past:
Surveillance methods - http://www.cdc.gov/flu/weekly/overview.htm.
National, regional and state data - http://gis.cdc.gov/grasp/fluview/fluportaldashboard.html.
ILI Activity Indicator Map for past weeks - https://gis.cdc.gov/grasp/fluview/main.html.


[h=2]Geographic Spread of Influenza as Assessed by State and Territorial Epidemiologists[/h]
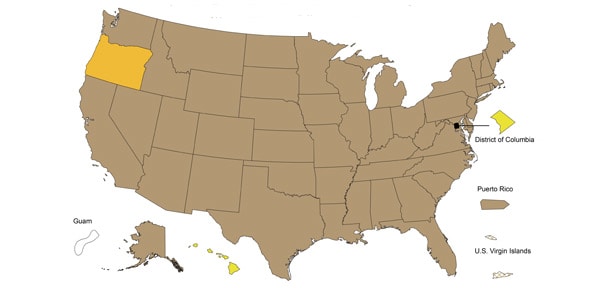
The influenza activity reported by state and territorial epidemiologists indicates geographic spread of influenza viruses, but does not measure the severity of influenza activity.

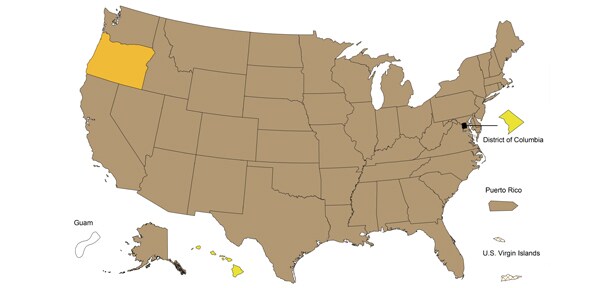
During week 40, the following influenza activity was reported:
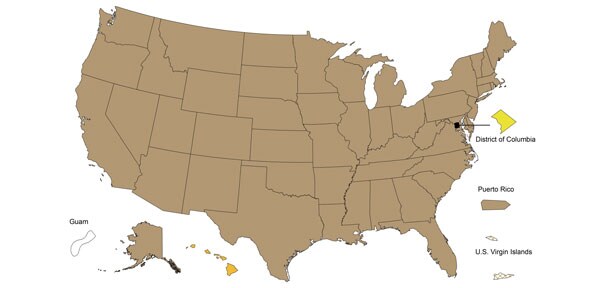
  • Local – four states (Alabama, Kentucky, Louisiana and Nevada).
  • Sporadic – the District of Columbia, Puerto Rico, the U.S. Virgin Islands and 40 states (Alaska, Arizona, Arkansas, California, Colorado, Connecticut, Delaware, Florida, Georgia, Hawaii, Idaho, Indiana, Iowa, Maine, Maryland, Massachusetts, Michigan, Minnesota, Missouri, Montana, New Jersey, New Mexico, New York, North Carolina, North Dakota, Ohio, Oklahoma, Oregon, Pennsylvania, South Carolina, South Dakota, Tennessee, Texas, Utah, Vermont, Virginia, Washington, West Virginia, Wisconsin and Wyoming).
  • No activity – six states (Illinois, Kansas, Mississippi, Nebraska, New Hampshire and Rhode Island).
  • Guam did not report.

Additional information about the geographic spread of influenza this season and past seasons:
Surveillance methods - http://www.cdc.gov/flu/weekly/overview.htm.
Map for past weeks - https://gis.cdc.gov/grasp/fluview/FluView8.html. [h=2]Influenza-Associated Hospitalizations:[/h]
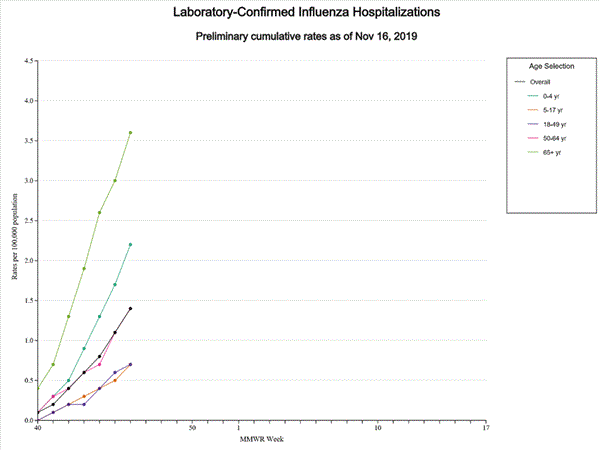
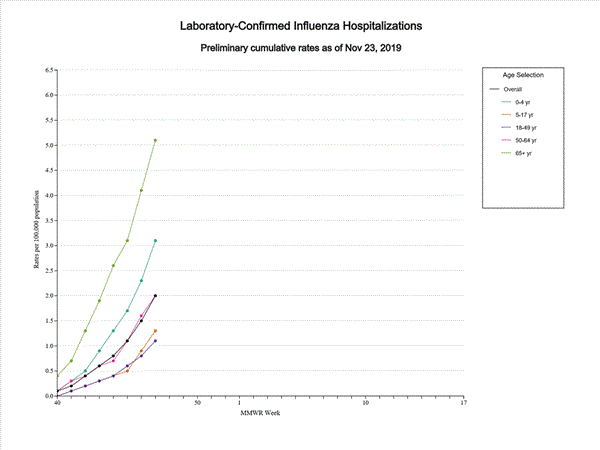
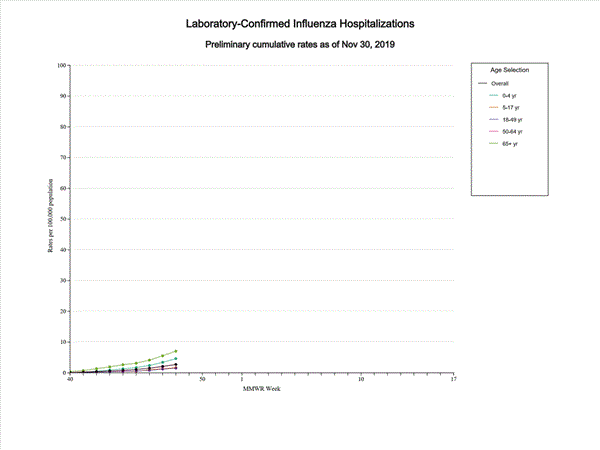
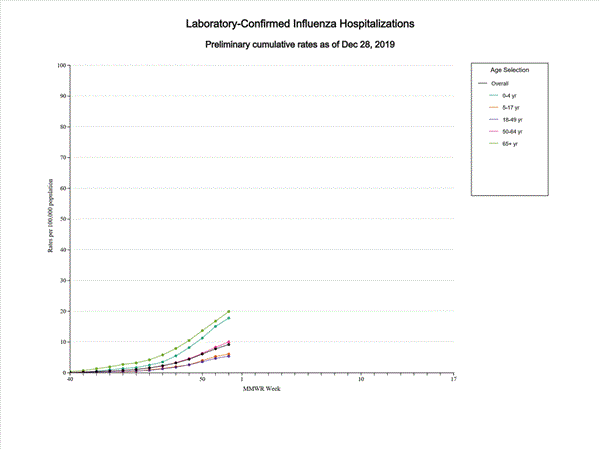
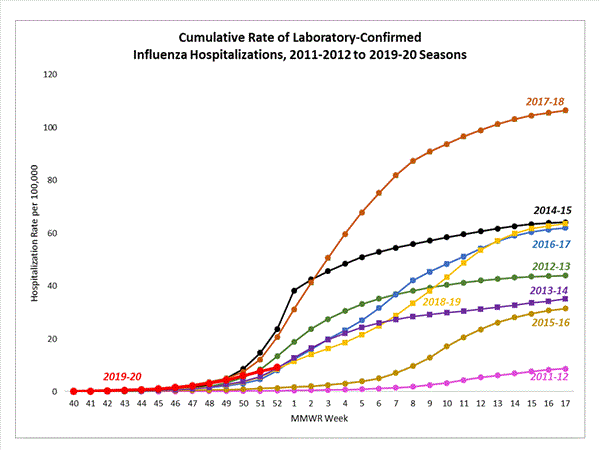
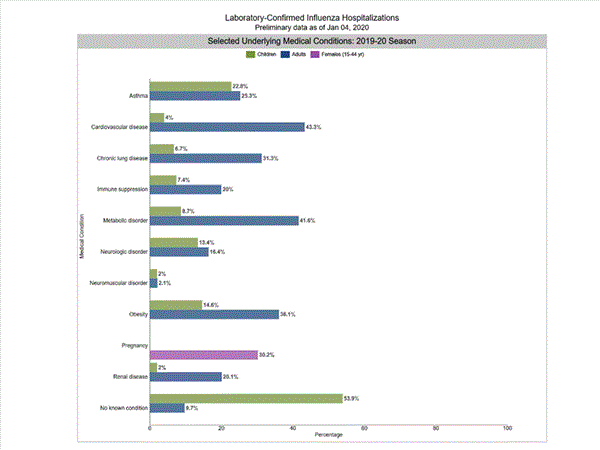
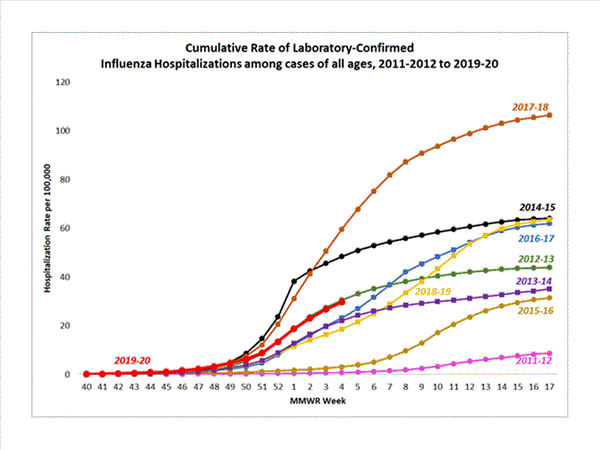
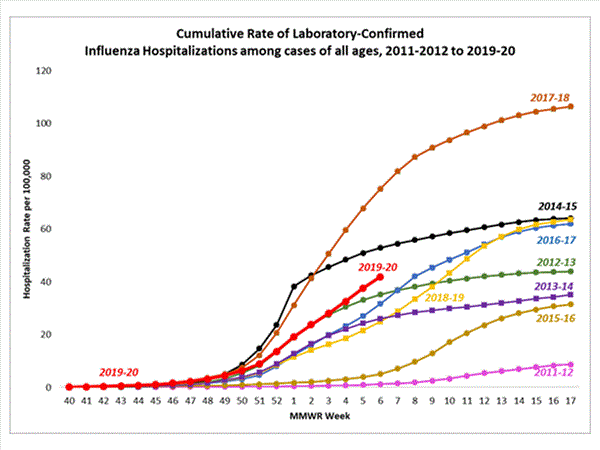
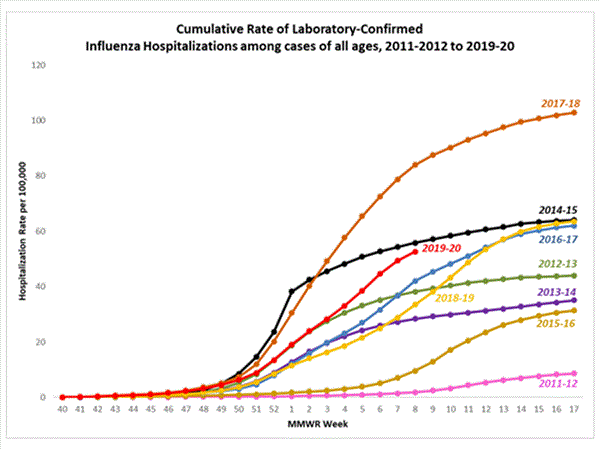
The Influenza Hospitalization Surveillance Network (FluSurv-NET) conducts all age population-based surveillance for laboratory-confirmed influenza-related hospitalizations in select counties in the Emerging Infections Program (EIP) states and Influenza Hospitalization Surveillance Project (IHSP) states. FluSurv-NET estimated hospitalization rates will be updated weekly starting later this season.

Additional FluSurv-NET data can be found at: http://gis.cdc.gov/GRASP/Fluview/FluHospRates.html and http://gis.cdc.gov/grasp/fluview/FluHospChars.html.

[h=2]Pneumonia and Influenza (P&I) Mortality Surveillance:[/h]
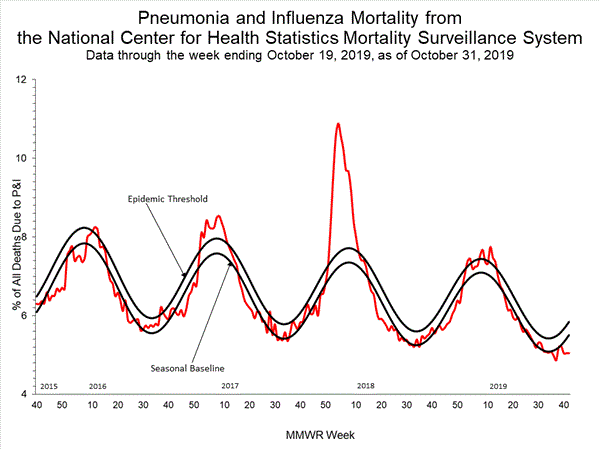
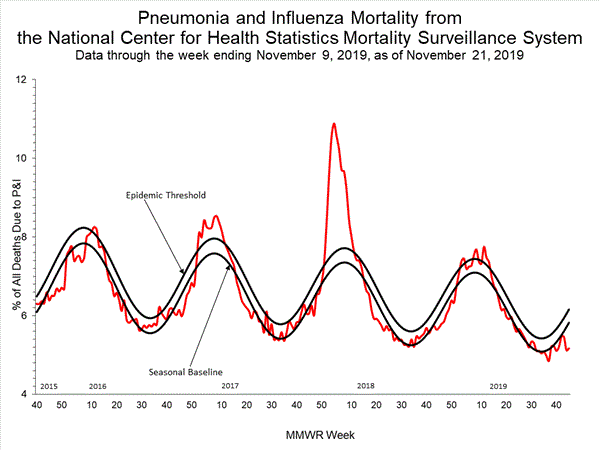
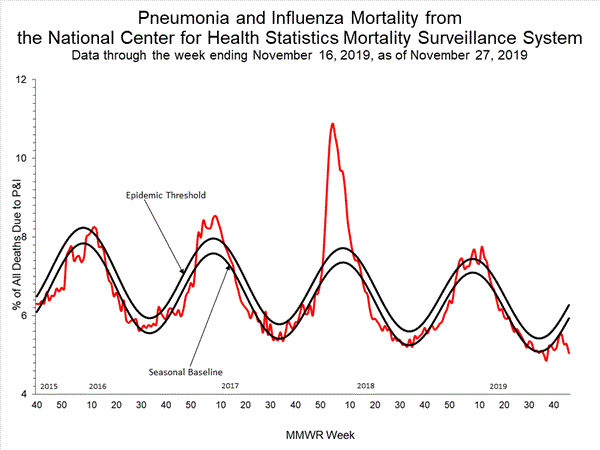
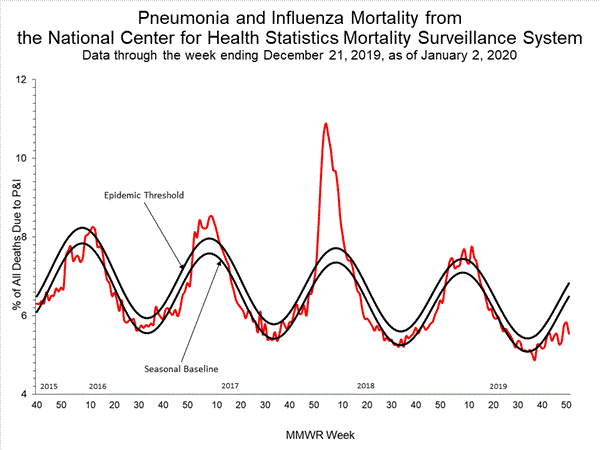
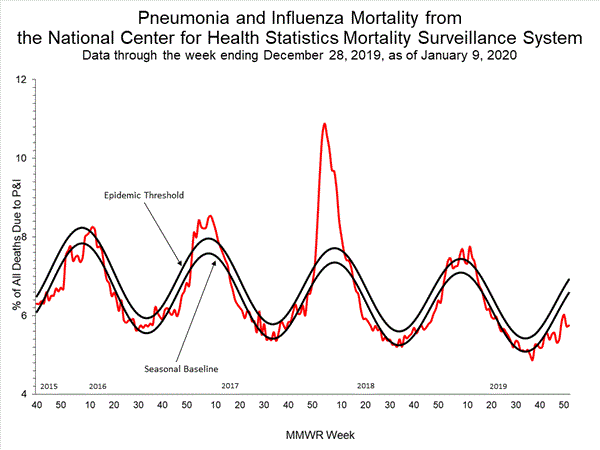
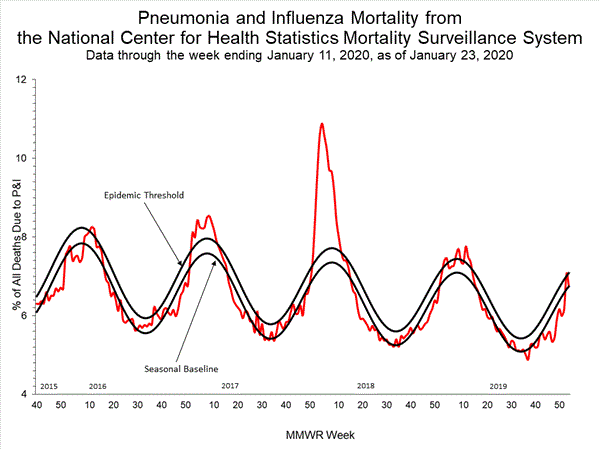
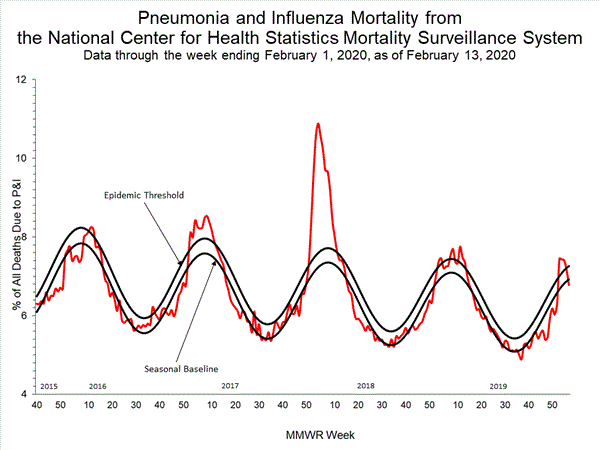
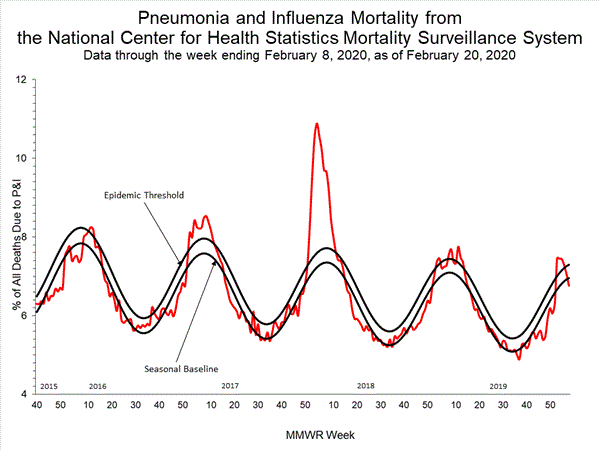
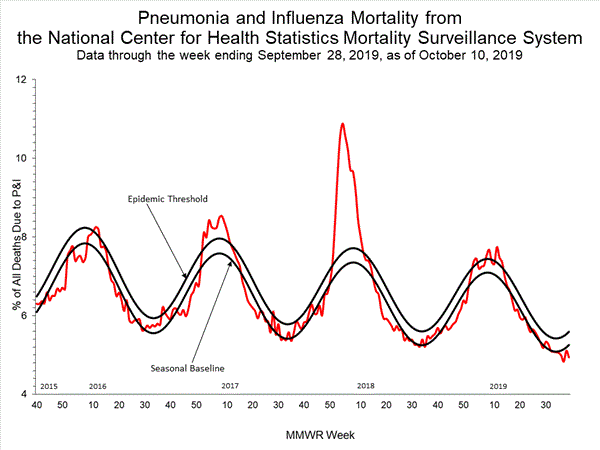
Based on National Center for Health Statistics (NCHS) mortality surveillance data available on October 10, 2019, 5.0% of the deaths occurring during the week ending September 28, 2019 (week 39) were due to P&I. This percentage is below the epidemic threshold of 5.6% for week 39.
NCHS40_small.gif

View Regional and State Level Data | View Chart Data | View Full Screen | View PowerPoint Presentation

Additional pneumonia and influenza mortality surveillance information for current and past seasons:
Surveillance methods - http://www.cdc.gov/flu/weekly/overview.htm.
National, regional and state data - http://gis.cdc.gov/grasp/fluview/fluportaldashboard.html.
Age group data- https://gis.cdc.gov/grasp/fluview/mortality.html.


[h=2]Influenza-Associated Pediatric Mortality:[/h]
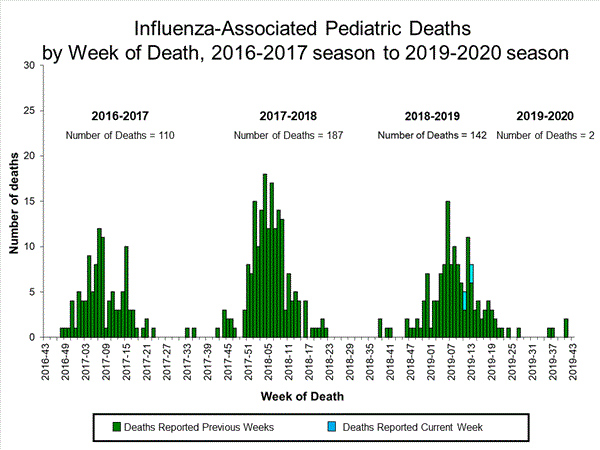
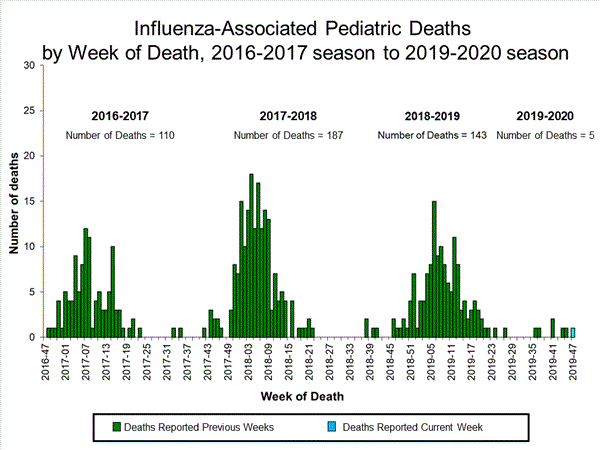
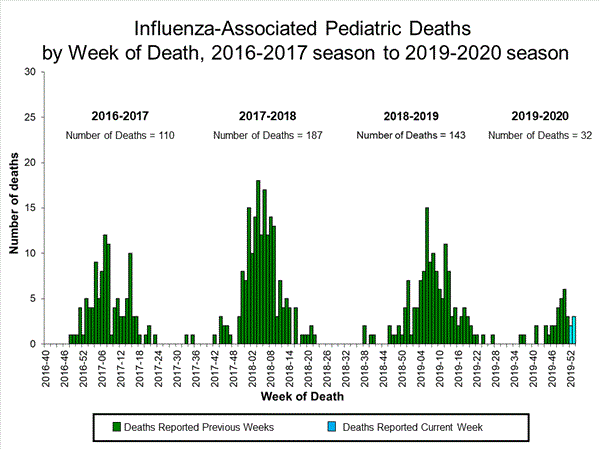
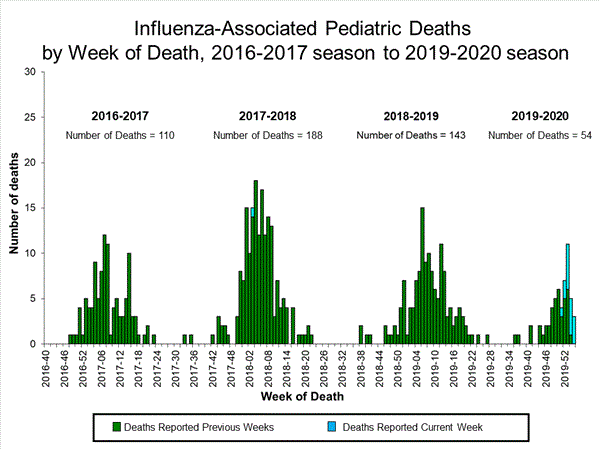
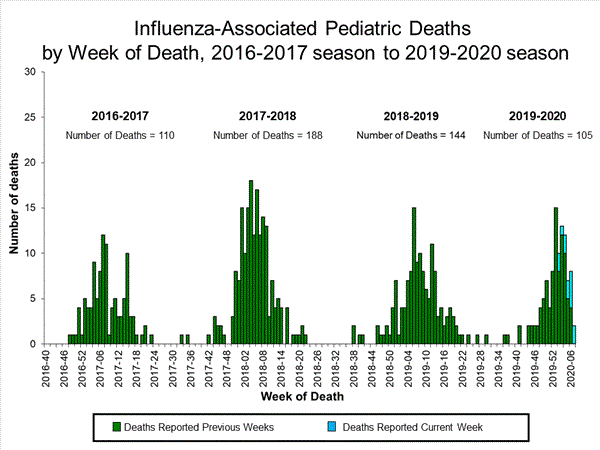
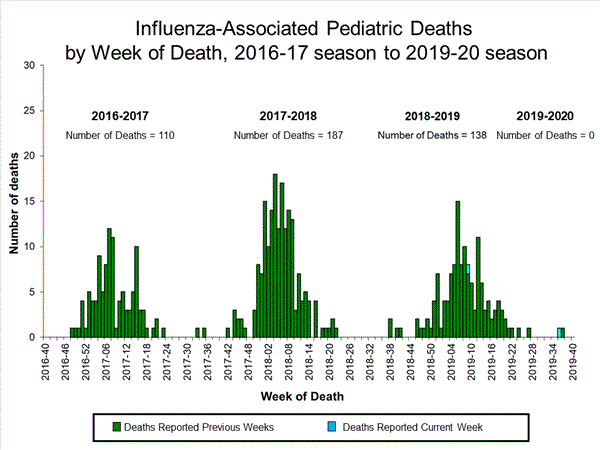
No influenza-associated pediatric deaths occurring during the 2019-2020 season have been reported to CDC.

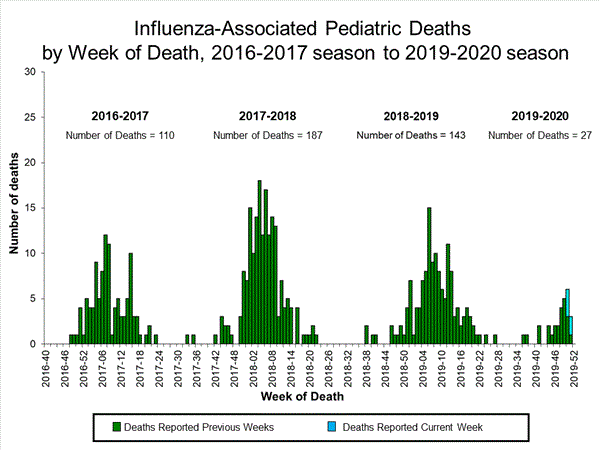
Two influenza-associated pediatric deaths were reported to CDC during week 40. Both occurred during the 2018-2019 influenza season, weeks 9 and 36 (the weeks ending March 2, 2019 and September 7, 2019), and both were associated with influenza A (H3) virus infection. The total number of pediatric deaths occurring during the 2018-2019 season is 138.
Click on image to launch interactive tool

View Interactive Application | View Full Screen | View PowerPoint Presentation


Additional Influenza-associated pediatric mortality surveillance information for current and past seasons:
Surveillance methods - http://www.cdc.gov/flu/weekly/overview.htm.
Basic demographics, underlying conditions, bacterial co-infections, and place of death for the current and past seasons - https://gis.cdc.gov/GRASP/Fluview/PedFluDeath.html.


[h=2]Additional National and International Influenza Surveillance Information[/h]

FluView Interactive: FluView includes enhanced web-based interactive applications that can provide dynamic visuals of the influenza data collected and analyzed by CDC. These FluView Interactive applications allow people to create customized, visual interpretations of influenza data, as well as make comparisons across flu seasons, regions, age groups and a variety of other demographics. To access these tools, visit http://www.cdc.gov/flu/weekly/fluviewinteractive.htm.

National Institute for Occupational Safety and Health: Monthly surveillance data on the prevalence of health-related workplace absenteeism among full-time workers in the United States are available from NIOSH at https://www.cdc.gov/niosh/topics/absences/default.html.

U.S. State and local influenza surveillance: Click on a jurisdiction below to access the latest local influenza information.


[TD="width: 139"] Alabama [/TD]
[TD="width: 139"] Alaska [/TD]
[TD="width: 139"] Arizona [/TD]
[TD="width: 139"] Arkansas [/TD]
[TD="width: 139"] California [/TD]

[TD="width: 139"] Colorado [/TD]
[TD="width: 139"] Connecticut [/TD]
[TD="width: 139"] Delaware [/TD]
[TD="width: 139"] District of Columbia [/TD]
[TD="width: 139"] Florida [/TD]

[TD="width: 139"] Georgia [/TD]
[TD="width: 139"] Hawaii [/TD]
[TD="width: 139"] Idaho [/TD]
[TD="width: 139"] Illinois [/TD]
[TD="width: 139"] Indiana [/TD]

[TD="width: 139"] Iowa [/TD]
[TD="width: 139"] Kansas [/TD]
[TD="width: 139"] Kentucky [/TD]
[TD="width: 139"] Louisiana [/TD]
[TD="width: 139"] Maine [/TD]

[TD="width: 139"] Maryland [/TD]
[TD="width: 139"] Massachusetts [/TD]
[TD="width: 139"] Michigan [/TD]
[TD="width: 139"] Minnesota [/TD]
[TD="width: 139"] Mississippi [/TD]

[TD="width: 139"] Missouri [/TD]
[TD="width: 139"] Montana [/TD]
[TD="width: 139"] Nebraska [/TD]
[TD="width: 139"] Nevada [/TD]
[TD="width: 139"] New Hampshire [/TD]

[TD="width: 139"] New Jersey [/TD]
[TD="width: 139"] New Mexico [/TD]
[TD="width: 139"] New York [/TD]
[TD="width: 139"] North Carolina [/TD]
[TD="width: 139"] North Dakota [/TD]

[TD="width: 139"] Ohio [/TD]
[TD="width: 139"] Oklahoma [/TD]
[TD="width: 139"] Oregon [/TD]
[TD="width: 139"] Pennsylvania [/TD]
[TD="width: 139"] Rhode Island [/TD]

[TD="width: 139"] South Carolina [/TD]
[TD="width: 139"] South Dakota [/TD]
[TD="width: 139"] Tennessee [/TD]
[TD="width: 139"] Texas [/TD]
[TD="width: 139"] Utah [/TD]

[TD="width: 139"] Vermont [/TD]
[TD="width: 139"] Virginia [/TD]
[TD="width: 139"] Washington [/TD]
[TD="width: 139"] West Virginia [/TD]
[TD="width: 139"] Wisconsin [/TD]

[TD="width: 139"] Wyoming [/TD]
[TD="width: 139"] New York City [/TD]
[TD="width: 139"] Puerto Rico [/TD]
[TD="width: 139"] Virgin Islands [/TD]
[TD="width: 139"] [/TD]


World Health Organization: Additional influenza surveillance information from participating WHO member nations is available through FluNet and the Global Epidemiology Reports.

WHO Collaborating Centers for Influenza located in Australia, China, Japan, the United Kingdom, and the United States (CDC in Atlanta, Georgia).

Europe: For the most recent influenza surveillance information from Europe, please see WHO/Europe and the European Centre for Disease Prevention and Control at http://www.flunewseurope.org/.

Public Health Agency of Canada: The most up-to-date influenza information from Canada is available at http://www.phac-aspc.gc.ca/fluwatch/

Public Health England: The most up-to-date influenza information from the United Kingdom is available at https://www.gov.uk/government/statistics/weekly-national-flu-reports


Any links provided to non-Federal organizations are provided solely as a service to our users. These links do not constitute an endorsement of these organizations or their programs by CDC or the Federal Government, and none should be inferred. CDC is not responsible for the content of the individual organization web pages found at these links.


An overview of the CDC influenza surveillance system, including methodology and detailed descriptions of each data component, is available at: http://www.cdc.gov/flu/weekly/overview.htm.

--------------------------------------------------------------------------------


Page last reviewed: October 17, 2019
Content source: Centers for Disease Control and Prevention, National Center for Immunization and Respiratory Diseases (NCIRD)

https://www.cdc.gov/flu/weekly/index.htm
 
[h=1]Weekly U.S. Influenza Surveillance Report[/h]
Espa?ol
FluView_header.jpg

Key Updates for Week 42, ending October 19, 2019

According to this week’s FluView report, seasonal influenza activity in the United States increased slightly, but remains low. [h=4]Viruses[/h]
Clinical Lab
2.4% of respiratory specimens tested in clinical laboratories were positive for influenza viruses. This is slightly lower than the previous week.

Public Health Lab
Influenza A (H3N2) and Influenza B/Victoria viruses have circulated at similar levels for the season overall.

Virus Characterization
Data for this season will be reported when a sufficient number of viruses have been characterized. Virus characterization data through September 28 is available. [h=4]Illness[/h] Outpatient Illness: ILINet
1.7% of visits to a health care provider were for influenza-like illness (ILI). ILI activity is higher than the previous week but remains below the national baseline of 2.4%.

Outpatient Illness: ILI Activity Map
Flu Activity & Surveillance


The majority of jurisdictions experienced minimal ILI activity; however, Louisiana and Puerto Rico experienced high ILI activity.

Geographic Spread
Flu Weekly Report


The majority of jurisdictions reported sporadic or local activity; however, Maryland reported widespread activity and Louisiana reported regional activity. [h=4]Severe Disease[/h]
Hospitalizations
Data for this season will be provided when a sufficient number of hospitalizations have been reported.

P&I Mortality
4.9% of deaths were attributed to pneumonia and influenza (P&I). This is below the epidemic threshold of 5.7%.

Pediatric Deaths
The first 2 influenza-associated pediatric deaths occurring during the 2019-2020 season were reported to CDC this week.

All data are preliminary and may change as more reports are received.

An overview of the CDC influenza surveillance system, including methodology and detailed descriptions of each data component, is available at [url]http://www.cdc.gov/flu/weekly/overview.htm[/URL].

Additional information on the current and previous influenza seasons for each surveillance component are available on FluView Interactive

Key Messages from CDC
  • Nationally, flu activity is low and similar to what has been observed during recent previous seasons at the same time, but Louisiana and Puerto Rico are experiencing high levels of influenza-like-illness.
  • Severe flu outcomes have been reported, including the first two pediatric deaths of the 2019-2020 season.
  • Flu vaccination is always the best way to prevent flu and its potentially serious complications. Most flu vaccines protect against 4 different flu viruses. Get vaccinated now.
[h=2]U.S. Virologic Surveillance[/h] [h=3]Clinical Laboratories[/h]
The results of tests performed by clinical laboratories nationwide are summarized below. Data from clinical laboratories (the percent of specimens tested that are positive for influenza) are used to monitor whether influenza activity is increasing or decreasing.
16,27057,399
395 (2.4%)1,613 (2.8%)
126 (31.9%)491 (30.4%)
269 (68.1%)1,122 (69.6%)
Week 42 Data Cumulative since September 29, 2019 (week 40) No. of specimens tested No. of positive specimens (%) Positive specimens by type Influenza A Influenza B

The majority (80.7%) of all viruses and 89.9% of all influenza B viruses reported by clinical laboratories thus far for the 2019-20 influenza season were from the south and southeast (regions 4 and 6).
INFLUENZA Virus Isolated

View Chart Data | View Full Screen [h=3]Public Health Laboratories[/h]
The results of tests performed by public health laboratories nationwide are summarized below. Data from public health laboratories are used to monitor the proportion of circulating viruses that belong to each influenza subtype/lineage.
5211,997
79362
49 (62.0%)210 (58.0%)
14 (33.3%)58 (33.7%)
28 (66.7%)114 (66.3%)
738
30 (38.0%)152 (42.0%)
1 (4.2%)4 (3.1%)
23 (95.8%)126 (96.9%)
622
Week 42 Data Cumulative since September 29, 2019 (week 40) No. of specimens tested No. of positive specimens Positive specimens by type/subtype Influenza A (H1N1)pdm09 H3N2 Subtyping not performed Influenza B Yamagata lineage Victoria lineage Lineage not performed

Influenza A (H3N2) viruses and Influenza B/Victoria viruses have circulated at similar levels nationally this season. Influenza B/Victoria viruses have predominated in the south and southeast regions (regions 4 and 6) while influenza A (H3N2) viruses have predominated elsewhere.
INFLUENZA Virus Isolated

View Chart Data | View Full Screen

For additional virologic surveillance information for this season and past seasons:
Surveillance Methods | FluView Interactive: National, Regional, and State Data or Age Data
[h=2]Influenza Virus Characterization[/h]
CDC performs genetic and antigenic characterization of U.S. viruses submitted from state and local health laboratories using Right Size Roadmap submission guidance. These data are used to compare how similar the currently circulating influenza viruses are to the reference viruses used for developing new influenza vaccines and to monitor evolutionary changes that continually occur in influenza viruses circulating in humans. CDC also tests susceptibility of influenza viruses to antiviral medications including the neuraminidase inhibitors (oseltamivir, zanamivir, and peramivir) and the PA endonuclease inhibitor baloxavir.

Virus characterization data will be updated starting later this season when sufficient numbers of specimens have been tested.
[h=2]Outpatient Illness Surveillance[/h] [h=3]ILINet[/h]
Nationwide during week 42, 1.7% of patient visits reported through the U.S. Outpatient Influenza-like Illness Surveillance Network (ILINet) were due to influenza-like illness (ILI). This percentage is below the national baseline of 2.4%.
national levels of ILI and ARI

View Chart Data | View Full Screen

On a regional level, the percentage of outpatient visits for ILI ranged from 1.1% to 2.7% during week 42. Region 7 (Iowa, Kansas, Missouri, and Nebraska) reported 1.9% of outpatient visits for ILI, which is above its region-specific baseline of 1.7%. All other regions reported a percentage of outpatient visits for ILI below their region-specific baselines. [h=3]ILI Activity Map[/h]
Data collected in ILINet are used to produce a measure of ILI activity* by state. During week 42, the following ILI activity levels were experienced:
  • High – Puerto Rico and 1 state (Louisiana)
  • Low – 4 states (Alabama, Connecticut, Hawaii, and Missouri)
  • Minimal – District of Columbia, New York City, and 45 states (Alaska, Arizona, Arkansas, California, Colorado, Delaware, Florida, Georgia, Idaho, Illinois, Indiana, Iowa, Kansas, Kentucky, Maine, Maryland, Massachusetts, Michigan, Minnesota, Mississippi, Montana, Nebraska, Nevada, New Hampshire, New Jersey, New Mexico, New York, North Carolina, North Dakota, Ohio, Oklahoma, Oregon, Pennsylvania, Rhode Island, South Carolina, South Dakota, Tennessee, Texas, Utah, Vermont, Virginia, Washington, West Virginia, Wisconsin, and Wyoming)
  • Data were Insufficient to calculate an ILI activity level from the U.S. Virgin Islands
*Data collected in ILINet may disproportionally represent certain populations within a state, and therefore, may not accurately depict the full picture of influenza activity for the whole state. Differences in the data presented here by CDC and independently by some state health departments likely represent differing levels of data completeness with data presented by the state likely being the more complete.


Additional information about medically attended visits for ILI this season and past seasons:
Surveillance Methods | FluView Interactive: National, Regional, and State Data or ILI Activity Map


[h=2]Geographic Spread of Influenza as Assessed by State and Territorial Epidemiologists[/h]
The influenza activity reported by state and territorial epidemiologists indicates geographic spread of influenza viruses but does not measure the severity of influenza activity.

During week 42 the following influenza activity was reported:
  • Widespread – one state (Maryland)
  • Regional – one state (Louisiana)
  • Local – six states (Arizona, California, Kentucky, Mississippi, South Carolina, and Tennessee).
  • Sporadic – the District of Columbia, Puerto Rico, the U.S. Virgin Islands and 40 states (Alabama, Alaska, Arkansas, Colorado, Connecticut, Delaware, Florida, Georgia, Hawaii, Idaho, Illinois, Indiana, Iowa, Kansas, Maine, Massachusetts, Michigan, Minnesota, Missouri, Montana, Nebraska, New Hampshire, New Jersey, New Mexico, New York, North Carolina, North Dakota, Ohio, Oklahoma, Oregon, Pennsylvania, South Dakota, Texas, Utah, Vermont, Virginia, Washington, West Virginia, Wisconsin, and Wyoming).
  • No activity – one state (Rhode Island).
  • Guam and one state (Nevada) did not report.
Additional information about the geographic spread of influenza this season and past seasons:
Surveillance Methods | FluView Interactive

[h=2]Influenza-Associated Hospitalizations[/h]
The Influenza Hospitalization Surveillance Network (FluSurv-NET) conducts population-based surveillance for laboratory-confirmed influenza-related hospitalizations in select counties in the Emerging Infections Program (EIP) states and Influenza Hospitalization Surveillance Project (IHSP) states. FluSurv-NET estimated hospitalization rates will be updated weekly starting later this season when a sufficient number of hospitalizations have been reported.

Additional FluSurv-NET data can be found at: http://gis.cdc.gov/GRASP/Fluview/FluHospRates.html and http://gis.cdc.gov/grasp/fluview/FluHospChars.html.


[h=2]Pneumonia and Influenza (P&I) Mortality Surveillance[/h]
Based on National Center for Health Statistics (NCHS) mortality surveillance data available on October 24, 2019, 4.9% of the deaths occurring during the week ending October 12, 2019 (week 41) were due to P&I. This percentage is below the epidemic threshold of 5.7% for week 41.
INFLUENZA Virus Isolated

View Chart Data | View Full Screen

Additional pneumonia and influenza mortality surveillance information for current and past seasons:
Surveillance Methods | FluView Interactive


[h=2]Influenza-Associated Pediatric Mortality[/h]
Two influenza-associated pediatric deaths were reported to CDC during week 42. One death was associated with an influenza A virus for which no subtyping was performed and one death was associated with an influenza B/Victoria virus. Both deaths occurred during week 41 (the week ending October, 12, 2019).

A total of two influenza-associated pediatric deaths occurring during the 2019-2020 season have been reported to CDC.
Click on image to launch interactive tool

View Full Screen

Additional Influenza-associated pediatric mortality surveillance information for current and past seasons:
Surveillance Methods | FluView Interactive


[h=2]Additional National and International Influenza Surveillance Information[/h]

FluView Interactive: FluView includes enhanced web-based interactive applications that can provide dynamic visuals of the influenza data collected and analyzed by CDC. These FluView Interactive applications allow people to create customized, visual interpretations of influenza data, as well as make comparisons across flu seasons, regions, age groups and a variety of other demographics. To access these tools, visit http://www.cdc.gov/flu/weekly/fluviewinteractive.htm

National Institute for Occupational Safety and Health: Monthly surveillance data on the prevalence of health-related workplace absenteeism among full-time workers in the United States are available from NIOSH at https://www.cdc.gov/niosh/topics/absences/default.html

U.S. State and local influenza surveillance: Click on a jurisdiction below to access the latest local influenza information


[TD="width: 139"] Alabama [/TD]
[TD="width: 139"] Alaska [/TD]
[TD="width: 139"] Arizona [/TD]
[TD="width: 139"] Arkansas [/TD]
[TD="width: 139"] California [/TD]

[TD="width: 139"] Colorado [/TD]
[TD="width: 139"] Connecticut [/TD]
[TD="width: 139"] Delaware [/TD]
[TD="width: 139"] District of Columbia [/TD]
[TD="width: 139"] Florida [/TD]

[TD="width: 139"] Georgia [/TD]
[TD="width: 139"] Hawaii [/TD]
[TD="width: 139"] Idaho [/TD]
[TD="width: 139"] Illinois [/TD]
[TD="width: 139"] Indiana [/TD]

[TD="width: 139"] Iowa [/TD]
[TD="width: 139"] Kansas [/TD]
[TD="width: 139"] Kentucky [/TD]
[TD="width: 139"] Louisiana [/TD]
[TD="width: 139"] Maine [/TD]

[TD="width: 139"] Maryland [/TD]
[TD="width: 139"] Massachusetts [/TD]
[TD="width: 139"] Michigan [/TD]
[TD="width: 139"] Minnesota [/TD]
[TD="width: 139"] Mississippi [/TD]

[TD="width: 139"] Missouri [/TD]
[TD="width: 139"] Montana [/TD]
[TD="width: 139"] Nebraska [/TD]
[TD="width: 139"] Nevada [/TD]
[TD="width: 139"] New Hampshire [/TD]

[TD="width: 139"] New Jersey [/TD]
[TD="width: 139"] New Mexico [/TD]
[TD="width: 139"] New York [/TD]
[TD="width: 139"] North Carolina [/TD]
[TD="width: 139"] North Dakota [/TD]

[TD="width: 139"] Ohio [/TD]
[TD="width: 139"] Oklahoma [/TD]
[TD="width: 139"] Oregon [/TD]
[TD="width: 139"] Pennsylvania [/TD]
[TD="width: 139"] Rhode Island [/TD]

[TD="width: 139"] South Carolina [/TD]
[TD="width: 139"] South Dakota [/TD]
[TD="width: 139"] Tennessee [/TD]
[TD="width: 139"] Texas [/TD]
[TD="width: 139"] Utah [/TD]

[TD="width: 139"] Vermont [/TD]
[TD="width: 139"] Virginia [/TD]
[TD="width: 139"] Washington [/TD]
[TD="width: 139"] West Virginia [/TD]
[TD="width: 139"] Wisconsin [/TD]

[TD="width: 139"] Wyoming [/TD]
[TD="width: 139"] New York City [/TD]
[TD="width: 139"] Puerto Rico [/TD]
[TD="width: 139"] Virgin Islands [/TD]
[TD="width: 139"] [/TD]


World Health Organization: Additional influenza surveillance information from participating WHO member nations is available through FluNet and the Global Epidemiology Reports.

WHO Collaborating Centers for Influenza located in Australia, China, Japan, the United Kingdom, and the United States (CDC in Atlanta, Georgia).

Europe: For the most recent influenza surveillance information from Europe, please see WHO/Europe and the European Centre for Disease Prevention and Control at http://www.flunewseurope.org/.

Public Health Agency of Canada: The most up-to-date influenza information from Canada is available at http://www.phac-aspc.gc.ca/fluwatch/

Public Health England: The most up-to-date influenza information from the United Kingdom is available at https://www.gov.uk/government/statistics/weekly-national-flu-reports


Any links provided to non-Federal organizations are provided solely as a service to our users. These links do not constitute an endorsement of these organizations or their programs by CDC or the Federal Government, and none should be inferred. CDC is not responsible for the content of the individual organization web pages found at these links.


An overview of the CDC influenza surveillance system, including methodology and detailed descriptions of each data component, is available at: http://www.cdc.gov/flu/weekly/overview.htm.

--------------------------------------------------------------------------------


Page last reviewed: October 25, 2019
Content source: Centers for Disease Control and Prevention, National Center for Immunization and Respiratory Diseases (NCIRD)Seasonal Influenza (Flu)

https://www.cdc.gov/flu/weekly/index.htm
 
[h=1]Weekly U.S. Influenza Surveillance Report[/h]
Espa?ol
FluView_header.jpg

Key Updates for Week 43, ending October 26, 2019

According to this week’s FluView report, seasonal influenza activity in the United States increased slightly, but remains low. [h=4]Viruses[/h]
Clinical Lab
2.4% of respiratory specimens tested in clinical laboratories were positive for influenza viruses. This is slightly higher than the previous week.

Public Health Lab
Influenza A(H3N2) and influenza B/Victoria viruses have been most common so far, with influenza A(H3N2) viruses slightly outnumbering influenza B/Victoria viruses.

Virus Characterization
Data for this season will be reported when a sufficient number of viruses have been characterized. Virus characterization data through September 28 is available. [h=4]Illness[/h] Outpatient Illness: ILINet
1.9% of visits to a health care provider were for influenza-like illness (ILI). ILI activity is higher than the previous week but remains below the national baseline of 2.4%.

Outpatient Illness: ILI Activity Map
Flu-Survey-Map - Flu Activity & Surveillance


The majority of jurisdictions experienced minimal ILI activity; however, Louisiana and Puerto Rico experienced high ILI activity and 7 states experienced low ILI activity.

Geographic Spread
FluWeeklyReport - Flu Weekly Report


The majority of jurisdictions reported sporadic or local activity; however, Louisiana reported regional activity and Rhode Island reported no activity. [h=4]Severe Disease[/h]
Hospitalizations
Data for this season will be provided when a sufficient number of hospitalizations have been reported.

P&I Mortality
5.1% of deaths were attributed to pneumonia and influenza (P&I). This is below the epidemic threshold of 5.8%.

Pediatric Deaths
No new influenza-associated pediatric deaths occurring during the 2019-2020 season were reported to CDC this week. The total for the season is 2.

All data are preliminary and may change as more reports are received.

An overview of the CDC influenza surveillance system, including methodology and detailed descriptions of each data component, is available at [url]http://www.cdc.gov/flu/weekly/overview.htm[/URL].

Additional information on the current and previous influenza seasons for each surveillance component are available on FluView Interactive

Key Messages from CDC
  • Nationally, flu activity is low and similar to what has been observed during recent previous seasons at the same time, but Louisiana and Puerto Rico both continue to experience high levels of influenza-like-illness.
  • It’s too early to characterize the timing of the season, what viruses will predominate, or how severe the season will be.
  • Flu vaccination is always the best way to prevent flu and its potentially serious complications. Most flu vaccines protect against 4 different flu viruses. Get vaccinated now.
[h=2]U.S. Virologic Surveillance[/h] [h=3]Clinical Laboratories[/h]
The results of tests performed by clinical laboratories nationwide are summarized below. Data from clinical laboratories (the percent of specimens tested that are positive for influenza) are used to monitor whether influenza activity is increasing or decreasing.
17,72082,444
428 (2.4%)2,130 (2.6%)
141 (32.9%)685 (32.2%)
287 (67.1%)1,445 (67.8%)
Week 43 Data Cumulative since September 29, 2019 (week 40) No. of specimens tested No. of positive specimens (%) Positive specimens by type Influenza A Influenza B

The majority (75%) of all influenza viruses and 86% of the influenza B viruses reported by clinical laboratories thus far this season were from the south and southeast regions (regions 4 and 6).
INFLUENZA Virus Isolated

View Chart Data | View Full Screen [h=3]Public Health Laboratories[/h]
The results of tests performed by public health laboratories nationwide are summarized below. Data from public health laboratories are used to monitor the proportion of circulating viruses that belong to each influenza subtype/lineage.
5503,209
106538
67 (63.2%)318 (59.1%)
21 (33.3%)89 (33.7%)
42 (66.7%)194 (66.3%)
435
39 (36.8%)220 (40.9%)
0 (0.0%)6 (3.7%)
20 (100%)155 (96.3%)
1959
Week 43 Data Cumulative since September 29, 2019 (week 40) No. of specimens tested No. of positive specimens Positive specimens by type/subtype Influenza A (H1N1)pdm09 H3N2 Subtyping not performed Influenza B Yamagata lineage Victoria lineage Lineage not performed

Nationally, influenza A(H3N2) viruses have been reported more frequently than other influenza viruses this season; however, influenza B/Victoria viruses have predominated in the south and southeast regions (regions 4 and 6).
INFLUENZA Virus Isolated

View Chart Data | View Full Screen

For additional virologic surveillance information for this season and past seasons:
Surveillance Methods | FluView Interactive: National, Regional, and State Data or Age Data
[h=2]Influenza Virus Characterization[/h]
CDC performs genetic and antigenic characterization of U.S. viruses submitted from state and local health laboratories using Right Size Roadmap submission guidance. These data are used to compare how similar the currently circulating influenza viruses are to the reference viruses used for developing new influenza vaccines and to monitor evolutionary changes that continually occur in influenza viruses circulating in humans. CDC also tests susceptibility of influenza viruses to antiviral medications including the neuraminidase inhibitors (oseltamivir, zanamivir, and peramivir) and the PA endonuclease inhibitor baloxavir.

Virus characterization data will be updated starting later this season when sufficient numbers of specimens have been tested.
[h=2]Outpatient Illness Surveillance[/h] [h=3]ILINet[/h]
Nationwide during week 43, 1.9% of patient visits reported through the U.S. Outpatient Influenza-like Illness Surveillance Network (ILINet) were due to influenza-like illness (ILI). This percentage is below the national baseline of 2.4%.
national levels of ILI and ARI

View Chart Data | View Full Screen

On a regional level, the percentage of outpatient visits for ILI ranged from 1.1% to 3.3% during week 43. All regions reported a percentage of outpatient visits for ILI below their region-specific baselines. [h=3]ILI Activity Map[/h]
Data collected in ILINet are used to produce a measure of ILI activity* by state.

During week 43, the following ILI activity levels were experienced:
  • High – Puerto Rico and 1 state (Louisiana)
  • Low – 7 states (Alabama, Connecticut, Georgia, Missouri, South Carolina, Texas, and Virginia)
  • Minimal – District of Columbia, New York City, and 42 states (Alaska, Arizona, Arkansas, California, Colorado, Delaware, Florida, Hawaii, Idaho, Illinois, Indiana, Iowa, Kansas, Kentucky, Maine, Maryland, Massachusetts, Michigan, Minnesota, Mississippi, Montana, Nebraska, Nevada, New Hampshire, New Jersey, New Mexico, New York, North Carolina, North Dakota, Ohio, Oklahoma, Oregon, Pennsylvania, Rhode Island, South Dakota, Tennessee, Utah, Vermont, Washington, West Virginia, Wisconsin, and Wyoming)
  • Data were Insufficient to calculate an ILI activity level from the U.S. Virgin Islands
*Data collected in ILINet may disproportionally represent certain populations within a state, and therefore, may not accurately depict the full picture of influenza activity for the whole state. Differences in the data presented here by CDC and independently by some state health departments likely represent differing levels of data completeness with data presented by the state likely being the more complete.


Additional information about medically attended visits for ILI this season and past seasons:
Surveillance Methods | FluView Interactive: National, Regional, and State Data or ILI Activity Map


[h=2]Geographic Spread of Influenza as Assessed by State and Territorial Epidemiologists[/h]
The influenza activity reported by state and territorial epidemiologists indicates geographic spread of influenza viruses but does not measure the severity of influenza activity.

During week 43 the following influenza activity was reported:
  • Regional – one state (Louisiana)
  • Local – 10 states (Arizona, Georgia, Hawaii, Idaho, Indiana, Kentucky, Mississippi, Nevada, Tennessee, and Texas).
  • Sporadic – the District of Columbia, Puerto Rico, the U.S. Virgin Islands and 38 states (Alabama, Alaska, Arkansas, California, Colorado, Connecticut, Delaware, Florida, Illinois, Iowa, Kansas, Maine, Maryland, Massachusetts, Michigan, Minnesota, Missouri, Montana, Nebraska, New Hampshire, New Jersey, New Mexico, New York, North Carolina, North Dakota, Ohio, Oklahoma, Oregon, Pennsylvania, South Carolina, South Dakota, Utah, Vermont, Virginia, Washington, West Virginia, Wisconsin, and Wyoming).
  • No activity – one state (Rhode Island).
  • Guam did not report.
Additional information about the geographic spread of influenza this season and past seasons:
Surveillance Methods | FluView Interactive

[h=2]Influenza-Associated Hospitalizations[/h]
The Influenza Hospitalization Surveillance Network (FluSurv-NET) conducts population-based surveillance for laboratory-confirmed influenza-related hospitalizations in select counties in the Emerging Infections Program (EIP) states and Influenza Hospitalization Surveillance Project (IHSP) states. FluSurv-NET estimated hospitalization rates will be updated weekly starting later this season when a sufficient number of hospitalizations have been reported.

Additional FluSurv-NET data can be found at: http://gis.cdc.gov/GRASP/Fluview/FluHospRates.html and http://gis.cdc.gov/grasp/fluview/FluHospChars.html.


[h=2]Pneumonia and Influenza (P&I) Mortality Surveillance[/h]
Based on National Center for Health Statistics (NCHS) mortality surveillance data available on October 31, 2019, 5.1% of the deaths occurring during the week ending October 19, 2019 (week 42) were due to P&I. This percentage is below the epidemic threshold of 5.8% for week 42.
INFLUENZA Virus Isolated

View Chart Data | View Full Screen

Additional pneumonia and influenza mortality surveillance information for current and past seasons:
Surveillance Methods | FluView Interactive


[h=2]Influenza-Associated Pediatric Mortality[/h]
Four influenza-associated pediatric deaths were reported to CDC during week 43. Two of the deaths occurred during week 11 (the week ending March 16, 2019). One of these deaths was associated with an influenza A (H3) virus and the other death was associated with an influenza A (H1N1)pdm09 virus. Two deaths occurred during week 13 (the week ending March, 30, 2019). One of these deaths was associated with an influenza A virus for which no subtyping was performed and the other death was associated with an influenza A (H1N1)pdm09 virus. All four of these deaths occurred during the 2018-2019 season, bringing the total number of deaths during that season to 142.

A total of two influenza-associated pediatric deaths occurring during the 2019-2020 season have been reported to CDC.
Click on image to launch interactive tool

View Full Screen

Additional Influenza-associated pediatric mortality surveillance information for current and past seasons:
Surveillance Methods | FluView Interactive


[h=2]Additional National and International Influenza Surveillance Information[/h]

FluView Interactive: FluView includes enhanced web-based interactive applications that can provide dynamic visuals of the influenza data collected and analyzed by CDC. These FluView Interactive applications allow people to create customized, visual interpretations of influenza data, as well as make comparisons across flu seasons, regions, age groups and a variety of other demographics. To access these tools, visit http://www.cdc.gov/flu/weekly/fluviewinteractive.htm

National Institute for Occupational Safety and Health: Monthly surveillance data on the prevalence of health-related workplace absenteeism among full-time workers in the United States are available from NIOSH at https://www.cdc.gov/niosh/topics/absences/default.html

U.S. State and local influenza surveillance: Click on a jurisdiction below to access the latest local influenza information


[TD="width: 139"] Alabama [/TD]
[TD="width: 139"] Alaska [/TD]
[TD="width: 139"] Arizona [/TD]
[TD="width: 139"] Arkansas [/TD]
[TD="width: 139"] California [/TD]

[TD="width: 139"] Colorado [/TD]
[TD="width: 139"] Connecticut [/TD]
[TD="width: 139"] Delaware [/TD]
[TD="width: 139"] District of Columbia [/TD]
[TD="width: 139"] Florida [/TD]

[TD="width: 139"] Georgia [/TD]
[TD="width: 139"] Hawaii [/TD]
[TD="width: 139"] Idaho [/TD]
[TD="width: 139"] Illinois [/TD]
[TD="width: 139"] Indiana [/TD]

[TD="width: 139"] Iowa [/TD]
[TD="width: 139"] Kansas [/TD]
[TD="width: 139"] Kentucky [/TD]
[TD="width: 139"] Louisiana [/TD]
[TD="width: 139"] Maine [/TD]

[TD="width: 139"] Maryland [/TD]
[TD="width: 139"] Massachusetts [/TD]
[TD="width: 139"] Michigan [/TD]
[TD="width: 139"] Minnesota [/TD]
[TD="width: 139"] Mississippi [/TD]

[TD="width: 139"] Missouri [/TD]
[TD="width: 139"] Montana [/TD]
[TD="width: 139"] Nebraska [/TD]
[TD="width: 139"] Nevada [/TD]
[TD="width: 139"] New Hampshire [/TD]

[TD="width: 139"] New Jersey [/TD]
[TD="width: 139"] New Mexico [/TD]
[TD="width: 139"] New York [/TD]
[TD="width: 139"] North Carolina [/TD]
[TD="width: 139"] North Dakota [/TD]

[TD="width: 139"] Ohio [/TD]
[TD="width: 139"] Oklahoma [/TD]
[TD="width: 139"] Oregon [/TD]
[TD="width: 139"] Pennsylvania [/TD]
[TD="width: 139"] Rhode Island [/TD]

[TD="width: 139"] South Carolina [/TD]
[TD="width: 139"] South Dakota [/TD]
[TD="width: 139"] Tennessee [/TD]
[TD="width: 139"] Texas [/TD]
[TD="width: 139"] Utah [/TD]

[TD="width: 139"] Vermont [/TD]
[TD="width: 139"] Virginia [/TD]
[TD="width: 139"] Washington [/TD]
[TD="width: 139"] West Virginia [/TD]
[TD="width: 139"] Wisconsin [/TD]

[TD="width: 139"] Wyoming [/TD]
[TD="width: 139"] New York City [/TD]
[TD="width: 139"] Puerto Rico [/TD]
[TD="width: 139"] Virgin Islands [/TD]
[TD="width: 139"] [/TD]


World Health Organization: Additional influenza surveillance information from participating WHO member nations is available through FluNet and the Global Epidemiology Reports.

WHO Collaborating Centers for Influenza located in Australia, China, Japan, the United Kingdom, and the United States (CDC in Atlanta, Georgia).

Europe: For the most recent influenza surveillance information from Europe, please see WHO/Europe and the European Centre for Disease Prevention and Control at http://www.flunewseurope.org/.

Public Health Agency of Canada: The most up-to-date influenza information from Canada is available at http://www.phac-aspc.gc.ca/fluwatch/

Public Health England: The most up-to-date influenza information from the United Kingdom is available at https://www.gov.uk/government/statistics/weekly-national-flu-reports


Any links provided to non-Federal organizations are provided solely as a service to our users. These links do not constitute an endorsement of these organizations or their programs by CDC or the Federal Government, and none should be inferred. CDC is not responsible for the content of the individual organization web pages found at these links.


An overview of the CDC influenza surveillance system, including methodology and detailed descriptions of each data component, is available at: http://www.cdc.gov/flu/weekly/overview.htm.

--------------------------------------------------------------------------------


Page last reviewed: November 1, 2019
Content source: Centers for Disease Control and Prevention, National Center for Immunization and Respiratory Diseases (NCIRD)Seasonal Influenza (Flu)
What CDC Does
email_03Get Email Updates

To receive weekly email updates about Seasonal Flu, enter your email address: Email Address
What's this?
Submit
H1N1 Flu Pandemic 2009-2019: A Decade Later - H1N1 Flu Pandemic 2009-2019: A Decade Later

Influenza Types
https://www.cdc.gov/flu/weekly/index.htm
 
[h=1]Weekly U.S. Influenza Surveillance Report[/h]
Espa?ol
FluView_header.jpg

Key Updates for Week 44, ending November 2, 2019

According to this week’s FluView report, seasonal influenza activity in the United States remains low but is increasing. [h=4]Viruses[/h]
Clinical Lab
3.2% of respiratory specimens tested by clinical laboratories were positive for influenza viruses. This is higher than the previous week.

Public Health Lab
Nationally, A(H3N2) and B/Victoria viruses have been most common; however, A(H1N1)pdm09 viruses also circulated. The predominant virus varies by region.

Virus Characterization
Data for this season will be reported when a sufficient number of viruses have been characterized. Virus characterization data through September 28 is available. [h=4]Illness[/h] Outpatient Illness: ILINet
2.1% of visits to a health care provider were for influenza-like illness (ILI). ILI activity is higher than the previous week but remains below the national baseline of 2.4%.

Outpatient Illness: ILI Activity Map
Flu-Survey-Map - Flu Activity & Surveillance


The majority of jurisdictions experienced minimal ILI activity; however, Louisiana and Puerto Rico experienced high ILI activity and 9 states experienced low ILI activity.

Geographic Spread
FluWeeklyReport - Flu Weekly Report


The majority of jurisdictions reported sporadic or local activity. Three states reported regional or widespread activity, and one state reported no activity. [h=4]Severe Disease[/h]
Hospitalizations
Data for this season will be provided when a sufficient number of hospitalizations have been reported.

P&I Mortality
Due to technical issues, data from the NCHS mortality surveillance system are not available this week.

Pediatric Deaths
No new influenza-associated pediatric deaths occurring during the 2019-2020 season were reported to CDC this week. The total for the season is 2.

All data are preliminary and may change as more reports are received.

An overview of the CDC influenza surveillance system, including methodology and detailed descriptions of each data component, is available at [url]http://www.cdc.gov/flu/weekly/overview.htm[/URL].

Additional information on the current and previous influenza seasons for each surveillance component are available on FluView Interactive

Key Messages from CDC
  • Nationally, flu activity is low and similar to what has been observed during recent previous seasons at the same time, but Louisiana and Puerto Rico both continue to experience high levels of influenza-like-illness.
  • It’s too early to characterize the timing of the season, what viruses will predominate, or how severe the season will be.
  • Flu vaccination is always the best way to prevent flu and its potentially serious complications. Most flu vaccines protect against 4 different flu viruses. Get vaccinated now.
[h=2]U.S. Virologic Surveillance[/h] [h=3]Clinical Laboratories[/h]
The results of tests performed by clinical laboratories nationwide are summarized below. Data from clinical laboratories (the percentage of specimens tested that are positive for influenza) are used to monitor whether influenza activity is increasing or decreasing.
18,126101,524
582 (3.2%)1,978 (1.9%)
143 (24.6%)738 (37.3%)
439 (75.4%)1,240 (62.7%)
Week 44 Data Cumulative since September 29, 2019 (week 40) No. of specimens tested* No. of positive specimens (%) Positive specimens by type Influenza A Influenza B

[SIZE=-1]* The total number of specimens tested by clinical laboratories decreased this week for this season because one high volume laboratory has been removed due to questions about testing practices and data interpretation.[/SIZE]

The majority (63%) of all influenza viruses and 75% of the influenza B viruses reported by clinical laboratories thus far this season were from the south and southeast regions (regions 4 and 6).
INFLUENZA Virus Isolated

View Chart Data | View Full Screen [h=3]Public Health Laboratories[/h]
The results of tests performed by public health laboratories nationwide are summarized below. Data from public health laboratories are used to monitor the proportion of circulating viruses that belong to each influenza subtype/lineage.
7665,022
117873
54 (46.2%)491 (56.2%)
22 (41.5%)153 (34.8%)
31 (58.5%)287 (65.2%)
151
63 (53.8%)382 (43.8%)
4 (9.5%)11 (3.7%)
38 (90.5%)287 (96.3%)
2184
Week 44 Data Cumulative since September 29, 2019 (week 40) No. of specimens tested No. of positive specimens Positive specimens by type/subtype Influenza A (H1N1)pdm09 H3N2 Subtyping not performed Influenza B Yamagata lineage Victoria lineage Lineage not performed

Nationally, influenza A(H3N2) and B/Victoria viruses have been reported more frequently than other influenza viruses this season; however, influenza A(H1N1)pdm09 viruses are also circulating widely. The predominant virus varies by region. For regional and state level data about circulating influenza viruses, please visit FluView Interactive.
INFLUENZA Virus Isolated

View Chart Data | View Full Screen

For additional virologic surveillance information for this season and past seasons:
Surveillance Methods | FluView Interactive: National, Regional, and State Data or Age Data
[h=2]Influenza Virus Characterization[/h]
CDC performs genetic and antigenic characterization of U.S. viruses submitted from state and local health laboratories using Right Size Roadmap submission guidance. These data are used to compare how similar the currently circulating influenza viruses are to the reference viruses used for developing new influenza vaccines and to monitor evolutionary changes that continually occur in influenza viruses circulating in humans. CDC also tests susceptibility of influenza viruses to antiviral medications including the neuraminidase inhibitors (oseltamivir, zanamivir, and peramivir) and the PA endonuclease inhibitor baloxavir.

Virus characterization data will be updated starting later this season when sufficient numbers of specimens have been tested.
[h=2]Outpatient Illness Surveillance[/h] [h=3]ILINet[/h]
Nationwide during week 44, 2.1% of patient visits reported through the U.S. Outpatient Influenza-like Illness Surveillance Network (ILINet) were due to influenza-like illness (ILI). This percentage is below the national baseline of 2.4%.
national levels of ILI and ARI

View Chart Data | View Full Screen

On a regional level, the percentage of outpatient visits for ILI ranged from 1.2% to 3.8% during week 44. Region 6 (Arkansas, Louisiana, New Mexico, Oklahoma, and Texas) and Region 7 (Iowa, Kansas, Missouri, and Nebraska) reported a percentage of outpatient visits for ILI which is equal to their region-specific baselines. All other regions remained below their region-specific baselines. [h=3]ILI Activity Map[/h]
Data collected in ILINet are used to produce a measure of ILI activity* by state.

During week 44, the following ILI activity levels were experienced:
  • High – Puerto Rico and one state (Louisiana) (Louisiana)
  • Low – nine states (Alabama, Arkansas, Colorado, Georgia, Hawaii, Missouri, South Carolina, Texas, and Virginia)
  • Minimal – the U.S. Virgin Islands, the District of Columbia, New York City, and 40 states (Alaska, Arizona, California, Connecticut, Delaware, Florida, Idaho, Illinois, Indiana, Iowa, Kansas, Kentucky, Maine, Maryland, Massachusetts, Michigan, Minnesota, Mississippi, Montana, Nebraska, Nevada, New Hampshire, New Jersey, New Mexico, New York, North Carolina, North Dakota, Ohio, Oklahoma, Oregon, Pennsylvania, Rhode Island, South Dakota, Tennessee, Utah, Vermont, Washington, West Virginia, Wisconsin, and Wyoming)
[SIZE=-1]*Data collected in ILINet may disproportionally represent certain populations within a state, and therefore, may not accurately depict the full picture of influenza activity for the whole state. Differences in the data presented here by CDC and independently by some state health departments likely represent differing levels of data completeness with data presented by the state likely being the more complete.[/SIZE]


Additional information about medically attended visits for ILI this season and past seasons:
Surveillance Methods | FluView Interactive: National, Regional, and State Data or ILI Activity Map


[h=2]Geographic Spread of Influenza as Assessed by State and Territorial Epidemiologists[/h]
The influenza activity reported by state and territorial epidemiologists indicates geographic spread of influenza viruses but does not measure the severity of influenza activity.

During week 44 the following influenza activity was reported:
  • Widespread – two states (Louisiana and Maryland)
  • Regional – one state (Alabama)
  • Local – Puerto Rico and 15 states (Arizona, California, Florida, Georgia, Illinois, Indiana, Kentucky, Massachusetts, Mississippi, Nevada, New Hampshire, South Carolina, Tennessee, Texas and West Virginia).
  • Sporadic – the District of Columbia, the U.S. Virgin Islands and 31 states (Alaska, Arkansas, Colorado, Connecticut, Delaware, Hawaii, Idaho, Iowa, Kansas, Maine, Michigan, Minnesota, Missouri, Montana, Nebraska, New Jersey, New Mexico, New York, North Carolina, North Dakota, Ohio, Oklahoma, Oregon, Pennsylvania, South Dakota, Utah, Vermont, Virginia, Washington, Wisconsin, and Wyoming).
  • No activity – one state (Rhode Island)
  • Guam did not report.
Additional information about the geographic spread of influenza this season and past seasons:
Surveillance Methods | FluView Interactive

[h=2]Influenza-Associated Hospitalizations[/h]
The Influenza Hospitalization Surveillance Network (FluSurv-NET) conducts population-based surveillance for laboratory-confirmed influenza-related hospitalizations in select counties in the Emerging Infections Program (EIP) states and Influenza Hospitalization Surveillance Project (IHSP) states. FluSurv-NET estimated hospitalization rates will be updated weekly starting later this season when a sufficient number of hospitalizations have been reported.

Additional FluSurv-NET data can be found at: http://gis.cdc.gov/GRASP/Fluview/FluHospRates.html and http://gis.cdc.gov/grasp/fluview/FluHospChars.html.


[h=2]Pneumonia and Influenza (P&I) Mortality Surveillance[/h]
Due to technical issues, the National Center for Health Statistics (NCHS) mortality surveillance data for the week ending October 26, 2019 (week 43) will not be published this week. Reporting of this data will resume once the technical issues have been resolved.

Additional pneumonia and influenza mortality surveillance information for current and past seasons:
Surveillance Methods | FluView Interactive


[h=2]Influenza-Associated Pediatric Mortality[/h]
No influenza-associated pediatric deaths were reported to CDC during week 44.

A total of two influenza-associated pediatric deaths occurring during the 2019-2020 season have been reported to CDC.
Click on image to launch interactive tool

View Full Screen

Additional Influenza-associated pediatric mortality surveillance information for current and past seasons:
Surveillance Methods | FluView Interactive


[h=2]Additional National and International Influenza Surveillance Information[/h]

FluView Interactive: FluView includes enhanced web-based interactive applications that can provide dynamic visuals of the influenza data collected and analyzed by CDC. These FluView Interactive applications allow people to create customized, visual interpretations of influenza data, as well as make comparisons across flu seasons, regions, age groups and a variety of other demographics. To access these tools, visit http://www.cdc.gov/flu/weekly/fluviewinteractive.htm

National Institute for Occupational Safety and Health: Monthly surveillance data on the prevalence of health-related workplace absenteeism among full-time workers in the United States are available from NIOSH at https://www.cdc.gov/niosh/topics/absences/default.html

U.S. State and local influenza surveillance: Click on a jurisdiction below to access the latest local influenza information


[TD="width: 139"] Alabama [/TD]
[TD="width: 139"] Alaska [/TD]
[TD="width: 139"] Arizona [/TD]
[TD="width: 139"] Arkansas [/TD]
[TD="width: 139"] California [/TD]

[TD="width: 139"] Colorado [/TD]
[TD="width: 139"] Connecticut [/TD]
[TD="width: 139"] Delaware [/TD]
[TD="width: 139"] District of Columbia [/TD]
[TD="width: 139"] Florida [/TD]

[TD="width: 139"] Georgia [/TD]
[TD="width: 139"] Hawaii [/TD]
[TD="width: 139"] Idaho [/TD]
[TD="width: 139"] Illinois [/TD]
[TD="width: 139"] Indiana [/TD]

[TD="width: 139"] Iowa [/TD]
[TD="width: 139"] Kansas [/TD]
[TD="width: 139"] Kentucky [/TD]
[TD="width: 139"] Louisiana [/TD]
[TD="width: 139"] Maine [/TD]

[TD="width: 139"] Maryland [/TD]
[TD="width: 139"] Massachusetts [/TD]
[TD="width: 139"] Michigan [/TD]
[TD="width: 139"] Minnesota [/TD]
[TD="width: 139"] Mississippi [/TD]

[TD="width: 139"] Missouri [/TD]
[TD="width: 139"] Montana [/TD]
[TD="width: 139"] Nebraska [/TD]
[TD="width: 139"] Nevada [/TD]
[TD="width: 139"] New Hampshire [/TD]

[TD="width: 139"] New Jersey [/TD]
[TD="width: 139"] New Mexico [/TD]
[TD="width: 139"] New York [/TD]
[TD="width: 139"] North Carolina [/TD]
[TD="width: 139"] North Dakota [/TD]

[TD="width: 139"] Ohio [/TD]
[TD="width: 139"] Oklahoma [/TD]
[TD="width: 139"] Oregon [/TD]
[TD="width: 139"] Pennsylvania [/TD]
[TD="width: 139"] Rhode Island [/TD]

[TD="width: 139"] South Carolina [/TD]
[TD="width: 139"] South Dakota [/TD]
[TD="width: 139"] Tennessee [/TD]
[TD="width: 139"] Texas [/TD]
[TD="width: 139"] Utah [/TD]

[TD="width: 139"] Vermont [/TD]
[TD="width: 139"] Virginia [/TD]
[TD="width: 139"] Washington [/TD]
[TD="width: 139"] West Virginia [/TD]
[TD="width: 139"] Wisconsin [/TD]

[TD="width: 139"] Wyoming [/TD]
[TD="width: 139"] New York City [/TD]
[TD="width: 139"] Puerto Rico [/TD]
[TD="width: 139"] Virgin Islands [/TD]
[TD="width: 139"] [/TD]


World Health Organization: Additional influenza surveillance information from participating WHO member nations is available through FluNet and the Global Epidemiology Reports.

WHO Collaborating Centers for Influenza located in Australia, China, Japan, the United Kingdom, and the United States (CDC in Atlanta, Georgia).

Europe: For the most recent influenza surveillance information from Europe, please see WHO/Europe and the European Centre for Disease Prevention and Control at http://www.flunewseurope.org/.

Public Health Agency of Canada: The most up-to-date influenza information from Canada is available at http://www.phac-aspc.gc.ca/fluwatch/

Public Health England: The most up-to-date influenza information from the United Kingdom is available at https://www.gov.uk/government/statistics/weekly-national-flu-reports


Any links provided to non-Federal organizations are provided solely as a service to our users. These links do not constitute an endorsement of these organizations or their programs by CDC or the Federal Government, and none should be inferred. CDC is not responsible for the content of the individual organization web pages found at these links.


An overview of the CDC influenza surveillance system, including methodology and detailed descriptions of each data component, is available at: http://www.cdc.gov/flu/weekly/overview.htm.

--------------------------------------------------------------------------------


Page last reviewed: November 8, 2019
Content source: Centers for Disease Control and Prevention, National Center for Immunization and Respiratory Diseases (NCIRD)Seasonal Influenza (Flu)
What CDC Does
email_03Get Email Updates

To receive weekly email updates about Seasonal Flu, enter your email address: Email Address
What's this?
Submit
H1N1 Flu Pandemic 2009-2019: A Decade Later - H1N1 Flu Pandemic 2009-2019: A Decade Later

Influenza Types
https://www.cdc.gov/flu/weekly/index.htm
 
[h=1]Weekly U.S. Influenza Surveillance Report[/h]
Espa?ol
FluView_header.jpg

Key Updates for Week 45, ending November 9, 2019

According to this week’s FluView report, seasonal influenza activity in the United States is increasing. [h=4]Viruses[/h]
Clinical Lab
Due to technical issues, data from clinical laboratories are not available this week.

Public Health Lab
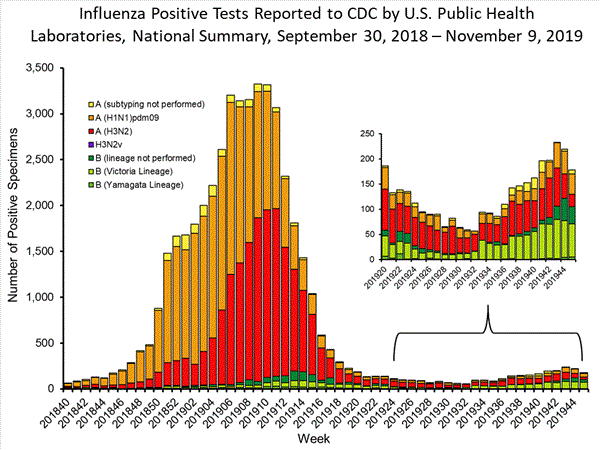
Nationally, B/Victoria viruses are predominant; however, A(H3N2) and A(H1N1)pdm09 viruses are also circulating widely. The predominant virus varies by region and age.

Virus Characterization
Data for this season will be reported when a sufficient number of viruses have been characterized. Virus characterization data through September 28 is available. [h=4]Illness[/h] Outpatient Illness: ILINet
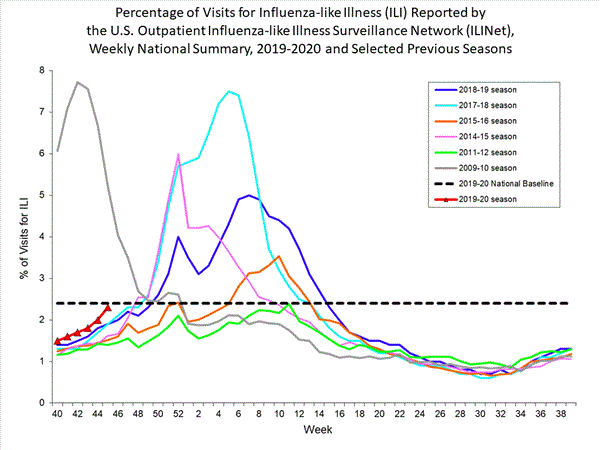
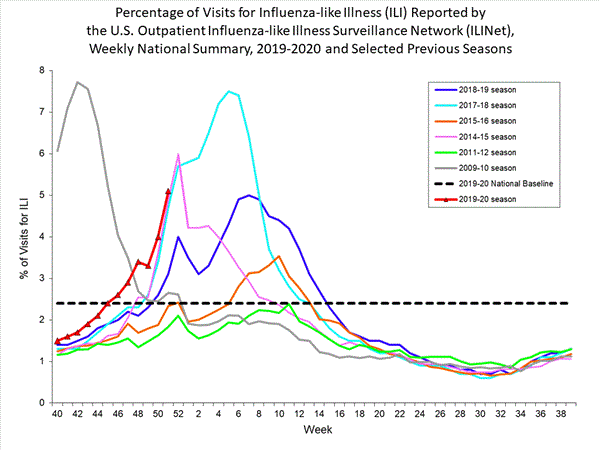
2.3% of visits to a health care provider were for influenza-like illness (ILI). Nationally, ILI was below the baseline (2.4%); however, 4 of 10 regions were at or above their baselines.

Outpatient Illness: ILI Activity Map
Flu-Survey-Map - Flu Activity & Surveillance


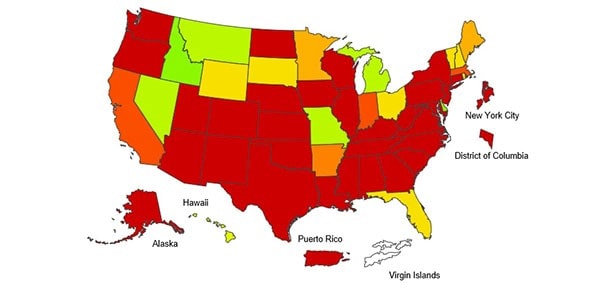
The majority of jurisdictions experienced minimal ILI activity; however, Louisiana experienced high ILI activity and 14 jurisdictions experienced moderate or low ILI activity.

Geographic Spread
FluWeeklyReport - Flu Weekly Report


The majority of jurisdictions reported sporadic or local activity. Ten states reported regional or widespread activity, and one state reported no activity. [h=4]Severe Disease[/h]
Hospitalizations
Data for this season will be provided when a sufficient number of hospitalizations have been reported.

P&I Mortality
4.9% of deaths were attributed to pneumonia and influenza (P&I). This is below the epidemic threshold of 6.0%.

Pediatric Deaths
One new influenza-associated pediatric death occurring during the 2019-2020 season was reported to CDC this week. The total for the season is 3.

All data are preliminary and may change as more reports are received.

An overview of the CDC influenza surveillance system, including methodology and detailed descriptions of each data component, is available at [url]http://www.cdc.gov/flu/weekly/overview.htm[/URL].

Additional information on the current and previous influenza seasons for each surveillance component are available on FluView Interactive

Key Messages from CDC
  • Nationally, ILI activity remains below baseline but parts of the country are seeing early increases in activity.
  • There is significant cocirculation of influenza A(H3N2), A(H1N1)pdm09 and B/Victoria viruses with the predominant virus varying by region and age group.
  • Flu vaccination is always the best way to prevent flu and its potentially serious complications. Most flu vaccines protect against 4 different flu viruses. Get vaccinated now.
[h=2]U.S. Virologic Surveillance[/h] [h=3]Clinical Laboratories[/h]
Due to technical issues with the National Respiratory and Enteric Virus Surveillance System (NREVSS) reporting platform, the clinical laboratory data are not available for week 45. An update to previous weeks is included in the table below and is available on FluView Interactive. Reporting of this data will resume once the technical issues have been resolved. We apologize for the inconvenience.
--104,888
--2,091 (2.0%)
--793 (37.9%)
--1,298 (62.1%)
Week 45 Cumulative Data
September 29, 2019 through
November 2, 2019
(Weeks 40 - 44)
No. of specimens tested No. of positive specimens (%) Positive specimens by type Influenza A Influenza B
[h=3]Public Health Laboratories[/h]
The results of tests performed by public health laboratories nationwide are summarized below. Data from public health laboratories are used to monitor the proportion of circulating viruses that belong to each influenza subtype/lineage.
8446,473
1781,185
73 (41.0%)627 (52.9%)
40 (61.5%)223 (39.3%)
25 (38.5%)344 (60.7%)
860
105 (59.0%)558 (47.1%)
5 (7.0%)17 (4.0%)
66 (93.0%)408 (96.0%)
34133
Week 45 Data Cumulative since September 29, 2019
(week 40)
No. of specimens tested No. of positive specimens Positive specimens by type/subtype Influenza A (H1N1)pdm09 H3N2 Subtyping not performed Influenza B Yamagata lineage Victoria lineage Lineage not performed

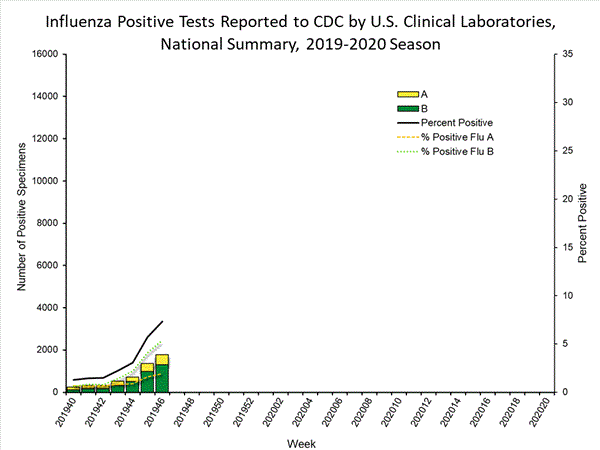
Nationally influenza B/Victoria viruses have been reported more frequently than other influenza viruses this season; however, influenza A(H3N2) and A(H1N1)pdm09 viruses are also circulating widely. The predominant virus varies by region. Regional and state level data about circulating influenza viruses can be found on FluView Interactive. The predominant virus also varies by age group. Nationally, influenza B/Victoria viruses are the most commonly reported influenza viruses among children age 0-4 years (45% of reported viruses) and 5-24 years (53% of reported viruses), while A(H3N2) viruses are the most commonly reported influenza viruses among persons 65 years of age and older (72% of reported viruses). Among adults aged 25-64 years, approximately equal proportions of influenza A(H1N1)pdm09, A(H3N2) and B/Victoria viruses (31%, 30% and 26%, respectively) have been reported. Additional age data can be found on FluView Interactive.
INFLUENZA Virus Isolated

View Chart Data | View Full Screen

For additional virologic surveillance information for this season and past seasons:
Surveillance Methods | FluView Interactive: National, Regional, and State Data or Age Data
[h=2]Influenza Virus Characterization[/h]
CDC performs genetic and antigenic characterization of U.S. viruses submitted from state and local health laboratories using Right Size Roadmap submission guidance. These data are used to compare how similar the currently circulating influenza viruses are to the reference viruses used for developing new influenza vaccines and to monitor evolutionary changes that continually occur in influenza viruses circulating in humans. CDC also tests susceptibility of influenza viruses to antiviral medications including the neuraminidase inhibitors (oseltamivir, zanamivir, and peramivir) and the PA endonuclease inhibitor baloxavir.

Virus characterization data will be updated starting later this season when sufficient numbers of specimens have been tested.
[h=2]Outpatient Illness Surveillance[/h] [h=3]ILINet[/h]
Nationwide during week 45, 2.3% of patient visits reported through the U.S. Outpatient Influenza-like Illness Surveillance Network (ILINet) were due to influenza-like illness (ILI). This percentage is below the national baseline of 2.4%.
national levels of ILI and ARI

View Chart Data | View Full Screen

On a regional level, the percentage of outpatient visits for ILI ranged from 1.2% to 4.2% during week 45. Region 4 (Alabama, Florida, Georgia, Kentucky, Mississippi, North Carolina, South Carolina, and Tennessee), Region 6 (Arkansas, Louisiana, New Mexico, Oklahoma, and Texas), Region 7 (Iowa, Kansas, Missouri, and Nebraska), and Region 9 (Arizona, California, Hawaii, and Nevada) reported a percentage of outpatient visits for ILI which is equal to or above their region-specific baselines. Regions 1, 2, 3, 5, 8, and 10 remained below their region-specific baselines. [h=3]ILI Activity Map[/h]
Data collected in ILINet are used to produce a measure of ILI activity* by state.

During week 45, the following ILI activity levels were experienced:
  • High – one state (Louisiana)
  • Moderate – Puerto Rico and five states (Alabama, Georgia, Mississippi, South Carolina and Texas)
  • Low – nine states (Arizona, Arkansas, Connecticut, Missouri, Nevada, New Mexico, Oklahoma, Tennessee and Virginia)
  • Minimal – the District of Columbia, New York City, and 35 states (Alaska, California, Colorado, Delaware, Florida, Hawaii, Idaho, Illinois, Indiana, Iowa, Kansas, Kentucky, Maine, Maryland, Massachusetts, Michigan, Minnesota, Montana, Nebraska, New Hampshire, New Jersey, New York, North Carolina, North Dakota, Ohio, Oregon, Pennsylvania, Rhode Island, South Dakota, Utah, Vermont, Washington, West Virginia, Wisconsin and Wyoming)
  • Data were Insufficient to calculate an ILI activity level from the U.S. Virgin Islands.
[SIZE=-1]*Data collected in ILINet may disproportionally represent certain populations within a state, and therefore, may not accurately depict the full picture of influenza activity for the whole state. Differences in the data presented here by CDC and independently by some state health departments likely represent differing levels of data completeness with data presented by the state likely being the more complete.[/SIZE]


Additional information about medically attended visits for ILI this season and past seasons:
Surveillance Methods | FluView Interactive: National, Regional, and State Data or ILI Activity Map


[h=2]Geographic Spread of Influenza as Assessed by State and Territorial Epidemiologists[/h]
The influenza activity reported by state and territorial epidemiologists indicates geographic spread of influenza viruses but does not measure the severity of influenza activity.

During week 45 the following influenza activity was reported:
  • Widespread – three states (California, Louisiana and Maryland)
  • Regional – seven states (Alabama, Florida, Indiana, Nevada, New Hampshire, Tennessee and Texas)
  • Local – Puerto Rico and 20 states (Arizona, Colorado, Connecticut, Georgia, Hawaii, Illinois, Iowa, Kentucky, Massachusetts, Mississippi, New Jersey, New Mexico, New York, North Carolina, North Dakota, Oklahoma, Oregon, South Carolina, Virginia and Washington)
  • Sporadic – the District of Columbia, the U.S. Virgin Islands and 19 states (Alaska, Arkansas, Delaware, Idaho, Kansas, Maine, Michigan, Minnesota, Missouri, Montana, Nebraska, Ohio, Pennsylvania, South Dakota, Utah, Vermont, West Virginia, Wisconsin and Wyoming)
  • No Activity – one state (Rhode Island)
  • Guam did not report.
Additional information about the geographic spread of influenza this season and past seasons:
Surveillance Methods | FluView Interactive

[h=2]Influenza-Associated Hospitalizations[/h]
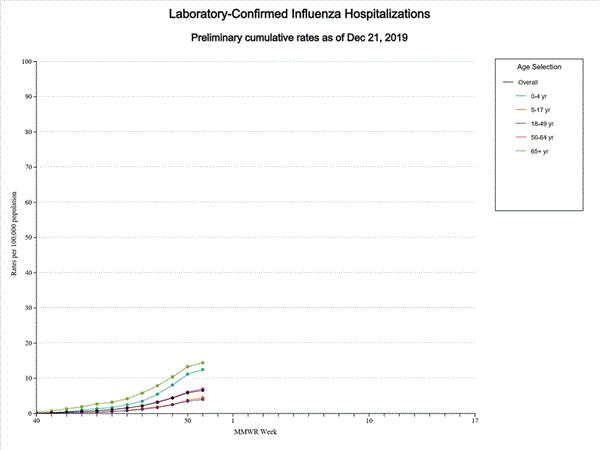
The Influenza Hospitalization Surveillance Network (FluSurv-NET) conducts population-based surveillance for laboratory-confirmed influenza-related hospitalizations in select counties in the Emerging Infections Program (EIP) states and Influenza Hospitalization Surveillance Project (IHSP) states. FluSurv-NET estimated hospitalization rates will be updated weekly starting later this season when a sufficient number of hospitalizations have been reported.

Additional FluSurv-NET data can be found at: http://gis.cdc.gov/GRASP/Fluview/FluHospRates.html and http://gis.cdc.gov/grasp/fluview/FluHospChars.html.


[h=2]Pneumonia and Influenza (P&I) Mortality Surveillance[/h]
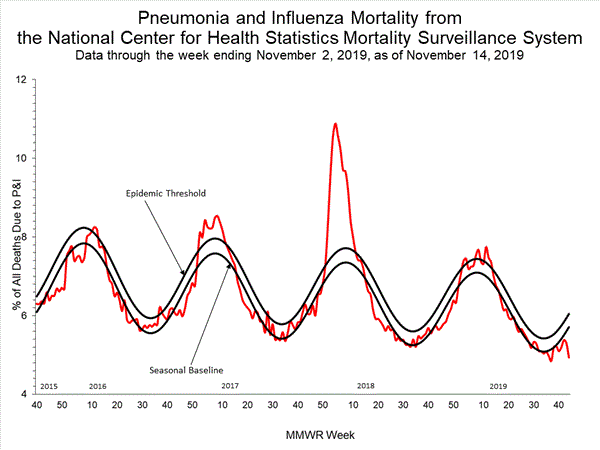
Based on National Center for Health Statistics (NCHS) mortality surveillance data available on November 14, 2019, 4.9% of the deaths occurring during the week ending October 19, 2019 (week 44) were due to P&I. This percentage is below the epidemic threshold of 6.0% for week 44.
INFLUENZA Virus Isolated

View Chart Data | View Full Screen

Additional pneumonia and influenza mortality surveillance information for current and past seasons:
Surveillance Methods | FluView Interactive


[h=2]Influenza-Associated Pediatric Mortality[/h]
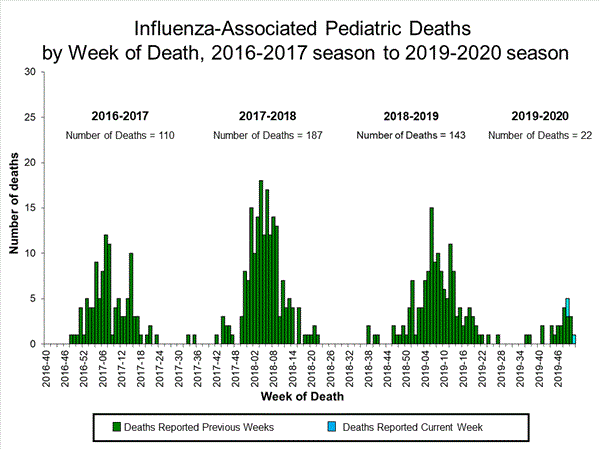
Two influenza-associated pediatric deaths were reported to CDC during week 45.

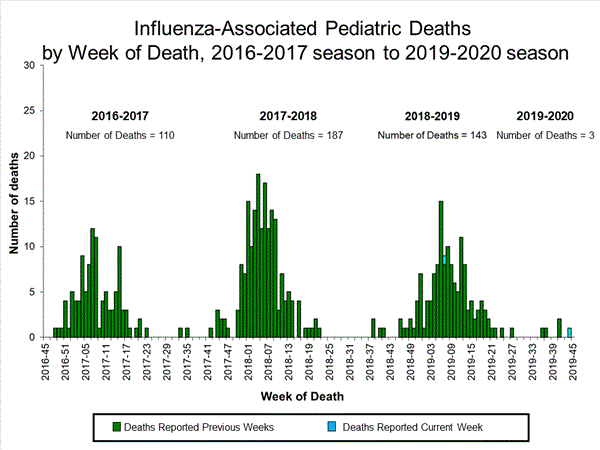
One death was associated with an influenza A virus for which no subtyping was performed and occurred during week 7 (the week ending February 16, 2019) in the 2018-2019 season. This brings the total number of deaths during that season to 143.

One death was associated with an influenza B/Victoria virus and occurred during week 44 (the week ending November 2, 2019). A total of three influenza-associated pediatric deaths occurring during the 2019-2020 season have been reported to CDC.
Click on image to launch interactive tool

View Full Screen

Additional Influenza-associated pediatric mortality surveillance information for current and past seasons:
Surveillance Methods | FluView Interactive


[h=2]Additional National and International Influenza Surveillance Information[/h]

FluView Interactive: FluView includes enhanced web-based interactive applications that can provide dynamic visuals of the influenza data collected and analyzed by CDC. These FluView Interactive applications allow people to create customized, visual interpretations of influenza data, as well as make comparisons across flu seasons, regions, age groups and a variety of other demographics. To access these tools, visit http://www.cdc.gov/flu/weekly/fluviewinteractive.htm

National Institute for Occupational Safety and Health: Monthly surveillance data on the prevalence of health-related workplace absenteeism among full-time workers in the United States are available from NIOSH at https://www.cdc.gov/niosh/topics/absences/default.html

U.S. State and local influenza surveillance: Click on a jurisdiction below to access the latest local influenza information


[TD="width: 139"] Alabama [/TD]
[TD="width: 139"] Alaska [/TD]
[TD="width: 139"] Arizona [/TD]
[TD="width: 139"] Arkansas [/TD]
[TD="width: 139"] California [/TD]

[TD="width: 139"] Colorado [/TD]
[TD="width: 139"] Connecticut [/TD]
[TD="width: 139"] Delaware [/TD]
[TD="width: 139"] District of Columbia [/TD]
[TD="width: 139"] Florida [/TD]

[TD="width: 139"] Georgia [/TD]
[TD="width: 139"] Hawaii [/TD]
[TD="width: 139"] Idaho [/TD]
[TD="width: 139"] Illinois [/TD]
[TD="width: 139"] Indiana [/TD]

[TD="width: 139"] Iowa [/TD]
[TD="width: 139"] Kansas [/TD]
[TD="width: 139"] Kentucky [/TD]
[TD="width: 139"] Louisiana [/TD]
[TD="width: 139"] Maine [/TD]

[TD="width: 139"] Maryland [/TD]
[TD="width: 139"] Massachusetts [/TD]
[TD="width: 139"] Michigan [/TD]
[TD="width: 139"] Minnesota [/TD]
[TD="width: 139"] Mississippi [/TD]

[TD="width: 139"] Missouri [/TD]
[TD="width: 139"] Montana [/TD]
[TD="width: 139"] Nebraska [/TD]
[TD="width: 139"] Nevada [/TD]
[TD="width: 139"] New Hampshire [/TD]

[TD="width: 139"] New Jersey [/TD]
[TD="width: 139"] New Mexico [/TD]
[TD="width: 139"] New York [/TD]
[TD="width: 139"] North Carolina [/TD]
[TD="width: 139"] North Dakota [/TD]

[TD="width: 139"] Ohio [/TD]
[TD="width: 139"] Oklahoma [/TD]
[TD="width: 139"] Oregon [/TD]
[TD="width: 139"] Pennsylvania [/TD]
[TD="width: 139"] Rhode Island [/TD]

[TD="width: 139"] South Carolina [/TD]
[TD="width: 139"] South Dakota [/TD]
[TD="width: 139"] Tennessee [/TD]
[TD="width: 139"] Texas [/TD]
[TD="width: 139"] Utah [/TD]

[TD="width: 139"] Vermont [/TD]
[TD="width: 139"] Virginia [/TD]
[TD="width: 139"] Washington [/TD]
[TD="width: 139"] West Virginia [/TD]
[TD="width: 139"] Wisconsin [/TD]

[TD="width: 139"] Wyoming [/TD]
[TD="width: 139"] New York City [/TD]
[TD="width: 139"] Puerto Rico [/TD]
[TD="width: 139"] Virgin Islands [/TD]
[TD="width: 139"] [/TD]


World Health Organization: Additional influenza surveillance information from participating WHO member nations is available through FluNet and the Global Epidemiology Reports.

WHO Collaborating Centers for Influenza located in Australia, China, Japan, the United Kingdom, and the United States (CDC in Atlanta, Georgia).

Europe: For the most recent influenza surveillance information from Europe, please see WHO/Europe and the European Centre for Disease Prevention and Control at http://www.flunewseurope.org/.

Public Health Agency of Canada: The most up-to-date influenza information from Canada is available at http://www.phac-aspc.gc.ca/fluwatch/

Public Health England: The most up-to-date influenza information from the United Kingdom is available at https://www.gov.uk/government/statistics/weekly-national-flu-reports


Any links provided to non-Federal organizations are provided solely as a service to our users. These links do not constitute an endorsement of these organizations or their programs by CDC or the Federal Government, and none should be inferred. CDC is not responsible for the content of the individual organization web pages found at these links.


An overview of the CDC influenza surveillance system, including methodology and detailed descriptions of each data component, is available at: http://www.cdc.gov/flu/weekly/overview.htm.

--------------------------------------------------------------------------------


Page last reviewed: November 15, 2019, 11:00 AM
Content source: Centers for Disease Control and Prevention, National Center for Immunization and Respiratory Diseases (NCIRD)Seasonal Influenza (Flu)
What CDC Does
email_03Get Email Updates

To receive weekly email updates about Seasonal Flu, enter your email address: Email Address
What's this?
Submit
H1N1 Flu Pandemic 2009-2019: A Decade Later - H1N1 Flu Pandemic 2009-2019: A Decade Later

Influenza Types
https://www.cdc.gov/flu/weekly/index.htm
 
[h=1]Weekly U.S. Influenza Surveillance Report[/h]
FluView_header.jpg

Key Updates for Week 46, ending November 16, 2019

According to this week’s FluView report, seasonal influenza activity in the United States continues to increase but the amount of activity and the predominant influenza virus varies by region. [h=4]Viruses[/h]
Clinical Lab
7.3% of respiratory specimens tested by clinical laboratories were positive for influenza viruses. This is higher than the previous week.

Public Health Lab
Nationally, B/Victoria viruses are most common followed by A(H1N1)pdm09 and A(H3N2) viruses. The predominant virus varies by region and age group.

Virus Characterization
Genetic and antigenic characterization and antiviral susceptibility of viruses collected in the U.S. this season is now being reported. [h=4]Illness[/h] Outpatient Illness: ILINet
2.5% of visits to health care providers were for influenza-like illness (ILI). ILI was above the national baseline of 2.4% for the first time. Four of 10 regions were at or above their baselines.

Outpatient Illness: ILI Activity Map
Flu-Survey-Map - Flu Activity & Surveillance


The number of jurisdictions experiencing high ILI activity increased from 1 last week to 8 this week; however 44 jurisdictions experienced minimal or low ILI activity.

Geographic Spread
FluWeeklyReport - Flu Weekly Report


The number of jurisdictions reporting regional or widespread activity increased from 10 last week to 15 this week. [h=4]Severe Disease[/h]
Hospitalizations
The overall hospitalization rate for the season is 1.4 per 100,000. This is similar to what has been seen at this time during other recent seasons.

P&I Mortality
5.2% of deaths were attributed to pneumonia and influenza (P&I). This is below the epidemic threshold of 6.2%.

Pediatric Deaths
One new influenza-associated pediatric death occurring during the 2019-2020 season was reported to CDC this week. The total for the season is 4.

All data are preliminary and may change as more reports are received.

A description of the CDC influenza surveillance system, including methodology and detailed descriptions of each data components is available on the surveillance methods page.

Additional information on the current and previous influenza seasons for each surveillance component are available on FluView Interactive

Key Messages from CDC
  • Nationally, ILI activity has been at or above baseline for two weeks; however, the amount of influenza activity across the country varies with the south and parts of the west seeing elevated activity while other parts of the country are still seeing low activity.
  • There is significant cocirculation of influenza A(H3N2), A(H1N1)pdm09 and B/Victoria viruses with the predominant virus varying by region and age group.
  • The flu season is just getting started. It’s not too late to get vaccinated. Flu vaccination is always the best way to prevent flu and its potentially serious complications.
[h=2]U.S. Virologic Surveillance[/h] [h=3]Clinical Laboratories[/h]
The results of tests performed by clinical laboratories nationwide are summarized below. Data from clinical laboratories (the percentage of specimens tested that are positive for influenza) are used to monitor whether influenza activity is increasing or decreasing.
24,405158,740
1,786 (7.3%)5,299 (3.3%)
470 (26.3%)1,681 (31.7%)
1,316 (73.7%)3,618 (68.3%)
Week 46 Data Cumulative since
September 29, 2019
(week 40)
No. of specimens tested No. of positive specimens (%) Positive specimens by type Influenza A Influenza B
INFLUENZA Virus Isolated

View Chart Data | View Full Screen [h=3]Public Health Laboratories[/h]
The results of tests performed by public health laboratories nationwide are summarized below. Data from public health laboratories are used to monitor the proportion of circulating viruses that belong to each influenza subtype/lineage.
7798,105
2411,676
87 (36.1%)811 (48.4%)
54 (71.1%)337 (45.7%)
22 (28.9%)401 (54.3%)
1173
154 (63.9%)865 (51.6%)
3 (2.8%)26 (4.0%)
106 (97.2%)630 (96.0%)
45209
Week 46 Data Cumulative since September 29, 2019
(week 40)
No. of specimens tested No. of positive specimens Positive specimens by type/subtype Influenza A (H1N1)pdm09 H3N2 Subtyping not performed Influenza B Yamagata lineage Victoria lineage Lineage not performed

Nationally influenza B/Victoria viruses have been reported more frequently than other influenza viruses this season; followed by A(H1N1)pdm09 and A(H3N2) viruses, which are also circulating in significant numbers. The predominant virus varies by region and the proportion of influenza B/Victoria viruses is increasing in some regions. Regional and state level data about circulating influenza viruses can be found on FluView Interactive. The predominant virus also varies by age group. Nationally, influenza B/Victoria viruses are the most commonly reported influenza viruses among children age 0-4 years (48% of reported viruses) and 5-24 years (56% of reported viruses), while A(H3N2) viruses are the most commonly reported influenza viruses among persons 65 years of age and older (70% of reported viruses). Among adults aged 25-64 years, approximately equal proportions of influenza A(H1N1)pdm09, A(H3N2) and B/Victoria viruses (33%, 24% and 31%, respectively) have been reported. Additional age data can be found on FluView Interactive.
INFLUENZA Virus Isolated

View Chart Data | View Full Screen

Additional virologic surveillance information for current and past seasons:
Surveillance Methods | FluView Interactive: National, Regional, and State Data or Age Data
[h=2]Influenza Virus Characterization[/h]
CDC performs genetic and antigenic characterization of U.S. viruses submitted from state and local health laboratories using Right Size Roadmap submission guidance. These data are used to compare how similar the currently circulating influenza viruses are to the reference viruses used for developing new influenza vaccines and to monitor evolutionary changes that continually occur in circulating influenza. CDC also tests susceptibility of influenza viruses to antiviral medications including the neuraminidase inhibitors (oseltamivir, zanamivir, and peramivir) and the PA endonuclease inhibitor baloxavir.

CDC genetically characterized 174 influenza viruses collected in the U.S. from September 29, 2019 to November 16, 2019.
35
6B.1A35 (100%)
77
3C.2a77 (100%)2a177 (100%)
2a20
2a30
2a40
3C.3a03a0
58
V1A58 (100%)V1A0
V1A.110 (17.2%)
V1A.348 (82.8%)
4
Y34 (100%)

Virus Subtype or Lineage Genetic Characterization
Total No. of Subtype/Lineage Tested Clade Number (% of subtype/lineage tested) Subclade Number (% of subtype/lineage tested) A/H1 A/H3 B/Victoria B/Yamagata

CDC antigenically characterizes a subset of influenza viruses by hemagglutination inhibition (HI) or neutralization based Focus Reduction assays (FRA). Antigenic drift is evaluated by comparing antigenic properties of cell-propagated reference viruses representing currently recommended vaccine components with those of cell-propagated circulating viruses. CDC antigenically characterized 13 influenza viruses collected in the U.S. from September 29, 2019 to November 16, 2019.

Influenza A Viruses
  • A (H1N1)pdm09: Two A(H1N1)pdm09 viruses were antigenically characterized by HI with ferret antisera, and all were antigenically similar (reacting at titers that were within 4-fold of the homologous virus titer) to cell-propagated A/Brisbane/02/2018-like reference viruses representing the A(H1N1)pdm09 component for the 2019-20 Northern Hemisphere influenza vaccines.
  • A (H3N2): Antigenic characterization is pending.


Influenza B Viruses
  • B/Victoria: 11 B/Victoria lineage viruses, including viruses from both co-circulating sub-clades, were antigenically characterized by HI with ferret antisera, and seven (63.6%) were antigenically similar to cell-propagated B/Colorado/06/2017-like reference viruses representing the B/Victoria component for the 2019-20 Northern Hemisphere influenza vaccines.
  • B/Yamagata: Antigenic characterization is pending.


CDC assesses susceptibility of influenza viruses to the antiviral medications oseltamivir, zanamivir, peramivir, and baloxavir using next generation sequence analysis supplemented by laboratory assays. One hundred and sixty-nine viruses collected in the U.S. from September 29, 2019 to November 16, 2019 were tested for antiviral susceptibility as follows:
1693573574
00000
1 (0.6%)1 (2.9%)000
1693573574
00000
1 (0.6%)1 (2.9%)000
1693573574
00000
00000
1693574564
00000

Antiviral Medication Total Viruses A/H1 A/H3 B/Victoria B/Yamagata Neuraminidase Inhibitors Oseltamivir Viruses Tested Reduced Inhibition Highly Reduced Inhibition Peramivir Viruses Tested Reduced Inhibition
Highly Reduced Inhibition Zanamivir Viruses Tested Reduced Inhibition
Highly Reduced Inhibition PA Endonuclease Inhibitor
Baloxavir Viruses Tested
Reduced Susceptibility

[h=2]Outpatient Illness Surveillance[/h] [h=3]ILINet[/h]
Nationwide during week 46, 2.5% of patient visits reported through the U.S. Outpatient Influenza-like Illness Surveillance Network (ILINet) were due to influenza-like illness (ILI). This percentage is above the national baseline of 2.4%.
national levels of ILI and ARI

View Chart Data | View Full Screen

On a regional level, the percentage of outpatient visits for ILI ranged from 1.4% to 4.4% during week 46. Region 3 (Delaware, the District of Columbia, Maryland, Pennsylvania, Virginia, and West Virginia), Region 4 (Alabama, Florida, Georgia, Kentucky, Mississippi, North Carolina, South Carolina, and Tennessee), Region 6 (Arkansas, Louisiana, New Mexico, Oklahoma, and Texas), and Region 9 (Arizona, California, Hawaii, and Nevada) reported a percentage of outpatient visits for ILI which is equal to or above their region-specific baselines. Regions 1, 2, 5, 7, 8, and 10 were below their region-specific baselines. [h=3]ILI Activity Map[/h]
Data collected in ILINet are used to produce a measure of ILI activity* by state.

During week 46, the following ILI activity levels were experienced:
  • High – Puerto Rico and seven states (Alabama, Arkansas, Georgia, Mississippi, Nevada, South Carolina, and Texas)
  • Low – New York City and 12 states (Alaska, Arizona, California, Colorado, Connecticut, Hawaii, Maryland, New Jersey, New Mexico, Oklahoma, Tennessee, and Virginia)
  • Minimal – the District of Columbia and 30 states (Delaware, Florida, Idaho, Illinois, Indiana, Iowa, Kansas, Kentucky, Maine, Massachusetts, Michigan, Minnesota, Missouri, Montana, Nebraska, New Hampshire, New York, North Carolina, North Dakota, Ohio, Oregon, Pennsylvania, Rhode Island, South Dakota, Utah, Vermont, Washington, West Virginia, Wisconsin, and Wyoming)
  • Data were insufficient to calculate an ILI activity level from the U.S. Virgin Islands and one state (Louisiana).
[SIZE=-1]*Data collected in ILINet may disproportionally represent certain populations within a state, and therefore, may not accurately depict the full picture of influenza activity for the whole state. Differences in the data presented here by CDC and independently by some state health departments likely represent differing levels of data completeness with data presented by the state likely being the more complete.[/SIZE]


Additional information about medically attended visits for ILI for current and past seasons:
Surveillance Methods | FluView Interactive: National, Regional, and State Data or ILI Activity Map


[h=2]Geographic Spread of Influenza as Assessed by State and Territorial Epidemiologists[/h]
The influenza activity reported by state and territorial epidemiologists indicates geographic spread of influenza viruses but does not measure the severity of influenza activity.

During week 46 the following influenza activity was reported:
  • Widespread – six states (Alabama, California, Louisiana, Massachusetts, Nevada and South Carolina)
  • Regional – nine states (Arizona, Connecticut, Florida, Georgia, Hawaii, New Mexico, Oregon, Tennessee and Texas)
  • Local – Puerto Rico and 23 states (Arkansas, Colorado, Delaware, Illinois, Indiana, Iowa, Kentucky, Maryland, Michigan, Minnesota, Mississippi, Nebraska, New Hampshire, New Jersey, New York, North Carolina, North Dakota, Oklahoma, Virginia, Washington, West Virginia, Wisconsin and Wyoming)
  • Sporadic – the District of Columbia, the U.S. Virgin Islands and 11 states (Alaska, Idaho, Kansas, Maine, Missouri, Montana, Ohio, Pennsylvania, South Dakota, Utah and Vermont)
  • No activity – one state (Rhode Island)
  • Guam did not report.
Additional geographic spread surveillance information for current and past seasons:
Surveillance Methods | FluView Interactive

[h=2]Influenza-Associated Hospitalizations[/h]
The Influenza Hospitalization Surveillance Network (FluSurv-NET) conducts population-based surveillance for laboratory-confirmed influenza-related hospitalizations in select counties in the Emerging Infections Program (EIP) states and Influenza Hospitalization Surveillance Project (IHSP) states.

A total of 393 laboratory-confirmed influenza-associated hospitalizations were reported by FluSurv-NET sites between October 1, 2019 and November 16, 2019. The overall hospitalization rate was 1.4 per 100,000 population. The highest rate of hospitalization was among adults aged ≥65 (3.6 per 100,000 population), followed by children aged 0-4 (2.2 per 100,000 population) and adults aged 50-64 (1.4 per 100,000 population). Rates are similar to what has been seen at this time during other recent seasons. Among 393 hospitalizations, 246(62.6%) were associated with influenza A virus, 142 (36.1%) with influenza B virus, 3 (0.8%) with influenza A virus and influenza B virus co-infection, and 2 (0.5%) with influenza virus for which the type was not determined. Among those with influenza A subtype information, 28 (50.0%) were A(H1N1)pdm09 virus and 28 (50.0%) were A(H3N2).

Click on graph to launch interactive tool
View Full Screen

Additional hospitalization surveillance information for current and past seasons and additional age groups:
Surveillance Methods | FluView Interactive


[h=2]Pneumonia and Influenza (P&I) Mortality Surveillance[/h]
Based on National Center for Health Statistics (NCHS) mortality surveillance data available on November 21, 2019, 5.2% of the deaths occurring during the week ending November 9, 2019 (week 45) were due to P&I. This percentage is below the epidemic threshold of 6.2% for week 45.
INFLUENZA Virus Isolated

View Chart Data | View Full Screen

Additional pneumonia and influenza mortality surveillance information for current and past seasons:
Surveillance Methods | FluView Interactive


[h=2]Influenza-Associated Pediatric Mortality[/h]
One influenza-associated pediatric death was reported to CDC during week 46. The death was associated with an influenza A (H1N1)pdm09 virus and occurred during week 45 (the week ending November 9, 2019).

A total of four influenza-associated pediatric deaths occurring during the 2019-2020 season have been reported to CDC.
Click on image to launch interactive tool

View Full Screen

Additional pediatric mortality surveillance information for current and past seasons:
Surveillance Methods | FluView Interactive


[h=2]Additional National and International Influenza Surveillance Information[/h]

FluView Interactive: FluView includes enhanced web-based interactive applications that can provide dynamic visuals of the influenza data collected and analyzed by CDC. These FluView Interactive applications allow people to create customized, visual interpretations of influenza data, as well as make comparisons across flu seasons, regions, age groups and a variety of other demographics. To access these tools, visit http://www.cdc.gov/flu/weekly/fluviewinteractive.htm

National Institute for Occupational Safety and Health: Monthly surveillance data on the prevalence of health-related workplace absenteeism among full-time workers in the United States are available from NIOSH at https://www.cdc.gov/niosh/topics/absences/default.html

U.S. State and local influenza surveillance:Select a jurisdiction below to access the latest local influenza information


[TD="width: 139"] Alabama [/TD]
[TD="width: 139"] Alaska [/TD]
[TD="width: 139"] Arizona [/TD]
[TD="width: 139"] Arkansas [/TD]
[TD="width: 139"] California [/TD]

[TD="width: 139"] Colorado [/TD]
[TD="width: 139"] Connecticut [/TD]
[TD="width: 139"] Delaware [/TD]
[TD="width: 139"] District of Columbia [/TD]
[TD="width: 139"] Florida [/TD]

[TD="width: 139"] Georgia [/TD]
[TD="width: 139"] Hawaii [/TD]
[TD="width: 139"] Idaho [/TD]
[TD="width: 139"] Illinois [/TD]
[TD="width: 139"] Indiana [/TD]

[TD="width: 139"] Iowa [/TD]
[TD="width: 139"] Kansas [/TD]
[TD="width: 139"] Kentucky [/TD]
[TD="width: 139"] Louisiana [/TD]
[TD="width: 139"] Maine [/TD]

[TD="width: 139"] Maryland [/TD]
[TD="width: 139"] Massachusetts [/TD]
[TD="width: 139"] Michigan [/TD]
[TD="width: 139"] Minnesota [/TD]
[TD="width: 139"] Mississippi [/TD]

[TD="width: 139"] Missouri [/TD]
[TD="width: 139"] Montana [/TD]
[TD="width: 139"] Nebraska [/TD]
[TD="width: 139"] Nevada [/TD]
[TD="width: 139"] New Hampshire [/TD]

[TD="width: 139"] New Jersey [/TD]
[TD="width: 139"] New Mexico [/TD]
[TD="width: 139"] New York [/TD]
[TD="width: 139"] North Carolina [/TD]
[TD="width: 139"] North Dakota [/TD]

[TD="width: 139"] Ohio [/TD]
[TD="width: 139"] Oklahoma [/TD]
[TD="width: 139"] Oregon [/TD]
[TD="width: 139"] Pennsylvania [/TD]
[TD="width: 139"] Rhode Island [/TD]

[TD="width: 139"] South Carolina [/TD]
[TD="width: 139"] South Dakota [/TD]
[TD="width: 139"] Tennessee [/TD]
[TD="width: 139"] Texas [/TD]
[TD="width: 139"] Utah [/TD]

[TD="width: 139"] Vermont [/TD]
[TD="width: 139"] Virginia [/TD]
[TD="width: 139"] Washington [/TD]
[TD="width: 139"] West Virginia [/TD]
[TD="width: 139"] Wisconsin [/TD]

[TD="width: 139"] Wyoming [/TD]
[TD="width: 139"] New York City [/TD]
[TD="width: 139"] Puerto Rico [/TD]
[TD="width: 139"] Virgin Islands [/TD]
[TD="width: 139"] [/TD]


World Health Organization: Additional influenza surveillance information from participating WHO member nations is available through FluNet and the Global Epidemiology Reports.

WHO Collaborating Centers for Influenza located in Australia, China, Japan, the United Kingdom, and the United States (CDC in Atlanta, Georgia).

Europe: For the most recent influenza surveillance information from Europe, please see WHO/Europe and the European Centre for Disease Prevention and Control at http://www.flunewseurope.org/.

Public Health Agency of Canada: The most up-to-date influenza information from Canada is available at http://www.phac-aspc.gc.ca/fluwatch/

Public Health England: The most up-to-date influenza information from the United Kingdom is available at https://www.gov.uk/government/statistics/weekly-national-flu-reports


Any links provided to non-Federal organizations are provided solely as a service to our users. These links do not constitute an endorsement of these organizations or their programs by CDC or the Federal Government, and none should be inferred. CDC is not responsible for the content of the individual organization web pages found at these links.


An overview of the CDC influenza surveillance system, including methodology and detailed descriptions of each data component, is available at: http://www.cdc.gov/flu/weekly/overview.htm.

--------------------------------------------------------------------------------


Page last reviewed: November 22, 2019, 11:00 AM
Content source: Centers for Disease Control and Prevention, National Center for Immunization and Respiratory Diseases (NCIRD)Seasonal Influenza (Flu)
What CDC Does
email_03Get Email Updates

To receive weekly email updates about Seasonal Flu, enter your email address: Email Address
What's this?
Submit
H1N1 Flu Pandemic 2009-2019: A Decade Later - H1N1 Flu Pandemic 2009-2019: A Decade Later

Influenza Types
https://www.cdc.gov/flu/weekly/index.htm
 
[h=1]Weekly U.S. Influenza Surveillance Report[/h]
FluView_header.jpg

Key Updates for Week 47, ending November 23, 2019

According to this week’s FluView report, seasonal influenza activity in the United States continues to increase but the amount of activity and the predominant influenza virus varies by region. [h=4]Viruses[/h]
Clinical Lab
8.0% of respiratory specimens tested by clinical laboratories were positive for influenza viruses. This is higher than the previous week.

Public Health Lab
Nationally, B/Victoria viruses are most common followed by A(H1N1)pdm09 and A(H3N2) viruses. The predominant virus varies by region and age group.

Virus Characterization
Genetic and antigenic characterization and antiviral susceptibility of viruses collected in the U.S. this season is now being reported. [h=4]Illness[/h] Outpatient Illness: ILINet
2.9% of visits to health care providers were for influenza-like illness (ILI). ILI has been at or above the national baseline of 2.4% for three weeks. Four of 10 regions were at or above their baselines.

Outpatient Illness: ILI Activity Map
week47 - Outpatient Illness: ILI Activity Map


The number of jurisdictions experiencing high ILI activity remained at 8 this week. In addition, 7 jurisdictions had moderate activity compared to 0 last week.

Geographic Spread
spread-map-47 - Geographic Spread week 47


The number of jurisdictions reporting regional or widespread activity increased from 15 last week to 24 this week. [h=4]Severe Disease[/h]
Hospitalizations
The overall hospitalization rate for the season is 2.0 per 100,000. This is similar to what has been seen at this time during other recent seasons.

P&I Mortality
5.1% of deaths were attributed to pneumonia and influenza (P&I). This is below the epidemic threshold of 6.3%.

Pediatric Deaths
One new influenza-associated pediatric death occurring during the 2019-2020 season was reported to CDC this week. The total for the season is 5.

All data are preliminary and may change as more reports are received.

A description of the CDC influenza surveillance system, including methodology and detailed descriptions of each data components is available on the surveillance methods page.

Additional information on the current and previous influenza seasons for each surveillance component are available on FluView Interactive

Key Points
  • Nationally, ILI activity has been at or above baseline for three weeks; however, the amount of influenza activity across the country varies with the south and parts of the west seeing elevated activity while other parts of the country are still seeing low activity.
  • There is significant cocirculation of influenza B/Victoria, A(H1N1)pdm09, and A(H3N2) viruses with the predominant virus varying by region and age group.
  • The flu season is just getting started. It’s not too late to get vaccinated. Flu vaccination is always the best way to prevent flu and its potentially serious complications.
[h=2]U.S. Virologic Surveillance[/h] [h=3]Clinical Laboratories[/h]
The results of tests performed by clinical laboratories nationwide are summarized below. Data from clinical laboratories (the percentage of specimens tested that are positive for influenza) are used to monitor whether influenza activity is increasing or decreasing.
21,367190,649
1,702 (8.0%)7,361 (3.9%)
504 (29.6%)2,261 (30.7%)
1,198 (70.4%)5,100 (69.3%)
Week 47 Data Cumulative since
September 29, 2019
(week 40)
No. of specimens tested No. of positive specimens (%) Positive specimens by type Influenza A Influenza B
INFLUENZA Virus Isolated

View Chart Data | View Full Screen [h=3]Public Health Laboratories[/h]
The results of tests performed by public health laboratories nationwide are summarized below. Data from public health laboratories are used to monitor the proportion of circulating viruses that belong to each influenza subtype/lineage.
1,19310,444
4122,460
163 (39.6%)1,084 (44.1%)
110 (75.9%)526 (52.7%)
35 (24.1%)472 (47.3%)
1886
249 (60.4%)1,376 (55.9%)
2 (1.2%)35 (3.3%)
167 (98.8%)1,028 (96.7%)
80313
Week 47 Data Cumulative since September 29, 2019
(week 40)
No. of specimens tested No. of positive specimens Positive specimens by type/subtype Influenza A (H1N1)pdm09 H3N2 Subtyping not performed Influenza B Yamagata lineage Victoria lineage Lineage not performed

Nationally influenza B/Victoria viruses have been reported more frequently than other influenza viruses this season; followed by A(H1N1)pdm09 and A(H3N2) viruses, which are also circulating in significant numbers. The predominant virus varies by region and the proportion of influenza B/Victoria viruses is increasing in some regions. Regional and state level data about circulating influenza viruses can be found on FluView Interactive. The predominant virus also varies by age group. Nationally, influenza B/Victoria viruses are the most commonly reported influenza viruses among children age 0-4 years (50% of reported viruses) and 5-24 years (59% of reported viruses), while A(H3N2) viruses are the most commonly reported influenza viruses among persons 65 years of age and older (59% of reported viruses). Among adults aged 25-64 years, approximately equal proportions of influenza A(H1N1)pdm09 and B/Victoria viruses (32% and 33%, respectively) have been reported. Additional age data can be found on FluView Interactive.
INFLUENZA Virus Isolated

View Chart Data | View Full Screen

Additional virologic surveillance information for current and past seasons:
Surveillance Methods | FluView Interactive: National, Regional, and State Data or Age Data
[h=2]Influenza Virus Characterization[/h]
CDC performs genetic and antigenic characterization of U.S. viruses submitted from state and local health laboratories using Right Size Roadmap submission guidance. These data are used to compare how similar the currently circulating influenza viruses are to the reference viruses used for developing new influenza vaccines and to monitor evolutionary changes that continually occur in circulating influenza. CDC also tests susceptibility of influenza viruses to antiviral medications including the neuraminidase inhibitors (oseltamivir, zanamivir, and peramivir) and the PA endonuclease inhibitor baloxavir.

CDC genetically characterized 216 influenza viruses collected in the U.S. from September 29, 2019 to November 23, 2019.
44
6B.1A44 (100%)
92
3C.2a92 (100%)2a192 (100%)
2a20
2a30
2a40
3C.3a03a0
72
V1A72 (100%)V1A0
V1A.110 (17.2%)
V1A.362 (82.8%)
8
Y38 (100%)

Virus Subtype or Lineage Genetic Characterization
Total No. of Subtype/Lineage Tested Clade Number (% of subtype/lineage tested) Subclade Number (% of subtype/lineage tested) A/H1 A/H3 B/Victoria B/Yamagata

CDC antigenically characterizes a subset of influenza viruses by hemagglutination inhibition (HI) or neutralization based Focus Reduction assays (FRA). Antigenic drift is evaluated by comparing antigenic properties of cell-propagated reference viruses representing currently recommended vaccine components with those of cell-propagated circulating viruses. CDC antigenically characterized 21 influenza viruses collected in the U.S. from September 29, 2019 to November 23, 2019.

Influenza A Viruses
  • A (H1N1)pdm09: Two A(H1N1)pdm09 viruses were antigenically characterized by HI with ferret antisera, and all were antigenically similar (reacting at titers that were within 4-fold of the homologous virus titer) to cell-propagated A/Brisbane/02/2018-like reference viruses representing the A(H1N1)pdm09 component for the 2019-20 Northern Hemisphere influenza vaccines.
  • A (H3N2): Eight A(H3N2) viruses were antigenically characterized by FRA with ferret antisera, and 7 (87.5%) were antigenically similar to cell-propagated A/Kansas/14/2017-like reference viruses representing the A(H3N2) component for the 2019-20 Northern Hemisphere influenza vaccines.


Influenza B Viruses
  • B/Victoria: 11 B/Victoria lineage viruses, including viruses from both co-circulating sub-clades, were antigenically characterized by HI with ferret antisera, and seven (63.6%) were antigenically similar to cell-propagated B/Colorado/06/2017-like reference viruses representing the B/Victoria component for the 2019-20 Northern Hemisphere influenza vaccines.
  • B/Yamagata: Antigenic characterization is pending.


CDC assesses susceptibility of influenza viruses to the antiviral medications oseltamivir, zanamivir, peramivir, and baloxavir using next generation sequence analysis supplemented by laboratory assays. Viruses collected in the U.S. from September 29, 2019 to November 23, 2019 were tested for antiviral susceptibility as follows:
2084489687
(0.0%)(0.0%)(0.0%)(0.0%)(0.0%)
1 (0.5%)1 (2.3%)(0.0%)(0.0%)(0.0%)
2084489687
(0.0%)(0.0%)(0.0%)(0.0%)(0.0%)
1 (0.5%)1 (2.3%)(0.0%)(0.0%)(0.0%)
2084489687
1 (0.5%)(0.0%)(0.0%)1 (1.5%)(0.0%)
(0.0%)(0.0%)(0.0%)(0.0%)(0.0%)
2124589708
(0.0%)(0.0%)(0.0%)(0.0%)(0.0%)

Antiviral Medication Total Viruses A/H1 A/H3 B/Victoria B/Yamagata Neuraminidase Inhibitors Oseltamivir Viruses Tested Reduced Inhibition Highly Reduced Inhibition Peramivir Viruses Tested Reduced Inhibition
Highly Reduced Inhibition Zanamivir Viruses Tested Reduced Inhibition
Highly Reduced Inhibition PA Endonuclease Inhibitor
Baloxavir Viruses Tested
Reduced Susceptibility

[h=2]Outpatient Illness Surveillance[/h] [h=3]ILINet[/h]
Nationwide during week 47, 2.9% of patient visits reported through the U.S. Outpatient Influenza-like Illness Surveillance Network (ILINet) were due to influenza-like illness (ILI). This percentage is above the national baseline of 2.4%.
national levels of ILI and ARI

View Chart Data | View Full Screen

On a regional level, the percentage of outpatient visits for ILI ranged from 1.5% to 6.8% during week 47. Region 3 (Delaware, the District of Columbia, Maryland, Pennsylvania, Virginia, and West Virginia), Region 4 (Alabama, Florida, Georgia, Kentucky, Mississippi, North Carolina, South Carolina, and Tennessee), Region 6 (Arkansas, Louisiana, New Mexico, Oklahoma, and Texas), and Region 10 (Alaska, Idaho, Oregon, and Washington) reported a percentage of outpatient visits for ILI which is equal to or above their region-specific baselines. Regions 1, 2, 5, 7, 8, and 9 were below their region-specific baselines. [h=3]ILI Activity Map[/h]
Data collected in ILINet are used to produce a measure of ILI activity* by state.

During week 47, the following ILI activity levels were experienced:
  • High – Puerto Rico and seven states (Alabama, Georgia, Louisiana, Mississippi, South Carolina, Tennessee, and Texas)
  • Moderate – seven states (Arkansas, Connecticut, Nebraska, Nevada, New Mexico, Virginia, and Washington)
  • Low – New York City and eight states (Arizona, Colorado, Hawaii, Maryland, Minnesota, New Jersey, Oklahoma, and Oregon)
  • Minimal – 28 states (Alaska, California, Delaware, Florida, Idaho, Illinois, Indiana, Iowa, Kansas, Kentucky, Maine, Massachusetts, Michigan, Missouri, Montana, New Hampshire, New York, North Carolina, North Dakota, Ohio, Pennsylvania, Rhode Island, South Dakota, Utah, Vermont, West Virginia, Wisconsin, and Wyoming)
  • Data were insufficient to calculate an ILI activity level from the District of Columbia and the U.S. Virgin Islands.
[SIZE=-1]*Data collected in ILINet may disproportionally represent certain populations within a state, and therefore, may not accurately depict the full picture of influenza activity for the whole state. Differences in the data presented here by CDC and independently by some state health departments likely represent differing levels of data completeness with data presented by the state likely being the more complete.[/SIZE]


Additional information about medically attended visits for ILI for current and past seasons:
Surveillance Methods | FluView Interactive: National, Regional, and State Data or ILI Activity Map


[h=2]Geographic Spread of Influenza as Assessed by State and Territorial Epidemiologists[/h]
The influenza activity reported by state and territorial epidemiologists indicates geographic spread of influenza viruses but does not measure the severity of influenza activity.

During week 47 the following influenza activity was reported:
  • Widespread – 10 states (Alabama, Alaska, California, Louisiana, Massachusetts, Nevada, New Mexico, South Carolina, Tennessee and Texas)
  • Regional – 14 states (Arizona, Colorado, Connecticut, Florida, Georgia, Idaho, Indiana, Kentucky, Nebraska, New York, Oregon, Pennsylvania, Virginia and Washington)
  • Local – Puerto Rico and 19 states (Arkansas, Delaware, Illinois, Iowa, Maryland, Michigan, Minnesota, Mississippi, Montana, New Hampshire, New Jersey, North Carolina, North Dakota, Ohio, Oklahoma, South Dakota, Utah, Vermont and Wisconsin)
  • Sporadic – the U.S. Virgin Islands and 7 states (Hawaii, Kansas, Maine, Missouri, Rhode Island, West Virginia and Wyoming)
  • The District of Columbia and Guam did not report.
Additional geographic spread surveillance information for current and past seasons:
Surveillance Methods | FluView Interactive

[h=2]Influenza-Associated Hospitalizations[/h]
The Influenza Hospitalization Surveillance Network (FluSurv-NET) conducts population-based surveillance for laboratory-confirmed influenza-related hospitalizations in select counties in the Emerging Infections Program (EIP) states and Influenza Hospitalization Surveillance Project (IHSP) states.

A total of 573 laboratory-confirmed influenza-associated hospitalizations were reported by FluSurv-NET sites between October 1, 2019 and November 23, 2019. The overall hospitalization rate was 2.0 per 100,000 population. The highest rate of hospitalization was among adults aged ≥65 (5.1 per 100,000 population), followed by children aged 0-4 (3.1 per 100,000 population) and adults aged 50-64 (2.0 per 100,000 population). Among 573 hospitalizations, 337 (58.8%) were associated with influenza A virus, 230 (40.1%) with influenza B virus, 4 (0.7%) with influenza A virus and influenza B virus co-infection, and 2 (0.3%) with influenza virus for which the type was not determined. Among those with influenza A subtype information, 40 (54.1%) were A(H1N1)pdm09 virus and 34 (45.9%) were A(H3N2).

Click on graph to launch interactive tool
View Full Screen

Additional hospitalization surveillance information for current and past seasons and additional age groups:
Surveillance Methods | FluView Interactive


[h=2]Pneumonia and Influenza (P&I) Mortality Surveillance[/h]
Based on National Center for Health Statistics (NCHS) mortality surveillance data available on November 27, 2019, 5.1% of the deaths occurring during the week ending November 16, 2019 (week 46) were due to P&I. This percentage is below the epidemic threshold of 6.3% for week 46.
INFLUENZA Virus Isolated

View Chart Data | View Full Screen

Additional pneumonia and influenza mortality surveillance information for current and past seasons:
Surveillance Methods | FluView Interactive


[h=2]Influenza-Associated Pediatric Mortality[/h]
One influenza-associated pediatric death was reported to CDC during week 47. The death was associated with an influenza B virus for which the lineage was not determined and occurred during week 47 (the week ending November 23, 2019).

A total of five influenza-associated pediatric deaths occurring during the 2019-2020 season have been reported to CDC.
Click on image to launch interactive tool

View Full Screen

Additional pediatric mortality surveillance information for current and past seasons:
Surveillance Methods | FluView Interactive


[h=2]Additional National and International Influenza Surveillance Information[/h]

FluView Interactive: FluView includes enhanced web-based interactive applications that can provide dynamic visuals of the influenza data collected and analyzed by CDC. These FluView Interactive applications allow people to create customized, visual interpretations of influenza data, as well as make comparisons across flu seasons, regions, age groups and a variety of other demographics. To access these tools, visit http://www.cdc.gov/flu/weekly/fluviewinteractive.htm

National Institute for Occupational Safety and Health: Monthly surveillance data on the prevalence of health-related workplace absenteeism among full-time workers in the United States are available from NIOSH at https://www.cdc.gov/niosh/topics/absences/default.html

U.S. State and local influenza surveillance:Select a jurisdiction below to access the latest local influenza information


[TD="width: 139"] Alabama [/TD]
[TD="width: 139"] Alaska [/TD]
[TD="width: 139"] Arizona [/TD]
[TD="width: 139"] Arkansas [/TD]
[TD="width: 139"] California [/TD]

[TD="width: 139"] Colorado [/TD]
[TD="width: 139"] Connecticut [/TD]
[TD="width: 139"] Delaware [/TD]
[TD="width: 139"] District of Columbia [/TD]
[TD="width: 139"] Florida [/TD]

[TD="width: 139"] Georgia [/TD]
[TD="width: 139"] Hawaii [/TD]
[TD="width: 139"] Idaho [/TD]
[TD="width: 139"] Illinois [/TD]
[TD="width: 139"] Indiana [/TD]

[TD="width: 139"] Iowa [/TD]
[TD="width: 139"] Kansas [/TD]
[TD="width: 139"] Kentucky [/TD]
[TD="width: 139"] Louisiana [/TD]
[TD="width: 139"] Maine [/TD]

[TD="width: 139"] Maryland [/TD]
[TD="width: 139"] Massachusetts [/TD]
[TD="width: 139"] Michigan [/TD]
[TD="width: 139"] Minnesota [/TD]
[TD="width: 139"] Mississippi [/TD]

[TD="width: 139"] Missouri [/TD]
[TD="width: 139"] Montana [/TD]
[TD="width: 139"] Nebraska [/TD]
[TD="width: 139"] Nevada [/TD]
[TD="width: 139"] New Hampshire [/TD]

[TD="width: 139"] New Jersey [/TD]
[TD="width: 139"] New Mexico [/TD]
[TD="width: 139"] New York [/TD]
[TD="width: 139"] North Carolina [/TD]
[TD="width: 139"] North Dakota [/TD]

[TD="width: 139"] Ohio [/TD]
[TD="width: 139"] Oklahoma [/TD]
[TD="width: 139"] Oregon [/TD]
[TD="width: 139"] Pennsylvania [/TD]
[TD="width: 139"] Rhode Island [/TD]

[TD="width: 139"] South Carolina [/TD]
[TD="width: 139"] South Dakota [/TD]
[TD="width: 139"] Tennessee [/TD]
[TD="width: 139"] Texas [/TD]
[TD="width: 139"] Utah [/TD]

[TD="width: 139"] Vermont [/TD]
[TD="width: 139"] Virginia [/TD]
[TD="width: 139"] Washington [/TD]
[TD="width: 139"] West Virginia [/TD]
[TD="width: 139"] Wisconsin [/TD]

[TD="width: 139"] Wyoming [/TD]
[TD="width: 139"] New York City [/TD]
[TD="width: 139"] Puerto Rico [/TD]
[TD="width: 139"] Virgin Islands [/TD]
[TD="width: 139"] [/TD]


World Health Organization: Additional influenza surveillance information from participating WHO member nations is available through FluNet and the Global Epidemiology Reports.

WHO Collaborating Centers for Influenza located in Australia, China, Japan, the United Kingdom, and the United States (CDC in Atlanta, Georgia).

Europe: For the most recent influenza surveillance information from Europe, please see WHO/Europe and the European Centre for Disease Prevention and Control at http://www.flunewseurope.org/.

Public Health Agency of Canada: The most up-to-date influenza information from Canada is available at http://www.phac-aspc.gc.ca/fluwatch/

Public Health England: The most up-to-date influenza information from the United Kingdom is available at https://www.gov.uk/government/statistics/weekly-national-flu-reports


Any links provided to non-Federal organizations are provided solely as a service to our users. These links do not constitute an endorsement of these organizations or their programs by CDC or the Federal Government, and none should be inferred. CDC is not responsible for the content of the individual organization web pages found at these links.


An overview of the CDC influenza surveillance system, including methodology and detailed descriptions of each data component, is available at: http://www.cdc.gov/flu/weekly/overview.htm.

--------------------------------------------------------------------------------


Page last reviewed: December 2, 2019, 11:00 AM
Content source: Centers for Disease Control and Prevention, National Center for Immunization and Respiratory Diseases (NCIRD)Seasonal Influenza (Flu)
What CDC Does
email_03Get Email Updates

To receive weekly email updates about Seasonal Flu, enter your email address: Email Address
What's this?
Submit
H1N1 Flu Pandemic 2009-2019: A Decade Later - H1N1 Flu Pandemic 2009-2019: A Decade Later

Influenza Types
https://www.cdc.gov/flu/weekly/index.htm
 
[h=1]Weekly U.S. Influenza Surveillance Report[/h]
FluView_header.jpg

Key Updates for Week 48, ending November 30, 2019

Seasonal influenza activity in the United States has been elevated for four weeks and continues to increase. [h=4]Viruses[/h]
Clinical Lab
10.2% of respiratory specimens tested by clinical laboratories were positive for influenza viruses. This is higher than the previous week.

Public Health Lab
Nationally, B/Victoria viruses are most common followed by A(H1N1)pdm09 and A(H3N2) viruses, but the predominant virus varies by region and age group.

Virus Characterization
Genetic and antigenic characterization and antiviral susceptibility of viruses collected in the U.S. this season is now being reported. [h=4]Illness[/h] Outpatient Illness: ILINet
3.5% of visits to health care providers were for influenza-like illness (ILI). ILI has been at or above the national baseline of 2.4% for four weeks. Nine of 10 regions were at or above their baselines.

Outpatient Illness: ILI Activity Map
week 48 - week 48


The number of jurisdictions experiencing high ILI activity increased to 13 this week, compared to 8 last week. In addition, 15 jurisdictions had moderate activity compared to 7 last week.

Geographic Spread
spread map 48


The number of jurisdictions reporting regional or widespread activity increased to 24 this week from 15 last week. [h=4]Severe Disease[/h]
Hospitalizations
The overall hospitalization rate for the season is 2.7 per 100,000. This is similar to what has been seen at this time during other recent seasons.

P&I Mortality
4.8% of deaths were attributed to pneumonia and influenza (P&I). This is below the epidemic threshold of 6.4%.

Pediatric Deaths
One new influenza-associated pediatric death occurring during the 2019-2020 season was reported to CDC this week. The total for the season to date is 6.

All data are preliminary and may change as more reports are received.

A description of the CDC influenza surveillance system, including methodology and detailed descriptions of each data component is available on the surveillance methods page.

Additional information on the current and previous influenza seasons for each surveillance component are available on FluView Interactive.

Key Points
  • The 2019-2020 flu season is underway for most of the country, however some parts of the country are still seeing lower levels of flu activity.
  • Activity is being caused mostly by influenza B/Victoria viruses, which is unusual for this time of year. H1N1 viruses are the next most common, followed by H3N2 viruses, which are decreasing in proportion.
  • The flu season is just getting started; elevated flu activity is expected to continue for weeks. It’s not too late to get vaccinated. Flu vaccination is the best way to reduce the risk from flu and its potentially serious complications.
[h=2]U.S. Virologic Surveillance[/h] [h=3]Clinical Laboratories[/h]
The results of tests performed by clinical laboratories nationwide are summarized below. Data from clinical laboratories (the percentage of specimens tested that are positive for influenza) are used to monitor whether influenza activity is increasing or decreasing.
26,576227,629
2,713 (10.2%)10,826 (4.8%)
784 (28.9%)3,271 (30.2%)
1,929 (71.1%)7,555 (69.8%)
Week 48 Data Cumulative since
September 29, 2019
(week 40)
No. of specimens tested No. of positive specimens (%) Positive specimens by type Influenza A Influenza B
INFLUENZA Virus Isolated

View Chart Data | View Full Screen [h=3]Public Health Laboratories[/h]
The results of tests performed by public health laboratories nationwide are summarized below. Data from public health laboratories are used to monitor the proportion of circulating viruses that belong to each influenza subtype/lineage.
82812,256
3893,251
147 (37.8%)1,380 (42.4%)
103 (79.2%)731 (57.6%)
27 (20.8%)538 (42.4%)
17111
242 (62.2%)1,871 (57.6%)
5 (2.9%)44 (3.1%)
166 (97.1%)1,371 (96.9%)
71456
Week 48 Data Cumulative since September 29, 2019
(week 40)
No. of specimens tested No. of positive specimens Positive specimens by type/subtype Influenza A (H1N1)pdm09 H3N2 Subtyping not performed Influenza B Yamagata lineage Victoria lineage Lineage not performed

Nationally influenza B/Victoria viruses have been reported more frequently than other influenza viruses this season; followed by A(H1N1)pdm09 and A(H3N2) viruses, which are also circulating in significant numbers. The predominant virus varies by region. The proportion of influenza B/Victoria viruses is increasing in some regions, while the proportion of A(H3N2) viruses is decreasing overall. Regional and state level data about circulating influenza viruses can be found on FluView Interactive. The predominant virus also varies by age group. Nationally, influenza B/Victoria viruses are the most commonly reported influenza viruses among children age 0-4 years (46% of reported viruses) and 5-24 years (60% of reported viruses), while A(H3N2) viruses are the most commonly reported influenza viruses among persons 65 years of age and older (54% of reported viruses). Among adults aged 25-64 years, approximately equal proportions of influenza A(H1N1)pdm09 and B/Victoria viruses (35% and 34%, respectively) have been reported. Additional age data can be found on FluView Interactive.
INFLUENZA Virus Isolated

View Chart Data | View Full Screen

Additional virologic surveillance information for current and past seasons:
Surveillance Methods | FluView Interactive: National, Regional, and State Data or Age Data
[h=2]Influenza Virus Characterization[/h]
CDC performs genetic and antigenic characterization of U.S. viruses submitted from state and local health laboratories using Right Size Roadmap submission guidance. These data are used to compare how similar the currently circulating influenza viruses are to the reference viruses used for developing new influenza vaccines and to monitor evolutionary changes that continually occur in circulating influenza. CDC also tests susceptibility of influenza viruses to antiviral medications including the neuraminidase inhibitors (oseltamivir, zanamivir, and peramivir) and the PA endonuclease inhibitor baloxavir.

CDC genetically characterized 299 influenza viruses collected in the U.S. from September 29, 2019 to November 30, 2019.
66
6B.1A66 (100%)
111
3C.2a111 (100%)2a1111 (100%)
2a20
2a30
2a40
3C.3a03a0
112
V1A112 (100%)V1A0
V1A.119 (17.0%)
V1A.393 (83.0%)
10
Y310 (100%)

Virus Subtype or Lineage Genetic Characterization
Total No. of Subtype/Lineage Tested Clade Number (% of subtype/lineage tested) Subclade Number (% of subtype/lineage tested) A/H1 A/H3 B/Victoria B/Yamagata

CDC antigenically characterizes a subset of influenza viruses by hemagglutination inhibition (HI) or neutralization based Focus Reduction assays (FRA). Antigenic drift is evaluated by comparing antigenic properties of cell-propagated reference viruses representing currently recommended vaccine components with those of cell-propagated circulating viruses. CDC antigenically characterized 29 influenza viruses collected in the U.S. from September 29, 2019 to November 30, 2019.

Influenza A Viruses
  • A (H1N1)pdm09: Five A(H1N1)pdm09 viruses were antigenically characterized by HI with ferret antisera, and all were antigenically similar (reacting at titers that were within 4-fold of the homologous virus titer) to cell-propagated A/Brisbane/02/2018-like reference viruses representing the A(H1N1)pdm09 component for the 2019-20 Northern Hemisphere influenza vaccines.
  • A (H3N2): Eight A(H3N2) viruses were antigenically characterized by FRA with ferret antisera, and 7 (87.5%) were antigenically similar to cell-propagated A/Kansas/14/2017-like reference viruses representing the A(H3N2) component for the 2019-20 Northern Hemisphere influenza vaccines.


Influenza B Viruses
  • B/Victoria: 16 B/Victoria lineage viruses, including viruses from both co-circulating sub-clades, were antigenically characterized by HI with ferret antisera, and ten (62.5%) were antigenically similar to cell-propagated B/Colorado/06/2017-like reference viruses representing the B/Victoria component for the 2019-20 Northern Hemisphere influenza vaccines.
  • B/Yamagata: Antigenic characterization is pending.


CDC assesses susceptibility of influenza viruses to the antiviral medications oseltamivir, zanamivir, peramivir, and baloxavir using next generation sequence analysis supplemented by laboratory assays. Viruses collected in the U.S. since September 29, 2019 were tested for antiviral susceptibility as follows:
286661081039
(0.0%)(0.0%)(0.0%)(0.0%)(0.0%)
1 (0.3%)1 (1.5%)(0.0%)(0.0%)(0.0%)
286661081039
(0.0%)(0.0%)(0.0%)(0.0%)(0.0%)
1 (0.3%)1 (1.5%)(0.0%)(0.0%)(0.0%)
286661081039
1 (0.3%)(0.0%)(0.0%)1 (1.0%)(0.0%)
(0.0%)(0.0%)(0.0%)(0.0%)(0.0%)
263571019510
(0.0%)(0.0%)(0.0%)(0.0%)(0.0%)

Antiviral Medication Total Viruses A/H1 A/H3 B/Victoria B/Yamagata Neuraminidase Inhibitors Oseltamivir Viruses Tested Reduced Inhibition Highly Reduced Inhibition Peramivir Viruses Tested Reduced Inhibition
Highly Reduced Inhibition Zanamivir Viruses Tested Reduced Inhibition
Highly Reduced Inhibition PA Endonuclease Inhibitor
Baloxavir Viruses Tested
Reduced Susceptibility

[h=2]Outpatient Illness Surveillance[/h] [h=3]ILINet[/h]
Nationwide during week 48, 3.5% of patient visits reported through the U.S. Outpatient Influenza-like Illness Surveillance Network (ILINet) were due to influenza-like illness (ILI). This percentage is above the national baseline of 2.4%.
national levels of ILI and ARI

View Chart Data | View Full Screen

On a regional level, the percentage of outpatient visits for ILI ranged from 1.8% to 6.9% during week 48. All regions except Region 1 (Connecticut, Maine, Massachusetts, New Hampshire, Rhode Island, and Vermont) reported a percentage of outpatient visits for ILI which is equal to or above their region-specific baselines. [h=3]ILI Activity Map[/h]
Data collected in ILINet are used to produce a measure of ILI activity* by state.

During week 48, the following ILI activity levels were experienced:
  • High – Puerto Rico and 12 states (Alabama, Georgia, Louisiana, Minnesota, Mississippi, Nebraska, Nevada, New Mexico, South Carolina, Tennessee, Texas, and Washington)
  • Moderate – New York City and 14 states (Arizona, Arkansas, Colorado, Connecticut, Florida, Hawaii, Kentucky, Maryland, Missouri, New Jersey, North Dakota, Oklahoma, Utah, and Virginia)
  • Low – District of Columbia and eight states (California, Illinois, Massachusetts, New York, North Carolina, Oregon, Pennsylvania, and Wisconsin)
  • Minimal – 16 states (Alaska, Delaware, Idaho, Indiana, Iowa, Kansas, Maine, Michigan, Montana, New Hampshire, Ohio, Rhode Island, South Dakota, Vermont, West Virginia, and Wyoming)
  • Data were insufficient to calculate an ILI activity level from the U.S. Virgin Islands.
[SIZE=-1]*Data collected in ILINet may disproportionally represent certain populations within a state, and therefore, may not accurately depict the full picture of influenza activity for the whole state. Differences in the data presented here by CDC and independently by some state health departments likely represent differing levels of data completeness with data presented by the state likely being the more complete.[/SIZE]


Additional information about medically attended visits for ILI for current and past seasons:
Surveillance Methods | FluView Interactive: National, Regional, and State Data or ILI Activity Map


[h=2]Geographic Spread of Influenza as Assessed by State and Territorial Epidemiologists[/h]
The influenza activity reported by state and territorial epidemiologists indicates geographic spread of influenza viruses but does not measure the severity of influenza activity.

During week 48 the following influenza activity was reported:
  • Widespread – 16 states (Alabama, California, Connecticut, Georgia, Indiana, Louisiana, Massachusetts, Mississippi, Nevada, New Mexico, New York, Pennsylvania, South Carolina, Tennessee, Texas, and Virginia)
  • Regional – Puerto Rico and 14 states (Alaska, Arizona, Colorado, Florida, Idaho, Kentucky, Minnesota, Montana, Nebraska, Oklahoma, Oregon, Utah, Washington, and Wisconsin)
  • Local – 17 states (Arkansas, Delaware, Hawaii, Illinois, Iowa, Maine, Maryland, Michigan, Missouri, New Hampshire, New Jersey, North Carolina, North Dakota, Ohio, South Dakota, Vermont, and Wyoming)
  • Sporadic – the District of Columbia, the U.S. Virgin Islands and 3 states (Kansas, Rhode Island, and West Virginia)
  • Guam did not report.
Additional geographic spread surveillance information for current and past seasons:
Surveillance Methods | FluView Interactive

[h=2]Influenza-Associated Hospitalizations[/h]
The Influenza Hospitalization Surveillance Network (FluSurv-NET) conducts population-based surveillance for laboratory-confirmed influenza-related hospitalizations in select counties in the Emerging Infections Program (EIP) states and Influenza Hospitalization Surveillance Project (IHSP) states.

A total of 784 laboratory-confirmed influenza-associated hospitalizations were reported by FluSurv-NET sites between October 1, 2019 and November 30, 2019. The overall hospitalization rate was 2.7 per 100,000 population. The highest rate of hospitalization was among adults aged ≥65 (7.0 per 100,000 population), followed by children aged 0-4 (4.6 per 100,000 population) and adults aged 50-64 (2.7 per 100,000 population). Among 784 hospitalizations, 451 (57.5%) were associated with influenza A virus, 325 (41.5%) with influenza B virus, 4 (0.5%) with influenza A virus and influenza B virus co-infection, and 4 (0.5%) with influenza virus for which the type was not determined. Among those with influenza A subtype information, 60 (60.6%) were A(H1N1)pdm09 virus and 39 (39.4%) were A(H3N2).

Click on graph to launch interactive tool
View Full Screen

Additional hospitalization surveillance information for current and past seasons and additional age groups:
Surveillance Methods | FluView Interactive


[h=2]Pneumonia and Influenza (P&I) Mortality Surveillance[/h]
Based on National Center for Health Statistics (NCHS) mortality surveillance data available on December 5, 2019, 4.8% of the deaths occurring during the week ending November 23, 2019 (week 47) were due to P&I. This percentage is below the epidemic threshold of 6.4% for week 47.
INFLUENZA Virus Isolated

View Chart Data | View Full Screen

Additional pneumonia and influenza mortality surveillance information for current and past seasons:
Surveillance Methods | FluView Interactive


[h=2]Influenza-Associated Pediatric Mortality[/h]
One influenza-associated pediatric death was reported to CDC during week 48. The death was associated with an influenza B virus for which the lineage was not determined and occurred during week 48 (the week ending November 30, 2019).

A total of six influenza-associated pediatric deaths occurring during the 2019-2020 season have been reported to CDC.
Click on image to launch interactive tool

View Full Screen

Additional pediatric mortality surveillance information for current and past seasons:
Surveillance Methods | FluView Interactive


[h=2]Additional National and International Influenza Surveillance Information[/h]

FluView Interactive: FluView includes enhanced web-based interactive applications that can provide dynamic visuals of the influenza data collected and analyzed by CDC. These FluView Interactive applications allow people to create customized, visual interpretations of influenza data, as well as make comparisons across flu seasons, regions, age groups and a variety of other demographics. To access these tools, visit http://www.cdc.gov/flu/weekly/fluviewinteractive.htm

National Institute for Occupational Safety and Health: Monthly surveillance data on the prevalence of health-related workplace absenteeism among full-time workers in the United States are available from NIOSH at https://www.cdc.gov/niosh/topics/absences/default.html

U.S. State and local influenza surveillance:Select a jurisdiction below to access the latest local influenza information


[TD="width: 139"] Alabama [/TD]
[TD="width: 139"] Alaska [/TD]
[TD="width: 139"] Arizona [/TD]
[TD="width: 139"] Arkansas [/TD]
[TD="width: 139"] California [/TD]

[TD="width: 139"] Colorado [/TD]
[TD="width: 139"] Connecticut [/TD]
[TD="width: 139"] Delaware [/TD]
[TD="width: 139"] District of Columbia [/TD]
[TD="width: 139"] Florida [/TD]

[TD="width: 139"] Georgia [/TD]
[TD="width: 139"] Hawaii [/TD]
[TD="width: 139"] Idaho [/TD]
[TD="width: 139"] Illinois [/TD]
[TD="width: 139"] Indiana [/TD]

[TD="width: 139"] Iowa [/TD]
[TD="width: 139"] Kansas [/TD]
[TD="width: 139"] Kentucky [/TD]
[TD="width: 139"] Louisiana [/TD]
[TD="width: 139"] Maine [/TD]

[TD="width: 139"] Maryland [/TD]
[TD="width: 139"] Massachusetts [/TD]
[TD="width: 139"] Michigan [/TD]
[TD="width: 139"] Minnesota [/TD]
[TD="width: 139"] Mississippi [/TD]

[TD="width: 139"] Missouri [/TD]
[TD="width: 139"] Montana [/TD]
[TD="width: 139"] Nebraska [/TD]
[TD="width: 139"] Nevada [/TD]
[TD="width: 139"] New Hampshire [/TD]

[TD="width: 139"] New Jersey [/TD]
[TD="width: 139"] New Mexico [/TD]
[TD="width: 139"] New York [/TD]
[TD="width: 139"] North Carolina [/TD]
[TD="width: 139"] North Dakota [/TD]

[TD="width: 139"] Ohio [/TD]
[TD="width: 139"] Oklahoma [/TD]
[TD="width: 139"] Oregon [/TD]
[TD="width: 139"] Pennsylvania [/TD]
[TD="width: 139"] Rhode Island [/TD]

[TD="width: 139"] South Carolina [/TD]
[TD="width: 139"] South Dakota [/TD]
[TD="width: 139"] Tennessee [/TD]
[TD="width: 139"] Texas [/TD]
[TD="width: 139"] Utah [/TD]

[TD="width: 139"] Vermont [/TD]
[TD="width: 139"] Virginia [/TD]
[TD="width: 139"] Washington [/TD]
[TD="width: 139"] West Virginia [/TD]
[TD="width: 139"] Wisconsin [/TD]

[TD="width: 139"] Wyoming [/TD]
[TD="width: 139"] New York City [/TD]
[TD="width: 139"] Puerto Rico [/TD]
[TD="width: 139"] Virgin Islands [/TD]
[TD="width: 139"] [/TD]


World Health Organization: Additional influenza surveillance information from participating WHO member nations is available through FluNet and the Global Epidemiology Reports.

WHO Collaborating Centers for Influenza located in Australia, China, Japan, the United Kingdom, and the United States (CDC in Atlanta, Georgia).

Europe: For the most recent influenza surveillance information from Europe, please see WHO/Europe and the European Centre for Disease Prevention and Control at http://www.flunewseurope.org/.

Public Health Agency of Canada: The most up-to-date influenza information from Canada is available at http://www.phac-aspc.gc.ca/fluwatch/

Public Health England: The most up-to-date influenza information from the United Kingdom is available at https://www.gov.uk/government/statistics/weekly-national-flu-reports


Any links provided to non-Federal organizations are provided solely as a service to our users. These links do not constitute an endorsement of these organizations or their programs by CDC or the Federal Government, and none should be inferred. CDC is not responsible for the content of the individual organization web pages found at these links.


An overview of the CDC influenza surveillance system, including methodology and detailed descriptions of each data component, is available at: http://www.cdc.gov/flu/weekly/overview.htm.

--------------------------------------------------------------------------------


Page last reviewed: December 6, 2019, 11:00 AM
Content source: Centers for Disease Control and Prevention, National Center for Immunization and Respiratory Diseases (NCIRD)Seasonal Influenza (Flu)
What CDC Does
email_03Get Email Updates

To receive weekly email updates about Seasonal Flu, enter your email address: Email Address
What's this?
Submit
H1N1 Flu Pandemic 2009-2019: A Decade Later - H1N1 Flu Pandemic 2009-2019: A Decade Later

Influenza Types
https://www.cdc.gov/flu/weekly/index.htm
 
[h=1]Weekly U.S. Influenza Surveillance Report[/h]
fluview-banner2.jpg

Key Updates for Week 49, ending December 7, 2019

Seasonal influenza activity in the United States has been elevated for five weeks and continues to increase. [h=4]Viruses[/h]
Clinical Lab
11.3% of respiratory specimens tested by clinical laboratories were positive for influenza viruses. This is higher than the previous week.

Public Health Lab
Nationally, B/Victoria viruses are most common followed by A(H1N1)pdm09 and A(H3N2) viruses. The predominant virus varies by region and age group.

Virus Characterization
Genetic and antigenic characterization and antiviral susceptibility of viruses collected in the U.S. this season are now being reported. [h=4]Illness[/h] Outpatient Illness: ILINet
3.2% of visits to health care providers were for influenza-like illness (ILI). ILI has been at or above the national baseline of 2.4% for five weeks. All regions were at or above their baselines.

Outpatient Illness: ILI Activity Map
week 49 - Week 49


The number of jurisdictions experiencing high ILI activity decreased to 12 this week compared to 13 last week. In addition, 12 jurisdictions had moderate activity compared to 15 last week.

Geographic Spread
spread map week 49


The number of jurisdictions reporting regional or widespread activity increased to 38 this week from 30 last week. [h=4]Severe Disease[/h]
Hospitalizations
The overall hospitalization rate for the season is 3.9 per 100,000. This is similar to what has been seen at this time during other recent seasons.

P&I Mortality
5.0% of deaths were attributed to pneumonia and influenza (P&I). This is below the epidemic threshold of 6.5%.

Pediatric Deaths
Four new influenza-associated pediatric deaths occurring during the 2019-2020 season were reported to CDC this week. The total for the season is 10.

All data are preliminary and may change as more reports are received.

A description of the CDC influenza surveillance system, including methodology and detailed descriptions of each data component is available on the surveillance methods page.

Additional information on the current and previous influenza seasons for each surveillance component are available on FluView Interactive.

Key Points
  • The 2019-2020 season is underway; all regions of the country are seeing elevated levels of flu-like illness.
  • Activity is being caused mostly by influenza B/Victoria viruses, which is unusual for this time of year. A/H1N1 viruses are the next most common and are increasing in proportion relative to other influenza viruses in some regions.
  • CDC estimates that so far this season there have been at least 2.6 million flu illnesses, 23,000 hospitalizations and 1,300 deaths from flu.
  • It’s not too late to get vaccinated. Flu vaccination is always the best way to prevent flu and its potentially serious complications.
  • Antiviral medications are an important adjunct to flu vaccine in the control of influenza. Almost all (>99%) of the influenza viruses tested this season are susceptible to the 4 FDA-approved influenza antiviral medications recommended for use in the U.S. this season.
[h=2]U.S. Virologic Surveillance[/h] [h=3]Clinical Laboratories[/h]
The results of tests performed by clinical laboratories nationwide are summarized below. Data from clinical laboratories (the percentage of specimens tested that are positive for influenza) are used to monitor whether influenza activity is increasing or decreasing.
30,510265,670
3,436 (11.3%)15,027 (5.7%)
1,083 (31.5%)4,577 (30.5%)
2,353 (68.5%)10,450 (69.5%)
Week 49 Data Cumulative since
September 29, 2019
(week 40)
No. of specimens tested No. of positive specimens (%) Positive specimens by type Influenza A Influenza B
INFLUENZA Virus Isolated

View Chart Data | View Full Screen [h=3]Public Health Laboratories[/h]
The results of tests performed by public health laboratories nationwide are summarized below. Data from public health laboratories are used to monitor the proportion of circulating viruses that belong to each influenza subtype/lineage.
1,50815,172
6314,556
283 (44.8%)1,932 (42.4%)
221 (83.7%)1,171 (64.7%)
43 (16.3%)640 (35.3%)
19121
348 (55.2%)2,624 (57.6%)
6 (2.5%)59 (3.0%)
232 (97.5%)1,904 (97.0%)
110661
Week 49 Data Cumulative since September 29, 2019
(week 40)
No. of specimens tested No. of positive specimens Positive specimens by type/subtype Influenza A (H1N1)pdm09 H3N2 Subtyping not performed Influenza B Yamagata lineage Victoria lineage Lineage not performed

Nationally influenza B/Victoria viruses have been reported more frequently than other influenza viruses this season; followed by A(H1N1)pdm09 and A(H3N2) viruses. The predominant virus varies by region and the proportions of influenza B/Victoria and influenza A(H1N1)pmd09 viruses are increasing in some regions. Regional and state level data about circulating influenza viruses can be found on FluView Interactive. The predominant virus also varies by age group. Nationally, influenza B/Victoria viruses are the most commonly reported influenza viruses among children age 0-4 years (46% of reported viruses) and 5-24 years (59% of reported viruses), while A(H3N2) viruses are the most commonly reported influenza viruses among persons 65 years of age and older (47% of reported viruses). Among adults aged 25-64 years, approximately equal proportions of influenza A(H1N1)pdm09 and B/Victoria viruses (38% and 34%, respectively) have been reported. Additional age data can be found on FluView Interactive.
INFLUENZA Virus Isolated

View Chart Data | View Full Screen

Additional virologic surveillance information for current and past seasons:
Surveillance Methods | FluView Interactive: National, Regional, and State Data or Age Data
[h=2]Influenza Virus Characterization[/h]
CDC performs genetic and antigenic characterization of U.S. viruses submitted from state and local health laboratories using Right Size Roadmap submission guidance. These data are used to compare how similar the currently circulating influenza viruses are to the reference viruses used for developing new influenza vaccines and to monitor evolutionary changes that continually occur in circulating influenza. CDC also tests susceptibility of influenza viruses to antiviral medications including the neuraminidase inhibitors (oseltamivir, zanamivir, and peramivir) and the PA endonuclease inhibitor baloxavir.

CDC genetically characterized 369 influenza viruses collected in the U.S. from September 29, 2019 to December 7, 2019.
81
6B.1A81 (100%)
132
3C.2a132 (100%)2a1132 (100%)
2a20
2a30
2a40
3C.3a03a0
142
V1A142 (100%)V1A0
V1A.122 (15.5%)
V1A.3120 (84.5%)
14
Y314 (100%)

Virus Subtype or Lineage Genetic Characterization
Total No. of Subtype/Lineage Tested Clade Number (% of subtype/lineage tested) Subclade Number (% of subtype/lineage tested) A/H1 A/H3 B/Victoria B/Yamagata

CDC antigenically characterizes a subset of influenza viruses by hemagglutination inhibition (HI) or neutralization based Focus Reduction assays (FRA). Antigenic drift is evaluated by comparing antigenic properties of cell-propagated reference viruses representing currently recommended vaccine components with those of cell-propagated circulating viruses. CDC antigenically characterized 61 influenza viruses collected in the U.S. from September 29, 2019 to December 7, 2019.

Influenza A Viruses
  • A (H1N1)pdm09: Eighteen A(H1N1)pdm09 viruses were antigenically characterized by HI with ferret antisera, and all were antigenically similar (reacting at titers that were within 4-fold of the homologous virus titer) to cell-propagated A/Brisbane/02/2018-like reference viruses representing the A(H1N1)pdm09 component for the 2019-20 Northern Hemisphere influenza vaccines.
  • A (H3N2): Seventeen A(H3N2) viruses were antigenically characterized by FRA with ferret antisera, and 12 (70.6%) were antigenically similar to cell-propagated A/Kansas/14/2017-like reference viruses representing the A(H3N2) component for the 2019-20 Northern Hemisphere influenza vaccines.


Influenza B Viruses
  • B/Victoria: Sixteen B/Victoria lineage viruses, including viruses from both co-circulating sub-clades, were antigenically characterized by HI with ferret antisera, and 10 (62.5%) were antigenically similar to cell-propagated B/Colorado/06/2017-like reference viruses representing the B/Victoria component for the 2019-20 Northern Hemisphere influenza vaccines.
  • B/Yamagata: Ten B/Yamagata lineage viruses were antigenically characterized by HI with ferret antisera, and all 10 (100%) were antigenically similar to cell-propagated B/Phuket/3073/2013-like reference viruses representing the B/Yamagata component for the 2019-20 Northern Hemisphere influenza vaccines.


CDC assesses susceptibility of influenza viruses to the antiviral medications oseltamivir, zanamivir, peramivir, and baloxavir using next generation sequence analysis supplemented by laboratory assays. Viruses collected in the U.S. since September 29, 2019 were tested for antiviral susceptibility as follows:
4158113019014
(0.0%)(0.0%)(0.0%)(0.0%)(0.0%)
1 (0.2%)1 (1.2%)(0.0%)(0.0%)(0.0%)
4158113019014
(0.0%)(0.0%)(0.0%)(0.0%)(0.0%)
1 (0.2%)1 (1.2%)(0.0%)(0.0%)(0.0%)
4158113019014
1 (0.2%)(0.0%)(0.0%)1 (0.5%)(0.0%)
(0.0%)(0.0%)(0.0%)(0.0%)(0.0%)
3367512212613
(0.0%)(0.0%)(0.0%)(0.0%)(0.0%)

Antiviral Medication Total Viruses A/H1 A/H3 B/Victoria B/Yamagata Neuraminidase Inhibitors Oseltamivir Viruses Tested Reduced Inhibition Highly Reduced Inhibition Peramivir Viruses Tested Reduced Inhibition
Highly Reduced Inhibition Zanamivir Viruses Tested Reduced Inhibition
Highly Reduced Inhibition PA Endonuclease Inhibitor
Baloxavir Viruses Tested
Reduced Susceptibility

[h=2]Outpatient Illness Surveillance[/h] [h=3]ILINet[/h]
Nationwide during week 49, 3.2% of patient visits reported through the U.S. Outpatient Influenza-like Illness Surveillance Network (ILINet) were due to influenza-like illness (ILI). This percentage is above the national baseline of 2.4%. The decrease in the percentage of patient visits for ILI during week 49 compared to week 48 may be influenced in part by a reduction in routine healthcare visits surrounding the Thanksgiving holiday (occurring during week 48) as has occurred during previous seasons.
national levels of ILI and ARI

View Chart Data | View Full Screen

On a regional level, the percentage of outpatient visits for ILI ranged from 1.8% to 5.7% during week 49. All regions reported a percentage of outpatient visits for ILI which is equal to or above their region-specific baselines. [h=3]ILI Activity Map[/h]
Data collected in ILINet are used to produce a measure of ILI activity* by state.

During week 49, the following ILI activity levels were experienced:
  • High – Puerto Rico and 11 states (Alabama, Arkansas, Georgia, Mississippi, Nebraska, New Mexico, South Carolina, Tennessee, Texas, Virginia, and Washington)
  • Moderate – New York City and 11 states (Arizona, Colorado, Connecticut, Hawaii, Kentucky, Maryland, Minnesota, Nevada, New Jersey, Oklahoma, and Oregon)
  • Low – District of Columbia and nine states (California, Florida, Illinois, Kansas, Massachusetts, New York, North Carolina, Pennsylvania, and Wisconsin)
  • Minimal – 18 states (Alaska, Delaware, Idaho, Indiana, Iowa, Maine, Michigan, Missouri, Montana, New Hampshire, North Dakota, Ohio, Rhode Island, South Dakota, Utah, Vermont, West Virginia, and Wyoming)
  • Data were insufficient to calculate an ILI activity level from the U.S. Virgin Islands and Louisiana.
[SIZE=-1]*Data collected in ILINet may disproportionally represent certain populations within a state, and therefore, may not accurately depict the full picture of influenza activity for the whole state. Differences in the data presented here by CDC and independently by some state health departments likely represent differing levels of data completeness with data presented by the state likely being the more complete.[/SIZE]


Additional information about medically attended visits for ILI for current and past seasons:
Surveillance Methods | FluView Interactive: National, Regional, and State Data or ILI Activity Map


[h=2]Geographic Spread of Influenza as Assessed by State and Territorial Epidemiologists[/h]
The influenza activity reported by state and territorial epidemiologists indicates geographic spread of influenza viruses but does not measure the severity of influenza activity.

During week 49 the following influenza activity was reported:
  • Widespread – 23 states (Alabama, Arizona, California, Connecticut, Georgia, Idaho, Indiana, Kentucky, Louisiana, Maryland, Massachusetts, Nebraska, Nevada, New Mexico, New York, North Carolina, Oregon, Pennsylvania, South Carolina, Tennessee, Texas, Virginia and Washington)
  • Regional – Puerto Rico and 14 states (Arkansas, Colorado, Florida, Illinois, Michigan, Minnesota, Mississippi, Montana, New Jersey, Ohio, Oklahoma, Rhode Island, Utah and Wisconsin)
  • Local – 12 states (Delaware, Hawaii, Iowa, Kansas, Maine, Missouri, New Hampshire, North Dakota, South Dakota, Vermont, West Virginia and Wyoming)
  • Sporadic – the District of Columbia, the U.S. Virgin Islands and one state (Alaska)
  • Guam did not report.
Additional geographic spread surveillance information for current and past seasons:
Surveillance Methods | FluView Interactive

[h=2]Influenza-Associated Hospitalizations[/h]
The Influenza Hospitalization Surveillance Network (FluSurv-NET) conducts population-based surveillance for laboratory-confirmed influenza-related hospitalizations in select counties in the Emerging Infections Program (EIP) states and Influenza Hospitalization Surveillance Project (IHSP) states.

A total of 1,139 laboratory-confirmed influenza-associated hospitalizations were reported by FluSurv-NET sites between October 1, 2019 and December 7, 2019. The overall hospitalization rate was 3.9 per 100,000 population. The highest rate of hospitalization was among adults aged ≥65 (9.4 per 100,000 population), followed by children aged 0-4 (7.5 per 100,000 population) and adults aged 50-64 (4.1 per 100,000 population). Among 1,139 hospitalizations, 627 (55.0%) were associated with influenza A virus, 499 (43.8%) with influenza B virus, 6 (0.5%) with influenza A virus and influenza B virus co-infection, and 7 (0.6%) with influenza virus for which the type was not determined. Among those with influenza A subtype information, 103 (70.5%) were A(H1N1)pdm09 virus and 43 (29.5%) were A(H3N2).

Click on graph to launch interactive tool
View Full Screen

Additional hospitalization surveillance information for current and past seasons and additional age groups:
Surveillance Methods | FluView Interactive


[h=2]Pneumonia and Influenza (P&I) Mortality Surveillance[/h]
Based on National Center for Health Statistics (NCHS) mortality surveillance data available on December 12, 2019, 5.0% of the deaths occurring during the week ending November 30, 2019 (week 48) were due to P&I. This percentage is below the epidemic threshold of 6.5% for week 48.
INFLUENZA Virus Isolated

View Chart Data | View Full Screen

Additional pneumonia and influenza mortality surveillance information for current and past seasons:
Surveillance Methods | FluView Interactive


[h=2]Influenza-Associated Pediatric Mortality[/h]
Four influenza-associated pediatric deaths were reported to CDC during week 49. One death occurred during week 47 (the week ending November 23, 2019) and was associated with an influenza A virus for which no subtyping was performed. Three deaths occurred during week 48 (the week ending November 30, 2019). One death was associated with an influenza B/Victoria virus, one was associated with an influenza B virus with no lineage determined, and one was associated with an influenza A(H1N1)pdm09 virus.

A total of 10 influenza-associated pediatric deaths occurring during the 2019-2020 season have been reported to CDC. Six cases tested positive for influenza B; three of these cases had the lineage determined and all were B/Victoria viruses. Four cases tested positive for influenza A. Two of these cases had subtyping performed and both were A(H1N1)pdm09 viruses.
Click on image to launch interactive tool

View Full Screen

Additional pediatric mortality surveillance information for current and past seasons:
Surveillance Methods | FluView Interactive


[h=2]Additional National and International Influenza Surveillance Information[/h]

FluView Interactive: FluView includes enhanced web-based interactive applications that can provide dynamic visuals of the influenza data collected and analyzed by CDC. These FluView Interactive applications allow people to create customized, visual interpretations of influenza data, as well as make comparisons across flu seasons, regions, age groups and a variety of other demographics. To access these tools, visit http://www.cdc.gov/flu/weekly/fluviewinteractive.htm

National Institute for Occupational Safety and Health: Monthly surveillance data on the prevalence of health-related workplace absenteeism among full-time workers in the United States are available from NIOSH at https://www.cdc.gov/niosh/topics/absences/default.html

U.S. State and local influenza surveillance:Select a jurisdiction below to access the latest local influenza information


[TD="width: 139"] Alabama [/TD]
[TD="width: 139"] Alaska [/TD]
[TD="width: 139"] Arizona [/TD]
[TD="width: 139"] Arkansas [/TD]
[TD="width: 139"] California [/TD]

[TD="width: 139"] Colorado [/TD]
[TD="width: 139"] Connecticut [/TD]
[TD="width: 139"] Delaware [/TD]
[TD="width: 139"] District of Columbia [/TD]
[TD="width: 139"] Florida [/TD]

[TD="width: 139"] Georgia [/TD]
[TD="width: 139"] Hawaii [/TD]
[TD="width: 139"] Idaho [/TD]
[TD="width: 139"] Illinois [/TD]
[TD="width: 139"] Indiana [/TD]

[TD="width: 139"] Iowa [/TD]
[TD="width: 139"] Kansas [/TD]
[TD="width: 139"] Kentucky [/TD]
[TD="width: 139"] Louisiana [/TD]
[TD="width: 139"] Maine [/TD]

[TD="width: 139"] Maryland [/TD]
[TD="width: 139"] Massachusetts [/TD]
[TD="width: 139"] Michigan [/TD]
[TD="width: 139"] Minnesota [/TD]
[TD="width: 139"] Mississippi [/TD]

[TD="width: 139"] Missouri [/TD]
[TD="width: 139"] Montana [/TD]
[TD="width: 139"] Nebraska [/TD]
[TD="width: 139"] Nevada [/TD]
[TD="width: 139"] New Hampshire [/TD]

[TD="width: 139"] New Jersey [/TD]
[TD="width: 139"] New Mexico [/TD]
[TD="width: 139"] New York [/TD]
[TD="width: 139"] North Carolina [/TD]
[TD="width: 139"] North Dakota [/TD]

[TD="width: 139"] Ohio [/TD]
[TD="width: 139"] Oklahoma [/TD]
[TD="width: 139"] Oregon [/TD]
[TD="width: 139"] Pennsylvania [/TD]
[TD="width: 139"] Rhode Island [/TD]

[TD="width: 139"] South Carolina [/TD]
[TD="width: 139"] South Dakota [/TD]
[TD="width: 139"] Tennessee [/TD]
[TD="width: 139"] Texas [/TD]
[TD="width: 139"] Utah [/TD]

[TD="width: 139"] Vermont [/TD]
[TD="width: 139"] Virginia [/TD]
[TD="width: 139"] Washington [/TD]
[TD="width: 139"] West Virginia [/TD]
[TD="width: 139"] Wisconsin [/TD]

[TD="width: 139"] Wyoming [/TD]
[TD="width: 139"] New York City [/TD]
[TD="width: 139"] Puerto Rico [/TD]
[TD="width: 139"] Virgin Islands [/TD]
[TD="width: 139"] [/TD]


World Health Organization: Additional influenza surveillance information from participating WHO member nations is available through FluNet and the Global Epidemiology Reports.

WHO Collaborating Centers for Influenza located in Australia, China, Japan, the United Kingdom, and the United States (CDC in Atlanta, Georgia).

Europe: For the most recent influenza surveillance information from Europe, please see WHO/Europe and the European Centre for Disease Prevention and Control at http://www.flunewseurope.org/.

Public Health Agency of Canada: The most up-to-date influenza information from Canada is available at http://www.phac-aspc.gc.ca/fluwatch/

Public Health England: The most up-to-date influenza information from the United Kingdom is available at https://www.gov.uk/government/statistics/weekly-national-flu-reports


Any links provided to non-Federal organizations are provided solely as a service to our users. These links do not constitute an endorsement of these organizations or their programs by CDC or the Federal Government, and none should be inferred. CDC is not responsible for the content of the individual organization web pages found at these links.


An overview of the CDC influenza surveillance system, including methodology and detailed descriptions of each data component, is available at: http://www.cdc.gov/flu/weekly/overview.htm.

--------------------------------------------------------------------------------


Page last reviewed: December 13, 2019, 11:00 AM
Content source: Centers for Disease Control and Prevention, National Center for Immunization and Respiratory Diseases (NCIRD)Seasonal Influenza (Flu)
What CDC Does
email_03Get Email Updates

To receive weekly email updates about Seasonal Flu, enter your email address: Email Address
What's this?
Submit
H1N1 Flu Pandemic 2009-2019: A Decade Later - H1N1 Flu Pandemic 2009-2019: A Decade Later

Influenza Types
https://www.cdc.gov/flu/weekly/index.htm
 
[h=1]Weekly U.S. Influenza Surveillance Report[/h]
fluview-banner2.jpg

Key Updates for Week 50, ending December 14, 2019

Seasonal influenza activity in the United States continues to increase and has been elevated for six weeks now. [h=4]Viruses[/h]
Clinical Lab
The percentage of respiratory specimens testing positive for influenza at clinical laboratories increased to 16.3% this week.

Public Health Lab
Nationally, B/Victoria viruses are most common followed by A(H1N1)pdm09 viruses. The predominant virus varies by region and age group.

Virus Characterization
Genetic and antigenic characterization and antiviral susceptibility of viruses collected in the U.S. this season are now being reported. [h=4]Illness[/h] Outpatient Illness: ILINet
Visits to health care providers for influenza-like illness (ILI) increased to 3.9%. ILI has been at or above the national baseline of 2.4% for six weeks. All regions were at or above their baselines.

Outpatient Illness: ILI Activity Map
Flu Activity & Surveillance


The number of jurisdictions experiencing high ILI activity increased to 21 this week compared to 12 last week.

Geographic Spread
spread map week50 - Spread Map week 50


The number of jurisdictions reporting regional or widespread activity increased to 48 this week from 38 last week. [h=4]Severe Disease[/h]
Hospitalizations
The overall hospitalization rate for the season increased to 5.5 per 100,000. This is similar to what has been seen at this time during recent seasons.

P&I Mortality
The percentage of deaths attributed to pneumonia and influenza increased to 5.5% but remains below the epidemic threshold.

Pediatric Deaths
Nine new influenza-associated pediatric deaths occurring during the 2019-2020 season were reported to CDC this week. The total for the season is 19.

All data are preliminary and may change as more reports are received.

A description of the CDC influenza surveillance system, including methodology and detailed descriptions of each data component is available on the surveillance methods page.

Additional information on the current and previous influenza seasons for each surveillance component are available on FluView Interactive.

Key Points
  • The 2019-2020 season is underway; all regions of the country are seeing elevated levels of flu-like illness.
  • Activity is being caused mostly by influenza B/Victoria viruses, which is unusual for this time of year. A(H1N1) viruses are the next most common and are increasing in proportion relative to other influenza viruses in some regions.
  • CDC estimates that so far this season there have been at least 3.7 million flu illnesses, 32,000 hospitalizations and 1,800 deaths from flu.
  • It’s not too late to get vaccinated. Flu vaccination is always the best way to prevent flu and its potentially serious complications.
  • Antiviral medications are an important adjunct to flu vaccine in the control of influenza. Almost all (>99%) of the influenza viruses tested this season are susceptible to the four FDA-approved influenza antiviral medications recommended for use in the U.S. this season.
[h=2]U.S. Virologic Surveillance[/h] [h=3]Clinical Laboratories[/h]
The results of tests performed by clinical laboratories nationwide are summarized below. Data from clinical laboratories (the percentage of specimens tested that are positive for influenza) are used to monitor whether influenza activity is increasing or decreasing.
33,918320,906
5,515 (16.3%)23,386 (7.3%)
1,735 (31.5%)6,891 (29.5%)
3,780 (68.5%)16,495 (70.5%)
Week 50 Data Cumulative since
September 29, 2019
(week 40)
No. of specimens tested No. of positive specimens (%) Positive specimens by type Influenza A Influenza B
INFLUENZA Virus Isolated

View Chart Data | View Full Screen [h=3]Public Health Laboratories[/h]
The results of tests performed by public health laboratories nationwide are summarized below. Data from public health laboratories are used to monitor the proportion of circulating viruses that belong to each influenza subtype/lineage.
1,41317,865
7336,045
282 (38.5%)2,487 (41.1%)
231 (87.2%)1,617 (69.3%)
34 (12.8%)718 (30.7%)
17152
451 (61.5%)3,558 (58.9%)
7 (2.2%)72 (2.7%)
310 (97.8%)2,562 (97.3%)
134924
Week 50 Data Cumulative since September 29, 2019
(week 40)
No. of specimens tested No. of positive specimens Positive specimens by type/subtype Influenza A (H1N1)pdm09 H3N2 Subtyping not performed Influenza B Yamagata lineage Victoria lineage Lineage not performed

Nationally influenza B/Victoria viruses have been reported more frequently than other influenza viruses this season followed by A(H1N1)pdm09. The predominant virus varies by region. Regional and state level data about circulating influenza viruses can be found on FluView Interactive. The predominant virus also varies by age group. Nationally, influenza B/Victoria viruses are the most commonly reported influenza viruses among children age 0-4 years (49% of reported viruses) and 5-24 years (59% of reported viruses), while A(H3N2) viruses are the most commonly reported influenza viruses among persons 65 years of age and older (42% of reported viruses). Among adults aged 25-64 years, approximately equal proportions of influenza A(H1N1)pdm09 and B/Victoria viruses (39% and 35%, respectively) have been reported. Additional age data can be found on FluView Interactive.
INFLUENZA Virus Isolated

View Chart Data | View Full Screen

Additional virologic surveillance information for current and past seasons:
Surveillance Methods | FluView Interactive: National, Regional, and State Data or Age Data
[h=2]Influenza Virus Characterization[/h]
CDC performs genetic and antigenic characterization of U.S. viruses submitted from state and local health laboratories using Right Size Roadmap submission guidance. These data are used to compare how similar the currently circulating influenza viruses are to the reference viruses used for developing new influenza vaccines and to monitor evolutionary changes that continually occur in circulating influenza. CDC also tests susceptibility of influenza viruses to antiviral medications including the neuraminidase inhibitors (oseltamivir, zanamivir, and peramivir) and the PA endonuclease inhibitor baloxavir.

CDC genetically characterized 501 influenza viruses collected in the U.S. from September 29, 2019 to December 14, 2019.
123
6B.1A123 (100%)
162
3C.2a162 (100%)2a1162 (100%)
2a20
2a30
2a40
3C.3a03a0
197
V1A197 (100%)V1A0
V1A.123 (11.7%)
V1A.3174 (88.3%)
19
Y319 (100%)

Virus Subtype or Lineage Genetic Characterization
Total No. of Subtype/Lineage Tested Clade Number (% of subtype/lineage tested) Subclade Number (% of subtype/lineage tested) A/H1 A/H3 B/Victoria B/Yamagata

CDC antigenically characterizes a subset of influenza viruses by hemagglutination inhibition (HI) or neutralization based Focus Reduction assays (FRA). Antigenic drift is evaluated by comparing antigenic properties of cell-propagated reference viruses representing currently recommended vaccine components with those of cell-propagated circulating viruses. CDC antigenically characterized 94 influenza viruses collected in the United States from September 29, 2019, to December 14, 2019.

Influenza A Viruses
  • A (H1N1)pdm09: 42 A(H1N1)pdm09 viruses were antigenically characterized by HI with ferret antisera, and all were antigenically similar (reacting at titers that were within 4-fold of the homologous virus titer) to cell-propagated A/Brisbane/02/2018-like reference viruses representing the A(H1N1)pdm09 component for the 2019-20 Northern Hemisphere influenza vaccines.
  • A (H3N2): 17 A(H3N2) viruses were antigenically characterized by FRA with ferret antisera, and 12 (70.6%) were antigenically similar to cell-propagated A/Kansas/14/2017-like reference viruses representing the A(H3N2) component for the 2019-20 Northern Hemisphere influenza vaccines.


Influenza B Viruses
  • B/Victoria: 25 B/Victoria lineage viruses, including viruses from both co-circulating sub-clades, were antigenically characterized by HI with ferret antisera, and 19 (76%) were antigenically similar to cell-propagated B/Colorado/06/2017-like reference viruses representing the B/Victoria component for the 2019-20 Northern Hemisphere influenza vaccines.
  • B/Yamagata: 10 B/Yamagata lineage viruses were antigenically characterized by HI with ferret antisera, and all 10 (100%) were antigenically similar to cell-propagated B/Phuket/3073/2013-like reference viruses representing the B/Yamagata component for the 2019-20 Northern Hemisphere influenza vaccines.


CDC assesses susceptibility of influenza viruses to the antiviral medications oseltamivir, zanamivir, peramivir, and baloxavir using next generation sequence analysis supplemented by laboratory assays. Viruses collected in the United States since September 29, 2019, were tested for antiviral susceptibility as follows:
46210315219017
(0.0%)(0.0%)(0.0%)(0.0%)(0.0%)
1 (0.2%)1 (1.0%)(0.0%)(0.0%)(0.0%)
46210315219017
(0.0%)(0.0%)(0.0%)(0.0%)(0.0%)
1 (0.2%)1 (1.0%)(0.0%)(0.0%)(0.0%)
46210315219017
1 (0.2%)(0.0%)(0.0%)1 (0.5%)(0.0%)
(0.0%)(0.0%)(0.0%)(0.0%)(0.0%)
4239214916715
(0.0%)(0.0%)(0.0%)(0.0%)(0.0%)

Antiviral Medication Total Viruses A/H1 A/H3 B/Victoria B/Yamagata Neuraminidase Inhibitors Oseltamivir Viruses Tested Reduced Inhibition Highly Reduced Inhibition Peramivir Viruses Tested Reduced Inhibition
Highly Reduced Inhibition Zanamivir Viruses Tested Reduced Inhibition
Highly Reduced Inhibition PA Endonuclease Inhibitor
Baloxavir Viruses Tested
Reduced Susceptibility

[h=2]Outpatient Illness Surveillance[/h] [h=3]ILINet[/h]
Nationwide during week 50, 3.9% of patient visits reported through the U.S. Outpatient Influenza-like Illness Surveillance Network (ILINet) were due to influenza-like illness (ILI). This percentage is above the national baseline of 2.4%.
national levels of ILI and ARI

View Chart Data | View Full Screen

On a regional level, the percentage of outpatient visits for ILI ranged from 1.9% to 7.8% during week 50. All regions reported a percentage of outpatient visits for ILI which is equal to or above their region-specific baselines. [h=3]ILI Activity Map[/h]
Data collected in ILINet are used to produce a measure of ILI activity* by state.

During week 50, the following ILI activity levels were experienced:
  • High – Puerto Rico, New York City, and 19 states (Alabama, Arizona, Arkansas, Colorado, Florida, Georgia, Kansas, Kentucky, Maryland, Mississippi, Nebraska, New Mexico, Oklahoma, Oregon, South Carolina, Tennessee, Texas, Virginia, and Washington)
  • Moderate – the District of Columbia and six states (Connecticut, Illinois, Minnesota, New Jersey, North Carolina, and North Dakota)
  • Low – 10 states (California, Hawaii, Indiana, Massachusetts, Nevada, New York, Pennsylvania, Utah, Wisconsin, and Wyoming)
  • Minimal – 14 states (Alaska, Delaware, Idaho, Iowa, Maine, Michigan, Missouri, Montana, New Hampshire, Ohio, Rhode Island, South Dakota, Vermont, and West Virginia)
  • Data were insufficient to calculate an ILI activity level from the U.S. Virgin Islands and Louisiana.
[SIZE=-1]*Data collected in ILINet may disproportionally represent certain populations within a state, and therefore, may not accurately depict the full picture of influenza activity for the whole state. Differences in the data presented here by CDC and independently by some state health departments likely represent differing levels of data completeness with data presented by the state likely being the more complete.[/SIZE]


Additional information about medically attended visits for ILI for current and past seasons:
Surveillance Methods | FluView Interactive: National, Regional, and State Data or ILI Activity Map


[h=2]Geographic Spread of Influenza as Assessed by State and Territorial Epidemiologists[/h]
The influenza activity reported by state and territorial epidemiologists indicates geographic spread of influenza viruses but does not measure the severity of influenza activity.

During week 50 the following influenza activity was reported:
  • Widespread – Puerto Rico and 30 states (Alabama, Alaska, Arizona, California, Connecticut, Delaware, Florida, Georgia, Idaho, Indiana, Kentucky, Louisiana, Maryland, Massachusetts, Minnesota, Mississippi, Montana, Nebraska, Nevada, New Mexico, New York, North Carolina, Ohio, Oregon, Pennsylvania, South Carolina, Tennessee, Texas, Virginia, and Washington)
  • Regional – 17 states (Arkansas, Colorado, Illinois, Iowa, Kansas, Maine, Michigan, Missouri, New Hampshire, New Jersey, North Dakota, Oklahoma, Rhode Island, South Dakota, Utah, Wisconsin, and Wyoming)
  • Local – the District of Columbia and two states (Vermont and West Virginia)
  • Sporadic – the U.S. Virgin Islands and one state (Hawaii)
  • Guam did not report.
Additional geographic spread surveillance information for current and past seasons:
Surveillance Methods | FluView Interactive

[h=2]Influenza-Associated Hospitalizations[/h]
The Influenza Hospitalization Surveillance Network (FluSurv-NET) conducts population-based surveillance for laboratory-confirmed influenza-related hospitalizations in select counties in the Emerging Infections Program (EIP) states and Influenza Hospitalization Surveillance Project (IHSP) states.

A total of 1,593 laboratory-confirmed influenza-associated hospitalizations were reported by FluSurv-NET sites between October 1, 2019, and December 14, 2019. The overall hospitalization rate was 5.5 per 100,000 population. The highest rate of hospitalization was among adults aged ≥65 (12.7 per 100,000 population), followed by children aged 0-4 (10.9 per 100,000 population) and adults aged 50-64 (5.5 per 100,000 population). Among 1,593 hospitalizations, 855 (53.7%) were associated with influenza A virus, 722 (45.3%) with influenza B virus, 9 (0.6%) with influenza A virus and influenza B virus co-infection, and 7 (0.4%) with influenza virus for which the type was not determined. Among those with influenza A subtype information, 137 (73.3%) were A(H1N1)pdm09 virus and 50 (26.7%) were A(H3N2).

Click on graph to launch interactive tool
View Full Screen

Additional hospitalization surveillance information for current and past seasons and additional age groups:
Surveillance Methods | FluView Interactive


[h=2]Pneumonia and Influenza (P&I) Mortality Surveillance[/h]
Based on National Center for Health Statistics (NCHS) mortality surveillance data available on December 19, 2019, 5.5% of the deaths occurring during the week ending December 7, 2019 (week 49) were due to P&I. This percentage is below the epidemic threshold of 6.6% for week 49.
INFLUENZA Virus Isolated

View Chart Data | View Full Screen

Additional pneumonia and influenza mortality surveillance information for current and past seasons:
Surveillance Methods | FluView Interactive


[h=2]Influenza-Associated Pediatric Mortality[/h]
Nine influenza-associated pediatric deaths occurring between week 44 (the week ending November 2, 2019) and week 50 (the week ending December 14, 2019) were reported to CDC during week 50. Two deaths were associated with influenza A(H1N1)pdm09 virus infection and seven were associated with influenza B viruses. Two of the influenza B viruses had lineage determined and both were B/Victoria viruses.

A total of 19 influenza-associated pediatric deaths occurring during the 2019-2020 season have been reported to CDC.
  • Thirteen deaths were associated with influenza B viruses. Five of these had the lineage determined and all were B/Victoria viruses.
  • Six deaths were associated with influenza A viruses. Four of these had subtyping performed and all were A(H1N1)pdm09 viruses.
Click on image to launch interactive tool

View Full Screen

Additional pediatric mortality surveillance information for current and past seasons:
Surveillance Methods | FluView Interactive


[h=2]Additional National and International Influenza Surveillance Information[/h]

FluView Interactive: FluView includes enhanced web-based interactive applications that can provide dynamic visuals of the influenza data collected and analyzed by CDC. These FluView Interactive applications allow people to create customized, visual interpretations of influenza data, as well as make comparisons across flu seasons, regions, age groups and a variety of other demographics. To access these tools, visit http://www.cdc.gov/flu/weekly/fluviewinteractive.htm

National Institute for Occupational Safety and Health: Monthly surveillance data on the prevalence of health-related workplace absenteeism among full-time workers in the United States are available from NIOSH at https://www.cdc.gov/niosh/topics/absences/default.html

U.S. State and local influenza surveillance:Select a jurisdiction below to access the latest local influenza information


[TD="width: 139"] Alabama [/TD]
[TD="width: 139"] Alaska [/TD]
[TD="width: 139"] Arizona [/TD]
[TD="width: 139"] Arkansas [/TD]
[TD="width: 139"] California [/TD]

[TD="width: 139"] Colorado [/TD]
[TD="width: 139"] Connecticut [/TD]
[TD="width: 139"] Delaware [/TD]
[TD="width: 139"] District of Columbia [/TD]
[TD="width: 139"] Florida [/TD]

[TD="width: 139"] Georgia [/TD]
[TD="width: 139"] Hawaii [/TD]
[TD="width: 139"] Idaho [/TD]
[TD="width: 139"] Illinois [/TD]
[TD="width: 139"] Indiana [/TD]

[TD="width: 139"] Iowa [/TD]
[TD="width: 139"] Kansas [/TD]
[TD="width: 139"] Kentucky [/TD]
[TD="width: 139"] Louisiana [/TD]
[TD="width: 139"] Maine [/TD]

[TD="width: 139"] Maryland [/TD]
[TD="width: 139"] Massachusetts [/TD]
[TD="width: 139"] Michigan [/TD]
[TD="width: 139"] Minnesota [/TD]
[TD="width: 139"] Mississippi [/TD]

[TD="width: 139"] Missouri [/TD]
[TD="width: 139"] Montana [/TD]
[TD="width: 139"] Nebraska [/TD]
[TD="width: 139"] Nevada [/TD]
[TD="width: 139"] New Hampshire [/TD]

[TD="width: 139"] New Jersey [/TD]
[TD="width: 139"] New Mexico [/TD]
[TD="width: 139"] New York [/TD]
[TD="width: 139"] North Carolina [/TD]
[TD="width: 139"] North Dakota [/TD]

[TD="width: 139"] Ohio [/TD]
[TD="width: 139"] Oklahoma [/TD]
[TD="width: 139"] Oregon [/TD]
[TD="width: 139"] Pennsylvania [/TD]
[TD="width: 139"] Rhode Island [/TD]

[TD="width: 139"] South Carolina [/TD]
[TD="width: 139"] South Dakota [/TD]
[TD="width: 139"] Tennessee [/TD]
[TD="width: 139"] Texas [/TD]
[TD="width: 139"] Utah [/TD]

[TD="width: 139"] Vermont [/TD]
[TD="width: 139"] Virginia [/TD]
[TD="width: 139"] Washington [/TD]
[TD="width: 139"] West Virginia [/TD]
[TD="width: 139"] Wisconsin [/TD]

[TD="width: 139"] Wyoming [/TD]
[TD="width: 139"] New York City [/TD]
[TD="width: 139"] Puerto Rico [/TD]
[TD="width: 139"] Virgin Islands [/TD]
[TD="width: 139"] [/TD]


World Health Organization: Additional influenza surveillance information from participating WHO member nations is available through FluNet and the Global Epidemiology Reports.

WHO Collaborating Centers for Influenza located in Australia, China, Japan, the United Kingdom, and the United States (CDC in Atlanta, Georgia).

Europe: For the most recent influenza surveillance information from Europe, please see WHO/Europe and the European Centre for Disease Prevention and Control at http://www.flunewseurope.org/.

Public Health Agency of Canada: The most up-to-date influenza information from Canada is available at http://www.phac-aspc.gc.ca/fluwatch/

Public Health England: The most up-to-date influenza information from the United Kingdom is available at https://www.gov.uk/government/statistics/weekly-national-flu-reports


Any links provided to non-Federal organizations are provided solely as a service to our users. These links do not constitute an endorsement of these organizations or their programs by CDC or the Federal Government, and none should be inferred. CDC is not responsible for the content of the individual organization web pages found at these links.


An overview of the CDC influenza surveillance system, including methodology and detailed descriptions of each data component, is available at: http://www.cdc.gov/flu/weekly/overview.htm.

--------------------------------------------------------------------------------


Page last reviewed: December 20, 2019, 11:00 AM
Content source: Centers for Disease Control and Prevention, National Center for Immunization and Respiratory Diseases (NCIRD)Seasonal Influenza (Flu)
What CDC Does
email_03Get Email Updates

To receive weekly email updates about Seasonal Flu, enter your email address: Email Address
What's this?
Submit
H1N1 Flu Pandemic 2009-2019: A Decade Later - H1N1 Flu Pandemic 2009-2019: A Decade Later

Influenza Types
https://www.cdc.gov/flu/weekly/index.htm
 
[h=1]Weekly U.S. Influenza Surveillance Report[/h]
fluview-banner2.jpg

Key Updates for Week 51, ending December 21, 2019

Seasonal influenza activity in the United States continues to increase and has been elevated for seven weeks. [h=4]Viruses[/h]
Clinical Lab
The percentage of respiratory specimens testing positive for influenza at clinical laboratories increased to 22.1% this week.

Public Health Lab
Nationally, B/Victoria viruses are most common followed by A(H1N1)pdm09 viruses. The predominant virus varies by region and age group.

Virus Characterization
Genetic and antigenic characterization and antiviral susceptibility of viruses collected in the U.S. this season are now being reported. [h=4]Illness[/h] Outpatient Illness: ILINet
Visits to health care providers for influenza-like illness (ILI) increased to 5.1%. ILI has been at or above the national baseline of 2.4% for seven weeks. All regions were at or above their baselines.

Outpatient Illness: ILI Activity Map
Flu Activity & Surveillance - Flu Activity & Surveillance week 51


The number of jurisdictions experiencing high ILI activity increased to 28 this week compared to 21 last week.

Geographic Spread
Geographic Spread week 51 - Geographic Spread


The number of jurisdictions reporting regional or widespread activity stayed the same as last week at 48. [h=4]Severe Disease[/h]
Hospitalizations
The overall hospitalization rate for the season increased to 6.6 per 100,000. This is similar to what has been seen at this time during recent seasons.

P&I Mortality
The percentage of deaths attributed to pneumonia and influenza increased to 5.7% but remains below the epidemic threshold.

Pediatric Deaths
Three new influenza-associated pediatric deaths occurring during the 2019-2020 season were reported to CDC this week. The total for the season is 22.

All data are preliminary and may change as more reports are received.

A description of the CDC influenza surveillance system, including methodology and detailed descriptions of each data component is available on the surveillance methods page.

Additional information on the current and previous influenza seasons for each surveillance component are available on FluView Interactive.

Key Points
  • The 2019-2020 season is underway; all regions of the country are seeing elevated levels of flu-like illness.
  • Activity is being caused mostly by influenza B/Victoria viruses, which is unusual for this time of year. A(H1N1) viruses are the next most common and are increasing in proportion relative to other influenza viruses in some regions.
  • CDC estimates that so far this season there have been at least 4.6 million flu illnesses, 39,000 hospitalizations and 2,100 deaths from flu.
  • It’s not too late to get vaccinated. Flu vaccination is always the best way to prevent flu and its potentially serious complications.
  • Antiviral medications are an important adjunct to flu vaccine in the control of influenza. Almost all (>99%) of the influenza viruses tested this season are susceptible to the four FDA-approved influenza antiviral medications recommended for use in the U.S. this season.
[h=2]U.S. Virologic Surveillance[/h] [h=3]Clinical Laboratories[/h]
The results of tests performed by clinical laboratories nationwide are summarized below. Data from clinical laboratories (the percentage of specimens tested that are positive for influenza) are used to monitor whether influenza activity is increasing or decreasing.
30,054358,869
6,629 (22.1%)31,350 (8.7%)
2,035 (30.7%)9,182 (29.3%)
4,594 (69.3%)22,168 (70.7%)
Week 51 Data Cumulative since
September 29, 2019
(week 40)
No. of specimens tested No. of positive specimens (%) Positive specimens by type Influenza A Influenza B
INFLUENZA Virus Isolated

View Chart Data | View Full Screen [h=3]Public Health Laboratories[/h]
The results of tests performed by public health laboratories nationwide are summarized below. Data from public health laboratories are used to monitor the proportion of circulating viruses that belong to each influenza subtype/lineage.
1,84821,741
1,0748,151
443 (41.2%)3,325 (40.8%)
386 (94.8%)2,358 (74.9%)
21 (5.2%)789 (25.1%)
36178
631 (58.8%)4,826 (59.2%)
6 (1.3%)87 (2.5%)
456 (98.7%)3,394 (97.5%)
1691,345
Week 51 Data Cumulative since September 29, 2019
(week 40)
No. of specimens tested No. of positive specimens Positive specimens by type/subtype Influenza A (H1N1)pdm09 H3N2 Subtyping not performed Influenza B Yamagata lineage Victoria lineage Lineage not performed

Nationally influenza B/Victoria viruses have been reported more frequently than other influenza viruses this season followed by A(H1N1)pdm09. The predominant virus varies by region. Regional and state level data about circulating influenza viruses can be found on FluView Interactive. The predominant virus also varies by age group. Nationally, influenza B/Victoria viruses are the most commonly reported influenza viruses among children age 0-4 years (46% of reported viruses) and 5-24 years (57% of reported viruses), while A(H1N1)pdm09 viruses are the most commonly reported influenza viruses among persons 25-64 years (41% of reported viruses). Among adults aged 65 years of age and older, approximately equal proportions of influenza A(H1N1)pdm09 and A(H3N2) viruses (38% and 37%, respectively) have been reported. Additional age data can be found on FluView Interactive.
INFLUENZA Virus Isolated

View Chart Data | View Full Screen

Additional virologic surveillance information for current and past seasons:
Surveillance Methods | FluView Interactive: National, Regional, and State Data or Age Data
[h=2]Influenza Virus Characterization[/h]
CDC performs genetic and antigenic characterization of U.S. viruses submitted from state and local health laboratories using Right Size Roadmap submission guidance. These data are used to compare how similar the currently circulating influenza viruses are to the reference viruses used for developing new influenza vaccines and to monitor evolutionary changes that continually occur in circulating influenza. CDC also tests susceptibility of influenza viruses to antiviral medications including the neuraminidase inhibitors (oseltamivir, zanamivir, and peramivir) and the PA endonuclease inhibitor baloxavir.

CDC genetically characterized 554 influenza viruses collected in the U.S. from September 29, 2019 to December 21, 2019.
143
6B.1A143 (100%)
168
3C.2a168 (100%)2a1168 (100%)
2a20
2a30
2a40
3C.3a03a0
221
V1A221 (100%)V1A0
V1A.124 (10.9%)
V1A.3197 (89.1%)
22
Y322 (100%)

Virus Subtype or Lineage Genetic Characterization
Total No. of Subtype/Lineage Tested Clade Number (% of subtype/lineage tested) Subclade Number (% of subtype/lineage tested) A/H1 A/H3 B/Victoria B/Yamagata

CDC antigenically characterizes a subset of influenza viruses by hemagglutination inhibition (HI) or neutralization based Focus Reduction assays (FRA). Antigenic drift is evaluated by comparing antigenic properties of cell-propagated reference viruses representing currently recommended vaccine components with those of cell-propagated circulating viruses. CDC antigenically characterized 148 influenza viruses collected in the United States from September 29, 2019, to December 21, 2019.

Influenza A Viruses
  • A (H1N1)pdm09: 47 A(H1N1)pdm09 viruses were antigenically characterized by HI with ferret antisera, and all were antigenically similar (reacting at titers that were within 4-fold of the homologous virus titer) to cell-propagated A/Brisbane/02/2018-like reference viruses representing the A(H1N1)pdm09 component for the 2019-20 Northern Hemisphere influenza vaccines.
  • A (H3N2): 41 A(H3N2) viruses were antigenically characterized by FRA with ferret antisera, and 14 (34.1%) were antigenically similar to cell-propagated A/Kansas/14/2017-like reference viruses representing the A(H3N2) component for the 2019-20 Northern Hemisphere influenza vaccines.


Influenza B Viruses
  • B/Victoria: 50 B/Victoria lineage viruses, including viruses from both co-circulating sub-clades, were antigenically characterized by HI with ferret antisera, and 29 (58%) were antigenically similar to cell-propagated B/Colorado/06/2017-like reference viruses representing the B/Victoria component for the 2019-20 Northern Hemisphere influenza vaccines.
  • B/Yamagata: 10 B/Yamagata lineage viruses were antigenically characterized by HI with ferret antisera, and all 10 (100%) were antigenically similar to cell-propagated B/Phuket/3073/2013-like reference viruses representing the B/Yamagata component for the 2019-20 Northern Hemisphere influenza vaccines.


CDC assesses susceptibility of influenza viruses to the antiviral medications oseltamivir, zanamivir, peramivir, and baloxavir using next generation sequence analysis supplemented by laboratory assays. Viruses collected in the United States since September 29, 2019, were tested for antiviral susceptibility as follows:
54614216621622
(0.0%)(0.0%)(0.0%)(0.0%)(0.0%)
1 (0.2%)1 (0.7%)(0.0%)(0.0%)(0.0%)
54614216621622
(0.0%)(0.0%)(0.0%)(0.0%)(0.0%)
1 (0.2%)1 (0.7%)(0.0%)(0.0%)(0.0%)
54614216621622
1 (0.2%)(0.0%)(0.0%)1 (0.5%)(0.0%)
(0.0%)(0.0%)(0.0%)(0.0%)(0.0%)
54614416421622
(0.0%)(0.0%)(0.0%)(0.0%)(0.0%)

Antiviral Medication Total Viruses A/H1 A/H3 B/Victoria B/Yamagata Neuraminidase Inhibitors Oseltamivir Viruses Tested Reduced Inhibition Highly Reduced Inhibition Peramivir Viruses Tested Reduced Inhibition
Highly Reduced Inhibition Zanamivir Viruses Tested Reduced Inhibition
Highly Reduced Inhibition PA Endonuclease Inhibitor
Baloxavir Viruses Tested
Reduced Susceptibility

[h=2]Outpatient Illness Surveillance[/h] [h=3]ILINet[/h]
Nationwide during week 51, 5.1% of patient visits reported through the U.S. Outpatient Influenza-like Illness Surveillance Network (ILINet) were due to influenza-like illness (ILI). This percentage is above the national baseline of 2.4%.
national levels of ILI and ARI

View Chart Data | View Full Screen

On a regional level, the percentage of outpatient visits for ILI ranged from 2.5% to 10.0% during week 51. All regions reported a percentage of outpatient visits for ILI which is equal to or above their region-specific baselines. [h=3]ILI Activity Map[/h]
Data collected in ILINet are used to produce a measure of ILI activity* by state.

During week 51, the following ILI activity levels were experienced:
  • High – District of Columbia, Puerto Rico, New York City, and 25 states (Alabama, Arizona, Colorado, Connecticut, Georgia, Illinois, Indiana, Kansas, Kentucky, Louisiana, Maryland, Minnesota, Mississippi, Nebraska, New Jersey, New Mexico, North Carolina, Oklahoma, Oregon, South Carolina, Tennessee, Texas, Virginia, Washington, and Wisconsin)
  • Moderate – six states (California, Massachusetts, New York, Pennsylvania, Utah, and West Virginia)
  • Low – nine states (Arkansas, Hawaii, Iowa, Maine, Michigan, Nevada, Rhode Island, South Dakota, and Wyoming)
  • Minimal – six states (Delaware, Missouri, Montana, New Hampshire, Ohio, and Vermont)
  • Data were insufficient to calculate an ILI activity level from the U.S. Virgin Islands and four states (Alaska, Florida, Idaho, and North Dakota).
[SIZE=-1]*Data collected in ILINet may disproportionally represent certain populations within a state, and therefore, may not accurately depict the full picture of influenza activity for the whole state. Differences in the data presented here by CDC and independently by some state health departments likely represent differing levels of data completeness with data presented by the state likely being the more complete.[/SIZE]


Additional information about medically attended visits for ILI for current and past seasons:
Surveillance Methods | FluView Interactive: National, Regional, and State Data or ILI Activity Map


[h=2]Geographic Spread of Influenza as Assessed by State and Territorial Epidemiologists[/h]
The influenza activity reported by state and territorial epidemiologists indicates geographic spread of influenza viruses but does not measure the severity of influenza activity.

During week 51 the following influenza activity was reported:
  • Widespread – 39 states (Alabama, Alaska, Arizona, Arkansas, California, Colorado, Connecticut, Delaware, Florida, Georgia, Idaho, Illinois, Indiana, Iowa, Kentucky, Louisiana, Maryland, Massachusetts, Minnesota, Mississippi, Montana, Nebraska, Nevada, New Jersey, New Mexico, New York, North Carolina, Ohio, Oklahoma, Oregon, Pennsylvania, Rhode Island, South Carolina, Tennessee, Texas, Virginia, Washington, West Virginia and Wyoming)
  • Regional – nine states (Kansas, Maine, Michigan, Missouri, New Hampshire, North Dakota, South Dakota, Utah, and Wisconsin)
  • Local – the District of Columbia and two states (Hawaii and Vermont)
  • Sporadic – the U.S. Virgin Islands
  • Guam and Puerto Rico did not report.
Additional geographic spread surveillance information for current and past seasons:
Surveillance Methods | FluView Interactive

[h=2]Influenza-Associated Hospitalizations[/h]
The Influenza Hospitalization Surveillance Network (FluSurv-NET) conducts population-based surveillance for laboratory-confirmed influenza-related hospitalizations in select counties in the Emerging Infections Program (EIP) states and Influenza Hospitalization Surveillance Project (IHSP) states.

A total of 1,931 laboratory-confirmed influenza-associated hospitalizations were reported by FluSurv-NET sites between October 1, 2019 and December 21, 2019. The overall hospitalization rate was 6.6 per 100,000 population. The highest rate of hospitalization was among adults aged ≥65 (14.4 per 100,000 population), followed by children aged 0-4 (12.5 per 100,000 population) and adults aged 50-64 (7.0 per 100,000 population). Among 1,931 hospitalizations, 1,021 (52.9%) were associated with influenza A virus, 896 (46.4%) with influenza B virus, 8 (0.4%) with influenza A virus and influenza B virus co-infection, and 6 (0.3%) with influenza virus for which the type was not determined. Among those with influenza A subtype information, 164 (74.5%) were A(H1N1)pdm09 virus and 56 (25.5%) were A(H3N2).

Click on graph to launch interactive tool
View Full Screen

Additional hospitalization surveillance information for current and past seasons and additional age groups:
Surveillance Methods | FluView Interactive


[h=2]Pneumonia and Influenza (P&I) Mortality Surveillance[/h]
Based on National Center for Health Statistics (NCHS) mortality surveillance data available on December 26, 2019, 5.7% of the deaths occurring during the week ending December 14, 2019 (week 50) were due to P&I. This percentage is below the epidemic threshold of 6.7% for week 50.
INFLUENZA Virus Isolated

View Chart Data | View Full Screen

Additional pneumonia and influenza mortality surveillance information for current and past seasons:
Surveillance Methods | FluView Interactive


[h=2]Influenza-Associated Pediatric Mortality[/h]
Three influenza-associated pediatric deaths occurring in weeks 49 (the week ending December 7, 2019) and 51 (the week ending December 21, 2019) were reported to CDC during week 51. All three were associated with influenza B viruses.

A total of 22 influenza-associated pediatric deaths occurring during the 2019-2020 season have been reported to CDC.
  • Sixteen deaths were associated with influenza B viruses. Five of these had the lineage determined and all were B/Victoria viruses.
  • Six deaths were associated with influenza A viruses. Four of these had subtyping performed and all were A(H1N1)pdm09 viruses.
Click on image to launch interactive tool

View Full Screen

Additional pediatric mortality surveillance information for current and past seasons:
Surveillance Methods | FluView Interactive


[h=2]Additional National and International Influenza Surveillance Information[/h]

FluView Interactive: FluView includes enhanced web-based interactive applications that can provide dynamic visuals of the influenza data collected and analyzed by CDC. These FluView Interactive applications allow people to create customized, visual interpretations of influenza data, as well as make comparisons across flu seasons, regions, age groups and a variety of other demographics. To access these tools, visit http://www.cdc.gov/flu/weekly/fluviewinteractive.htm

National Institute for Occupational Safety and Health: Monthly surveillance data on the prevalence of health-related workplace absenteeism among full-time workers in the United States are available from NIOSH at https://www.cdc.gov/niosh/topics/absences/default.html

U.S. State and local influenza surveillance:Select a jurisdiction below to access the latest local influenza information


[TD="width: 139"] Alabama [/TD]
[TD="width: 139"] Alaska [/TD]
[TD="width: 139"] Arizona [/TD]
[TD="width: 139"] Arkansas [/TD]
[TD="width: 139"] California [/TD]

[TD="width: 139"] Colorado [/TD]
[TD="width: 139"] Connecticut [/TD]
[TD="width: 139"] Delaware [/TD]
[TD="width: 139"] District of Columbia [/TD]
[TD="width: 139"] Florida [/TD]

[TD="width: 139"] Georgia [/TD]
[TD="width: 139"] Hawaii [/TD]
[TD="width: 139"] Idaho [/TD]
[TD="width: 139"] Illinois [/TD]
[TD="width: 139"] Indiana [/TD]

[TD="width: 139"] Iowa [/TD]
[TD="width: 139"] Kansas [/TD]
[TD="width: 139"] Kentucky [/TD]
[TD="width: 139"] Louisiana [/TD]
[TD="width: 139"] Maine [/TD]

[TD="width: 139"] Maryland [/TD]
[TD="width: 139"] Massachusetts [/TD]
[TD="width: 139"] Michigan [/TD]
[TD="width: 139"] Minnesota [/TD]
[TD="width: 139"] Mississippi [/TD]

[TD="width: 139"] Missouri [/TD]
[TD="width: 139"] Montana [/TD]
[TD="width: 139"] Nebraska [/TD]
[TD="width: 139"] Nevada [/TD]
[TD="width: 139"] New Hampshire [/TD]

[TD="width: 139"] New Jersey [/TD]
[TD="width: 139"] New Mexico [/TD]
[TD="width: 139"] New York [/TD]
[TD="width: 139"] North Carolina [/TD]
[TD="width: 139"] North Dakota [/TD]

[TD="width: 139"] Ohio [/TD]
[TD="width: 139"] Oklahoma [/TD]
[TD="width: 139"] Oregon [/TD]
[TD="width: 139"] Pennsylvania [/TD]
[TD="width: 139"] Rhode Island [/TD]

[TD="width: 139"] South Carolina [/TD]
[TD="width: 139"] South Dakota [/TD]
[TD="width: 139"] Tennessee [/TD]
[TD="width: 139"] Texas [/TD]
[TD="width: 139"] Utah [/TD]

[TD="width: 139"] Vermont [/TD]
[TD="width: 139"] Virginia [/TD]
[TD="width: 139"] Washington [/TD]
[TD="width: 139"] West Virginia [/TD]
[TD="width: 139"] Wisconsin [/TD]

[TD="width: 139"] Wyoming [/TD]
[TD="width: 139"] New York City [/TD]
[TD="width: 139"] Puerto Rico [/TD]
[TD="width: 139"] Virgin Islands [/TD]
[TD="width: 139"] [/TD]


World Health Organization: Additional influenza surveillance information from participating WHO member nations is available through FluNet and the Global Epidemiology Reports.

WHO Collaborating Centers for Influenza located in Australia, China, Japan, the United Kingdom, and the United States (CDC in Atlanta, Georgia).

Europe: For the most recent influenza surveillance information from Europe, please see WHO/Europe and the European Centre for Disease Prevention and Control at http://www.flunewseurope.org/.

Public Health Agency of Canada: The most up-to-date influenza information from Canada is available at http://www.phac-aspc.gc.ca/fluwatch/

Public Health England: The most up-to-date influenza information from the United Kingdom is available at https://www.gov.uk/government/statistics/weekly-national-flu-reports


Any links provided to non-Federal organizations are provided solely as a service to our users. These links do not constitute an endorsement of these organizations or their programs by CDC or the Federal Government, and none should be inferred. CDC is not responsible for the content of the individual organization web pages found at these links.


An overview of the CDC influenza surveillance system, including methodology and detailed descriptions of each data component, is available at: http://www.cdc.gov/flu/weekly/overview.htm.

--------------------------------------------------------------------------------


Page last reviewed: December 27, 2019, 11:30 AM
Content source: Centers for Disease Control and Prevention, National Center for Immunization and Respiratory Diseases (NCIRD)
https://www.cdc.gov/flu/weekly/index.htm
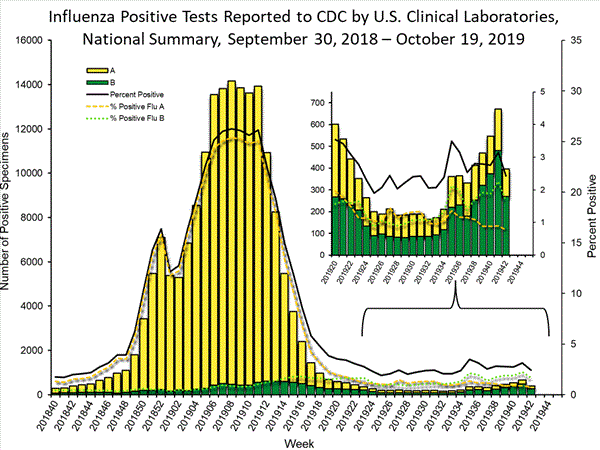
 
[h=1]Weekly U.S. Influenza Surveillance Report[/h]
fluview-banner2.jpg

Key Updates for Week 52, ending December 28, 2019

Seasonal influenza activity in the United States is high and continues to increase. Activity has been elevated for eight weeks. [h=4]Viruses[/h]
Clinical Labs
The percentage of respiratory specimens testing positive for influenza at clinical laboratories increased from 23.0% last week to 26.3% this week.

Public Health Labs
Nationally, B/Victoria viruses are most common followed by A(H1N1)pdm09 viruses. The predominant virus varies by region and age group. There is low circulation of A(H3N2) and B/Yamagata viruses.

Virus Characterization
Genetic and antigenic characterization and antiviral susceptibility of influenza viruses collected in the U.S. this season is summarized in this report. [h=4]Illness[/h] Outpatient Illness: ILINet
Visits to health care providers for influenza-like illness (ILI) increased from 5.1% last week to 6.9% this week. All regions were above their baselines and continuing to increase.

Outpatient Illness: ILI Activity Map
Flu Activity & Surveillance


The number of jurisdictions experiencing high ILI activity increased to 37 this week compared to 28 last week.

Geographic Spread
Spread map 52


The number of jurisdictions reporting regional or widespread influenza activity increased to 50 this week compared to 48 last week. [h=4]Severe Disease[/h]
Hospitalizations
The overall hospitalization rate for the season increased to 9.2 per 100,000. This is similar to what has been seen at this time during recent seasons.

P&I Mortality
The percentage of deaths attributed to pneumonia and influenza is 5.5% which is below the epidemic threshold.

Pediatric Deaths
Five new influenza-associated pediatric deaths occurring during the 2019-2020 season were reported this week. The total for the season is 27.

All data are preliminary and may change as more reports are received.

A description of the CDC influenza surveillance system, including methodology and detailed descriptions of each data component is available on the surveillance methods page.

Additional information on the current and previous influenza seasons for each surveillance component are available on FluView Interactive.

Key Points
  • Influenza activity is high nationally with outpatient visits for ILI and the percentage of respiratory specimens testing positive for influenza at levels similar to what have been seen at the peak of recent seasons. However, this week’s data may in part be influenced by changes in healthcare seeking behavior that can occur during the holidays.
  • Influenza B/Victoria viruses are predominant nationally, which is unusual for this time of year. A(H1N1)pdm09 viruses are the next most common. A(H3N2) and B/Yamagata viruses are circulating at very low levels.
  • CDC estimates that so far this season there have been at least 6.4 million flu illnesses, 55,000 hospitalizations and 2,900 deaths from flu.
  • It’s not too late to get vaccinated. Flu vaccination is always the best way to prevent flu and its potentially serious complications.
  • Antiviral medications are an important adjunct to flu vaccine in the control of influenza. Almost all (>99%) of the influenza viruses tested this season are susceptible to the four FDA-approved influenza antiviral medications recommended for use in the U.S. this season.
[h=2]U.S. Virologic Surveillance[/h] [h=3]Clinical Laboratories[/h]
The results of tests performed by clinical laboratories nationwide are summarized below. Data from clinical laboratories (the percentage of specimens tested that are positive for influenza) are used to monitor whether influenza activity is increasing or decreasing.
45,749450,253
12,016 (26.3%)55,251 (12.3%)
3,859 (32.1%)16,247 (29.4%)
8,157 (67.9%)39,004 (70.6%)
Week 52 Data Cumulative since
September 29, 2019
(week 40)
No. of specimens tested No. of positive specimens (%) Positive specimens by type Influenza A Influenza B
INFLUENZA Virus Isolated

View Chart Data | View Full Screen [h=3]Public Health Laboratories[/h]
The results of tests performed by public health laboratories nationwide are summarized below. Data from public health laboratories are used to monitor the proportion of circulating viruses that belong to each influenza subtype/lineage.
1,61824,350
1,17210,034
474 (40.4%)4,090 (40.8%)
387 (91.3%)3,028 (78.1%)
37 (8.7%)849 (21.9%)
50213
698 (59.6%)5,944 (59.2%)
2 (0.4%)95 (2.1%)
548 (99.6%)4,342 (97.9%)
1481,507
Week 52 Data Cumulative since September 29, 2019
(week 40)
No. of specimens tested No. of positive specimens Positive specimens by type/subtype Influenza A (H1N1)pdm09 H3N2 Subtyping not performed Influenza B Yamagata lineage Victoria lineage Lineage not performed

Nationally influenza B/Victoria viruses have been reported more frequently than other influenza viruses this season followed by A(H1N1)pdm09. The predominant virus varies by region. Regional and state level data about circulating influenza viruses can be found on FluView Interactive. The predominant virus also varies by age group. Nationally, influenza B/Victoria viruses are the most commonly reported influenza viruses among children age 0-4 years (48% of reported viruses) and 5-24 years (59% of reported viruses), while A(H1N1)pdm09 viruses are the most commonly reported influenza viruses among persons 25-64 years (42% of reported viruses) and 65 years of age and older (43% of reported viruses). Additional age data can be found on FluView Interactive.
INFLUENZA Virus Isolated

View Chart Data | View Full Screen

Additional virologic surveillance information for current and past seasons:
Surveillance Methods | FluView Interactive: National, Regional, and State Data or Age Data
[h=2]Influenza Virus Characterization[/h]
CDC performs genetic and antigenic characterization of U.S. viruses submitted from state and local health laboratories using Right Size Roadmap submission guidance. These data are used to compare how similar the currently circulating influenza viruses are to the reference viruses used for developing new influenza vaccines and to monitor evolutionary changes that continually occur in circulating influenza. CDC also tests susceptibility of influenza viruses to antiviral medications including the neuraminidase inhibitors (oseltamivir, zanamivir, and peramivir) and the PA endonuclease inhibitor baloxavir.

CDC genetically characterized 714 influenza viruses collected in the U.S. from September 29, 2019, to December 28, 2019.
205
6B.1A205 (100%)
189
3C.2a189 (100%)2a1189 (100%)
2a20
2a30
2a40
3C.3a03a0
295
V1A295 (100%)V1A0
V1A.131 (10.5%)
V1A.3264 (89.5%)
25
Y325 (100%)

Virus Subtype or Lineage Genetic Characterization
Total No. of Subtype/Lineage Tested Clade Number (% of subtype/lineage tested) Subclade Number (% of subtype/lineage tested) A/H1 A/H3 B/Victoria B/Yamagata

CDC antigenically characterizes a subset of influenza viruses by hemagglutination inhibition (HI) or neutralization based Focus Reduction assays (FRA). Antigenic drift is evaluated by comparing antigenic properties of cell-propagated reference viruses representing currently recommended vaccine components with those of cell-propagated circulating viruses. CDC antigenically characterized 167 influenza viruses collected in the United States from September 29, 2019, to December 28, 2019.

Influenza A Viruses
  • A (H1N1)pdm09: 66 A(H1N1)pdm09 viruses were antigenically characterized by HI with ferret antisera, and all were antigenically similar (reacting at titers that were within 4-fold of the homologous virus titer) to cell-propagated A/Brisbane/02/2018-like reference viruses representing the A(H1N1)pdm09 component for the 2019-20 Northern Hemisphere influenza vaccines.
  • A (H3N2): 41 A(H3N2) viruses were antigenically characterized by FRA with ferret antisera, and 14 (34.1%) were antigenically similar to cell-propagated A/Kansas/14/2017-like reference viruses representing the A(H3N2) component for the 2019-20 Northern Hemisphere influenza vaccines.


Influenza B Viruses
  • B/Victoria: 50 B/Victoria lineage viruses, including viruses from both co-circulating sub-clades, were antigenically characterized by HI with ferret antisera, and 29 (58%) were antigenically similar to cell-propagated B/Colorado/06/2017-like reference viruses representing the B/Victoria component for the 2019-20 Northern Hemisphere influenza vaccines.
  • B/Yamagata: 10 B/Yamagata lineage viruses were antigenically characterized by HI with ferret antisera, and all 10 (100%) were antigenically similar to cell-propagated B/Phuket/3073/2013-like reference viruses representing the B/Yamagata component for the 2019-20 Northern Hemisphere influenza vaccines.


CDC assesses susceptibility of influenza viruses to the antiviral medications oseltamivir, zanamivir, peramivir, and baloxavir using next generation sequence analysis supplemented by laboratory assays. Viruses collected in the United States since September 29, 2019, were tested for antiviral susceptibility as follows:
70720418529325
(0.0%)(0.0%)(0.0%)(0.0%)(0.0%)
1 (0.1%)1 (0.5%)(0.0%)(0.0%)(0.0%)
70720418529325
(0.0%)(0.0%)(0.0%)(0.0%)(0.0%)
1 (0.1%)1 (0.5%)(0.0%)(0.0%)(0.0%)
70720418529325
1 (0.1%)(0.0%)(0.0%)1 (0.3%)(0.0%)
(0.0%)(0.0%)(0.0%)(0.0%)(0.0%)
72720819529826
(0.0%)(0.0%)(0.0%)(0.0%)(0.0%)

Antiviral Medication Total Viruses A/H1 A/H3 B/Victoria B/Yamagata Neuraminidase Inhibitors Oseltamivir Viruses Tested Reduced Inhibition Highly Reduced Inhibition Peramivir Viruses Tested Reduced Inhibition
Highly Reduced Inhibition Zanamivir Viruses Tested Reduced Inhibition
Highly Reduced Inhibition PA Endonuclease Inhibitor
Baloxavir Viruses Tested
Reduced Susceptibility

[h=2]Outpatient Illness Surveillance[/h] [h=3]ILINet[/h]
Nationwide during week 52, 6.9% of patient visits reported through the U.S. Outpatient Influenza-like Illness Surveillance Network (ILINet) were due to influenza-like illness (ILI). This percentage is above the national baseline of 2.4%. The increase in the percentage of patient visits for ILI during week 52 compared to week 51 may be influenced in part by a reduction in routine healthcare visits surrounding the holidays occurring during week 52 as has occurred during previous seasons.
national levels of ILI and ARI

View Chart Data | View Full Screen

On a regional level, the percentage of outpatient visits for ILI ranged from 3.8% to 13.9% during week 52. All regions reported a percentage of outpatient visits for ILI which is equal to or above their region-specific baselines. [h=3]ILI Activity Map[/h]
Data collected in ILINet are used to produce a measure of ILI activity* by state.

During week 52, the following ILI activity levels were experienced:
  • High – the District of Columbia, New York City, Puerto Rico, and 34 states (Alabama, Alaska, Arizona, Arkansas, California, Colorado, Connecticut, Georgia, Illinois, Indiana, Iowa, Kansas, Kentucky, Louisiana, Maryland, Massachusetts, Mississippi, Nebraska, New Jersey, New Mexico, New York, North Carolina, North Dakota, Oklahoma, Oregon, Pennsylvania, South Carolina, Tennessee, Texas, Utah, Virginia, Washington, West Virginia, and Wisconsin)
  • Moderate – nine states (Florida, Maine, Minnesota, New Hampshire, Ohio, Rhode Island, South Dakota, Vermont, and Wyoming)
  • Low – five states (Hawaii, Michigan, Missouri, Montana, and Nevada)
  • Minimal – two states (Delaware and Idaho)
  • Data were insufficient to calculate an ILI activity level from the U.S. Virgin Islands.
[SIZE=-1]*Data collected in ILINet may disproportionally represent certain populations within a state, and therefore, may not accurately depict the full picture of influenza activity for the whole state. Differences in the data presented here by CDC and independently by some state health departments likely represent differing levels of data completeness with data presented by the state likely being the more complete.[/SIZE]


Additional information about medically attended visits for ILI for current and past seasons:
Surveillance Methods | FluView Interactive: National, Regional, and State Data or ILI Activity Map


[h=2]Geographic Spread of Influenza as Assessed by State and Territorial Epidemiologists[/h]
The influenza activity reported by state and territorial epidemiologists indicates geographic spread of influenza viruses but does not measure the severity of influenza activity.

During week 52 the following influenza activity was reported:
  • Widespread – Puerto Rico and 45 states (Alabama, Alaska, Arizona, Arkansas, California, Colorado, Connecticut, Delaware, Florida, Georgia, Idaho, Illinois, Indiana, Iowa, Kentucky, Louisiana, Maryland, Massachusetts, Michigan, Minnesota, Mississippi, Missouri, Montana, Nebraska, Nevada, New Hampshire, New Jersey, New Mexico, New York, North Carolina, Ohio, Oklahoma, Oregon, Pennsylvania, Rhode Island, South Carolina, South Dakota, Tennessee, Texas, Utah, Virginia, Washington, West Virginia, Wisconsin and Wyoming)
  • Regional – four states (Kansas, Maine, North Dakota, and Vermont)
  • Local – the District of Columbia and one state (Hawaii)
  • Sporadic – the U.S. Virgin Islands
  • Guam did not report.
Additional geographic spread surveillance information for current and past seasons:
Surveillance Methods | FluView Interactive

[h=2]Influenza-Associated Hospitalizations[/h]
The Influenza Hospitalization Surveillance Network (FluSurv-NET) conducts population-based surveillance for laboratory-confirmed influenza-related hospitalizations in select counties in the Emerging Infections Program (EIP) states and Influenza Hospitalization Surveillance Project (IHSP) states.

A total of 2,667 laboratory-confirmed influenza-associated hospitalizations were reported by FluSurv-NET sites between October 1, 2019 and December 28, 2019. The overall hospitalization rate was 9.2 per 100,000 population. The highest rate of hospitalization was among adults aged ≥65 (19.9 per 100,000 population), followed by children aged 0-4 (17.8 per 100,000 population) and adults aged 50-64 (10.0 per 100,000 population). Among 2,667 hospitalizations, 1,374 (51.5%) were associated with influenza A virus, 1,274 (47.8%) with influenza B virus, 10 (0.4%) with influenza A virus and influenza B virus co-infection, and 9 (0.3%) with influenza virus for which the type was not determined. Among those with influenza A subtype information, 259 (80.7%) were A(H1N1)pdm09 and 62 (19.3%) were A(H3N2) viruses.

Click on graph to launch interactive tool
View Full Screen

Additional hospitalization surveillance information for current and past seasons and additional age groups:
Surveillance Methods | FluView Interactive


[h=2]Pneumonia and Influenza (P&I) Mortality Surveillance[/h]
Based on National Center for Health Statistics (NCHS) mortality surveillance data available on January 2, 2020, 5.5% of the deaths occurring during the week ending December 21, 2019 (week 51) were due to P&I. This percentage is below the epidemic threshold of 6.8% for week 51.
INFLUENZA Virus Isolated

View Chart Data | View Full Screen

Additional pneumonia and influenza mortality surveillance information for current and past seasons:
Surveillance Methods | FluView Interactive


[h=2]Influenza-Associated Pediatric Mortality[/h]
Five influenza-associated pediatric deaths occurring in weeks 50 (the week ending December 14, 2019) and 51 (the week ending December 21, 2019) were reported to CDC during week 52. Three were associated with influenza A viruses and two were associated with influenza B viruses.

A total of 27 influenza-associated pediatric deaths occurring during the 2019-2020 season have been reported to CDC.
  • Eighteen deaths were associated with influenza B viruses. Five of these had the lineage determined and all were B/Victoria viruses.
  • Nine deaths were associated with influenza A viruses. Four of these had subtyping performed and all were A(H1N1)pdm09 viruses.
Click on image to launch interactive tool

View Full Screen

Additional pediatric mortality surveillance information for current and past seasons:
Surveillance Methods | FluView Interactive


[h=2]Additional National and International Influenza Surveillance Information[/h]

FluView Interactive: FluView includes enhanced web-based interactive applications that can provide dynamic visuals of the influenza data collected and analyzed by CDC. These FluView Interactive applications allow people to create customized, visual interpretations of influenza data, as well as make comparisons across flu seasons, regions, age groups and a variety of other demographics. To access these tools, visit http://www.cdc.gov/flu/weekly/fluviewinteractive.htm

National Institute for Occupational Safety and Health: Monthly surveillance data on the prevalence of health-related workplace absenteeism among full-time workers in the United States are available from NIOSH at https://www.cdc.gov/niosh/topics/absences/default.html

U.S. State and local influenza surveillance:Select a jurisdiction below to access the latest local influenza information


[TD="width: 139"] Alabama [/TD]
[TD="width: 139"] Alaska [/TD]
[TD="width: 139"] Arizona [/TD]
[TD="width: 139"] Arkansas [/TD]
[TD="width: 139"] California [/TD]

[TD="width: 139"] Colorado [/TD]
[TD="width: 139"] Connecticut [/TD]
[TD="width: 139"] Delaware [/TD]
[TD="width: 139"] District of Columbia [/TD]
[TD="width: 139"] Florida [/TD]

[TD="width: 139"] Georgia [/TD]
[TD="width: 139"] Hawaii [/TD]
[TD="width: 139"] Idaho [/TD]
[TD="width: 139"] Illinois [/TD]
[TD="width: 139"] Indiana [/TD]

[TD="width: 139"] Iowa [/TD]
[TD="width: 139"] Kansas [/TD]
[TD="width: 139"] Kentucky [/TD]
[TD="width: 139"] Louisiana [/TD]
[TD="width: 139"] Maine [/TD]

[TD="width: 139"] Maryland [/TD]
[TD="width: 139"] Massachusetts [/TD]
[TD="width: 139"] Michigan [/TD]
[TD="width: 139"] Minnesota [/TD]
[TD="width: 139"] Mississippi [/TD]

[TD="width: 139"] Missouri [/TD]
[TD="width: 139"] Montana [/TD]
[TD="width: 139"] Nebraska [/TD]
[TD="width: 139"] Nevada [/TD]
[TD="width: 139"] New Hampshire [/TD]

[TD="width: 139"] New Jersey [/TD]
[TD="width: 139"] New Mexico [/TD]
[TD="width: 139"] New York [/TD]
[TD="width: 139"] North Carolina [/TD]
[TD="width: 139"] North Dakota [/TD]

[TD="width: 139"] Ohio [/TD]
[TD="width: 139"] Oklahoma [/TD]
[TD="width: 139"] Oregon [/TD]
[TD="width: 139"] Pennsylvania [/TD]
[TD="width: 139"] Rhode Island [/TD]

[TD="width: 139"] South Carolina [/TD]
[TD="width: 139"] South Dakota [/TD]
[TD="width: 139"] Tennessee [/TD]
[TD="width: 139"] Texas [/TD]
[TD="width: 139"] Utah [/TD]

[TD="width: 139"] Vermont [/TD]
[TD="width: 139"] Virginia [/TD]
[TD="width: 139"] Washington [/TD]
[TD="width: 139"] West Virginia [/TD]
[TD="width: 139"] Wisconsin [/TD]

[TD="width: 139"] Wyoming [/TD]
[TD="width: 139"] New York City [/TD]
[TD="width: 139"] Puerto Rico [/TD]
[TD="width: 139"] Virgin Islands [/TD]
[TD="width: 139"] [/TD]


World Health Organization: Additional influenza surveillance information from participating WHO member nations is available through FluNet and the Global Epidemiology Reports.

WHO Collaborating Centers for Influenza located in Australia, China, Japan, the United Kingdom, and the United States (CDC in Atlanta, Georgia).

Europe: For the most recent influenza surveillance information from Europe, please see WHO/Europe and the European Centre for Disease Prevention and Control at http://www.flunewseurope.org/.

Public Health Agency of Canada: The most up-to-date influenza information from Canada is available at http://www.phac-aspc.gc.ca/fluwatch/

Public Health England: The most up-to-date influenza information from the United Kingdom is available at https://www.gov.uk/government/statistics/weekly-national-flu-reports


Any links provided to non-Federal organizations are provided solely as a service to our users. These links do not constitute an endorsement of these organizations or their programs by CDC or the Federal Government, and none should be inferred. CDC is not responsible for the content of the individual organization web pages found at these links.


An overview of the CDC influenza surveillance system, including methodology and detailed descriptions of each data component, is available at: http://www.cdc.gov/flu/weekly/overview.htm.

--------------------------------------------------------------------------------


Page last reviewed: January 3, 2020, 11:00 AM
Content source: Centers for Disease Control and Prevention, National Center for Immunization and Respiratory Diseases (NCIRD)Seasonal Influenza (Flu)
What CDC Does
email_03Get Email Updates

To receive weekly email updates about Seasonal Flu, enter your email address: Email Address
What's this?
Submit
H1N1 Flu Pandemic 2009-2019: A Decade Later - H1N1 Flu Pandemic 2009-2019: A Decade Later

Influenza Types
https://www.cdc.gov/flu/weekly/index.htm
 
[h=1]Weekly U.S. Influenza Surveillance Report[/h]
fluview-banner2.jpg

Key Updates for Week 1, ending January 4, 2020

Key indicators that track flu activity remain high, but indicators that track severity (hospitalizations and deaths) are not high at this point in the season. [h=4]Viruses[/h]
Clinical Labs
The percentage of respiratory specimens testing positive for influenza at clinical laboratories decreased from 26.4% last week to 23.3% this week.

Public Health Labs
Nationally, B/Victoria viruses are most common followed by A(H1N1)pdm09 viruses. The predominant virus varies by region and age group. There is low circulation of A(H3N2) and B/Yamagata viruses.

Virus Characterization
Genetic and antigenic characterization and antiviral susceptibility of influenza viruses collected in the U.S. this season is summarized in this report. [h=4]Illness[/h] Outpatient Illness: ILINet
Visits to health care providers for influenza-like illness (ILI) decreased from 7.0% last week to 5.8% this week. All regions remain above their baselines.

Outpatient Illness: ILI Activity Map
Flu Activity & Surveillance - Flu Activity & Surveillance


The number of jurisdictions experiencing high ILI activity decreased from 37 last week to 36 this week.

Geographic Spread
spread map 2001 - spread map


The number of jurisdictions reporting regional or widespread influenza activity increased to 50 this week compared to 48 last week. [h=4]Severe Disease[/h]
Hospitalizations
The overall hospitalization rate for the season increased to 14.6 per 100,000. This is similar to what has been seen at this time during recent seasons.

P&I Mortality
The percentage of deaths attributed to pneumonia and influenza is 5.8% which is below the epidemic threshold.

Pediatric Deaths
Five new influenza-associated pediatric deaths occurring during the 2019-2020 season were reported this week. The total for the season is 32.

All data are preliminary and may change as more reports are received.

A description of the CDC influenza surveillance system, including methodology and detailed descriptions of each data component is available on the surveillance methods page.

Additional information on the current and previous influenza seasons for each surveillance component are available on FluView Interactive.

Key Points
  • Levels of outpatient ILI remain elevated; however hospitalization rates and percent of deaths due to pneumonia and influenza remain low. This is likely due to the predominance of influenza B/Victoria and influenza A(H1N1)pdm09 viruses which are more likely to affect children and younger adults than the elderly. Because the majority of hospitalizations and deaths occur among people age 65 and older, with fewer illnesses among that group, we expect, on a population level, to see less impact in flu-related hospitalizations and deaths.
  • The decline in outpatient ILI and laboratory data this week may in part be influenced by changes in healthcare seeking behavior and influenza virus transmission that can occur during the holidays. It is too early to know whether the season has peaked or if flu activity will increase into January.
  • CDC estimates that so far this season there have been at least 9.7 million flu illnesses, 87,000 hospitalizations and 4,800 deaths from flu.
  • It’s not too late to get vaccinated. Flu vaccination is always the best way to prevent flu and its potentially serious complications.
  • Antiviral medications are an important adjunct to flu vaccine in the control of influenza. Almost all (>99%) of the influenza viruses tested this season are susceptible to the four FDA-approved influenza antiviral medications recommended for use in the U.S. this season.
[h=2]U.S. Virologic Surveillance[/h] [h=3]Clinical Laboratories[/h]
The results of tests performed by clinical laboratories nationwide are summarized below. Data from clinical laboratories (the percentage of specimens tested that are positive for influenza) are used to monitor whether influenza activity is increasing or decreasing.
49,194493,875
11,459 (23.3%)63,975 (13.0%)
4,202 (36.7%)20,240 (31.6%)
7,257 (63.3%)43,735 (68.4%)
Week 1 Data Cumulative since
September 29, 2019
(week 40)
No. of specimens tested No. of positive specimens (%) Positive specimens by type Influenza A Influenza B
INFLUENZA Virus Isolated

View Chart Data | View Full Screen [h=3]Public Health Laboratories[/h]
The results of tests performed by public health laboratories nationwide are summarized below. Data from public health laboratories are used to monitor the proportion of circulating viruses that belong to each influenza subtype/lineage.
1,45928,292
94112,530
487 (51.8%)5,267 (42.0%)
411 (92.8%)4,127 (81.7%)
32 (7.2%)927 (18.3%)
44213
454 (48.2%)7,263 (58.0%)
3 (1.0%)116 (2.2%)
306 (99.0%)5,204 (97.8%)
1451,943
Week 1 Data Cumulative since September 29, 2019
(week 40)
No. of specimens tested No. of positive specimens Positive specimens by type/subtype Influenza A (H1N1)pdm09 H3N2 Subtyping not performed Influenza B Yamagata lineage Victoria lineage Lineage not performed

Nationally influenza B/Victoria viruses have been reported more frequently than other influenza viruses this season followed by A(H1N1)pdm09. The predominant virus varies by region. Regional and state level data about circulating influenza viruses can be found on FluView Interactive. The predominant virus also varies by age group. Nationally, influenza B/Victoria viruses are the most commonly reported influenza viruses among children age 0-4 years (46% of reported viruses) and 5-24 years (58% of reported viruses), while A(H1N1)pdm09 viruses are the most commonly reported influenza viruses among persons 25-64 years (45% of reported viruses) and 65 years of age and older (48% of reported viruses). Additional age data can be found on FluView Interactive.
INFLUENZA Virus Isolated

View Chart Data | View Full Screen

Additional virologic surveillance information for current and past seasons:
Surveillance Methods | FluView Interactive: National, Regional, and State Data or Age Data
[h=2]Influenza Virus Characterization[/h]
CDC performs genetic and antigenic characterization of U.S. viruses submitted from state and local health laboratories using Right Size Roadmap submission guidance. These data are used to compare how similar the currently circulating influenza viruses are to the reference viruses used for developing new influenza vaccines and to monitor evolutionary changes that continually occur in circulating influenza. CDC also tests susceptibility of influenza viruses to antiviral medications including the neuraminidase inhibitors (oseltamivir, zanamivir, and peramivir) and the PA endonuclease inhibitor baloxavir.

CDC genetically characterized 877 influenza viruses collected in the U.S. from September 29, 2019, to January 4, 2020.
260
6B.1A260 (100%)
231
3C.2a228 (98.7%)2a1228 (98.7%)
2a20
2a30
2a40
3C.3a3 (1.3%)3a3 (1.3%)
353
V1A353 (100%)V1A0
V1A.133 (9.3%)
V1A.3320 (90.7%)
33
Y333 (100%)

Virus Subtype or Lineage Genetic Characterization
Total No. of Subtype/Lineage Tested Clade Number (% of subtype/lineage tested) Subclade Number (% of subtype/lineage tested) A/H1 A/H3 B/Victoria B/Yamagata

CDC antigenically characterizes a subset of influenza viruses by hemagglutination inhibition (HI) or neutralization based Focus Reduction assays (FRA). Antigenic drift is evaluated by comparing antigenic properties of cell-propagated reference viruses representing currently recommended vaccine components with those of cell-propagated circulating viruses. CDC antigenically characterized 167 influenza viruses collected in the United States from September 29, 2019, to January 4, 2020.

Influenza A Viruses
  • A (H1N1)pdm09: 66 A(H1N1)pdm09 viruses were antigenically characterized by HI with ferret antisera, and all were antigenically similar (reacting at titers that were within 4-fold of the homologous virus titer) to cell-propagated A/Brisbane/02/2018-like reference viruses representing the A(H1N1)pdm09 component for the 2019-20 Northern Hemisphere influenza vaccines.
  • A (H3N2): 41 A(H3N2) viruses were antigenically characterized by FRA with ferret antisera, and 14 (34.1%) were antigenically similar to cell-propagated A/Kansas/14/2017-like reference viruses representing the A(H3N2) component for the 2019-20 Northern Hemisphere influenza vaccines.


Influenza B Viruses
  • B/Victoria: 50 B/Victoria lineage viruses, including viruses from both co-circulating sub-clades, were antigenically characterized by HI with ferret antisera, and 29 (58%) were antigenically similar to cell-propagated B/Colorado/06/2017-like reference viruses representing the B/Victoria component for the 2019-20 Northern Hemisphere influenza vaccines.
  • B/Yamagata: 10 B/Yamagata lineage viruses were antigenically characterized by HI with ferret antisera, and all 10 (100%) were antigenically similar to cell-propagated B/Phuket/3073/2013-like reference viruses representing the B/Yamagata component for the 2019-20 Northern Hemisphere influenza vaccines.


CDC assesses susceptibility of influenza viruses to the antiviral medications oseltamivir, zanamivir, peramivir, and baloxavir using next generation sequence analysis supplemented by laboratory assays. Viruses collected in the United States since September 29, 2019, were tested for antiviral susceptibility as follows:
82123921833529
(0.0%)(0.0%)(0.0%)(0.0%)(0.0%)
1 (0.1%)1 (0.4%)(0.0%)(0.0%)(0.0%)
82123921833529
(0.0%)(0.0%)(0.0%)(0.0%)(0.0%)
1 (0.1%)1 (0.4%)(0.0%)(0.0%)(0.0%)
82123921833529
1 (0.1%)(0.0%)(0.0%)1 (0.3%)(0.0%)
(0.0%)(0.0%)(0.0%)(0.0%)(0.0%)
82723821733537
(0.0%)(0.0%)(0.0%)(0.0%)(0.0%)

Antiviral Medication Total Viruses A/H1 A/H3 B/Victoria B/Yamagata Neuraminidase Inhibitors Oseltamivir Viruses Tested Reduced Inhibition Highly Reduced Inhibition Peramivir Viruses Tested Reduced Inhibition
Highly Reduced Inhibition Zanamivir Viruses Tested Reduced Inhibition
Highly Reduced Inhibition PA Endonuclease Inhibitor
Baloxavir Viruses Tested
Reduced Susceptibility

[h=2]Outpatient Illness Surveillance[/h] [h=3]ILINet[/h]
Nationwide during week 1, 5.8% of patient visits reported through the U.S. Outpatient Influenza-like Illness Surveillance Network (ILINet) were due to influenza-like illness (ILI). This percentage is above the national baseline of 2.4%. The decrease in the percentage of patient visits for ILI may be influenced in part by changes in healthcare seeking behavior and influenza virus transmission that can occur during the holidays.
national levels of ILI and ARI

View Chart Data (current season only) | View Full Screen

On a regional level, the percentage of outpatient visits for ILI ranged from 3.6% to 8.6% during week 1. All regions reported a percentage of outpatient visits for ILI which is equal to or above their region-specific baselines. [h=3]ILI Activity Map[/h]
Data collected in ILINet are used to produce a measure of ILI activity* by state.

During week 1, the following ILI activity levels were experienced:
  • High – the District of Columbia, New York City, Puerto Rico, and 33 states (Alabama, Arizona, Arkansas, California, Colorado, Connecticut, Georgia, Illinois, Iowa, Kansas, Kentucky, Louisiana, Maine, Maryland, Massachusetts, Mississippi, Nebraska, New Jersey, New Mexico, New York, North Carolina, North Dakota, Oklahoma, Oregon, Pennsylvania, South Carolina, Tennessee, Texas, Utah, Virginia, Washington, West Virginia, and Wisconsin)
  • Moderate – six states (Alaska, Indiana, Michigan, Minnesota, Rhode Island, and South Dakota)
  • Low – eight states (Florida, Hawaii, Missouri, Montana, Nevada, Ohio, Vermont, and Wyoming)
  • Minimal – one state (New Hampshire)
  • Data were insufficient to calculate an ILI activity level from the U.S. Virgin Islands and two states (Delaware and Idaho).
[SIZE=-1]*Data collected in ILINet may disproportionally represent certain populations within a state, and therefore, may not accurately depict the full picture of influenza activity for the whole state. Differences in the data presented here by CDC and independently by some state health departments likely represent differing levels of data completeness with data presented by the state likely being the more complete.[/SIZE]


Additional information about medically attended visits for ILI for current and past seasons:
Surveillance Methods | FluView Interactive: National, Regional, and State Data or ILI Activity Map


[h=2]Geographic Spread of Influenza as Assessed by State and Territorial Epidemiologists[/h]
The influenza activity reported by state and territorial epidemiologists indicates geographic spread of influenza viruses but does not measure the severity of influenza activity.

During week 1 the following influenza activity was reported:
  • Widespread – Puerto Rico and 46 states (Alabama, Alaska, Arizona, Arkansas, California, Colorado, Connecticut, Delaware, Florida, Georgia, Idaho, Illinois, Indiana, Iowa, Kansas, Kentucky, Louisiana, Maine, Maryland, Massachusetts, Michigan, Minnesota, Missouri, Montana, Nebraska, Nevada, New Hampshire, New Jersey, New Mexico, New York, North Carolina, Ohio, Oklahoma, Oregon, Pennsylvania, Rhode Island, South Carolina, South Dakota, Tennessee, Texas, Utah, Virginia, Washington, West Virginia, Wisconsin and Wyoming)
  • Regional – three states (Mississippi, North Dakota, and Vermont)
  • Local – the District of Columbia and one state (Hawaii)
  • Sporadic – the U.S. Virgin Islands
  • Guam did not report.
Additional geographic spread surveillance information for current and past seasons:
Surveillance Methods | FluView Interactive

[h=2]Influenza-Associated Hospitalizations[/h]
The Influenza Hospitalization Surveillance Network (FluSurv-NET) conducts population-based surveillance for laboratory-confirmed influenza-related hospitalizations in select counties in the Emerging Infections Program (EIP) states and Influenza Hospitalization Surveillance Project (IHSP) states.

A total of 4,228 laboratory-confirmed influenza-associated hospitalizations were reported by FluSurv-NET sites between October 1, 2019 and January 4, 2020; 2,299 (54.4%) were associated with influenza A virus, 1,906 (45.1%) with influenza B virus, 13 (0.3%) with influenza A virus and influenza B virus co-infection, and 10 (0.2%) with influenza virus for which the type was not determined. Among those with influenza A subtype information, 461 (86.0%) were A(H1N1)pdm09 virus and 75 (14.0%) were A(H3N2).

The overall cumulative hospitalization rate was 14.6 per 100,000 population which is similar to what has been seen during recent previous influenza seasons at this time of year.

Click on graph to launch interactive tool
View Full Screen

The highest rate of hospitalization is among adults aged ≥65, followed by children aged 0-4 years and adults aged 50-64 years.
Overall14.6
0-4 years26.8
5-17 years8.3
18-49 years8.2
50-64 years17.0
65+ years33.3
Age Group 2019-2020 Season
Cumulative Rate per 100,000 Population


Among 549 hospitalized adults with information on underlying medical conditions, 90.3% had at least one reported underlying medical condition, the most commonly reported were cardiovascular disease, metabolic disorder, and obesity. Among 154 hospitalized children with information on underlying medical conditions, 46.1% had at least one underlying medical condition; the most commonly reported was asthma. Among 116 hospitalized women of childbearing age (15-44 years) with information on pregnancy status, 30.2% were pregnant.

Click on graph to launch interactive tool2
View Full Screen

Additional hospitalization surveillance information for current and past seasons and additional age groups:
Surveillance Methods | FluView Interactive


[h=2]Pneumonia and Influenza (P&I) Mortality Surveillance[/h]
Based on National Center for Health Statistics (NCHS) mortality surveillance data available on January 9, 2020, 5.8% of the deaths occurring during the week ending December 28, 2019 (week 52) were due to P&I. This percentage is below the epidemic threshold of 6.9% for week 52.
INFLUENZA Virus Isolated

View Chart Data | View Full Screen

Additional pneumonia and influenza mortality surveillance information for current and past seasons:
Surveillance Methods | FluView Interactive


[h=2]Influenza-Associated Pediatric Mortality[/h]
Five influenza-associated pediatric deaths occurring in weeks 52 (the week ending December 28, 2019) and 1 (the week ending January 4, 2020) were reported to CDC during week 1. Three were associated with influenza B viruses that did not have a lineage determined, and two were associated with influenza A(H1N1)pdm09 viruses.

A total of 32 influenza-associated pediatric deaths occurring during the 2019-2020 season have been reported to CDC.
  • 21 deaths were associated with influenza B viruses. Five of these had the lineage determined and all were B/Victoria viruses.
  • 11 deaths were associated with influenza A viruses. Six of these had subtyping performed and all were A(H1N1)pdm09 viruses.
Click on image to launch interactive tool

View Full Screen

Additional pediatric mortality surveillance information for current and past seasons:
Surveillance Methods | FluView Interactive


[h=2]Additional National and International Influenza Surveillance Information[/h]

FluView Interactive: FluView includes enhanced web-based interactive applications that can provide dynamic visuals of the influenza data collected and analyzed by CDC. These FluView Interactive applications allow people to create customized, visual interpretations of influenza data, as well as make comparisons across flu seasons, regions, age groups and a variety of other demographics. To access these tools, visit http://www.cdc.gov/flu/weekly/fluviewinteractive.htm

National Institute for Occupational Safety and Health: Monthly surveillance data on the prevalence of health-related workplace absenteeism among full-time workers in the United States are available from NIOSH at https://www.cdc.gov/niosh/topics/absences/default.html

U.S. State and local influenza surveillance:Select a jurisdiction below to access the latest local influenza information


[TD="width: 139"] Alabama [/TD]
[TD="width: 139"] Alaska [/TD]
[TD="width: 139"] Arizona [/TD]
[TD="width: 139"] Arkansas [/TD]
[TD="width: 139"] California [/TD]

[TD="width: 139"] Colorado [/TD]
[TD="width: 139"] Connecticut [/TD]
[TD="width: 139"] Delaware [/TD]
[TD="width: 139"] District of Columbia [/TD]
[TD="width: 139"] Florida [/TD]

[TD="width: 139"] Georgia [/TD]
[TD="width: 139"] Hawaii [/TD]
[TD="width: 139"] Idaho [/TD]
[TD="width: 139"] Illinois [/TD]
[TD="width: 139"] Indiana [/TD]

[TD="width: 139"] Iowa [/TD]
[TD="width: 139"] Kansas [/TD]
[TD="width: 139"] Kentucky [/TD]
[TD="width: 139"] Louisiana [/TD]
[TD="width: 139"] Maine [/TD]

[TD="width: 139"] Maryland [/TD]
[TD="width: 139"] Massachusetts [/TD]
[TD="width: 139"] Michigan [/TD]
[TD="width: 139"] Minnesota [/TD]
[TD="width: 139"] Mississippi [/TD]

[TD="width: 139"] Missouri [/TD]
[TD="width: 139"] Montana [/TD]
[TD="width: 139"] Nebraska [/TD]
[TD="width: 139"] Nevada [/TD]
[TD="width: 139"] New Hampshire [/TD]

[TD="width: 139"] New Jersey [/TD]
[TD="width: 139"] New Mexico [/TD]
[TD="width: 139"] New York [/TD]
[TD="width: 139"] North Carolina [/TD]
[TD="width: 139"] North Dakota [/TD]

[TD="width: 139"] Ohio [/TD]
[TD="width: 139"] Oklahoma [/TD]
[TD="width: 139"] Oregon [/TD]
[TD="width: 139"] Pennsylvania [/TD]
[TD="width: 139"] Rhode Island [/TD]

[TD="width: 139"] South Carolina [/TD]
[TD="width: 139"] South Dakota [/TD]
[TD="width: 139"] Tennessee [/TD]
[TD="width: 139"] Texas [/TD]
[TD="width: 139"] Utah [/TD]

[TD="width: 139"] Vermont [/TD]
[TD="width: 139"] Virginia [/TD]
[TD="width: 139"] Washington [/TD]
[TD="width: 139"] West Virginia [/TD]
[TD="width: 139"] Wisconsin [/TD]

[TD="width: 139"] Wyoming [/TD]
[TD="width: 139"] New York City [/TD]
[TD="width: 139"] Puerto Rico [/TD]
[TD="width: 139"] Virgin Islands [/TD]
[TD="width: 139"] [/TD]


World Health Organization: Additional influenza surveillance information from participating WHO member nations is available through FluNet and the Global Epidemiology Reports.

WHO Collaborating Centers for Influenza located in Australia, China, Japan, the United Kingdom, and the United States (CDC in Atlanta, Georgia).

Europe: For the most recent influenza surveillance information from Europe, please see WHO/Europe and the European Centre for Disease Prevention and Control at http://www.flunewseurope.org/.

Public Health Agency of Canada: The most up-to-date influenza information from Canada is available at http://www.phac-aspc.gc.ca/fluwatch/

Public Health England: The most up-to-date influenza information from the United Kingdom is available at https://www.gov.uk/government/statistics/weekly-national-flu-reports


Any links provided to non-Federal organizations are provided solely as a service to our users. These links do not constitute an endorsement of these organizations or their programs by CDC or the Federal Government, and none should be inferred. CDC is not responsible for the content of the individual organization web pages found at these links.


An overview of the CDC influenza surveillance system, including methodology and detailed descriptions of each data component, is available at: http://www.cdc.gov/flu/weekly/overview.htm.

--------------------------------------------------------------------------------


Page last reviewed: January 10, 2020, 11:00 AM
Content source: Centers for Disease Control and Prevention, National Center for Immunization and Respiratory Diseases (NCIRD)
https://www.cdc.gov/flu/weekly/index.htm
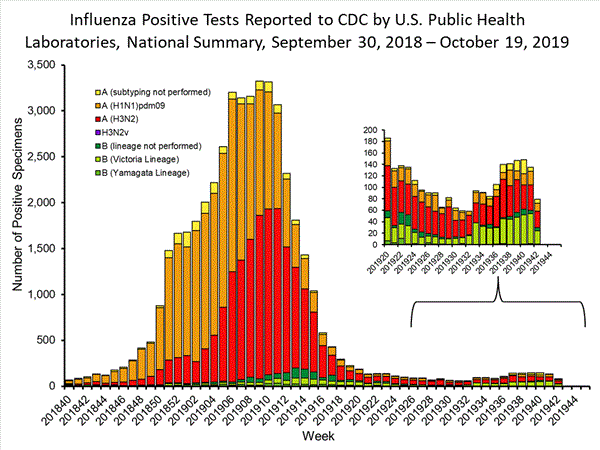
 
[h=1]Weekly U.S. Influenza Surveillance Report[/h]
fluview-banner2.jpg

Key Updates for Week 2, ending January 11, 2020

Key indicators that track flu activity declined slightly but remain high. Indicators that track severity (hospitalizations and deaths) are not high at this point in the season. [h=4]Viruses[/h]
Clinical Labs
The percentage of respiratory specimens testing positive for influenza at clinical laboratories decreased from 23.6% last week to 22.9% this week.

Public Health Labs
Nationally, B/Victoria viruses are the predominant viruses this season; however, during recent weeks, approximately equal numbers of B/Victoria and A(H1N1)pdm09 viruses have been reported.

Virus Characterization
Genetic and antigenic characterization and antiviral susceptibility of influenza viruses collected in the U.S. are summarized in this report. [h=4]Illness[/h] Outpatient Illness: ILINet
Visits to health care providers for influenza-like illness (ILI) decreased from 5.7% last week to 4.7% this week. All regions remain above their baselines.

Outpatient Illness: ILI Activity Map
Flu Activity & Surveillance - Flu Activity & Surveillance


The number of jurisdictions experiencing high ILI activity decreased from 36 last week to 34 this week.

Geographic Spread
spread-map2 - Spread map week 2


The number of jurisdictions reporting regional or widespread influenza activity remained at 50 this week. [h=4]Severe Disease[/h]
Hospitalizations
The overall hospitalization rate for the season increased to 19.9 per 100,000. This is similar to what has been seen at this time during recent seasons.

P&I Mortality
The percentage of deaths attributed to pneumonia and influenza increased from 6.0% to 6.9% but remains below the epidemic threshold.

Pediatric Deaths
Seven new influenza-associated pediatric deaths occurring during the 2019-2020 season were reported this week. The total for the season is 39.

All data are preliminary and may change as more reports are received.

A description of the CDC influenza surveillance system, including methodology and detailed descriptions of each data component is available on the surveillance methods page.

Additional information on the current and previous influenza seasons for each surveillance component are available on FluView Interactive.

Key Points
  • Outpatient ILI and laboratory data remain elevated but declined slightly this week. While the overall percent of specimens positive for influenza declined nationally, the percent positive for influenza A viruses increased and some regions are seeing increases in the proportion of influenza A(H1N1)pdm09 viruses compared to other influenza viruses. It is too early to know whether the season has peaked or if flu activity will increase again.
  • Levels of outpatient ILI remain elevated; however, hospitalization rates remain similar to what has been seen at this time during recent seasons and mortality, while increasing, has not yet exceeded the epidemic threshold.
  • CDC estimates that so far this season there have been at least 13 million flu illnesses, 120,000 hospitalizations and 6,600 deaths from flu.
  • Flu vaccine effectiveness estimates are not available yet this season, but vaccination is always the best way to prevent flu and its potentially serious complications.
  • Antiviral medications are an important adjunct to flu vaccine in the control of influenza. Almost all (>99%) of the influenza viruses tested this season are susceptible to the four FDA-approved influenza antiviral medications recommended for use in the U.S. this season.
[h=2]U.S. Virologic Surveillance[/h] [h=3]Clinical Laboratories[/h]
The results of tests performed by clinical laboratories nationwide are summarized below. Data from clinical laboratories (the percentage of specimens tested that are positive for influenza) are used to monitor whether influenza activity is increasing or decreasing.
40,451541,982
9,277 (22.9%)75,552 (13.9%)
3,899 (42.0%)24,881 (32.9%)
5,378 (58.0%)50,671 (67.1%)
Week 2 Data Cumulative since
September 29, 2019
(week 40)
No. of specimens tested No. of positive specimens (%) Positive specimens by type Influenza A Influenza B
INFLUENZA Virus Isolated

View Chart Data | View Full Screen [h=3]Public Health Laboratories[/h]
The results of tests performed by public health laboratories nationwide are summarized below. Data from public health laboratories are used to monitor the proportion of circulating viruses that belong to each influenza subtype/lineage.
1,90432,894
1,14815,580
579 (50.4%)6,748 (43.3%)
504 (93.3%)5,500 (84.2%)
36 (6.7%)1,031 (15.8%)
39217
569 (49.6%)8,832 (56.7%)
5 (1.2%)130 (2.0%)
422 (98.8%)6,466 (98.0%)
1422,236
Week 2 Data Cumulative since September 29, 2019
(week 40)
No. of specimens tested No. of positive specimens Positive specimens by type/subtype Influenza A (H1N1)pdm09 H3N2 Subtyping not performed Influenza B Yamagata lineage Victoria lineage Lineage not performed

Nationally influenza B/Victoria viruses have been reported more frequently than other influenza viruses this season. However, during recent weeks, approximately equal numbers of B/Victoria and influenza A(H1N1)pdm09 viruses have been reported nationally. The predominant virus varies by region. Regional and state level data about circulating influenza viruses can be found on FluView Interactive. The predominant virus also varies by age group. Nationally, influenza B/Victoria viruses are the most commonly reported influenza viruses among children age 0-4 years (47% of reported viruses) and 5-24 years (57% of reported viruses), while A(H1N1)pdm09 viruses are the most commonly reported influenza viruses among persons 25-64 years (46% of reported viruses) and 65 years of age and older (53% of reported viruses). Additional age data can be found on FluView Interactive.
INFLUENZA Virus Isolated

View Chart Data | View Full Screen

Additional virologic surveillance information for current and past seasons:
Surveillance Methods | FluView Interactive: National, Regional, and State Data or Age Data
[h=2]Influenza Virus Characterization[/h]
CDC performs genetic and antigenic characterization of U.S. viruses submitted from state and local health laboratories using Right Size Roadmap submission guidance. These data are used to compare how similar the currently circulating influenza viruses are to the reference viruses used for developing new influenza vaccines and to monitor evolutionary changes that continually occur in circulating influenza. Antigenic characterization data are based on an animal model (influenza-naive ferrets), and do not reflect pre-existing protection provided by past influenza infections and vaccinations. Additional antigenic characterization studies involving people vaccinated with current influenza vaccines are conducted later in the season; these data account for pre-existing protection in different populations against circulating influenza viruses. Genetic and antigenic characterization data are not used to make calculations about vaccine effectiveness (VE). CDC conducts VE studies each year to measure the benefits of flu vaccines in people.

CDC genetically characterized 952 influenza viruses collected in the U.S. from September 29, 2019, to January 11, 2020.
290
6B.1A290 (100%)
244
3C.2a240 (98.4%)2a1240 (98.4%)
2a20
2a30
2a40
3C.3a4 (1.6%)3a4 (1.6%)
382
V1A382 (100%)V1A0
V1A.134 (8.9%)
V1A.3348 (91.1%)
36
Y336 (100%)

Virus Subtype or Lineage Genetic Characterization
Total No. of Subtype/Lineage Tested Clade Number (% of subtype/lineage tested) Subclade Number (% of subtype/lineage tested) A/H1 A/H3 B/Victoria B/Yamagata

CDC antigenically characterizes a subset of influenza viruses by hemagglutination inhibition (HI) or neutralization based Focus Reduction assays (FRA). Antigenic drift is evaluated by comparing antigenic properties of cell-propagated reference viruses representing currently recommended vaccine components with those of cell-propagated circulating viruses. CDC antigenically characterized 195 influenza viruses collected in the United States from September 29, 2019, to January 11, 2020. These data are not used to make calculations about vaccine effectiveness (VE). CDC conducts VE studies each year to measure the benefits of flu vaccines in people.

Influenza A Viruses
  • A (H1N1)pdm09: 74 A(H1N1)pdm09 viruses were antigenically characterized by HI with ferret antisera, and all were antigenically similar (reacting at titers that were within 4-fold of the homologous virus titer) to cell-propagated A/Brisbane/02/2018-like reference viruses representing the A(H1N1)pdm09 component for the 2019-20 Northern Hemisphere influenza vaccines.
  • A (H3N2): 41 A(H3N2) viruses were antigenically characterized by FRA with ferret antisera, and 14 (34.1%) were antigenically similar to cell-propagated A/Kansas/14/2017-like reference viruses representing the A(H3N2) component for the 2019-20 Northern Hemisphere influenza vaccines.


Influenza B Viruses
  • B/Victoria: 70 B/Victoria lineage viruses, including viruses from both co-circulating sub-clades, were antigenically characterized by HI with ferret antisera, and 46 (65.7%) were antigenically similar to cell-propagated B/Colorado/06/2017-like reference viruses representing the B/Victoria component for the 2019-20 Northern Hemisphere influenza vaccines.
  • B/Yamagata: 10 B/Yamagata lineage viruses were antigenically characterized by HI with ferret antisera, and all 10 (100%) were antigenically similar to cell-propagated B/Phuket/3073/2013-like reference viruses representing the B/Yamagata component for the 2019-20 Northern Hemisphere influenza vaccines.


CDC assesses susceptibility of influenza viruses to the antiviral medications including the neuraminidase inhibitors (oseltamivir, zanamivir, and peramivir) and the PA endonuclease inhibitor baloxavir using next generation sequence analysis supplemented by laboratory assays. Viruses collected in the United States since September 29, 2019, were tested for antiviral susceptibility as follows:
89626922936335
(0.0%)(0.0%)(0.0%)(0.0%)(0.0%)
1 (0.1%)1 (0.4%)(0.0%)(0.0%)(0.0%)
89626922936335
(0.0%)(0.0%)(0.0%)(0.0%)(0.0%)
1 (0.1%)1 (0.4%)(0.0%)(0.0%)(0.0%)
89626922936335
1 (0.1%)(0.0%)(0.0%)1 (0.3%)(0.0%)
(0.0%)(0.0%)(0.0%)(0.0%)(0.0%)
90227023136437
(0.0%)(0.0%)(0.0%)(0.0%)(0.0%)

Antiviral Medication Total Viruses A/H1 A/H3 B/Victoria B/Yamagata Neuraminidase Inhibitors Oseltamivir Viruses Tested Reduced Inhibition Highly Reduced Inhibition Peramivir Viruses Tested Reduced Inhibition
Highly Reduced Inhibition Zanamivir Viruses Tested Reduced Inhibition
Highly Reduced Inhibition PA Endonuclease Inhibitor
Baloxavir Viruses Tested
Reduced Susceptibility

[h=2]Outpatient Illness Surveillance[/h] [h=3]ILINet[/h]
Nationwide during week 2, 4.7% of patient visits reported through the U.S. Outpatient Influenza-like Illness Surveillance Network (ILINet) were due to influenza-like illness (ILI). This percentage is above the national baseline of 2.4%.
national levels of ILI and ARI

View Chart Data (current season only) | View Full Screen

On a regional level, the percentage of outpatient visits for ILI ranged from 3.0% to 7.4% during week 2. All regions reported a percentage of outpatient visits for ILI which is above their region-specific baselines. [h=3]ILI Activity Map[/h]
Data collected in ILINet are used to produce a measure of ILI activity* by state.

During week 2, the following ILI activity levels were experienced:
  • High – New York City, Puerto Rico, and 32 states (Alabama, Arkansas, California, Colorado, Connecticut, Georgia, Illinois, Kansas, Kentucky, Louisiana, Maryland, Massachusetts, Mississippi, Nebraska, New Jersey, New Mexico, New York, North Carolina, North Dakota, Oklahoma, Oregon, Pennsylvania, Rhode Island, South Carolina, Tennessee, Texas, Utah, Virginia, Washington, West Virginia, Wisconsin, and Wyoming)
  • Moderate – the District of Columbia and four states (Arizona, Iowa, Maine, and South Dakota)
  • Low – nine states (Alaska, Florida, Hawaii, Indiana, Michigan, Minnesota, Missouri, Nevada, and Vermont)
  • Minimal – five states (Delaware, Idaho, Montana, New Hampshire, and Ohio)
  • Data were insufficient to calculate an ILI activity level from the U.S. Virgin Islands.
[SIZE=-1]*Data collected in ILINet may disproportionally represent certain populations within a state, and therefore, may not accurately depict the full picture of influenza activity for the whole state. Differences in the data presented here by CDC and independently by some state health departments likely represent differing levels of data completeness with data presented by the state likely being the more complete.[/SIZE]


Additional information about medically attended visits for ILI for current and past seasons:
Surveillance Methods | FluView Interactive: National, Regional, and State Data or ILI Activity Map


[h=2]Geographic Spread of Influenza as Assessed by State and Territorial Epidemiologists[/h]
The influenza activity reported by state and territorial epidemiologists indicates geographic spread of influenza viruses but does not measure the severity of influenza activity.

During week 2 the following influenza activity was reported:
  • Widespread – Puerto Rico and 48 states (Alabama, Alaska, Arizona, Arkansas, California, Colorado, Connecticut, Delaware, Florida, Georgia, Idaho, Illinois, Indiana, Iowa, Kansas, Kentucky, Louisiana, Maine, Maryland, Massachusetts, Michigan, Minnesota, Mississippi, Missouri, Montana, Nebraska, Nevada, New Hampshire, New Jersey, New Mexico, New York, North Carolina, North Dakota, Ohio, Oklahoma, Pennsylvania, Rhode Island, South Carolina, South Dakota, Tennessee, Texas, Utah, Vermont, Virginia, Washington, West Virginia, Wisconsin, and Wyoming)
  • Regional – one state (Oregon)
  • Local – the District of Columbia and one state (Hawaii)
  • Sporadic – the U.S. Virgin Islands
  • Guam did not report.
Additional geographic spread surveillance information for current and past seasons:
Surveillance Methods | FluView Interactive

[h=2]Influenza-Associated Hospitalizations[/h]
The Influenza Hospitalization Surveillance Network (FluSurv-NET) conducts population-based surveillance for laboratory-confirmed influenza-related hospitalizations in select counties in the Emerging Infections Program (EIP) states and Influenza Hospitalization Surveillance Project (IHSP) states.

A total of 5,786 laboratory-confirmed influenza-associated hospitalizations were reported by FluSurv-NET sites between October 1, 2019 and January 11, 2020; 3,257 (56.3%) were associated with influenza A virus, 2,491 (43.1%) with influenza B virus, 15 (0.3%) with influenza A virus and influenza B virus co-infection, and 23 (0.4%) with influenza virus for which the type was not determined. Among those with influenza A subtype information, 679 (88.3%) were A(H1N1)pdm09 virus and 90 (11.7%) were A(H3N2).

The overall cumulative hospitalization rate was 19.9 per 100,000 population which is similar to what has been seen during recent previous influenza seasons at this time of year.

Click on graph to launch interactive tool
View Full Screen

The highest rate of hospitalization is among adults aged ≥65, followed by children aged 0-4 years and adults aged 50-64 years.
Overall19.9
0-4 years34.4
5-17 years9.6
18-49 years11.5
50-64 years23.2
65+ years47.6
Age Group 2019-2020 Season
Cumulative Rate per 100,000 Population


Among 729 hospitalized adults with information on underlying medical conditions, 91.2% had at least one reported underlying medical condition, the most commonly reported were cardiovascular disease, metabolic disorder, and obesity. Among 193 hospitalized children with information on underlying medical conditions, 45.1% had at least one underlying medical condition; the most commonly reported was asthma. Among 151 hospitalized women of childbearing age (15-44 years) with information on pregnancy status, 27.8% were pregnant.

Click on graph to launch interactive tool2
View Full Screen

Additional hospitalization surveillance information for current and past seasons and additional age groups:
Surveillance Methods | FluView Interactive


[h=2]Pneumonia and Influenza (P&I) Mortality Surveillance[/h]
Based on National Center for Health Statistics (NCHS) mortality surveillance data available on January 16, 2020, 6.9% of the deaths occurring during the week ending January 4, 2020 (week 1) were due to P&I. This percentage is below the epidemic threshold of 7.0% for week 1.
INFLUENZA Virus Isolated

View Chart Data | View Full Screen

Additional pneumonia and influenza mortality surveillance information for current and past seasons:
Surveillance Methods | FluView Interactive


[h=2]Influenza-Associated Pediatric Mortality[/h]
Seven influenza-associated pediatric deaths occurring in weeks 52 (the week ending December 28, 2019), 1 (the week ending January 4, 2020), and 2 (the week ending January 11, 2020) were reported to CDC during week 2. All seven were associated with influenza B viruses that did not have a lineage determined.

A total of 39 influenza-associated pediatric deaths occurring during the 2019-2020 season have been reported to CDC.
  • 28 deaths were associated with influenza B viruses. Five of these had the lineage determined and all were B/Victoria viruses.
  • 11 deaths were associated with influenza A viruses. Six of these had subtyping performed and all were A(H1N1)pdm09 viruses.
Click on image to launch interactive tool

View Full Screen

Additional pediatric mortality surveillance information for current and past seasons:
Surveillance Methods | FluView Interactive


[h=2]Additional National and International Influenza Surveillance Information[/h]

FluView Interactive: FluView includes enhanced web-based interactive applications that can provide dynamic visuals of the influenza data collected and analyzed by CDC. These FluView Interactive applications allow people to create customized, visual interpretations of influenza data, as well as make comparisons across flu seasons, regions, age groups and a variety of other demographics. To access these tools, visit http://www.cdc.gov/flu/weekly/fluviewinteractive.htm

National Institute for Occupational Safety and Health: Monthly surveillance data on the prevalence of health-related workplace absenteeism among full-time workers in the United States are available from NIOSH at https://www.cdc.gov/niosh/topics/absences/default.html

U.S. State and local influenza surveillance:Select a jurisdiction below to access the latest local influenza information


[TD="width: 139"] Alabama [/TD]
[TD="width: 139"] Alaska [/TD]
[TD="width: 139"] Arizona [/TD]
[TD="width: 139"] Arkansas [/TD]
[TD="width: 139"] California [/TD]

[TD="width: 139"] Colorado [/TD]
[TD="width: 139"] Connecticut [/TD]
[TD="width: 139"] Delaware [/TD]
[TD="width: 139"] District of Columbia [/TD]
[TD="width: 139"] Florida [/TD]

[TD="width: 139"] Georgia [/TD]
[TD="width: 139"] Hawaii [/TD]
[TD="width: 139"] Idaho [/TD]
[TD="width: 139"] Illinois [/TD]
[TD="width: 139"] Indiana [/TD]

[TD="width: 139"] Iowa [/TD]
[TD="width: 139"] Kansas [/TD]
[TD="width: 139"] Kentucky [/TD]
[TD="width: 139"] Louisiana [/TD]
[TD="width: 139"] Maine [/TD]

[TD="width: 139"] Maryland [/TD]
[TD="width: 139"] Massachusetts [/TD]
[TD="width: 139"] Michigan [/TD]
[TD="width: 139"] Minnesota [/TD]
[TD="width: 139"] Mississippi [/TD]

[TD="width: 139"] Missouri [/TD]
[TD="width: 139"] Montana [/TD]
[TD="width: 139"] Nebraska [/TD]
[TD="width: 139"] Nevada [/TD]
[TD="width: 139"] New Hampshire [/TD]

[TD="width: 139"] New Jersey [/TD]
[TD="width: 139"] New Mexico [/TD]
[TD="width: 139"] New York [/TD]
[TD="width: 139"] North Carolina [/TD]
[TD="width: 139"] North Dakota [/TD]

[TD="width: 139"] Ohio [/TD]
[TD="width: 139"] Oklahoma [/TD]
[TD="width: 139"] Oregon [/TD]
[TD="width: 139"] Pennsylvania [/TD]
[TD="width: 139"] Rhode Island [/TD]

[TD="width: 139"] South Carolina [/TD]
[TD="width: 139"] South Dakota [/TD]
[TD="width: 139"] Tennessee [/TD]
[TD="width: 139"] Texas [/TD]
[TD="width: 139"] Utah [/TD]

[TD="width: 139"] Vermont [/TD]
[TD="width: 139"] Virginia [/TD]
[TD="width: 139"] Washington [/TD]
[TD="width: 139"] West Virginia [/TD]
[TD="width: 139"] Wisconsin [/TD]

[TD="width: 139"] Wyoming [/TD]
[TD="width: 139"] New York City [/TD]
[TD="width: 139"] Puerto Rico [/TD]
[TD="width: 139"] Virgin Islands [/TD]
[TD="width: 139"] [/TD]


World Health Organization: Additional influenza surveillance information from participating WHO member nations is available through FluNet and the Global Epidemiology Reports.

WHO Collaborating Centers for Influenza located in Australia, China, Japan, the United Kingdom, and the United States (CDC in Atlanta, Georgia).

Europe: For the most recent influenza surveillance information from Europe, please see WHO/Europe and the European Centre for Disease Prevention and Control at http://www.flunewseurope.org/.

Public Health Agency of Canada: The most up-to-date influenza information from Canada is available at http://www.phac-aspc.gc.ca/fluwatch/

Public Health England: The most up-to-date influenza information from the United Kingdom is available at https://www.gov.uk/government/statistics/weekly-national-flu-reports


Any links provided to non-Federal organizations are provided solely as a service to our users. These links do not constitute an endorsement of these organizations or their programs by CDC or the Federal Government, and none should be inferred. CDC is not responsible for the content of the individual organization web pages found at these links.


An overview of the CDC influenza surveillance system, including methodology and detailed descriptions of each data component, is available at: http://www.cdc.gov/flu/weekly/overview.htm.

--------------------------------------------------------------------------------


Page last reviewed: January 17, 2020, 11:00 AM
Content source: Centers for Disease Control and Prevention, National Center for Immunization and Respiratory Diseases (NCIRD)Seasonal Influenza (Flu)
What CDC Does
email_03Get Email Updates

To receive weekly email updates about Seasonal Flu, enter your email address: Email Address
What's this?
Submit
H1N1 Flu Pandemic 2009-2019: A Decade Later - H1N1 Flu Pandemic 2009-2019: A Decade Later

Influenza Types
https://www.cdc.gov/flu/weekly/index.htm
 
[h=1]Weekly U.S. Influenza Surveillance Report[/h]
fluview-banner2.jpg

Key Updates for Week 3, ending January 18, 2020

Key indicators that track flu activity remain high and, after falling during the first two weeks of the year, increased slightly this week. Indicators that track severity (hospitalizations and deaths) are not high at this point in the season. [h=4]Viruses[/h]
Clinical Labs
The percentage of respiratory specimens testing positive for influenza at clinical laboratories increased from 23.4% last week to 25.6% this week.

Public Health Labs
Nationally, B/Victoria viruses are the predominant viruses this season; however, during recent weeks, approximately equal numbers of B/Victoria and A(H1N1)pdm09 viruses have been reported.

Virus Characterization
Genetic and antigenic characterization and antiviral susceptibility of influenza viruses collected in the U.S. are summarized in this report. [h=4]Illness[/h] Outpatient Illness: ILINet
Visits to health care providers for influenza-like illness (ILI) increased from 4.7% last week to 5.0% this week. All regions remain above their baselines.

Outpatient Illness: ILI Activity Map
Flu Activity & Surveillance - Flu Activity & Surveillance


The number of jurisdictions experiencing high ILI activity increased from 34 last week to 37 this week.

Geographic Spread
Geographic Spread Map - Geographic Spread Map


The number of jurisdictions reporting regional or widespread influenza activity remained at 50 this week. [h=4]Severe Disease[/h]
Hospitalizations
The overall hospitalization rate for the season increased to 24.1 per 100,000. This is similar to what has been seen at this time during recent seasons.

P&I Mortality
The percentage of deaths attributed to pneumonia and influenza decreased from 7.1% to 6.7% and is below the epidemic threshold.

Pediatric Deaths
Fifteen new influenza-associated pediatric deaths occurring during the 2019-2020 season were reported this week. The total for the season is 54.

All data are preliminary and may change as more reports are received.

A description of the CDC influenza surveillance system, including methodology and detailed descriptions of each data component is available on the surveillance methods page.

Additional information on the current and previous influenza seasons for each surveillance component are available on FluView Interactive.

Key Points
  • Outpatient ILI and laboratory data remain elevated and increased slightly this week. Some regions are seeing increases in the proportion of influenza A(H1N1)pdm09 viruses compared to influenza B viruses.
  • Levels of outpatient ILI remain elevated; however, hospitalization rates remain similar to what has been seen at this time during recent seasons and mortality, while low overall, has exceeded the epidemic threshold for one week this season.
  • Over 50% of influenza positive test results from public health laboratories this season are in children and young adults (<25 years), while only 12% are in adults aged 65 and older. This has resulted in high levels of outpatient illness, but lower levels of hospitalization and death due to influenza. However, influenza can still cause severe disease in children.
  • 15 additional pediatric deaths were reported this week, bringing the total for the season to 54. Influenza B viruses account for 37 of the 54 reported flu-related pediatric deaths this season.
  • CDC estimates that so far this season there have been at least 15 million flu illnesses, 140,000 hospitalizations and 8,200 deaths from flu.
  • Flu vaccine effectiveness estimates are not available yet this season, but vaccination is always the best way to prevent flu and its potentially serious complications.
  • Antiviral medications are an important adjunct to flu vaccine in the control of influenza. Almost all (>99%) of the influenza viruses tested this season are susceptible to the four FDA-approved influenza antiviral medications recommended for use in the U.S. this season.
[h=2]U.S. Virologic Surveillance[/h] [h=3]Clinical Laboratories[/h]
The results of tests performed by clinical laboratories nationwide are summarized below. Data from clinical laboratories (the percentage of specimens tested that are positive for influenza) are used to monitor whether influenza activity is increasing or decreasing.
46,427610,685
11,890 (25.6%)93,120 (15.2%)
5,629 (47.3%)32,997 (35.4%)
6,261 (52.7%)60,123 (64.6%)
Week 3 Data Cumulative since
September 29, 2019
(week 40)
No. of specimens tested No. of positive specimens (%) Positive specimens by type Influenza A Influenza B
INFLUENZA Virus Isolated

View Chart Data | View Full Screen [h=3]Public Health Laboratories[/h]
The results of tests performed by public health laboratories nationwide are summarized below. Data from public health laboratories are used to monitor the proportion of circulating viruses that belong to each influenza subtype/lineage.
1,26235,731
75617,407
364 (48.1%)7,581 (43.6%)
306 (94.4%)6,259 (85.2%)
18 (5.6%)1,083 (14.8%)
40239
392 (51.9%)9,826 (56.4%)
2 (0.6%)142 (1.9%)
308 (99.4%)7,307 (98.1%)
822,377
Week 3 Data Cumulative since September 29, 2019
(week 40)
No. of specimens tested No. of positive specimens Positive specimens by type/subtype Influenza A (H1N1)pdm09 H3N2 Subtyping not performed Influenza B Yamagata lineage Victoria lineage Lineage not performed

Nationally influenza B/Victoria viruses have been reported more frequently than other influenza viruses this season. However, during recent weeks, approximately equal numbers of B/Victoria and influenza A(H1N1)pdm09 viruses have been reported nationally. The predominant virus varies by region. Regional and state level data about circulating influenza viruses can be found on FluView Interactive.

The predominant virus also varies by age group. Nationally, influenza B viruses are the most commonly reported influenza viruses among children age 0-4 years (60% of reported viruses) and 5-24 years (75% of reported viruses), while A(H1N1)pdm09 viruses are the most commonly reported influenza viruses among persons 25-64 years (47% of reported viruses) and 65 years of age and older (53% of reported viruses). For this season, 53% of influenza positive specimens reported by public health laboratories were among persons less than 25 years of age and only 12% were from persons age 65 and older.
INFLUENZA Virus Isolated

View Chart Data | View Full Screen

Additional virologic surveillance information for current and past seasons:
Surveillance Methods | FluView Interactive: National, Regional, and State Data or Age Data
[h=2]Influenza Virus Characterization[/h]
CDC performs genetic and antigenic characterization of U.S. viruses submitted from state and local health laboratories using Right Size Roadmap submission guidance. These data are used to compare how similar the currently circulating influenza viruses are to the reference viruses used for developing new influenza vaccines and to monitor evolutionary changes that continually occur in circulating influenza. Antigenic characterization data are based on an animal model (influenza-naive ferrets), and do not reflect pre-existing protection provided by past influenza infections and vaccinations. Additional antigenic characterization studies involving people vaccinated with current influenza vaccines are conducted later in the season; these data account for pre-existing protection in different populations against circulating influenza viruses. Genetic and antigenic characterization data are not used to make calculations about vaccine effectiveness (VE). CDC conducts VE studies each year to measure the benefits of flu vaccines in people.

CDC genetically characterized 1,087 influenza viruses collected in the U.S. from September 29, 2019, to January 18, 2020.
340
6B.1A340 (100%)
268
3C.2a260 (97.0%)2a1260 (97.0%)
2a20
2a30
2a40
3C.3a8 (3.0%)3a8 (3.0%)
433
V1A433 (100%)V1A0
V1A.138 (8.8%)
V1A.3395 (91.2%)
46
Y346 (100%)

Virus Subtype or Lineage Genetic Characterization
Total No. of Subtype/Lineage Tested Clade Number (% of subtype/lineage tested) Subclade Number (% of subtype/lineage tested) A/H1 A/H3 B/Victoria B/Yamagata

CDC antigenically characterizes a subset of influenza viruses by hemagglutination inhibition (HI) or neutralization based Focus Reduction assays (FRA). Antigenic drift is evaluated by comparing antigenic properties of cell-propagated reference viruses representing currently recommended vaccine components with those of cell-propagated circulating viruses. CDC antigenically characterized 225 influenza viruses collected in the United States from September 29, 2019, to January 18, 2020. These data are not used to make calculations about vaccine effectiveness (VE). CDC conducts VE studies each year to measure the benefits of flu vaccines in people.

Influenza A Viruses
  • A (H1N1)pdm09: 74 A(H1N1)pdm09 viruses were antigenically characterized by HI with ferret antisera, and all were antigenically similar (reacting at titers that were within 4-fold of the homologous virus titer) to cell-propagated A/Brisbane/02/2018-like reference viruses representing the A(H1N1)pdm09 component for the 2019-20 Northern Hemisphere influenza vaccines.
  • A (H3N2): 53 A(H3N2) viruses were antigenically characterized by FRA with ferret antisera, and 22 (41.5%) were antigenically similar to cell-propagated A/Kansas/14/2017-like reference viruses representing the A(H3N2) component for the 2019-20 Northern Hemisphere influenza vaccines.


Influenza B Viruses
  • B/Victoria: 88 B/Victoria lineage viruses, including viruses from both co-circulating sub-clades, were antigenically characterized by HI with ferret antisera, and 53 (60.2%) were antigenically similar to cell-propagated B/Colorado/06/2017-like reference viruses representing the B/Victoria component for the 2019-20 Northern Hemisphere influenza vaccines.
  • B/Yamagata: 10 B/Yamagata lineage viruses were antigenically characterized by HI with ferret antisera, and all 10 (100%) were antigenically similar to cell-propagated B/Phuket/3073/2013-like reference viruses representing the B/Yamagata component for the 2019-20 Northern Hemisphere influenza vaccines.


CDC assesses susceptibility of influenza viruses to the antiviral medications including the neuraminidase inhibitors (oseltamivir, zanamivir, and peramivir) and the PA endonuclease inhibitor baloxavir using next generation sequence analysis supplemented by laboratory assays. Viruses collected in the United States since September 29, 2019, were tested for antiviral susceptibility as follows:
1,07633926242946
(0.0%)(0.0%)(0.0%)(0.0%)(0.0%)
1 (0.1%)1 (0.3%)(0.0%)(0.0%)(0.0%)
1,07633926242946
(0.0%)(0.0%)(0.0%)(0.0%)(0.0%)
1 (0.1%)1 (0.3%)(0.0%)(0.0%)(0.0%)
1,07633926242946
1 (0.1%)(0.0%)(0.0%)1 (0.2%)(0.0%)
(0.0%)(0.0%)(0.0%)(0.0%)(0.0%)
1,07433826142943
(0.0%)(0.0%)(0.0%)(0.0%)(0.0%)

Antiviral Medication Total Viruses A/H1 A/H3 B/Victoria B/Yamagata Neuraminidase Inhibitors Oseltamivir Viruses Tested Reduced Inhibition Highly Reduced Inhibition Peramivir Viruses Tested Reduced Inhibition
Highly Reduced Inhibition Zanamivir Viruses Tested Reduced Inhibition
Highly Reduced Inhibition PA Endonuclease Inhibitor
Baloxavir Viruses Tested
Reduced Susceptibility

[h=2]Outpatient Illness Surveillance[/h] [h=3]ILINet[/h]
Nationwide during week 3, 5.0% of patient visits reported through the U.S. Outpatient Influenza-like Illness Surveillance Network (ILINet) were due to influenza-like illness (ILI). This percentage is above the national baseline of 2.4%.
national levels of ILI and ARI

View Chart Data (current season only) | View Full Screen

On a regional level, the percentage of outpatient visits for ILI ranged from 3.2% to 7.3% during week 3. All regions reported a percentage of outpatient visits for ILI which is above their region-specific baselines. [h=3]ILI Activity Map[/h]
Data collected in ILINet are used to produce a measure of ILI activity* by state.

During week 3, the following ILI activity levels were experienced:
  • High – New York City, Puerto Rico, and 35 states (Alabama, Arizona, Arkansas, California, Colorado, Connecticut, Georgia, Hawaii, Illinois, Kansas, Kentucky, Louisiana, Maine, Maryland, Massachusetts, Mississippi, Nebraska, New Jersey, New Mexico, New York, North Carolina, North Dakota, Oklahoma, Oregon, Pennsylvania, Rhode Island, South Carolina, Tennessee, Texas, Utah, Virginia, Washington, West Virginia, Wisconsin, and Wyoming)
  • Moderate – the District of Columbia and six states (Florida, Iowa, Minnesota, Missouri, South Dakota, and Vermont)
  • Low – eight states (Alaska, Delaware, Indiana, Michigan, Montana, Nevada, New Hampshire, and Ohio)
  • Minimal – one state (Idaho)
  • Data were insufficient to calculate an ILI activity level from the U.S. Virgin Islands.
[SIZE=-1]*Data collected in ILINet may disproportionally represent certain populations within a state, and therefore, may not accurately depict the full picture of influenza activity for the whole state. Differences in the data presented here by CDC and independently by some state health departments likely represent differing levels of data completeness with data presented by the state likely being the more complete.[/SIZE]


Additional information about medically attended visits for ILI for current and past seasons:
Surveillance Methods | FluView Interactive: National, Regional, and State Data or ILI Activity Map


[h=2]Geographic Spread of Influenza as Assessed by State and Territorial Epidemiologists[/h]
The influenza activity reported by state and territorial epidemiologists indicates geographic spread of influenza viruses but does not measure the severity of influenza activity.

During week 3 the following influenza activity was reported:
  • Widespread – Puerto Rico and 48 states (Alabama, Alaska, Arizona, Arkansas, California, Colorado, Connecticut, Delaware, Florida, Georgia, Idaho, Illinois, Indiana, Iowa, Kansas, Kentucky, Louisiana, Maine, Maryland, Massachusetts, Michigan, Minnesota, Mississippi, Missouri, Montana, Nebraska, Nevada, New Hampshire, New Jersey, New Mexico, New York, North Carolina, North Dakota, Ohio, Oklahoma, Pennsylvania, Rhode Island, South Carolina, South Dakota, Tennessee, Texas, Utah, Vermont, Virginia, Washington, West Virginia, Wisconsin, and Wyoming)
  • Regional – one state (Oregon)
  • Local – the District of Columbia and one state (Hawaii)
  • Sporadic – the U.S. Virgin Islands
  • Guam did not report.
Additional geographic spread surveillance information for current and past seasons:
Surveillance Methods | FluView Interactive

[h=2]Influenza-Associated Hospitalizations[/h]
The Influenza Hospitalization Surveillance Network (FluSurv-NET) conducts population-based surveillance for laboratory-confirmed influenza-related hospitalizations in select counties in the Emerging Infections Program (EIP) states and Influenza Hospitalization Surveillance Project (IHSP) states.

A total of 7,013 laboratory-confirmed influenza-associated hospitalizations were reported by FluSurv-NET sites between October 1, 2019 and January 18, 2020; 4,056 (57.8%) were associated with influenza A virus, 2,914 (41.6%) with influenza B virus, 22 (0.3%) with influenza A virus and influenza B virus co-infection, and 21 (0.3%) with influenza virus for which the type was not determined. Among those with influenza A subtype information, 850 (89.9%) were A(H1N1)pdm09 virus and 96 (10.1%) were A(H3N2).

The overall cumulative hospitalization rate was 24.1 per 100,000 population which is similar to what has been seen during recent previous influenza seasons at this time of year.

Click on graph to launch interactive tool
View Full Screen

The highest rate of hospitalization is among adults aged ≥65, followed by children aged 0-4 years and adults aged 50-64 years.
Overall24.1
0-4 years40.6
5-17 years10.8
18-49 years13.9
50-64 years28.9
65+ years58.1
Age Group 2019-2020 Season
Cumulative Rate per 100,000 Population


Among 903 hospitalized adults with information on underlying medical conditions, 91.9% had at least one reported underlying medical condition, the most commonly reported were cardiovascular disease, metabolic disorder, and obesity. Among 228 hospitalized children with information on underlying medical conditions, 46.1% had at least one underlying medical condition; the most commonly reported was asthma. Among 177 hospitalized women of childbearing age (15-44 years) with information on pregnancy status, 27.7% were pregnant.

Click on graph to launch interactive tool2
View Full Screen

Additional hospitalization surveillance information for current and past seasons and additional age groups:
Surveillance Methods | FluView Interactive


[h=2]Pneumonia and Influenza (P&I) Mortality Surveillance[/h]
Based on National Center for Health Statistics (NCHS) mortality surveillance data available on January 23, 2020, 6.7% of the deaths occurring during the week ending January 11, 2020 (week 2) were due to P&I. This percentage is below the epidemic threshold of 7.1% for week 2.
INFLUENZA Virus Isolated

View Chart Data | View Full Screen

Additional pneumonia and influenza mortality surveillance information for current and past seasons:
Surveillance Methods | FluView Interactive


[h=2]Influenza-Associated Pediatric Mortality[/h]
Fifteen influenza-associated pediatric deaths occurring during the 2019-2020 season between weeks 51 and 3 (the weeks ending December 21, 2019 and January 18, 2020) were reported to CDC during week 3. Nine were associated with influenza B viruses; two had a lineage determined and were both B/Victoria viruses. Six were associated with influenza A viruses, and four were subtyped; all A(H1N1)pdm09 viruses.

One influenza-associated pediatric death occurring during the 2017-2018 season in week 3 (the week ending January 20, 2018) was reported to CDC during week 3, bringing the total during that season to 188. This was associated with an influenza B virus.

Of the 54 influenza-associated pediatric deaths occurring during the 2019-2020 season and reported to CDC:
  • 37 deaths were associated with influenza B viruses. Seven of these had the lineage determined and all were B/Victoria viruses.
  • 17 deaths were associated with influenza A viruses. Ten of these had subtyping performed and all were A(H1N1)pdm09 viruses.
Click on image to launch interactive tool

View Full Screen

Additional pediatric mortality surveillance information for current and past seasons:
Surveillance Methods | FluView Interactive


[h=2]Additional National and International Influenza Surveillance Information[/h]

FluView Interactive: FluView includes enhanced web-based interactive applications that can provide dynamic visuals of the influenza data collected and analyzed by CDC. These FluView Interactive applications allow people to create customized, visual interpretations of influenza data, as well as make comparisons across flu seasons, regions, age groups and a variety of other demographics. To access these tools, visit http://www.cdc.gov/flu/weekly/fluviewinteractive.htm

National Institute for Occupational Safety and Health: Monthly surveillance data on the prevalence of health-related workplace absenteeism among full-time workers in the United States are available from NIOSH at https://www.cdc.gov/niosh/topics/absences/default.html

U.S. State and local influenza surveillance:Select a jurisdiction below to access the latest local influenza information


[TD="width: 139"] Alabama [/TD]
[TD="width: 139"] Alaska [/TD]
[TD="width: 139"] Arizona [/TD]
[TD="width: 139"] Arkansas [/TD]
[TD="width: 139"] California [/TD]

[TD="width: 139"] Colorado [/TD]
[TD="width: 139"] Connecticut [/TD]
[TD="width: 139"] Delaware [/TD]
[TD="width: 139"] District of Columbia [/TD]
[TD="width: 139"] Florida [/TD]

[TD="width: 139"] Georgia [/TD]
[TD="width: 139"] Hawaii [/TD]
[TD="width: 139"] Idaho [/TD]
[TD="width: 139"] Illinois [/TD]
[TD="width: 139"] Indiana [/TD]

[TD="width: 139"] Iowa [/TD]
[TD="width: 139"] Kansas [/TD]
[TD="width: 139"] Kentucky [/TD]
[TD="width: 139"] Louisiana [/TD]
[TD="width: 139"] Maine [/TD]

[TD="width: 139"] Maryland [/TD]
[TD="width: 139"] Massachusetts [/TD]
[TD="width: 139"] Michigan [/TD]
[TD="width: 139"] Minnesota [/TD]
[TD="width: 139"] Mississippi [/TD]

[TD="width: 139"] Missouri [/TD]
[TD="width: 139"] Montana [/TD]
[TD="width: 139"] Nebraska [/TD]
[TD="width: 139"] Nevada [/TD]
[TD="width: 139"] New Hampshire [/TD]

[TD="width: 139"] New Jersey [/TD]
[TD="width: 139"] New Mexico [/TD]
[TD="width: 139"] New York [/TD]
[TD="width: 139"] North Carolina [/TD]
[TD="width: 139"] North Dakota [/TD]

[TD="width: 139"] Ohio [/TD]
[TD="width: 139"] Oklahoma [/TD]
[TD="width: 139"] Oregon [/TD]
[TD="width: 139"] Pennsylvania [/TD]
[TD="width: 139"] Rhode Island [/TD]

[TD="width: 139"] South Carolina [/TD]
[TD="width: 139"] South Dakota [/TD]
[TD="width: 139"] Tennessee [/TD]
[TD="width: 139"] Texas [/TD]
[TD="width: 139"] Utah [/TD]

[TD="width: 139"] Vermont [/TD]
[TD="width: 139"] Virginia [/TD]
[TD="width: 139"] Washington [/TD]
[TD="width: 139"] West Virginia [/TD]
[TD="width: 139"] Wisconsin [/TD]

[TD="width: 139"] Wyoming [/TD]
[TD="width: 139"] New York City [/TD]
[TD="width: 139"] Puerto Rico [/TD]
[TD="width: 139"] Virgin Islands [/TD]
[TD="width: 139"] [/TD]


World Health Organization: Additional influenza surveillance information from participating WHO member nations is available through FluNet and the Global Epidemiology Reports.

WHO Collaborating Centers for Influenza located in Australia, China, Japan, the United Kingdom, and the United States (CDC in Atlanta, Georgia).

Europe: For the most recent influenza surveillance information from Europe, please see WHO/Europe and the European Centre for Disease Prevention and Control at http://www.flunewseurope.org/.

Public Health Agency of Canada: The most up-to-date influenza information from Canada is available at http://www.phac-aspc.gc.ca/fluwatch/

Public Health England: The most up-to-date influenza information from the United Kingdom is available at https://www.gov.uk/government/statistics/weekly-national-flu-reports


Any links provided to non-Federal organizations are provided solely as a service to our users. These links do not constitute an endorsement of these organizations or their programs by CDC or the Federal Government, and none should be inferred. CDC is not responsible for the content of the individual organization web pages found at these links.


An overview of the CDC influenza surveillance system, including methodology and detailed descriptions of each data component, is available at: http://www.cdc.gov/flu/weekly/overview.htm.

--------------------------------------------------------------------------------


Page last reviewed: January 24, 2020, 11:00 AM
Content source: Centers for Disease Control and Prevention, National Center for Immunization and Respiratory Diseases (NCIRD)

https://www.cdc.gov/flu/weekly/index.htm
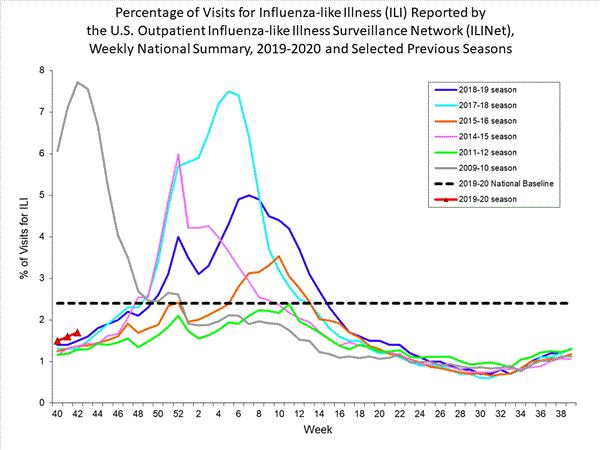
 
[h=1]Weekly U.S. Influenza Surveillance Report[/h]
fluview-banner2.jpg

Key Updates for Week 4, ending January 25, 2020

Key indicators that track flu activity remain high and, after falling during the first two weeks of the year, increased over the last two weeks. Indicators that track severity (hospitalizations and deaths) are not high at this point in the season. [h=4]Viruses[/h]
Clinical Labs
The percentage of respiratory specimens testing positive for influenza at clinical laboratories increased from 25.7% last week to 27.7% this week.

Public Health Labs
Nationally, B/Victoria viruses are the predominant virus this season; however, during recent weeks, slightly more A(H1N1)pdm09 than B/Victoria viruses have been reported.

Virus Characterization
Genetic and antigenic characterization and antiviral susceptibility of influenza viruses collected in the U.S. are summarized in this report. [h=4]Illness[/h] Outpatient Illness: ILINet
Visits to health care providers for influenza-like illness (ILI) increased from 5.1% last week to 5.7% this week. All regions remain above their baselines.

Outpatient Illness: ILI Activity Map
Flu Activity & Surveillance - Flu Activity & Surveillance


The number of jurisdictions experiencing high ILI activity increased from 37 last week to 44 this week.

Geographic Spread
spread-map-week4 - Spread map week 4


The number of jurisdictions reporting regional or widespread influenza activity increased to 51 this week. [h=4]Severe Disease[/h]
Hospitalizations
The overall hospitalization rate for the season increased to 29.7 per 100,000. This is similar to what has been seen at this time during recent seasons.

P&I Mortality
The percentage of deaths attributed to pneumonia and influenza is 6.7%, below the epidemic threshold of 7.2%.

Pediatric Deaths
Fourteen new influenza-associated pediatric deaths occurring during the 2019-2020 season were reported this week. The total for the season is 68.

All data are preliminary and may change as more reports are received.

A description of the CDC influenza surveillance system, including methodology and detailed descriptions of each data component is available on the surveillance methods page.

Additional information on the current and previous influenza seasons for each surveillance component are available on FluView Interactive.

Key Points
  • Outpatient ILI and laboratory data remain elevated and increased again this week. Nationally and in some regions the proportion of influenza A(H1N1)pdm09 viruses compared to influenza B viruses is increasing.
  • Overall, hospitalization rates remain similar to what has been seen at this time during recent seasons, but rates among children and young adults are higher at this time than in recent seasons.
  • Pneumonia and influenza mortality has been low, but 68 influenza-associated deaths in children have been reported so far this season.
  • CDC estimates that so far this season there have been at least 19 million flu illnesses, 180,000 hospitalizations and 10,000 deaths from flu.
  • Flu vaccine effectiveness estimates are not available yet this season, but vaccination is always the best way to prevent flu and its potentially serious complications.
  • Antiviral medications are an important adjunct to flu vaccine in the control of influenza. Almost all (>99%) of the influenza viruses tested this season are susceptible to the four FDA-approved influenza antiviral medications recommended for use in the U.S. this season.
[h=2]U.S. Virologic Surveillance[/h] [h=3]Clinical Laboratories[/h]
The results of tests performed by clinical laboratories nationwide are summarized below. Data from clinical laboratories (the percentage of specimens tested that are positive for influenza) are used to monitor whether influenza activity is increasing or decreasing.
45,949662,536
12,715 (27.7%)107,343 (16.2%)
6,335 (49.8%)40,123 (37.4%)
6,380 (50.2%)67,220 (62.6%)
Week 4 Data Cumulative since
September 29, 2019
(week 40)
No. of specimens tested No. of positive specimens (%) Positive specimens by type Influenza A Influenza B
INFLUENZA Virus Isolated

View Chart Data | View Full Screen [h=3]Public Health Laboratories[/h]
The results of tests performed by public health laboratories nationwide are summarized below. Data from public health laboratories are used to monitor the proportion of circulating viruses that belong to each influenza subtype/lineage.
1,80141,527
1,12921,184
629 (55.7%)9,738 (46.0%)
585 (96.1%)8,261 (87.5%)
24 (3.9%)1,175 (12.5%)
20302
500 (44.3%)11,445 (54.0%)
1 (0.3%)154 (1.8%)
357 (99.7%)8,539 (98.2%)
1422,752
Week 4 Data Cumulative since September 29, 2019
(week 40)
No. of specimens tested No. of positive specimens Positive specimens by type/subtype Influenza A (H1N1)pdm09 H3N2 Subtyping not performed Influenza B Yamagata lineage Victoria lineage Lineage not performed

Nationally influenza B/Victoria viruses have been reported more frequently than other influenza viruses this season. However, during recent weeks, influenza A(H1N1)pdm09 viruses have been reported more frequently than B/Victoria viruses. The predominant virus varies by region. Regional and state level data about circulating influenza viruses can be found on FluView Interactive.

The predominant virus also varies by age group. Nationally, influenza B viruses are the most commonly reported influenza viruses among children and young adults age 0-4 years (58% of reported viruses) and 5-24 years (72% of reported viruses), while A(H1N1)pdm09 viruses are the most commonly reported influenza viruses among persons 25-64 years (50% of reported viruses) and 65 years of age and older (57% of reported viruses). For this season, 53% of influenza positive specimens reported by public health laboratories were among persons less than 25 years of age and only 12% were from persons age 65 and older.
INFLUENZA Virus Isolated

View Chart Data | View Full Screen

Additional virologic surveillance information for current and past seasons:
Surveillance Methods | FluView Interactive: National, Regional, and State Data or Age Data
[h=2]Influenza Virus Characterization[/h]
CDC performs genetic and antigenic characterization of U.S. viruses submitted from state and local health laboratories using Right Size Roadmap submission guidance. These data are used to compare how similar the currently circulating influenza viruses are to the reference viruses used for developing new influenza vaccines and to monitor evolutionary changes that continually occur in circulating influenza. Antigenic characterization data are based on an animal model (influenza-naive ferrets), and do not reflect pre-existing protection provided by past influenza infections and vaccinations. Additional antigenic characterization studies involving people vaccinated with current influenza vaccines are conducted later in the season; these data account for pre-existing protection in different populations against circulating influenza viruses. Genetic and antigenic characterization data are not used to make calculations about vaccine effectiveness (VE). CDC conducts VE studies each year to measure the benefits of flu vaccines in people.

CDC genetically characterized 1,128 influenza viruses collected in the U.S. from September 29, 2019, to January 25, 2020.
354
6B.1A354 (100%)
276
3C.2a268 (97.1%)2a1268 (97.1%)
2a20
2a30
2a40
3C.3a8 (2.9%)3a8 (2.9%)
451
V1A451 (100%)V1A0
V1A.140 (8.9%)
V1A.3411 (91.1%)
47
Y347 (100%)

Virus Subtype or Lineage Genetic Characterization
Total No. of Subtype/Lineage Tested Clade Number (% of subtype/lineage tested) Subclade Number (% of subtype/lineage tested) A/H1 A/H3 B/Victoria B/Yamagata

CDC antigenically characterizes a subset of influenza viruses by hemagglutination inhibition (HI) or neutralization based Focus Reduction assays (FRA). Antigenic drift is evaluated by comparing antigenic properties of cell-propagated reference viruses representing currently recommended vaccine components with those of cell-propagated circulating viruses. CDC antigenically characterized 225 influenza viruses collected in the United States from September 29, 2019, to January 25, 2020. These data are not used to make calculations about vaccine effectiveness (VE). CDC conducts VE studies each year to measure the benefits of flu vaccines in people.

Influenza A Viruses
  • A (H1N1)pdm09: 74 A(H1N1)pdm09 viruses were antigenically characterized by HI with ferret antisera, and all were antigenically similar (reacting at titers that were within 4-fold of the homologous virus titer) to cell-propagated A/Brisbane/02/2018-like reference viruses representing the A(H1N1)pdm09 component for the 2019-20 Northern Hemisphere influenza vaccines.
  • A (H3N2): 53 A(H3N2) viruses were antigenically characterized by FRA with ferret antisera, and 22 (41.5%) were antigenically similar to cell-propagated A/Kansas/14/2017-like reference viruses representing the A(H3N2) component for the 2019-20 Northern Hemisphere influenza vaccines.


Influenza B Viruses
  • B/Victoria: 88 B/Victoria lineage viruses, including viruses from both co-circulating sub-clades, were antigenically characterized by HI with ferret antisera, and 53 (60.2%) were antigenically similar to cell-propagated B/Colorado/06/2017-like reference viruses representing the B/Victoria component for the 2019-20 Northern Hemisphere influenza vaccines.
  • B/Yamagata: 10 B/Yamagata lineage viruses were antigenically characterized by HI with ferret antisera, and all 10 (100%) were antigenically similar to cell-propagated B/Phuket/3073/2013-like reference viruses representing the B/Yamagata component for the 2019-20 Northern Hemisphere influenza vaccines.


CDC assesses susceptibility of influenza viruses to the antiviral medications including the neuraminidase inhibitors (oseltamivir, zanamivir, and peramivir) and the PA endonuclease inhibitor baloxavir using next generation sequence analysis supplemented by laboratory assays. Viruses collected in the United States since September 29, 2019, were tested for antiviral susceptibility as follows:
1,11935527044747
(0.0%)(0.0%)(0.0%)(0.0%)(0.0%)
1 (0.1%)1 (0.3%)(0.0%)(0.0%)(0.0%)
1,11935527044747
(0.0%)(0.0%)(0.0%)(0.0%)(0.0%)
1 (0.1%)1 (0.3%)(0.0%)(0.0%)(0.0%)
1,11935527044747
1 (0.1%)(0.0%)(0.0%)1 (0.2%)(0.0%)
(0.0%)(0.0%)(0.0%)(0.0%)(0.0%)
1,11535227044647
(0.0%)(0.0%)(0.0%)(0.0%)(0.0%)

Antiviral Medication Total Viruses A/H1 A/H3 B/Victoria B/Yamagata Neuraminidase Inhibitors Oseltamivir Viruses Tested Reduced Inhibition Highly Reduced Inhibition Peramivir Viruses Tested Reduced Inhibition
Highly Reduced Inhibition Zanamivir Viruses Tested Reduced Inhibition
Highly Reduced Inhibition PA Endonuclease Inhibitor
Baloxavir Viruses Tested
Reduced Susceptibility

[h=2]Outpatient Illness Surveillance[/h] [h=3]ILINet[/h]
Nationwide during week 4, 5.7% of patient visits reported through the U.S. Outpatient Influenza-like Illness Surveillance Network (ILINet) were due to influenza-like illness (ILI). This percentage is above the national baseline of 2.4%.
national levels of ILI and ARI

View Chart Data (current season only) | View Full Screen

On a regional level, the percentage of outpatient visits for ILI ranged from 4.1% to 7.7% during week 4. All regions reported a percentage of outpatient visits for ILI which is above their region-specific baselines. [h=3]ILI Activity Map[/h]
Data collected in ILINet are used to produce a measure of ILI activity* by state.

During week 4, the following ILI activity levels were experienced:
  • High – the District of Columbia, New York City, Puerto Rico, and 41 states (Alabama, Arizona, Arkansas, California, Colorado, Connecticut, Florida, Georgia, Hawaii, Illinois, Indiana, Kansas, Kentucky, Louisiana, Maine, Maryland, Massachusetts, Minnesota, Mississippi, Missouri, Nebraska, New Jersey, New Mexico, New York, North Carolina, North Dakota, Oklahoma, Oregon, Pennsylvania, Rhode Island, South Carolina, South Dakota, Tennessee, Texas, Utah, Vermont, Virginia, Washington, West Virginia, Wisconsin, and Wyoming)
  • Moderate – seven states (Alaska, Iowa, Michigan, Montana, Nevada, New Hampshire, and Ohio)
  • Data were insufficient to calculate an ILI activity level from the U.S. Virgin Islands and two states (Delaware and Idaho).
[SIZE=-1]*Data collected in ILINet may disproportionally represent certain populations within a state, and therefore, may not accurately depict the full picture of influenza activity for the whole state. Differences in the data presented here by CDC and independently by some state health departments likely represent differing levels of data completeness with data presented by the state likely being the more complete.[/SIZE]


Additional information about medically attended visits for ILI for current and past seasons:
Surveillance Methods | FluView Interactive: National, Regional, and State Data or ILI Activity Map


[h=2]Geographic Spread of Influenza as Assessed by State and Territorial Epidemiologists[/h]
The influenza activity reported by state and territorial epidemiologists indicates geographic spread of influenza viruses but does not measure the severity of influenza activity.

During week 4 the following influenza activity was reported:
  • Widespread – Puerto Rico and 49 states (Alabama, Alaska, Arizona, Arkansas, California, Colorado, Connecticut, Delaware, Florida, Georgia, Idaho, Illinois, Indiana, Iowa, Kansas, Kentucky, Louisiana, Maine, Maryland, Massachusetts, Michigan, Minnesota, Mississippi, Missouri, Montana, Nebraska, Nevada, New Hampshire, New Jersey, New Mexico, New York, North Carolina, North Dakota, Ohio, Oklahoma, Oregon, Pennsylvania, Rhode Island, South Carolina, South Dakota, Tennessee, Texas, Utah, Vermont, Virginia, Washington, West Virginia, Wisconsin, and Wyoming)
  • Regional – one state (Hawaii)
  • Local – the District of Columbia
  • Sporadic – the U.S. Virgin Islands
  • Guam did not report.
Additional geographic spread surveillance information for current and past seasons:
Surveillance Methods | FluView Interactive

[h=2]Influenza-Associated Hospitalizations[/h]
The Influenza Hospitalization Surveillance Network (FluSurv-NET) conducts population-based surveillance for laboratory-confirmed influenza-related hospitalizations in select counties in the Emerging Infections Program (EIP) states and Influenza Hospitalization Surveillance Project (IHSP) states.

A total of 8,633 laboratory-confirmed influenza-associated hospitalizations were reported by FluSurv-NET sites between October 1, 2019 and January 25, 2020; 5,173 (59.9%) were associated with influenza A virus, 3,401 (39.4%) with influenza B virus, 27 (0.3%) with influenza A virus and influenza B virus co-infection, and 32 (0.4%) with influenza virus for which the type was not determined. Among those with influenza A subtype information, 1,080 (91.1%) were A(H1N1)pdm09 virus and 106 (8.9%) were A(H3N2).

The overall cumulative hospitalization rate was 29.7 per 100,000 population which is similar to what has been seen during recent previous influenza seasons at this time of year. Rates in children and young adults are higher than at this time in recent seasons.

Click on graph to launch interactive tool
View Full Screen

The highest rate of hospitalization is among adults aged ≥65, followed by children aged 0-4 years and adults aged 50-64 years.
Overall29.7
0-4 years48.8
5-17 years13.4
18-49 years16.9
50-64 years36.7
65+ years71.3
Age Group 2019-2020 Season
Cumulative Rate per 100,000 Population


Among 1,108 hospitalized adults with information on underlying medical conditions, 91.5% had at least one reported underlying medical condition, the most commonly reported were cardiovascular disease, metabolic disorder, obesity, and chronic lung disease. Among 271 hospitalized children with information on underlying medical conditions, 46.5% had at least one underlying medical condition; the most commonly reported was asthma. Among 216 hospitalized women of childbearing age (15-44 years) with information on pregnancy status, 26.4% were pregnant.

Click on graph to launch interactive tool2
View Full Screen

Additional hospitalization surveillance information for current and past seasons and additional age groups:
Surveillance Methods | FluView Interactive


[h=2]Pneumonia and Influenza (P&I) Mortality Surveillance[/h]
Based on National Center for Health Statistics (NCHS) mortality surveillance data available on January 30, 2020, 6.7% of the deaths occurring during the week ending January 18, 2020 (week 3) were due to P&I. This percentage is below the epidemic threshold of 7.2% for week 3.
INFLUENZA Virus Isolated

View Chart Data | View Full Screen

Additional pneumonia and influenza mortality surveillance information for current and past seasons:
Surveillance Methods | FluView Interactive


[h=2]Influenza-Associated Pediatric Mortality[/h]
Fourteen influenza-associated pediatric deaths occurring during the 2019-2020 season between weeks 45 and 4 (the weeks ending November 9, 2019 and January 25, 2020) were reported to CDC during week 4. Eight were associated with influenza B viruses; one had a lineage determined and was a B/Victoria virus. Six were associated with influenza A viruses, and three were subtyped; all were A(H1N1)pdm09 viruses.

Of the 68 influenza-associated pediatric deaths occurring during the 2019-2020 season and reported to CDC:
  • 45 deaths were associated with influenza B viruses, and eight had a lineage determined; all were B/Victoria viruses.
  • 23 deaths were associated with influenza A viruses, and 13 were subtyped; all were A(H1N1)pdm09 viruses.
Click on image to launch interactive tool

View Full Screen

Additional pediatric mortality surveillance information for current and past seasons:
Surveillance Methods | FluView Interactive


[h=2]Additional National and International Influenza Surveillance Information[/h]

FluView Interactive: FluView includes enhanced web-based interactive applications that can provide dynamic visuals of the influenza data collected and analyzed by CDC. These FluView Interactive applications allow people to create customized, visual interpretations of influenza data, as well as make comparisons across flu seasons, regions, age groups and a variety of other demographics. To access these tools, visit http://www.cdc.gov/flu/weekly/fluviewinteractive.htm

National Institute for Occupational Safety and Health: Monthly surveillance data on the prevalence of health-related workplace absenteeism among full-time workers in the United States are available from NIOSH at https://www.cdc.gov/niosh/topics/absences/default.html

U.S. State and local influenza surveillance:Select a jurisdiction below to access the latest local influenza information


[TD="width: 139"] Alabama [/TD]
[TD="width: 139"] Alaska [/TD]
[TD="width: 139"] Arizona [/TD]
[TD="width: 139"] Arkansas [/TD]
[TD="width: 139"] California [/TD]

[TD="width: 139"] Colorado [/TD]
[TD="width: 139"] Connecticut [/TD]
[TD="width: 139"] Delaware [/TD]
[TD="width: 139"] District of Columbia [/TD]
[TD="width: 139"] Florida [/TD]

[TD="width: 139"] Georgia [/TD]
[TD="width: 139"] Hawaii [/TD]
[TD="width: 139"] Idaho [/TD]
[TD="width: 139"] Illinois [/TD]
[TD="width: 139"] Indiana [/TD]

[TD="width: 139"] Iowa [/TD]
[TD="width: 139"] Kansas [/TD]
[TD="width: 139"] Kentucky [/TD]
[TD="width: 139"] Louisiana [/TD]
[TD="width: 139"] Maine [/TD]

[TD="width: 139"] Maryland [/TD]
[TD="width: 139"] Massachusetts [/TD]
[TD="width: 139"] Michigan [/TD]
[TD="width: 139"] Minnesota [/TD]
[TD="width: 139"] Mississippi [/TD]

[TD="width: 139"] Missouri [/TD]
[TD="width: 139"] Montana [/TD]
[TD="width: 139"] Nebraska [/TD]
[TD="width: 139"] Nevada [/TD]
[TD="width: 139"] New Hampshire [/TD]

[TD="width: 139"] New Jersey [/TD]
[TD="width: 139"] New Mexico [/TD]
[TD="width: 139"] New York [/TD]
[TD="width: 139"] North Carolina [/TD]
[TD="width: 139"] North Dakota [/TD]

[TD="width: 139"] Ohio [/TD]
[TD="width: 139"] Oklahoma [/TD]
[TD="width: 139"] Oregon [/TD]
[TD="width: 139"] Pennsylvania [/TD]
[TD="width: 139"] Rhode Island [/TD]

[TD="width: 139"] South Carolina [/TD]
[TD="width: 139"] South Dakota [/TD]
[TD="width: 139"] Tennessee [/TD]
[TD="width: 139"] Texas [/TD]
[TD="width: 139"] Utah [/TD]

[TD="width: 139"] Vermont [/TD]
[TD="width: 139"] Virginia [/TD]
[TD="width: 139"] Washington [/TD]
[TD="width: 139"] West Virginia [/TD]
[TD="width: 139"] Wisconsin [/TD]

[TD="width: 139"] Wyoming [/TD]
[TD="width: 139"] New York City [/TD]
[TD="width: 139"] Puerto Rico [/TD]
[TD="width: 139"] Virgin Islands [/TD]
[TD="width: 139"] [/TD]


World Health Organization: Additional influenza surveillance information from participating WHO member nations is available through FluNet and the Global Epidemiology Reports.

WHO Collaborating Centers for Influenza located in Australia, China, Japan, the United Kingdom, and the United States (CDC in Atlanta, Georgia).

Europe: For the most recent influenza surveillance information from Europe, please see WHO/Europe and the European Centre for Disease Prevention and Control at http://www.flunewseurope.org/.

Public Health Agency of Canada: The most up-to-date influenza information from Canada is available at http://www.phac-aspc.gc.ca/fluwatch/

Public Health England: The most up-to-date influenza information from the United Kingdom is available at https://www.gov.uk/government/statistics/weekly-national-flu-reports


Any links provided to non-Federal organizations are provided solely as a service to our users. These links do not constitute an endorsement of these organizations or their programs by CDC or the Federal Government, and none should be inferred. CDC is not responsible for the content of the individual organization web pages found at these links.


An overview of the CDC influenza surveillance system, including methodology and detailed descriptions of each data component, is available at: http://www.cdc.gov/flu/weekly/overview.htm.

--------------------------------------------------------------------------------


Page last reviewed: January 31, 2020, 11:00 AM
Content source: Centers for Disease Control and Prevention, National Center for Immunization and Respiratory Diseases (NCIRD)Seasonal Influenza (Flu)
What CDC Does
email_03Get Email Updates

To receive weekly email updates about Seasonal Flu, enter your email address: Email Address
What's this?
Submit
H1N1 Flu Pandemic 2009-2019: A Decade Later - H1N1 Flu Pandemic 2009-2019: A Decade Later

Influenza Types
https://www.cdc.gov/flu/weekly/index.htm
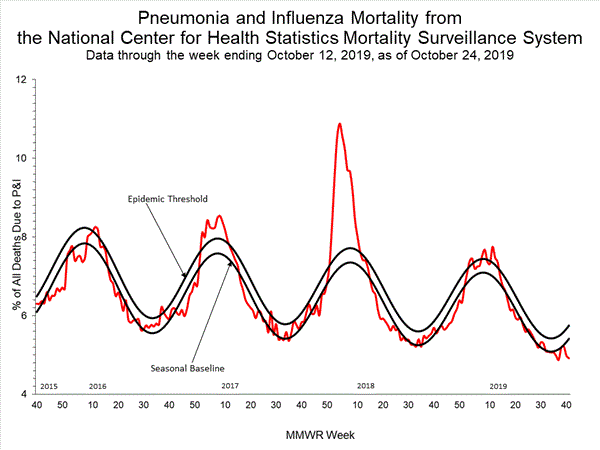
 
[h=1]Weekly U.S. Influenza Surveillance Report[/h]
fluview-banner2.jpg

Key Updates for Week 5, ending February 1, 2020

Key indicators that track flu activity remain high and, after falling during the first two weeks of the year, increased over the last three weeks. Indicators that track overall severity (hospitalizations and deaths) are not high at this point in the season. [h=4]Viruses[/h]
Clinical Labs
The percentage of respiratory specimens testing positive for influenza at clinical laboratories increased from 28.4% last week to 29.8% this week.

Public Health Labs
Numbers of influenza B/Victoria and A(H1N1)pdm09 viruses are approximately equal for the season overall, with continued increases in influenza A(H1N1)pdm09 viruses in recent weeks.

Virus Characterization
Genetic and antigenic characterization and antiviral susceptibility of influenza viruses collected in the U.S. are summarized in this report. [h=4]Illness[/h] Outpatient Illness: ILINet
Visits to health care providers for influenza-like illness (ILI) increased from 6.0% last week to 6.7% this week. All regions remain above their baselines.

Outpatient Illness: ILINet Activity Map
Flu Activity & Surveillance - Flu Activity & Surveillance


The number of jurisdictions experiencing high ILI activity increased from 44 last week to 47 this week.

Geographic Spread
spread map week 5 - Flu Spread Map


The number of jurisdictions reporting regional or widespread influenza activity remained at 51 this week. [h=4]Severe Disease[/h]
Hospitalizations
The overall hospitalization rate for the season increased to 35.5 per 100,000. This is similar to what has been seen at this time during recent seasons.

P&I Mortality
The percentage of deaths attributed to pneumonia and influenza is 7.1%, below the epidemic threshold of 7.2%.

Pediatric Deaths
10 influenza-associated pediatric deaths occurring during the 2019-2020 season were reported this week. The total for the season is 78.

All data are preliminary and may change as more reports are received.

A description of the CDC influenza surveillance system, including methodology and detailed descriptions of each data component is available on the surveillance methods page.

Additional information on the current and previous influenza seasons for each surveillance component are available on FluView Interactive.

Key Points
  • Outpatient ILI and laboratory data remain elevated and increased again this week. Nationally, and in some regions, the proportion of influenza A(H1N1)pdm09 viruses compared to influenza B viruses is increasing.
  • Overall, hospitalization rates remain similar to this time during recent seasons, but rates among children and young adults are higher at this time than in recent seasons.
  • Pneumonia and influenza mortality has been low, but 78 influenza-associated deaths in children have been reported so far this season.
  • CDC estimates that so far this season there have been at least 22 million flu illnesses, 210,000 hospitalizations and 12,000 deaths from flu.
  • Flu vaccine effectiveness estimates will be available later this month, but vaccination is always the best way to prevent flu and its potentially serious complications.
  • Antiviral medications are an important adjunct to flu vaccine in the control of influenza. Almost all (>99%) of the influenza viruses tested this season are susceptible to the four FDA-approved influenza antiviral medications recommended for use in the U.S. this season.
[h=2]U.S. Virologic Surveillance[/h] [h=3]Clinical Laboratories[/h]
The results of tests performed by clinical laboratories nationwide are summarized below. Data from clinical laboratories (the percentage of specimens tested that are positive for influenza) are used to monitor whether influenza activity is increasing or decreasing.
53,247738,331
15,875 (29.8%)129,997 (17.6%)
8,637 (54.4%)52,928 (40.7%)
7,238 (45.6%)77,069 (59.3%)
Week 5 Data Cumulative since
September 29, 2019
(week 40)
No. of specimens tested No. of positive specimens (%) Positive specimens by type Influenza A Influenza B


The predominant virus also varies by age group. Nationally, for the season overall, influenza B viruses are the most commonly reported influenza viruses among children and young adults age 0-4 years (56% of reported viruses) and 5-24 years (73% of reported viruses), while A(H1N1)pdm09 viruses are the most commonly reported influenza viruses among persons 25-64 years (53% of reported viruses) and 65 years of age and older (60% of reported viruses). For this season, 52% of influenza positive specimens reported by public health laboratories were among persons less than 25 years of age and less than 13% were from persons age 65 and older.
INFLUENZA Virus Isolated

View Chart Data | View Full Screen [h=3]Public Health Laboratories[/h]
The results of tests performed by public health laboratories nationwide are summarized below. Data from public health laboratories are used to monitor the proportion of circulating viruses that belong to each influenza subtype/lineage.
2,12946,258
1,36524,403
898 (65.8%)11,670 (47.8%)
810 (95.7%)10,087 (88.9%)
36 (4.3%)1,255 (11.1%)
52328
467 (34.2%)12,733 (52.2%)
2 (0.5%)168 (1.7%)
393 (99.5%)9,765 (98.3%)
722,800
Week 5 Data Cumulative since September 29, 2019
(week 40)
No. of specimens tested No. of positive specimens Positive specimens by type/subtype Influenza A (H1N1)pdm09 H3N2 Subtyping not performed Influenza B Yamagata lineage Victoria lineage Lineage not performed

Nationally, influenza B/Victoria viruses have been reported more frequently than other influenza viruses this season. However, during recent weeks, influenza A(H1N1)pdm09 viruses have been reported more frequently than B/Victoria viruses. The predominant virus varies by region. Regional and state level data about circulating influenza viruses can be found on FluView Interactive.
INFLUENZA Virus Isolated

View Chart Data | View Full Screen

Additional virologic surveillance information for current and past seasons:
Surveillance Methods | FluView Interactive: National, Regional, and State Data or Age Data
[h=2]Influenza Virus Characterization[/h]
CDC performs genetic and antigenic characterization of U.S. viruses submitted from state and local health laboratories using Right Size Roadmap submission guidance. These data are used to compare how similar the currently circulating influenza viruses are to the reference viruses used for developing new influenza vaccines and to monitor evolutionary changes that continually occur in circulating influenza. Antigenic characterization data are based on an animal model (influenza-naive ferrets), and do not reflect pre-existing protection provided by past influenza infections and vaccinations. Additional antigenic characterization studies involving people vaccinated with current influenza vaccines are conducted later in the season; these data account for pre-existing protection in different populations against circulating influenza viruses. Genetic and antigenic characterization data are not used to make calculations about vaccine effectiveness (VE). CDC conducts VE studies each year to measure the benefits of flu vaccines in people.

CDC genetically characterized 1,260 influenza viruses collected in the U.S. from September 29, 2019, to February 1, 2020.
397
6B.1A397 (100%)
301
3C.2a290 (96.3%)2a1290 (96.3%)
2a20
2a30
2a40
3C.3a11 (3.7%)3a11 (3.7%)
509
V1A509 (100%)V1A0
V1A.142 (8.3%)
V1A.3467 (91.7%)
53
Y353 (100%)

Virus Subtype or Lineage Genetic Characterization
Total No. of Subtype/Lineage Tested Clade Number (% of subtype/lineage tested) Subclade Number (% of subtype/lineage tested) A/H1 A/H3 B/Victoria B/Yamagata

CDC antigenically characterizes a subset of influenza viruses by hemagglutination inhibition (HI) or neutralization based Focus Reduction assays (FRA). Antigenic drift is evaluated by comparing antigenic properties of cell-propagated reference viruses representing currently recommended vaccine components with those of cell-propagated circulating viruses. CDC antigenically characterized 241 influenza viruses collected in the United States from September 29, 2019, to February 1, 2020. These data are not used to make calculations about vaccine effectiveness (VE). CDC conducts VE studies each year to measure the benefits of flu vaccines in people.

Influenza A Viruses
  • A (H1N1)pdm09: 74 A(H1N1)pdm09 viruses were antigenically characterized by HI with ferret antisera, and all 74 (100%) were antigenically similar (reacting at titers that were within 4-fold of the homologous virus titer) to cell-propagated A/Brisbane/02/2018-like reference viruses representing the A(H1N1)pdm09 component for the 2019-20 Northern Hemisphere influenza vaccines.
  • A (H3N2): 69 A(H3N2) viruses were antigenically characterized by FRA with ferret antisera, and 30 (43.5%) were antigenically similar to cell-propagated A/Kansas/14/2017-like reference viruses representing the A(H3N2) component for the 2019-20 Northern Hemisphere influenza vaccines.


Influenza B Viruses
  • B/Victoria: 88 B/Victoria lineage viruses, including viruses from both co-circulating sub-clades, were antigenically characterized by HI with ferret antisera, and 53 (60.2%) were antigenically similar to cell-propagated B/Colorado/06/2017-like reference viruses representing the B/Victoria component for the 2019-20 Northern Hemisphere influenza vaccines.
  • B/Yamagata: 10 B/Yamagata lineage viruses were antigenically characterized by HI with ferret antisera, and all 10 (100%) were antigenically similar to cell-propagated B/Phuket/3073/2013-like reference viruses representing the B/Yamagata component for the 2019-20 Northern Hemisphere influenza vaccines.


CDC assesses susceptibility of influenza viruses to the antiviral medications including the neuraminidase inhibitors (oseltamivir, zanamivir, and peramivir) and the PA endonuclease inhibitor baloxavir using next generation sequence analysis supplemented by laboratory assays. Viruses collected in the United States since September 29, 2019, were tested for antiviral susceptibility as follows:
1,19237428748150
(0.0%)(0.0%)(0.0%)(0.0%)(0.0%)
1 (0.1%)1 (0.3%)(0.0%)(0.0%)(0.0%)
1,19237428748150
(0.0%)(0.0%)(0.0%)(0.0%)(0.0%)
1 (0.1%)1 (0.3%)(0.0%)(0.0%)(0.0%)
1,19237428748150
1 (0.1%)(0.0%)(0.0%)1 (0.2%)(0.0%)
(0.0%)(0.0%)(0.0%)(0.0%)(0.0%)
1,24639529450453
(0.0%)(0.0%)(0.0%)(0.0%)(0.0%)

Antiviral Medication Total Viruses A/H1 A/H3 B/Victoria B/Yamagata Neuraminidase Inhibitors Oseltamivir Viruses Tested Reduced Inhibition Highly Reduced Inhibition Peramivir Viruses Tested Reduced Inhibition
Highly Reduced Inhibition Zanamivir Viruses Tested Reduced Inhibition
Highly Reduced Inhibition PA Endonuclease Inhibitor
Baloxavir Viruses Tested
Reduced Susceptibility


A total of 259 additional viruses (118 H1pdm09, 19 H3, and 122 B) collected in Alabama, Alaska, Florida, Illinois, Iowa, Michigan, Nevada, New York, North Carolina, Pennsylvania, Virginia, and Wisconsin were analyzed for resistance to neuraminidase inhibitors by pyrosequencing assay. Two (1.7%) of the 118 A(H1N1)pdm09 viruses tested had the H275Y amino acid substitution in the neuraminidase that confers resistance to oseltamivir and potential resistance to peramivir. No markers of resistance to neuraminidase inhibitors were detected in A(H3N2) and type B viruses tested.

[h=2]Outpatient Illness Surveillance[/h] [h=3]ILINet[/h]
Nationwide during week 5, 6.7% of patient visits reported through the U.S. Outpatient Influenza-like Illness Surveillance Network (ILINet) were due to influenza-like illness (ILI). This percentage is above the national baseline of 2.4%.
national levels of ILI and ARI

View Chart Data (current season only) | View Full Screen

On a regional level, the percentage of outpatient visits for ILI ranged from 4.0% to 10.9% during week 5. All regions reported a percentage of outpatient visits for ILI above their region-specific baselines. [h=3]ILI Activity Map[/h]
Data collected in ILINet are used to produce a measure of ILI activity* by state.

During week 5, the following ILI activity levels were experienced:
  • High – New York City, Puerto Rico, and 45 states (Alabama, Arizona, Arkansas, California, Colorado, Connecticut, Florida, Georgia, Hawaii, Illinois, Indiana, Iowa, Kansas, Kentucky, Louisiana, Maine, Maryland, Massachusetts, Michigan, Minnesota, Mississippi, Missouri, Montana, Nebraska, New Jersey, New Mexico, New York, North Carolina, North Dakota, Ohio, Oklahoma, Oregon, Pennsylvania, Rhode Island, South Carolina, South Dakota, Tennessee, Texas, Utah, Vermont, Virginia, Washington, West Virginia, Wisconsin, and Wyoming)
  • Moderate – the District of Columbia, the U.S. Virgin Islands, and two states (Nevada and New Hampshire)
  • Low - two states (Alaska and Delaware)
  • Minimal - one state (Idaho)
[SIZE=-1]*Data collected in ILINet may disproportionally represent certain populations within a state, and therefore, may not accurately depict the full picture of influenza activity for the whole state. Differences in the data presented here by CDC and independently by some state health departments likely represent differing levels of data completeness with data presented by the state likely being the more complete.[/SIZE]


Additional information about medically attended visits for ILI for current and past seasons:
Surveillance Methods | FluView Interactive: National, Regional, and State Data or ILI Activity Map


[h=2]Geographic Spread of Influenza as Assessed by State and Territorial Epidemiologists[/h]
The influenza activity reported by state and territorial epidemiologists indicates geographic spread of influenza viruses but does not measure the severity of influenza activity.

During week 5, the following influenza activity was reported:
  • Widespread – Puerto Rico and 48 states (Alabama, Alaska, Arizona, Arkansas, California, Colorado, Connecticut, Delaware, Florida, Georgia, Idaho, Illinois, Indiana, Iowa, Kansas, Kentucky, Louisiana, Maine, Maryland, Massachusetts, Michigan, Minnesota, Mississippi, Missouri, Montana, Nebraska, Nevada, New Hampshire, New Jersey, New Mexico, New York, North Carolina, North Dakota, Ohio, Oklahoma, Pennsylvania, Rhode Island, South Carolina, South Dakota, Tennessee, Texas, Utah, Vermont, Virginia, Washington, West Virginia, Wisconsin, and Wyoming)
  • Regional – two states (Hawaii and Oregon)
  • Local – the District of Columbia
  • Sporadic – the U.S. Virgin Islands
  • Guam did not report.
Additional geographic spread surveillance information for current and past seasons:
Surveillance Methods | FluView Interactive

[h=2]Influenza-Associated Hospitalizations[/h]
The Influenza Hospitalization Surveillance Network (FluSurv-NET) conducts population-based surveillance for laboratory-confirmed influenza-related hospitalizations in select counties in the Emerging Infections Program (EIP) states and Influenza Hospitalization Surveillance Project (IHSP) states.

A total of 10,314 laboratory-confirmed influenza-associated hospitalizations were reported by FluSurv-NET sites between October 1, 2019 and February 1, 2020; 6,416 (62.2%) were associated with influenza A virus, 3,835 (37.2%) with influenza B virus, 31 (0.3%) with influenza A virus and influenza B virus co-infection, and 32 (0.3%) with influenza virus for which the type was not determined. Among those with influenza A subtype information, 1,397 (92.6%) were A(H1N1)pdm09 virus and 112 (7.4%) were A(H3N2).

The overall cumulative hospitalization rate was 35.5 per 100,000 population which is similar to what has been seen during recent previous influenza seasons at this time of year. Rates in children and young adults are higher than at this time in recent seasons.

Click on graph to launch interactive tool
View Full Screen

The highest rate of hospitalization is among adults aged ≥65, followed by children aged 0-4 years and adults aged 50-64 years.
Overall35.5
0-4 years56.9
5-17 years15.1
18-49 years20.2
50-64 years44.9
65+ years85.1
Age Group 2019-2020 Season
Cumulative Rate per 100,000 Population


Among 1,332 hospitalized adults with information on underlying medical conditions, 91.6% had at least one reported underlying medical condition, the most commonly reported were cardiovascular disease, metabolic disorder, obesity, and chronic lung disease. Among 297 hospitalized children with information on underlying medical conditions, 46.5% had at least one underlying medical condition; the most commonly reported was asthma. Among 253 hospitalized women of childbearing age (15-44 years) with information on pregnancy status, 25.3% were pregnant.

Click on graph to launch interactive tool2
View Full Screen

Additional hospitalization surveillance information for current and past seasons and additional age groups:
Surveillance Methods | FluView Interactive: Rates by Age or Patient Characteristics


[h=2]Pneumonia and Influenza (P&I) Mortality Surveillance[/h]
Based on National Center for Health Statistics (NCHS) mortality surveillance data available on February 6, 2020, 7.1% of the deaths occurring during the week ending January 25, 2020 (week 4) were due to P&I. This percentage is below the epidemic threshold of 7.2% for week 4.
INFLUENZA Virus Isolated

View Chart Data | View Full Screen

Additional pneumonia and influenza mortality surveillance information for current and past seasons:
Surveillance Methods | FluView Interactive


[h=2]Influenza-Associated Pediatric Mortality[/h]
Ten influenza-associated pediatric deaths occurring during the 2019-2020 season between weeks 1 and 4 (the weeks ending January 4, 2020 and January 25, 2020) were reported to CDC during week 5. Seven were associated with influenza B viruses; none had a lineage determined. Three were associated with influenza A viruses, and one was subtyped and was an A(H1N1)pdm09 virus.

One influenza-associated pediatric death occurring during the 2018-2019 season in week 30 (the week ending July 27, 2019) was reported to CDC during week 5, bringing the total during that season to 144. This was associated with an influenza A virus.

Of the 78 influenza-associated pediatric deaths occurring during the 2019-2020 season and reported to CDC:
  • 52 deaths were associated with influenza B viruses, and nine had a lineage determined; all were B/Victoria viruses.
  • 26 deaths were associated with influenza A viruses, and 16 were subtyped; all were A(H1N1)pdm09 viruses.
Click on image to launch interactive tool

View Full Screen

Additional pediatric mortality surveillance information for current and past seasons:
Surveillance Methods | FluView Interactive


[h=2]Additional National and International Influenza Surveillance Information[/h]

FluView Interactive: FluView includes enhanced web-based interactive applications that can provide dynamic visuals of the influenza data collected and analyzed by CDC. These FluView Interactive applications allow people to create customized, visual interpretations of influenza data, as well as make comparisons across flu seasons, regions, age groups and a variety of other demographics. To access these tools, visit http://www.cdc.gov/flu/weekly/fluviewinteractive.htm

National Institute for Occupational Safety and Health: Monthly surveillance data on the prevalence of health-related workplace absenteeism among full-time workers in the United States are available from NIOSH at https://www.cdc.gov/niosh/topics/absences/default.html

U.S. State and local influenza surveillance:Select a jurisdiction below to access the latest local influenza information


[TD="width: 139"] Alabama [/TD]
[TD="width: 139"] Alaska [/TD]
[TD="width: 139"] Arizona [/TD]
[TD="width: 139"] Arkansas [/TD]
[TD="width: 139"] California [/TD]

[TD="width: 139"] Colorado [/TD]
[TD="width: 139"] Connecticut [/TD]
[TD="width: 139"] Delaware [/TD]
[TD="width: 139"] District of Columbia [/TD]
[TD="width: 139"] Florida [/TD]

[TD="width: 139"] Georgia [/TD]
[TD="width: 139"] Hawaii [/TD]
[TD="width: 139"] Idaho [/TD]
[TD="width: 139"] Illinois [/TD]
[TD="width: 139"] Indiana [/TD]

[TD="width: 139"] Iowa [/TD]
[TD="width: 139"] Kansas [/TD]
[TD="width: 139"] Kentucky [/TD]
[TD="width: 139"] Louisiana [/TD]
[TD="width: 139"] Maine [/TD]

[TD="width: 139"] Maryland [/TD]
[TD="width: 139"] Massachusetts [/TD]
[TD="width: 139"] Michigan [/TD]
[TD="width: 139"] Minnesota [/TD]
[TD="width: 139"] Mississippi [/TD]

[TD="width: 139"] Missouri [/TD]
[TD="width: 139"] Montana [/TD]
[TD="width: 139"] Nebraska [/TD]
[TD="width: 139"] Nevada [/TD]
[TD="width: 139"] New Hampshire [/TD]

[TD="width: 139"] New Jersey [/TD]
[TD="width: 139"] New Mexico [/TD]
[TD="width: 139"] New York [/TD]
[TD="width: 139"] North Carolina [/TD]
[TD="width: 139"] North Dakota [/TD]

[TD="width: 139"] Ohio [/TD]
[TD="width: 139"] Oklahoma [/TD]
[TD="width: 139"] Oregon [/TD]
[TD="width: 139"] Pennsylvania [/TD]
[TD="width: 139"] Rhode Island [/TD]

[TD="width: 139"] South Carolina [/TD]
[TD="width: 139"] South Dakota [/TD]
[TD="width: 139"] Tennessee [/TD]
[TD="width: 139"] Texas [/TD]
[TD="width: 139"] Utah [/TD]

[TD="width: 139"] Vermont [/TD]
[TD="width: 139"] Virginia [/TD]
[TD="width: 139"] Washington [/TD]
[TD="width: 139"] West Virginia [/TD]
[TD="width: 139"] Wisconsin [/TD]

[TD="width: 139"] Wyoming [/TD]
[TD="width: 139"] New York City [/TD]
[TD="width: 139"] Puerto Rico [/TD]
[TD="width: 139"] Virgin Islands [/TD]
[TD="width: 139"] [/TD]


World Health Organization: Additional influenza surveillance information from participating WHO member nations is available through FluNet and the Global Epidemiology Reports.

WHO Collaborating Centers for Influenza located in Australia, China, Japan, the United Kingdom, and the United States (CDC in Atlanta, Georgia).

Europe: For the most recent influenza surveillance information from Europe, please see WHO/Europe and the European Centre for Disease Prevention and Control at http://www.flunewseurope.org/.

Public Health Agency of Canada: The most up-to-date influenza information from Canada is available at http://www.phac-aspc.gc.ca/fluwatch/

Public Health England: The most up-to-date influenza information from the United Kingdom is available at https://www.gov.uk/government/statistics/weekly-national-flu-reports


Any links provided to non-Federal organizations are provided solely as a service to our users. These links do not constitute an endorsement of these organizations or their programs by CDC or the Federal Government, and none should be inferred. CDC is not responsible for the content of the individual organization web pages found at these links.


An overview of the CDC influenza surveillance system, including methodology and detailed descriptions of each data component, is available at: http://www.cdc.gov/flu/weekly/overview.htm.

--------------------------------------------------------------------------------


Page last reviewed: February 7, 2020, 11:00 AM
Content source: Centers for Disease Control and Prevention, National Center for Immunization and Respiratory Diseases (NCIRD)Seasonal Influenza (Flu)
What CDC Does
email_03Get Email Updates

To receive weekly email updates about Seasonal Flu, enter your email address: Email Address
What's this?
Submit
H1N1 Flu Pandemic 2009-2019: A Decade Later - H1N1 Flu Pandemic 2009-2019: A Decade Later

Influenza Types
https://www.cdc.gov/flu/weekly/index.htm
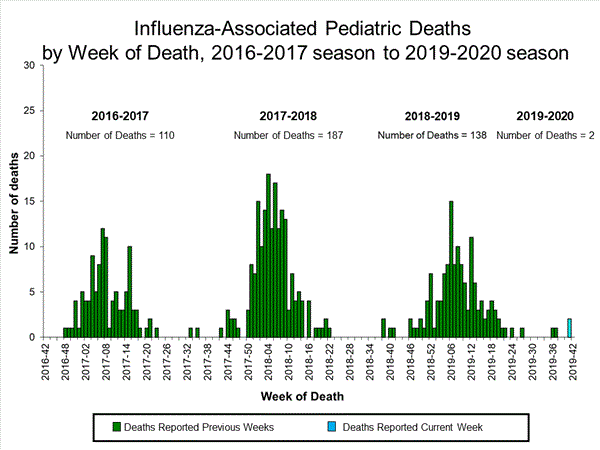
 
[h=1]Weekly U.S. Influenza Surveillance Report[/h]
fluview-banner2.jpg

Key Updates for Week 6, ending February 8, 2020

Key indicators that track flu activity remain high and, after falling during the first two weeks of the year, increased over the last four weeks. Indicators that track overall severity (hospitalizations and deaths) are not high at this point in the season. [h=4]Viruses[/h]
Clinical Labs
The percentage of respiratory specimens testing positive for influenza at clinical laboratories increased from 30.1% last week to 30.8% this week.

Public Health Labs
Numbers of influenza B/Victoria and A(H1N1)pdm09 viruses are approximately equal for the season overall, with continued increases in influenza A(H1N1)pdm09 viruses in recent weeks.

Virus Characterization
Genetic and antigenic characterization and antiviral susceptibility of influenza viruses collected in the U.S. are summarized in this report. [h=4]Illness[/h] Outpatient Illness: ILINet
Visits to health care providers for influenza-like illness (ILI) increased from 6.6% last week to 6.8% this week. All regions remain above their baselines.

Outpatient Illness: ILINet Activity Map
Flu Activity & Surveillance - Flu Activity & Surveillance


The number of jurisdictions experiencing high ILI activity decreased slightly from 47 last week to 46 this week.

Geographic Spread
spread map week 6 - spread map week 6


The number of jurisdictions reporting regional or widespread influenza activity remained at 51 this week. [h=4]Severe Disease[/h]
Hospitalizations
The overall hospitalization rate for the season increased to 41.9 per 100,000. This is similar to what has been seen at this time during recent seasons.

P&I Mortality
The percentage of deaths attributed to pneumonia and influenza is 6.8%, below the epidemic threshold of 7.3%.

Pediatric Deaths
14 influenza-associated pediatric deaths occurring during the 2019-2020 season were reported this week. The total for the season is 92.

All data are preliminary and may change as more reports are received.

A description of the CDC influenza surveillance system, including methodology and detailed descriptions of each data component is available on the surveillance methods page.

Additional information on the current and previous influenza seasons for each surveillance component are available on FluView Interactive.

Key Points
  • Outpatient ILI and clinical laboratory data remain elevated and increased again this week. Nationally, and in some regions, the proportion of influenza A(H1N1)pdm09 viruses compared to influenza B viruses is increasing.
  • Overall, hospitalization rates remain similar to this time during recent seasons, but rates among children and young adults are higher at this time than in recent seasons.
  • Pneumonia and influenza mortality has been low, but 92 influenza-associated deaths in children have been reported so far this season.
  • CDC estimates that so far this season there have been at least 26 million flu illnesses, 250,000 hospitalizations and 14,000 deaths from flu.
  • Flu vaccine effectiveness estimates will be available next week. Vaccination is always the best way to prevent flu and its potentially serious complications.
  • Antiviral medications are an important adjunct to flu vaccine in the control of influenza. Almost all (>99%) of the influenza viruses tested this season are susceptible to the four FDA-approved influenza antiviral medications recommended for use in the U.S. this season.
[h=2]U.S. Virologic Surveillance[/h] [h=3]Clinical Laboratories[/h]
The results of tests performed by clinical laboratories nationwide are summarized below. Data from clinical laboratories (the percentage of specimens tested that are positive for influenza) are used to monitor whether influenza activity is increasing or decreasing.
54,982823,555
16,934 (30.8%)155,014 (18.8%)
10,067 (59.4%)67,285 (43.4%)
6,867 (40.6%)87,729 (56.6%)
Week 6 Data Cumulative since
September 29, 2019
(week 40)
No. of specimens tested No. of positive specimens (%) Positive specimens by type Influenza A Influenza B


The predominant virus also varies by age group. Nationally, for the season overall, influenza B viruses are the most commonly reported influenza viruses among children and young adults age 0-4 years (56% of reported viruses) and 5-24 years (70% of reported viruses), while A(H1N1)pdm09 viruses are the most commonly reported influenza viruses among persons 25-64 years (55% of reported viruses) and 65 years of age and older (62% of reported viruses). For this season, 51% of influenza positive specimens reported by public health laboratories were among persons less than 25 years of age and less than 13% were from persons age 65 and older.
INFLUENZA Virus Isolated

View Chart Data | View Full Screen [h=3]Public Health Laboratories[/h]
The results of tests performed by public health laboratories nationwide are summarized below. Data from public health laboratories are used to monitor the proportion of circulating viruses that belong to each influenza subtype/lineage.
1,93651,930
1,25828,040
833 (66.2%)13,822 (49.3%)
721 (95.5%)12,088 (90.0%)
34 (4.5%)1,349 (10.0%)
78385
425 (33.8%)14,218 (50.7%)
1 (0.3%)178 (1.6%)
361 (99.7%)11,080 (98.4%)
632,960
Week 6 Data Cumulative since September 29, 2019
(week 40)
No. of specimens tested No. of positive specimens Positive specimens by type/subtype Influenza A (H1N1)pdm09 H3N2 Subtyping not performed Influenza B Yamagata lineage Victoria lineage Lineage not performed

Nationally, influenza B/Victoria viruses have been reported more frequently than other influenza viruses this season. However, during recent weeks, influenza A(H1N1)pdm09 viruses have been reported more frequently than B/Victoria viruses. The predominant virus varies by region. Regional and state level data about circulating influenza viruses can be found on FluView Interactive.
INFLUENZA Virus Isolated

View Chart Data | View Full Screen

Additional virologic surveillance information for current and past seasons:
Surveillance Methods | FluView Interactive: National, Regional, and State Data or Age Data
[h=2]Influenza Virus Characterization[/h]
CDC performs genetic and antigenic characterization of U.S. viruses submitted from state and local health laboratories using Right Size Roadmap submission guidance. These data are used to compare how similar the currently circulating influenza viruses are to the reference viruses used for developing new influenza vaccines and to monitor evolutionary changes that continually occur in circulating influenza. Antigenic characterization data are based on an animal model (influenza-naive ferrets), and do not reflect pre-existing protection provided by past influenza infections and vaccinations. Additional antigenic characterization studies involving people vaccinated with current influenza vaccines are conducted later in the season; these data account for pre-existing protection in different populations against circulating influenza viruses. Genetic and antigenic characterization data are not used to make calculations about vaccine effectiveness (VE). CDC conducts VE studies each year to measure the benefits of flu vaccines in people.

CDC genetically characterized 1,462 influenza viruses collected in the U.S. from September 29, 2019, to February 8, 2020.
484
6B.1A484 (100%)
339
3C.2a325 (95.9%)2a1325 (95.9%)
2a20
2a30
2a40
3C.3a14 (4.1%)3a14 (4.1%)
579
V1A579 (100%)V1A0
V1A.149 (8.5%)
V1A.3530 (91.5%)
60
Y360 (100%)

Virus Subtype or Lineage Genetic Characterization
Total No. of Subtype/Lineage Tested Clade Number (% of subtype/lineage tested) Subclade Number (% of subtype/lineage tested) A/H1 A/H3 B/Victoria B/Yamagata

CDC antigenically characterizes a subset of influenza viruses by hemagglutination inhibition (HI) or neutralization based Focus Reduction assays (FRA). Antigenic drift is evaluated by comparing antigenic properties of cell-propagated reference viruses representing currently recommended vaccine components with those of cell-propagated circulating viruses. CDC antigenically characterized 244 influenza viruses collected in the United States from September 29, 2019, to February 8, 2020. These data are not used to make calculations about vaccine effectiveness (VE). CDC conducts VE studies each year to measure the benefits of flu vaccines in people.

Influenza A Viruses
  • A (H1N1)pdm09: 74 A(H1N1)pdm09 viruses were antigenically characterized by HI with ferret antisera, and all 74 (100%) were antigenically similar (reacting at titers that were within 4-fold of the homologous virus titer) to cell-propagated A/Brisbane/02/2018-like reference viruses representing the A(H1N1)pdm09 component for the 2019-20 Northern Hemisphere influenza vaccines.
  • A (H3N2): 72 A(H3N2) viruses were antigenically characterized by FRA with ferret antisera, and 31 (43.1%) were antigenically similar to cell-propagated A/Kansas/14/2017-like reference viruses representing the A(H3N2) component for the 2019-20 Northern Hemisphere influenza vaccines.


Influenza B Viruses
  • B/Victoria: 88 B/Victoria lineage viruses, including viruses from both co-circulating sub-clades, were antigenically characterized by HI with ferret antisera, and 53 (60.2%) were antigenically similar to cell-propagated B/Colorado/06/2017-like reference viruses representing the B/Victoria component for the 2019-20 Northern Hemisphere influenza vaccines.
  • B/Yamagata: 10 B/Yamagata lineage viruses were antigenically characterized by HI with ferret antisera, and all 10 (100%) were antigenically similar to cell-propagated B/Phuket/3073/2013-like reference viruses representing the B/Yamagata component for the 2019-20 Northern Hemisphere influenza vaccines.


CDC assesses susceptibility of influenza viruses to the antiviral medications including the neuraminidase inhibitors (oseltamivir, zanamivir, and peramivir) and the PA endonuclease inhibitor baloxavir using next generation sequence analysis supplemented by laboratory assays. Viruses collected in the United States since September 29, 2019, were tested for antiviral susceptibility as follows:
1,41546932656060
(0.0%)(0.0%)(0.0%)(0.0%)(0.0%)
1 (0.1%)1 (0.2%)(0.0%)(0.0%)(0.0%)
1,41546932656060
(0.0%)(0.0%)(0.0%)(0.0%)(0.0%)
1 (0.1%)1 (0.2%)(0.0%)(0.0%)(0.0%)
1,41546932656060
1 (0.1%)(0.0%)(0.0%)1 (0.2%)(0.0%)
(0.0%)(0.0%)(0.0%)(0.0%)(0.0%)
1,40946432755860
(0.0%)(0.0%)(0.0%)(0.0%)(0.0%)

Antiviral Medication Total Viruses A/H1 A/H3 B/Victoria B/Yamagata Neuraminidase Inhibitors Oseltamivir Viruses Tested Reduced Inhibition Highly Reduced Inhibition Peramivir Viruses Tested Reduced Inhibition
Highly Reduced Inhibition Zanamivir Viruses Tested Reduced Inhibition
Highly Reduced Inhibition PA Endonuclease Inhibitor
Baloxavir Viruses Tested
Reduced Susceptibility


A total of 353 additional viruses (173 H1pdm09, 22 H3, and 158 B) collected in Alabama, Alaska, Florida, Illinois, Iowa, Louisiana, Michigan, Nevada, New York, North Carolina, Pennsylvania, South Dakota, Virginia and Wisconsin were analyzed for resistance to neuraminidase inhibitors by pyrosequencing assay. Two (1.2%) of the 173 A(H1N1)pdm09 viruses tested had the H275Y amino acid substitution in the neuraminidase that confers resistance to oseltamivir and potential resistance to peramivir. No markers of resistance to neuraminidase inhibitors were detected in A(H3N2) and type B viruses tested.

[h=2]Outpatient Illness Surveillance[/h] [h=3]ILINet[/h]
Nationwide during week 6, 6.8% of patient visits reported through the U.S. Outpatient Influenza-like Illness Surveillance Network (ILINet) were due to influenza-like illness (ILI). This percentage is above the national baseline of 2.4%.
national levels of ILI and ARI

View Chart Data (current season only) | View Full Screen

On a regional level, the percentage of outpatient visits for ILI ranged from 3.6% to 10.8% during week 6. All regions reported a percentage of outpatient visits for ILI above their region-specific baselines. [h=3]ILI Activity Map[/h]
Data collected in ILINet are used to produce a measure of ILI activity* by state.

During week 6, the following ILI activity levels were experienced:
  • High – New York City, Puerto Rico, and 44 states (Alabama, Arizona, Arkansas, California, Colorado, Connecticut, Georgia, Hawaii, Illinois, Indiana, Iowa, Kansas, Kentucky, Louisiana, Maine, Maryland, Massachusetts, Michigan, Minnesota, Mississippi, Missouri, Montana, Nebraska, New Hampshire, New Jersey, New Mexico, New York, North Carolina, North Dakota, Ohio, Oklahoma, Pennsylvania, Rhode Island, South Carolina, South Dakota, Tennessee, Texas, Utah, Vermont, Virginia, Washington, West Virginia, Wisconsin, and Wyoming)
  • Moderate – two states (Nevada and Oregon)
  • Low - the District of Columbia and two states (Alaska and Florida)
  • Minimal - one state (Idaho)
  • Data were insufficient to calculate an ILI activity level from the U.S. Virgin Islands and one state (Delaware)
[SIZE=-1]*Data collected in ILINet may disproportionally represent certain populations within a state, and therefore, may not accurately depict the full picture of influenza activity for the whole state. Differences in the data presented here by CDC and independently by some state health departments likely represent differing levels of data completeness with data presented by the state likely being the more complete.[/SIZE]


Additional information about medically attended visits for ILI for current and past seasons:
Surveillance Methods | FluView Interactive: National, Regional, and State Data or ILI Activity Map


[h=2]Geographic Spread of Influenza as Assessed by State and Territorial Epidemiologists[/h]
The influenza activity reported by state and territorial epidemiologists indicates geographic spread of influenza viruses but does not measure the severity of influenza activity.

During week 6, the following influenza activity was reported:
  • Widespread – Puerto Rico and 48 states (Alabama, Alaska, Arizona, Arkansas, California, Colorado, Connecticut, Delaware, Florida, Georgia, Idaho, Illinois, Indiana, Iowa, Kansas, Kentucky, Louisiana, Maine, Maryland, Massachusetts, Michigan, Minnesota, Mississippi, Missouri, Montana, Nebraska, Nevada, New Hampshire, New Jersey, New Mexico, New York, North Carolina, North Dakota, Ohio, Oklahoma, Pennsylvania, Rhode Island, South Carolina, South Dakota, Tennessee, Texas, Utah, Vermont, Virginia, Washington, West Virginia, Wisconsin, and Wyoming)
  • Regional – two states (Hawaii and Oregon)
  • Local – the District of Columbia
  • Sporadic – the U.S. Virgin Islands
  • Guam did not report.
Additional geographic spread surveillance information for current and past seasons:
Surveillance Methods | FluView Interactive

[h=2]Influenza-Associated Hospitalizations[/h]
The Influenza Hospitalization Surveillance Network (FluSurv-NET) conducts population-based surveillance for laboratory-confirmed influenza-related hospitalizations in select counties in the Emerging Infections Program (EIP) states and Influenza Hospitalization Surveillance Project (IHSP) states.

A total of 12,167 laboratory-confirmed influenza-associated hospitalizations were reported by FluSurv-NET sites between October 1, 2019 and February 8, 2020; 7,881 (64.8%) were associated with influenza A virus, 4,213 (34.6%) with influenza B virus, 39 (0.3%) with influenza A virus and influenza B virus co-infection, and 34 (0.3%) with influenza virus for which the type was not determined. Among those with influenza A subtype information, 1,782 (93.2%) were A(H1N1)pdm09 virus and 129 (6.8%) were A(H3N2).

The overall cumulative hospitalization rate was 41.9 per 100,000 population which is similar to what has been seen during recent previous influenza seasons at this time of year. Rates in children and young adults are higher than at this time in recent seasons.

Click on graph to launch interactive tool
View Full Screen

The highest rate of hospitalization is among adults aged ≥65, followed by children aged 0-4 years and adults aged 50-64 years.
Overall41.9
0-4 years65.9
5-17 years17.3
18-49 years23.5
50-64 years53.9
65+ years101.6
Age Group 2019-2020 Season
Cumulative Rate per 100,000 Population


Among 1,573 hospitalized adults with information on underlying medical conditions, 91.9% had at least one reported underlying medical condition, the most commonly reported were cardiovascular disease, metabolic disorder, obesity, and chronic lung disease. Among 333 hospitalized children with information on underlying medical conditions, 46.2% had at least one underlying medical condition; the most commonly reported was asthma. Among 299 hospitalized women of childbearing age (15-44 years) with information on pregnancy status, 26.4% were pregnant.

Click on graph to launch interactive tool2
View Full Screen

Additional hospitalization surveillance information for current and past seasons and additional age groups:
Surveillance Methods | FluView Interactive: Rates by Age or Patient Characteristics


[h=2]Pneumonia and Influenza (P&I) Mortality Surveillance[/h]
Based on National Center for Health Statistics (NCHS) mortality surveillance data available on February 13, 2020, 6.8% of the deaths occurring during the week ending February 1, 2020 (week 5) were due to P&I. This percentage is below the epidemic threshold of 7.3% for week 5.
INFLUENZA Virus Isolated

View Chart Data | View Full Screen

Additional pneumonia and influenza mortality surveillance information for current and past seasons:
Surveillance Methods | FluView Interactive


[h=2]Influenza-Associated Pediatric Mortality[/h]
14 influenza-associated pediatric deaths occurring during the 2019-2020 season between weeks 52 and 6 (the weeks ending December 28, 2019 and February 8, 2020) were reported to CDC during week 6. 10 were associated with influenza B viruses; one had a lineage determined and was a B/Victoria virus. Four were associated with influenza A viruses, and two were subtyped; one was an A(H1N1)pdm09 virus and one was an A(H3) virus.

Of the 92 influenza-associated pediatric deaths occurring during the 2019-2020 season and reported to CDC:
  • 62 deaths were associated with influenza B viruses, and 10 had a lineage determined; all were B/Victoria viruses.
  • 30 deaths were associated with influenza A viruses, and 18 were subtyped; 17 were A(H1N1)pdm09 viruses and one was an A(H3) virus.
Click on image to launch interactive tool

View Full Screen

Additional pediatric mortality surveillance information for current and past seasons:
Surveillance Methods | FluView Interactive


[h=2]Additional National and International Influenza Surveillance Information[/h]

FluView Interactive: FluView includes enhanced web-based interactive applications that can provide dynamic visuals of the influenza data collected and analyzed by CDC. These FluView Interactive applications allow people to create customized, visual interpretations of influenza data, as well as make comparisons across flu seasons, regions, age groups and a variety of other demographics. To access these tools, visit http://www.cdc.gov/flu/weekly/fluviewinteractive.htm

National Institute for Occupational Safety and Health: Monthly surveillance data on the prevalence of health-related workplace absenteeism among full-time workers in the United States are available from NIOSH at https://www.cdc.gov/niosh/topics/absences/default.html

U.S. State and local influenza surveillance:Select a jurisdiction below to access the latest local influenza information


[TD="width: 139"] Alabama [/TD]
[TD="width: 139"] Alaska [/TD]
[TD="width: 139"] Arizona [/TD]
[TD="width: 139"] Arkansas [/TD]
[TD="width: 139"] California [/TD]

[TD="width: 139"] Colorado [/TD]
[TD="width: 139"] Connecticut [/TD]
[TD="width: 139"] Delaware [/TD]
[TD="width: 139"] District of Columbia [/TD]
[TD="width: 139"] Florida [/TD]

[TD="width: 139"] Georgia [/TD]
[TD="width: 139"] Hawaii [/TD]
[TD="width: 139"] Idaho [/TD]
[TD="width: 139"] Illinois [/TD]
[TD="width: 139"] Indiana [/TD]

[TD="width: 139"] Iowa [/TD]
[TD="width: 139"] Kansas [/TD]
[TD="width: 139"] Kentucky [/TD]
[TD="width: 139"] Louisiana [/TD]
[TD="width: 139"] Maine [/TD]

[TD="width: 139"] Maryland [/TD]
[TD="width: 139"] Massachusetts [/TD]
[TD="width: 139"] Michigan [/TD]
[TD="width: 139"] Minnesota [/TD]
[TD="width: 139"] Mississippi [/TD]

[TD="width: 139"] Missouri [/TD]
[TD="width: 139"] Montana [/TD]
[TD="width: 139"] Nebraska [/TD]
[TD="width: 139"] Nevada [/TD]
[TD="width: 139"] New Hampshire [/TD]

[TD="width: 139"] New Jersey [/TD]
[TD="width: 139"] New Mexico [/TD]
[TD="width: 139"] New York [/TD]
[TD="width: 139"] North Carolina [/TD]
[TD="width: 139"] North Dakota [/TD]

[TD="width: 139"] Ohio [/TD]
[TD="width: 139"] Oklahoma [/TD]
[TD="width: 139"] Oregon [/TD]
[TD="width: 139"] Pennsylvania [/TD]
[TD="width: 139"] Rhode Island [/TD]

[TD="width: 139"] South Carolina [/TD]
[TD="width: 139"] South Dakota [/TD]
[TD="width: 139"] Tennessee [/TD]
[TD="width: 139"] Texas [/TD]
[TD="width: 139"] Utah [/TD]

[TD="width: 139"] Vermont [/TD]
[TD="width: 139"] Virginia [/TD]
[TD="width: 139"] Washington [/TD]
[TD="width: 139"] West Virginia [/TD]
[TD="width: 139"] Wisconsin [/TD]

[TD="width: 139"] Wyoming [/TD]
[TD="width: 139"] New York City [/TD]
[TD="width: 139"] Puerto Rico [/TD]
[TD="width: 139"] Virgin Islands [/TD]
[TD="width: 139"] [/TD]


World Health Organization: Additional influenza surveillance information from participating WHO member nations is available through FluNet and the Global Epidemiology Reports.

WHO Collaborating Centers for Influenza located in Australia, China, Japan, the United Kingdom, and the United States (CDC in Atlanta, Georgia).

Europe: For the most recent influenza surveillance information from Europe, please see WHO/Europe and the European Centre for Disease Prevention and Control at http://www.flunewseurope.org/.

Public Health Agency of Canada: The most up-to-date influenza information from Canada is available at http://www.phac-aspc.gc.ca/fluwatch/

Public Health England: The most up-to-date influenza information from the United Kingdom is available at https://www.gov.uk/government/statistics/weekly-national-flu-reports


Any links provided to non-Federal organizations are provided solely as a service to our users. These links do not constitute an endorsement of these organizations or their programs by CDC or the Federal Government, and none should be inferred. CDC is not responsible for the content of the individual organization web pages found at these links.


An overview of the CDC influenza surveillance system, including methodology and detailed descriptions of each data component, is available at: http://www.cdc.gov/flu/weekly/overview.htm.

--------------------------------------------------------------------------------


Page last reviewed: February 14, 2020, 11:00 AM
Content source: Centers for Disease Control and Prevention, National Center for Immunization and Respiratory Diseases (NCIRD)Seasonal Influenza (Flu)
What CDC Does
email_03Get Email Updates

To receive weekly email updates about Seasonal Flu, enter your email address: Email Address
What's this?
Submit
H1N1 Flu Pandemic 2009-2019: A Decade Later - H1N1 Flu Pandemic 2009-2019: A Decade Later

Influenza Types
https://www.cdc.gov/flu/weekly/index.htm
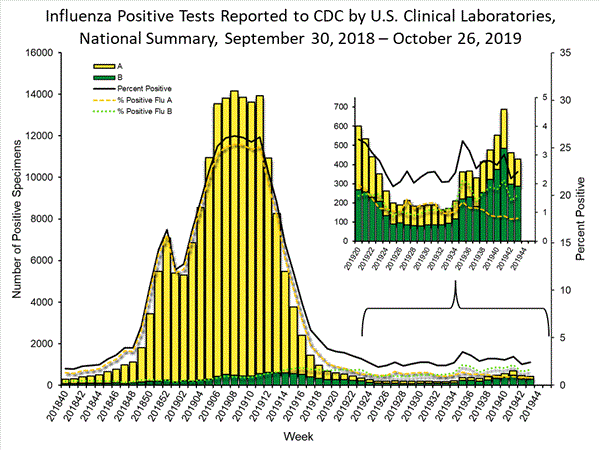
 
[h=1]Weekly U.S. Influenza Surveillance Report[/h]
fluview-banner2.jpg

Key Updates for Week 7, ending February 15, 2020

Key indicators that track flu activity remain high but decreased slightly this week. Indicators that track overall severity (hospitalizations and deaths) are not high at this point in the season. [h=4]Viruses[/h]
Clinical Labs
The percentage of respiratory specimens testing positive for influenza at clinical laboratories decreased from 30.3% last week to 29.6% this week.

Public Health Labs
Numbers of influenza B/Victoria and A(H1N1)pdm09 viruses are approximately equal for the season overall, with continued increases in influenza A(H1N1)pdm09 viruses in recent weeks.

Virus Characterization
Genetic and antigenic characterization and antiviral susceptibility of influenza viruses collected in the U.S. are summarized in this report. [h=4]Illness[/h] Outpatient Illness: ILINet
Visits to health care providers for influenza-like illness (ILI) decreased from 6.7% last week to 6.1% this week. All regions remain above their baselines.

Outpatient Illness: ILINet Activity Map
Flu Activity & Surveillance - Flu Activity & Surveillance


The number of jurisdictions experiencing high ILI activity remained at 46 this week.

Geographic Spread
spreadmap-7 - Spread Map


The number of jurisdictions reporting regional or widespread influenza activity remained at 51 this week. [h=4]Severe Disease[/h]
Hospitalizations
The overall hospitalization rate for the season increased to 47.4 per 100,000. This is similar to what has been seen at this time during recent seasons.

P&I Mortality
The percentage of deaths attributed to pneumonia and influenza is 6.8%, below the epidemic threshold of 7.3%.

Pediatric Deaths
13 influenza-associated pediatric deaths occurring during the 2019-2020 season were reported this week. The total for the season is 105.

All data are preliminary and may change as more reports are received.

A description of the CDC influenza surveillance system, including methodology and detailed descriptions of each data component is available on the surveillance methods page.

Additional information on the current and previous influenza seasons for each surveillance component are available on FluView Interactive.
  • Outpatient ILI and clinical laboratory data remain elevated but decreased slightly this week. The overall decrease in the percentage of specimens testing positive for influenza was due to a decrease in the percentage of specimens testing positive for influenza B. The percentage of specimens testing positive for influenza A continued to increase.
  • Overall, hospitalization rates remain similar to this time during recent seasons, but rates among children and young adults are higher at this time than in recent seasons.
  • Pneumonia and influenza mortality has been low, but 105 influenza-associated deaths in children have been reported so far this season.
  • CDC estimates that so far this season there have been at least 29 million flu illnesses, 280,000 hospitalizations and 16,000 deaths from flu.
  • Interim estimates of 2019-2020 flu vaccine effectiveness were released this week. So far this season, flu vaccines are reducing doctor’s visits for flu illness by 45% overall and 55% in children.
  • Antiviral medications are an important adjunct to flu vaccine in the control of influenza. Almost all (>99%) of the influenza viruses tested this season are susceptible to the four FDA-approved influenza antiviral medications recommended for use in the U.S. this season.
[h=2]U.S. Virologic Surveillance[/h] [h=3]Clinical Laboratories[/h]
The results of tests performed by clinical laboratories nationwide are summarized below. Data from clinical laboratories (the percentage of specimens tested that are positive for influenza) are used to monitor whether influenza activity is increasing or decreasing.
49,510888,399
14,657 (29.6%)174,037 (19.6%)
9,305 (63.5%)79,269 (45.5%)
5,352 (36.5%)94,768 (54.5%)
Week 7 Data Cumulative since
September 29, 2019
(week 40)
No. of specimens tested No. of positive specimens (%) Positive specimens by type Influenza A Influenza B
INFLUENZA Virus Isolated

View Chart Data | View Full Screen [h=3]Public Health Laboratories[/h]
The results of tests performed by public health laboratories nationwide are summarized below. Data from public health laboratories are used to monitor the proportion of circulating viruses that belong to each influenza subtype/lineage.
1,62657,630
98131,638
637 (64.9%)16,160 (51.1%)
531 (96.0%)14,320 (90.9%)
22 (4.0%)1,427 (9.1%)
84413
344 (35.1%)15,478 (48.9%)
3 (1.6%)191 (1.6%)
180 (98.4%)11,796 (98.4%)
1613,491
Week 7 Data Cumulative since September 29, 2019
(week 40)
No. of specimens tested No. of positive specimens Positive specimens by type/subtype Influenza A (H1N1)pdm09 H3N2 Subtyping not performed Influenza B Yamagata lineage Victoria lineage Lineage not performed

While influenza B/Victoria viruses predominated earlier in the season, during recent weeks, influenza A(H1N1)pdm09 viruses have been reported more frequently than B/Victoria viruses. For the season, the number of B/Victoria and A(H1N1)pdm09 viruses are approximately equal. The predominant virus varies by region. Regional and state level data about circulating influenza viruses can be found on FluView Interactive.

The predominant virus also varies by age group. Nationally, for the season overall, influenza B viruses are the most commonly reported influenza viruses among children and young adults age 0-4 years (53% of reported viruses) and 5-24 years (68% of reported viruses), while A(H1N1)pdm09 viruses are the most commonly reported influenza viruses among persons 25-64 years (57% of reported viruses) and 65 years of age and older (64% of reported viruses). For this season, 51% of influenza positive specimens reported by public health laboratories were among persons less than 25 years of age and less than 13% were from persons age 65 and older.
INFLUENZA Virus Isolated

View Chart Data | View Full Screen

Additional virologic surveillance information for current and past seasons:
Surveillance Methods | FluView Interactive: National, Regional, and State Data or Age Data
[h=2]Influenza Virus Characterization[/h]
CDC performs genetic and antigenic characterization of U.S. viruses submitted from state and local health laboratories using Right Size Roadmap submission guidance. These data are used to compare how similar the currently circulating influenza viruses are to the reference viruses used for developing new influenza vaccines and to monitor evolutionary changes that continually occur in circulating influenza viruses. Antigenic characterization data are based on an animal model (influenza-naive ferrets), and do not reflect pre-existing protection provided by past influenza infections and vaccinations. Additional antigenic characterization studies involving people vaccinated with current influenza vaccines are conducted later in the season; these data account for pre-existing protection in different populations against circulating influenza viruses. Genetic and antigenic characterization data are not used to make calculations about vaccine effectiveness (VE). CDC conducts VE studies each year to measure the benefits of flu vaccines in people. Interim estimates of 2019-2020 flu vaccine effectiveness were released this week.

CDC genetically characterized 1,667 influenza viruses collected in the U.S. from September 29, 2019, to February 15, 2020.
563
6B.1A563 (100%)
381
3C.2a365 (95.8%)2a1365 (95.8%)
2a20
2a30
2a40
3C.3a16 (4.2%)3a16 (4.2%)
655
V1A655 (100%)V1A0
V1A.150 (7.6%)
V1A.3605 (92.4%)
68
Y368 (100%)

Virus Subtype or Lineage Genetic Characterization
Total No. of Subtype/Lineage Tested Clade Number (% of subtype/lineage tested) Subclade Number (% of subtype/lineage tested) A/H1 A/H3 B/Victoria B/Yamagata

CDC antigenically characterizes a subset of influenza viruses by hemagglutination inhibition (HI) or neutralization based Focus Reduction assays (FRA). Antigenic drift is evaluated by comparing antigenic properties of cell-propagated reference viruses representing currently recommended vaccine components with those of cell-propagated circulating viruses. CDC antigenically characterized 244 influenza viruses collected in the United States from September 29, 2019, to February 15, 2020. These data are not used to make calculations about vaccine effectiveness (VE). CDC conducts VE studies each year to measure the benefits of flu vaccines in people.

Influenza A Viruses
  • A (H1N1)pdm09: 74 A(H1N1)pdm09 viruses were antigenically characterized by HI with ferret antisera, and all 74 (100%) were antigenically similar (reacting at titers that were within 4-fold of the homologous virus titer) to cell-propagated A/Brisbane/02/2018-like reference viruses representing the A(H1N1)pdm09 component for the 2019-20 Northern Hemisphere influenza vaccines.
  • A (H3N2): 72 A(H3N2) viruses were antigenically characterized by FRA with ferret antisera, and 31 (43.1%) were antigenically similar to cell-propagated A/Kansas/14/2017-like reference viruses representing the A(H3N2) component for the 2019-20 Northern Hemisphere influenza vaccines.


Influenza B Viruses
  • B/Victoria: 88 B/Victoria lineage viruses, including viruses from both co-circulating sub-clades, were antigenically characterized by HI with ferret antisera, and 53 (60.2%) were antigenically similar to cell-propagated B/Colorado/06/2017-like reference viruses representing the B/Victoria component for the 2019-20 Northern Hemisphere influenza vaccines.
  • B/Yamagata: 10 B/Yamagata lineage viruses were antigenically characterized by HI with ferret antisera, and all 10 (100%) were antigenically similar to cell-propagated B/Phuket/3073/2013-like reference viruses representing the B/Yamagata component for the 2019-20 Northern Hemisphere influenza vaccines.


CDC assesses susceptibility of influenza viruses to the antiviral medications including the neuraminidase inhibitors (oseltamivir, zanamivir, and peramivir) and the PA endonuclease inhibitor baloxavir using next generation sequence analysis supplemented by laboratory assays. Viruses collected in the United States since September 29, 2019, were tested for antiviral susceptibility as follows:
1,61354736763267
(0.0%)(0.0%)(0.0%)(0.0%)(0.0%)
1 (0.1%)1 (0.2%)(0.0%)(0.0%)(0.0%)
1,61354736763267
(0.0%)(0.0%)(0.0%)(0.0%)(0.0%)
1 (0.1%)1 (0.2%)(0.0%)(0.0%)(0.0%)
1,61354736763267
1 (0.1%)(0.0%)(0.0%)1 (0.2%)(0.0%)
(0.0%)(0.0%)(0.0%)(0.0%)(0.0%)
1,76756745367671
(0.0%)(0.0%)(0.0%)(0.0%)(0.0%)

Antiviral Medication Total Viruses A/H1 A/H3 B/Victoria B/Yamagata Neuraminidase Inhibitors Oseltamivir Viruses Tested Reduced Inhibition Highly Reduced Inhibition Peramivir Viruses Tested Reduced Inhibition
Highly Reduced Inhibition Zanamivir Viruses Tested Reduced Inhibition
Highly Reduced Inhibition PA Endonuclease Inhibitor
Baloxavir Viruses Tested
Reduced Susceptibility


A total of 353 additional viruses (173 A(H1N1)pdm09, 22 A(H3N2), and 158 B) collected in Alabama, Alaska, Florida, Illinois, Iowa, Louisiana, Michigan, Nevada, New York, North Carolina, Pennsylvania, South Dakota, Virginia and Wisconsin were analyzed for resistance to neuraminidase inhibitors by pyrosequencing assay. Two (1.2%) of the 173 A(H1N1)pdm09 viruses tested had the H275Y amino acid substitution in the neuraminidase that confers resistance to oseltamivir and potential resistance to peramivir. No markers of resistance to neuraminidase inhibitors were detected in A(H3N2) and type B viruses tested.

[h=2]Outpatient Illness Surveillance[/h] [h=3]ILINet[/h]
Nationwide during week 7, 6.1% of patient visits reported through the U.S. Outpatient Influenza-like Illness Surveillance Network (ILINet) were due to influenza-like illness (ILI). This percentage is above the national baseline of 2.4%.
national levels of ILI and ARI

View Chart Data (current season only) | View Full Screen

On a regional level, the percentage of outpatient visits for ILI ranged from 3.4% to 9.7% during week 7. All regions reported a percentage of outpatient visits for ILI above their region-specific baselines. [h=3]ILI Activity Map[/h]
Data collected in ILINet are used to produce a measure of ILI activity* by state.

During week 7, the following ILI activity levels were experienced:
  • High – New York City, Puerto Rico, and 44 states (Alabama, Arkansas, California, Colorado, Connecticut, Georgia, Hawaii, Illinois, Indiana, Iowa, Kansas, Kentucky, Louisiana, Maine, Maryland, Massachusetts, Michigan, Minnesota, Mississippi, Missouri, Montana, Nebraska, New Hampshire, New Jersey, New Mexico, New York, North Carolina, North Dakota, Ohio, Oklahoma, Oregon, Pennsylvania, Rhode Island, South Carolina, South Dakota, Tennessee, Texas, Utah, Vermont, Virginia, Washington, West Virginia, Wisconsin, and Wyoming)
  • Moderate – the District of Columbia and four states (Arizona, Delaware, Florida, and Nevada)
  • Low - the U.S. Virgin Islands
  • Minimal - two states (Alaska and Idaho)
[SIZE=-1]*Data collected in ILINet may disproportionally represent certain populations within a state, and therefore, may not accurately depict the full picture of influenza activity for the whole state. Differences in the data presented here by CDC and independently by some state health departments likely represent differing levels of data completeness with data presented by the state likely being the more complete.[/SIZE]


Additional information about medically attended visits for ILI for current and past seasons:
Surveillance Methods | FluView Interactive: National, Regional, and State Data or ILI Activity Map


[h=2]Geographic Spread of Influenza as Assessed by State and Territorial Epidemiologists[/h]
The influenza activity reported by state and territorial epidemiologists indicates geographic spread of influenza viruses but does not measure the severity of influenza activity.

During week 7, the following influenza activity was reported:
  • Widespread – Puerto Rico and 47 states (Alabama, Alaska, Arizona, Arkansas, California, Colorado, Connecticut, Delaware, Florida, Georgia, Illinois, Indiana, Iowa, Kansas, Kentucky, Louisiana, Maine, Maryland, Massachusetts, Michigan, Minnesota, Mississippi, Missouri, Montana, Nebraska, Nevada, New Hampshire, New Jersey, New Mexico, New York, North Carolina, North Dakota, Ohio, Oklahoma, Pennsylvania, Rhode Island, South Carolina, South Dakota, Tennessee, Texas, Utah, Vermont, Virginia, Washington, West Virginia, Wisconsin, and Wyoming)
  • Regional – three states (Hawaii, Idaho and Oregon)
  • Local – the District of Columbia
  • Sporadic – the U.S. Virgin Islands
  • Guam did not report.
Additional geographic spread surveillance information for current and past seasons:
Surveillance Methods | FluView Interactive

[h=2]Influenza-Associated Hospitalizations[/h]
The Influenza Hospitalization Surveillance Network (FluSurv-NET) conducts population-based surveillance for laboratory-confirmed influenza-related hospitalizations in select counties in the Emerging Infections Program (EIP) states and Influenza Hospitalization Surveillance Project (IHSP) states.

A total of 13,775 laboratory-confirmed influenza-associated hospitalizations were reported by FluSurv-NET sites between October 1, 2019 and February 15, 2020; 9,168 (66.6%) were associated with influenza A virus, 4,529 (32.9%) with influenza B virus, 42 (0.3%) with influenza A virus and influenza B virus co-infection, and 36 (0.3%) with influenza virus for which the type was not determined. Among those with influenza A subtype information, 2,385 (93.3%) were A(H1N1)pdm09 virus and 172 (6.7%) were A(H3N2).

The overall cumulative hospitalization rate was 47.4 per 100,000 population which is similar to what has been seen during recent previous influenza seasons at this time of year. Rates in children and young adults are higher than at this time in recent seasons.

Click on graph to launch interactive tool
View Full Screen

The highest rate of hospitalization is among adults aged ≥65, followed by children aged 0-4 years and adults aged 50-64 years.
Overall47.4
0-4 years72.5
5-17 years19.2
18-49 years26.3
50-64 years61.5
65+ years116.7
Age Group 2019-2020 Season
Cumulative Rate per 100,000 Population


Among 1,833 hospitalized adults with information on underlying medical conditions, 92.5% had at least one reported underlying medical condition, the most commonly reported were cardiovascular disease, metabolic disorder, obesity, and chronic lung disease. Among 360 hospitalized children with information on underlying medical conditions, 47.2% had at least one underlying medical condition; the most commonly reported was asthma. Among 342 hospitalized women of childbearing age (15-44 years) with information on pregnancy status, 26% were pregnant.

Click on graph to launch interactive tool2
View Full Screen

Additional hospitalization surveillance information for current and past seasons and additional age groups:
Surveillance Methods | FluView Interactive: Rates by Age or Patient Characteristics


[h=2]Pneumonia and Influenza (P&I) Mortality Surveillance[/h]
Based on National Center for Health Statistics (NCHS) mortality surveillance data available on February 20, 2020, 6.8% of the deaths occurring during the week ending February 8, 2020 (week 6) were due to P&I. This percentage is below the epidemic threshold of 7.3% for week 6.
INFLUENZA Virus Isolated

View Chart Data | View Full Screen

Additional pneumonia and influenza mortality surveillance information for current and past seasons:
Surveillance Methods | FluView Interactive


[h=2]Influenza-Associated Pediatric Mortality[/h]
13 influenza-associated pediatric deaths occurring during the 2019-2020 season between weeks 2 and 7 (the weeks ending January 11, 2020 and February 15, 2020) were reported to CDC during week 7. 10 were associated with influenza B viruses, and two had a lineage determined; both B/Victoria viruses. Three were associated with influenza A viruses, and two were subtyped; both A(H1N1)pdm09 viruses.

Of the 105 influenza-associated pediatric deaths occurring during the 2019-2020 season and reported to CDC:
  • 72 deaths were associated with influenza B viruses, and 12 had a lineage determined; all were B/Victoria viruses.
  • 33 deaths were associated with influenza A viruses, and 20 were subtyped; 19 were A(H1N1)pdm09 viruses and one was an A(H3) virus.
Click on image to launch interactive tool

View Full Screen

Additional pediatric mortality surveillance information for current and past seasons:
Surveillance Methods | FluView Interactive


[h=2]Additional National and International Influenza Surveillance Information[/h]

FluView Interactive: FluView includes enhanced web-based interactive applications that can provide dynamic visuals of the influenza data collected and analyzed by CDC. These FluView Interactive applications allow people to create customized, visual interpretations of influenza data, as well as make comparisons across flu seasons, regions, age groups and a variety of other demographics. To access these tools, visit http://www.cdc.gov/flu/weekly/fluviewinteractive.htm

National Institute for Occupational Safety and Health: Monthly surveillance data on the prevalence of health-related workplace absenteeism among full-time workers in the United States are available from NIOSH at https://www.cdc.gov/niosh/topics/absences/default.html

U.S. State and local influenza surveillance:Select a jurisdiction below to access the latest local influenza information


[TD="width: 139"] Alabama [/TD]
[TD="width: 139"] Alaska [/TD]
[TD="width: 139"] Arizona [/TD]
[TD="width: 139"] Arkansas [/TD]
[TD="width: 139"] California [/TD]

[TD="width: 139"] Colorado [/TD]
[TD="width: 139"] Connecticut [/TD]
[TD="width: 139"] Delaware [/TD]
[TD="width: 139"] District of Columbia [/TD]
[TD="width: 139"] Florida [/TD]

[TD="width: 139"] Georgia [/TD]
[TD="width: 139"] Hawaii [/TD]
[TD="width: 139"] Idaho [/TD]
[TD="width: 139"] Illinois [/TD]
[TD="width: 139"] Indiana [/TD]

[TD="width: 139"] Iowa [/TD]
[TD="width: 139"] Kansas [/TD]
[TD="width: 139"] Kentucky [/TD]
[TD="width: 139"] Louisiana [/TD]
[TD="width: 139"] Maine [/TD]

[TD="width: 139"] Maryland [/TD]
[TD="width: 139"] Massachusetts [/TD]
[TD="width: 139"] Michigan [/TD]
[TD="width: 139"] Minnesota [/TD]
[TD="width: 139"] Mississippi [/TD]

[TD="width: 139"] Missouri [/TD]
[TD="width: 139"] Montana [/TD]
[TD="width: 139"] Nebraska [/TD]
[TD="width: 139"] Nevada [/TD]
[TD="width: 139"] New Hampshire [/TD]

[TD="width: 139"] New Jersey [/TD]
[TD="width: 139"] New Mexico [/TD]
[TD="width: 139"] New York [/TD]
[TD="width: 139"] North Carolina [/TD]
[TD="width: 139"] North Dakota [/TD]

[TD="width: 139"] Ohio [/TD]
[TD="width: 139"] Oklahoma [/TD]
[TD="width: 139"] Oregon [/TD]
[TD="width: 139"] Pennsylvania [/TD]
[TD="width: 139"] Rhode Island [/TD]

[TD="width: 139"] South Carolina [/TD]
[TD="width: 139"] South Dakota [/TD]
[TD="width: 139"] Tennessee [/TD]
[TD="width: 139"] Texas [/TD]
[TD="width: 139"] Utah [/TD]

[TD="width: 139"] Vermont [/TD]
[TD="width: 139"] Virginia [/TD]
[TD="width: 139"] Washington [/TD]
[TD="width: 139"] West Virginia [/TD]
[TD="width: 139"] Wisconsin [/TD]

[TD="width: 139"] Wyoming [/TD]
[TD="width: 139"] New York City [/TD]
[TD="width: 139"] Puerto Rico [/TD]
[TD="width: 139"] Virgin Islands [/TD]
[TD="width: 139"] [/TD]


World Health Organization: Additional influenza surveillance information from participating WHO member nations is available through FluNet and the Global Epidemiology Reports.

WHO Collaborating Centers for Influenza located in Australia, China, Japan, the United Kingdom, and the United States (CDC in Atlanta, Georgia).

Europe: For the most recent influenza surveillance information from Europe, please see WHO/Europe and the European Centre for Disease Prevention and Control at http://www.flunewseurope.org/.

Public Health Agency of Canada: The most up-to-date influenza information from Canada is available at http://www.phac-aspc.gc.ca/fluwatch/

Public Health England: The most up-to-date influenza information from the United Kingdom is available at https://www.gov.uk/government/statistics/weekly-national-flu-reports


Any links provided to non-Federal organizations are provided solely as a service to our users. These links do not constitute an endorsement of these organizations or their programs by CDC or the Federal Government, and none should be inferred. CDC is not responsible for the content of the individual organization web pages found at these links.


An overview of the CDC influenza surveillance system, including methodology and detailed descriptions of each data component, is available at: http://www.cdc.gov/flu/weekly/overview.htm.

--------------------------------------------------------------------------------


Page last reviewed: February 21, 2020, 11:00 AM
Content source: Centers for Disease Control and Prevention, National Center for Immunization and Respiratory Diseases (NCIRD)Seasonal Influenza (Flu)
What CDC Does
email_03Get Email Updates

To receive weekly email updates about Seasonal Flu, enter your email address: Email Address
What's this?
Submit
H1N1 Flu Pandemic 2009-2019: A Decade Later - H1N1 Flu Pandemic 2009-2019: A Decade Later

Influenza Types
https://www.cdc.gov/flu/weekly/index.htm
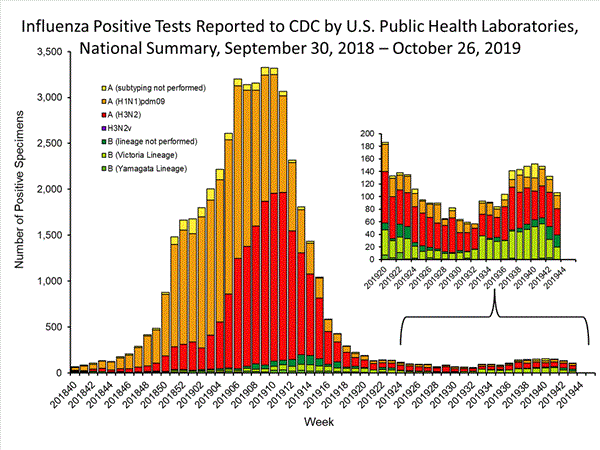
 
[h=1]Weekly U.S. Influenza Surveillance Report[/h]
fluview-banner2.jpg

Key Updates for Week 8, ending February 22, 2020

Key indicators that track flu activity remain high but decreased for the second week in a row. Severity indicators (hospitalizations and deaths) remain moderate to low overall, but hospitalization rates differ by age group, with high rates among children and young adults. [h=4]Viruses[/h]
Clinical Labs
The percentage of respiratory specimens testing positive for influenza at clinical laboratories decreased from 29.7% last week to 26.4% this week.

Public Health Labs
Numbers of influenza B/Victoria and A(H1N1)pdm09 viruses are approximately equal for the season overall, with continued increases in influenza A(H1N1)pdm09 viruses in recent weeks.

Virus Characterization
Genetic and antigenic characterization and antiviral susceptibility of influenza viruses collected in the U.S. are summarized in this report. [h=4]Illness[/h] Outpatient Illness: ILINet
Visits to health care providers for influenza-like illness (ILI) decreased from 6.1% last week to 5.5% this week. All regions remain above their baselines.

Outpatient Illness: ILINet Activity Map
Flu Activity & Surveillance - Flu Activity & Surveillance


The number of jurisdictions experiencing high ILI activity decreased slightly from 46 last week to 45 this week.

Geographic Spread
spreadmap-8 - Spread map


The number of jurisdictions reporting regional or widespread influenza activity decreased from 51 last week to 50 this week. [h=4]Severe Disease[/h]
Hospitalizations
The overall cumulative hospitalization rate for the season increased to 52.7 per 100,000.

P&I Mortality
The percentage of deaths attributed to pneumonia and influenza is 6.9%, below the epidemic threshold of 7.3%.

Pediatric Deaths
20 influenza-associated pediatric deaths occurring during the 2019-2020 season were reported this week. The total for the season is 125.

All data are preliminary and may change as more reports are received.

A description of the CDC influenza surveillance system, including methodology and detailed descriptions of each data component is available on the surveillance methods page.

Additional information on the current and previous influenza seasons for each surveillance component are available on FluView Interactive.

Key Points:
  • Outpatient ILI and clinical laboratory data remain elevated but decreased for the second week in a row. The percentage of specimens testing positive for both influenza A and influenza B viruses decreased.
  • Overall, hospitalization rates remain similar to this time during recent seasons, but rates among school aged children and young adults are higher at this time than in recent seasons and rates among children 0-4 years old are now the highest CDC has on record at this point in the season, surpassing rates reported during the second wave of the 2009 H1N1 pandemic.
  • Pneumonia and influenza mortality has been low, but 125 influenza-associated deaths in children have been reported so far this season. This number is higher for the same time period than in every season since reporting began in 2004-05, except for the 2009 pandemic.
  • CDC estimates that so far this season there have been at least 32 million flu illnesses, 310,000 hospitalizations and 18,000 deaths from flu.
  • Interim estimates of 2019-2020 flu vaccine effectiveness were released last week. So far this season, flu vaccines are reducing doctor’s visits for flu illness by 45% overall and 55% in children.
  • Antiviral medications are an important adjunct to flu vaccine in the control of influenza. Almost all (>99%) of the influenza viruses tested this season are susceptible to the four FDA-approved influenza antiviral medications recommended for use in the U.S. this season.
[h=2]U.S. Virologic Surveillance[/h] [h=3]Clinical Laboratories[/h]
The results of tests performed by clinical laboratories nationwide are summarized below. Data from clinical laboratories (the percentage of specimens tested that are positive for influenza) are used to monitor whether influenza activity is increasing or decreasing.
42,587948,064
11,249 (26.4%)190,362 (20.1%)
7,633 (67.9%)90,382 (47.5%)
3,616 (32.1%)99,980 (52.5%)
Week 8 Data Cumulative since
September 29, 2019
(week 40)
No. of specimens tested No. of positive specimens (%) Positive specimens by type Influenza A Influenza B
INFLUENZA Virus Isolated

View Chart Data | View Full Screen [h=3]Public Health Laboratories[/h]
The results of tests performed by public health laboratories nationwide are summarized below. Data from public health laboratories are used to monitor the proportion of circulating viruses that belong to each influenza subtype/lineage.
1,78362,234
1,15334,807
835 (72.4%)18,421 (52.9%)
697 (94.8%)16,409 (91.6%)
38 (5.2%)1,511 (8.4%)
100501
318 (27.6%)16,386 (47.1%)
2 (0.7%)205 (1.6%)
277 (99.3%)12,657 (98.4%)
393,524
Week 8 Data Cumulative since September 29, 2019
(week 40)
No. of specimens tested No. of positive specimens Positive specimens by type/subtype Influenza A (H1N1)pdm09 H3N2 Subtyping not performed Influenza B Yamagata lineage Victoria lineage Lineage not performed

While influenza B/Victoria viruses predominated earlier in the season, during recent weeks, influenza A(H1N1)pdm09 viruses have been reported more frequently than B/Victoria viruses. For the season, the number of B/Victoria and A(H1N1)pdm09 viruses are approximately equal. The predominant virus varies by region. Regional and state level data about circulating influenza viruses can be found on FluView Interactive.

The predominant virus also varies by age group. Nationally, for the season overall, influenza B viruses are the most commonly reported influenza viruses among children and young adults less than 25 years, while A viruses are the most commonly reported influenza viruses among persons 25 years and older. In the most recent weeks, influenza A viruses are the most commonly reported influenza viruses in all but the school aged children and young adults (5-24 years old).
INFLUENZA Virus Isolated

View Chart Data | View Full Screen

Additional virologic surveillance information for current and past seasons:
Surveillance Methods | FluView Interactive: National, Regional, and State Data or Age Data
[h=2]Influenza Virus Characterization[/h]
CDC performs genetic and antigenic characterization of U.S. viruses submitted from state and local health laboratories using Right Size Roadmap submission guidance. These data are used to compare how similar the currently circulating influenza viruses are to the reference viruses used for developing new influenza vaccines and to monitor evolutionary changes that continually occur in circulating influenza viruses. Antigenic characterization data are based on an animal model (influenza-naive ferrets), and do not reflect pre-existing protection provided by past influenza infections and vaccinations. Additional antigenic characterization studies involving people vaccinated with current influenza vaccines are conducted later in the season; these data account for pre-existing protection in different populations against circulating influenza viruses. Genetic and antigenic characterization data are not used to make calculations about vaccine effectiveness (VE). CDC conducts VE studies each year to measure the benefits of flu vaccines in people. Interim estimates of 2019-2020 flu vaccine effectiveness have been released.

CDC genetically characterized 1,787 influenza viruses collected in the U.S. from September 29, 2019, to February 22, 2020.
606
6B.1A606 (100%)
406
3C.2a386 (95.1%)2a1386 (95.1%)
2a20
2a30
2a40
3C.3a20 (4.9%)3a20 (4.9%)
699
V1A699 (100%)V1A0
V1A.151 (7.3%)
V1A.3648 (92.7%)
76
Y376 (100%)

Virus Subtype or Lineage Genetic Characterization
Total No. of Subtype/Lineage Tested Clade Number (% of subtype/lineage tested) Subclade Number (% of subtype/lineage tested) A/H1 A/H3 B/Victoria B/Yamagata

CDC antigenically characterizes a subset of influenza viruses by hemagglutination inhibition (HI) or neutralization based Focus Reduction assays (FRA). Antigenic drift is evaluated by comparing antigenic properties of cell-propagated reference viruses representing currently recommended vaccine components with those of cell-propagated circulating viruses. CDC antigenically characterized 287 influenza viruses collected in the United States from September 29, 2019, to February 22, 2020. These data are not used to make calculations about vaccine effectiveness (VE). CDC conducts VE studies each year to measure the benefits of flu vaccines in people.

Influenza A Viruses
  • A (H1N1)pdm09: 74 A(H1N1)pdm09 viruses were antigenically characterized by HI with ferret antisera, and all 74 (100%) were antigenically similar (reacting at titers that were within 4-fold of the homologous virus titer) to cell-propagated A/Brisbane/02/2018-like reference viruses representing the A(H1N1)pdm09 component for the 2019-20 Northern Hemisphere influenza vaccines.
  • A (H3N2): 72 A(H3N2) viruses were antigenically characterized by FRA with ferret antisera, and 31 (43.1%) were antigenically similar to cell-propagated A/Kansas/14/2017-like reference viruses representing the A(H3N2) component for the 2019-20 Northern Hemisphere influenza vaccines.


Influenza B Viruses
  • B/Victoria: 131 B/Victoria lineage viruses, including viruses from both co-circulating sub-clades, were antigenically characterized by HI with ferret antisera, and 83 (63.4%) were antigenically similar to cell-propagated B/Colorado/06/2017-like reference viruses representing the B/Victoria component for the 2019-20 Northern Hemisphere influenza vaccines.
  • B/Yamagata: 10 B/Yamagata lineage viruses were antigenically characterized by HI with ferret antisera, and all 10 (100%) were antigenically similar to cell-propagated B/Phuket/3073/2013-like reference viruses representing the B/Yamagata component for the 2019-20 Northern Hemisphere influenza vaccines.


CDC assesses susceptibility of influenza viruses to the antiviral medications including the neuraminidase inhibitors (oseltamivir, zanamivir, and peramivir) and the PA endonuclease inhibitor baloxavir using next generation sequence analysis supplemented by laboratory assays. Viruses collected in the United States since September 29, 2019, were tested for antiviral susceptibility as follows:
1,77660639969576
1 (0.1%)(0.0%)(0.0%)1 (0.1%)(0.0%)
3 (0.2%)3 (0.5%)(0.0%)(0.0%)(0.0%)
1,77660639969576
(0.0%)(0.0%)(0.0%)(0.0%)(0.0%)
4 (0.2%)3 (0.5%)(0.0%)1 (0.1%)(0.0%)
1,77660639969576
2 (0.1%)(0.0%)(0.0%)2 (0.3%)(0.0%)
(0.0%)(0.0%)(0.0%)(0.0%)(0.0%)
1,92662648473779
(0.0%)(0.0%)(0.0%)(0.0%)(0.0%)

Antiviral Medication Total Viruses A/H1 A/H3 B/Victoria B/Yamagata Neuraminidase Inhibitors Oseltamivir Viruses Tested Reduced Inhibition Highly Reduced Inhibition Peramivir Viruses Tested Reduced Inhibition
Highly Reduced Inhibition Zanamivir Viruses Tested Reduced Inhibition
Highly Reduced Inhibition PA Endonuclease Inhibitor
Baloxavir Viruses Tested
Reduced Susceptibility


A total of 416 additional viruses (199 A(H1N1)pdm09, 30 A(H3N2), and 187 B) collected in Alabama, Alaska, Florida, Illinois, Iowa, Louisiana, Massachusetts, Michigan, Nevada, New York, North Carolina, Pennsylvania, South Dakota, Virginia and Wisconsin were analyzed for resistance to neuraminidase inhibitors by pyrosequencing assay. Two (1.0%) of the 199 A(H1N1)pdm09 viruses tested had the H275Y amino acid substitution in the neuraminidase that confers resistance to oseltamivir and potential resistance to peramivir. No markers of resistance to neuraminidase inhibitors were detected in A(H3N2) and type B viruses tested.

[h=2]Outpatient Illness Surveillance[/h] [h=3]ILINet[/h]
Nationwide during week 8, 5.5% of patient visits reported through the U.S. Outpatient Influenza-like Illness Surveillance Network (ILINet) were due to influenza-like illness (ILI). This percentage is above the national baseline of 2.4%.
national levels of ILI and ARI

View Chart Data (current season only) | View Full Screen

On a regional level, the percentage of outpatient visits for ILI ranged from 3.6% to 8.8% during week 8. All regions reported a percentage of outpatient visits for ILI above their region-specific baselines. [h=3]ILI Activity Map[/h]
Data collected in ILINet are used to produce a measure of ILI activity* by state.

During week 8, the following ILI activity levels were experienced:
  • High – New York City, Puerto Rico, and 43 states (Alabama, Alaska, Arizona, Arkansas, California, Colorado, Connecticut, Georgia, Hawaii, Illinois, Indiana, Iowa, Kansas, Kentucky, Louisiana, Maine, Maryland, Massachusetts, Michigan, Minnesota, Mississippi, Missouri, Montana, Nebraska, New Hampshire, New Jersey, New Mexico, New York, North Carolina, Oklahoma, Pennsylvania, Rhode Island, South Carolina, South Dakota, Tennessee, Texas, Utah, Vermont, Virginia, Washington, West Virginia, Wisconsin, and Wyoming)
  • Moderate – five states (Delaware, Nevada, North Dakota, Ohio, and Oregon)
  • Low - the District of Columbia and one state (Idaho)
  • Minimal - the U.S. Virgin Islands and one state (Florida)
[SIZE=-1]*Data collected in ILINet may disproportionally represent certain populations within a state, and therefore, may not accurately depict the full picture of influenza activity for the whole state. Differences in the data presented here by CDC and independently by some state health departments likely represent differing levels of data completeness with data presented by the state likely being the more complete.[/SIZE]


Additional information about medically attended visits for ILI for current and past seasons:
Surveillance Methods | FluView Interactive: National, Regional, and State Data or ILI Activity Map


[h=2]Geographic Spread of Influenza as Assessed by State and Territorial Epidemiologists[/h]
The influenza activity reported by state and territorial epidemiologists indicates geographic spread of influenza viruses but does not measure the severity of influenza activity.

During week 8, the following influenza activity was reported:
  • Widespread – Puerto Rico and 48 states (Alabama, Alaska, Arizona, Arkansas, California, Colorado, Connecticut, Delaware, Florida, Georgia, Idaho, Illinois, Indiana, Iowa, Kansas, Kentucky, Louisiana, Maine, Maryland, Massachusetts, Michigan, Minnesota, Mississippi, Missouri, Montana, Nebraska, Nevada, New Hampshire, New Jersey, New Mexico, New York, North Carolina, North Dakota, Ohio, Oklahoma, Pennsylvania, Rhode Island, South Carolina, South Dakota, Tennessee, Texas, Utah, Vermont, Virginia, Washington, West Virginia, Wisconsin, and Wyoming)
  • Regional – one state (Oregon)
  • Local – the District of Columbia and one state (Hawaii)
  • Sporadic – the U.S. Virgin Islands
  • Guam did not report.
Additional geographic spread surveillance information for current and past seasons:
Surveillance Methods | FluView Interactive

[h=2]Influenza-Associated Hospitalizations[/h]
The Influenza Hospitalization Surveillance Network (FluSurv-NET) conducts population-based surveillance for laboratory-confirmed influenza-related hospitalizations in select counties in the Emerging Infections Program (EIP) states and Influenza Hospitalization Surveillance Project (IHSP) states.

A total of 15,319 laboratory-confirmed influenza-associated hospitalizations were reported by FluSurv-NET sites between October 1, 2019 and February 22, 2020; 10,439 (68.1%) were associated with influenza A virus, 4,797 (31.3%) with influenza B virus, 47 (0.3%) with influenza A virus and influenza B virus co-infection, and 36 (0.2%) with influenza virus for which the type was not determined. Among those with influenza A subtype information, 2,834 (94.1%) were A(H1N1)pdm09 virus and 179 (5.9%) were A(H3N2).

The overall cumulative hospitalization rate was 52.7 per 100,000 population which is similar to what has been seen during recent previous influenza seasons at this time of year. Rates in school aged children and young adults are higher than at this time in recent seasons, and rates among children 0-4 years old are now the highest CDC has on record at this point in the season, surpassing rates reported during the second wave of the 2009 H1N1 pandemic.

Click on graph to launch interactive tool
View Full Screen

The highest rate of hospitalization is among adults aged ≥ 65, followed by children aged 0-4 years and adults aged 50-64 years.
Overall52.7
0-4 years80.1
5-17 years20.6
18-49 years28.6
50-64 years69.1
65+ years132.0
Age Group 2019-2020 Season
Cumulative Rate per 100,000 Population


Among 2,172 hospitalized adults with information on underlying medical conditions, 92.1% had at least one reported underlying medical condition, the most commonly reported were cardiovascular disease, metabolic disorder, obesity, and chronic lung disease. Among 397 hospitalized children with information on underlying medical conditions, 48.6% had at least one underlying medical condition; the most commonly reported was asthma. Among 381 hospitalized women of childbearing age (15-44 years) with information on pregnancy status, 24.1% were pregnant.

Click on graph to launch interactive tool2
View Full Screen

Additional hospitalization surveillance information for current and past seasons and additional age groups:
Surveillance Methods | FluView Interactive: Rates by Age or Patient Characteristics


[h=2]Pneumonia and Influenza (P&I) Mortality Surveillance[/h]
Based on National Center for Health Statistics (NCHS) mortality surveillance data available on February 27, 2020, 6.9% of the deaths occurring during the week ending February 15, 2020 (week 7) were due to P&I. This percentage is below the epidemic threshold of 7.3% for week 7.
INFLUENZA Virus Isolated

View Chart Data | View Full Screen

Additional pneumonia and influenza mortality surveillance information for current and past seasons:
Surveillance Methods | FluView Interactive


[h=2]Influenza-Associated Pediatric Mortality[/h]
20 influenza-associated pediatric deaths occurring during the 2019-2020 season between weeks 52 and 8 (the weeks ending December 28, 2019 and February 22, 2020) were reported to CDC during week 8. 15 were associated with influenza B viruses, and four had a lineage determined; all B/Victoria viruses. Five were associated with influenza A viruses, and three were subtyped; all A(H1N1)pdm09 viruses.

Of the 125 influenza-associated pediatric deaths occurring during the 2019-2020 season and reported to CDC:
  • 87 deaths were associated with influenza B viruses, and 18 had a lineage determined; all were B/Victoria viruses.
  • 38 deaths were associated with influenza A viruses, and 23 were subtyped; 22 were A(H1N1)pdm09 viruses and one was an A(H3) virus.
Click on image to launch interactive tool

View Full Screen

Additional pediatric mortality surveillance information for current and past seasons:
Surveillance Methods | FluView Interactive


[h=2]Additional National and International Influenza Surveillance Information[/h]

FluView Interactive: FluView includes enhanced web-based interactive applications that can provide dynamic visuals of the influenza data collected and analyzed by CDC. These FluView Interactive applications allow people to create customized, visual interpretations of influenza data, as well as make comparisons across flu seasons, regions, age groups and a variety of other demographics. To access these tools, visit http://www.cdc.gov/flu/weekly/fluviewinteractive.htm

National Institute for Occupational Safety and Health: Monthly surveillance data on the prevalence of health-related workplace absenteeism among full-time workers in the United States are available from NIOSH at https://www.cdc.gov/niosh/topics/absences/default.html

U.S. State and local influenza surveillance:Select a jurisdiction below to access the latest local influenza information


[TD="width: 139"] Alabama [/TD]
[TD="width: 139"] Alaska [/TD]
[TD="width: 139"] Arizona [/TD]
[TD="width: 139"] Arkansas [/TD]
[TD="width: 139"] California [/TD]

[TD="width: 139"] Colorado [/TD]
[TD="width: 139"] Connecticut [/TD]
[TD="width: 139"] Delaware [/TD]
[TD="width: 139"] District of Columbia [/TD]
[TD="width: 139"] Florida [/TD]

[TD="width: 139"] Georgia [/TD]
[TD="width: 139"] Hawaii [/TD]
[TD="width: 139"] Idaho [/TD]
[TD="width: 139"] Illinois [/TD]
[TD="width: 139"] Indiana [/TD]

[TD="width: 139"] Iowa [/TD]
[TD="width: 139"] Kansas [/TD]
[TD="width: 139"] Kentucky [/TD]
[TD="width: 139"] Louisiana [/TD]
[TD="width: 139"] Maine [/TD]

[TD="width: 139"] Maryland [/TD]
[TD="width: 139"] Massachusetts [/TD]
[TD="width: 139"] Michigan [/TD]
[TD="width: 139"] Minnesota [/TD]
[TD="width: 139"] Mississippi [/TD]

[TD="width: 139"] Missouri [/TD]
[TD="width: 139"] Montana [/TD]
[TD="width: 139"] Nebraska [/TD]
[TD="width: 139"] Nevada [/TD]
[TD="width: 139"] New Hampshire [/TD]

[TD="width: 139"] New Jersey [/TD]
[TD="width: 139"] New Mexico [/TD]
[TD="width: 139"] New York [/TD]
[TD="width: 139"] North Carolina [/TD]
[TD="width: 139"] North Dakota [/TD]

[TD="width: 139"] Ohio [/TD]
[TD="width: 139"] Oklahoma [/TD]
[TD="width: 139"] Oregon [/TD]
[TD="width: 139"] Pennsylvania [/TD]
[TD="width: 139"] Rhode Island [/TD]

[TD="width: 139"] South Carolina [/TD]
[TD="width: 139"] South Dakota [/TD]
[TD="width: 139"] Tennessee [/TD]
[TD="width: 139"] Texas [/TD]
[TD="width: 139"] Utah [/TD]

[TD="width: 139"] Vermont [/TD]
[TD="width: 139"] Virginia [/TD]
[TD="width: 139"] Washington [/TD]
[TD="width: 139"] West Virginia [/TD]
[TD="width: 139"] Wisconsin [/TD]

[TD="width: 139"] Wyoming [/TD]
[TD="width: 139"] New York City [/TD]
[TD="width: 139"] Puerto Rico [/TD]
[TD="width: 139"] Virgin Islands [/TD]
[TD="width: 139"] [/TD]


World Health Organization: Additional influenza surveillance information from participating WHO member nations is available through FluNet and the Global Epidemiology Reports.

WHO Collaborating Centers for Influenza located in Australia, China, Japan, the United Kingdom, and the United States (CDC in Atlanta, Georgia).

Europe: For the most recent influenza surveillance information from Europe, please see WHO/Europe and the European Centre for Disease Prevention and Control at http://www.flunewseurope.org/.

Public Health Agency of Canada: The most up-to-date influenza information from Canada is available at http://www.phac-aspc.gc.ca/fluwatch/

Public Health England: The most up-to-date influenza information from the United Kingdom is available at https://www.gov.uk/government/statistics/weekly-national-flu-reports


Any links provided to non-Federal organizations are provided solely as a service to our users. These links do not constitute an endorsement of these organizations or their programs by CDC or the Federal Government, and none should be inferred. CDC is not responsible for the content of the individual organization web pages found at these links.


An overview of the CDC influenza surveillance system, including methodology and detailed descriptions of each data component, is available at: http://www.cdc.gov/flu/weekly/overview.htm.

--------------------------------------------------------------------------------


Page last reviewed: February 28, 2020, 11:00 AM
Content source: Centers for Disease Control and Prevention, National Center for Immunization and Respiratory Diseases (NCIRD)
...
https://www.cdc.gov/flu/weekly/index.htm
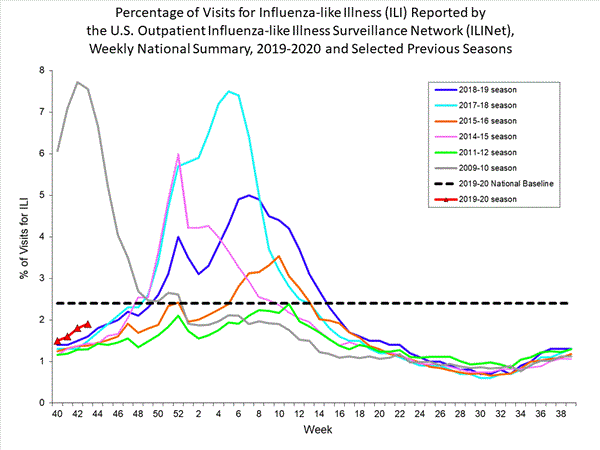
 
Back
Top