• FluTrackers.com Inc. does not provide medical advice. Information on this web site is collected from various internet resources, and the FluTrackers board of directors makes no warranty to the safety, efficacy, correctness or completeness of the information posted on this site by any author or poster. The information collated here is for instructional and/or discussion purposes only and is NOT intended to diagnose or treat any disease, illness, or other medical condition. Every individual reader or poster should seek advice from their personal physician/healthcare practitioner before considering or using any interventions that are discussed on this website. By continuing to access this website you agree to consult your personal physican before using any interventions posted on this website, and you agree to hold harmless FluTrackers.com Inc., the board of directors, the members, and all authors and posters for any effects from use of any medication, supplement, vitamin or other substance, device, intervention, etc. mentioned in posts on this website, or other internet venues referenced in posts on this website.
  • We are not asking for any donations. Do not donate to any entity who says they are raising funds for us.

USA FluView 2018-19

[h=3]2018-2019 Influenza Season Week 10 ending March 9, 2019[/h] All data are preliminary and may change as more reports are received.
An overview of the CDC influenza surveillance system, including methodology and detailed descriptions of each data component, is available at http://www.cdc.gov/flu/weekly/overview.htm.
[h=3]Synopsis:[/h] Influenza activity decreased slightly, but remains elevated in the United States. Influenza A(H1N1)pdm09, influenza A(H3N2), and influenza B viruses continue to co-circulate. Below is a summary of the key influenza indicators for the week ending March 9, 2019:
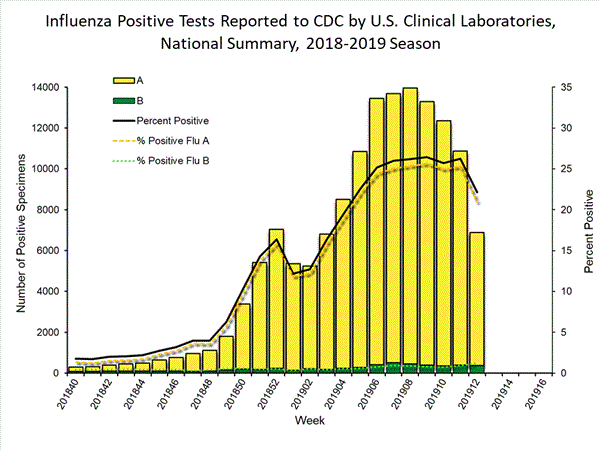
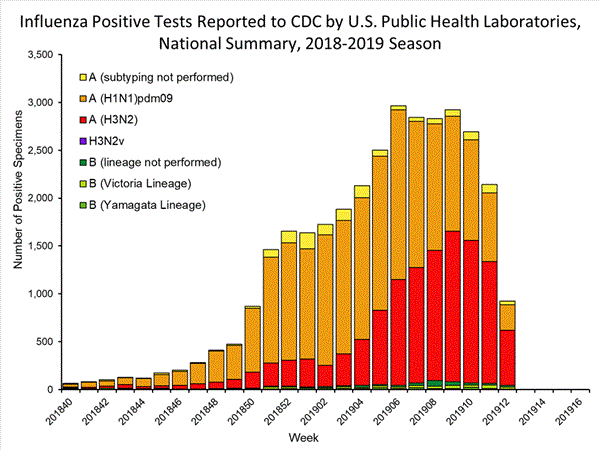
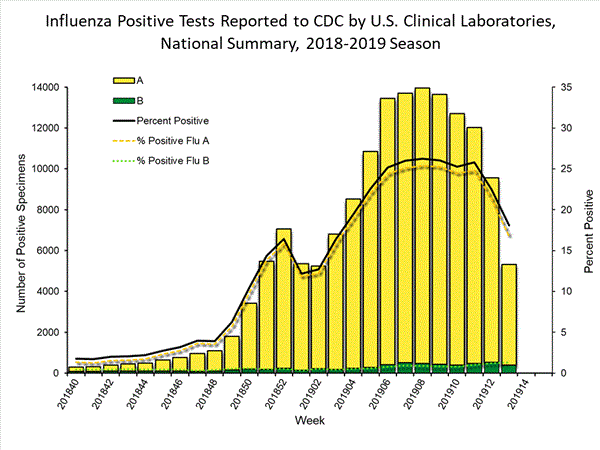
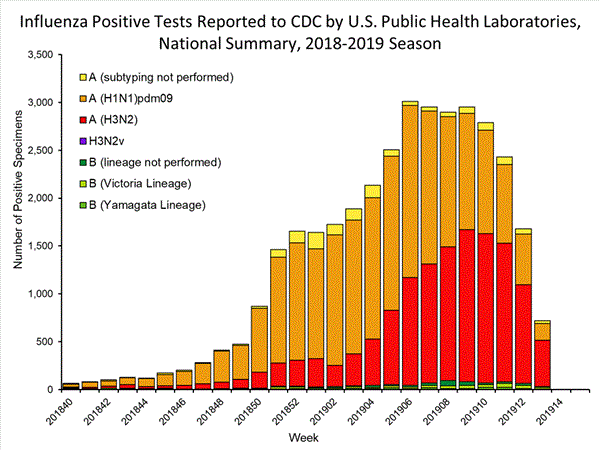
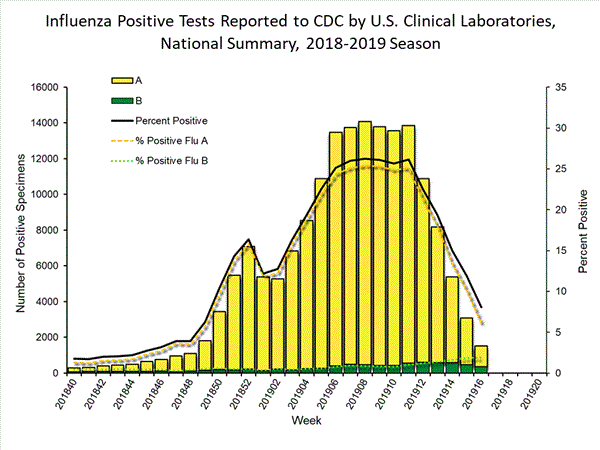
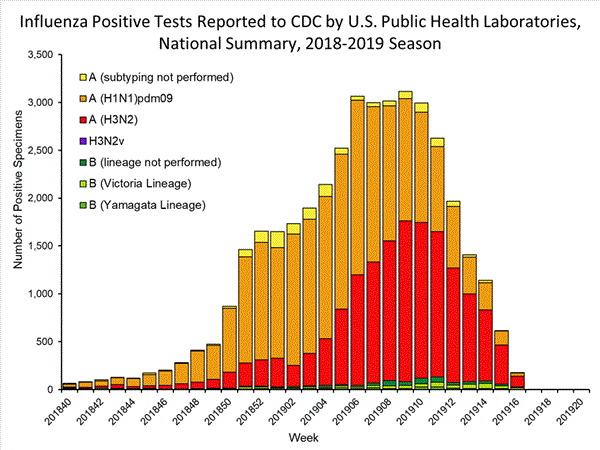
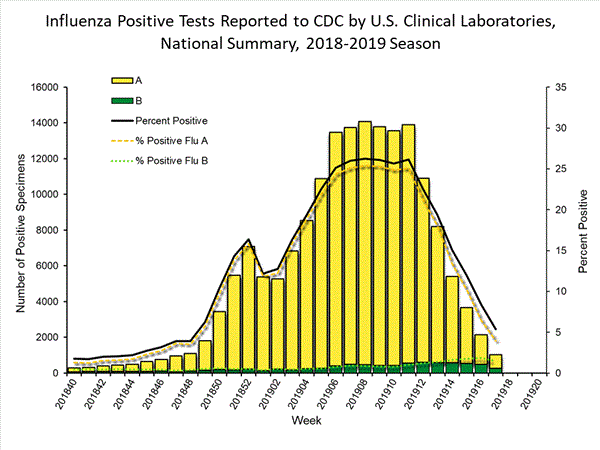
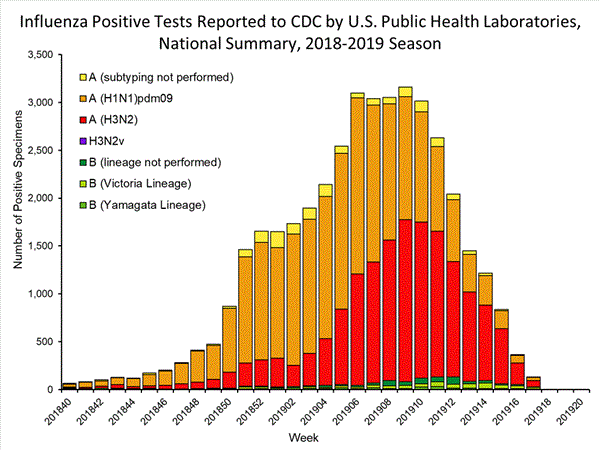
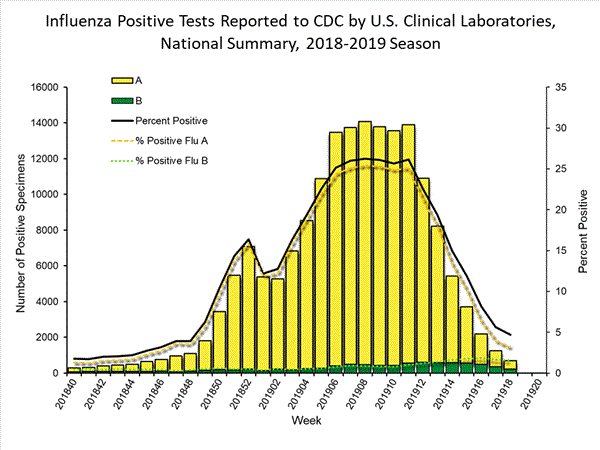
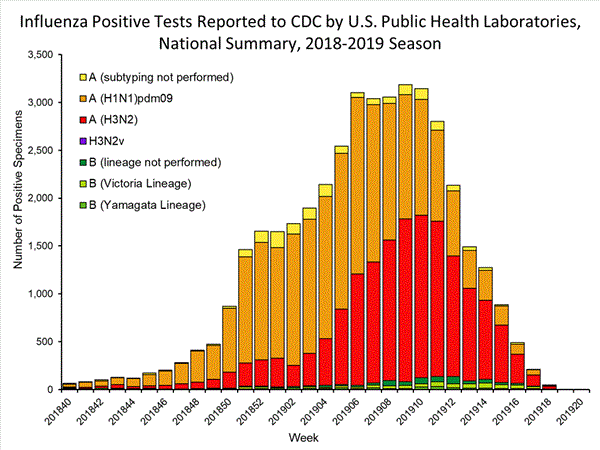
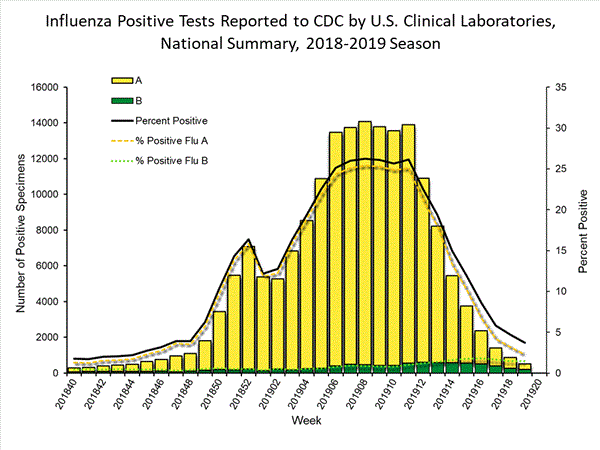
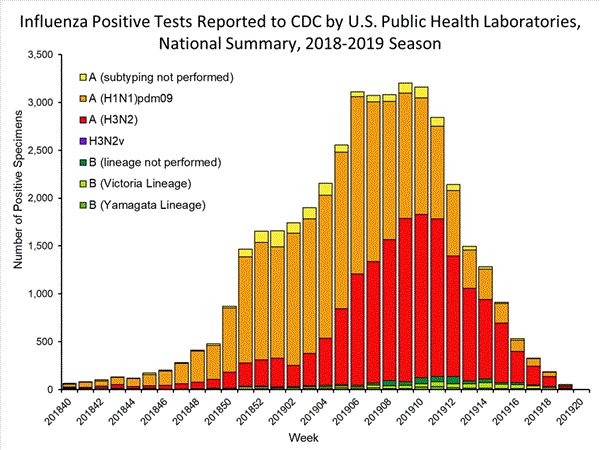
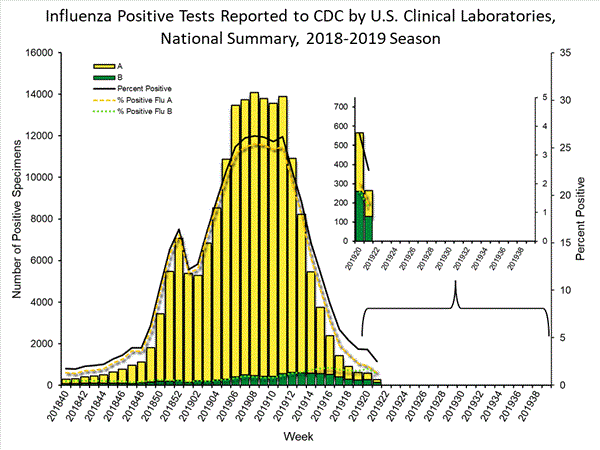
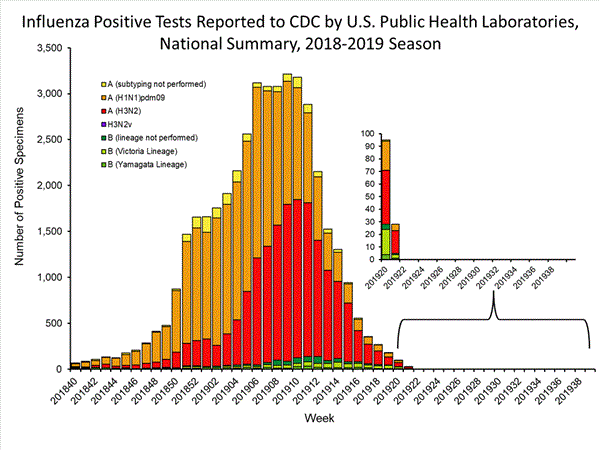
  • Viral Surveillance:The percentage of respiratory specimens testing positive for influenza viruses in clinical laboratories decreased slightly. Nationally, during week 10, influenza A(H3) viruses were reported more frequently than influenza A(H1N1)pdm09 viruses. During the most recent three weeks, influenza A(H3) viruses were reported more frequently than influenza A(H1N1)pdm09 viruses in HHS Regions 2, 4, 5, 6, 7, 8 and 10.
    • Virus Characterization:The majority of influenza viruses characterized antigenically are similar to the cell-grown reference viruses representing the 2018?2019 Northern Hemisphere influenza vaccine viruses.
    • Antiviral Resistance:The vast majority of influenza viruses tested (>99%) show susceptibility to oseltamivir and peramivir. All influenza viruses tested showed susceptibility to zanamivir.
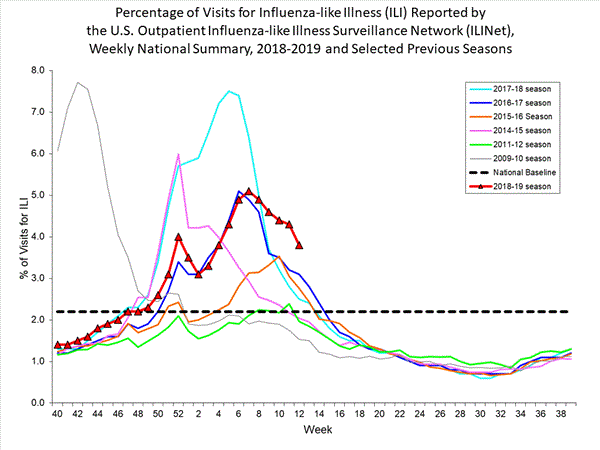
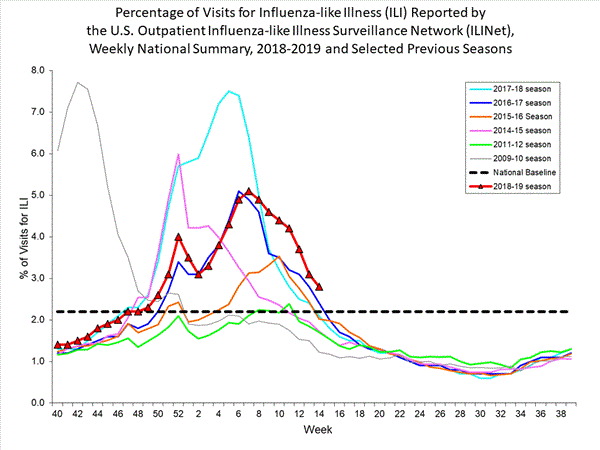
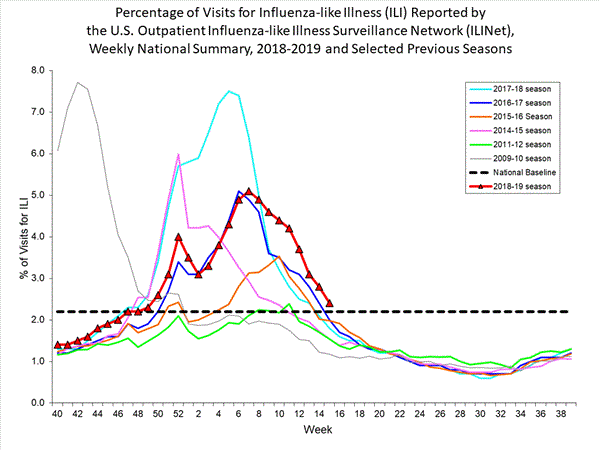
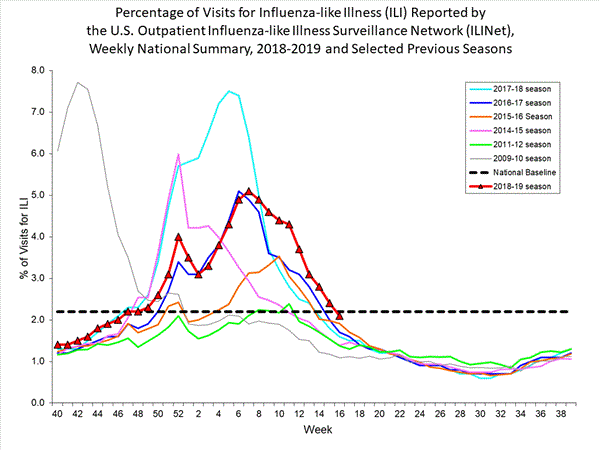
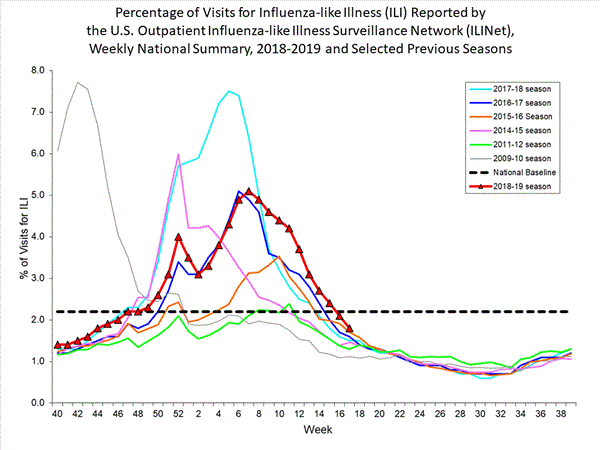
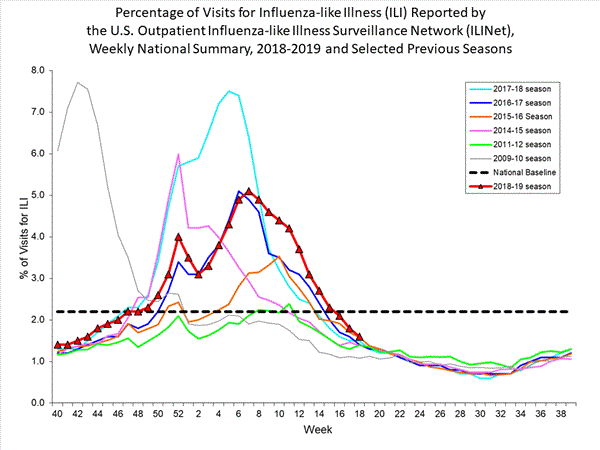
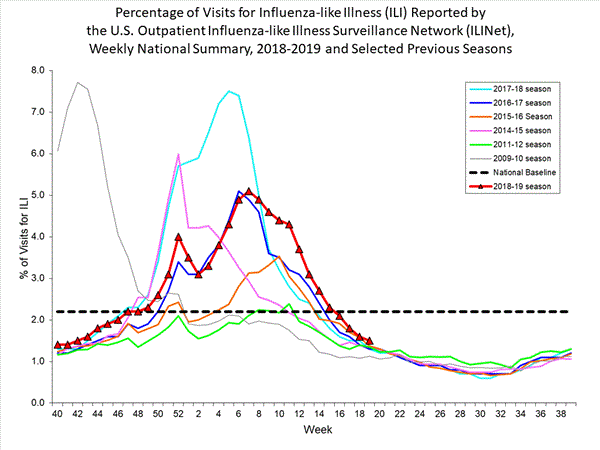
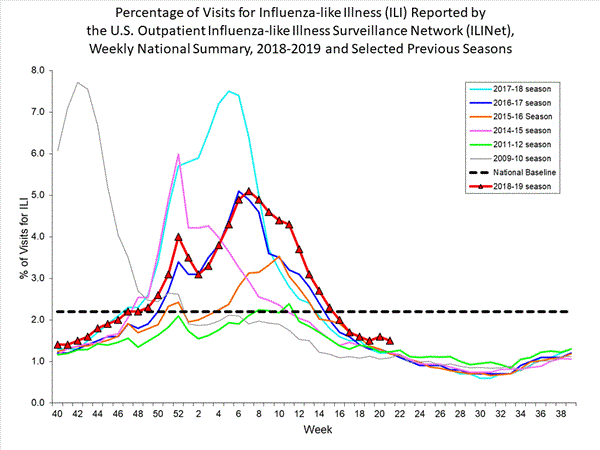
  • Influenza-like Illness Surveillance:The proportion of outpatient visits for influenza-like illness (ILI) decreased slightly to 4.5%, which is above the national baseline of 2.2%. All 10 regions reported ILI at or above their region-specific baseline level.
    • ILI State Activity Indictor Map: 30 states experienced high ILI activity; 11 states experienced moderate ILI activity; New York City, the District of Columbia and five states experienced low ILI activity; Puerto Rico and four states experienced minimal ILI activity; and the U.S. Virgin Islands had insufficient data.
  • Geographic Spread of Influenza: The geographic spread of influenza in Puerto Rico and 46 states was reported as widespread; four states reported regional activity; the District of Columbia reported local activity; the U.S. Virgin Islands reported sporadic activity; and Guam did not report.
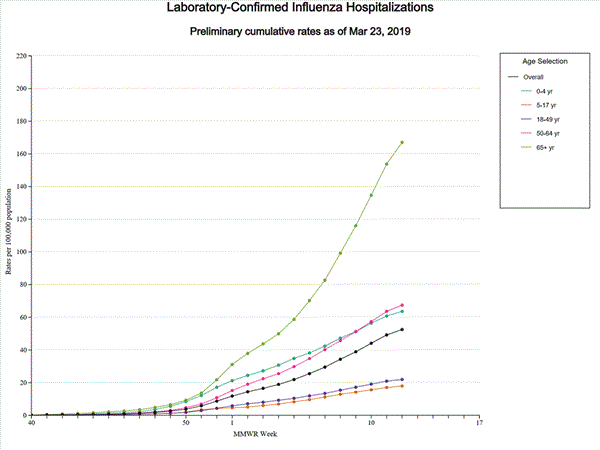
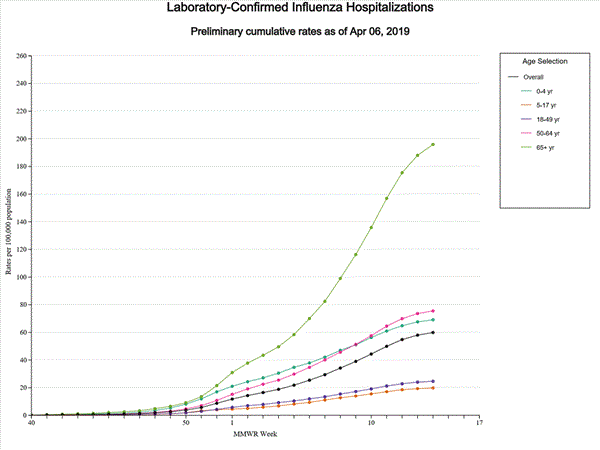
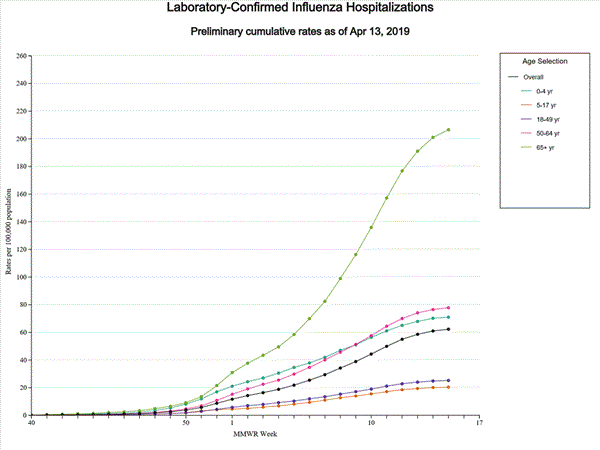
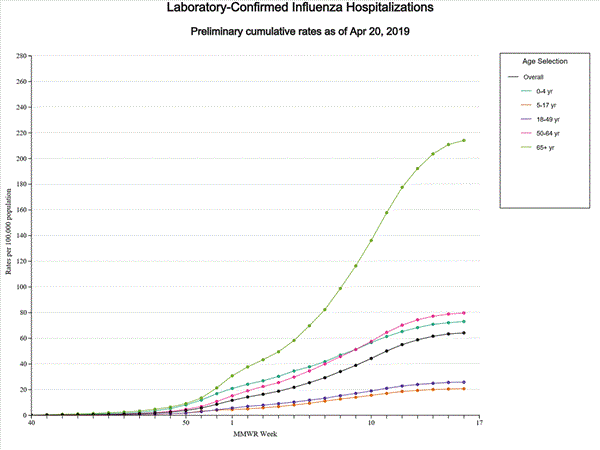
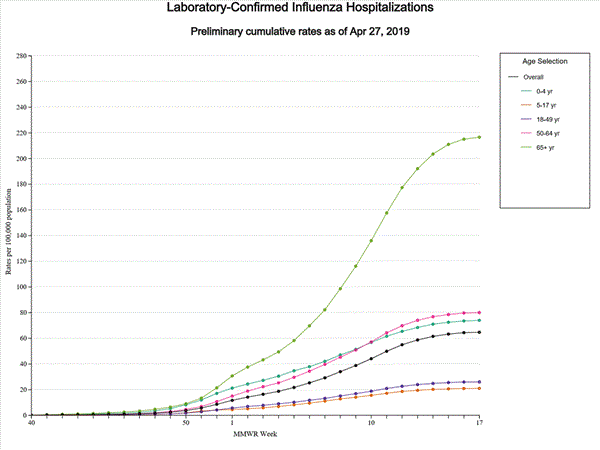
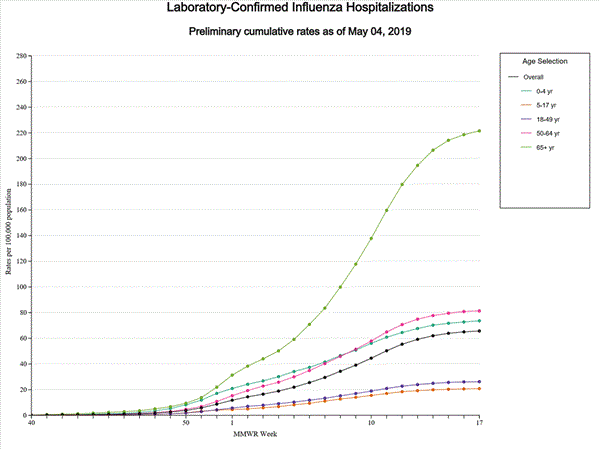
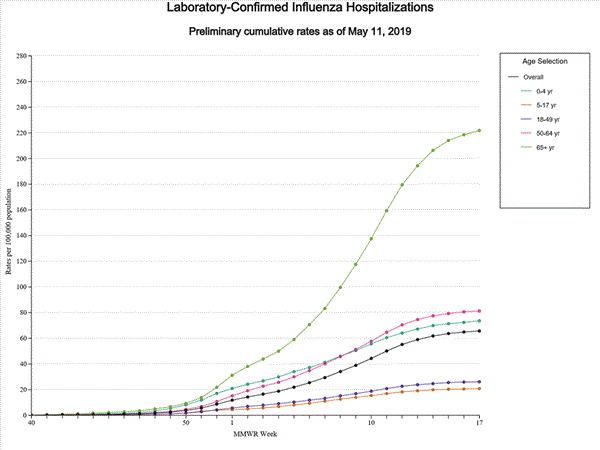
  • Influenza-associated Hospitalizations A cumulative rate of 41.3 laboratory-confirmed influenza-associated hospitalizations per 100,000 population was reported. The highest hospitalization rate is among adults 65 years and older (123.9 hospitalizations per 100,000 population).
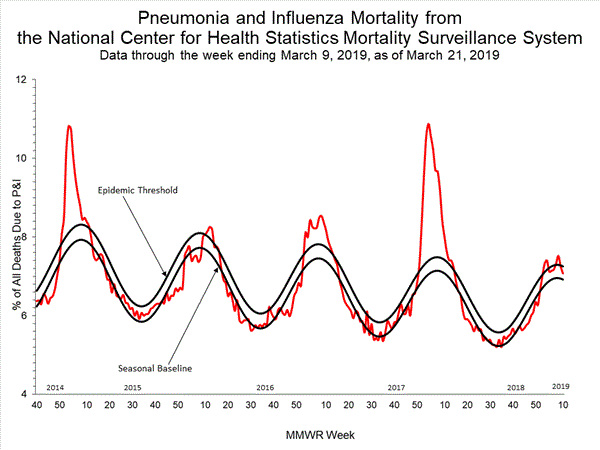
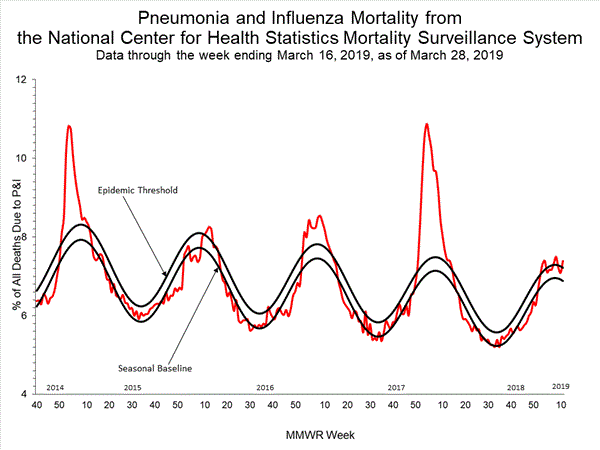
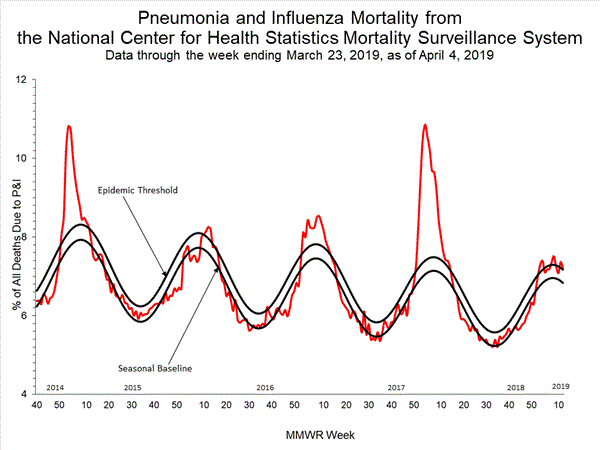
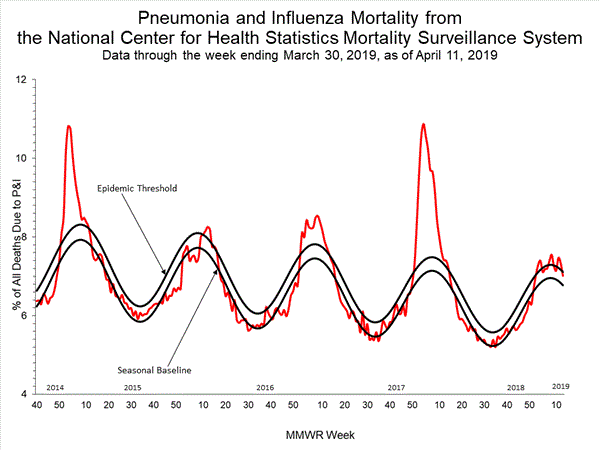
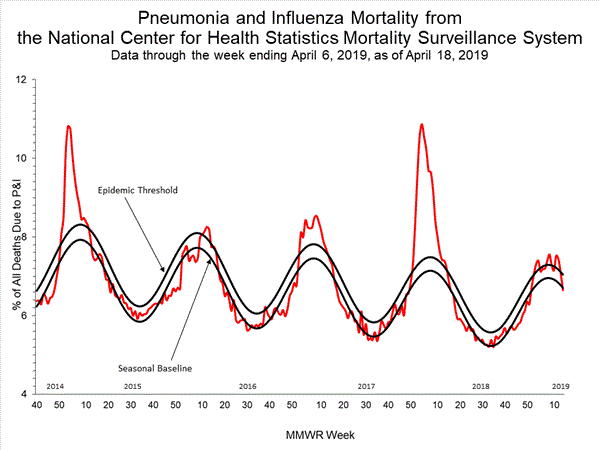
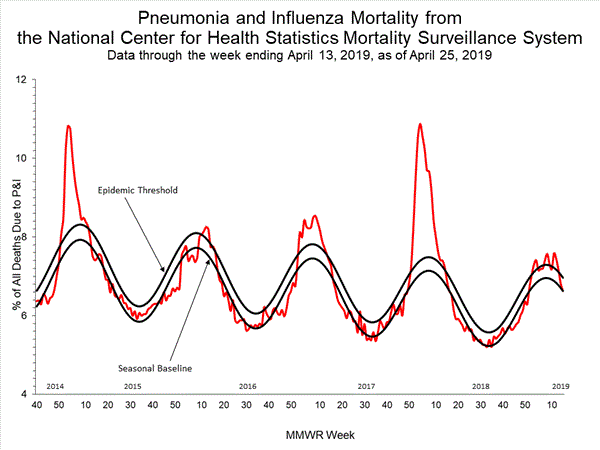
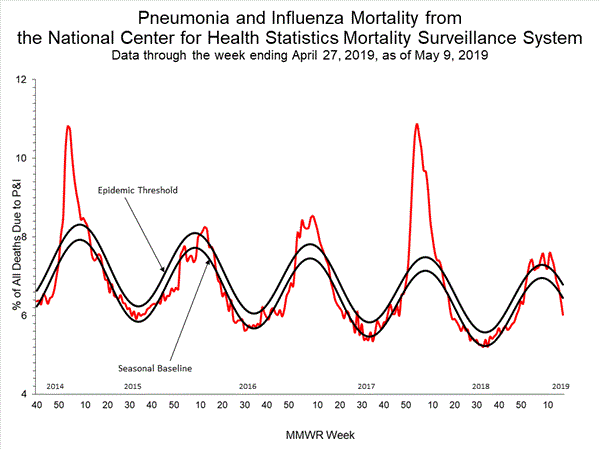
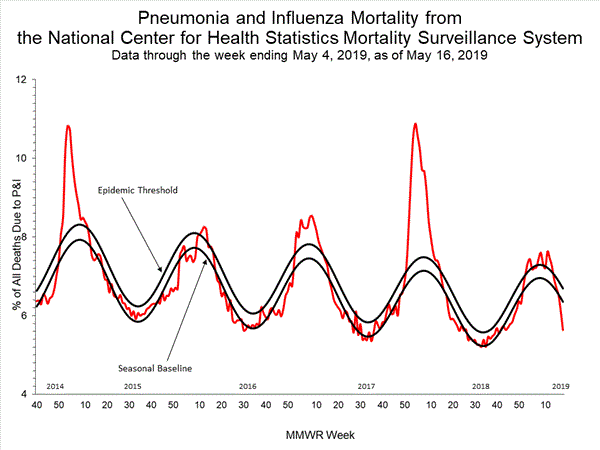
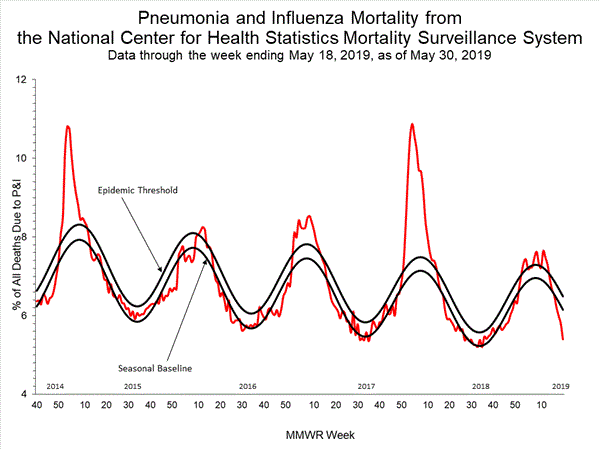
  • Pneumonia and Influenza Mortality: The proportion of deaths attributed to pneumonia and influenza (P&I) was below the system-specific epidemic threshold in the National Center for Health Statistics (NCHS) Mortality Surveillance System.
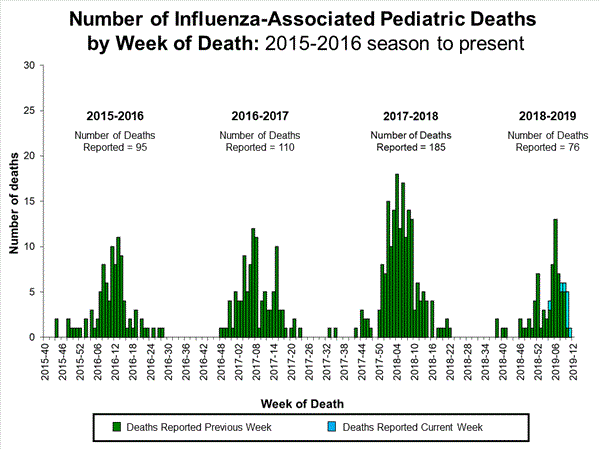
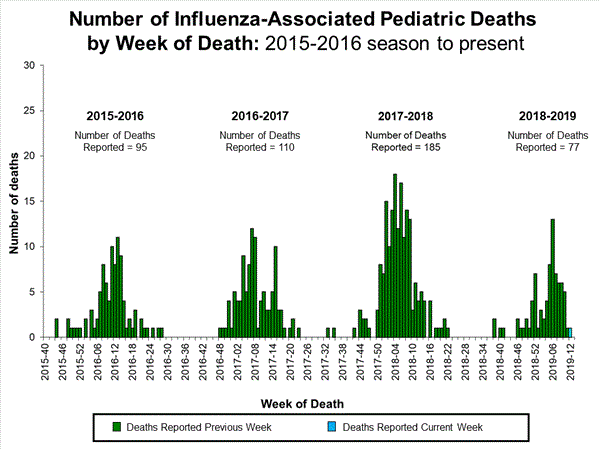
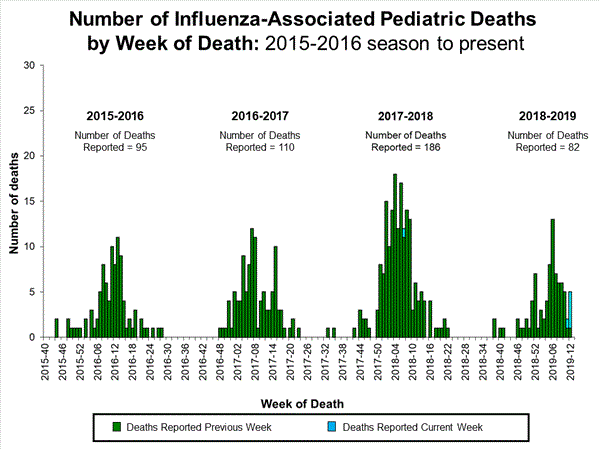
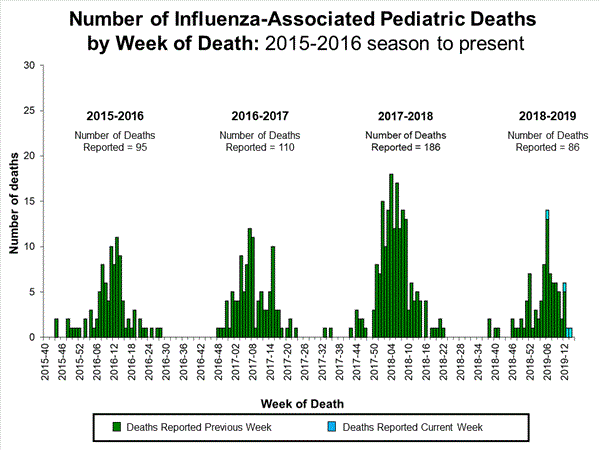
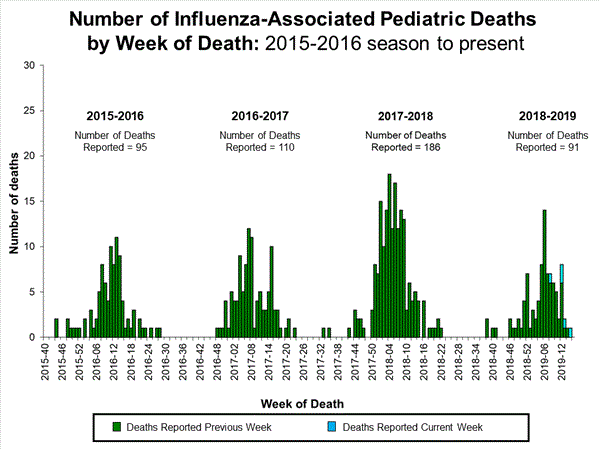
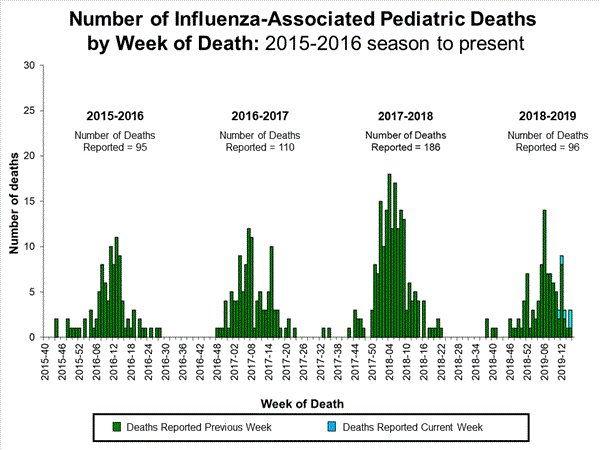
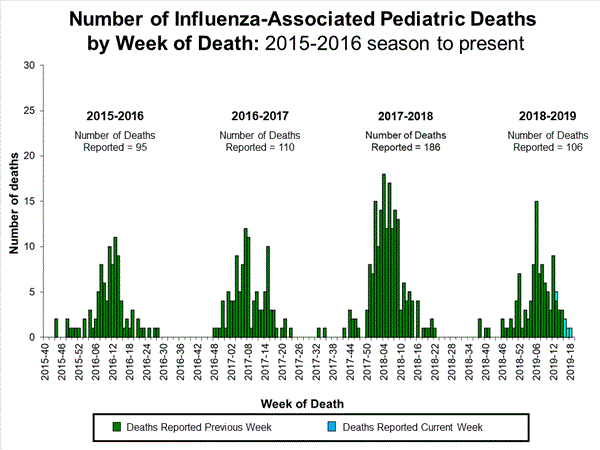
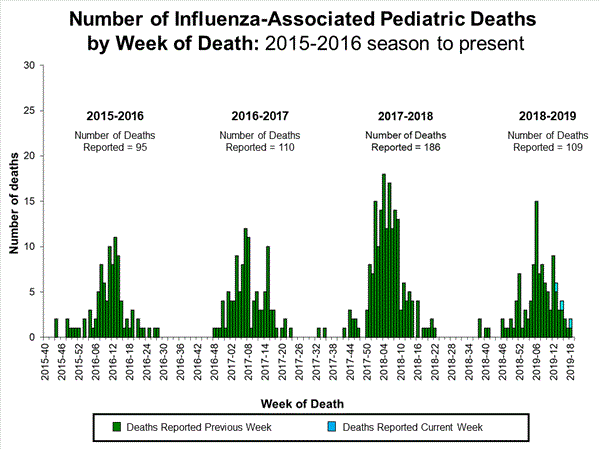
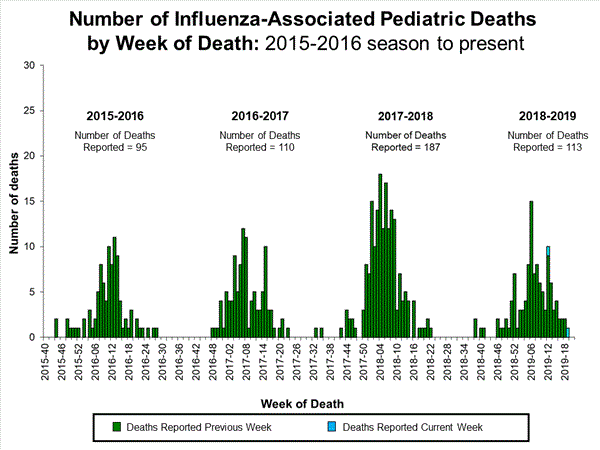
  • Influenza-associated Pediatric Deaths: Four influenza-associated pediatric deaths were reported to CDC during week 10.
[h=3]National and Regional Summary of Select Surveillance Components[/h]
[TABLE="class: table table-bordered opt-in, width: 100%"]
[TR]
[/TR]
[TR]
HHS Surveillance Regions* Data for current week National data is for the current week
Regional data is for the most recent three weeks
[/TR]
[TR]
Out-patient ILI? Number of jurisdictions reporting regional or widespread activity? % respiratory specimens positive for flu in clinical laboratories Predominant flu virus reported by public health laboratories [/TR]
[TR]
[/TR]
[TR]
Nation [TD]Elevated[/TD]
[TD]51 of 54[/TD]
[TD]25.8%[/TD]
[TD]Influenza A(H3)[/TD]
[/TR]
[TR]
Region 1 [TD]Elevated[/TD]
[TD]6 of 6[/TD]
[TD]20.4%[/TD]
[TD]Influenza A(H1N1)pdm09[/TD]
[/TR]
[TR]
Region 2 [TD]Elevated[/TD]
[TD]3 of 4[/TD]
[TD]24.3%[/TD]
[TD]Influenza A(H3)[/TD]
[/TR]
[TR]
Region 3 [TD]Elevated[/TD]
[TD]5 of 6[/TD]
[TD]26.7%[/TD]
[TD]Influenza A(H1N1)pdm09[/TD]
[/TR]
[TR]
Region 4 [TD]Elevated[/TD]
[TD]8 of 8[/TD]
[TD]16.1%[/TD]
[TD]Influenza A(H3)[/TD]
[/TR]
[TR]
Region 5 [TD]Elevated[/TD]
[TD]6 of 6[/TD]
[TD]29.2%[/TD]
[TD]Influenza A(H3)[/TD]
[/TR]
[TR]
Region 6 [TD]Elevated[/TD]
[TD]5 of 5[/TD]
[TD]29.1%[/TD]
[TD]Influenza A(H3)[/TD]
[/TR]
[TR]
Region 7 [TD]Elevated[/TD]
[TD]4 of 4[/TD]
[TD]29.9%[/TD]
[TD]Influenza A(H3)[/TD]
[/TR]
[TR]
Region 8 [TD]Elevated[/TD]
[TD]6 of 6[/TD]
[TD]34.0%[/TD]
[TD]Influenza A(H3)[/TD]
[/TR]
[TR]
Region 9 [TD]Elevated[/TD]
[TD]4 of 5[/TD]
[TD]13.0%[/TD]
[TD]Influenza A(H1N1)pdm09[/TD]
[/TR]
[TR]
Region 10 [TD]Elevated[/TD]
[TD]4 of 4[/TD]
[TD]32.2%[/TD]
[TD]Influenza A(H3)[/TD]
[/TR]
[/TABLE]
*https://www.hhs.gov/about/agencies/iea/regional-offices/index.html
? Elevated means the % of visits for ILI is at or above the national or region-specific baseline
? Includes all 50 states, the District of Columbia, Guam, Puerto Rico, and U.S. Virgin Islands

[h=2]U.S. Virologic Surveillance:[/h] WHO and NREVSS collaborating laboratories, which include both public health and clinical laboratories located in all 50 states, Puerto Rico, Guam, and the District of Columbia, report to CDC the total number of respiratory specimens tested for influenza and the number positive for influenza by virus type. In addition, public health laboratories also report the influenza A subtype (H1 or H3) and influenza B lineage information of the viruses they test and the age or age group of the persons from whom the specimens were collected.
Additional virologic data, including national, regional and select state-level data, can be found at: http://gis.cdc.gov/grasp/fluview/fluportaldashboard.html. Age group proportions and totals by influenza subtype reported by public health laboratories can be found at: http://gis.cdc.gov/grasp/fluview/flu_by_age_virus.html.
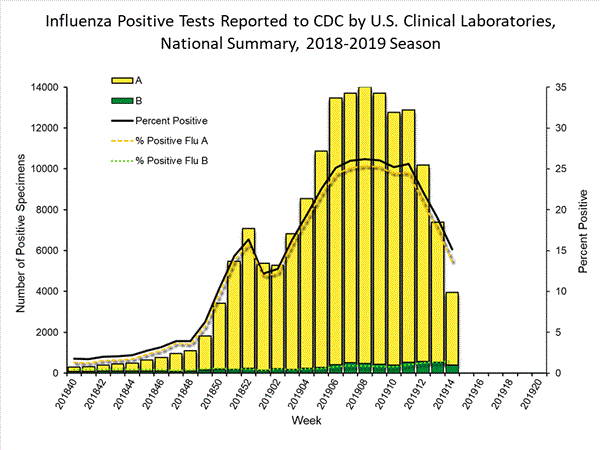
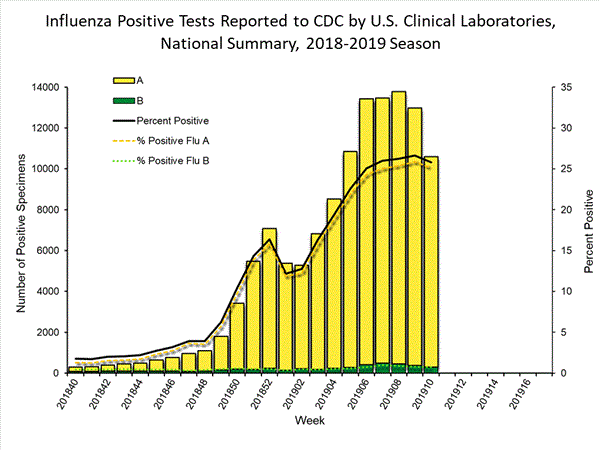
The results of tests performed by clinical laboratories are summarized below.
[TABLE="class: table table-bordered table-condensed opt-in, width: 100%"]
[TR]
[TD="width: 200"] [/TD]
Week 10 Data Cumulative since
September 30, 2018 (Week 40) [/TR]
[TR]
No. of specimens tested [TD]41,054[/TD]
[TD]809,094[/TD]
[/TR]
[TR]
No. of positive specimens (%) [TD]10,591 (25.8%)[/TD]
[TD]124,283 (15.4%)[/TD]
[/TR]
[TR]
Positive specimens by type [TD] [/TD]
[TD] [/TD]
[/TR]
[TR]
Influenza A [TD]10,296 (97.2%)[/TD]
[TD]119,654 (96.3%)[/TD]
[/TR]
[TR]
Influenza B [TD]295 (2.8%)[/TD]
[TD]4,629 (3.7%)[/TD]
[/TR]
[/TABLE]
View National and Regional Level Graphs and Data | View Chart Data | View Full Screen | View PowerPoint Presentation
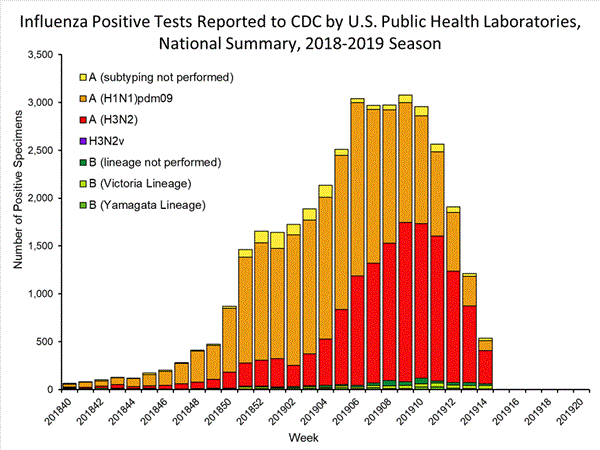
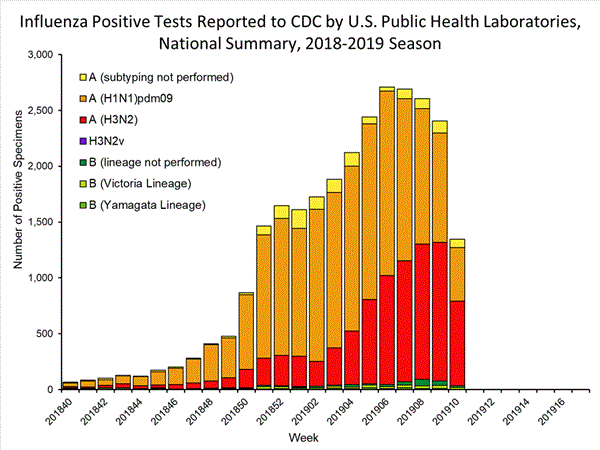
The results of tests performed by public health laboratories are summarized below.
[TABLE="class: table table-bordered table-condensed opt-in, width: 100%"]
[TR]
[TD] [/TD]
Week 10 Data Cumulative since
September 30, 2018 (Week 40) [/TR]
[TR]
No. of specimens tested [TD]2,047[/TD]
[TD]54,387[/TD]
[/TR]
[TR]
No. of positive specimens* [TD]1,345[/TD]
[TD]27,552[/TD]
[/TR]
[TR]
Positive specimens by type/subtype [TD] [/TD]
[TD] [/TD]
[/TR]
[TR]
[/TR]
[TR]
Influenza A [TD]1,309 (97.3%)[/TD]
[TD]26,818 (97.3%)[/TD]
[/TR]
[TR]
(H1N1)pdm09 [TD]478 (38.7%)[/TD]
[TD]17,169 (67.2%)[/TD]
[/TR]
[TR]
H3N2 [TD]758 (61.3%)[/TD]
[TD]6,725 (30.4%)[/TD]
[/TR]
[TR]
Subtyping not performed [TD]73[/TD]
[TD]1,267[/TD]
[/TR]
[TR]
[/TR]
[TR]
Influenza B [TD]36 (2.7%)[/TD]
[TD]734 (2.7%)[/TD]
[/TR]
[TR]
Yamagata lineage [TD]4 (20.0%)[/TD]
[TD]226 (48.0%)[/TD]
[/TR]
[TR]
Victoria lineage [TD]16 (80.0%)[/TD]
[TD]245 (52.0%)[/TD]
[/TR]
[TR]
Lineage not performed [TD]16[/TD]
[TD]263[/TD]
[/TR]
[/TABLE]
*The percent of specimens testing positive for influenza is not reported because public health laboratories often receive samples that have already tested positive for influenza at a clinical laboratory and therefore percent positive would not be a valid indicator of influenza activity. Additional information is available at http://www.cdc.gov/flu/weekly/overview.htm.

View National and Regional Level Graphs and Data | View Chart Data | View Full Screen | View PowerPoint Presentation
[h=2]Influenza Virus Characterization:[/h] Close monitoring of influenza viruses is required to better assess the potential impact on public health. CDC characterizes influenza viruses through one or more tests including genomic sequencing, hemagglutination inhibition (HI) and/or neutralization based Focus Reduction assays (FRA). These data are used to compare how similar currently circulating influenza viruses are to the reference viruses used for developing new influenza vaccines and to monitor evolutionary changes that continually occur in influenza viruses circulating in humans. Antigenic and genetic characterization of circulating influenza viruses gives an indication of the influenza vaccine's ability to induce an immune response against the wide array of influenza viruses that are co-circulating every season. However, annual vaccine effectiveness estimates are needed to determine how much protection was provided to the population by vaccination. On February 14, 2019, interim influenza effectiveness estimates for the 2018-2019 season were released and are available here.
For nearly all influenza-positive surveillance samples received at CDC, next-generation sequencing is performed to determine the genetic identity of circulating influenza viruses and to monitor the evolutionary trajectory of viruses circulating in our population. Virus gene segments are classified into genetic clades/subclades based on phylogenetic analysis. However, genetic changes that classify the clades/subclades do not always result in antigenic changes. ?Antigenic drift? is a term used to describe gradual antigenic change that occurs as viruses evolve changes to escape host immune pressure. Antigenic drift is evaluated by comparing antigenic properties of cell-propagated reference viruses representing currently recommended vaccine components with those of cell-propagated circulating viruses.
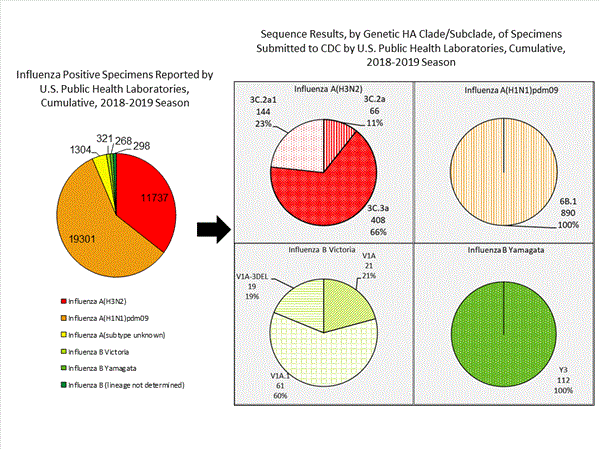
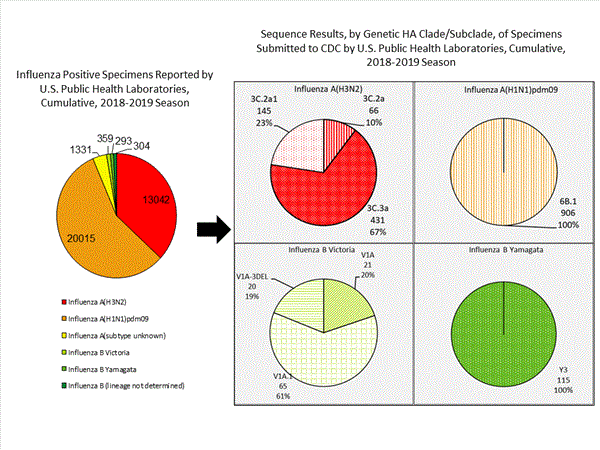
CDC has antigenically or genetically characterized 1,467 influenza viruses collected September 30, 2018 ? March 2, 2019, and submitted by U.S. laboratories, including 783 influenza A(H1N1)pdm09 viruses, 514 influenza A(H3N2) viruses, and 170 influenza B viruses.
Influenza A Viruses
Influenza B Viruses

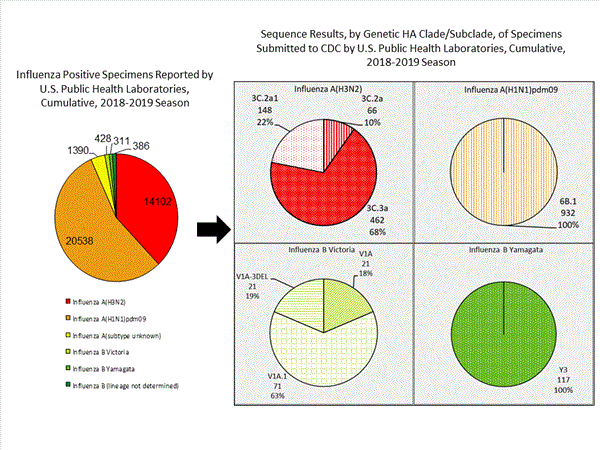
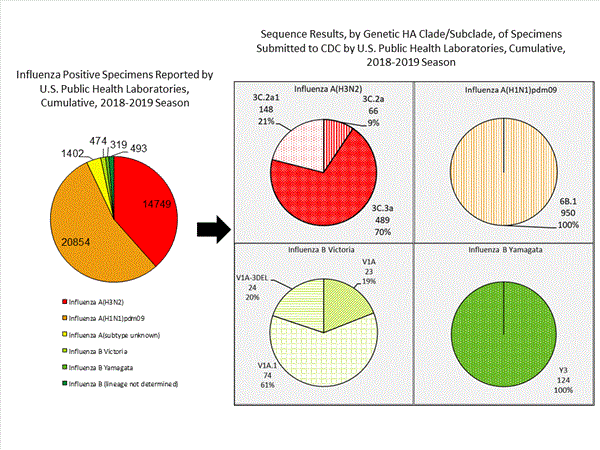
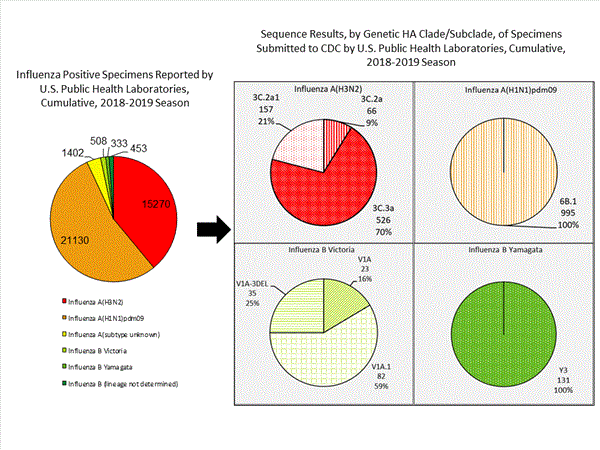
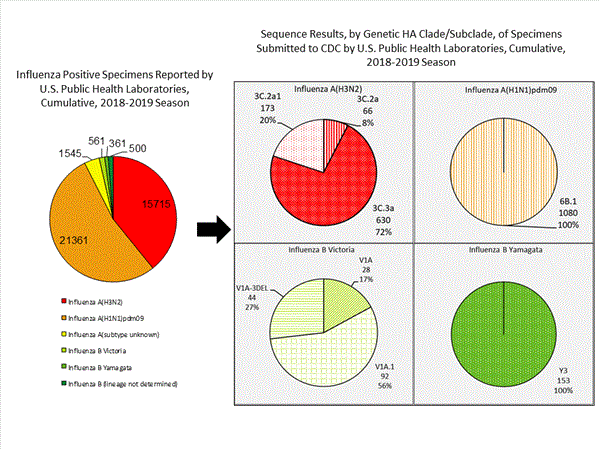
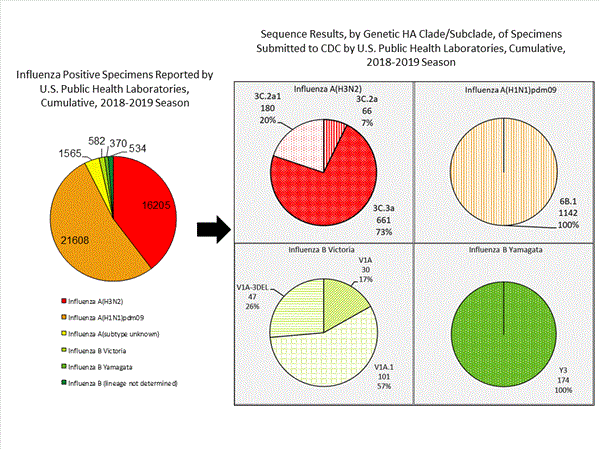
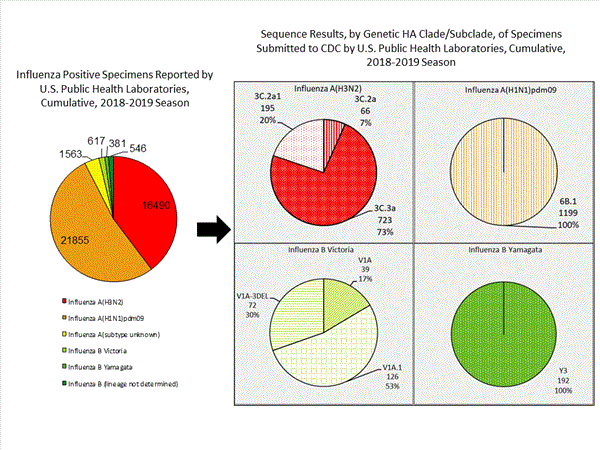
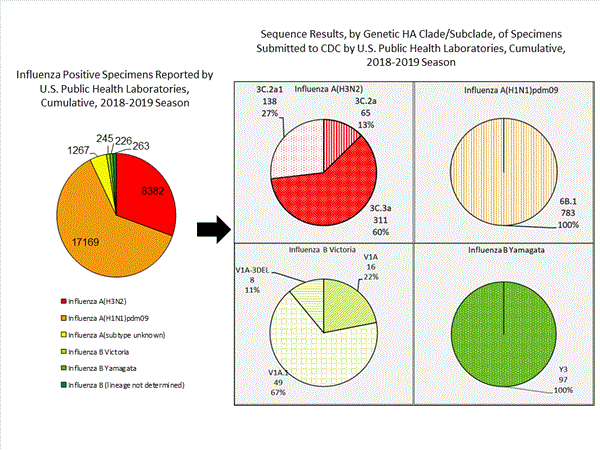
The majority of U.S. viruses submitted for characterization come from state and local public health laboratories. Due to Right Size Roadmapconsiderations, specimen submission guidance to laboratories is that, if available, 2 influenza A(H1N1)pdm09, 2 influenza A(H3N2), and 2 influenza B viruses be submitted every other week. Therefore, the numbers of each virus type/subtype characterized should be more balanced across subtypes/lineages but will not reflect the actual proportion of circulating viruses. In the figure below, the results of tests performed by public health labs are shown on the left and CDC sequence results (by genetic clade/subclade) are shown on the right.
Genetic10_small.gif

View Chart Data | View Full Screen | View PowerPoint Presentation
    • A (H1N1)pdm09: Phylogenetic analysis of the HA genes from 783 A(H1N1)pdm09 viruses showed that all belonged to clade 6B.1. Two hundred seventy six A(H1N1)pdm09 viruses were antigenically characterized, and 270 (97.8%) were antigenically similar (analyzed using HI with ferret antisera) to A/Michigan/45/2015 (6B.1), a cell-propagated A/Michigan/45/2015-like reference virus representing the A(H1N1)pdm09 component for the 2018-19 Northern Hemisphere influenza vaccines.
    • A (H3N2): Phylogenetic analysis of the HA genes from 514 A(H3N2) viruses revealed extensive genetic diversity with multiple clades/subclades co-circulating. The HA genes of circulating viruses belonged to clade 3C.2a (n=65), subclade 3C.2a1 (n=138) or clade 3C.3a (n=311). Two hundred twenty four A(H3N2) viruses were antigenically characterized by FRA with ferret antisera, and 138 (61.6%) A(H3N2) viruses tested were well-inhibited (reacting at titers that were within 4-fold of the homologous virus titer) by ferret antisera raised against A/Singapore/INFIMH-16-0019/2016 (3C.2a1), a cell-propagated reference virus representing the A(H3N2) component of 2018-19 Northern Hemisphere influenza vaccines. Eighty-six (38.4%) viruses reacted poorly (at titers that were 8-fold or greater reduced compared with that of the homologous virus A/Singapore/INFIMH-16-0019/2016) and of those, 85 (98.8%) belonged to clade 3C.3a.
    • B/Victoria: Phylogenetic analysis of 73 B/Victoria-lineage viruses indicate that all HA genes belonged to genetic clade V1A, however genetic subclades which are antigenically distinct have emerged. Genetic subclades which are antigenically distinct include viruses with a two amino acid deletion (162-163) in the HA protein (V1A.1, previously abbreviated as V1A-2Del) and viruses with a three amino acid deletion (162-164) in the HA protein (abbreviated as V1A-3Del). Fifty-four B/Victoria lineage viruses were antigenically characterized and 44 (81.5%) were antigenically similar with ferret antisera raised against cell-propagated B/Colorado/06/2017-like V1A.1 reference virus. Ten (18.5%) reacted poorly (at titers that were 8-fold or greater reduced compared with the homologous virus titer) and belonged to clade V1A or genetic subclade V1A-3Del.
    • B/Yamagata: Phylogenetic analysis of 97 influenza B/Yamagata-lineage viruses indicate that the HA genes belonged to clade Y3. A total of 83 influenza B/Yamagata-lineage viruses were antigenically characterized, and all were antigenically similar to cell-propagated B/Phuket/3073/2013 (Y3), the reference vaccine virus representing the influenza B/Yamagata-lineage component of the 2018-19 Northern Hemisphere quadrivalent vaccines.
    [h=2]Antiviral Resistance:[/h] Testing of influenza A(H1N1)pdm09, influenza A(H3N2), and influenza B viruses for resistance to the neuraminidase inhibitors (oseltamivir, zanamivir, and peramivir) is performed at CDC using next-generation sequencing analysis and/or a functional assay. Neuraminidase sequences of viruses are inspected to detect the presence of amino acid substitutions,previously associated with reduced or highly reduced inhibition by any of three neuraminidase inhibitors.In addition, a subset of viruses are tested using the neuraminidase inhibition assay with three neuraminidase inhibitors. The level of neuraminidase activity inhibition is reported using the thresholds recommended by the World Health Organization Expert Working Group of the Global Influenza Surveillance and Response System (GISRS)These samples are routinely obtained for surveillance purposes rather than for diagnostic testing of patients suspected to be infected with an antiviral-resistant virus.
    Reporting of baloxavir susceptibility testing for the 2018-2019 influenza season will begin later this season. More information regarding influenza antiviral drug resistance can be found here.
    High levels of resistance to the adamantanes (amantadine and rimantadine) persist among influenza A(H1N1)pdm09 and influenza A(H3N2) viruses (the adamantanes are not effective against influenza B viruses). Therefore, data from adamantane resistance testing are not presented below.
    [h=3]Assessment of Virus Susceptibility to Neuraminidase Inhibitors Using Next-Generation Sequencing Analysis and/or Neuraminidase Inhibition Assay[/h]
    [TABLE="class: table table-bordered opt-in, width: 100%"]
    [TR]
    Type/Subtype or Lineage Inhibition of Neuraminidase Activity by Antiviral Drug [/TR]
    [TR]
    [TD="colspan: 3"]Oseltamivir[/TD]
    [TD="colspan: 3"]Peramivir[/TD]
    [TD="colspan: 3"]Zanamivir[/TD]
    [/TR]
    [TR]
    Virus Tested (n) Reduced, Number (%) Highly Reduced, Number (%) Virus Tested (n) Reduced, Number (%) Highly Reduced, Number (%) Virus Tested (n) Reduced, Number (%) Highly Reduced, Number (%) [/TR]
    [TR]
    Total Viruses [TD]1,477[/TD]
    [TD]2 (0.1%)[/TD]
    [TD]2 (0.1%)[/TD]
    [TD]1,477[/TD]
    [TD]0 (0%)[/TD]
    [TD]2 (0.1%)[/TD]
    [TD]1,477[/TD]
    [TD]0 (0%)[/TD]
    [TD]0 (0%)[/TD]
    [/TR]
    [TR]
    A(H1N1)pdm09 [TD]791[/TD]
    [TD]2 (0.3%)[/TD]
    [TD]2 (0.3%)[/TD]
    [TD]791[/TD]
    [TD]0 (0%)[/TD]
    [TD]2 (0.3%)[/TD]
    [TD]791[/TD]
    [TD]0 (0%)[/TD]
    [TD]0 (0%)[/TD]
    [/TR]
    [TR]
    A(H3N2) [TD]519[/TD]
    [TD]0 (0%)[/TD]
    [TD]0 (0%)[/TD]
    [TD]519[/TD]
    [TD]0 (0%)[/TD]
    [TD]0 (0%)[/TD]
    [TD]519[/TD]
    [TD]0 (0%)[/TD]
    [TD]0 (0%)[/TD]
    [/TR]
    [TR]
    B/Victoria [TD]71[/TD]
    [TD]0 (0%)[/TD]
    [TD]0 (0%)[/TD]
    [TD]71[/TD]
    [TD]0 (0%)[/TD]
    [TD]0 (0%)[/TD]
    [TD]71[/TD]
    [TD]0 (0%)[/TD]
    [TD]0 (0%)[/TD]
    [/TR]
    [TR]
    B/Yamagata [TD]96[/TD]
    [TD]0 (0%)[/TD]
    [TD]0 (0%)[/TD]
    [TD]96[/TD]
    [TD]0 (0%)[/TD]
    [TD]0 (0%)[/TD]
    [TD]96[/TD]
    [TD]0 (0%)[/TD]
    [TD]0 (0%)[/TD]
    [/TR]
    [/TABLE]
    Antiviral treatment as early as possible is recommended for patients with confirmed or suspected influenza who have severe, complicated, or progressive illness; who require hospitalization; or who are at high risk for serious influenza-related complications. Additional information on recommendations for treatment and chemoprophylaxis of influenza virus infection with antiviral agents is available at:http://www.cdc.gov/flu/antivirals/index.htm.


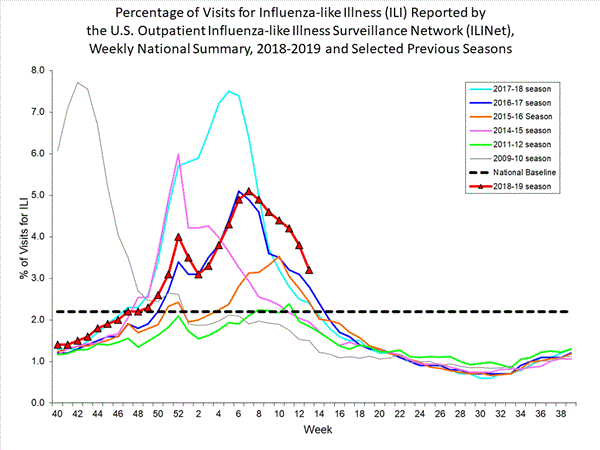
    [h=2]Outpatient Illness Surveillance:[/h] Nationwide during week 10, 4.5% of patient visits reported through the U.S. Outpatient Influenza-like Illness Surveillance Network (ILINet) were due to influenza-like illness (ILI). This percentage is above the national baseline of 2.2%.(ILI is defined as fever (temperature of 100?F [37.8?C] or greater) and cough and/or sore throat.)
    On a regional level, the percentage of outpatient visits for ILI ranged from 3.0% to 8.5% during week 10. All 10 regions reported a percentage of outpatient visits for ILI at or above their region-specific baseline.
    Additional data on medically attended visits for ILI for current and past seasons and by geography (national, HHS region, or select states) are available on FluView Interactive http://gis.cdc.gov/grasp/fluview/fluportaldashboard.html.

    View National and Regional Level Graphs and Data | View Chart Data | View Full Screen | View PowerPoint Presentation


    [h=2]ILINet State Activity Indicator Map:[/h] Data collected in ILINet are used to produce a measure of ILI activity* by state. Activity levels are based on the percent of outpatient visits in a state due to ILI and are compared to the average percent of ILI visits that occur during weeks with little or no influenza virus circulation. Activity levels range from minimal, which would correspond to ILI activity from outpatient clinics being below, or only slightly above, the average, to high, which would correspond to ILI activity from outpatient clinics being much higher than average.
    The ILI Activity Indicator Map displays state-specific activity levels for multiple seasons and allows a visual representation of relative activity from state to state. More information is available on FluView Interactive at https://gis.cdc.gov/grasp/fluview/main.html.
    During week 10, the following ILI activity levels were experienced:


    *This map uses the proportion of outpatient visits to health care providers for ILI to measure the ILI activity level within a state. It does not, however, measure the extent of geographic spread of flu within a state. Therefore, outbreaks occurring in a single city could cause the state to display high activity levels.
    Data collected in ILINet may disproportionally represent certain populations within a state, and therefore, may not accurately depict the full picture of influenza activity for the whole state.
    Data displayed in this map are based on data collected in ILINet, whereas the State and Territorial flu activity map is based on reports from state and territorial epidemiologists. The data presented in this map are preliminary and may change as more data are received.
    Differences in the data presented here by CDC and independently by some state health departments likely represent differing levels of data completeness with data presented by the state likely being the more complete.


    [h=2]Geographic Spread of Influenza as Assessed by State and Territorial Epidemiologists[/h] The influenza activity reported by state and territorial epidemiologists indicates geographic spread of influenza viruses, but does not measure the severity of influenza activity. Additional data displaying the influenza activity reported by state and territorial epidemiologists for the current and past seasons are available on FluView Interactive at https://gis.cdc.gov/grasp/fluview/FluView8.html
    During week 10, the following influenza activity was reported:
      • 30 states (Alabama, Alaska, Arkansas, Colorado, Connecticut, Georgia, Indiana, Iowa, Kansas, Kentucky, Louisiana, Mississippi, Missouri, Nebraska, New Jersey, New Mexico, North Carolina, North Dakota, Ohio, Oklahoma, Oregon, Pennsylvania, Rhode Island, South Carolina, Texas, Utah, Virginia, Washington, Wisconsin and Wyoming) experienced high ILI activity.
      • 11 states (California, Hawaii, Illinois, Maine, Maryland, Montana, Nevada, New York, South Dakota, Vermont and West Virginia) experienced moderate ILI activity.
      • New York City, the District of Columbia and five states (Idaho, Massachusetts, Michigan, Minnesota and New Hampshire) experienced low ILI activity.
      • Puerto Rico and four states (Arizona, Delaware, Florida and Tennessee) experienced minimal ILI activity.
      • Data were insufficient to calculate an ILI activity level from the U.S. Virgin Islands.
      • Widespread influenza activity was reported by Puerto Rico and 46 states (Alabama, Alaska, Arizona, Arkansas, California, Colorado, Connecticut, Delaware, Florida, Georgia, Idaho, Illinois, Indiana, Iowa, Kansas, Kentucky, Louisiana, Maine, Maryland, Massachusetts, Michigan, Minnesota, Mississippi, Missouri, Montana, Nebraska, Nevada, New Hampshire, New Jersey, New Mexico, New York, North Carolina, North Dakota, Ohio, Oklahoma, Oregon, Pennsylvania, Rhode Island, South Carolina, South Dakota, Utah, Virginia, Washington, West Virginia, Wisconsin and Wyoming).
      • Regional influenza activity was reported by four states (Hawaii, Tennessee, Texas and Vermont).
      • Local influenza activity was reported by the District of Columbia.
      • Sporadic influenza activity was reported by the U.S. Virgin Islands.
      • Guam did not report.
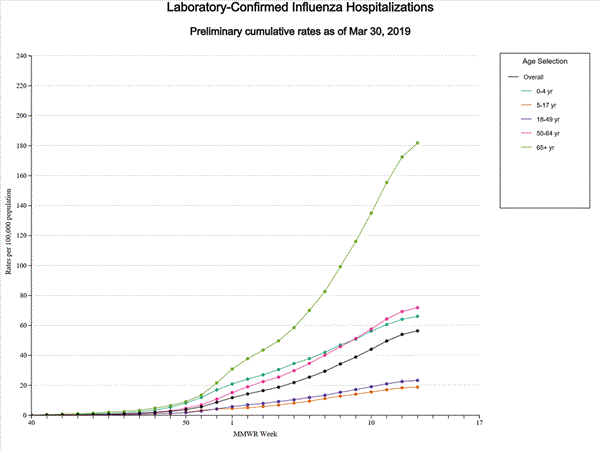
        [h=2]Influenza-Associated Hospitalizations:[/h] The Influenza Hospitalization Surveillance Network (FluSurv-NET) conducts population-based surveillance for laboratory-confirmed influenza-related hospitalizations in select counties in the Emerging Infections Program (EIP) states and Influenza Hospitalization Surveillance Project (IHSP) states.
        A total of 11,922 laboratory-confirmed influenza-associated hospitalizations were reported by FluSurv-NET sites between October 1, 2018 and March 9, 2019. The overall hospitalization rate was 41.3 per 100,000 population. The highest rate of hospitalization was among adults aged ≥65 (123.9 per 100,000 population), followed by children aged 0-4 (54.8 per 100,000 population) and adults aged 50-64 (54.0 per 100,000 population). Among 11,922 hospitalizations, 11,395 (95.6%) were associated with influenza A virus, 429 (3.6%) with influenza B virus, 34 (0.3%) with influenza A virus and influenza B virus co-infection, and 64 (0.5%) with influenza virus for which the type was not determined. Among those with influenza A subtype information, 1,727 (63.6%) were A(H1N1)pdm09 virus and 986 (36.3%) were A(H3N2).
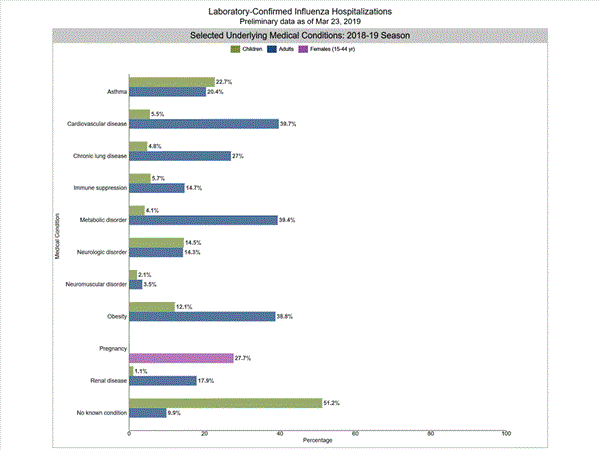
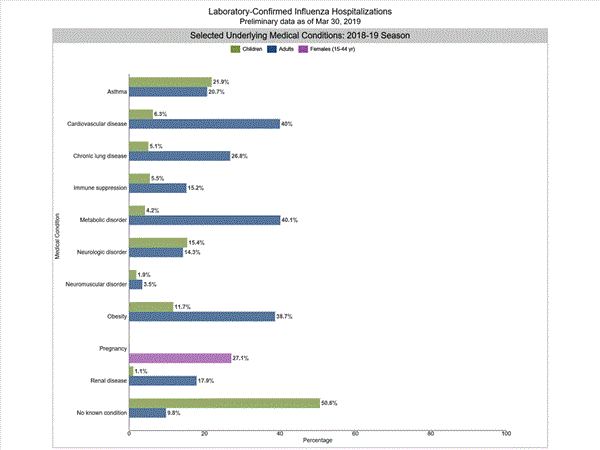
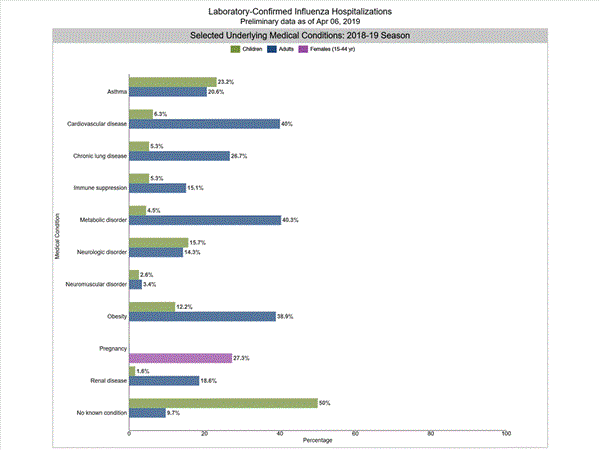
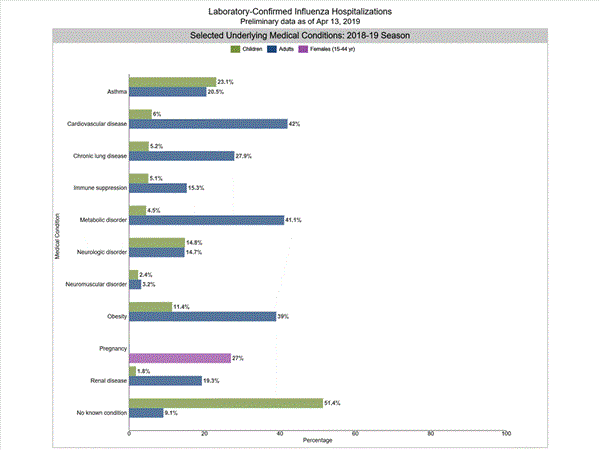
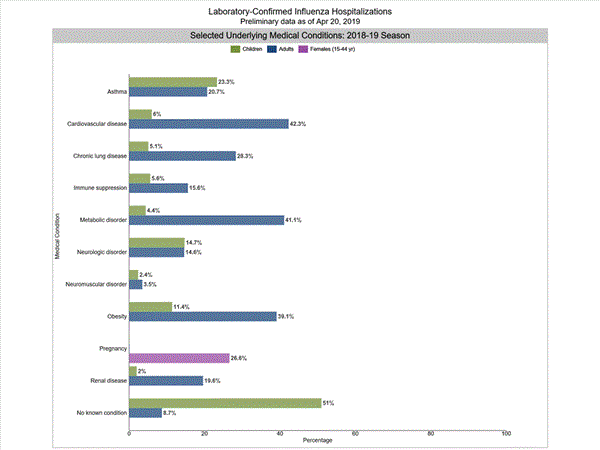
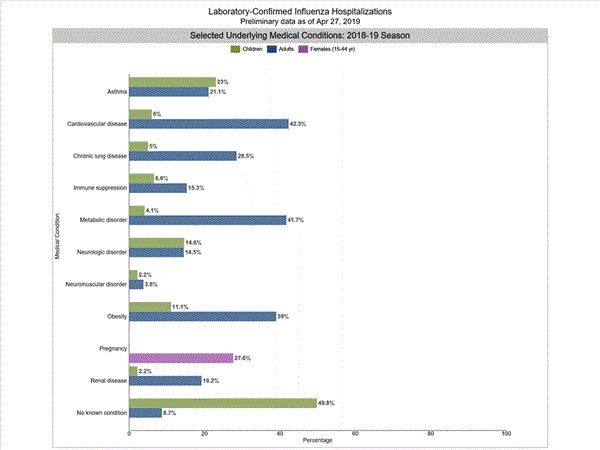
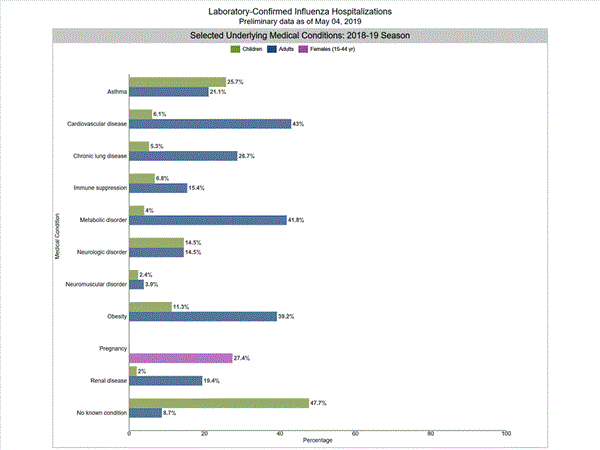
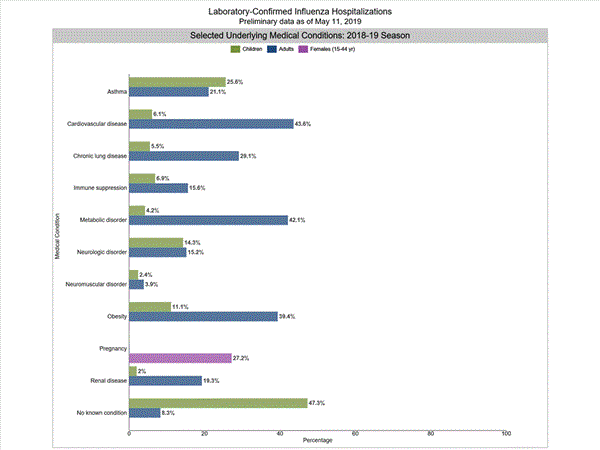
        Among 1,791 hospitalized adults with information on underlying medical conditions, 1,616 (90.2%) had at least one reported underlying medical condition, the most commonly reported were cardiovascular disease, metabolic disorder, and obesity. Among 320 hospitalized children with information on underlying medical conditions, 146 (45.6%) had at least one underlying medical condition; the most commonly reported was asthma. Among 274 hospitalized women of childbearing age (15-44 years) with information on pregnancy status, 64 (23.4%) were pregnant.
        Additional FluSurv-NET data displaying hospitalization rates for the current and past seasons and different age groups, as well as data on patient characteristics (such as influenza virus type, demographic, and clinical information), are available on FluView Interactive at: http://gis.cdc.gov/GRASP/Fluview/FluHospRates.html and http://gis.cdc.gov/grasp/fluview/FluHospChars.html.
        FluSurv-Net data is used to generate national estimates of the total numbers of flu cases, medical visits, hospitalizations, and deaths. This season, CDC is reporting preliminary cumulative in-season estimates, which are available athttps://cdc.gov/flu/about/burden/preliminary-in-season-estimates.htm.
        [SIZE=1.5]Data from the Influenza Hospitalization Surveillance Network (FluSurv-NET), a population-based surveillance for influenza related hospitalizations in children and adults in 13 U.S. states. Cumulative incidence rates are calculated using the National Center for Health Statistics? (NCHS) population estimates for the counties included in the surveillance catchment area.[/SIZE]
        View Interactive Application | View Full Screen | View PowerPoint Presentation
        [SIZE=1.5]FluSurv-NET data are preliminary and displayed as they become available. Therefore, figures are based on varying denominators as some variables represent information that may require more time to be collected. Data are refreshed and updated weekly. Asthma includes a medical diagnosis of asthma or reactive airway disease; Cardiovascular diseases include conditions such as coronary heart disease, cardiac valve disorders, congestive heart failure, and pulmonary hypertension; does not include isolated hypertension; Chronic lung diseases include conditions such as chronic obstructive pulmonary disease, bronchiolitis obliterans, chronic aspiration pneumonia, and interstitial lung disease; Immune suppression includes conditions such as immunoglobulin deficiency, leukemia, lymphoma, HIV/AIDS, and individuals taking immunosuppressive medications; Metabolic disorders include conditions such as diabetes mellitus; Neurologic diseases include conditions such as seizure disorders, cerebral palsy, and cognitive dysfunction; Neuromuscular diseases include conditions such as multiple sclerosis and muscular dystrophy; Obesity was assigned if indicated in patient's medical chart or if body mass index (BMI) >30 kg/m2; Pregnancy percentage calculated using number of female cases aged between 15 and 44 years of age as the denominator; Renal diseases include conditions such as acute or chronic renal failure, nephrotic syndrome, glomerulonephritis, and impaired creatinine clearance; No known condition indicates that the case did not have any known high risk medical condition indicated in medical chart at the time of hospitalization.[/SIZE]
        View Interactive Application | View Full Screen | View PowerPoint Presentation

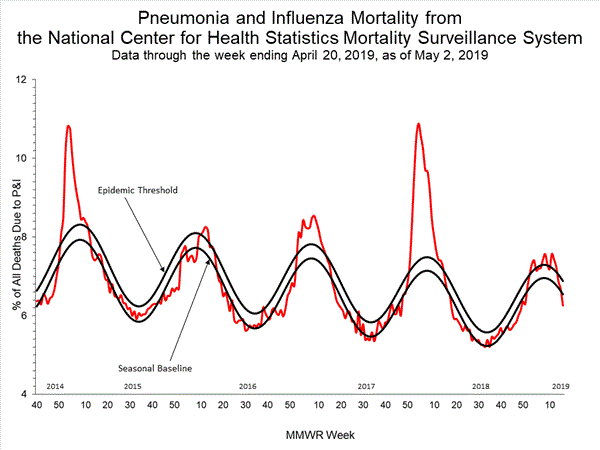
        [h=2]Pneumonia and Influenza (P&I) Mortality Surveillance:[/h] Based on National Center for Health Statistics (NCHS) mortality surveillance data available on March 14, 2019, 7.2% of the deaths occurring during the week ending March 2, 2019 (week 9) were due to P&I. This percentage is below the epidemic threshold of 7.3% for week 9.
        Additional pneumonia and influenza mortality data for current and past seasons and by geography (national, HHS region, or state) are available at on FluView Interactive http://gis.cdc.gov/grasp/fluview/mortality.html. Data displayed on the regional and state-level are aggregated by the state of residence of the decedent.
        NCHS10_small.gif

        View Regional and State Level Data | View Chart Data | View Full Screen | View PowerPoint Presentation

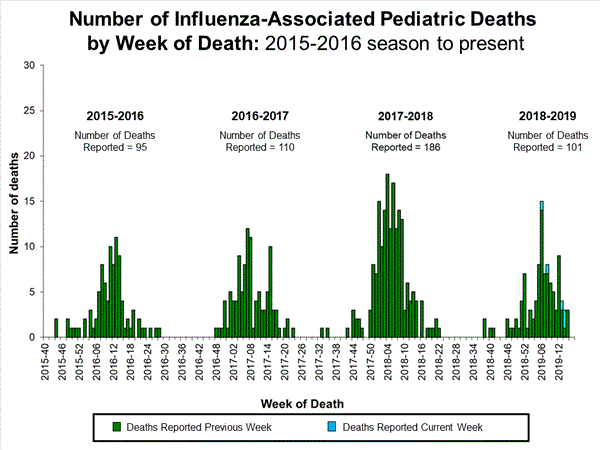
        [h=2]Influenza-Associated Pediatric Mortality:[/h] Four influenza-associated pediatric deaths were reported to CDC during week 10. One death was associated with an influenza A(H1N1)pdm09 virus and occurred during week 6 (the week ending February 9, 2019). Two deaths were associated with an influenza A(H3) virus and occurred during weeks 9 and 10 (the weeks ending March 2 and March 9, 2019, respectively). One death was associated with an influenza A virus for which no subtyping was performed and occurred during week 9 (the week ending March 2, 2019).
        A total of 68 influenza-associated pediatric deaths occurring during the 2018-2019 season have been reported to CDC.
        Additional information on influenza-associated pediatric deaths including basic demographics, underlying conditions, bacterial co-infections, and place of death for the current and past seasons, is available on FluView Interactivehttp://gis.cdc.gov/GRASP/Fluview/PedFluDeath.html.

        View Interactive Application | View Full Screen | View PowerPoint Presentation


        [h=2]Additional National and International Influenza Surveillance Information[/h] FluView Interactive: FluView includes enhanced web-based interactive applications that can provide dynamic visuals of the influenza data collected and analyzed by CDC. These FluView Interactive applications allow people to create customized, visual interpretations of influenza data, as well as make comparisons across flu seasons, regions, age groups and a variety of other demographics. To access these tools, visit http://www.cdc.gov/flu/weekly/fluviewinteractive.htm.
        U.S. State and local influenza surveillance: Click on a jurisdiction below to access the latest local influenza information.

        [TABLE="width: 100%"]
        [TR]
        [TD="width: 139"] Alabama
        [/TD]
        [TD="width: 139"] Alaska
        [/TD]
        [TD="width: 139"] Arizona
        [/TD]
        [TD="width: 139"] Arkansas
        [/TD]
        [TD="width: 139"] California
        [/TD]
        [/TR]
        [TR]
        [TD="width: 139"] Colorado
        [/TD]
        [TD="width: 139"] Connecticut
        [/TD]
        [TD="width: 139"] Delaware
        [/TD]
        [TD="width: 139"] District of Columbia
        [/TD]
        [TD="width: 139"] Florida
        [/TD]
        [/TR]
        [TR]
        [TD="width: 139"] Georgia
        [/TD]
        [TD="width: 139"] Hawaii
        [/TD]
        [TD="width: 139"] Idaho
        [/TD]
        [TD="width: 139"] Illinois
        [/TD]
        [TD="width: 139"] Indiana
        [/TD]
        [/TR]
        [TR]
        [TD="width: 139"] Iowa
        [/TD]
        [TD="width: 139"] Kansas
        [/TD]
        [TD="width: 139"] Kentucky
        [/TD]
        [TD="width: 139"] Louisiana
        [/TD]
        [TD="width: 139"] Maine
        [/TD]
        [/TR]
        [TR]
        [TD="width: 139"] Maryland
        [/TD]
        [TD="width: 139"] Massachusetts
        [/TD]
        [TD="width: 139"] Michigan
        [/TD]
        [TD="width: 139"] Minnesota
        [/TD]
        [TD="width: 139"] Mississippi
        [/TD]
        [/TR]
        [TR]
        [TD="width: 139"] Missouri
        [/TD]
        [TD="width: 139"] Montana
        [/TD]
        [TD="width: 139"] Nebraska
        [/TD]
        [TD="width: 139"] Nevada
        [/TD]
        [TD="width: 139"] New Hampshire
        [/TD]
        [/TR]
        [TR]
        [TD="width: 139"] New Jersey
        [/TD]
        [TD="width: 139"] New Mexico
        [/TD]
        [TD="width: 139"] New York
        [/TD]
        [TD="width: 139"] North Carolina
        [/TD]
        [TD="width: 139"] North Dakota
        [/TD]
        [/TR]
        [TR]
        [TD="width: 139"] Ohio
        [/TD]
        [TD="width: 139"] Oklahoma
        [/TD]
        [TD="width: 139"] Oregon
        [/TD]
        [TD="width: 139"] Pennsylvania
        [/TD]
        [TD="width: 139"] Rhode Island
        [/TD]
        [/TR]
        [TR]
        [TD="width: 139"] South Carolina
        [/TD]
        [TD="width: 139"] South Dakota
        [/TD]
        [TD="width: 139"] Tennessee
        [/TD]
        [TD="width: 139"] Texas
        [/TD]
        [TD="width: 139"] Utah
        [/TD]
        [/TR]
        [TR]
        [TD="width: 139"] Vermont
        [/TD]
        [TD="width: 139"] Virginia
        [/TD]
        [TD="width: 139"] Washington
        [/TD]
        [TD="width: 139"] West Virginia
        [/TD]
        [TD="width: 139"] Wisconsin
        [/TD]
        [/TR]
        [TR]
        [TD="width: 139"] Wyoming
        [/TD]
        [TD="width: 139"] New York City
        [/TD]
        [TD="width: 139"] Puerto Rico
        [/TD]
        [TD="width: 139"] Virgin Islands
        [/TD]
        [TD="width: 139"] [/TD]
        [/TR]
        [/TABLE]
        World Health Organization: Additional influenza surveillance information from participating WHO member nations is available throughFluNet and the Global Epidemiology Reports.
        WHO Collaborating Centers for Influenza located in Australia, China, Japan, the United Kingdom, and the United States (CDC in Atlanta, Georgia).
        Europe: For the most recent influenza surveillance information from Europe, please see WHO/Europe and the European Centre for Disease Prevention and Control at http://www.flunewseurope.org/.
        Public Health Agency of Canada: The most up-to-date influenza information from Canada is available at http://www.phac-aspc.gc.ca/fluwatch/
        Public Health England: The most up-to-date influenza information from the United Kingdom is available athttps://www.gov.uk/government/statistics/weekly-national-flu-reports
        • Any links provided to non-Federal organizations are provided solely as a service to our users. These links do not constitute an endorsement of these organizations or their programs by CDC or the Federal Government, and none should be inferred. CDC is not responsible for the content of the individual organization web pages found at these links.
          An overview of the CDC influenza surveillance system, including methodology and detailed descriptions of each data component, is available at: http://www.cdc.gov/flu/weekly/overview.htm.
          --------------------------------------------------------------------------------
https://www.cdc.gov/flu/weekly/index.htm
 
[h=3]2018-2019 Influenza Season Week 11 ending March 16, 2019[/h] All data are preliminary and may change as more reports are received.
An overview of the CDC influenza surveillance system, including methodology and detailed descriptions of each data component, is available at http://www.cdc.gov/flu/weekly/overview.htm.
[h=3]Synopsis:[/h] Influenza activity remains elevated in the United States. Influenza A(H1N1)pdm09, influenza A(H3N2), and influenza B viruses continue to co-circulate. Below is a summary of the key influenza indicators for the week ending March 16, 2019:
  • Viral Surveillance:The percentage of respiratory specimens testing positive for influenza viruses in clinical laboratories increased slightly. Nationally, during the most recent three weeks, influenza A(H3) viruses were reported more frequently than influenza A(H1N1)pdm09 viruses and in HHS Regions 2, 4, 5, 6, 7, 8, 9 and 10.
    • Virus Characterization:The majority of influenza viruses characterized antigenically are similar to the cell-grown reference viruses representing the 2018?2019 Northern Hemisphere influenza vaccine viruses. However, an increasing proportion of influenza A(H3N2) viruses are antigenically distinguishable from A/Singapore/INFIMH-16-0019/2016 (3C.2a1), a cell-propagated reference virus representing the A(H3N2) component of 2018-19 Northern Hemisphere influenza vaccines.
    • Antiviral Resistance:The vast majority of influenza viruses tested (>99%) show susceptibility to oseltamivir and peramivir. All influenza viruses tested showed susceptibility to zanamivir.
  • Influenza-like Illness Surveillance:The proportion of outpatient visits for influenza-like illness (ILI) remained at 4.4%, which is above the national baseline of 2.2%. All 10 regions reported ILI at or above their region-specific baseline level.
    • ILI State Activity Indictor Map: 26 states experienced high ILI activity; 12 states experienced moderate ILI activity; New York City, Puerto Rico and eight states experienced low ILI activity; four states experienced minimal ILI activity; and the U.S. Virgin Islands and the District of Columbia had insufficient data.
  • Geographic Spread of Influenza: The geographic spread of influenza in 44 states was reported as widespread; Puerto Rico and four states reported regional activity; the District of Columbia and two states reported local activity; the U.S. Virgin Islands reported sporadic activity; and Guam did not report.
  • Influenza-associated Hospitalizations A cumulative rate of 47.1 laboratory-confirmed influenza-associated hospitalizations per 100,000 population was reported. The highest hospitalization rate is among adults 65 years and older (146.0 hospitalizations per 100,000 population).
  • Pneumonia and Influenza Mortality: The proportion of deaths attributed to pneumonia and influenza (P&I) was below the system-specific epidemic threshold in the National Center for Health Statistics (NCHS) Mortality Surveillance System.
  • Influenza-associated Pediatric Deaths: Eight influenza-associated pediatric deaths were reported to CDC during week 11.
[h=3]National and Regional Summary of Select Surveillance Components[/h]
[TABLE="class: table table-bordered opt-in, width: 100%"]
[TR]
[/TR]
[TR]
HHS Surveillance Regions* Data for current week National data is for the current week
Regional data is for the most recent three weeks
[/TR]
[TR]
Out-patient ILI? Number of jurisdictions reporting regional or widespread activity? % respiratory specimens positive for flu in clinical laboratories Predominant flu virus reported by public health laboratories [/TR]
[TR]
[/TR]
[TR]
Nation [TD]Elevated[/TD]
[TD]49 of 54[/TD]
[TD]26.0%[/TD]
[TD]Influenza A(H3)[/TD]
[/TR]
[TR]
Region 1 [TD]Elevated[/TD]
[TD]5 of 6[/TD]
[TD]19.6%[/TD]
[TD]Approximately equal Influenza A(H1N1)pdm09 and Influenza A(H3)[/TD]
[/TR]
[TR]
Region 2 [TD]Elevated[/TD]
[TD]3 of 4[/TD]
[TD]22.5%[/TD]
[TD]Influenza A(H3)[/TD]
[/TR]
[TR]
Region 3 [TD]Elevated[/TD]
[TD]5 of 6[/TD]
[TD]25.0%[/TD]
[TD]Influenza A(H1N1)pdm09[/TD]
[/TR]
[TR]
Region 4 [TD]Elevated[/TD]
[TD]8 of 8[/TD]
[TD]13.9%[/TD]
[TD]Influenza A(H3)[/TD]
[/TR]
[TR]
Region 5 [TD]Elevated[/TD]
[TD]6 of 6[/TD]
[TD]29.5%[/TD]
[TD]Influenza A(H3)[/TD]
[/TR]
[TR]
Region 6 [TD]Elevated[/TD]
[TD]5 of 5[/TD]
[TD]27.9%[/TD]
[TD]Influenza A(H3)[/TD]
[/TR]
[TR]
Region 7 [TD]Elevated[/TD]
[TD]4 of 4[/TD]
[TD]30.3%[/TD]
[TD]Influenza A(H3)[/TD]
[/TR]
[TR]
Region 8 [TD]Elevated[/TD]
[TD]6 of 6[/TD]
[TD]31.7%[/TD]
[TD]Influenza A(H3)[/TD]
[/TR]
[TR]
Region 9 [TD]Elevated[/TD]
[TD]3 of 5[/TD]
[TD]12.2%[/TD]
[TD]Influenza A(H3)[/TD]
[/TR]
[TR]
Region 10 [TD]Elevated[/TD]
[TD]4 of 4[/TD]
[TD]35.9%[/TD]
[TD]Influenza A(H3)[/TD]
[/TR]
[/TABLE]
*https://www.hhs.gov/about/agencies/iea/regional-offices/index.html
? Elevated means the % of visits for ILI is at or above the national or region-specific baseline
? Includes all 50 states, the District of Columbia, Guam, Puerto Rico, and U.S. Virgin Islands

[h=2]U.S. Virologic Surveillance:[/h] WHO and NREVSS collaborating laboratories, which include both public health and clinical laboratories located in all 50 states, Puerto Rico, Guam, and the District of Columbia, report to CDC the total number of respiratory specimens tested for influenza and the number positive for influenza by virus type. In addition, public health laboratories also report the influenza A subtype (H1 or H3) and influenza B lineage information of the viruses they test and the age or age group of the persons from whom the specimens were collected.
Additional virologic data, including national, regional and select state-level data, can be found at: http://gis.cdc.gov/grasp/fluview/fluportaldashboard.html. Age group proportions and totals by influenza subtype reported by public health laboratories can be found at: http://gis.cdc.gov/grasp/fluview/flu_by_age_virus.html.
The results of tests performed by clinical laboratories are summarized below.
[TABLE="class: table table-bordered table-condensed opt-in, width: 100%"]
[TR]
[TD="width: 200"] [/TD]
Week 11 Data Cumulative since
September 30, 2018 (Week 40) [/TR]
[TR]
No. of specimens tested [TD]34,780[/TD]
[TD]852,185[/TD]
[/TR]
[TR]
No. of positive specimens (%) [TD]9,046 (26.0%)[/TD]
[TD]134,867 (15.8%)[/TD]
[/TR]
[TR]
Positive specimens by type [TD] [/TD]
[TD] [/TD]
[/TR]
[TR]
Influenza A [TD]8,724 (96.4%)[/TD]
[TD]129,819 (96.3%)[/TD]
[/TR]
[TR]
Influenza B [TD]322 (3.6%)[/TD]
[TD]5,048 (3.7%)[/TD]
[/TR]
[/TABLE]

View National and Regional Level Graphs and Data | View Chart Data | View Full Screen | View PowerPoint Presentation
The results of tests performed by public health laboratories are summarized below.
[TABLE="class: table table-bordered table-condensed opt-in, width: 100%"]
[TR]
[TD] [/TD]
Week 11 Data Cumulative since
September 30, 2018 (Week 40) [/TR]
[TR]
No. of specimens tested [TD]1,823[/TD]
[TD]59,134[/TD]
[/TR]
[TR]
No. of positive specimens* [TD]1,145[/TD]
[TD]30,821[/TD]
[/TR]
[TR]
Positive specimens by type/subtype [TD] [/TD]
[TD] [/TD]
[/TR]
[TR]
[/TR]
[TR]
Influenza A [TD]1,105 (96.5%)[/TD]
[TD]30,015 (97.4%)[/TD]
[/TR]
[TR]
(H1N1)pdm09 [TD]366 (34.6%)[/TD]
[TD]18,412 (64.2%)[/TD]
[/TR]
[TR]
H3N2 [TD]691 (65.4%)[/TD]
[TD]10,270 (35.8%)[/TD]
[/TR]
[TR]
Subtyping not performed [TD]48[/TD]
[TD]1,333[/TD]
[/TR]
[TR]
[/TR]
[TR]
Influenza B [TD]40 (3.5%)[/TD]
[TD]806 (2.6%)[/TD]
[/TR]
[TR]
Yamagata lineage [TD]6 (20.0%)[/TD]
[TD]246 (46.9%)[/TD]
[/TR]
[TR]
Victoria lineage [TD]24 (80.0%)[/TD]
[TD]278 (53.1%)[/TD]
[/TR]
[TR]
Lineage not performed [TD]10[/TD]
[TD]282[/TD]
[/TR]
[/TABLE]
*The percent of specimens testing positive for influenza is not reported because public health laboratories often receive samples that have already tested positive for influenza at a clinical laboratory and therefore percent positive would not be a valid indicator of influenza activity. Additional information is available at http://www.cdc.gov/flu/weekly/overview.htm.


View National and Regional Level Graphs and Data | View Chart Data | View Full Screen | View PowerPoint Presentation
[h=2]Influenza Virus Characterization:[/h] Close monitoring of influenza viruses is required to better assess the potential impact on public health. CDC characterizes influenza viruses through one or more tests including genomic sequencing, hemagglutination inhibition (HI) and/or neutralization based Focus Reduction assays (FRA). These data are used to compare how similar currently circulating influenza viruses are to the reference viruses used for developing new influenza vaccines and to monitor evolutionary changes that continually occur in influenza viruses circulating in humans. Antigenic and genetic characterization of circulating influenza viruses gives an indication of the influenza vaccine's ability to induce an immune response against the wide array of influenza viruses that are co-circulating every season. However, annual vaccine effectiveness estimates are needed to determine how much protection was provided to the population by vaccination. On February 14, 2019, interim influenza effectiveness estimates for the 2018-2019 season were released and are available here.
For nearly all influenza-positive surveillance samples received at CDC, next-generation sequencing is performed to determine the genetic identity of circulating influenza viruses and to monitor the evolutionary trajectory of viruses circulating in our population. Virus gene segments are classified into genetic clades/subclades based on phylogenetic analysis. However, genetic changes that classify the clades/subclades do not always result in antigenic changes. ?Antigenic drift? is a term used to describe gradual antigenic change that occurs as viruses evolve changes to escape host immune pressure. Antigenic drift is evaluated by comparing antigenic properties of cell-propagated reference viruses representing currently recommended vaccine components with those of cell-propagated circulating viruses.
CDC has antigenically or genetically characterized 1,656 influenza viruses collected September 30, 2018 ? March 16, 2019, and submitted by U.S. laboratories, including 865 influenza A(H1N1)pdm09 viruses, 592 influenza A(H3N2) viruses, and 199 influenza B viruses.
Influenza A Viruses
Influenza B Viruses

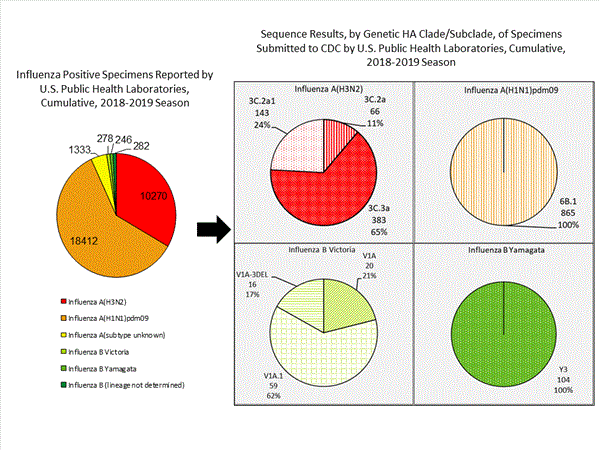
The majority of U.S. viruses submitted for characterization come from state and local public health laboratories. Due to Right Size Roadmapconsiderations, specimen submission guidance to laboratories is that, if available, 2 influenza A(H1N1)pdm09, 2 influenza A(H3N2), and 2 influenza B viruses be submitted every other week. Therefore, the numbers of each virus type/subtype characterized should be more balanced across subtypes/lineages but will not reflect the actual proportion of circulating viruses. In the figure below, the results of tests performed by public health labs are shown on the left and CDC sequence results (by genetic clade/subclade) are shown on the right.
Genetic11_small.gif

View Chart Data | View Full Screen | View PowerPoint Presentation
    • A (H1N1)pdm09: Phylogenetic analysis of the HA genes from 865 A(H1N1)pdm09 viruses showed that all belonged to clade 6B.1. Two hundred ninety one A(H1N1)pdm09 viruses were antigenically characterized, and 282 (96.9%) were antigenically similar (analyzed using HI with ferret antisera) to A/Michigan/45/2015 (6B.1), a cell-propagated A/Michigan/45/2015-like reference virus representing the A(H1N1)pdm09 component for the 2018-19 Northern Hemisphere influenza vaccines.
    • A (H3N2): Phylogenetic analysis of the HA genes from 592 A(H3N2) viruses revealed extensive genetic diversity with multiple clades/subclades co-circulating. The HA genes of circulating viruses belonged to clade 3C.2a (n=66), subclade 3C.2a1 (n=143) or clade 3C.3a (n=383). Two hundred fifty six A(H3N2) viruses were antigenically characterized by FRA with ferret antisera, and 155 (60.5%) A(H3N2) viruses tested were well-inhibited (reacting at titers that were within 4-fold of the homologous virus titer) by ferret antisera raised against A/Singapore/INFIMH-16-0019/2016 (3C.2a1), a cell-propagated reference virus representing the A(H3N2) component of 2018-19 Northern Hemisphere influenza vaccines. One hundred and one (39.5%) viruses reacted poorly (at titers that were 8-fold or greater reduced compared with that of the homologous virus A/Singapore/INFIMH-16-0019/2016) and of those, 100 (99%) belonged to clade 3C.3a.
    • B/Victoria: Phylogenetic analysis of 95 B/Victoria-lineage viruses indicate that all HA genes belonged to genetic clade V1A, however genetic subclades which are antigenically distinct have emerged. Genetic subclades which are antigenically distinct include viruses with a two amino acid deletion (162-163) in the HA protein (V1A.1, previously abbreviated as V1A-2Del) and viruses with a three amino acid deletion (162-164) in the HA protein (abbreviated as V1A-3Del). Fifty-four B/Victoria lineage viruses were antigenically characterized and 44 (81.5%) were antigenically similar with ferret antisera raised against cell-propagated B/Colorado/06/2017-like V1A.1 reference virus. Ten (18.5%) reacted poorly (at titers that were 8-fold or greater reduced compared with the homologous virus titer) and belonged to clade V1A or genetic subclade V1A-3Del.
    • B/Yamagata: Phylogenetic analysis of 104 influenza B/Yamagata-lineage viruses indicate that the HA genes belonged to clade Y3. A total of 89 influenza B/Yamagata-lineage viruses were antigenically characterized, and all were antigenically similar to cell-propagated B/Phuket/3073/2013 (Y3), the reference vaccine virus representing the influenza B/Yamagata-lineage component of the 2018-19 Northern Hemisphere quadrivalent vaccines.
    [h=2]Antiviral Resistance:[/h] Testing of influenza A(H1N1)pdm09, influenza A(H3N2), and influenza B viruses for resistance to the neuraminidase inhibitors (oseltamivir, zanamivir, and peramivir) is performed at CDC using next-generation sequencing analysis and/or a functional assay. Neuraminidase sequences of viruses are inspected to detect the presence of amino acid substitutions,previously associated with reduced or highly reduced inhibition by any of three neuraminidase inhibitors.In addition, a subset of viruses are tested using the neuraminidase inhibition assay with three neuraminidase inhibitors. The level of neuraminidase activity inhibition is reported using the thresholds recommended by the World Health Organization Expert Working Group of the Global Influenza Surveillance and Response System (GISRS)These samples are routinely obtained for surveillance purposes rather than for diagnostic testing of patients suspected to be infected with an antiviral-resistant virus.
    Reporting of baloxavir susceptibility testing for the 2018-2019 influenza season will begin later this season. More information regarding influenza antiviral drug resistance can be found here.
    High levels of resistance to the adamantanes (amantadine and rimantadine) persist among influenza A(H1N1)pdm09 and influenza A(H3N2) viruses (the adamantanes are not effective against influenza B viruses). Therefore, data from adamantane resistance testing are not presented below.
    [h=3]Assessment of Virus Susceptibility to Neuraminidase Inhibitors Using Next-Generation Sequencing Analysis and/or Neuraminidase Inhibition Assay[/h]
    [TABLE="class: table table-bordered opt-in, width: 100%"]
    [TR]
    Type/Subtype or Lineage Inhibition of Neuraminidase Activity by Antiviral Drug [/TR]
    [TR]
    [TD="colspan: 3"]Oseltamivir[/TD]
    [TD="colspan: 3"]Peramivir[/TD]
    [TD="colspan: 3"]Zanamivir[/TD]
    [/TR]
    [TR]
    Virus Tested (n) Reduced, Number (%) Highly Reduced, Number (%) Virus Tested (n) Reduced, Number (%) Highly Reduced, Number (%) Virus Tested (n) Reduced, Number (%) Highly Reduced, Number (%) [/TR]
    [TR]
    Total Viruses [TD]1,634[/TD]
    [TD]2 (0.1%)[/TD]
    [TD]2 (0.1%)[/TD]
    [TD]1,634[/TD]
    [TD]0 (0%)[/TD]
    [TD]2 (0.1%)[/TD]
    [TD]1,634[/TD]
    [TD]0 (0%)[/TD]
    [TD]0 (0%)[/TD]
    [/TR]
    [TR]
    A(H1N1)pdm09 [TD]857[/TD]
    [TD]2 (0.2%)[/TD]
    [TD]2 (0.2%)[/TD]
    [TD]857[/TD]
    [TD]0 (0%)[/TD]
    [TD]2 (0.2%)[/TD]
    [TD]857[/TD]
    [TD]0 (0%)[/TD]
    [TD]0 (0%)[/TD]
    [/TR]
    [TR]
    A(H3N2) [TD]585[/TD]
    [TD]0 (0%)[/TD]
    [TD]0 (0%)[/TD]
    [TD]585[/TD]
    [TD]0 (0%)[/TD]
    [TD]0 (0%)[/TD]
    [TD]585[/TD]
    [TD]0 (0%)[/TD]
    [TD]0 (0%)[/TD]
    [/TR]
    [TR]
    B/Victoria [TD]90[/TD]
    [TD]0 (0%)[/TD]
    [TD]0 (0%)[/TD]
    [TD]90[/TD]
    [TD]0 (0%)[/TD]
    [TD]0 (0%)[/TD]
    [TD]90[/TD]
    [TD]0 (0%)[/TD]
    [TD]0 (0%)[/TD]
    [/TR]
    [TR]
    B/Yamagata [TD]102[/TD]
    [TD]0 (0%)[/TD]
    [TD]0 (0%)[/TD]
    [TD]102[/TD]
    [TD]0 (0%)[/TD]
    [TD]0 (0%)[/TD]
    [TD]102[/TD]
    [TD]0 (0%)[/TD]
    [TD]0 (0%)[/TD]
    [/TR]
    [/TABLE]
    Antiviral treatment as early as possible is recommended for patients with confirmed or suspected influenza who have severe, complicated, or progressive illness; who require hospitalization; or who are at high risk for serious influenza-related complications. Additional information on recommendations for treatment and chemoprophylaxis of influenza virus infection with antiviral agents is available at:http://www.cdc.gov/flu/antivirals/index.htm.


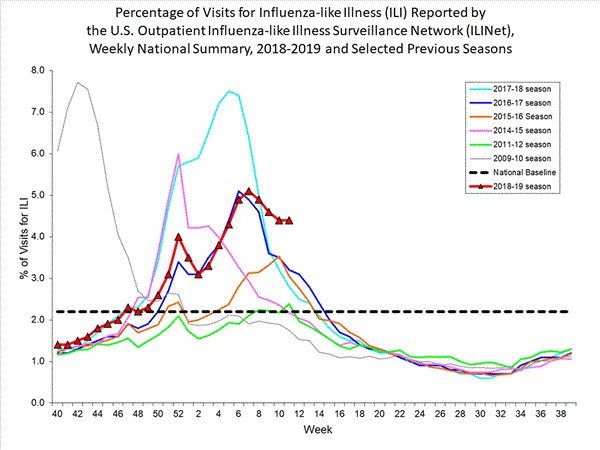
    [h=2]Outpatient Illness Surveillance:[/h] Nationwide during week 11, 4.4% of patient visits reported through the U.S. Outpatient Influenza-like Illness Surveillance Network (ILINet) were due to influenza-like illness (ILI). This percentage is above the national baseline of 2.2%.(ILI is defined as fever (temperature of 100?F [37.8?C] or greater) and cough and/or sore throat.)
    On a regional level, the percentage of outpatient visits for ILI ranged from 3.1% to 7.7% during week 11. All 10 regions reported a percentage of outpatient visits for ILI at or above their region-specific baseline.
    Additional data on medically attended visits for ILI for current and past seasons and by geography (national, HHS region, or select states) are available on FluView Interactive http://gis.cdc.gov/grasp/fluview/fluportaldashboard.html.

    View National and Regional Level Graphs and Data | View Chart Data | View Full Screen | View PowerPoint Presentation


    [h=2]ILINet State Activity Indicator Map:[/h] Data collected in ILINet are used to produce a measure of ILI activity* by state. Activity levels are based on the percent of outpatient visits in a state due to ILI and are compared to the average percent of ILI visits that occur during weeks with little or no influenza virus circulation. Activity levels range from minimal, which would correspond to ILI activity from outpatient clinics being below, or only slightly above, the average, to high, which would correspond to ILI activity from outpatient clinics being much higher than average.
    The ILI Activity Indicator Map displays state-specific activity levels for multiple seasons and allows a visual representation of relative activity from state to state. More information is available on FluView Interactive at https://gis.cdc.gov/grasp/fluview/main.html.
    During week 11, the following ILI activity levels were experienced:


    *This map uses the proportion of outpatient visits to health care providers for ILI to measure the ILI activity level within a state. It does not, however, measure the extent of geographic spread of flu within a state. Therefore, outbreaks occurring in a single city could cause the state to display high activity levels.
    Data collected in ILINet may disproportionally represent certain populations within a state, and therefore, may not accurately depict the full picture of influenza activity for the whole state.
    Data displayed in this map are based on data collected in ILINet, whereas the State and Territorial flu activity map is based on reports from state and territorial epidemiologists. The data presented in this map are preliminary and may change as more data are received.
    Differences in the data presented here by CDC and independently by some state health departments likely represent differing levels of data completeness with data presented by the state likely being the more complete.


    [h=2]Geographic Spread of Influenza as Assessed by State and Territorial Epidemiologists[/h] The influenza activity reported by state and territorial epidemiologists indicates geographic spread of influenza viruses, but does not measure the severity of influenza activity. Additional data displaying the influenza activity reported by state and territorial epidemiologists for the current and past seasons are available on FluView Interactive at https://gis.cdc.gov/grasp/fluview/FluView8.html
    During week 11, the following influenza activity was reported:
      • 26 states (Alabama, Alaska, Arkansas, Colorado, Georgia, Illinois, Indiana, Iowa, Kansas, Kentucky, Louisiana, Mississippi, Missouri, New Jersey, New Mexico, North Carolina, Oklahoma, Oregon, Pennsylvania, Rhode Island, South Carolina, Texas, Utah, Virginia, Washington and Wisconsin) experienced high ILI activity.
      • 12 states (California, Hawaii, Maine, Maryland, Michigan, Minnesota, Montana, Nevada, New York, Ohio, West Virginia and Wyoming) experienced moderate ILI activity.
      • New York City, Puerto Rico, and eight states (Arizona, Connecticut, Idaho, Massachusetts, Nebraska, North Dakota, South Dakota and Vermont) experienced low ILI activity.
      • Four states (Delaware, Florida, New Hampshire and Tennessee) experienced minimal ILI activity.
      • Data were insufficient to calculate an ILI activity level from the District of Columbia and the U.S. Virgin Islands.
      • Widespread influenza activity was reported by 44 states (Alabama, Alaska, Arizona, Arkansas, California, Colorado, Connecticut, Delaware, Florida, Georgia, Idaho, Illinois, Indiana, Iowa, Kansas, Kentucky, Louisiana, Maine, Maryland, Massachusetts, Michigan, Minnesota, Mississippi, Missouri, Montana, Nevada, New Hampshire, New Jersey, New Mexico, New York, North Carolina, North Dakota, Ohio, Oklahoma, Oregon, Pennsylvania, Rhode Island, South Carolina, South Dakota, Utah, Virginia, Washington, Wisconsin and Wyoming).
      • Regional influenza activity was reported by Puerto Rico and four states (Nebraska, Tennessee, Texas and West Virginia).
      • Local influenza activity was reported by the District of Columbia and two states (Hawaii and Vermont).
      • Sporadic influenza activity was reported by the U.S. Virgin Islands.
      • Guam did not report.
        [h=2]Influenza-Associated Hospitalizations:[/h] The Influenza Hospitalization Surveillance Network (FluSurv-NET) conducts population-based surveillance for laboratory-confirmed influenza-related hospitalizations in select counties in the Emerging Infections Program (EIP) states and Influenza Hospitalization Surveillance Project (IHSP) states.
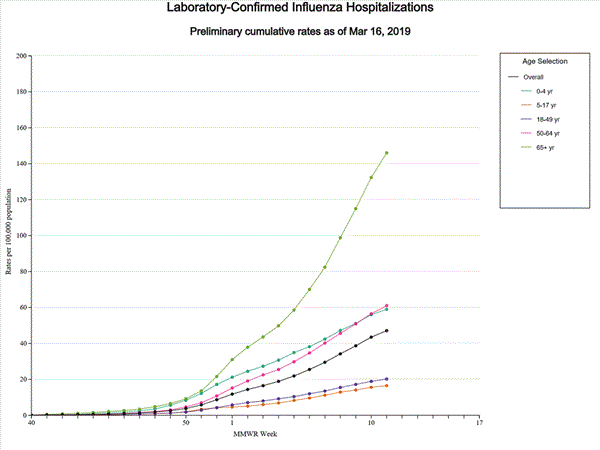
        A total of 13,604 laboratory-confirmed influenza-associated hospitalizations were reported by FluSurv-NET sites between October 1, 2018 and March 16, 2019. The overall hospitalization rate was 47.1 per 100,000 population. The highest rate of hospitalization was among adults aged ≥65 (146.0 per 100,000 population), followed by adults aged 50-64 (61.0 per 100,000 population) and children aged 0-4 (59.0 per 100,000 population). Among 13,604 hospitalizations, 13,040 (95.9%) were associated with influenza A virus, 457 (3.4%) with influenza B virus, 36 (0.3%) with influenza A virus and influenza B virus co-infection, and 71 (0.5%) with influenza virus for which the type was not determined. Among those with influenza A subtype information, 1,896 (59.0%) were A(H1N1)pdm09 virus and 1,313 (40.9%) were A(H3N2).
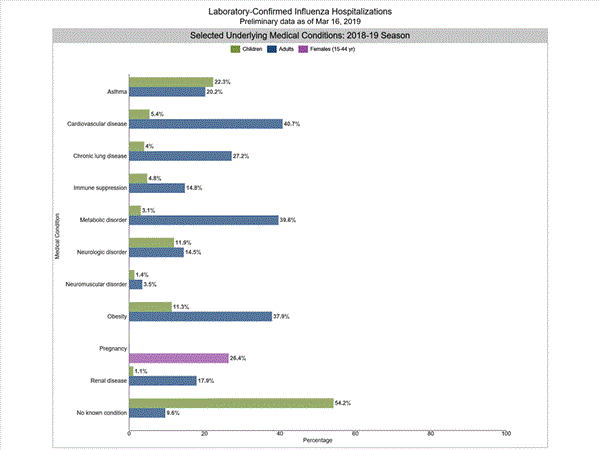
        Among 1,986 hospitalized adults with information on underlying medical conditions, 1,796 (90.4%) had at least one reported underlying medical condition, the most commonly reported were cardiovascular disease, metabolic disorder, and obesity. Among 345 hospitalized children with information on underlying medical conditions, 158 (45.8%) had at least one underlying medical condition; the most commonly reported was asthma. Among 303 hospitalized women of childbearing age (15-44 years) with information on pregnancy status, 80 (26.4%) were pregnant.
        Additional FluSurv-NET data displaying hospitalization rates for the current and past seasons and different age groups, as well as data on patient characteristics (such as influenza virus type, demographic, and clinical information), are available on FluView Interactive at: http://gis.cdc.gov/GRASP/Fluview/FluHospRates.html and http://gis.cdc.gov/grasp/fluview/FluHospChars.html.
        FluSurv-Net data is used to generate national estimates of the total numbers of flu cases, medical visits, hospitalizations, and deaths. This season, CDC is reporting preliminary cumulative in-season estimates, which are available athttps://cdc.gov/flu/about/burden/preliminary-in-season-estimates.htm.
        [SIZE=1.5]Data from the Influenza Hospitalization Surveillance Network (FluSurv-NET), a population-based surveillance for influenza related hospitalizations in children and adults in 13 U.S. states. Cumulative incidence rates are calculated using the National Center for Health Statistics? (NCHS) population estimates for the counties included in the surveillance catchment area.[/SIZE]
        View Interactive Application | View Full Screen | View PowerPoint Presentation
        [SIZE=1.5]FluSurv-NET data are preliminary and displayed as they become available. Therefore, figures are based on varying denominators as some variables represent information that may require more time to be collected. Data are refreshed and updated weekly. Asthma includes a medical diagnosis of asthma or reactive airway disease; Cardiovascular diseases include conditions such as coronary heart disease, cardiac valve disorders, congestive heart failure, and pulmonary hypertension; does not include isolated hypertension; Chronic lung diseases include conditions such as chronic obstructive pulmonary disease, bronchiolitis obliterans, chronic aspiration pneumonia, and interstitial lung disease; Immune suppression includes conditions such as immunoglobulin deficiency, leukemia, lymphoma, HIV/AIDS, and individuals taking immunosuppressive medications; Metabolic disorders include conditions such as diabetes mellitus; Neurologic diseases include conditions such as seizure disorders, cerebral palsy, and cognitive dysfunction; Neuromuscular diseases include conditions such as multiple sclerosis and muscular dystrophy; Obesity was assigned if indicated in patient's medical chart or if body mass index (BMI) >30 kg/m2; Pregnancy percentage calculated using number of female cases aged between 15 and 44 years of age as the denominator; Renal diseases include conditions such as acute or chronic renal failure, nephrotic syndrome, glomerulonephritis, and impaired creatinine clearance; No known condition indicates that the case did not have any known high risk medical condition indicated in medical chart at the time of hospitalization.[/SIZE]
        View Interactive Application | View Full Screen | View PowerPoint Presentation

        [h=2]Pneumonia and Influenza (P&I) Mortality Surveillance:[/h] Based on National Center for Health Statistics (NCHS) mortality surveillance data available on March 21, 2019, 7.1% of the deaths occurring during the week ending March 9, 2019 (week 10) were due to P&I. This percentage is below the epidemic threshold of 7.3% for week 10.
        Additional pneumonia and influenza mortality data for current and past seasons and by geography (national, HHS region, or state) are available at on FluView Interactive http://gis.cdc.gov/grasp/fluview/mortality.html. Data displayed on the regional and state-level are aggregated by the state of residence of the decedent.
        NCHS11_small.gif

        View Regional and State Level Data | View Chart Data | View Full Screen | View PowerPoint Presentation

        [h=2]Influenza-Associated Pediatric Mortality:[/h] Eight influenza-associated pediatric deaths were reported to CDC during week 11. Two deaths were associated with an influenza A(H1N1)pdm09 virus and occurred during week 10 (the week ending March 9, 2019). Two deaths were associated with an influenza A(H3) virus and occurred during weeks 4 and 8 (the weeks ending January 26 and February 23, 2019, respectively). Three deaths were associated with an influenza A virus for which no subtyping was performed and occurred during weeks 10 and 11 (the weeks ending March 9 and March 16, 2019, respectively). One death was associated with an influenza B virus and occurred during week 9 (the week ending March 2, 2019).
        A total of 76 influenza-associated pediatric deaths occurring during the 2018-2019 season have been reported to CDC.
        Additional information on influenza-associated pediatric deaths including basic demographics, underlying conditions, bacterial co-infections, and place of death for the current and past seasons, is available on FluView Interactivehttp://gis.cdc.gov/GRASP/Fluview/PedFluDeath.html.

        View Interactive Application | View Full Screen | View PowerPoint Presentation


        [h=2]Additional National and International Influenza Surveillance Information[/h] FluView Interactive: FluView includes enhanced web-based interactive applications that can provide dynamic visuals of the influenza data collected and analyzed by CDC. These FluView Interactive applications allow people to create customized, visual interpretations of influenza data, as well as make comparisons across flu seasons, regions, age groups and a variety of other demographics. To access these tools, visit http://www.cdc.gov/flu/weekly/fluviewinteractive.htm.
        U.S. State and local influenza surveillance: Click on a jurisdiction below to access the latest local influenza information.

        [TABLE="width: 100%"]
        [TR]
        [TD="width: 139"] Alabama
        [/TD]
        [TD="width: 139"] Alaska
        [/TD]
        [TD="width: 139"] Arizona
        [/TD]
        [TD="width: 139"] Arkansas
        [/TD]
        [TD="width: 139"] California
        [/TD]
        [/TR]
        [TR]
        [TD="width: 139"] Colorado
        [/TD]
        [TD="width: 139"] Connecticut
        [/TD]
        [TD="width: 139"] Delaware
        [/TD]
        [TD="width: 139"] District of Columbia
        [/TD]
        [TD="width: 139"] Florida
        [/TD]
        [/TR]
        [TR]
        [TD="width: 139"] Georgia
        [/TD]
        [TD="width: 139"] Hawaii
        [/TD]
        [TD="width: 139"] Idaho
        [/TD]
        [TD="width: 139"] Illinois
        [/TD]
        [TD="width: 139"] Indiana
        [/TD]
        [/TR]
        [TR]
        [TD="width: 139"] Iowa
        [/TD]
        [TD="width: 139"] Kansas
        [/TD]
        [TD="width: 139"] Kentucky
        [/TD]
        [TD="width: 139"] Louisiana
        [/TD]
        [TD="width: 139"] Maine
        [/TD]
        [/TR]
        [TR]
        [TD="width: 139"] Maryland
        [/TD]
        [TD="width: 139"] Massachusetts
        [/TD]
        [TD="width: 139"] Michigan
        [/TD]
        [TD="width: 139"] Minnesota
        [/TD]
        [TD="width: 139"] Mississippi
        [/TD]
        [/TR]
        [TR]
        [TD="width: 139"] Missouri
        [/TD]
        [TD="width: 139"] Montana
        [/TD]
        [TD="width: 139"] Nebraska
        [/TD]
        [TD="width: 139"] Nevada
        [/TD]
        [TD="width: 139"] New Hampshire
        [/TD]
        [/TR]
        [TR]
        [TD="width: 139"] New Jersey
        [/TD]
        [TD="width: 139"] New Mexico
        [/TD]
        [TD="width: 139"] New York
        [/TD]
        [TD="width: 139"] North Carolina
        [/TD]
        [TD="width: 139"] North Dakota
        [/TD]
        [/TR]
        [TR]
        [TD="width: 139"] Ohio
        [/TD]
        [TD="width: 139"] Oklahoma
        [/TD]
        [TD="width: 139"] Oregon
        [/TD]
        [TD="width: 139"] Pennsylvania
        [/TD]
        [TD="width: 139"] Rhode Island
        [/TD]
        [/TR]
        [TR]
        [TD="width: 139"] South Carolina
        [/TD]
        [TD="width: 139"] South Dakota
        [/TD]
        [TD="width: 139"] Tennessee
        [/TD]
        [TD="width: 139"] Texas
        [/TD]
        [TD="width: 139"] Utah
        [/TD]
        [/TR]
        [TR]
        [TD="width: 139"] Vermont
        [/TD]
        [TD="width: 139"] Virginia
        [/TD]
        [TD="width: 139"] Washington
        [/TD]
        [TD="width: 139"] West Virginia
        [/TD]
        [TD="width: 139"] Wisconsin
        [/TD]
        [/TR]
        [TR]
        [TD="width: 139"] Wyoming
        [/TD]
        [TD="width: 139"] New York City
        [/TD]
        [TD="width: 139"] Puerto Rico
        [/TD]
        [TD="width: 139"] Virgin Islands
        [/TD]
        [TD="width: 139"] [/TD]
        [/TR]
        [/TABLE]
        World Health Organization: Additional influenza surveillance information from participating WHO member nations is available throughFluNet and the Global Epidemiology Reports.
        WHO Collaborating Centers for Influenza located in Australia, China, Japan, the United Kingdom, and the United States (CDC in Atlanta, Georgia).
        Europe: For the most recent influenza surveillance information from Europe, please see WHO/Europe and the European Centre for Disease Prevention and Control at http://www.flunewseurope.org/.
        Public Health Agency of Canada: The most up-to-date influenza information from Canada is available at http://www.phac-aspc.gc.ca/fluwatch/
        Public Health England: The most up-to-date influenza information from the United Kingdom is available athttps://www.gov.uk/government/statistics/weekly-national-flu-reports
        • Any links provided to non-Federal organizations are provided solely as a service to our users. These links do not constitute an endorsement of these organizations or their programs by CDC or the Federal Government, and none should be inferred. CDC is not responsible for the content of the individual organization web pages found at these links.
          An overview of the CDC influenza surveillance system, including methodology and detailed descriptions of each data component, is available at: http://www.cdc.gov/flu/weekly/overview.htm.
          --------------------------------------------------------------------------------
https://www.cdc.gov/flu/weekly/index.htm
 
Influenza Season Continues with an Increase in Influenza A(H3N2) Activity
[FONT=&quot][/FONT]


[FONT=&quot]
HAN_badge_HEALTH_ADVISORY_320x125.png


Distributed via the CDC Health Alert Network
March 28, 2019 1415 ET (2:15 PM ET)
CDCHAN-00419
[/FONT]

[FONT=&quot]CDC reminds clinicians to have a high suspicion for influenza and recommends rapid antiviral treatment of high-risk patients with suspected influenza.[/FONT]
[FONT=&quot] Summary

The Centers for Disease Control and Prevention (CDC) is issuing this health advisory to notify clinicians that influenza activity remains high in the United States, with an increasing proportion of activity due to influenza A(H3N2) viruses, continued circulation of influenza A(H1N1) viruses, and low levels of influenza B viruses. Influenza should be considered as a possible diagnosis for patients with respiratory illness while local influenza activity remains elevated. Because influenza A(H3N2) viruses may be associated with severe disease in older adults, this health advisory serves as a reminder that early empiric treatment with influenza antiviral medications is recommended for hospitalized and high-risk patients, especially those 65 years and older. Antiviral treatment should be started as soon as possible after illness onset and should not wait for laboratory confirmation.

Background

In the United States, influenza activity remains elevated and widespread, and the season is likely to last several more weeks (see CDC FluView report for details: https://www.cdc.gov/flu/weekly/index.htm). Earlier in the season, influenza A(H1N1) viruses were predominant in most of the country. Although A(H1N1) viruses continue to circulate and remain predominant for the season overall, during the three weeks ending March 16, influenza A(H3N2) viruses have been identified more frequently than A(H1N1) viruses in most of the country. In the past, A(H3N2) virus-predominant influenza seasons have been associated with more hospitalizations and deaths in people 65 years and older than A(H1N1) virus-predominant seasons. Influenza vaccine effectiveness is generally lower against influenza A(H3N2) viruses than against A(H1N1) or B viruses [1]. In addition, one genetic clade of A(H3N2) viruses, the 3C.3a clade, has recently become predominant among circulating A(H3N2) viruses and according to laboratory testing these viruses are antigenically distinct from the A(H3N2) virus included in this season’s vaccine.

CDC recommends antiviral medications for treatment of influenza, regardless of a patient’s influenza vaccination status.
Antiviral treatment has been shown to have clinical and public health benefit in reducing illness and severe outcomes of influenza based on evidence from randomized controlled trials, meta-analyses of randomized controlled trials, and observational studies during past influenza seasons and during the 2009 H1N1 pandemic [2–9]. Influenza antiviral medications are most effective in treating influenza and reducing complications when treatment is started early (within 48 hours of illness onset). However, some studies suggest clinical benefit among hospitalized patients and young children with febrile illness even when treatment starts three to five days after illness onset [10–16].

Recommendations
[/FONT]
  1. [FONT=&quot]All Hospitalized, Severely Ill, and High-Risk Patients with Suspected or Confirmed Influenza Should Be Treated with Antivirals[/FONT]
  2. [FONT=&quot]Antiviral treatment is recommended as early as possible for any patient with suspected or confirmed influenza who:1) Is hospitalized—treatment is recommended for all hospitalized patients;2) Has severe, complicated, or progressive illness—this may include outpatients with severe or prolonged progressive symptoms or patients who develop complications such as pneumonia but who are not hospitalized;3) Is at high risk for influenza complications but not hospitalized—this includes [/FONT]
    1. [FONT=&quot]Adults 65 years and older.[/FONT]
    2. [FONT=&quot]Children younger than two years. Although all children younger than five years are considered at higher risk for complications from influenza, the highest risk is for those younger than two years.[/FONT]
    3. [FONT=&quot]People with chronic pulmonary (including asthma), cardiovascular (except hypertension alone), renal, hepatic, hematological (including sickle cell disease), and metabolic disorders (including diabetes mellitus).[/FONT]
    4. [FONT=&quot]People with neurologic and neurodevelopment conditions (including disorders of the brain, spinal cord, peripheral nerve, and muscle such as cerebral palsy, epilepsy [seizure disorders], stroke, intellectual disability, moderate to severe developmental delay, muscular dystrophy, or spinal cord injury).[/FONT]
    5. [FONT=&quot]People with immunosuppression, including that caused by medications or by HIV infection.[/FONT]
    6. [FONT=&quot]Women who are pregnant or postpartum (within two weeks after delivery).[/FONT]
    7. [FONT=&quot]People younger than 19 years who are receiving long-term aspirin therapy.[/FONT]
    8. [FONT=&quot]American Indians and Alaska Natives.[/FONT]
    9. [FONT=&quot]People with extreme obesity (i.e., body-mass index is equal to or greater than 40).[/FONT]
    10. [FONT=&quot]Residents of nursing homes and other chronic-care facilities.[/FONT]
    [FONT=&quot] [/FONT]
  3. [FONT=&quot]Antivirals in Non-High Risk Patients with Uncomplicated Influenza
    Antiviral treatment can benefit other individuals with influenza. While current guidance focuses on antiviral treatment of those with severe illness or at high risk of complications, antiviral treatment may be prescribed for any previously healthy (non-high risk) outpatient with suspected or confirmed influenza who presents within two days after illness onset. Clinical judgment—considering the patient’s disease severity and progression, age, likelihood of influenza, and time since onset of symptoms—is important when making antiviral treatment decisions for outpatients who are not at increased risk for influenza complications.
    [/FONT]
  4. [FONT=&quot]Choice of Antiviral Medication
    Four influenza antiviral medications approved by the U.S. Food and Drug Administration (FDA) are recommended for use in the United States during the 2018-2019 influenza season. Three drugs are chemically related antiviral medications known as neuraminidase inhibitors that block the viral neuraminidase enzyme and have activity against both influenza A and B viruses: oral oseltamivir phosphate (available as a generic version or under the trade name Tamiflu?), inhaled zanamivir (trade name Relenza?), and intravenous peramivir (trade name Rapivab?). The fourth drug is oral baloxavir marboxil (trade name Xofluza?), which is active against both influenza A and B viruses but has a different mechanism of action. Baloxavir is a cap-dependent endonuclease inhibitor that interferes with viral RNA transcription and blocks virus replication. Recommended ages for treatment and prevention with antiviral medications are summarized in the table below. Dosing and more detailed treatment considerations can be found in the Summary of Influenza Antiviral Treatment Recommendations for Clinicians (http://www.cdc.gov/flu/professionals...clinicians.htm).
    [/FONT]
    [TABLE="border: 0"]
    [TR="bgcolor: #999999"]
    [TD][FONT=&quot]Antiviral[/FONT][/TD]
    [TD][FONT=&quot]Route[/FONT][/TD]
    [TD][FONT=&quot]Treatment[/FONT][/TD]
    [TD][FONT=&quot]Chemoprophylaxis[/FONT][/TD]
    [TD][FONT=&quot]Most Common Adverse Events[/FONT][/TD]
    [/TR]
    [TR="bgcolor: #999999"]
    [TD] [/TD]
    [TD] [/TD]
    [TD="colspan: 2"][FONT=&quot](Recommended Age)[/FONT][/TD]
    [TD] [/TD]
    [/TR]
    [TR]
    [TD][FONT=&quot]Oseltamivir[/FONT][/TD]
    [TD][FONT=&quot]oral and enteric[/FONT][/TD]
    [TD][FONT=&quot]any age[/FONT][/TD]
    [TD][FONT=&quot]>3 months[/FONT][/TD]
    [TD][FONT=&quot]nausea, vomiting, headache*[/FONT][/TD]
    [/TR]
    [TR]
    [TD][FONT=&quot]Zanamivir[/FONT][/TD]
    [TD][FONT=&quot]inhaled[/FONT][/TD]
    [TD][FONT=&quot]>7 years[/FONT][/TD]
    [TD][FONT=&quot]>5 years[/FONT][/TD]
    [TD][FONT=&quot]bronchospasm[/FONT][/TD]
    [/TR]
    [TR]
    [TD][FONT=&quot]Peramivir[/FONT][/TD]
    [TD][FONT=&quot]intravenous[/FONT][/TD]
    [TD][FONT=&quot]>2 years[/FONT][/TD]
    [TD][FONT=&quot]n/a[/FONT][/TD]
    [TD][FONT=&quot]diarrhea[/FONT][/TD]
    [/TR]
    [TR]
    [TD][FONT=&quot]Baloxavir[/FONT][/TD]
    [TD][FONT=&quot]oral[/FONT][/TD]
    [TD][FONT=&quot]>12 years[/FONT][/TD]
    [TD][FONT=&quot]n/a[/FONT][/TD]
    [TD][FONT=&quot]none more common than placebo[/FONT][/TD]
    [/TR]
    [TR]
    [TD="colspan: 5"][FONT=&quot]*Nausea and vomiting are generally transient and can be mitigated if oseltamivir is taken with food n/a = not applicable[/FONT][/TD]
    [/TR]
    [/TABLE]
    [FONT=&quot] For outpatients with acute uncomplicated influenza, oral oseltamivir, inhaled zanamivir, intravenous peramivir, or oral baloxavir may be used for treatment.
    The recommended treatment course for uncomplicated influenza is
    [/FONT]
    • [FONT=&quot]Two doses per day of oral oseltamivir for five days, or[/FONT]
    • [FONT=&quot]Two doses per day of inhaled zanamivir for five days, or[/FONT]
    • [FONT=&quot]One dose per day of intravenous peramivir for one day, or[/FONT]
    • [FONT=&quot]One dose per day of oral baloxavir for one day.[/FONT]
    [FONT=&quot] Oral or enterically-administered oseltamivir is the only recommended antiviral medication for treatment of hospitalized patients with suspected or confirmed influenza and patients with severe or complicated illness with suspected or confirmed influenza (e.g., pneumonia, exacerbation of underlying chronic medical condition) who are not hospitalized. There are insufficient data for inhaled zanamivir, intravenous peramivir, and oral baloxavir in patients with severe influenza disease.
    Oral oseltamivir is preferred for treatment of pregnant women. Pregnant women are recommended to receive the same antiviral dosing as non-pregnant people. Baloxavir is not recommended for the treatment of pregnant women or breastfeeding mothers, as there are no available efficacy or safety data.
    [/FONT]
  5. [FONT=&quot]Timing of Treatment and Implications for Patient Evaluation, Treatment, and Testing
    Clinical benefit is greatest when antiviral treatment is administered as early as possible after illness onset. Therefore, antiviral treatment should be started as soon as possible after illness onset and should not be delayed, even for a few hours to wait for the results of testing. Ideally, treatment should be initiated within 48 hours of symptom onset. However, antiviral treatment initiated later than 48 hours after illness onset can still be beneficial for some patients.Because of the importance of early treatment, decisions about starting antiviral treatment should not wait for laboratory confirmation of influenza. Therefore, empiric antiviral treatment should be initiated as soon as possible when there is known influenza activity in the community. A history of current season influenza vaccination does not exclude a diagnosis of influenza in an ill child or adult. High-risk patients should be advised to call their provider promptly if they have symptoms of influenza. ...
    [/FONT]
  6. [FONT=&quot]https://emergency.cdc.gov/han/han00419.asp[/FONT]
[FONT=&quot] [/FONT]
 
[h=3]2018-2019 Influenza Season Week 12 ending March 23, 2019[/h] All data are preliminary and may change as more reports are received.
An overview of the CDC influenza surveillance system, including methodology and detailed descriptions of each data component, is available at http://www.cdc.gov/flu/weekly/overview.htm.
[h=3]Synopsis:[/h] Influenza activity decreased but remains elevated in the United States. Influenza A(H1N1)pdm09 viruses predominated from October to mid-February and influenza A(H3N2) viruses have been more commonly identified since late February. Small numbers of influenza B viruses have also been reported. Below is a summary of the key influenza indicators for the week ending March 23, 2019
  • Viral Surveillance:The percentage of respiratory specimens testing positive for influenza viruses in clinical laboratories decreased. Nationally, during the most recent three weeks, influenza A(H3) viruses were reported more frequently than influenza A(H1N1)pdm09 viruses and in all 10 HHS Regions.
    • Virus Characterization:The majority of influenza viruses characterized antigenically are similar to the cell-grown reference viruses representing the 2018?2019 Northern Hemisphere influenza vaccine viruses. However, an increasing proportion of influenza A(H3N2) viruses are antigenically distinguishable from A/Singapore/INFIMH-16-0019/2016 (3C.2a1), a cell-propagated reference virus representing the A(H3N2) component of 2018-19 Northern Hemisphere influenza vaccines.
    • Antiviral Resistance:The vast majority of influenza viruses tested (>99%) show susceptibility to oseltamivir and peramivir. All influenza viruses tested showed susceptibility to zanamivir.
  • Influenza-like Illness Surveillance:The proportion of outpatient visits for influenza-like illness (ILI) decreased to 3.8%, and remains above the national baseline of 2.2%. All 10 regions reported ILI at or above their region-specific baseline level.
    • ILI State Activity Indictor Map: 20 states experienced high ILI activity; Puerto Rico and 13 states experienced moderate ILI activity; New York City, the District of Columbia and seven states experienced low ILI activity; 10 states experienced minimal ILI activity; and the U.S. Virgin Islands had insufficient data.
  • Geographic Spread of Influenza: The geographic spread of influenza in Puerto Rico and 34 states was reported as widespread; 14 states reported regional activity; the District of Columbia and two states reported local activity; the U.S. Virgin Islands reported sporadic activity; and Guam did not report.
  • Influenza-associated Hospitalizations A cumulative rate of 52.5 laboratory-confirmed influenza-associated hospitalizations per 100,000 population was reported. The highest hospitalization rate is among adults 65 years and older (167.0 hospitalizations per 100,000 population).
  • Pneumonia and Influenza Mortality: The proportion of deaths attributed to pneumonia and influenza (P&I) was above the system-specific epidemic threshold in the National Center for Health Statistics (NCHS) Mortality Surveillance System.
  • Influenza-associated Pediatric Deaths: One influenza-associated pediatric death was reported to CDC during week 12.
[h=3]National and Regional Summary of Select Surveillance Components[/h]
[TABLE="class: table table-bordered opt-in, width: 100%"]
[TR]
[/TR]
[TR]
HHS Surveillance Regions* Data for current week National data is for the current week
Regional data is for the most recent three weeks
[/TR]
[TR]
Out-patient ILI? Number of jurisdictions reporting regional or widespread activity? % respiratory specimens positive for flu in clinical laboratories Predominant flu virus reported by public health laboratories [/TR]
[TR]
[/TR]
[TR]
Nation [TD]Elevated[/TD]
[TD]49 of 54[/TD]
[TD]22.1%[/TD]
[TD]Influenza A(H3)[/TD]
[/TR]
[TR]
Region 1 [TD]Elevated[/TD]
[TD]6 of 6[/TD]
[TD]19.8%[/TD]
[TD]Influenza A(H3)[/TD]
[/TR]
[TR]
Region 2 [TD]Elevated[/TD]
[TD]3 of 4[/TD]
[TD]22.5%[/TD]
[TD]Influenza A(H3)[/TD]
[/TR]
[TR]
Region 3 [TD]Elevated[/TD]
[TD]5 of 6[/TD]
[TD]22.3%[/TD]
[TD]Influenza A(H3)[/TD]
[/TR]
[TR]
Region 4 [TD]Elevated[/TD]
[TD]8 of 8[/TD]
[TD]12.4%[/TD]
[TD]Influenza A(H3)[/TD]
[/TR]
[TR]
Region 5 [TD]Elevated[/TD]
[TD]6 of 6[/TD]
[TD]30.4%[/TD]
[TD]Influenza A(H3)[/TD]
[/TR]
[TR]
Region 6 [TD]Elevated[/TD]
[TD]5 of 5[/TD]
[TD]24.1%[/TD]
[TD]Influenza A(H3)[/TD]
[/TR]
[TR]
Region 7 [TD]Elevated[/TD]
[TD]4 of 4[/TD]
[TD]28.4%[/TD]
[TD]Influenza A(H3)[/TD]
[/TR]
[TR]
Region 8 [TD]Elevated[/TD]
[TD]6 of 6[/TD]
[TD]28.1%[/TD]
[TD]Influenza A(H3)[/TD]
[/TR]
[TR]
Region 9 [TD]Elevated[/TD]
[TD]3 of 5[/TD]
[TD]11.5%[/TD]
[TD]Influenza A(H3)[/TD]
[/TR]
[TR]
Region 10 [TD]Elevated[/TD]
[TD]3 of 4[/TD]
[TD]36.7%[/TD]
[TD]Influenza A(H3)[/TD]
[/TR]
[/TABLE]
*https://www.hhs.gov/about/agencies/iea/regional-offices/index.html
? Elevated means the % of visits for ILI is at or above the national or region-specific baseline
? Includes all 50 states, the District of Columbia, Guam, Puerto Rico, and U.S. Virgin Islands

[h=2]U.S. Virologic Surveillance:[/h] WHO and NREVSS collaborating laboratories, which include both public health and clinical laboratories located in all 50 states, Puerto Rico, Guam, and the District of Columbia, report to CDC the total number of respiratory specimens tested for influenza and the number positive for influenza by virus type. In addition, public health laboratories also report the influenza A subtype (H1 or H3) and influenza B lineage information of the viruses they test and the age or age group of the persons from whom the specimens were collected.
Additional virologic data, including national, regional and select state-level data, can be found at: http://gis.cdc.gov/grasp/fluview/fluportaldashboard.html. Age group proportions and totals by influenza subtype reported by public health laboratories can be found at: http://gis.cdc.gov/grasp/fluview/flu_by_age_virus.html.
The results of tests performed by clinical laboratories are summarized below.
[TABLE="class: table table-bordered table-condensed opt-in, width: 100%"]
[TR]
[TD="width: 200"] [/TD]
Week 12 Data Cumulative since
September 30, 2018 (Week 40) [/TR]
[TR]
No. of specimens tested [TD]31,045[/TD]
[TD]889,328[/TD]
[/TR]
[TR]
No. of positive specimens (%) [TD]6,876 (22.1%)[/TD]
[TD]144,280(16.2%)[/TD]
[/TR]
[TR]
Positive specimens by type [TD] [/TD]
[TD] [/TD]
[/TR]
[TR]
Influenza A [TD]6,503 (94.6%)[/TD]
[TD]138,778 (96.2%)[/TD]
[/TR]
[TR]
Influenza B [TD]373 (5.4%)[/TD]
[TD]5,502 (3.8%)[/TD]
[/TR]
[/TABLE]

View National and Regional Level Graphs and Data | View Chart Data | View Full Screen | View PowerPoint Presentation
The results of tests performed by public health laboratories are summarized below.
[TABLE="class: table table-bordered table-condensed opt-in, width: 100%"]
[TR]
[TD] [/TD]
Week 12 Data Cumulative since
September 30, 2018 (Week 40) [/TR]
[TR]
No. of specimens tested [TD]1,618[/TD]
[TD]62,942[/TD]
[/TR]
[TR]
No. of positive specimens* [TD]923[/TD]
[TD]33,229[/TD]
[/TR]
[TR]
Positive specimens by type/subtype [TD] [/TD]
[TD] [/TD]
[/TR]
[TR]
[/TR]
[TR]
Influenza A [TD]877 (95.0%)[/TD]
[TD]32,342 (97.3%)[/TD]
[/TR]
[TR]
(H1N1)pdm09 [TD]268 (31.9%)[/TD]
[TD]19,301 (62.2%)[/TD]
[/TR]
[TR]
H3N2 [TD]573 (68.1%)[/TD]
[TD]11,737 (37.8%)[/TD]
[/TR]
[TR]
Subtyping not performed [TD]36[/TD]
[TD]1,304[/TD]
[/TR]
[TR]
[/TR]
[TR]
Influenza B [TD]46 (5.0%)[/TD]
[TD]887 (2.7%)[/TD]
[/TR]
[TR]
Yamagata lineage [TD]6 (23.1%)[/TD]
[TD]268(45.5%)[/TD]
[/TR]
[TR]
Victoria lineage [TD]20 (76.9%)[/TD]
[TD]321 (54.5%)[/TD]
[/TR]
[TR]
Lineage not performed [TD]20[/TD]
[TD]298[/TD]
[/TR]
[/TABLE]
*The percent of specimens testing positive for influenza is not reported because public health laboratories often receive samples that have already tested positive for influenza at a clinical laboratory and therefore percent positive would not be a valid indicator of influenza activity. Additional information is available at http://www.cdc.gov/flu/weekly/overview.htm.


View National and Regional Level Graphs and Data | View Chart Data | View Full Screen | View PowerPoint Presentation
[h=2]Influenza Virus Characterization:[/h] Close monitoring of influenza viruses is required to better assess the potential impact on public health. CDC characterizes influenza viruses through one or more tests including genomic sequencing, hemagglutination inhibition (HI) and/or neutralization based Focus Reduction assays (FRA). These data are used to compare how similar currently circulating influenza viruses are to the reference viruses used for developing new influenza vaccines and to monitor evolutionary changes that continually occur in influenza viruses circulating in humans. Antigenic and genetic characterization of circulating influenza viruses gives an indication of the influenza vaccine's ability to induce an immune response against the wide array of influenza viruses that are co-circulating every season. However, annual vaccine effectiveness estimates are needed to determine how much protection was provided to the population by vaccination. On February 14, 2019, interim influenza effectiveness estimates for the 2018-2019 season were released and are available here.
For nearly all influenza-positive surveillance samples received at CDC, next-generation sequencing is performed to determine the genetic identity of circulating influenza viruses and to monitor the evolutionary trajectory of viruses circulating in our population. Virus gene segments are classified into genetic clades/subclades based on phylogenetic analysis. However, genetic changes that classify the clades/subclades do not always result in antigenic changes. ?Antigenic drift? is a term used to describe gradual antigenic change that occurs as viruses evolve changes to escape host immune pressure. Antigenic drift is evaluated by comparing antigenic properties of cell-propagated reference viruses representing currently recommended vaccine components with those of cell-propagated circulating viruses.
CDC has antigenically or genetically characterized 1,721 influenza viruses collected September 30, 2018 ? March 23, 2019, and submitted by U.S. laboratories, including 890 influenza A(H1N1)pdm09 viruses, 618 influenza A(H3N2) viruses, and 213 influenza B viruses.
Influenza A Viruses
Influenza B Viruses

The majority of U.S. viruses submitted for characterization come from state and local public health laboratories. Due to Right Size Roadmapconsiderations, specimen submission guidance to laboratories is that, if available, 2 influenza A(H1N1)pdm09, 2 influenza A(H3N2), and 2 influenza B viruses be submitted every other week. Therefore, the numbers of each virus type/subtype characterized should be more balanced across subtypes/lineages but will not reflect the actual proportion of circulating viruses. In the figure below, the results of tests performed by public health labs are shown on the left and CDC sequence results (by genetic clade/subclade) are shown on the right.
Genetic12_small.gif

View Chart Data | View Full Screen | View PowerPoint Presentation
    • A (H1N1)pdm09: Phylogenetic analysis of the HA genes from 890 A(H1N1)pdm09 viruses showed that all belonged to clade 6B.1. Two hundred ninety-two A(H1N1)pdm09 viruses were antigenically characterized, and 283 (96.9%) were antigenically similar (analyzed using HI with ferret antisera) to A/Michigan/45/2015 (6B.1), a cell-propagated A/Michigan/45/2015-like reference virus representing the A(H1N1)pdm09 component for the 2018-19 Northern Hemisphere influenza vaccines.
    • A (H3N2): Phylogenetic analysis of the HA genes from 618 A(H3N2) viruses revealed extensive genetic diversity with multiple clades/subclades co-circulating. The HA genes of circulating viruses belonged to clade 3C.2a (n=66), subclade 3C.2a1 (n=144) or clade 3C.3a (n=408). Two hundred seventy-two A(H3N2) viruses were antigenically characterized by FRA with ferret antisera, and 156 (57.4%) A(H3N2) viruses tested were well-inhibited (reacting at titers that were within 4-fold of the homologous virus titer) by ferret antisera raised against A/Singapore/INFIMH-16-0019/2016 (3C.2a1), a cell-propagated reference virus representing the A(H3N2) component of 2018-19 Northern Hemisphere influenza vaccines. One hundred sixteen (42.6%) viruses reacted poorly (at titers that were 8-fold or greater reduced compared with that of the homologous virus A/Singapore/INFIMH-16-0019/2016) and of those, 115 (99.1%) belonged to clade 3C.3a.
    • B/Victoria: Phylogenetic analysis of 95 B/Victoria-lineage viruses indicate that all HA genes belonged to genetic clade V1A, however genetic subclades which are antigenically distinct have emerged. Genetic subclades which are antigenically distinct include viruses with a two amino acid deletion (162-163) in the HA protein (V1A.1, previously abbreviated as V1A-2Del) and viruses with a three amino acid deletion (162-164) in the HA protein (abbreviated as V1A-3Del). Fifty-four B/Victoria lineage viruses were antigenically characterized and 44 (81.5%) were antigenically similar with ferret antisera raised against cell-propagated B/Colorado/06/2017-like V1A.1 reference virus. Ten (18.5%) reacted poorly (at titers that were 8-fold or greater reduced compared with the homologous virus titer) and belonged to clade V1A or genetic subclade V1A-3Del.
    • B/Yamagata: Phylogenetic analysis of 112 influenza B/Yamagata-lineage viruses indicate that the HA genes belonged to clade Y3. A total of 89 influenza B/Yamagata-lineage viruses were antigenically characterized, and all were antigenically similar to cell-propagated B/Phuket/3073/2013 (Y3), the reference vaccine virus representing the influenza B/Yamagata-lineage component of the 2018-19 Northern Hemisphere quadrivalent vaccines.
    [h=2]Antiviral Resistance:[/h] Testing of influenza A(H1N1)pdm09, influenza A(H3N2), and influenza B viruses for resistance to the neuraminidase inhibitors (oseltamivir, zanamivir, and peramivir) is performed at CDC using next-generation sequencing analysis and/or a functional assay. Neuraminidase sequences of viruses are inspected to detect the presence of amino acid substitutions,previously associated with reduced or highly reduced inhibition by any of three neuraminidase inhibitors.In addition, a subset of viruses are tested using the neuraminidase inhibition assay with three neuraminidase inhibitors. The level of neuraminidase activity inhibition is reported using the thresholds recommended by the World Health Organization Expert Working Group of the Global Influenza Surveillance and Response System (GISRS)These samples are routinely obtained for surveillance purposes rather than for diagnostic testing of patients suspected to be infected with an antiviral-resistant virus.
    Reporting of baloxavir susceptibility testing for the 2018-2019 influenza season will begin later this season. More information regarding influenza antiviral drug resistance can be found here.
    High levels of resistance to the adamantanes (amantadine and rimantadine) persist among influenza A(H1N1)pdm09 and influenza A(H3N2) viruses (the adamantanes are not effective against influenza B viruses). Therefore, data from adamantane resistance testing are not presented below.
    [h=3]Assessment of Virus Susceptibility to Neuraminidase Inhibitors Using Next-Generation Sequencing Analysis and/or Neuraminidase Inhibition Assay[/h]
    [TABLE="class: table table-bordered opt-in, width: 100%"]
    [TR]
    Type/Subtype or Lineage Inhibition of Neuraminidase Activity by Antiviral Drug [/TR]
    [TR]
    [TD="colspan: 3"]Oseltamivir[/TD]
    [TD="colspan: 3"]Peramivir[/TD]
    [TD="colspan: 3"]Zanamivir[/TD]
    [/TR]
    [TR]
    Virus Tested (n) Reduced, Number (%) Highly Reduced, Number (%) Virus Tested (n) Reduced, Number (%) Highly Reduced, Number (%) Virus Tested (n) Reduced, Number (%) Highly Reduced, Number (%) [/TR]
    [TR]
    Total Viruses [TD]1,698[/TD]
    [TD]2 (0.1%)[/TD]
    [TD]3 (0.2%)[/TD]
    [TD]1,698[/TD]
    [TD]0 (0%)[/TD]
    [TD]3 (0.2%)[/TD]
    [TD]1,698[/TD]
    [TD]0 (0%)[/TD]
    [TD]0 (0%)[/TD]
    [/TR]
    [TR]
    A(H1N1)pdm09 [TD]882[/TD]
    [TD]2 (0.2%)[/TD]
    [TD]3 (0.3%)[/TD]
    [TD]882[/TD]
    [TD]0 (0%)[/TD]
    [TD]3 (0.3%)[/TD]
    [TD]882[/TD]
    [TD]0 (0%)[/TD]
    [TD]0 (0%)[/TD]
    [/TR]
    [TR]
    A(H3N2) [TD]610[/TD]
    [TD]0 (0%)[/TD]
    [TD]0 (0%)[/TD]
    [TD]610[/TD]
    [TD]0 (0%)[/TD]
    [TD]0 (0%)[/TD]
    [TD]610[/TD]
    [TD]0 (0%)[/TD]
    [TD]0 (0%)[/TD]
    [/TR]
    [TR]
    B/Victoria [TD]96[/TD]
    [TD]0 (0%)[/TD]
    [TD]0 (0%)[/TD]
    [TD]96[/TD]
    [TD]0 (0%)[/TD]
    [TD]0 (0%)[/TD]
    [TD]96[/TD]
    [TD]0 (0%)[/TD]
    [TD]0 (0%)[/TD]
    [/TR]
    [TR]
    B/Yamagata [TD]110[/TD]
    [TD]0 (0%)[/TD]
    [TD]0 (0%)[/TD]
    [TD]110[/TD]
    [TD]0 (0%)[/TD]
    [TD]0 (0%)[/TD]
    [TD]110[/TD]
    [TD]0 (0%)[/TD]
    [TD]0 (0%)[/TD]
    [/TR]
    [/TABLE]
    Antiviral treatment as early as possible is recommended for patients with confirmed or suspected influenza who have severe, complicated, or progressive illness; who require hospitalization; or who are at high risk for serious influenza-related complications. Additional information on recommendations for treatment and chemoprophylaxis of influenza virus infection with antiviral agents is available at:http://www.cdc.gov/flu/antivirals/index.htm.


    [h=2]Outpatient Illness Surveillance:[/h] Nationwide during week 12, 3.8% of patient visits reported through the U.S. Outpatient Influenza-like Illness Surveillance Network (ILINet) were due to influenza-like illness (ILI). This percentage is above the national baseline of 2.2%.(ILI is defined as fever (temperature of 100?F [37.8?C] or greater) and cough and/or sore throat.)
    On a regional level, the percentage of outpatient visits for ILI ranged from 2.8% to 5.6% during week 12. All 10 regions reported a percentage of outpatient visits for ILI at or above their region-specific baseline.
    Additional data on medically attended visits for ILI for current and past seasons and by geography (national, HHS region, or select states) are available on FluView Interactive http://gis.cdc.gov/grasp/fluview/fluportaldashboard.html.

    View National and Regional Level Graphs and Data | View Chart Data | View Full Screen | View PowerPoint Presentation


    [h=2]ILINet State Activity Indicator Map:[/h] Data collected in ILINet are used to produce a measure of ILI activity* by state. Activity levels are based on the percent of outpatient visits in a state due to ILI and are compared to the average percent of ILI visits that occur during weeks with little or no influenza virus circulation. Activity levels range from minimal, which would correspond to ILI activity from outpatient clinics being below, or only slightly above, the average, to high, which would correspond to ILI activity from outpatient clinics being much higher than average.
    The ILI Activity Indicator Map displays state-specific activity levels for multiple seasons and allows a visual representation of relative activity from state to state. More information is available on FluView Interactive at https://gis.cdc.gov/grasp/fluview/main.html.
    During week 12, the following ILI activity levels were experienced:


    *This map uses the proportion of outpatient visits to health care providers for ILI to measure the ILI activity level within a state. It does not, however, measure the extent of geographic spread of flu within a state. Therefore, outbreaks occurring in a single city could cause the state to display high activity levels.
    Data collected in ILINet may disproportionally represent certain populations within a state, and therefore, may not accurately depict the full picture of influenza activity for the whole state.
    Data displayed in this map are based on data collected in ILINet, whereas the State and Territorial flu activity map is based on reports from state and territorial epidemiologists. The data presented in this map are preliminary and may change as more data are received.
    Differences in the data presented here by CDC and independently by some state health departments likely represent differing levels of data completeness with data presented by the state likely being the more complete.


    [h=2]Geographic Spread of Influenza as Assessed by State and Territorial Epidemiologists[/h] The influenza activity reported by state and territorial epidemiologists indicates geographic spread of influenza viruses, but does not measure the severity of influenza activity. Additional data displaying the influenza activity reported by state and territorial epidemiologists for the current and past seasons are available on FluView Interactive at https://gis.cdc.gov/grasp/fluview/FluView8.html
    During week 12, the following influenza activity was reported:
      • 20 states (Alabama, Arkansas, Colorado, Indiana, Iowa, Kentucky, Louisiana, Michigan, Missouri, New Mexico, New York, Oklahoma, Oregon, Rhode Island, South Carolina, Texas, Utah, Virginia, Washington and Wisconsin) experienced high ILI activity.
      • Puerto Rico and 13 states (Arizona, California, Georgia, Illinois, Kansas, Maine, Maryland, New Jersey, North Carolina, Ohio, Pennsylvania, West Virginia and Wyoming) experienced moderate ILI activity.
      • New York City, the District of Columbia and seven states (Connecticut, Idaho, Massachusetts, Minnesota, Mississippi, Nevada and Vermont) experienced low ILI activity.
      • Ten states (Alaska, Delaware, Florida, Hawaii, Montana, Nebraska, New Hampshire, North Dakota, South Dakota and Tennessee) experienced minimal ILI activity.
      • Data were insufficient to calculate an ILI activity level from the U.S. Virgin Islands.
      • Widespread influenza activity was reported by Puerto Rico and 34 states (Alabama, Arizona, Arkansas, California, Connecticut, Delaware, Georgia, Illinois, Indiana, Iowa, Kansas, Maine, Maryland, Massachusetts, Michigan, Mississippi, Missouri, Montana, Nevada, New Hampshire, New Jersey, New Mexico, New York, North Carolina, Ohio, Oklahoma, Oregon, Pennsylvania, Rhode Island, South Carolina, Virginia, Washington, Wisconsin and Wyoming).
      • Regional influenza activity was reported by 14 states (Colorado, Florida, Idaho, Kentucky, Louisiana, Minnesota, Nebraska, North Dakota, South Dakota, Tennessee, Texas, Utah, Vermont and West Virginia).
      • Local influenza activity was reported by the District of Columbia and two states (Alaska and Hawaii).
      • Sporadic influenza activity was reported by the U.S. Virgin Islands.
      • Guam did not report.
        [h=2]Influenza-Associated Hospitalizations:[/h] The Influenza Hospitalization Surveillance Network (FluSurv-NET) conducts population-based surveillance for laboratory-confirmed influenza-related hospitalizations in select counties in the Emerging Infections Program (EIP) states and Influenza Hospitalization Surveillance Project (IHSP) states.
        A total of 15,165 laboratory-confirmed influenza-associated hospitalizations were reported by FluSurv-NET sites between October 1, 2018 and March 23, 2019. The overall hospitalization rate was 52.5 per 100,000 population. The highest rate of hospitalization was among adults aged ≥65 (167.0 per 100,000 population), followed by adults aged 50-64 (67.4 per 100,000 population) and children aged 0-4 (63.6 per 100,000 population). Among 15,165 hospitalizations, 14,544 (95.9%) were associated with influenza A virus, 495 (3.3%) with influenza B virus, 38 (0.3%) with influenza A virus and influenza B virus co-infection, and 88 (0.6%) with influenza virus for which the type was not determined. Among those with influenza A subtype information, 2,043 (55.8%) were A(H1N1)pdm09 virus and 1,616 (44.1%) were A(H3N2).
        Among 2,219 hospitalized adults with information on underlying medical conditions, 2,000 (90.1%) had at least one reported underlying medical condition, the most commonly reported were cardiovascular disease, metabolic disorder, and obesity. Among 428 hospitalized children with information on underlying medical conditions, 209 (48.8%) had at least one underlying medical condition; the most commonly reported was asthma. Among 328 hospitalized women of childbearing age (15-44 years) with information on pregnancy status, 91 (27.7%) were pregnant.
        Additional FluSurv-NET data displaying hospitalization rates for the current and past seasons and different age groups (including rates for patients 65-74 years, 74-84 years, and 85 years of age and older), as well as data on patient characteristics (such as influenza virus type, demographic, and clinical information), are available on FluView Interactive at: http://gis.cdc.gov/GRASP/Fluview/FluHospRates.html and http://gis.cdc.gov/grasp/fluview/FluHospChars.html.
        FluSurv-Net data is used to generate national estimates of the total numbers of flu cases, medical visits, hospitalizations, and deaths. This season, CDC is reporting preliminary cumulative in-season estimates, which are available athttps://cdc.gov/flu/about/burden/preliminary-in-season-estimates.htm.
        [SIZE=1.5]Data from the Influenza Hospitalization Surveillance Network (FluSurv-NET), a population-based surveillance for influenza related hospitalizations in children and adults in 13 U.S. states. Cumulative incidence rates are calculated using the National Center for Health Statistics? (NCHS) population estimates for the counties included in the surveillance catchment area.[/SIZE]
        View Interactive Application | View Full Screen | View PowerPoint Presentation
        [SIZE=1.5]FluSurv-NET data are preliminary and displayed as they become available. Therefore, figures are based on varying denominators as some variables represent information that may require more time to be collected. Data are refreshed and updated weekly. Asthma includes a medical diagnosis of asthma or reactive airway disease; Cardiovascular diseases include conditions such as coronary heart disease, cardiac valve disorders, congestive heart failure, and pulmonary hypertension; does not include isolated hypertension; Chronic lung diseases include conditions such as chronic obstructive pulmonary disease, bronchiolitis obliterans, chronic aspiration pneumonia, and interstitial lung disease; Immune suppression includes conditions such as immunoglobulin deficiency, leukemia, lymphoma, HIV/AIDS, and individuals taking immunosuppressive medications; Metabolic disorders include conditions such as diabetes mellitus; Neurologic diseases include conditions such as seizure disorders, cerebral palsy, and cognitive dysfunction; Neuromuscular diseases include conditions such as multiple sclerosis and muscular dystrophy; Obesity was assigned if indicated in patient's medical chart or if body mass index (BMI) >30 kg/m2; Pregnancy percentage calculated using number of female cases aged between 15 and 44 years of age as the denominator; Renal diseases include conditions such as acute or chronic renal failure, nephrotic syndrome, glomerulonephritis, and impaired creatinine clearance; No known condition indicates that the case did not have any known high risk medical condition indicated in medical chart at the time of hospitalization.[/SIZE]
        View Interactive Application | View Full Screen | View PowerPoint Presentation

        [h=2]Pneumonia and Influenza (P&I) Mortality Surveillance:[/h] Based on National Center for Health Statistics (NCHS) mortality surveillance data available on March 28, 2019, 7.4% of the deaths occurring during the week ending March 16, 2019 (week 11) were due to P&I. This percentage is above the epidemic threshold of 7.2% for week 11.
        Additional pneumonia and influenza mortality data for current and past seasons and by geography (national, HHS region, or state) are available at on FluView Interactive http://gis.cdc.gov/grasp/fluview/mortality.html. Data displayed on the regional and state-level are aggregated by the state of residence of the decedent.
        NCHS12_small.gif

        View Regional and State Level Data | View Chart Data | View Full Screen | View PowerPoint Presentation

        [h=2]Influenza-Associated Pediatric Mortality:[/h] One influenza-associated pediatric death was reported to CDC during week 12. This death was associated with an influenza A(H1N1)pdm09 virus and occurred during week 12 (the week ending March 23, 2019).
        A total of 77 influenza-associated pediatric deaths occurring during the 2018-2019 season have been reported to CDC.
        Additional information on influenza-associated pediatric deaths including basic demographics, underlying conditions, bacterial co-infections, and place of death for the current and past seasons, is available on FluView Interactivehttp://gis.cdc.gov/GRASP/Fluview/PedFluDeath.html.

        View Interactive Application | View Full Screen | View PowerPoint Presentation


        [h=2]Additional National and International Influenza Surveillance Information[/h] FluView Interactive: FluView includes enhanced web-based interactive applications that can provide dynamic visuals of the influenza data collected and analyzed by CDC. These FluView Interactive applications allow people to create customized, visual interpretations of influenza data, as well as make comparisons across flu seasons, regions, age groups and a variety of other demographics. To access these tools, visit http://www.cdc.gov/flu/weekly/fluviewinteractive.htm.
        U.S. State and local influenza surveillance: Click on a jurisdiction below to access the latest local influenza information.

        [TABLE="width: 100%"]
        [TR]
        [TD="width: 139"] Alabama
        [/TD]
        [TD="width: 139"] Alaska
        [/TD]
        [TD="width: 139"] Arizona
        [/TD]
        [TD="width: 139"] Arkansas
        [/TD]
        [TD="width: 139"] California
        [/TD]
        [/TR]
        [TR]
        [TD="width: 139"] Colorado
        [/TD]
        [TD="width: 139"] Connecticut
        [/TD]
        [TD="width: 139"] Delaware
        [/TD]
        [TD="width: 139"] District of Columbia
        [/TD]
        [TD="width: 139"] Florida
        [/TD]
        [/TR]
        [TR]
        [TD="width: 139"] Georgia
        [/TD]
        [TD="width: 139"] Hawaii
        [/TD]
        [TD="width: 139"] Idaho
        [/TD]
        [TD="width: 139"] Illinois
        [/TD]
        [TD="width: 139"] Indiana
        [/TD]
        [/TR]
        [TR]
        [TD="width: 139"] Iowa
        [/TD]
        [TD="width: 139"] Kansas
        [/TD]
        [TD="width: 139"] Kentucky
        [/TD]
        [TD="width: 139"] Louisiana
        [/TD]
        [TD="width: 139"] Maine
        [/TD]
        [/TR]
        [TR]
        [TD="width: 139"] Maryland
        [/TD]
        [TD="width: 139"] Massachusetts
        [/TD]
        [TD="width: 139"] Michigan
        [/TD]
        [TD="width: 139"] Minnesota
        [/TD]
        [TD="width: 139"] Mississippi
        [/TD]
        [/TR]
        [TR]
        [TD="width: 139"] Missouri
        [/TD]
        [TD="width: 139"] Montana
        [/TD]
        [TD="width: 139"] Nebraska
        [/TD]
        [TD="width: 139"] Nevada
        [/TD]
        [TD="width: 139"] New Hampshire
        [/TD]
        [/TR]
        [TR]
        [TD="width: 139"] New Jersey
        [/TD]
        [TD="width: 139"] New Mexico
        [/TD]
        [TD="width: 139"] New York
        [/TD]
        [TD="width: 139"] North Carolina
        [/TD]
        [TD="width: 139"] North Dakota
        [/TD]
        [/TR]
        [TR]
        [TD="width: 139"] Ohio
        [/TD]
        [TD="width: 139"] Oklahoma
        [/TD]
        [TD="width: 139"] Oregon
        [/TD]
        [TD="width: 139"] Pennsylvania
        [/TD]
        [TD="width: 139"] Rhode Island
        [/TD]
        [/TR]
        [TR]
        [TD="width: 139"] South Carolina
        [/TD]
        [TD="width: 139"] South Dakota
        [/TD]
        [TD="width: 139"] Tennessee
        [/TD]
        [TD="width: 139"] Texas
        [/TD]
        [TD="width: 139"] Utah
        [/TD]
        [/TR]
        [TR]
        [TD="width: 139"] Vermont
        [/TD]
        [TD="width: 139"] Virginia
        [/TD]
        [TD="width: 139"] Washington
        [/TD]
        [TD="width: 139"] West Virginia
        [/TD]
        [TD="width: 139"] Wisconsin
        [/TD]
        [/TR]
        [TR]
        [TD="width: 139"] Wyoming
        [/TD]
        [TD="width: 139"] New York City
        [/TD]
        [TD="width: 139"] Puerto Rico
        [/TD]
        [TD="width: 139"] Virgin Islands
        [/TD]
        [TD="width: 139"] [/TD]
        [/TR]
        [/TABLE]
        World Health Organization: Additional influenza surveillance information from participating WHO member nations is available throughFluNet and the Global Epidemiology Reports.
        WHO Collaborating Centers for Influenza located in Australia, China, Japan, the United Kingdom, and the United States (CDC in Atlanta, Georgia).
        Europe: For the most recent influenza surveillance information from Europe, please see WHO/Europe and the European Centre for Disease Prevention and Control at http://www.flunewseurope.org/.
        Public Health Agency of Canada: The most up-to-date influenza information from Canada is available at http://www.phac-aspc.gc.ca/fluwatch/
        Public Health England: The most up-to-date influenza information from the United Kingdom is available athttps://www.gov.uk/government/statistics/weekly-national-flu-reports
        • Any links provided to non-Federal organizations are provided solely as a service to our users. These links do not constitute an endorsement of these organizations or their programs by CDC or the Federal Government, and none should be inferred. CDC is not responsible for the content of the individual organization web pages found at these links.
          An overview of the CDC influenza surveillance system, including methodology and detailed descriptions of each data component, is available at: http://www.cdc.gov/flu/weekly/overview.htm.
https://www.cdc.gov/flu/weekly/index.htm
 
Last edited:
[h=3]018-2019 Influenza Season Week 13 ending March 30, 2019[/h] All data are preliminary and may change as more reports are received.
An overview of the CDC influenza surveillance system, including methodology and detailed descriptions of each data component, is available at http://www.cdc.gov/flu/weekly/overview.htm.
[h=3]Synopsis:[/h] Influenza activity decreased but remains elevated in the United States. Influenza A(H1N1)pdm09 viruses predominated from October to mid-February, and influenza A(H3N2) viruses have been more commonly identified since late February. Small numbers of influenza B viruses have also been reported. Below is a summary of the key influenza indicators for the week ending March 30, 2019:
  • Viral Surveillance:The percentage of respiratory specimens testing positive for influenza viruses in clinical laboratories decreased. Nationally, during the most recent three weeks, influenza A(H3) viruses were reported more frequently than influenza A(H1N1)pdm09 viruses and in all 10 HHS Regions.
    • Virus Characterization:The majority of influenza viruses characterized antigenically are similar to the cell-grown reference viruses representing the 2018?2019 Northern Hemisphere influenza vaccine viruses. However, an increasing proportion of influenza A(H3N2) viruses are antigenically distinguishable from A/Singapore/INFIMH-16-0019/2016 (3C.2a1), a cell-propagated reference virus representing the A(H3N2) component of 2018-19 Northern Hemisphere influenza vaccines.
    • Antiviral Resistance:The vast majority of influenza viruses tested (>99%) show susceptibility to oseltamivir and peramivir. All influenza viruses tested showed susceptibility to zanamivir.
  • Influenza-like Illness Surveillance:The proportion of outpatient visits for influenza-like illness (ILI) decreased to 3.2%, and remains above the national baseline of 2.2%. All 10 regions reported ILI at or above their region-specific baseline level.
    • ILI State Activity Indictor Map: Six states experienced high ILI activity; 19 states experienced moderate ILI activity; New York City, the District of Columbia, Puerto Rico and 13 states experienced low ILI activity; 12 states experienced minimal ILI activity; and the U.S. Virgin Islands had insufficient data.
  • Geographic Spread of Influenza: The geographic spread of influenza in Puerto Rico and 33 states was reported as widespread; 15 states reported regional activity; the District of Columbia and one state reported local activity; the U.S. Virgin Islands and Guam did not report.
  • Influenza-associated Hospitalizations A cumulative rate of 56.4 laboratory-confirmed influenza-associated hospitalizations per 100,000 population was reported. The highest hospitalization rate is among adults 65 years and older (181.8 hospitalizations per 100,000 population).
  • Pneumonia and Influenza Mortality: The proportion of deaths attributed to pneumonia and influenza (P&I) was at the system-specific epidemic threshold in the National Center for Health Statistics (NCHS) Mortality Surveillance System.
  • Influenza-associated Pediatric Deaths: Six influenza-associated pediatric deaths were reported to CDC during week 13. Five deaths occurred during the 2018-2019 season and one death occurred during the 2017-2018 season.
[h=3]National and Regional Summary of Select Surveillance Components[/h]
[TABLE="class: table table-bordered opt-in, width: 100%"]
[TR]
[/TR]
[TR]
HHS Surveillance Regions* Data for current week National data is for the current week
Regional data is for the most recent three weeks
[/TR]
[TR]
Out-patient ILI? Number of jurisdictions reporting regional or widespread activity? % respiratory specimens positive for flu in clinical laboratories Predominant flu virus reported by public health laboratories [/TR]
[TR]
[/TR]
[TR]
Nation [TD]Elevated[/TD]
[TD]49 of 54[/TD]
[TD]18.1%[/TD]
[TD]Influenza A(H3)[/TD]
[/TR]
[TR]
Region 1 [TD]Elevated[/TD]
[TD]5 of 6[/TD]
[TD]20.0%[/TD]
[TD]Influenza A(H3)[/TD]
[/TR]
[TR]
Region 2 [TD]Elevated[/TD]
[TD]3 of 4[/TD]
[TD]20.9%[/TD]
[TD]Influenza A(H3)[/TD]
[/TR]
[TR]
Region 3 [TD]Elevated[/TD]
[TD]5 of 6[/TD]
[TD]18.4%[/TD]
[TD]Influenza A(H3)[/TD]
[/TR]
[TR]
Region 4 [TD]Elevated[/TD]
[TD]8 of 8[/TD]
[TD]12.5%[/TD]
[TD]Influenza A(H3)[/TD]
[/TR]
[TR]
Region 5 [TD]Elevated[/TD]
[TD]6 of 6[/TD]
[TD]29.8%[/TD]
[TD]Influenza A(H3)[/TD]
[/TR]
[TR]
Region 6 [TD]Elevated[/TD]
[TD]5 of 5[/TD]
[TD]18.0%[/TD]
[TD]Influenza A(H3)[/TD]
[/TR]
[TR]
Region 7 [TD]Elevated[/TD]
[TD]4 of 4[/TD]
[TD]26.4%[/TD]
[TD]Influenza A(H3)[/TD]
[/TR]
[TR]
Region 8 [TD]Elevated[/TD]
[TD]6 of 6[/TD]
[TD]22.4%[/TD]
[TD]Influenza A(H3)[/TD]
[/TR]
[TR]
Region 9 [TD]Elevated[/TD]
[TD]3 of 5[/TD]
[TD]10.8%[/TD]
[TD]Influenza A(H3)[/TD]
[/TR]
[TR]
Region 10 [TD]Elevated[/TD]
[TD]4 of 4[/TD]
[TD]33.5%[/TD]
[TD]Influenza A(H3)[/TD]
[/TR]
[/TABLE]
*https://www.hhs.gov/about/agencies/iea/regional-offices/index.html
? Elevated means the % of visits for ILI is at or above the national or region-specific baseline
? Includes all 50 states, the District of Columbia, Guam, Puerto Rico, and U.S. Virgin Islands

[h=2]U.S. Virologic Surveillance:[/h] WHO and NREVSS collaborating laboratories, which include both public health and clinical laboratories located in all 50 states, Puerto Rico, Guam, and the District of Columbia, report to CDC the total number of respiratory specimens tested for influenza and the number positive for influenza by virus type. In addition, public health laboratories also report the influenza A subtype (H1 or H3) and influenza B lineage information of the viruses they test and the age or age group of the persons from whom the specimens were collected.
Additional virologic data, including national, regional and select state-level data, can be found at: http://gis.cdc.gov/grasp/fluview/fluportaldashboard.html. Age group proportions and totals by influenza subtype reported by public health laboratories can be found at: http://gis.cdc.gov/grasp/fluview/flu_by_age_virus.html.
The results of tests performed by clinical laboratories are summarized below.
[TABLE="class: table table-bordered table-condensed opt-in, width: 100%"]
[TR]
[TD="width: 200"] [/TD]
Week 13 Data Cumulative since
September 30, 2018 (Week 40) [/TR]
[TR]
No. of specimens tested [TD]29,407[/TD]
[TD]939,381[/TD]
[/TR]
[TR]
No. of positive specimens (%) [TD]5,324 (18.1%)[/TD]
[TD]154,262 (16.4%)[/TD]
[/TR]
[TR]
Positive specimens by type [TD] [/TD]
[TD] [/TD]
[/TR]
[TR]
Influenza A [TD]4,942 (92.8%)[/TD]
[TD]148,056 (96.0%)[/TD]
[/TR]
[TR]
Influenza B [TD]382 (7.2%)[/TD]
[TD]6,206 (4.0%)[/TD]
[/TR]
[/TABLE]

View National and Regional Level Graphs and Data | View Chart Data | View Full Screen | View PowerPoint Presentation
The results of tests performed by public health laboratories are summarized below.
[TABLE="class: table table-bordered table-condensed opt-in, width: 100%"]
[TR]
[TD] [/TD]
Week 13 Data Cumulative since
September 30, 2018 (Week 40) [/TR]
[TR]
No. of specimens tested [TD]1,263[/TD]
[TD]66,266[/TD]
[/TR]
[TR]
No. of positive specimens* [TD]720[/TD]
[TD]35,344[/TD]
[/TR]
[TR]
Positive specimens by type/subtype [TD] [/TD]
[TD] [/TD]
[/TR]
[TR]
[/TR]
[TR]
Influenza A [TD]690 (95.8%)[/TD]
[TD]34,388 (97.3%)[/TD]
[/TR]
[TR]
(H1N1)pdm09 [TD]175 (26.4%)[/TD]
[TD]20,015 (60.5%)[/TD]
[/TR]
[TR]
H3N2 [TD]487 (73.6%)[/TD]
[TD]13,042 (39.5%)[/TD]
[/TR]
[TR]
Subtyping not performed [TD]28[/TD]
[TD]1,331[/TD]
[/TR]
[TR]
[/TR]
[TR]
Influenza B [TD]30 (4.2%)[/TD]
[TD]956 (2.7%)[/TD]
[/TR]
[TR]
Yamagata lineage [TD]6 (25.0%)[/TD]
[TD]293 (44.9%)[/TD]
[/TR]
[TR]
Victoria lineage [TD]18 (75.0%)[/TD]
[TD]359 (55.1%)[/TD]
[/TR]
[TR]
Lineage not performed [TD]6[/TD]
[TD]304[/TD]
[/TR]
[/TABLE]
*The percent of specimens testing positive for influenza is not reported because public health laboratories often receive samples that have already tested positive for influenza at a clinical laboratory and therefore percent positive would not be a valid indicator of influenza activity. Additional information is available at http://www.cdc.gov/flu/weekly/overview.htm.


View National and Regional Level Graphs and Data | View Chart Data | View Full Screen | View PowerPoint Presentation
[h=2]Influenza Virus Characterization:[/h] Close monitoring of influenza viruses is required to better assess the potential impact on public health. CDC characterizes influenza viruses through one or more tests including genomic sequencing, hemagglutination inhibition (HI) and/or neutralization based Focus Reduction assays (FRA). These data are used to compare how similar currently circulating influenza viruses are to the reference viruses used for developing new influenza vaccines and to monitor evolutionary changes that continually occur in influenza viruses circulating in humans. Antigenic and genetic characterization of circulating influenza viruses gives an indication of the influenza vaccine's ability to induce an immune response against the wide array of influenza viruses that are co-circulating every season. However, annual vaccine effectiveness estimates are needed to determine how much protection was provided to the population by vaccination. On February 14, 2019, interim influenza effectiveness estimates for the 2018-2019 season were released and are available here.
For nearly all influenza-positive surveillance samples received at CDC, next-generation sequencing is performed to determine the genetic identity of circulating influenza viruses and to monitor the evolutionary trajectory of viruses circulating in our population. Virus gene segments are classified into genetic clades/subclades based on phylogenetic analysis. However, genetic changes that classify the clades/subclades do not always result in antigenic changes. ?Antigenic drift? is a term used to describe gradual antigenic change that occurs as viruses evolve changes to escape host immune pressure. Antigenic drift is evaluated by comparing antigenic properties of cell-propagated reference viruses representing currently recommended vaccine components with those of cell-propagated circulating viruses.
CDC has antigenically or genetically characterized 1,769 influenza viruses collected September 30, 2018 ? March 30, 2019, and submitted by U.S. laboratories, including 906 influenza A(H1N1)pdm09 viruses, 642 influenza A(H3N2) viruses, and 221 influenza B viruses.
Influenza A Viruses
Influenza B Viruses

The majority of U.S. viruses submitted for characterization come from state and local public health laboratories. Due to Right Size Roadmapconsiderations, specimen submission guidance to laboratories is that, if available, 2 influenza A(H1N1)pdm09, 2 influenza A(H3N2), and 2 influenza B viruses be submitted every other week. Therefore, the numbers of each virus type/subtype characterized should be more balanced across subtypes/lineages but will not reflect the actual proportion of circulating viruses. In the figure below, the results of tests performed by public health labs are shown on the left and CDC sequence results (by genetic clade/subclade) are shown on the right.
Genetic13_small.gif

View Chart Data | View Full Screen | View PowerPoint Presentation
    • A (H1N1)pdm09: Phylogenetic analysis of the HA genes from 906 A(H1N1)pdm09 viruses showed that all belonged to clade 6B.1. Two hundred ninety-two A(H1N1)pdm09 viruses were antigenically characterized, and 283 (96.9%) were antigenically similar (analyzed using HI with ferret antisera) to A/Michigan/45/2015 (6B.1), a cell-propagated A/Michigan/45/2015-like reference virus representing the A(H1N1)pdm09 component for the 2018-19 Northern Hemisphere influenza vaccines.
    • A (H3N2): Phylogenetic analysis of the HA genes from 642 A(H3N2) viruses revealed extensive genetic diversity with multiple clades/subclades co-circulating. The HA genes of circulating viruses belonged to clade 3C.2a (n=66), subclade 3C.2a1 (n=145) or clade 3C.3a (n=431). Two hundred seventy-two A(H3N2) viruses were antigenically characterized by FRA with ferret antisera, and 156 (57.4%) A(H3N2) viruses tested were well-inhibited (reacting at titers that were within 4-fold of the homologous virus titer) by ferret antisera raised against A/Singapore/INFIMH-16-0019/2016 (3C.2a1), a cell-propagated reference virus representing the A(H3N2) component of 2018-19 Northern Hemisphere influenza vaccines. One hundred sixteen (42.6%) viruses reacted poorly (at titers that were 8-fold or greater reduced compared with that of the homologous virus A/Singapore/INFIMH-16-0019/2016) and of those, 115 (98.8%) belonged to clade 3C.3a.
    • B/Victoria: Phylogenetic analysis of 106 B/Victoria-lineage viruses indicate that all HA genes belonged to genetic clade V1A, however genetic subclades which are antigenically distinct have emerged. Genetic subclades which are antigenically distinct include viruses with a two amino acid deletion (162-163) in the HA protein (V1A.1, previously abbreviated as V1A-2Del) and viruses with a three amino acid deletion (162-164) in the HA protein (abbreviated as V1A-3Del). Eighty-three B/Victoria lineage viruses were antigenically characterized and 63 (75.9%) were antigenically similar with ferret antisera raised against cell-propagated B/Colorado/06/2017-like V1A.1 reference virus. Twenty (24.1%) reacted poorly (at titers that were 8-fold or greater reduced compared with the homologous virus titer) and belonged to clade V1A or genetic subclade V1A-3Del.
    • B/Yamagata: Phylogenetic analysis of 115 influenza B/Yamagata-lineage viruses indicate that the HA genes belonged to clade Y3. A total of 100 influenza B/Yamagata-lineage viruses were antigenically characterized, and all were antigenically similar to cell-propagated B/Phuket/3073/2013 (Y3), the reference vaccine virus representing the influenza B/Yamagata-lineage component of the 2018-19 Northern Hemisphere quadrivalent vaccines.
    [h=2]Antiviral Resistance:[/h] Testing of influenza A(H1N1)pdm09, influenza A(H3N2), and influenza B viruses for resistance to the neuraminidase inhibitors (oseltamivir, zanamivir, and peramivir) is performed at CDC using next-generation sequencing analysis and/or a functional assay. Neuraminidase sequences of viruses are inspected to detect the presence of amino acid substitutions,previously associated with reduced or highly reduced inhibition by any of three neuraminidase inhibitors.In addition, a subset of viruses are tested using the neuraminidase inhibition assay with three neuraminidase inhibitors. The level of neuraminidase activity inhibition is reported using the thresholds recommended by the World Health Organization Expert Working Group of the Global Influenza Surveillance and Response System (GISRS)These samples are routinely obtained for surveillance purposes rather than for diagnostic testing of patients suspected to be infected with an antiviral-resistant virus.
    Reporting of baloxavir susceptibility testing for the 2018-2019 influenza season will begin later this season. More information regarding influenza antiviral drug resistance can be found here.
    High levels of resistance to the adamantanes (amantadine and rimantadine) persist among influenza A(H1N1)pdm09 and influenza A(H3N2) viruses (the adamantanes are not effective against influenza B viruses). Therefore, data from adamantane resistance testing are not presented below.
    [h=3]Assessment of Virus Susceptibility to Neuraminidase Inhibitors Using Next-Generation Sequencing Analysis and/or Neuraminidase Inhibition Assay[/h]
    [TABLE="class: table table-bordered opt-in, width: 100%"]
    [TR]
    Type/Subtype or Lineage Inhibition of Neuraminidase Activity by Antiviral Drug [/TR]
    [TR]
    [TD="colspan: 3"]Oseltamivir[/TD]
    [TD="colspan: 3"]Peramivir[/TD]
    [TD="colspan: 3"]Zanamivir[/TD]
    [/TR]
    [TR]
    Virus Tested (n) Reduced, Number (%) Highly Reduced, Number (%) Virus Tested (n) Reduced, Number (%) Highly Reduced, Number (%) Virus Tested (n) Reduced, Number (%) Highly Reduced, Number (%) [/TR]
    [TR]
    Total Viruses [TD]1,745[/TD]
    [TD]2 (0.1%)[/TD]
    [TD]3 (0.2%)[/TD]
    [TD]1,745[/TD]
    [TD]0 (0%)[/TD]
    [TD]3 (0.2%)[/TD]
    [TD]1,745[/TD]
    [TD]0 (0%)[/TD]
    [TD]0 (0%)[/TD]
    [/TR]
    [TR]
    A(H1N1)pdm09 [TD]898[/TD]
    [TD]2 (0.2%)[/TD]
    [TD]3 (0.3%)[/TD]
    [TD]898[/TD]
    [TD]0 (0%)[/TD]
    [TD]3 (0.3%)[/TD]
    [TD]898[/TD]
    [TD]0 (0%)[/TD]
    [TD]0 (0%)[/TD]
    [/TR]
    [TR]
    A(H3N2) [TD]634[/TD]
    [TD]0 (0%)[/TD]
    [TD]0 (0%)[/TD]
    [TD]634[/TD]
    [TD]0 (0%)[/TD]
    [TD]0 (0%)[/TD]
    [TD]634[/TD]
    [TD]0 (0%)[/TD]
    [TD]0 (0%)[/TD]
    [/TR]
    [TR]
    B/Victoria [TD]100[/TD]
    [TD]0 (0%)[/TD]
    [TD]0 (0%)[/TD]
    [TD]100[/TD]
    [TD]0 (0%)[/TD]
    [TD]0 (0%)[/TD]
    [TD]100[/TD]
    [TD]0 (0%)[/TD]
    [TD]0 (0%)[/TD]
    [/TR]
    [TR]
    B/Yamagata [TD]113[/TD]
    [TD]0 (0%)[/TD]
    [TD]0 (0%)[/TD]
    [TD]113[/TD]
    [TD]0 (0%)[/TD]
    [TD]0 (0%)[/TD]
    [TD]113[/TD]
    [TD]0 (0%)[/TD]
    [TD]0 (0%)[/TD]
    [/TR]
    [/TABLE]
    Antiviral treatment as early as possible is recommended for patients with confirmed or suspected influenza who have severe, complicated, or progressive illness; who require hospitalization; or who are at high risk for serious influenza-related complications. Additional information on recommendations for treatment and chemoprophylaxis of influenza virus infection with antiviral agents is available at:http://www.cdc.gov/flu/antivirals/index.htm.


    [h=2]Outpatient Illness Surveillance:[/h] Nationwide during week 13, 3.2% of patient visits reported through the U.S. Outpatient Influenza-like Illness Surveillance Network (ILINet) were due to influenza-like illness (ILI). This percentage is above the national baseline of 2.2%.(ILI is defined as fever (temperature of 100?F [37.8?C] or greater) and cough and/or sore throat.)
    On a regional level, the percentage of outpatient visits for ILI ranged from 2.4% to 4.6% during week 13. All 10 regions reported a percentage of outpatient visits for ILI at or above their region-specific baseline.
    Additional data on medically attended visits for ILI for current and past seasons and by geography (national, HHS region, or select states) are available on FluView Interactive http://gis.cdc.gov/grasp/fluview/fluportaldashboard.html.

    View National and Regional Level Graphs and Data | View Chart Data | View Full Screen | View PowerPoint Presentation


    [h=2]ILINet State Activity Indicator Map:[/h] Data collected in ILINet are used to produce a measure of ILI activity* by state. Activity levels are based on the percent of outpatient visits in a state due to ILI and are compared to the average percent of ILI visits that occur during weeks with little or no influenza virus circulation. Activity levels range from minimal, which would correspond to ILI activity from outpatient clinics being below, or only slightly above, the average, to high, which would correspond to ILI activity from outpatient clinics being much higher than average.
    The ILI Activity Indicator Map displays state-specific activity levels for multiple seasons and allows a visual representation of relative activity from state to state. More information is available on FluView Interactive at https://gis.cdc.gov/grasp/fluview/main.html.
    During week 13, the following ILI activity levels were experienced:


    *This map uses the proportion of outpatient visits to health care providers for ILI to measure the ILI activity level within a state. It does not, however, measure the extent of geographic spread of flu within a state. Therefore, outbreaks occurring in a single city could cause the state to display high activity levels.
    Data collected in ILINet may disproportionally represent certain populations within a state, and therefore, may not accurately depict the full picture of influenza activity for the whole state.
    Data displayed in this map are based on data collected in ILINet, whereas the State and Territorial flu activity map is based on reports from state and territorial epidemiologists. The data presented in this map are preliminary and may change as more data are received.
    Differences in the data presented here by CDC and independently by some state health departments likely represent differing levels of data completeness with data presented by the state likely being the more complete.


    [h=2]Geographic Spread of Influenza as Assessed by State and Territorial Epidemiologists[/h] The influenza activity reported by state and territorial epidemiologists indicates geographic spread of influenza viruses, but does not measure the severity of influenza activity. Additional data displaying the influenza activity reported by state and territorial epidemiologists for the current and past seasons are available on FluView Interactive at https://gis.cdc.gov/grasp/fluview/FluView8.html
    During week 13, the following influenza activity was reported:
      • Six states (Kentucky, Louisiana, Missouri, Rhode Island, South Carolina, and Virginia) experienced high ILI activity.
      • 19 states (Alabama, Arkansas, Colorado, Connecticut, Georgia, Iowa, Kansas, Maryland, Massachusetts, Michigan, New Mexico, New York, North Carolina, Oregon, Pennsylvania, Texas, Utah, Washington and Wisconsin) experienced moderate ILI activity.
      • New York City, the District of Columbia, Puerto Rico and 13 states (Arizona, California, Idaho, Illinois, Indiana, Maine, Mississippi, Nebraska, Nevada, New Jersey, Ohio, Oklahoma, and West Virginia) experienced low ILI activity.
      • 12 states (Alaska, Delaware, Florida, Hawaii, Minnesota, Montana, New Hampshire, North Dakota, South Dakota, Tennessee, Vermont and Wyoming) experienced minimal ILI activity.
      • Data were insufficient to calculate an ILI activity level from the U.S. Virgin Islands.
      • Widespread influenza activity was reported by Puerto Rico and 33 states (Alabama, Alaska, Arizona, California, Connecticut, Delaware, Georgia, Illinois, Indiana, Iowa, Maine, Maryland, Massachusetts, Michigan, Mississippi, Missouri, Montana, Nevada, New Hampshire, New Jersey, New Mexico, New York, North Carolina, Ohio, Oklahoma, Oregon, Pennsylvania, Rhode Island, South Carolina, Virginia, Washington, West Virginia, and Wisconsin).
      • Regional influenza activity was reported by 15 states (Arkansas, Colorado, Florida, Idaho, Kansas, Kentucky, Louisiana, Minnesota, Nebraska, North Dakota, South Dakota, Tennessee, Texas, Utah and Wyoming).
      • Local influenza activity was reported by the District of Columbia and one state (Hawaii).
      • Sporadic influenza activity was reported by one state (Vermont).
      • Guam and the U.S. Virgin Islands did not report.
        [h=2]Influenza-Associated Hospitalizations:[/h] The Influenza Hospitalization Surveillance Network (FluSurv-NET) conducts population-based surveillance for laboratory-confirmed influenza-related hospitalizations in select counties in the Emerging Infections Program (EIP) states and Influenza Hospitalization Surveillance Project (IHSP) states.
        A total of 16,274 laboratory-confirmed influenza-associated hospitalizations were reported by FluSurv-NET sites between October 1, 2018 and March 30, 2019. The overall hospitalization rate was 56.4 per 100,000 population. The highest rate of hospitalization was among adults aged ≥65 (181.8 per 100,000 population), followed by adults aged 50-64 (71.9 per 100,000 population) and children aged 0-4 (66.1 per 100,000 population). Among 16,274 hospitalizations, 15,622 (96.0%) were associated with influenza A virus, 533 (3.3%) with influenza B virus, 37 (0.2%) with influenza A virus and influenza B virus co-infection, and 82 (0.5%) with influenza virus for which the type was not determined. Among those with influenza A subtype information, 2,655 (57.0%) were A(H1N1)pdm09 virus and 2,001 (43.0%) were A(H3N2).
        Among 2,503 hospitalized adults with information on underlying medical conditions, 2,257 (90.2%) had at least one reported underlying medical condition, the most commonly reported were metabolic disorder, cardiovascular disease, and obesity. Among 462 hospitalized children with information on underlying medical conditions, 228 (49.4%) had at least one underlying medical condition; the most commonly reported was asthma. Among 373 hospitalized women of childbearing age (15-44 years) with information on pregnancy status, 101 (27.1%) were pregnant.
        Additional FluSurv-NET data displaying hospitalization rates for the current and past seasons and different age groups (including rates for patients 65-74 years, 74-84 years, and 85 years of age and older), as well as data on patient characteristics (such as influenza virus type, demographic, and clinical information), are available on FluView Interactive at: http://gis.cdc.gov/GRASP/Fluview/FluHospRates.html and http://gis.cdc.gov/grasp/fluview/FluHospChars.html.
        FluSurv-Net data is used to generate national estimates of the total numbers of flu cases, medical visits, hospitalizations, and deaths. This season, CDC is reporting preliminary cumulative in-season estimates, which are available athttps://cdc.gov/flu/about/burden/preliminary-in-season-estimates.htm.
        [SIZE=1.5]Data from the Influenza Hospitalization Surveillance Network (FluSurv-NET), a population-based surveillance for influenza related hospitalizations in children and adults in 13 U.S. states. Cumulative incidence rates are calculated using the National Center for Health Statistics? (NCHS) population estimates for the counties included in the surveillance catchment area.[/SIZE]
        View Interactive Application | View Full Screen | View PowerPoint Presentation
        [SIZE=1.5]FluSurv-NET data are preliminary and displayed as they become available. Therefore, figures are based on varying denominators as some variables represent information that may require more time to be collected. Data are refreshed and updated weekly. Asthma includes a medical diagnosis of asthma or reactive airway disease; Cardiovascular diseases include conditions such as coronary heart disease, cardiac valve disorders, congestive heart failure, and pulmonary hypertension; does not include isolated hypertension; Chronic lung diseases include conditions such as chronic obstructive pulmonary disease, bronchiolitis obliterans, chronic aspiration pneumonia, and interstitial lung disease; Immune suppression includes conditions such as immunoglobulin deficiency, leukemia, lymphoma, HIV/AIDS, and individuals taking immunosuppressive medications; Metabolic disorders include conditions such as diabetes mellitus; Neurologic diseases include conditions such as seizure disorders, cerebral palsy, and cognitive dysfunction; Neuromuscular diseases include conditions such as multiple sclerosis and muscular dystrophy; Obesity was assigned if indicated in patient's medical chart or if body mass index (BMI) >30 kg/m2; Pregnancy percentage calculated using number of female cases aged between 15 and 44 years of age as the denominator; Renal diseases include conditions such as acute or chronic renal failure, nephrotic syndrome, glomerulonephritis, and impaired creatinine clearance; No known condition indicates that the case did not have any known high risk medical condition indicated in medical chart at the time of hospitalization.[/SIZE]
        View Interactive Application | View Full Screen | View PowerPoint Presentation

        [h=2]Pneumonia and Influenza (P&I) Mortality Surveillance:[/h] Based on National Center for Health Statistics (NCHS) mortality surveillance data available on April 4, 2019, 7.2% of the deaths occurring during the week ending March 23, 2019 (week 12) were due to P&I. This percentage is at the epidemic threshold of 7.2% for week 12.
        Additional pneumonia and influenza mortality data for current and past seasons and by geography (national, HHS region, or state) are available at on FluView Interactive http://gis.cdc.gov/grasp/fluview/mortality.html. Data displayed on the regional and state-level are aggregated by the state of residence of the decedent.
        NCHS13_small.gif

        View Regional and State Level Data | View Chart Data | View Full Screen | View PowerPoint Presentation

        [h=2]Influenza-Associated Pediatric Mortality:[/h] Six influenza-associated pediatric deaths were reported to CDC during week 13, five of which occurred during the 2018-2019 influenza season. Two deaths were associated with an influenza A(H1N1)pdm09 virus and occurred during week 12 (the week ending March 23, 2019). One death was associated with an influenza A(H3) virus and occurred during week 11 (the week ending March 16, 2019). One death was associated with an influenza A virus for which no subtyping was performed and occurred during week 12. One death was associated with an influenza B virus and occurred during week 12.
        A total of 82 influenza-associated pediatric deaths occurring during the 2018-2019 season have been reported to CDC.
        An additional death that occurred during the 2017-2018 season was reported to CDC. This death was associated with an influenza A virus for which no subtyping was performed and brings the total number of reported influenza-associated deaths occurring during that season to 186.
        Additional information on influenza-associated pediatric deaths including basic demographics, underlying conditions, bacterial co-infections, and place of death for the current and past seasons, is available on FluView Interactivehttp://gis.cdc.gov/GRASP/Fluview/PedFluDeath.html.

        View Interactive Application | View Full Screen | View PowerPoint Presentation


        [h=2]Additional National and International Influenza Surveillance Information[/h] FluView Interactive: FluView includes enhanced web-based interactive applications that can provide dynamic visuals of the influenza data collected and analyzed by CDC. These FluView Interactive applications allow people to create customized, visual interpretations of influenza data, as well as make comparisons across flu seasons, regions, age groups and a variety of other demographics. To access these tools, visit http://www.cdc.gov/flu/weekly/fluviewinteractive.htm.
        U.S. State and local influenza surveillance: Click on a jurisdiction below to access the latest local influenza information.

        [TABLE="width: 100%"]
        [TR]
        [TD="width: 139"] Alabama
        [/TD]
        [TD="width: 139"] Alaska
        [/TD]
        [TD="width: 139"] Arizona
        [/TD]
        [TD="width: 139"] Arkansas
        [/TD]
        [TD="width: 139"] California
        [/TD]
        [/TR]
        [TR]
        [TD="width: 139"] Colorado
        [/TD]
        [TD="width: 139"] Connecticut
        [/TD]
        [TD="width: 139"] Delaware
        [/TD]
        [TD="width: 139"] District of Columbia
        [/TD]
        [TD="width: 139"] Florida
        [/TD]
        [/TR]
        [TR]
        [TD="width: 139"] Georgia
        [/TD]
        [TD="width: 139"] Hawaii
        [/TD]
        [TD="width: 139"] Idaho
        [/TD]
        [TD="width: 139"] Illinois
        [/TD]
        [TD="width: 139"] Indiana
        [/TD]
        [/TR]
        [TR]
        [TD="width: 139"] Iowa
        [/TD]
        [TD="width: 139"] Kansas
        [/TD]
        [TD="width: 139"] Kentucky
        [/TD]
        [TD="width: 139"] Louisiana
        [/TD]
        [TD="width: 139"] Maine
        [/TD]
        [/TR]
        [TR]
        [TD="width: 139"] Maryland
        [/TD]
        [TD="width: 139"] Massachusetts
        [/TD]
        [TD="width: 139"] Michigan
        [/TD]
        [TD="width: 139"] Minnesota
        [/TD]
        [TD="width: 139"] Mississippi
        [/TD]
        [/TR]
        [TR]
        [TD="width: 139"] Missouri
        [/TD]
        [TD="width: 139"] Montana
        [/TD]
        [TD="width: 139"] Nebraska
        [/TD]
        [TD="width: 139"] Nevada
        [/TD]
        [TD="width: 139"] New Hampshire
        [/TD]
        [/TR]
        [TR]
        [TD="width: 139"] New Jersey
        [/TD]
        [TD="width: 139"] New Mexico
        [/TD]
        [TD="width: 139"] New York
        [/TD]
        [TD="width: 139"] North Carolina
        [/TD]
        [TD="width: 139"] North Dakota
        [/TD]
        [/TR]
        [TR]
        [TD="width: 139"] Ohio
        [/TD]
        [TD="width: 139"] Oklahoma
        [/TD]
        [TD="width: 139"] Oregon
        [/TD]
        [TD="width: 139"] Pennsylvania
        [/TD]
        [TD="width: 139"] Rhode Island
        [/TD]
        [/TR]
        [TR]
        [TD="width: 139"] South Carolina
        [/TD]
        [TD="width: 139"] South Dakota
        [/TD]
        [TD="width: 139"] Tennessee
        [/TD]
        [TD="width: 139"] Texas
        [/TD]
        [TD="width: 139"] Utah
        [/TD]
        [/TR]
        [TR]
        [TD="width: 139"] Vermont
        [/TD]
        [TD="width: 139"] Virginia
        [/TD]
        [TD="width: 139"] Washington
        [/TD]
        [TD="width: 139"] West Virginia
        [/TD]
        [TD="width: 139"] Wisconsin
        [/TD]
        [/TR]
        [TR]
        [TD="width: 139"] Wyoming
        [/TD]
        [TD="width: 139"] New York City
        [/TD]
        [TD="width: 139"] Puerto Rico
        [/TD]
        [TD="width: 139"] Virgin Islands
        [/TD]
        [TD="width: 139"] [/TD]
        [/TR]
        [/TABLE]
        World Health Organization: Additional influenza surveillance information from participating WHO member nations is available throughFluNet and the Global Epidemiology Reports.
        WHO Collaborating Centers for Influenza located in Australia, China, Japan, the United Kingdom, and the United States (CDC in Atlanta, Georgia).
        Europe: For the most recent influenza surveillance information from Europe, please see WHO/Europe and the European Centre for Disease Prevention and Control at http://www.flunewseurope.org/.
        Public Health Agency of Canada: The most up-to-date influenza information from Canada is available at http://www.phac-aspc.gc.ca/fluwatch/
        Public Health England: The most up-to-date influenza information from the United Kingdom is available athttps://www.gov.uk/government/statistics/weekly-national-flu-reports
        • Any links provided to non-Federal organizations are provided solely as a service to our users. These links do not constitute an endorsement of these organizations or their programs by CDC or the Federal Government, and none should be inferred. CDC is not responsible for the content of the individual organization web pages found at these links.
          An overview of the CDC influenza surveillance system, including methodology and detailed descriptions of each data component, is available at: http://www.cdc.gov/flu/weekly/overview.htm.
          --------------------------------------------------------------------------------
https://www.cdc.gov/flu/weekly/index.htm
 
[h=1]Weekly U.S. Influenza Surveillance Report[/h]
Language: English (US)


Recommend on FacebookTweet


fluview_hdr.jpg

[h=3]2018-2019 Influenza Season Week 14 ending April 6, 2019[/h] All data are preliminary and may change as more reports are received.
An overview of the CDC influenza surveillance system, including methodology and detailed descriptions of each data component, is available at http://www.cdc.gov/flu/weekly/overview.htm.
[h=3]Synopsis:[/h] Influenza activity continues to decrease but remains elevated in the United States. Influenza A(H1N1)pdm09 viruses predominated from October to mid-February, and influenza A(H3N2) viruses have been more commonly identified since late February. Small numbers of influenza B viruses have also been reported. Below is a summary of the key influenza indicators for the week ending April 6, 2019:
  • Viral Surveillance:The percentage of respiratory specimens testing positive for influenza viruses in clinical laboratories decreased. Nationally, during the most recent three weeks, influenza A(H3) viruses were reported more frequently than influenza A(H1N1)pdm09 viruses and in all 10 HHS Regions.
    • Virus Characterization:The majority of influenza viruses characterized antigenically are similar to the cell-grown reference viruses representing the 2018?2019 Northern Hemisphere influenza vaccine viruses. However, an increasing proportion of influenza A(H3N2) viruses are antigenically distinguishable from A/Singapore/INFIMH-16-0019/2016 (3C.2a1), a cell-propagated reference virus representing the A(H3N2) component of 2018-19 Northern Hemisphere influenza vaccines.
    • Antiviral Resistance:The vast majority of influenza viruses tested (>99%) show susceptibility to oseltamivir and peramivir. All influenza viruses tested showed susceptibility to zanamivir.
  • Influenza-like Illness Surveillance:The proportion of outpatient visits for influenza-like illness (ILI) decreased to 2.8%, and remains above the national baseline of 2.2%. Nine of 10 regions reported ILI at or above their region-specific baseline level.
    • ILI State Activity Indictor Map: Four states experienced high ILI activity; eight states experienced moderate ILI activity; New York City and 21 states experienced low ILI activity; the District of Columbia, Puerto Rico and 17 states experienced minimal ILI activity; and the U.S. Virgin Islands had insufficient data.
  • Geographic Spread of Influenza: The geographic spread of influenza in 20 states was reported as widespread; Puerto Rico and 25 states reported regional activity; the District of Columbia and five states reported local activity; the U.S. Virgin Islands reported sporadic activity; Guam did not report.
  • Influenza-associated Hospitalizations A cumulative rate of 59.9 laboratory-confirmed influenza-associated hospitalizations per 100,000 population was reported. The highest hospitalization rate is among adults 65 years and older (195.9 hospitalizations per 100,000 population).
  • Pneumonia and Influenza Mortality: The proportion of deaths attributed to pneumonia and influenza (P&I) was below the system-specific epidemic threshold in the National Center for Health Statistics (NCHS) Mortality Surveillance System.
  • Influenza-associated Pediatric Deaths: Four influenza-associated pediatric deaths were reported to CDC during week 14.
[h=3]National and Regional Summary of Select Surveillance Components[/h]
[TABLE="class: table table-bordered opt-in, width: 100%"]
[TR]
[/TR]
[TR]
HHS Surveillance Regions* Data for current week National data is for the current week
Regional data is for the most recent three weeks
[/TR]
[TR]
Out-patient ILI? Number of jurisdictions reporting regional or widespread activity? % respiratory specimens positive for flu in clinical laboratories Predominant flu virus reported by public health laboratories [/TR]
[TR]
[/TR]
[TR]
Nation [TD]Elevated[/TD]
[TD]46 of 54[/TD]
[TD]15.1%[/TD]
[TD]Influenza A(H3)[/TD]
[/TR]
[TR]
Region 1 [TD]Elevated[/TD]
[TD]6 of 6[/TD]
[TD]20.2%[/TD]
[TD]Influenza A(H3)[/TD]
[/TR]
[TR]
Region 2 [TD]Elevated[/TD]
[TD]3 of 4[/TD]
[TD]17.2%[/TD]
[TD]Influenza A(H3)[/TD]
[/TR]
[TR]
Region 3 [TD]Elevated[/TD]
[TD]5 of 6[/TD]
[TD]18.2%[/TD]
[TD]Influenza A(H3)[/TD]
[/TR]
[TR]
Region 4 [TD]Elevated[/TD]
[TD]7 of 8[/TD]
[TD]11.2%[/TD]
[TD]Influenza A(H3)[/TD]
[/TR]
[TR]
Region 5 [TD]Elevated[/TD]
[TD]6 of 6[/TD]
[TD]26.7%[/TD]
[TD]Influenza A(H3)[/TD]
[/TR]
[TR]
Region 6 [TD]Normal[/TD]
[TD]4 of 5[/TD]
[TD]13.6%[/TD]
[TD]Influenza A(H3)[/TD]
[/TR]
[TR]
Region 7 [TD]Elevated[/TD]
[TD]3 of 4[/TD]
[TD]19.8%[/TD]
[TD]Influenza A(H3)[/TD]
[/TR]
[TR]
Region 8 [TD]Elevated[/TD]
[TD]5 of 6[/TD]
[TD]17.1%[/TD]
[TD]Influenza A(H3)[/TD]
[/TR]
[TR]
Region 9 [TD]Elevated[/TD]
[TD]4 of 5[/TD]
[TD]11.0%[/TD]
[TD]Influenza A(H3)[/TD]
[/TR]
[TR]
Region 10 [TD]Elevated[/TD]
[TD]3 of 4[/TD]
[TD]27.0%[/TD]
[TD]Influenza A(H3)[/TD]
[/TR]
[/TABLE]
*https://www.hhs.gov/about/agencies/iea/regional-offices/index.html
? Elevated means the % of visits for ILI is at or above the national or region-specific baseline
? Includes all 50 states, the District of Columbia, Guam, Puerto Rico, and U.S. Virgin Islands

[h=2]U.S. Virologic Surveillance:[/h] WHO and NREVSS collaborating laboratories, which include both public health and clinical laboratories located in all 50 states, Puerto Rico, Guam, and the District of Columbia, report to CDC the total number of respiratory specimens tested for influenza and the number positive for influenza by virus type. In addition, public health laboratories also report the influenza A subtype (H1 or H3) and influenza B lineage information of the viruses they test and the age or age group of the persons from whom the specimens were collected.
Additional virologic data, including national, regional and select state-level data, can be found at: http://gis.cdc.gov/grasp/fluview/fluportaldashboard.html. Age group proportions and totals by influenza subtype reported by public health laboratories can be found at: http://gis.cdc.gov/grasp/fluview/flu_by_age_virus.html.
The results of tests performed by clinical laboratories are summarized below.
[TABLE="class: table table-bordered table-condensed opt-in, width: 100%"]
[TR]
[TD="width: 200"] [/TD]
Week 14 Data Cumulative since
September 30, 2018 (Week 40) [/TR]
[TR]
No. of specimens tested [TD]26,127[/TD]
[TD]986,085[/TD]
[/TR]
[TR]
No. of positive specimens (%) [TD]3,957 (15.1%)[/TD]
[TD]162,150 (16.4%)[/TD]
[/TR]
[TR]
Positive specimens by type [TD] [/TD]
[TD] [/TD]
[/TR]
[TR]
Influenza A [TD]3,570 (90.2%)[/TD]
[TD]155,300 (95.8%)[/TD]
[/TR]
[TR]
Influenza B [TD]387 (9.8%)[/TD]
[TD]6,850 (4.2%)[/TD]
[/TR]
[/TABLE]

View National and Regional Level Graphs and Data | View Chart Data | View Full Screen | View PowerPoint Presentation The results of tests performed by public health laboratories are summarized below.
[TABLE="class: table table-bordered table-condensed opt-in, width: 100%"]
[TR]
[TD] [/TD]
Week 14 Data Cumulative since
September 30, 2018 (Week 40) [/TR]
[TR]
No. of specimens tested [TD]1,090[/TD]
[TD]69,291[/TD]
[/TR]
[TR]
No. of positive specimens* [TD]720[/TD]
[TD]37,155[/TD]
[/TR]
[TR]
Positive specimens by type/subtype [TD] [/TD]
[TD] [/TD]
[/TR]
[TR]
[/TR]
[TR]
Influenza A [TD]477 (88.7%)[/TD]
[TD]36,030 (97.0%)[/TD]
[/TR]
[TR]
(H1N1)pdm09 [TD]104 (23.2%)[/TD]
[TD]20,538 (59.3%)[/TD]
[/TR]
[TR]
H3N2 [TD]345 (76.8%)[/TD]
[TD]14,102 (40.7%)[/TD]
[/TR]
[TR]
Subtyping not performed [TD]28[/TD]
[TD]1,390[/TD]
[/TR]
[TR]
[/TR]
[TR]
Influenza B [TD]61 (11.3%)[/TD]
[TD]1,125 (3.0%)[/TD]
[/TR]
[TR]
Yamagata lineage [TD]5 (11.1%)[/TD]
[TD]311 (42.1%)[/TD]
[/TR]
[TR]
Victoria lineage [TD]40 (88.9%)[/TD]
[TD]428 (57.9%)[/TD]
[/TR]
[TR]
Lineage not performed [TD]16[/TD]
[TD]386[/TD]
[/TR]
[/TABLE]
*The percent of specimens testing positive for influenza is not reported because public health laboratories often receive samples that have already tested positive for influenza at a clinical laboratory and therefore percent positive would not be a valid indicator of influenza activity. Additional information is available at http://www.cdc.gov/flu/weekly/overview.htm.


View National and Regional Level Graphs and Data | View Chart Data | View Full Screen | View PowerPoint Presentation [h=2]Influenza Virus Characterization:[/h] Close monitoring of influenza viruses is required to better assess the potential impact on public health. CDC characterizes influenza viruses through one or more tests including genomic sequencing, hemagglutination inhibition (HI) and/or neutralization based Focus Reduction assays (FRA). These data are used to compare how similar currently circulating influenza viruses are to the reference viruses used for developing new influenza vaccines and to monitor evolutionary changes that continually occur in influenza viruses circulating in humans. Antigenic and genetic characterization of circulating influenza viruses gives an indication of the influenza vaccine's ability to induce an immune response against the wide array of influenza viruses that are co-circulating every season. However, annual vaccine effectiveness estimates are needed to determine how much protection was provided to the population by vaccination. On February 14, 2019, interim influenza effectiveness estimates for the 2018-2019 season were released and are available here.
For nearly all influenza-positive surveillance samples received at CDC, next-generation sequencing is performed to determine the genetic identity of circulating influenza viruses and to monitor the evolutionary trajectory of viruses circulating in our population. Virus gene segments are classified into genetic clades/subclades based on phylogenetic analysis. However, genetic changes that classify the clades/subclades do not always result in antigenic changes. ?Antigenic drift? is a term used to describe gradual antigenic change that occurs as viruses evolve changes to escape host immune pressure. Antigenic drift is evaluated by comparing antigenic properties of cell-propagated reference viruses representing currently recommended vaccine components with those of cell-propagated circulating viruses.
CDC has antigenically or genetically characterized 1,838 influenza viruses collected September 30, 2018 ? April 6, 2019, and submitted by U.S. laboratories, including 932 influenza A(H1N1)pdm09 viruses, 676 influenza A(H3N2) viruses, and 230 influenza B viruses.
Influenza A Viruses
Influenza B Viruses

The majority of U.S. viruses submitted for characterization come from state and local public health laboratories. Due to Right Size Roadmapconsiderations, specimen submission guidance to laboratories is that, if available, 2 influenza A(H1N1)pdm09, 2 influenza A(H3N2), and 2 influenza B viruses be submitted every other week. Therefore, the numbers of each virus type/subtype characterized should be more balanced across subtypes/lineages but will not reflect the actual proportion of circulating viruses. In the figure below, the results of tests performed by public health labs are shown on the left and CDC sequence results (by genetic clade/subclade) are shown on the right.
Genetic14_small.gif

View Chart Data | View Full Screen | View PowerPoint Presentation
    • A (H1N1)pdm09: Phylogenetic analysis of the HA genes from 932 A(H1N1)pdm09 viruses showed that all belonged to clade 6B.1. Three hundred and four A(H1N1)pdm09 viruses were antigenically characterized, and 295 (97%) were antigenically similar (analyzed using HI with ferret antisera) to A/Michigan/45/2015 (6B.1), a cell-propagated A/Michigan/45/2015-like reference virus representing the A(H1N1)pdm09 component for the 2018-19 Northern Hemisphere influenza vaccines.
    • A (H3N2): Phylogenetic analysis of the HA genes from 676 A(H3N2) viruses revealed extensive genetic diversity with multiple clades/subclades co-circulating. The HA genes of circulating viruses belonged to clade 3C.2a (n=66), subclade 3C.2a1 (n=148) or clade 3C.3a (n=462). Two hundred ninety-four A(H3N2) viruses were antigenically characterized by FRA with ferret antisera, and 162 (55.1%) A(H3N2) viruses tested were well-inhibited (reacting at titers that were within 4-fold of the homologous virus titer) by ferret antisera raised against A/Singapore/INFIMH-16-0019/2016 (3C.2a1), a cell-propagated reference virus representing the A(H3N2) component of 2018-19 Northern Hemisphere influenza vaccines. One hundred thirty-two (44.9%) viruses reacted poorly (at titers that were 8-fold or greater reduced compared with that of the homologous virus A/Singapore/INFIMH-16-0019/2016) and of those, 131 (99.2%) belonged to clade 3C.3a.
    • B/Victoria: Phylogenetic analysis of 113 B/Victoria-lineage viruses indicate that all HA genes belonged to genetic clade V1A, however genetic subclades which are antigenically distinct have emerged. Genetic subclades which are antigenically distinct include viruses with a two amino acid deletion (162-163) in the HA protein (V1A.1, previously abbreviated as V1A-2Del) and viruses with a three amino acid deletion (162-164) in the HA protein (abbreviated as V1A-3Del). Eighty-three B/Victoria lineage viruses were antigenically characterized and 63 (75.9%) were antigenically similar with ferret antisera raised against cell-propagated B/Colorado/06/2017-like V1A.1 reference virus. Twenty (24.1%) reacted poorly (at titers that were 8-fold or greater reduced compared with the homologous virus titer) and belonged to clade V1A or genetic subclade V1A-3Del.
    • B/Yamagata: Phylogenetic analysis of 117 influenza B/Yamagata-lineage viruses indicate that the HA genes belonged to clade Y3. A total of 100 influenza B/Yamagata-lineage viruses were antigenically characterized, and all were antigenically similar to cell-propagated B/Phuket/3073/2013 (Y3), the reference vaccine virus representing the influenza B/Yamagata-lineage component of the 2018-19 Northern Hemisphere quadrivalent vaccines.
    [h=2]Antiviral Resistance:[/h] Testing of influenza A(H1N1)pdm09, influenza A(H3N2), and influenza B viruses for resistance to the neuraminidase inhibitors (oseltamivir, zanamivir, and peramivir) is performed at CDC using next-generation sequencing analysis and/or a functional assay. Neuraminidase sequences of viruses are inspected to detect the presence of amino acid substitutions,previously associated with reduced or highly reduced inhibition by any of three neuraminidase inhibitors.In addition, a subset of viruses are tested using the neuraminidase inhibition assay with three neuraminidase inhibitors. The level of neuraminidase activity inhibition is reported using the thresholds recommended by the World Health Organization Expert Working Group of the Global Influenza Surveillance and Response System (GISRS)These samples are routinely obtained for surveillance purposes rather than for diagnostic testing of patients suspected to be infected with an antiviral-resistant virus.
    Reporting of baloxavir susceptibility testing for the 2018-2019 influenza season will begin later this season. More information regarding influenza antiviral drug resistance can be found here.
    High levels of resistance to the adamantanes (amantadine and rimantadine) persist among influenza A(H1N1)pdm09 and influenza A(H3N2) viruses (the adamantanes are not effective against influenza B viruses). Therefore, data from adamantane resistance testing are not presented below.
    [h=3]Assessment of Virus Susceptibility to Neuraminidase Inhibitors Using Next-Generation Sequencing Analysis and/or Neuraminidase Inhibition Assay[/h]
    [TABLE="class: table table-bordered opt-in, width: 100%"]
    [TR]
    Type/Subtype or Lineage Inhibition of Neuraminidase Activity by Antiviral Drug [/TR]
    [TR]
    [TD="colspan: 3"]Oseltamivir[/TD]
    [TD="colspan: 3"]Peramivir[/TD]
    [TD="colspan: 3"]Zanamivir[/TD]
    [/TR]
    [TR]
    Virus Tested (n) Reduced, Number (%) Highly Reduced, Number (%) Virus Tested (n) Reduced, Number (%) Highly Reduced, Number (%) Virus Tested (n) Reduced, Number (%) Highly Reduced, Number (%) [/TR]
    [TR]
    Total Viruses [TD]1,812[/TD]
    [TD]2 (0.1%)[/TD]
    [TD]3 (0.2%)[/TD]
    [TD]1,812[/TD]
    [TD]0 (0%)[/TD]
    [TD]3 (0.2%)[/TD]
    [TD]1,812[/TD]
    [TD]0 (0%)[/TD]
    [TD]0 (0%)[/TD]
    [/TR]
    [TR]
    A(H1N1)pdm09 [TD]923[/TD]
    [TD]2 (0.2%)[/TD]
    [TD]3 (0.3%)[/TD]
    [TD]923[/TD]
    [TD]0 (0%)[/TD]
    [TD]3 (0.3%)[/TD]
    [TD]923[/TD]
    [TD]0 (0%)[/TD]
    [TD]0 (0%)[/TD]
    [/TR]
    [TR]
    A(H3N2) [TD]669[/TD]
    [TD]0 (0%)[/TD]
    [TD]0 (0%)[/TD]
    [TD]669[/TD]
    [TD]0 (0%)[/TD]
    [TD]0 (0%)[/TD]
    [TD]669[/TD]
    [TD]0 (0%)[/TD]
    [TD]0 (0%)[/TD]
    [/TR]
    [TR]
    B/Victoria [TD]105[/TD]
    [TD]0 (0%)[/TD]
    [TD]0 (0%)[/TD]
    [TD]105[/TD]
    [TD]0 (0%)[/TD]
    [TD]0 (0%)[/TD]
    [TD]105[/TD]
    [TD]0 (0%)[/TD]
    [TD]0 (0%)[/TD]
    [/TR]
    [TR]
    B/Yamagata [TD]115[/TD]
    [TD]0 (0%)[/TD]
    [TD]0 (0%)[/TD]
    [TD]115[/TD]
    [TD]0 (0%)[/TD]
    [TD]0 (0%)[/TD]
    [TD]115[/TD]
    [TD]0 (0%)[/TD]
    [TD]0 (0%)[/TD]
    [/TR]
    [/TABLE]
    Antiviral treatment as early as possible is recommended for patients with confirmed or suspected influenza who have severe, complicated, or progressive illness; who require hospitalization; or who are at high risk for serious influenza-related complications. Additional information on recommendations for treatment and chemoprophylaxis of influenza virus infection with antiviral agents is available at:http://www.cdc.gov/flu/antivirals/index.htm.


    [h=2]Outpatient Illness Surveillance:[/h] Nationwide during week 14, 2.8% of patient visits reported through the U.S. Outpatient Influenza-like Illness Surveillance Network (ILINet) were due to influenza-like illness (ILI). This percentage is above the national baseline of 2.2%.(ILI is defined as fever (temperature of 100?F [37.8?C] or greater) and cough and/or sore throat.)
    On a regional level, the percentage of outpatient visits for ILI ranged from 1.9% to 3.9% during week 14. Nine of 10 regions (Regions 1-5 and 7-10) reported a percentage of outpatient visits for ILI at or above their region-specific baseline.
    Additional data on medically attended visits for ILI for current and past seasons and by geography (national, HHS region, or select states) are available on FluView Interactive http://gis.cdc.gov/grasp/fluview/fluportaldashboard.html.

    View National and Regional Level Graphs and Data | View Chart Data | View Full Screen | View PowerPoint Presentation


    [h=2]ILINet State Activity Indicator Map:[/h] Data collected in ILINet are used to produce a measure of ILI activity* by state. Activity levels are based on the percent of outpatient visits in a state due to ILI and are compared to the average percent of ILI visits that occur during weeks with little or no influenza virus circulation. Activity levels range from minimal, which would correspond to ILI activity from outpatient clinics being below, or only slightly above, the average, to high, which would correspond to ILI activity from outpatient clinics being much higher than average.
    The ILI Activity Indicator Map displays state-specific activity levels for multiple seasons and allows a visual representation of relative activity from state to state. More information is available on FluView Interactive at https://gis.cdc.gov/grasp/fluview/main.html.
    During week 14, the following ILI activity levels were experienced:


    *This map uses the proportion of outpatient visits to health care providers for ILI to measure the ILI activity level within a state. It does not, however, measure the extent of geographic spread of flu within a state. Therefore, outbreaks occurring in a single city could cause the state to display high activity levels.
    Data collected in ILINet may disproportionally represent certain populations within a state, and therefore, may not accurately depict the full picture of influenza activity for the whole state.
    Data displayed in this map are based on data collected in ILINet, whereas the State and Territorial flu activity map is based on reports from state and territorial epidemiologists. The data presented in this map are preliminary and may change as more data are received.
    Differences in the data presented here by CDC and independently by some state health departments likely represent differing levels of data completeness with data presented by the state likely being the more complete.


    [h=2]Geographic Spread of Influenza as Assessed by State and Territorial Epidemiologists[/h] The influenza activity reported by state and territorial epidemiologists indicates geographic spread of influenza viruses, but does not measure the severity of influenza activity. Additional data displaying the influenza activity reported by state and territorial epidemiologists for the current and past seasons are available on FluView Interactive at https://gis.cdc.gov/grasp/fluview/FluView8.html
    During week 14, the following influenza activity was reported:
      • Four states (Louisiana, Missouri, South Carolina and Virginia) experienced high ILI activity.
      • Eight states (Connecticut, Kentucky, Michigan, New York, Rhode Island, Utah, West Virginia, and Wisconsin) experienced moderate ILI activity.
      • New York City and 21 states (Alabama, Arizona, Arkansas, California, Colorado, Georgia, Hawaii, Illinois, Maine, Massachusetts, Nebraska, Nevada, New Jersey, New Mexico, North Carolina, Oklahoma, Oregon, Pennsylvania, Texas, Washington and Wyoming) experienced low ILI activity.
      • The District of Columbia, Puerto Rico and 17 states (Alaska, Delaware, Florida, Idaho, Indiana, Iowa, Kansas, Maryland, Minnesota, Mississippi, Montana, New Hampshire, North Dakota, Ohio, South Dakota, Tennessee and Vermont) experienced minimal ILI activity.
      • Data were insufficient to calculate an ILI activity level from the U.S. Virgin Islands.
      • Widespread influenza activity was reported by 20 states (Arizona, California, Connecticut, Delaware, Georgia, Maine, Maryland, Massachusetts, Michigan, Nevada, New Hampshire, New Jersey, New York, North Carolina, Ohio, Rhode Island, South Carolina, Virginia, Washington and Wisconsin).
      • Regional influenza activity was reported by Puerto Rico and 25 states (Arkansas, Colorado, Florida, Hawaii, Idaho, Illinois, Indiana, Iowa, Kansas, Kentucky, Louisiana, Minnesota, Mississippi, Missouri, Montana, New Mexico, North Dakota, Oklahoma, Oregon, Pennsylvania, Tennessee, Utah, Vermont, West Virginia and Wyoming).
      • Local influenza activity was reported by the District of Columbia and one state (Hawaii).
      • Sporadic influenza activity was reported by the U.S. Virgin Islands.
      • Guam did not report.
        [h=2]Influenza-Associated Hospitalizations:[/h] The Influenza Hospitalization Surveillance Network (FluSurv-NET) conducts population-based surveillance for laboratory-confirmed influenza-related hospitalizations in select counties in the Emerging Infections Program (EIP) states and Influenza Hospitalization Surveillance Project (IHSP) states.
        A total of 17,295 laboratory-confirmed influenza-associated hospitalizations were reported by FluSurv-NET sites between October 1, 2018 and April 6, 2019. The overall hospitalization rate was 59.9 per 100,000 population. The highest rate of hospitalization was among adults aged ≥65 (195.9 per 100,000 population), followed by adults aged 50-64 (75.5 per 100,000 population) and children aged 0-4 (69.1 per 100,000 population). Among 17,295 hospitalizations, 16,592 (95.9%) were associated with influenza A virus, 569 (3.3%) with influenza B virus, 36 (0.2%) with influenza A virus and influenza B virus co-infection, and 98 (0.6%) with influenza virus for which the type was not determined. Among those with influenza A subtype information, 2,850 (55.9%) were A(H1N1)pdm09 virus and 2,249 (44.1%) were A(H3N2).
        Among 2,812 hospitalized adults with information on underlying medical conditions, 2,538(90.3%) had at least one reported underlying medical condition; the most commonly reported were metabolic disorder, cardiovascular disease, and obesity. Among 496 hospitalized children with information on underlying medical conditions, 248 (50.0%) had at least one underlying medical condition; the most commonly reported was asthma. Among 421 hospitalized women of childbearing age (15-44 years) with information on pregnancy status, 115 (27.3%) were pregnant.
        Additional FluSurv-NET data displaying hospitalization rates for the current and past seasons and different age groups (including rates for patients 65-74 years, 74-84 years, and 85 years of age and older), as well as data on patient characteristics (such as influenza virus type, demographic, and clinical information), are available on FluView Interactive at: http://gis.cdc.gov/GRASP/Fluview/FluHospRates.html and http://gis.cdc.gov/grasp/fluview/FluHospChars.html.
        FluSurv-Net data is used to generate national estimates of the total numbers of flu cases, medical visits, hospitalizations, and deaths. This season, CDC is reporting preliminary cumulative in-season estimates, which are available athttps://cdc.gov/flu/about/burden/preliminary-in-season-estimates.htm.
        [SIZE=1.5]Data from the Influenza Hospitalization Surveillance Network (FluSurv-NET), a population-based surveillance for influenza related hospitalizations in children and adults in 13 U.S. states. Cumulative incidence rates are calculated using the National Center for Health Statistics? (NCHS) population estimates for the counties included in the surveillance catchment area.

      • View Interactive Application | View Full Screen | View PowerPoint Presentation
        [SIZE=1.5]FluSurv-NET data are preliminary and displayed as they become available. Therefore, figures are based on varying denominators as some variables represent information that may require more time to be collected. Data are refreshed and updated weekly. Asthma includes a medical diagnosis of asthma or reactive airway disease; Cardiovascular diseases include conditions such as coronary heart disease, cardiac valve disorders, congestive heart failure, and pulmonary hypertension; does not include isolated hypertension; Chronic lung diseases include conditions such as chronic obstructive pulmonary disease, bronchiolitis obliterans, chronic aspiration pneumonia, and interstitial lung disease; Immune suppression includes conditions such as immunoglobulin deficiency, leukemia, lymphoma, HIV/AIDS, and individuals taking immunosuppressive medications; Metabolic disorders include conditions such as diabetes mellitus; Neurologic diseases include conditions such as seizure disorders, cerebral palsy, and cognitive dysfunction; Neuromuscular diseases include conditions such as multiple sclerosis and muscular dystrophy; Obesity was assigned if indicated in patient's medical chart or if body mass index (BMI) >30 kg/m2; Pregnancy percentage calculated using number of female cases aged between 15 and 44 years of age as the denominator; Renal diseases include conditions such as acute or chronic renal failure, nephrotic syndrome, glomerulonephritis, and impaired creatinine clearance; No known condition indicates that the case did not have any known high risk medical condition indicated in medical chart at the time of hospitalization.[/SIZE]
        View Interactive Application | View Full Screen | View PowerPoint Presentation

        [h=2]Pneumonia and Influenza (P&I) Mortality Surveillance:[/h] Based on National Center for Health Statistics (NCHS) mortality surveillance data available on April 11, 2019, 7.0% of the deaths occurring during the week ending March 30, 2019 (week 13) were due to P&I. This percentage is below the epidemic threshold of 7.1% for week 13.
        Additional pneumonia and influenza mortality data for current and past seasons and by geography (national, HHS region, or state) are available on FluView Interactive http://gis.cdc.gov/grasp/fluview/mortality.html. Data displayed on the regional and state-level are aggregated by the state of residence of the decedent.
        NCHS14_small.gif

        View Regional and State Level Data | View Chart Data | View Full Screen | View PowerPoint Presentation

        [h=2]Influenza-Associated Pediatric Mortality:[/h] Four influenza-associated pediatric deaths were reported to CDC during week 14. One death was associated with an influenza A(H1N1)pdm09 virus and occurred during week 12 (the week ending March 23, 2019). One death was associated with an influenza A(H3) virus and occurred during week 6 (the week ending February 9, 2019). Two deaths were associated with an influenza A virus for which no subtyping was performed and occurred during weeks 13 and 14 (the weeks ending March 30 and April 6, 2019, respectively).
        A total of 86 influenza-associated pediatric deaths occurring during the 2018-2019 season have been reported to CDC.
        Additional information on influenza-associated pediatric deaths including basic demographics, underlying conditions, bacterial co-infections, and place of death for the current and past seasons, is available on FluView Interactivehttp://gis.cdc.gov/GRASP/Fluview/PedFluDeath.html.

        View Interactive Application | View Full Screen | View PowerPoint Presentation


        [h=2]Additional National and International Influenza Surveillance Information[/h] FluView Interactive: FluView includes enhanced web-based interactive applications that can provide dynamic visuals of the influenza data collected and analyzed by CDC. These FluView Interactive applications allow people to create customized, visual interpretations of influenza data, as well as make comparisons across flu seasons, regions, age groups and a variety of other demographics. To access these tools, visit http://www.cdc.gov/flu/weekly/fluviewinteractive.htm.
        U.S. State and local influenza surveillance: Click on a jurisdiction below to access the latest local influenza information.

        [TABLE="width: 100%"]
        [TR]
        [TD="width: 139"] Alabama
        [/TD]
        [TD="width: 139"] Alaska
        [/TD]
        [TD="width: 139"] Arizona
        [/TD]
        [TD="width: 139"] Arkansas
        [/TD]
        [TD="width: 139"] California
        [/TD]
        [/TR]
        [TR]
        [TD="width: 139"] Colorado
        [/TD]
        [TD="width: 139"] Connecticut
        [/TD]
        [TD="width: 139"] Delaware
        [/TD]
        [TD="width: 139"] District of Columbia
        [/TD]
        [TD="width: 139"] Florida
        [/TD]
        [/TR]
        [TR]
        [TD="width: 139"] Georgia
        [/TD]
        [TD="width: 139"] Hawaii
        [/TD]
        [TD="width: 139"] Idaho
        [/TD]
        [TD="width: 139"] Illinois
        [/TD]
        [TD="width: 139"] Indiana
        [/TD]
        [/TR]
        [TR]
        [TD="width: 139"] Iowa
        [/TD]
        [TD="width: 139"] Kansas
        [/TD]
        [TD="width: 139"] Kentucky
        [/TD]
        [TD="width: 139"] Louisiana
        [/TD]
        [TD="width: 139"] Maine
        [/TD]
        [/TR]
        [TR]
        [TD="width: 139"] Maryland
        [/TD]
        [TD="width: 139"] Massachusetts
        [/TD]
        [TD="width: 139"] Michigan
        [/TD]
        [TD="width: 139"] Minnesota
        [/TD]
        [TD="width: 139"] Mississippi
        [/TD]
        [/TR]
        [TR]
        [TD="width: 139"] Missouri
        [/TD]
        [TD="width: 139"] Montana
        [/TD]
        [TD="width: 139"] Nebraska
        [/TD]
        [TD="width: 139"] Nevada
        [/TD]
        [TD="width: 139"] New Hampshire
        [/TD]
        [/TR]
        [TR]
        [TD="width: 139"] New Jersey
        [/TD]
        [TD="width: 139"] New Mexico
        [/TD]
        [TD="width: 139"] New York
        [/TD]
        [TD="width: 139"] North Carolina
        [/TD]
        [TD="width: 139"] North Dakota
        [/TD]
        [/TR]
        [TR]
        [TD="width: 139"] Ohio
        [/TD]
        [TD="width: 139"] Oklahoma
        [/TD]
        [TD="width: 139"] Oregon
        [/TD]
        [TD="width: 139"] Pennsylvania
        [/TD]
        [TD="width: 139"] Rhode Island
        [/TD]
        [/TR]
        [TR]
        [TD="width: 139"] South Carolina
        [/TD]
        [TD="width: 139"] South Dakota
        [/TD]
        [TD="width: 139"] Tennessee
        [/TD]
        [TD="width: 139"] Texas
        [/TD]
        [TD="width: 139"] Utah
        [/TD]
        [/TR]
        [TR]
        [TD="width: 139"] Vermont
        [/TD]
        [TD="width: 139"] Virginia
        [/TD]
        [TD="width: 139"] Washington
        [/TD]
        [TD="width: 139"] West Virginia
        [/TD]
        [TD="width: 139"] Wisconsin
        [/TD]
        [/TR]
        [TR]
        [TD="width: 139"] Wyoming
        [/TD]
        [TD="width: 139"] New York City
        [/TD]
        [TD="width: 139"] Puerto Rico
        [/TD]
        [TD="width: 139"] Virgin Islands
        [/TD]
        [TD="width: 139"] [/TD]
        [/TR]
        [/TABLE]
        World Health Organization: Additional influenza surveillance information from participating WHO member nations is available throughFluNet and the Global Epidemiology Reports.
        WHO Collaborating Centers for Influenza located in Australia, China, Japan, the United Kingdom, and the United States (CDC in Atlanta, Georgia).
        Europe: For the most recent influenza surveillance information from Europe, please see WHO/Europe and the European Centre for Disease Prevention and Control at http://www.flunewseurope.org/.
        Public Health Agency of Canada: The most up-to-date influenza information from Canada is available at http://www.phac-aspc.gc.ca/fluwatch/
        Public Health England: The most up-to-date influenza information from the United Kingdom is available athttps://www.gov.uk/government/statistics/weekly-national-flu-reports
        • Any links provided to non-Federal organizations are provided solely as a service to our users. These links do not constitute an endorsement of these organizations or their programs by CDC or the Federal Government, and none should be inferred. CDC is not responsible for the content of the individual organization web pages found at these links.
          An overview of the CDC influenza surveillance system, including methodology and detailed descriptions of each data component, is available at: http://www.cdc.gov/flu/weekly/overview.htm.
          https://www.cdc.gov/flu/weekly/index.htm


[/SIZE]
 
[h=1]Weekly U.S. Influenza Surveillance Report[/h]
Language: English (US)


Recommend on FacebookTweet


fluview_hdr.jpg

[h=3]2018-2019 Influenza Season Week 15 ending April 13, 2019[/h] All data are preliminary and may change as more reports are received.
An overview of the CDC influenza surveillance system, including methodology and detailed descriptions of each data component, is available at http://www.cdc.gov/flu/weekly/overview.htm.
[h=3]Synopsis:[/h] Influenza activity continues to decrease in the United States, but remains elevated. Influenza A(H1N1)pdm09 viruses predominated from October to mid-February, and influenza A(H3N2) viruses have been more commonly identified since late February. Small numbers of influenza B viruses also have been reported. Below is a summary of the key influenza indicators for the week ending April 13, 2019:
  • Viral Surveillance:The percentage of respiratory specimens testing positive for influenza viruses in clinical laboratories decreased. During the most recent three weeks, influenza A(H3) viruses were reported more frequently than influenza A(H1N1)pdm09 viruses nationally, and in all 10 HHS Regions.
    • Virus Characterization:The majority of influenza A(H1N1)pdm09 and influenza B viruses characterized antigenically are similar to the cell-grown reference viruses representing the 2018?2019 Northern Hemisphere influenza vaccine viruses. However, the majority of influenza A(H3N2) viruses are antigenically distinguishable from A/Singapore/INFIMH-16-0019/2016 (3C.2a1), a cell-propagated reference virus representing the A(H3N2) component of 2018-19 Northern Hemisphere influenza vaccines.
    • Antiviral Resistance:The vast majority of influenza viruses tested (>99%) show susceptibility to oseltamivir and peramivir. All influenza viruses tested showed susceptibility to zanamivir.
  • Influenza-like Illness Surveillance:The proportion of outpatient visits for influenza-like illness (ILI) decreased to 2.4%, but remains above the national baseline of 2.2%. Seven of 10 regions reported ILI at or above their region-specific baseline level.
    • ILI State Activity Indictor Map: One state experienced high ILI activity; five states experienced moderate ILI activity; New York City, Puerto Rico and 14 states experienced low ILI activity; the District of Columbia and 30 states experienced minimal ILI activity; and the U.S. Virgin Islands had insufficient data.
  • Geographic Spread of Influenza: The geographic spread of influenza in 11 states was reported as widespread; Puerto Rico and 20 states reported regional activity; the District of Columbia and 17 states reported local activity; the U.S. Virgin Islands and two states reported sporadic activity; Guam did not report.
  • Influenza-associated Hospitalizations A cumulative rate of 62.3 laboratory-confirmed influenza-associated hospitalizations per 100,000 population was reported. The highest hospitalization rate is among adults 65 years and older (206.5 hospitalizations per 100,000 population).
  • Pneumonia and Influenza Mortality: The proportion of deaths attributed to pneumonia and influenza (P&I) was below the system-specific epidemic threshold in the National Center for Health Statistics (NCHS) Mortality Surveillance System.
  • Influenza-associated Pediatric Deaths: Five influenza-associated pediatric deaths were reported to CDC during week 15.
[h=3]National and Regional Summary of Select Surveillance Components[/h]
[TABLE="class: table table-bordered opt-in, width: 100%"]
[TR]
[/TR]
[TR]
HHS Surveillance Regions* Data for current week National data is for the current week
Regional data is for the most recent three weeks
[/TR]
[TR]
Out-patient ILI? Number of jurisdictions reporting regional or widespread activity? % respiratory specimens positive for flu in clinical laboratories Predominant flu virus reported by public health laboratories [/TR]
[TR]
[/TR]
[TR]
Nation [TD]Elevated[/TD]
[TD]32 of 54[/TD]
[TD]11.8%[/TD]
[TD]Influenza A(H3)[/TD]
[/TR]
[TR]
Region 1 [TD]Elevated[/TD]
[TD]5 of 6[/TD]
[TD]19.9%[/TD]
[TD]Influenza A(H3)[/TD]
[/TR]
[TR]
Region 2 [TD]Elevated[/TD]
[TD]3 of 4[/TD]
[TD]15.0%[/TD]
[TD]Influenza A(H3)[/TD]
[/TR]
[TR]
Region 3 [TD]Elevated[/TD]
[TD]4 of 6[/TD]
[TD]14.0%[/TD]
[TD]Influenza A(H3)[/TD]
[/TR]
[TR]
Region 4 [TD]Normal[/TD]
[TD]6 of 8[/TD]
[TD]9.2%[/TD]
[TD]Influenza A(H3)[/TD]
[/TR]
[TR]
Region 5 [TD]Elevated[/TD]
[TD]4 of 6[/TD]
[TD]22.7%[/TD]
[TD]Influenza A(H3)[/TD]
[/TR]
[TR]
Region 6 [TD]Normal[/TD]
[TD]2 of 5[/TD]
[TD]10.4%[/TD]
[TD]Influenza A(H3)[/TD]
[/TR]
[TR]
Region 7 [TD]Elevated[/TD]
[TD]1 of 4[/TD]
[TD]14.0%[/TD]
[TD]Influenza A(H3)[/TD]
[/TR]
[TR]
Region 8 [TD]Elevated[/TD]
[TD]3 of 6[/TD]
[TD]12.9%[/TD]
[TD]Influenza A(H3)[/TD]
[/TR]
[TR]
Region 9 [TD]Elevated[/TD]
[TD]3 of 5[/TD]
[TD]9.1%[/TD]
[TD]Influenza A(H3)[/TD]
[/TR]
[TR]
Region 10 [TD]Normal[/TD]
[TD]1 of 4[/TD]
[TD]18.8%[/TD]
[TD]Influenza A(H3)[/TD]
[/TR]
[/TABLE]
*https://www.hhs.gov/about/agencies/iea/regional-offices/index.html
? Elevated means the % of visits for ILI is at or above the national or region-specific baseline
? Includes all 50 states, the District of Columbia, Guam, Puerto Rico, and U.S. Virgin Islands

[h=2]U.S. Virologic Surveillance:[/h] WHO and NREVSS collaborating laboratories, which include both public health and clinical laboratories located in all 50 states, Puerto Rico, Guam, and the District of Columbia, report to CDC the total number of respiratory specimens tested for influenza and the number positive for influenza by virus type. In addition, public health laboratories also report the influenza A subtype (H1 or H3) and influenza B lineage information of the viruses they test and the age or age group of the persons from whom the specimens were collected.
Additional virologic data, including national, regional and select state-level data, can be found at: http://gis.cdc.gov/grasp/fluview/fluportaldashboard.html. Age group proportions and totals by influenza subtype reported by public health laboratories can be found at: http://gis.cdc.gov/grasp/fluview/flu_by_age_virus.html.
The results of tests performed by clinical laboratories are summarized below.
[TABLE="class: table table-bordered table-condensed opt-in, width: 100%"]
[TR]
[TD="width: 200"] [/TD]
Week 15 Data Cumulative since
September 30, 2018 (Week 40) [/TR]
[TR]
No. of specimens tested [TD]22,526[/TD]
[TD]1,023,853[/TD]
[/TR]
[TR]
No. of positive specimens (%) [TD]2,669 (11.8%)[/TD]
[TD]168,344 (16.4%)[/TD]
[/TR]
[TR]
Positive specimens by type [TD] [/TD]
[TD] [/TD]
[/TR]
[TR]
Influenza A [TD]2,266 (84.9%)[/TD]
[TD]160,897 (95.6%)[/TD]
[/TR]
[TR]
Influenza B [TD]403 (15.1%)[/TD]
[TD]7,447 (4.4%)[/TD]
[/TR]
[/TABLE]

View National and Regional Level Graphs and Data | View Chart Data | View Full Screen | View PowerPoint Presentation The results of tests performed by public health laboratories are summarized below.
[TABLE="class: table table-bordered table-condensed opt-in, width: 100%"]
[TR]
[TD] [/TD]
Week 15 Data Cumulative since
September 30, 2018 (Week 40) [/TR]
[TR]
No. of specimens tested [TD]831[/TD]
[TD]71,382[/TD]
[/TR]
[TR]
No. of positive specimens* [TD]353[/TD]
[TD]38,291[/TD]
[/TR]
[TR]
Positive specimens by type/subtype [TD] [/TD]
[TD] [/TD]
[/TR]
[TR]
[/TR]
[TR]
Influenza A [TD]321 (90.9%)[/TD]
[TD]37,005 (96.6%)[/TD]
[/TR]
[TR]
(H1N1)pdm09 [TD]77 (24.6%)[/TD]
[TD]20,854 (58.6%)[/TD]
[/TR]
[TR]
H3N2 [TD]236 (75.4%)[/TD]
[TD]14,749 (41.4%)[/TD]
[/TR]
[TR]
Subtyping not performed [TD]8[/TD]
[TD]1,402[/TD]
[/TR]
[TR]
[/TR]
[TR]
Influenza B [TD]32 (9.1%)[/TD]
[TD]1,286 (3.4%)[/TD]
[/TR]
[TR]
Yamagata lineage [TD]3 (15.0%)[/TD]
[TD]319 (40.2%)[/TD]
[/TR]
[TR]
Victoria lineage [TD]17 (85.0%)[/TD]
[TD]474 (59.8%)[/TD]
[/TR]
[TR]
Lineage not performed [TD]12[/TD]
[TD]493[/TD]
[/TR]
[/TABLE]
*The percent of specimens testing positive for influenza is not reported because public health laboratories often receive samples that have already tested positive for influenza at a clinical laboratory and therefore percent positive would not be a valid indicator of influenza activity. Additional information is available at http://www.cdc.gov/flu/weekly/overview.htm.


View National and Regional Level Graphs and Data | View Chart Data | View Full Screen | View PowerPoint Presentation [h=2]Influenza Virus Characterization:[/h] Close monitoring of influenza viruses is required to better assess the potential impact on public health. CDC characterizes influenza viruses through one or more tests including genomic sequencing, hemagglutination inhibition (HI) and/or neutralization based Focus Reduction assays (FRA). These data are used to compare how similar currently circulating influenza viruses are to the reference viruses used for developing new influenza vaccines and to monitor evolutionary changes that continually occur in influenza viruses circulating in humans. Antigenic and genetic characterization of circulating influenza viruses gives an indication of the influenza vaccine's ability to induce an immune response against the wide array of influenza viruses that are co-circulating every season. However, annual vaccine effectiveness estimates are needed to determine how much protection was provided to the population by vaccination. On February 14, 2019, interim influenza effectiveness estimates for the 2018-2019 season were released and are available here.
For nearly all influenza-positive surveillance samples received at CDC, next-generation sequencing is performed to determine the genetic identity of circulating influenza viruses and to monitor the evolutionary trajectory of viruses circulating in our population. Virus gene segments are classified into genetic clades/subclades based on phylogenetic analysis. However, genetic changes that classify the clades/subclades do not always result in antigenic changes. ?Antigenic drift? is a term used to describe gradual antigenic change that occurs as viruses evolve changes to escape host immune pressure. Antigenic drift is evaluated by comparing antigenic properties of cell-propagated reference viruses representing currently recommended vaccine components with those of cell-propagated circulating viruses.
CDC has antigenically or genetically characterized 1,898 influenza viruses collected September 30, 2018 ? April 13, 2019, and submitted by U.S. laboratories, including 950 influenza A(H1N1)pdm09 viruses, 703 influenza A(H3N2) viruses, and 245 influenza B viruses.
Influenza A Viruses
Influenza B Viruses

The majority of U.S. viruses submitted for characterization come from state and local public health laboratories. Due to Right Size Roadmapconsiderations, specimen submission guidance to laboratories is that, if available, 2 influenza A(H1N1)pdm09, 2 influenza A(H3N2), and 2 influenza B viruses be submitted every other week. Therefore, the numbers of each virus type/subtype characterized should be more balanced across subtypes/lineages but will not reflect the actual proportion of circulating viruses. In the figure below, the results of tests performed by public health labs are shown on the left and CDC sequence results (by genetic clade/subclade) are shown on the right.
Genetic15_small.gif

View Chart Data | View Full Screen | View PowerPoint Presentation [h=2]2019-2020 Influenza Season - U.S. Influenza Vaccine Composition:[/h] The World Health Organization (WHO) has recommended the Northern Hemisphere 2019-2020 influenza vaccine composition, and the Food and Drug Administration?s Vaccines and Related Biological Products Advisory Committee (VRBPAC) subsequently made the influenza vaccine composition recommendation for the United States. Both agencies recommend that influenza trivalent vaccines contain:
It is recommended that quadrivalent vaccines, which have two influenza B viruses, contain the viruses recommended for the trivalent vaccines, as well as a B/Phuket/3073/2013-like (B/Yamagata lineage) virus. The (H1N1)pdm09 and H3N2 recommendations represents an update to the 2018-2019 Northern Hemisphere vaccines. These vaccine recommendations were based on several factors, including global influenza virologic and epidemiologic surveillance, genetic characterization, antigenic characterization and the candidate vaccine viruses that are available for production.
[h=2]Antiviral Resistance:[/h] Testing of influenza A(H1N1)pdm09, influenza A(H3N2), and influenza B viruses for resistance to the neuraminidase inhibitors (oseltamivir, zanamivir, and peramivir) is performed at CDC using next-generation sequencing analysis and/or a functional assay. Neuraminidase sequences of viruses are inspected to detect the presence of amino acid substitutions,previously associated with reduced or highly reduced inhibition by any of three neuraminidase inhibitors.In addition, a subset of viruses are tested using the neuraminidase inhibition assay with three neuraminidase inhibitors. The level of neuraminidase activity inhibition is reported using the thresholds recommended by the World Health Organization Expert Working Group of the Global Influenza Surveillance and Response System (GISRS)These samples are routinely obtained for surveillance purposes rather than for diagnostic testing of patients suspected to be infected with an antiviral-resistant virus.
Reporting of baloxavir susceptibility testing for the 2018-2019 influenza season will begin later this season. More information regarding influenza antiviral drug resistance can be found here.
High levels of resistance to the adamantanes (amantadine and rimantadine) persist among influenza A(H1N1)pdm09 and influenza A(H3N2) viruses (the adamantanes are not effective against influenza B viruses). Therefore, data from adamantane resistance testing are not presented below.
[h=3]Assessment of Virus Susceptibility to Neuraminidase Inhibitors Using Next-Generation Sequencing Analysis and/or Neuraminidase Inhibition Assay[/h]
[TABLE="class: table table-bordered opt-in, width: 100%"]
[TR]
Type/Subtype or Lineage Inhibition of Neuraminidase Activity by Antiviral Drug [/TR]
[TR]
[TD="colspan: 3"]Oseltamivir[/TD]
[TD="colspan: 3"]Peramivir[/TD]
[TD="colspan: 3"]Zanamivir[/TD]
[/TR]
[TR]
Virus Tested (n) Reduced, Number (%) Highly Reduced, Number (%) Virus Tested (n) Reduced, Number (%) Highly Reduced, Number (%) Virus Tested (n) Reduced, Number (%) Highly Reduced, Number (%) [/TR]
[TR]
Total Viruses [TD]1,954[/TD]
[TD]2 (0.1%)[/TD]
[TD]3 (0.2%)[/TD]
[TD]1,954[/TD]
[TD]0 (0%)[/TD]
[TD]3 (0.2%)[/TD]
[TD]1,954[/TD]
[TD]0 (0%)[/TD]
[TD]0 (0%)[/TD]
[/TR]
[TR]
A(H1N1)pdm09 [TD]968[/TD]
[TD]2 (0.2%)[/TD]
[TD]3 (0.3%)[/TD]
[TD]968[/TD]
[TD]0 (0%)[/TD]
[TD]3 (0.3%)[/TD]
[TD]968[/TD]
[TD]0 (0%)[/TD]
[TD]0 (0%)[/TD]
[/TR]
[TR]
A(H3N2) [TD]732[/TD]
[TD]0 (0%)[/TD]
[TD]0 (0%)[/TD]
[TD]732[/TD]
[TD]0 (0%)[/TD]
[TD]0 (0%)[/TD]
[TD]732[/TD]
[TD]0 (0%)[/TD]
[TD]0 (0%)[/TD]
[/TR]
[TR]
B/Victoria [TD]127[/TD]
[TD]0 (0%)[/TD]
[TD]0 (0%)[/TD]
[TD]127[/TD]
[TD]0 (0%)[/TD]
[TD]0 (0%)[/TD]
[TD]127[/TD]
[TD]0 (0%)[/TD]
[TD]0 (0%)[/TD]
[/TR]
[TR]
B/Yamagata [TD]127[/TD]
[TD]0 (0%)[/TD]
[TD]0 (0%)[/TD]
[TD]127[/TD]
[TD]0 (0%)[/TD]
[TD]0 (0%)[/TD]
[TD]127[/TD]
[TD]0 (0%)[/TD]
[TD]0 (0%)[/TD]
[/TR]
[/TABLE]
Antiviral treatment as early as possible is recommended for patients with confirmed or suspected influenza who have severe, complicated, or progressive illness; who require hospitalization; or who are at high risk for serious influenza-related complications. Additional information on recommendations for treatment and chemoprophylaxis of influenza virus infection with antiviral agents is available at:http://www.cdc.gov/flu/antivirals/index.htm.


[h=2]Outpatient Illness Surveillance:[/h] Nationwide during week 15, 2.4% of patient visits reported through the U.S. Outpatient Influenza-like Illness Surveillance Network (ILINet) were due to influenza-like illness (ILI). This percentage is above the national baseline of 2.2%.(ILI is defined as fever (temperature of 100?F [37.8?C] or greater) and cough and/or sore throat.)
On a regional level, the percentage of outpatient visits for ILI ranged from 1.0% to 3.5% during week 15. Seven of 10 regions (Regions 1, 2, 3, 5 and 7-9) reported a percentage of outpatient visits for ILI at or above their region-specific baseline.
Additional data on medically attended visits for ILI for current and past seasons and by geography (national, HHS region, or select states) are available on FluView Interactive http://gis.cdc.gov/grasp/fluview/fluportaldashboard.html.
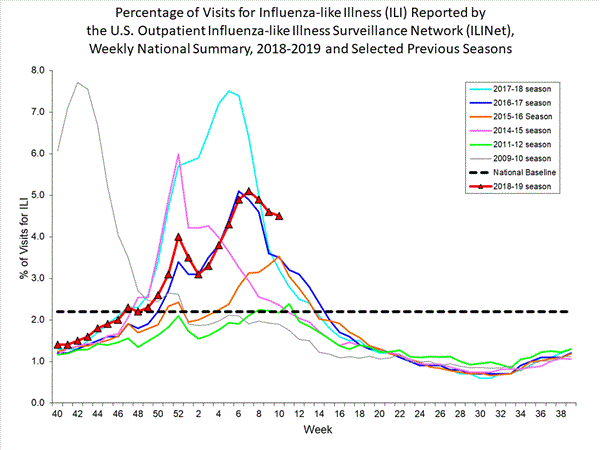
View National and Regional Level Graphs and Data | View Chart Data | View Full Screen | View PowerPoint Presentation


[h=2]ILINet State Activity Indicator Map:[/h] Data collected in ILINet are used to produce a measure of ILI activity* by state. Activity levels are based on the percent of outpatient visits in a state due to ILI and are compared to the average percent of ILI visits that occur during weeks with little or no influenza virus circulation. Activity levels range from minimal, which would correspond to ILI activity from outpatient clinics being below, or only slightly above, the average, to high, which would correspond to ILI activity from outpatient clinics being much higher than average.
The ILI Activity Indicator Map displays state-specific activity levels for multiple seasons and allows a visual representation of relative activity from state to state. More information is available on FluView Interactive at https://gis.cdc.gov/grasp/fluview/main.html.
During week 15, the following ILI activity levels were experienced:


*This map uses the proportion of outpatient visits to health care providers for ILI to measure the ILI activity level within a state. It does not, however, measure the extent of geographic spread of flu within a state. Therefore, outbreaks occurring in a single city could cause the state to display high activity levels.
Data collected in ILINet may disproportionally represent certain populations within a state, and therefore, may not accurately depict the full picture of influenza activity for the whole state.
Data displayed in this map are based on data collected in ILINet, whereas the State and Territorial flu activity map is based on reports from state and territorial epidemiologists. The data presented in this map are preliminary and may change as more data are received.
Differences in the data presented here by CDC and independently by some state health departments likely represent differing levels of data completeness with data presented by the state likely being the more complete.


[h=2]Geographic Spread of Influenza as Assessed by State and Territorial Epidemiologists[/h] The influenza activity reported by state and territorial epidemiologists indicates geographic spread of influenza viruses, but does not measure the severity of influenza activity. Additional data displaying the influenza activity reported by state and territorial epidemiologists for the current and past seasons are available on FluView Interactive at https://gis.cdc.gov/grasp/fluview/FluView8.html
During week 15, the following influenza activity was reported:
    • A (H1N1)pdm09: Phylogenetic analysis of the HA genes from 950 A(H1N1)pdm09 viruses showed that all belonged to clade 6B.1. Three hundred and four A(H1N1)pdm09 viruses were antigenically characterized, and 295 (97%) were antigenically similar (analyzed using HI with ferret antisera) to A/Michigan/45/2015 (6B.1), a cell-propagated A/Michigan/45/2015-like reference virus representing the A(H1N1)pdm09 component for the 2018-19 Northern Hemisphere influenza vaccines.
    • A (H3N2): Phylogenetic analysis of the HA genes from 703 A(H3N2) viruses revealed extensive genetic diversity with multiple clades/subclades co-circulating. The HA genes of circulating viruses belonged to clade 3C.2a (n=66), subclade 3C.2a1 (n=148) or clade 3C.3a (n=489). Three hundred forty-five A(H3N2) viruses were antigenically characterized by FRA with ferret antisera, and 167 (48.4%) were well-inhibited (reacting at titers that were within 4-fold of the homologous virus titer) by ferret antisera raised against A/Singapore/INFIMH-16-0019/2016 (3C.2a1), a cell-propagated reference virus representing the A(H3N2) component of 2018-19 Northern Hemisphere influenza vaccines. One hundred seventy-eight (51.6%) viruses reacted poorly (at titers that were 8-fold or greater reduced compared with that of the homologous virus A/Singapore/INFIMH-16-0019/2016) and of those, 177 (99.2%) belonged to clade 3C.3a.
    • B/Victoria: Phylogenetic analysis of 121 B/Victoria-lineage viruses indicate that all HA genes belonged to genetic clade V1A, however genetic subclades which are antigenically distinct have emerged. Genetic subclades which are antigenically distinct include viruses with a two amino acid deletion (162-163) in the HA protein (V1A.1, previously abbreviated as V1A-2Del) and viruses with a three amino acid deletion (162-164) in the HA protein (abbreviated as V1A-3Del). Ninety-eight B/Victoria lineage viruses were antigenically characterized and 73 (74.5%) were antigenically similar with ferret antisera raised against cell-propagated B/Colorado/06/2017-like V1A.1 reference virus. Twenty-five (25.5%) viruses reacted poorly (at titers that were 8-fold or greater reduced compared with the homologous virus titer) and belonged to clade V1A or genetic subclade V1A-3Del.
    • B/Yamagata: Phylogenetic analysis of 124 influenza B/Yamagata-lineage viruses indicate that the HA genes belonged to clade Y3. A total of 107 influenza B/Yamagata-lineage viruses were antigenically characterized, and all were antigenically similar to cell-propagated B/Phuket/3073/2013 (Y3), the reference vaccine virus representing the influenza B/Yamagata-lineage component of the 2018-19 Northern Hemisphere quadrivalent vaccines.
    • an A/Brisbane/02/2018 (H1N1)pdm09-like virus
    • an A/Kansas/14/2017 (H3N2)-like virus and
    • a B/Colorado/06/2017-like (B/Victoria lineage) virus
    • One state (Rhode Island) experienced high ILI activity.
    • Five states (Arizona, Hawaii, Kentucky, Louisiana and Missouri) experienced moderate ILI activity.
    • New York City, Puerto Rico and 14 states (California, Colorado, Georgia, Iowa, Maine, Massachusetts, New Jersey, New Mexico, New York, Pennsylvania, South Carolina, Texas, Virginia and Wisconsin) experienced low ILI activity.
    • The District of Columbia and 30 states (Alabama, Alaska, Arkansas, Connecticut, Delaware, Florida, Idaho, Illinois, Indiana, Kansas, Maryland, Michigan, Minnesota, Mississippi, Montana, Nebraska, Nevada, New Hampshire, North Carolina, North Dakota, Ohio, Oklahoma, Oregon, South Dakota, Tennessee, Utah, Vermont, Washington, West Virginia and Wyoming) experienced minimal ILI activity.
    • Data were insufficient to calculate an ILI activity level from the U.S. Virgin Islands.
    • Widespread influenza activity was reported by 11 states (Arizona, California, Connecticut, Delaware, Maine, Massachusetts, New Hampshire, New York, Ohio, Rhode Island and Virginia).
    • Regional influenza activity was reported by Puerto Rico and 20 states (Alabama, Florida, Georgia, Illinois, Kentucky, Louisiana, Maryland, Michigan, Missouri, Montana, Nevada, New Jersey, New Mexico, North Dakota, Pennsylvania, South Carolina, Tennessee, Utah, Washington and Wisconsin).
    • Local influenza activity was reported by the District of Columbia and 17 states (Alaska, Arkansas, Colorado, Hawaii, Idaho, Iowa, Kansas, Minnesota, Mississippi, Nebraska, North Carolina, Oklahoma, Oregon, South Dakota, Vermont, West Virginia and Wyoming).
    • Sporadic influenza activity was reported by the U.S. Virgin Islands and two states (Indiana and Texas).
    • Guam did not report.
      [h=2]Influenza-Associated Hospitalizations:[/h] The Influenza Hospitalization Surveillance Network (FluSurv-NET) conducts population-based surveillance for laboratory-confirmed influenza-related hospitalizations in select counties in the Emerging Infections Program (EIP) states and Influenza Hospitalization Surveillance Project (IHSP) states.
      A total of 17,979 laboratory-confirmed influenza-associated hospitalizations were reported by FluSurv-NET sites between October 1, 2018 and April 13, 2019. The overall hospitalization rate was 62.3 per 100,000 population. The highest rate of hospitalization was among adults aged ≥65 (206.5 per 100,000 population), followed by adults aged 50-64 (77.8 per 100,000 population) and children aged 0-4 (71.0 per 100,000 population). Among 17,979 hospitalizations, 17,232 (95.8%) were associated with influenza A virus, 611 (3.4%) with influenza B virus, 36 (0.2%) with influenza A virus and influenza B virus co-infection, and 100 (0.6%) with influenza virus for which the type was not determined. Among those with influenza A subtype information, 2,949 (54.9%) were A(H1N1)pdm09 virus and 2,426 (45.1%) were A(H3N2).
      Among 2,991 hospitalized adults with information on underlying medical conditions, 90.9% had at least one reported underlying medical condition, the most commonly reported were cardiovascular disease, metabolic disorder, and obesity. Among 541 hospitalized children with information on underlying medical conditions, 48.6% had at least one underlying medical condition; the most commonly reported was asthma. Among 452 hospitalized women of childbearing age (15-44 years) with information on pregnancy status, 27.0% were pregnant.
      Additional FluSurv-NET data displaying hospitalization rates for the current and past seasons and different age groups (including rates for patients 65-74 years, 74-84 years, and 85 years of age and older), as well as data on patient characteristics (such as influenza virus type, demographic, and clinical information), are available on FluView Interactive at: http://gis.cdc.gov/GRASP/Fluview/FluHospRates.html and http://gis.cdc.gov/grasp/fluview/FluHospChars.html.
      FluSurv-Net data is used to generate national estimates of the total numbers of flu cases, medical visits, hospitalizations, and deaths. This season, CDC is reporting preliminary cumulative in-season estimates, which are available at https://cdc.gov/flu/about/burden/preliminary-in-season-estimates.htm.
      [SIZE=1.5]Data from the Influenza Hospitalization Surveillance Network (FluSurv-NET), a population-based surveillance for influenza related hospitalizations in children and adults in 13 U.S. states. Cumulative incidence rates are calculated using the National Center for Health Statistics? (NCHS) population estimates for the counties included in the surveillance catchment area.

    • View Interactive Application | View Full Screen | View PowerPoint Presentation
      [SIZE=1.5]FluSurv-NET data are preliminary and displayed as they become available. Therefore, figures are based on varying denominators as some variables represent information that may require more time to be collected. Data are refreshed and updated weekly. Asthma includes a medical diagnosis of asthma or reactive airway disease; Cardiovascular diseases include conditions such as coronary heart disease, cardiac valve disorders, congestive heart failure, and pulmonary hypertension; does not include isolated hypertension; Chronic lung diseases include conditions such as chronic obstructive pulmonary disease, bronchiolitis obliterans, chronic aspiration pneumonia, and interstitial lung disease; Immune suppression includes conditions such as immunoglobulin deficiency, leukemia, lymphoma, HIV/AIDS, and individuals taking immunosuppressive medications; Metabolic disorders include conditions such as diabetes mellitus; Neurologic diseases include conditions such as seizure disorders, cerebral palsy, and cognitive dysfunction; Neuromuscular diseases include conditions such as multiple sclerosis and muscular dystrophy; Obesity was assigned if indicated in patient's medical chart or if body mass index (BMI) >30 kg/m2; Pregnancy percentage calculated using number of female cases aged between 15 and 44 years of age as the denominator; Renal diseases include conditions such as acute or chronic renal failure, nephrotic syndrome, glomerulonephritis, and impaired creatinine clearance; No known condition indicates that the case did not have any known high risk medical condition indicated in medical chart at the time of hospitalization.[/SIZE]
      View Interactive Application | View Full Screen | View PowerPoint Presentation

      [h=2]Pneumonia and Influenza (P&I) Mortality Surveillance:[/h] Based on National Center for Health Statistics (NCHS) mortality surveillance data available on April 18, 2019, 6.6% of the deaths occurring during the week ending April 6, 2019 (week 14) were due to P&I. This percentage is below the epidemic threshold of 7.0% for week 14.
      Additional pneumonia and influenza mortality data for current and past seasons and by geography (national, HHS region, or state) are available on FluView Interactive http://gis.cdc.gov/grasp/fluview/mortality.html. Data displayed on the regional and state-level are aggregated by the state of residence of the decedent.
      NCHS15_small.gif

      View Regional and State Level Data | View Chart Data | View Full Screen | View PowerPoint Presentation

      [h=2]Influenza-Associated Pediatric Mortality:[/h] Five influenza-associated pediatric deaths were reported to CDC during week 15. Three deaths were associated with an influenza A(H3) virus and occurred during weeks 8, 12 and 15 (the weeks ending February 23, March 23 and April 13, 2019). Two deaths were associated with an influenza A virus for which no subtyping was performed and occurred during weeks 12 and 13 (the weeks ending March 23 and March 30, 2019, respectively).
      A total of 91 influenza-associated pediatric deaths occurring during the 2018-2019 season have been reported to CDC.
      Additional information on influenza-associated pediatric deaths including basic demographics, underlying conditions, bacterial co-infections, and place of death for the current and past seasons, is available on FluView Interactive http://gis.cdc.gov/GRASP/Fluview/PedFluDeath.html.

      View Interactive Application | View Full Screen | View PowerPoint Presentation


      [h=2]Additional National and International Influenza Surveillance Information[/h] FluView Interactive: FluView includes enhanced web-based interactive applications that can provide dynamic visuals of the influenza data collected and analyzed by CDC. These FluView Interactive applications allow people to create customized, visual interpretations of influenza data, as well as make comparisons across flu seasons, regions, age groups and a variety of other demographics. To access these tools, visithttp://www.cdc.gov/flu/weekly/fluviewinteractive.htm.
      U.S. State and local influenza surveillance: Click on a jurisdiction below to access the latest local influenza information.

      [TABLE="width: 100%"]
      [TR]
      [TD="width: 139"] Alabama
      [/TD]
      [TD="width: 139"] Alaska
      [/TD]
      [TD="width: 139"] Arizona
      [/TD]
      [TD="width: 139"] Arkansas
      [/TD]
      [TD="width: 139"] California
      [/TD]
      [/TR]
      [TR]
      [TD="width: 139"] Colorado
      [/TD]
      [TD="width: 139"] Connecticut
      [/TD]
      [TD="width: 139"] Delaware
      [/TD]
      [TD="width: 139"] District of Columbia
      [/TD]
      [TD="width: 139"] Florida
      [/TD]
      [/TR]
      [TR]
      [TD="width: 139"] Georgia
      [/TD]
      [TD="width: 139"] Hawaii
      [/TD]
      [TD="width: 139"] Idaho
      [/TD]
      [TD="width: 139"] Illinois
      [/TD]
      [TD="width: 139"] Indiana
      [/TD]
      [/TR]
      [TR]
      [TD="width: 139"] Iowa
      [/TD]
      [TD="width: 139"] Kansas
      [/TD]
      [TD="width: 139"] Kentucky
      [/TD]
      [TD="width: 139"] Louisiana
      [/TD]
      [TD="width: 139"] Maine
      [/TD]
      [/TR]
      [TR]
      [TD="width: 139"] Maryland
      [/TD]
      [TD="width: 139"] Massachusetts
      [/TD]
      [TD="width: 139"] Michigan
      [/TD]
      [TD="width: 139"] Minnesota
      [/TD]
      [TD="width: 139"] Mississippi
      [/TD]
      [/TR]
      [TR]
      [TD="width: 139"] Missouri
      [/TD]
      [TD="width: 139"] Montana
      [/TD]
      [TD="width: 139"] Nebraska
      [/TD]
      [TD="width: 139"] Nevada
      [/TD]
      [TD="width: 139"] New Hampshire
      [/TD]
      [/TR]
      [TR]
      [TD="width: 139"] New Jersey
      [/TD]
      [TD="width: 139"] New Mexico
      [/TD]
      [TD="width: 139"] New York
      [/TD]
      [TD="width: 139"] North Carolina
      [/TD]
      [TD="width: 139"] North Dakota
      [/TD]
      [/TR]
      [TR]
      [TD="width: 139"] Ohio
      [/TD]
      [TD="width: 139"] Oklahoma
      [/TD]
      [TD="width: 139"] Oregon
      [/TD]
      [TD="width: 139"] Pennsylvania
      [/TD]
      [TD="width: 139"] Rhode Island
      [/TD]
      [/TR]
      [TR]
      [TD="width: 139"] South Carolina
      [/TD]
      [TD="width: 139"] South Dakota
      [/TD]
      [TD="width: 139"] Tennessee
      [/TD]
      [TD="width: 139"] Texas
      [/TD]
      [TD="width: 139"] Utah
      [/TD]
      [/TR]
      [TR]
      [TD="width: 139"] Vermont
      [/TD]
      [TD="width: 139"] Virginia
      [/TD]
      [TD="width: 139"] Washington
      [/TD]
      [TD="width: 139"] West Virginia
      [/TD]
      [TD="width: 139"] Wisconsin
      [/TD]
      [/TR]
      [TR]
      [TD="width: 139"] Wyoming
      [/TD]
      [TD="width: 139"] New York City
      [/TD]
      [TD="width: 139"] Puerto Rico
      [/TD]
      [TD="width: 139"] Virgin Islands
      [/TD]
      [TD="width: 139"] [/TD]
      [/TR]
      [/TABLE]
      World Health Organization: Additional influenza surveillance information from participating WHO member nations is available throughFluNet and the Global Epidemiology Reports.
      WHO Collaborating Centers for Influenza located in Australia, China, Japan, the United Kingdom, and the United States (CDC in Atlanta, Georgia).
      Europe: For the most recent influenza surveillance information from Europe, please see WHO/Europe and the European Centre for Disease Prevention and Control at http://www.flunewseurope.org/.
      Public Health Agency of Canada: The most up-to-date influenza information from Canada is available at http://www.phac-aspc.gc.ca/fluwatch/
      Public Health England: The most up-to-date influenza information from the United Kingdom is available athttps://www.gov.uk/government/statistics/weekly-national-flu-reports
      • Any links provided to non-Federal organizations are provided solely as a service to our users. These links do not constitute an endorsement of these organizations or their programs by CDC or the Federal Government, and none should be inferred. CDC is not responsible for the content of the individual organization web pages found at these links.
        An overview of the CDC influenza surveillance system, including methodology and detailed descriptions of each data component, is available at: http://www.cdc.gov/flu/weekly/overview.htm.
        --------------------------------------------------------------------------------
https://www.cdc.gov/flu/weekly/index.htm


[/SIZE]
 
[h=1]Weekly U.S. Influenza Surveillance Report[/h]
Language: English (US)


Recommend on FacebookTweet


fluview_hdr.jpg

[h=3]2018-2019 Influenza Season Week 16 ending April 20, 2019[/h] All data are preliminary and may change as more reports are received.
An overview of the CDC influenza surveillance system, including methodology and detailed descriptions of each data component, is available at http://www.cdc.gov/flu/weekly/overview.htm.
[h=3]Synopsis:[/h] Influenza activity continues to decrease in the United States. Influenza A(H1N1)pdm09 viruses predominated from October to mid-February, and influenza A(H3N2) viruses have been more commonly identified since late February. Small numbers of influenza B viruses also have been reported. Below is a summary of the key influenza indicators for the week ending April 20, 2019:
  • Viral Surveillance:The percentage of respiratory specimens testing positive for influenza viruses in clinical laboratories decreased. During the most recent three weeks, influenza A(H3) viruses were reported more frequently than influenza A(H1N1)pdm09 viruses nationally, and in all 10 HHS Regions.
    • Virus Characterization:The majority of influenza A(H1N1)pdm09 and influenza B viruses characterized antigenically are similar to the cell-grown reference viruses representing the 2018?2019 Northern Hemisphere influenza vaccine viruses. However, the majority of influenza A(H3N2) viruses are antigenically distinguishable from A/Singapore/INFIMH-16-0019/2016 (3C.2a1), a cell-propagated reference virus representing the A(H3N2) component of 2018-19 Northern Hemisphere influenza vaccines.
    • Antiviral Resistance:The vast majority of influenza viruses tested (>99%) show susceptibility to oseltamivir and peramivir. All influenza viruses tested showed susceptibility to zanamivir.
  • Influenza-like Illness Surveillance:The proportion of outpatient visits for influenza-like illness (ILI) decreased to 2.1%, which is below the national baseline of 2.2%. This is the first week ILI activity was below the national baseline since mid-November 2018. Four of 10 regions reported ILI at or above their region-specific baseline level.
    • ILI State Activity Indictor Map: Puerto Rico experienced high ILI activity; one state experienced moderate ILI activity; nine states experienced low ILI activity; New York City, the District of Columbia and 40 states experienced minimal ILI activity; and the U.S. Virgin Islands had insufficient data.
  • Geographic Spread of Influenza: The geographic spread of influenza in five states was reported as widespread; Puerto Rico and 17 states reported regional activity; 19 states reported local activity; the District of Columbia, the U.S. Virgin Islands and nine states reported sporadic activity; and Guam did not report.
  • Influenza-associated Hospitalizations A cumulative rate of 64.2 laboratory-confirmed influenza-associated hospitalizations per 100,000 population was reported. The highest hospitalization rate is among adults 65 years and older (214.1 hospitalizations per 100,000 population).
  • Pneumonia and Influenza Mortality: The proportion of deaths attributed to pneumonia and influenza (P&I) was below the system-specific epidemic threshold in the National Center for Health Statistics (NCHS) Mortality Surveillance System.
  • Influenza-associated Pediatric Deaths: Five influenza-associated pediatric deaths were reported to CDC during week 16.
[h=3]National and Regional Summary of Select Surveillance Components[/h]
[TABLE="class: table table-bordered opt-in, width: 100%"]
[TR]
[/TR]
[TR]
HHS Surveillance Regions* Data for current week National data is for the current week
Regional data is for the most recent three weeks
[/TR]
[TR]
Out-patient ILI? Number of jurisdictions reporting regional or widespread activity? % respiratory specimens positive for flu in clinical laboratories Predominant flu virus reported by public health laboratories [/TR]
[TR]
[/TR]
[TR]
Nation [TD]Normal[/TD]
[TD]23 of 54[/TD]
[TD]8.1%[/TD]
[TD]Influenza A(H3)[/TD]
[/TR]
[TR]
Region 1 [TD]Elevated[/TD]
[TD]6 of 6[/TD]
[TD]18.4%[/TD]
[TD]Influenza A(H3)[/TD]
[/TR]
[TR]
Region 2 [TD]Elevated[/TD]
[TD]2 of 4[/TD]
[TD]11.4%[/TD]
[TD]Influenza A(H3)[/TD]
[/TR]
[TR]
Region 3 [TD]Normal[/TD]
[TD]1 of 6[/TD]
[TD]10.4%[/TD]
[TD]Influenza A(H3)[/TD]
[/TR]
[TR]
Region 4 [TD]Normal[/TD]
[TD]3 of 8[/TD]
[TD]8.2%[/TD]
[TD]Influenza A(H3)[/TD]
[/TR]
[TR]
Region 5 [TD]Normal[/TD]
[TD]3 of 6[/TD]
[TD]17.5%[/TD]
[TD]Influenza A(H3)[/TD]
[/TR]
[TR]
Region 6 [TD]Normal[/TD]
[TD]1 of 5[/TD]
[TD]9.0%[/TD]
[TD]Influenza A(H3)[/TD]
[/TR]
[TR]
Region 7 [TD]Normal[/TD]
[TD]0 of 4[/TD]
[TD]9.4%[/TD]
[TD]Influenza A(H3)[/TD]
[/TR]
[TR]
Region 8 [TD]Elevated[/TD]
[TD]2 of 6[/TD]
[TD]9.9%[/TD]
[TD]Influenza A(H3)[/TD]
[/TR]
[TR]
Region 9 [TD]Elevated[/TD]
[TD]4 of 5[/TD]
[TD]8.4%[/TD]
[TD]Influenza A(H3)[/TD]
[/TR]
[TR]
Region 10 [TD]Normal[/TD]
[TD]1 of 4[/TD]
[TD]11.6%[/TD]
[TD]Influenza A(H3)[/TD]
[/TR]
[/TABLE]
*https://www.hhs.gov/about/agencies/iea/regional-offices/index.html
? Elevated means the % of visits for ILI is at or above the national or region-specific baseline
? Includes all 50 states, the District of Columbia, Guam, Puerto Rico, and U.S. Virgin Islands

[h=2]U.S. Virologic Surveillance:[/h] WHO and NREVSS collaborating laboratories, which include both public health and clinical laboratories located in all 50 states, Puerto Rico, Guam, and the District of Columbia, report to CDC the total number of respiratory specimens tested for influenza and the number positive for influenza by virus type. In addition, public health laboratories also report the influenza A subtype (H1 or H3) and influenza B lineage information of the viruses they test and the age or age group of the persons from whom the specimens were collected.
Additional virologic data, including national, regional and select state-level data, can be found at: http://gis.cdc.gov/grasp/fluview/fluportaldashboard.html. Age group proportions and totals by influenza subtype reported by public health laboratories can be found at: http://gis.cdc.gov/grasp/fluview/flu_by_age_virus.html.
The results of tests performed by clinical laboratories are summarized below.
[TABLE="class: table table-bordered table-condensed opt-in, width: 100%"]
[TR]
[TD="width: 200"] [/TD]
Week 16 Data Cumulative since
September 30, 2018 (Week 40) [/TR]
[TR]
No. of specimens tested [TD]18,777[/TD]
[TD]1,051,664[/TD]
[/TR]
[TR]
No. of positive specimens (%) [TD]1,516 (8.1%)[/TD]
[TD]171,607 (16.3%)[/TD]
[/TR]
[TR]
Positive specimens by type [TD] [/TD]
[TD] [/TD]
[/TR]
[TR]
Influenza A [TD]1,155 (76.2%)[/TD]
[TD]163,602 (95.3%)[/TD]
[/TR]
[TR]
Influenza B [TD]361 (23.8%)[/TD]
[TD]8,005 (4.7%)[/TD]
[/TR]
[/TABLE]

View National and Regional Level Graphs and Data | View Chart Data | View Full Screen | View PowerPoint Presentation The results of tests performed by public health laboratories are summarized below.
[TABLE="class: table table-bordered table-condensed opt-in, width: 100%"]
[TR]
[TD] [/TD]
Week 16 Data Cumulative since
September 30, 2018 (Week 40) [/TR]
[TR]
No. of specimens tested [TD]584[/TD]
[TD]73,182[/TD]
[/TR]
[TR]
No. of positive specimens* [TD]177[/TD]
[TD]39,096[/TD]
[/TR]
[TR]
Positive specimens by type/subtype [TD] [/TD]
[TD] [/TD]
[/TR]
[TR]
[/TR]
[TR]
Influenza A [TD]149 (84.2%)[/TD]
[TD]37,802 (96.7%)[/TD]
[/TR]
[TR]
(H1N1)pdm09 [TD]34 (23.3%)[/TD]
[TD]21,130 (58.0%)[/TD]
[/TR]
[TR]
H3N2 [TD]112 (76.7%)[/TD]
[TD]15,270 (42.0%)[/TD]
[/TR]
[TR]
Subtyping not performed [TD]3[/TD]
[TD]1,402[/TD]
[/TR]
[TR]
[/TR]
[TR]
Influenza B [TD]28 (15.8%)[/TD]
[TD]1,294 (3.3%)[/TD]
[/TR]
[TR]
Yamagata lineage [TD]3 (14.3%)[/TD]
[TD]333 (39.6%)[/TD]
[/TR]
[TR]
Victoria lineage [TD]18 (85.7%)[/TD]
[TD]508 (60.4%)[/TD]
[/TR]
[TR]
Lineage not performed [TD]7[/TD]
[TD]453[/TD]
[/TR]
[/TABLE]
*The percent of specimens testing positive for influenza is not reported because public health laboratories often receive samples that have already tested positive for influenza at a clinical laboratory and therefore percent positive would not be a valid indicator of influenza activity. Additional information is available at http://www.cdc.gov/flu/weekly/overview.htm.


View National and Regional Level Graphs and Data | View Chart Data | View Full Screen | View PowerPoint Presentation [h=2]Influenza Virus Characterization:[/h] Close monitoring of influenza viruses is required to better assess the potential impact on public health. CDC characterizes influenza viruses through one or more tests including genomic sequencing, hemagglutination inhibition (HI) and/or neutralization based Focus Reduction assays (FRA). These data are used to compare how similar currently circulating influenza viruses are to the reference viruses used for developing new influenza vaccines and to monitor evolutionary changes that continually occur in influenza viruses circulating in humans. Antigenic and genetic characterization of circulating influenza viruses gives an indication of the influenza vaccine's ability to induce an immune response against the wide array of influenza viruses that are co-circulating every season. However, annual vaccine effectiveness estimates are needed to determine how much protection was provided to the population by vaccination. On February 14, 2019, interim influenza effectiveness estimates for the 2018-2019 season were released and are available here.
For nearly all influenza-positive surveillance samples received at CDC, next-generation sequencing is performed to determine the genetic identity of circulating influenza viruses and to monitor the evolutionary trajectory of viruses circulating in our population. Virus gene segments are classified into genetic clades/subclades based on phylogenetic analysis. However, genetic changes that classify the clades/subclades do not always result in antigenic changes. ?Antigenic drift? is a term used to describe gradual antigenic change that occurs as viruses evolve changes to escape host immune pressure. Antigenic drift is evaluated by comparing antigenic properties of cell-propagated reference viruses representing currently recommended vaccine components with those of cell-propagated circulating viruses.
CDC has antigenically or genetically characterized 2,015 influenza viruses collected September 30, 2018 ? April 20, 2019, and submitted by U.S. laboratories, including 995 influenza A(H1N1)pdm09 viruses, 749 influenza A(H3N2) viruses, and 271 influenza B viruses.
Influenza A Viruses
Influenza B Viruses

The majority of U.S. viruses submitted for characterization come from state and local public health laboratories. Due to Right Size Roadmapconsiderations, specimen submission guidance to laboratories is that, if available, 2 influenza A(H1N1)pdm09, 2 influenza A(H3N2), and 2 influenza B viruses be submitted every other week. Therefore, the numbers of each virus type/subtype characterized should be more balanced across subtypes/lineages but will not reflect the actual proportion of circulating viruses. In the figure below, the results of tests performed by public health labs are shown on the left and CDC sequence results (by genetic clade/subclade) are shown on the right.
Genetic16_small.gif

View Chart Data | View Full Screen | View PowerPoint Presentation [h=2]2019-2020 Influenza Season - U.S. Influenza Vaccine Composition:[/h] The World Health Organization (WHO) has recommended the Northern Hemisphere 2019-2020 influenza vaccine composition, and the Food and Drug Administration?s Vaccines and Related Biological Products Advisory Committee (VRBPAC) subsequently made the influenza vaccine composition recommendation for the United States. Both agencies recommend that influenza trivalent vaccines contain:
It is recommended that quadrivalent vaccines, which have two influenza B viruses, contain the viruses recommended for the trivalent vaccines, as well as a B/Phuket/3073/2013-like (B/Yamagata lineage) virus. The (H1N1)pdm09 and H3N2 recommendations represents an update to the 2018-2019 Northern Hemisphere vaccines. These vaccine recommendations were based on several factors, including global influenza virologic and epidemiologic surveillance, genetic characterization, antigenic characterization and the candidate vaccine viruses that are available for production.
[h=2]Antiviral Resistance:[/h] Testing of influenza A(H1N1)pdm09, influenza A(H3N2), and influenza B viruses for resistance to the neuraminidase inhibitors (oseltamivir, zanamivir, and peramivir) is performed at CDC using next-generation sequencing analysis and/or a functional assay. Neuraminidase sequences of viruses are inspected to detect the presence of amino acid substitutions,previously associated with reduced or highly reduced inhibition by any of three neuraminidase inhibitors.In addition, a subset of viruses are tested using the neuraminidase inhibition assay with three neuraminidase inhibitors. The level of neuraminidase activity inhibition is reported using the thresholds recommended by the World Health Organization Expert Working Group of the Global Influenza Surveillance and Response System (GISRS)These samples are routinely obtained for surveillance purposes rather than for diagnostic testing of patients suspected to be infected with an antiviral-resistant virus.
Reporting of baloxavir susceptibility testing for the 2018-2019 influenza season will begin later this season. More information regarding influenza antiviral drug resistance can be found here.
High levels of resistance to the adamantanes (amantadine and rimantadine) persist among influenza A(H1N1)pdm09 and influenza A(H3N2) viruses (the adamantanes are not effective against influenza B viruses). Therefore, data from adamantane resistance testing are not presented below.
[h=3]Assessment of Virus Susceptibility to Neuraminidase Inhibitors Using Next-Generation Sequencing Analysis and/or Neuraminidase Inhibition Assay[/h]
[TABLE="class: table table-bordered opt-in, width: 100%"]
[TR]
Type/Subtype or Lineage Inhibition of Neuraminidase Activity by Antiviral Drug [/TR]
[TR]
[TD="colspan: 3"]Oseltamivir[/TD]
[TD="colspan: 3"]Peramivir[/TD]
[TD="colspan: 3"]Zanamivir[/TD]
[/TR]
[TR]
Virus Tested (n) Reduced, Number (%) Highly Reduced, Number (%) Virus Tested (n) Reduced, Number (%) Highly Reduced, Number (%) Virus Tested (n) Reduced, Number (%) Highly Reduced, Number (%) [/TR]
[TR]
Total Viruses [TD]2,077[/TD]
[TD]2 (0.1%)[/TD]
[TD]3 (0.1%)[/TD]
[TD]2,077[/TD]
[TD]0 (0%)[/TD]
[TD]3 (0.1%)[/TD]
[TD]2,077[/TD]
[TD]0 (0%)[/TD]
[TD]0 (0%)[/TD]
[/TR]
[TR]
A(H1N1)pdm09 [TD]1,006[/TD]
[TD]2 (0.2%)[/TD]
[TD]3 (0.3%)[/TD]
[TD]1,006[/TD]
[TD]0 (0%)[/TD]
[TD]3 (0.3%)[/TD]
[TD]1,006[/TD]
[TD]0 (0%)[/TD]
[TD]0 (0%)[/TD]
[/TR]
[TR]
A(H3N2) [TD]789[/TD]
[TD]0 (0%)[/TD]
[TD]0 (0%)[/TD]
[TD]789[/TD]
[TD]0 (0%)[/TD]
[TD]0 (0%)[/TD]
[TD]789[/TD]
[TD]0 (0%)[/TD]
[TD]0 (0%)[/TD]
[/TR]
[TR]
B/Victoria [TD]145[/TD]
[TD]0 (0%)[/TD]
[TD]0 (0%)[/TD]
[TD]145[/TD]
[TD]0 (0%)[/TD]
[TD]0 (0%)[/TD]
[TD]145[/TD]
[TD]0 (0%)[/TD]
[TD]0 (0%)[/TD]
[/TR]
[TR]
B/Yamagata [TD]137[/TD]
[TD]0 (0%)[/TD]
[TD]0 (0%)[/TD]
[TD]137[/TD]
[TD]0 (0%)[/TD]
[TD]0 (0%)[/TD]
[TD]137[/TD]
[TD]0 (0%)[/TD]
[TD]0 (0%)[/TD]
[/TR]
[/TABLE]
Antiviral treatment as early as possible is recommended for patients with confirmed or suspected influenza who have severe, complicated, or progressive illness; who require hospitalization; or who are at high risk for serious influenza-related complications. Additional information on recommendations for treatment and chemoprophylaxis of influenza virus infection with antiviral agents is available at:http://www.cdc.gov/flu/antivirals/index.htm.


[h=2]Outpatient Illness Surveillance:[/h] Nationwide during week 16, 2.1% of patient visits reported through the U.S. Outpatient Influenza-like Illness Surveillance Network (ILINet) were due to influenza-like illness (ILI). This percentage is below the national baseline of 2.2%. (ILI is defined as fever (temperature of 100?F [37.8?C] or greater) and cough and/or sore throat.)
On a regional level, the percentage of outpatient visits for ILI ranged from 0.8% to 3.2% during week 16. Four of 10 regions (Regions 1, 2, 8 and 9) reported a percentage of outpatient visits for ILI at or above their region-specific baseline.
Additional data on medically attended visits for ILI for current and past seasons and by geography (national, HHS region, or select states) are available on FluView Interactive http://gis.cdc.gov/grasp/fluview/fluportaldashboard.html.

View National and Regional Level Graphs and Data | View Chart Data | View Full Screen | View PowerPoint Presentation


[h=2]ILINet State Activity Indicator Map:[/h] Data collected in ILINet are used to produce a measure of ILI activity* by state. Activity levels are based on the percent of outpatient visits in a state due to ILI and are compared to the average percent of ILI visits that occur during weeks with little or no influenza virus circulation. Activity levels range from minimal, which would correspond to ILI activity from outpatient clinics being below, or only slightly above, the average, to high, which would correspond to ILI activity from outpatient clinics being much higher than average.
The ILI Activity Indicator Map displays state-specific activity levels for multiple seasons and allows a visual representation of relative activity from state to state. More information is available on FluView Interactive at https://gis.cdc.gov/grasp/fluview/main.html.
During week 16, the following ILI activity levels were experienced:


*This map uses the proportion of outpatient visits to health care providers for ILI to measure the ILI activity level within a state. It does not, however, measure the extent of geographic spread of flu within a state. Therefore, outbreaks occurring in a single city could cause the state to display high activity levels.
Data collected in ILINet may disproportionally represent certain populations within a state, and therefore, may not accurately depict the full picture of influenza activity for the whole state.
Data displayed in this map are based on data collected in ILINet, whereas the State and Territorial flu activity map is based on reports from state and territorial epidemiologists. The data presented in this map are preliminary and may change as more data are received.
Differences in the data presented here by CDC and independently by some state health departments likely represent differing levels of data completeness with data presented by the state likely being the more complete.


[h=2]Geographic Spread of Influenza as Assessed by State and Territorial Epidemiologists[/h] The influenza activity reported by state and territorial epidemiologists indicates geographic spread of influenza viruses, but does not measure the severity of influenza activity. Additional data displaying the influenza activity reported by state and territorial epidemiologists for the current and past seasons are available on FluView Interactive at https://gis.cdc.gov/grasp/fluview/FluView8.html
During week 16, the following influenza activity was reported:
    • A (H1N1)pdm09: Phylogenetic analysis of the HA genes from 995 A(H1N1)pdm09 viruses showed that all belonged to clade 6B.1. Three hundred and four A(H1N1)pdm09 viruses were antigenically characterized, and 295 (97%) were antigenically similar (analyzed using HI with ferret antisera) to A/Michigan/45/2015 (6B.1), a cell-propagated A/Michigan/45/2015-like reference virus representing the A(H1N1)pdm09 component for the 2018-19 Northern Hemisphere influenza vaccines.
    • A (H3N2): Phylogenetic analysis of the HA genes from 749 A(H3N2) viruses revealed extensive genetic diversity with multiple clades/subclades co-circulating. The HA genes of circulating viruses belonged to clade 3C.2a (n=66), subclade 3C.2a1 (n=157) or clade 3C.3a (n=526). Three hundred seventy A(H3N2) viruses were antigenically characterized by FRA with ferret antisera, and 167 (45.1%) were well-inhibited (reacting at titers that were within 4-fold of the homologous virus titer) by ferret antisera raised against A/Singapore/INFIMH-16-0019/2016 (3C.2a1), a cell-propagated reference virus representing the A(H3N2) component of 2018-19 Northern Hemisphere influenza vaccines. Two hundred and three (54.9%) viruses reacted poorly (at titers that were 8-fold or greater reduced compared with that of the homologous virus A/Singapore/INFIMH-16-0019/2016) and of those, 202 (99.5%) belonged to clade 3C.3a.
    • B/Victoria: Phylogenetic analysis of 140 B/Victoria-lineage viruses indicate that all HA genes belonged to genetic clade V1A, however genetic subclades which are antigenically distinct have emerged. Genetic subclades which are antigenically distinct include viruses with a two amino acid deletion (162-163) in the HA protein (V1A.1, previously abbreviated as V1A-2Del) and viruses with a three amino acid deletion (162-164) in the HA protein (abbreviated as V1A-3Del). One hundred and eight B/Victoria lineage viruses were antigenically characterized and 82 (75.9%) were antigenically similar with ferret antisera raised against cell-propagated B/Colorado/06/2017-like V1A.1 reference virus. Twenty-six (24.1%) viruses reacted poorly (at titers that were 8-fold or greater reduced compared with the homologous virus titer) and belonged to clade V1A or genetic subclade V1A-3Del.
    • B/Yamagata: Phylogenetic analysis of 131 influenza B/Yamagata-lineage viruses indicate that the HA genes belonged to clade Y3. A total of 107 influenza B/Yamagata-lineage viruses were antigenically characterized, and all were antigenically similar to cell-propagated B/Phuket/3073/2013 (Y3), the reference vaccine virus representing the influenza B/Yamagata-lineage component of the 2018-19 Northern Hemisphere quadrivalent vaccines.
    • an A/Brisbane/02/2018 (H1N1)pdm09-like virus
    • an A/Kansas/14/2017 (H3N2)-like virus and
    • a B/Colorado/06/2017-like (B/Victoria lineage) virus
    • Puerto Rico experienced high ILI activity.
    • One state (Kentucky) experienced moderate ILI activity.
    • Nine states (Arizona, Colorado, Louisiana, Massachusetts, Rhode Island, South Carolina, Utah, Virginia and Wisconsin) experienced low ILI activity.
    • New York City, the District of Columbia and 40 states (Alabama, Alaska, Arkansas, California, Connecticut, Delaware, Florida, Georgia, Hawaii, Idaho, Illinois, Indiana, Iowa, Kansas, Maine, Maryland, Michigan, Minnesota, Mississippi, Missouri, Montana, Nebraska, Nevada, New Hampshire, New Jersey, New Mexico, New York, North Carolina, North Dakota, Ohio, Oklahoma, Oregon, Pennsylvania, South Dakota, Tennessee, Texas, Vermont, Washington, West Virginia and Wyoming) experienced minimal ILI activity.
    • Data were insufficient to calculate an ILI activity level from the U.S. Virgin Islands.
    • Widespread influenza activity was reported by five states (Connecticut, Georgia, Maine, Massachusetts and New York).
    • Regional influenza activity was reported by Puerto Rico and 17 states (Arizona, California, Hawaii, Kentucky, Maryland, Michigan, Nevada, New Hampshire, New Mexico, North Carolina, North Dakota, Ohio, Rhode Island, Utah, Vermont, Washington and Wisconsin).
    • Local influenza activity was reported by 19 states (Alabama, Colorado, Delaware, Florida, Idaho, Illinois, Louisiana, Minnesota, Mississippi, Missouri, Montana, New Jersey, Oklahoma, Oregon, Pennsylvania, South Carolina, South Dakota, Tennessee and Virginia).
    • Sporadic influenza activity was reported by the District of Columbia, the U.S. Virgin Islands and nine states (Alaska, Arkansas, Indiana, Iowa, Kansas, Nebraska, Texas, West Virginia and Wyoming).
    • Guam did not report.
      [h=2]Influenza-Associated Hospitalizations:[/h] The Influenza Hospitalization Surveillance Network (FluSurv-NET) conducts population-based surveillance for laboratory-confirmed influenza-related hospitalizations in select counties in the Emerging Infections Program (EIP) states and Influenza Hospitalization Surveillance Project (IHSP) states.
      A total of 18,527 laboratory-confirmed influenza-associated hospitalizations were reported by FluSurv-NET sites between October 1, 2018 and April 20, 2019. The overall hospitalization rate was 64.2 per 100,000 population. The highest rate of hospitalization was among adults aged ≥65 (214.1 per 100,000 population), followed by adults aged 50-64 (79.7 per 100,000 population) and children aged 0-4 (73.1 per 100,000 population). Among 18,527 hospitalizations, 17,721 (95.6%) were associated with influenza A virus, 665 (3.6%) with influenza B virus, 39 (0.2%) with influenza A virus and influenza B virus co-infection, and 102 (0.6%) with influenza virus for which the type was not determined. Among those with influenza A subtype information, 3,044 (54.0%) were A(H1N1)pdm09 virus and 2,598 (46.0%) were A(H3N2).
      Among 3,294 hospitalized adults with information on underlying medical conditions, 91.3% had at least one reported underlying medical condition, the most commonly reported were cardiovascular disease, metabolic disorder, and obesity. Among 574 hospitalized children with information on underlying medical conditions, 49.0% had at least one underlying medical condition; the most commonly reported was asthma. Among 482 hospitalized women of childbearing age (15-44 years) with information on pregnancy status, 26.6% were pregnant.
      Additional FluSurv-NET data displaying hospitalization rates for the current and past seasons and different age groups (including rates for patients 65-74 years, 74-84 years, and 85 years of age and older), as well as data on patient characteristics (such as influenza virus type, demographic, and clinical information), are available on FluView Interactive at: http://gis.cdc.gov/GRASP/Fluview/FluHospRates.html and http://gis.cdc.gov/grasp/fluview/FluHospChars.html.
      FluSurv-Net data is used to generate national estimates of the total numbers of flu cases, medical visits, hospitalizations, and deaths. This season, CDC is reporting preliminary cumulative in-season estimates, which are available at https://cdc.gov/flu/about/burden/preliminary-in-season-estimates.htm.
      [SIZE=1.5]Data from the Influenza Hospitalization Surveillance Network (FluSurv-NET), a population-based surveillance for influenza related hospitalizations in children and adults in 13 U.S. states. Cumulative incidence rates are calculated using the National Center for Health Statistics? (NCHS) population estimates for the counties included in the surveillance catchment area.

    • View Interactive Application | View Full Screen | View PowerPoint Presentation
      [SIZE=1.5]FluSurv-NET data are preliminary and displayed as they become available. Therefore, figures are based on varying denominators as some variables represent information that may require more time to be collected. Data are refreshed and updated weekly. Asthma includes a medical diagnosis of asthma or reactive airway disease; Cardiovascular diseases include conditions such as coronary heart disease, cardiac valve disorders, congestive heart failure, and pulmonary hypertension; does not include isolated hypertension; Chronic lung diseases include conditions such as chronic obstructive pulmonary disease, bronchiolitis obliterans, chronic aspiration pneumonia, and interstitial lung disease; Immune suppression includes conditions such as immunoglobulin deficiency, leukemia, lymphoma, HIV/AIDS, and individuals taking immunosuppressive medications; Metabolic disorders include conditions such as diabetes mellitus; Neurologic diseases include conditions such as seizure disorders, cerebral palsy, and cognitive dysfunction; Neuromuscular diseases include conditions such as multiple sclerosis and muscular dystrophy; Obesity was assigned if indicated in patient's medical chart or if body mass index (BMI) >30 kg/m2; Pregnancy percentage calculated using number of female cases aged between 15 and 44 years of age as the denominator; Renal diseases include conditions such as acute or chronic renal failure, nephrotic syndrome, glomerulonephritis, and impaired creatinine clearance; No known condition indicates that the case did not have any known high risk medical condition indicated in medical chart at the time of hospitalization.[/SIZE]
      View Interactive Application | View Full Screen | View PowerPoint Presentation

      [h=2]Pneumonia and Influenza (P&I) Mortality Surveillance:[/h] Based on National Center for Health Statistics (NCHS) mortality surveillance data available on April 25, 2019, 6.6% of the deaths occurring during the week ending April 13, 2019 (week 15) were due to P&I. This percentage is below the epidemic threshold of 7.0% for week 15.
      Additional pneumonia and influenza mortality data for current and past seasons and by geography (national, HHS region, or state) are available on FluView Interactive http://gis.cdc.gov/grasp/fluview/mortality.html. Data displayed on the regional and state-level are aggregated by the state of residence of the decedent.
      NCHS16_small.gif

      View Regional and State Level Data | View Chart Data | View Full Screen | View PowerPoint Presentation

      [h=2]Influenza-Associated Pediatric Mortality:[/h] Five influenza-associated pediatric deaths were reported to CDC during week 16. One death was associated with an influenza A(H3) virus and occurred during week 15 (the week ending April 13, 2019). Two deaths were associated with an influenza A virus for which no subtyping was performed and occurred during weeks 12 and 13 (the weeks ending March 23 and March 30, 2019, respectively). Two deaths were associated with influenza B virus and occurred during weeks 11 and 15 (the weeks ending March 16 and April 13, 2019, respectively).
      A total of 96 influenza-associated pediatric deaths occurring during the 2018-2019 season have been reported to CDC.
      Additional information on influenza-associated pediatric deaths including basic demographics, underlying conditions, bacterial co-infections, and place of death for the current and past seasons, is available on FluView Interactive http://gis.cdc.gov/GRASP/Fluview/PedFluDeath.html.

      View Interactive Application | View Full Screen | View PowerPoint Presentation


      [h=2]Additional National and International Influenza Surveillance Information[/h] FluView Interactive: FluView includes enhanced web-based interactive applications that can provide dynamic visuals of the influenza data collected and analyzed by CDC. These FluView Interactive applications allow people to create customized, visual interpretations of influenza data, as well as make comparisons across flu seasons, regions, age groups and a variety of other demographics. To access these tools, visithttp://www.cdc.gov/flu/weekly/fluviewinteractive.htm.
      U.S. State and local influenza surveillance: Click on a jurisdiction below to access the latest local influenza information.

      [TABLE="width: 100%"]
      [TR]
      [TD="width: 139"] Alabama
      [/TD]
      [TD="width: 139"] Alaska
      [/TD]
      [TD="width: 139"] Arizona
      [/TD]
      [TD="width: 139"] Arkansas
      [/TD]
      [TD="width: 139"] California
      [/TD]
      [/TR]
      [TR]
      [TD="width: 139"] Colorado
      [/TD]
      [TD="width: 139"] Connecticut
      [/TD]
      [TD="width: 139"] Delaware
      [/TD]
      [TD="width: 139"] District of Columbia
      [/TD]
      [TD="width: 139"] Florida
      [/TD]
      [/TR]
      [TR]
      [TD="width: 139"] Georgia
      [/TD]
      [TD="width: 139"] Hawaii
      [/TD]
      [TD="width: 139"] Idaho
      [/TD]
      [TD="width: 139"] Illinois
      [/TD]
      [TD="width: 139"] Indiana
      [/TD]
      [/TR]
      [TR]
      [TD="width: 139"] Iowa
      [/TD]
      [TD="width: 139"] Kansas
      [/TD]
      [TD="width: 139"] Kentucky
      [/TD]
      [TD="width: 139"] Louisiana
      [/TD]
      [TD="width: 139"] Maine
      [/TD]
      [/TR]
      [TR]
      [TD="width: 139"] Maryland
      [/TD]
      [TD="width: 139"] Massachusetts
      [/TD]
      [TD="width: 139"] Michigan
      [/TD]
      [TD="width: 139"] Minnesota
      [/TD]
      [TD="width: 139"] Mississippi
      [/TD]
      [/TR]
      [TR]
      [TD="width: 139"] Missouri
      [/TD]
      [TD="width: 139"] Montana
      [/TD]
      [TD="width: 139"] Nebraska
      [/TD]
      [TD="width: 139"] Nevada
      [/TD]
      [TD="width: 139"] New Hampshire
      [/TD]
      [/TR]
      [TR]
      [TD="width: 139"] New Jersey
      [/TD]
      [TD="width: 139"] New Mexico
      [/TD]
      [TD="width: 139"] New York
      [/TD]
      [TD="width: 139"] North Carolina
      [/TD]
      [TD="width: 139"] North Dakota
      [/TD]
      [/TR]
      [TR]
      [TD="width: 139"] Ohio
      [/TD]
      [TD="width: 139"] Oklahoma
      [/TD]
      [TD="width: 139"] Oregon
      [/TD]
      [TD="width: 139"] Pennsylvania
      [/TD]
      [TD="width: 139"] Rhode Island
      [/TD]
      [/TR]
      [TR]
      [TD="width: 139"] South Carolina
      [/TD]
      [TD="width: 139"] South Dakota
      [/TD]
      [TD="width: 139"] Tennessee
      [/TD]
      [TD="width: 139"] Texas
      [/TD]
      [TD="width: 139"] Utah
      [/TD]
      [/TR]
      [TR]
      [TD="width: 139"] Vermont
      [/TD]
      [TD="width: 139"] Virginia
      [/TD]
      [TD="width: 139"] Washington
      [/TD]
      [TD="width: 139"] West Virginia
      [/TD]
      [TD="width: 139"] Wisconsin
      [/TD]
      [/TR]
      [TR]
      [TD="width: 139"] Wyoming
      [/TD]
      [TD="width: 139"] New York City
      [/TD]
      [TD="width: 139"] Puerto Rico
      [/TD]
      [TD="width: 139"] Virgin Islands
      [/TD]
      [TD="width: 139"] [/TD]
      [/TR]
      [/TABLE]
      World Health Organization: Additional influenza surveillance information from participating WHO member nations is available throughFluNet and the Global Epidemiology Reports.
      WHO Collaborating Centers for Influenza located in Australia, China, Japan, the United Kingdom, and the United States (CDC in Atlanta, Georgia).
      Europe: For the most recent influenza surveillance information from Europe, please see WHO/Europe and the European Centre for Disease Prevention and Control at http://www.flunewseurope.org/.
      Public Health Agency of Canada: The most up-to-date influenza information from Canada is available at http://www.phac-aspc.gc.ca/fluwatch/
      Public Health England: The most up-to-date influenza information from the United Kingdom is available athttps://www.gov.uk/government/statistics/weekly-national-flu-reports
      • Any links provided to non-Federal organizations are provided solely as a service to our users. These links do not constitute an endorsement of these organizations or their programs by CDC or the Federal Government, and none should be inferred. CDC is not responsible for the content of the individual organization web pages found at these links.
        An overview of the CDC influenza surveillance system, including methodology and detailed descriptions of each data component, is available at: http://www.cdc.gov/flu/weekly/overview.htm.

        https://www.cdc.gov/flu/weekly/index.htm


[/SIZE]
 
[h=1]Weekly U.S. Influenza Surveillance Report[/h]
Language: English (US)


Recommend on FacebookTweet


fluview_hdr.jpg

[h=3]2018-2019 Influenza Season Week 17 ending April 27, 2019[/h] All data are preliminary and may change as more reports are received.
An overview of the CDC influenza surveillance system, including methodology and detailed descriptions of each data component, is available at http://www.cdc.gov/flu/weekly/overview.htm.
[h=3]Synopsis:[/h] Influenza activity continues to decrease in the United States. While influenza A(H1N1)pdm09 viruses predominated from October to mid-February, influenza A(H3N2) viruses have been more commonly identified since late February. Small numbers of influenza B viruses also have been reported. Below is a summary of the key influenza indicators for the week ending April 27, 2019:
  • Viral Surveillance:The percentage of respiratory specimens testing positive for influenza viruses in clinical laboratories decreased. During the most recent three weeks, influenza A(H3) viruses were reported more frequently than influenza A(H1N1)pdm09 viruses nationally, and in all 10 HHS Regions.
    • Virus Characterization:The majority of influenza A(H1N1)pdm09 and influenza B viruses characterized antigenically are similar to the cell-grown reference viruses representing the 2018?2019 Northern Hemisphere influenza vaccine viruses. However, the majority of influenza A(H3N2) viruses are antigenically distinguishable from A/Singapore/INFIMH-16-0019/2016 (3C.2a1), a cell-propagated reference virus representing the A(H3N2) component of 2018-19 Northern Hemisphere influenza vaccines.
    • Antiviral Resistance:The vast majority of influenza viruses tested (>99%) show susceptibility to oseltamivir and peramivir. All influenza viruses tested showed susceptibility to zanamivir.
  • Influenza-like Illness Surveillance:The proportion of outpatient visits for influenza-like illness (ILI) decreased to 1.8%, which is below the national baseline of 2.2%. All regions reported ILI below their region-specific baseline level.
    • ILI State Activity Indictor Map: Puerto Rico experienced high ILI activity; four states experienced low ILI activity; New York City, the District of Columbia and 46 states experienced minimal ILI activity; and the U.S. Virgin Islands had insufficient data.
  • Geographic Spread of Influenza: The geographic spread of influenza in three states was reported as widespread; Puerto Rico and seven states reported regional activity; 18 states reported local activity; the District of Columbia, the U.S. Virgin Islands and 22 states reported sporadic activity; and Guam did not report.
  • Influenza-associated Hospitalizations A cumulative rate of 64.7 laboratory-confirmed influenza-associated hospitalizations per 100,000 population was reported. The highest hospitalization rate is among adults 65 years and older (216.6 hospitalizations per 100,000 population).
  • Pneumonia and Influenza Mortality: The proportion of deaths attributed to pneumonia and influenza (P&I) was below the system-specific epidemic threshold in the National Center for Health Statistics (NCHS) Mortality Surveillance System.
  • Influenza-associated Pediatric Deaths: Five influenza-associated pediatric deaths were reported to CDC during week 17.
[h=3]National and Regional Summary of Select Surveillance Components[/h]
[TABLE="class: table table-bordered opt-in, width: 100%"]
[TR]
[/TR]
[TR]
HHS Surveillance Regions* Data for current week National data is for the current week
Regional data is for the most recent three weeks
[/TR]
[TR]
Out-patient ILI? Number of jurisdictions reporting regional or widespread activity? % respiratory specimens positive for flu in clinical laboratories Predominant flu virus reported by public health laboratories [/TR]
[TR]
[/TR]
[TR]
Nation [TD]Normal[/TD]
[TD]11 of 54[/TD]
[TD]5.4%[/TD]
[TD]Influenza A(H3)[/TD]
[/TR]
[TR]
Region 1 [TD]Normal[/TD]
[TD]4 of 6[/TD]
[TD]15.3%[/TD]
[TD]Influenza A(H3)[/TD]
[/TR]
[TR]
Region 2 [TD]Normal[/TD]
[TD]2 of 4[/TD]
[TD]10.0%[/TD]
[TD]Influenza A(H3)[/TD]
[/TR]
[TR]
Region 3 [TD]Normal[/TD]
[TD]0 of 6[/TD]
[TD]5.6%[/TD]
[TD]Influenza A(H3)[/TD]
[/TR]
[TR]
Region 4 [TD]Normal[/TD]
[TD]1 of 8[/TD]
[TD]5.6%[/TD]
[TD]Influenza A(H3)[/TD]
[/TR]
[TR]
Region 5 [TD]Normal[/TD]
[TD]1 of 6[/TD]
[TD]12.5%[/TD]
[TD]Influenza A(H3)[/TD]
[/TR]
[TR]
Region 6 [TD]Normal[/TD]
[TD]0 of 5[/TD]
[TD]8.0%[/TD]
[TD]Influenza A(H3)[/TD]
[/TR]
[TR]
Region 7 [TD]Normal[/TD]
[TD]0 of 4[/TD]
[TD]6.2%[/TD]
[TD]Influenza A(H3)[/TD]
[/TR]
[TR]
Region 8 [TD]Normal[/TD]
[TD]1 of 6[/TD]
[TD]6.5%[/TD]
[TD]Influenza A(H3)[/TD]
[/TR]
[TR]
Region 9 [TD]Normal[/TD]
[TD]2 of 5[/TD]
[TD]7.0%[/TD]
[TD]Influenza A(H3)[/TD]
[/TR]
[TR]
Region 10 [TD]Normal[/TD]
[TD]0 of 4[/TD]
[TD]6.6%[/TD]
[TD]Influenza A(H3)[/TD]
[/TR]
[/TABLE]
*https://www.hhs.gov/about/agencies/iea/regional-offices/index.html
? Elevated means the % of visits for ILI is at or above the national or region-specific baseline
? Includes all 50 states, the District of Columbia, Guam, Puerto Rico, and U.S. Virgin Islands

[h=2]U.S. Virologic Surveillance:[/h] WHO and NREVSS collaborating laboratories, which include both public health and clinical laboratories located in all 50 states, Puerto Rico, Guam, and the District of Columbia, report to CDC the total number of respiratory specimens tested for influenza and the number positive for influenza by virus type. In addition, public health laboratories also report the influenza A subtype (H1 or H3) and influenza B lineage information of the viruses they test and the age or age group of the persons from whom the specimens were collected.
Additional virologic data, including national, regional and select state-level data, can be found at: http://gis.cdc.gov/grasp/fluview/fluportaldashboard.html. Age group proportions and totals by influenza subtype reported by public health laboratories can be found at: http://gis.cdc.gov/grasp/fluview/flu_by_age_virus.html.
The results of tests performed by clinical laboratories are summarized below.
[TABLE="class: table table-bordered table-condensed opt-in, width: 100%"]
[TR]
[TD="width: 200"] [/TD]
Week 17 Data Cumulative since
September 30, 2018 (Week 40) [/TR]
[TR]
No. of specimens tested [TD]19,080[/TD]
[TD]1,082,778[/TD]
[/TR]
[TR]
No. of positive specimens (%) [TD]1,026 (5.4%)[/TD]
[TD]173,963 (16.1%)[/TD]
[/TR]
[TR]
Positive specimens by type [TD] [/TD]
[TD] [/TD]
[/TR]
[TR]
Influenza A [TD]750 (73.1%)[/TD]
[TD]165,485 (95.1%)[/TD]
[/TR]
[TR]
Influenza B [TD]276 (26.9%)[/TD]
[TD]8,478 (4.9%)[/TD]
[/TR]
[/TABLE]

View National and Regional Level Graphs and Data | View Chart Data | View Full Screen | View PowerPoint Presentation The results of tests performed by public health laboratories are summarized below.
[TABLE="class: table table-bordered table-condensed opt-in, width: 100%"]
[TR]
[TD] [/TD]
Week 17 Data Cumulative since
September 30, 2018 (Week 40) [/TR]
[TR]
No. of specimens tested [TD]496[/TD]
[TD]75,776[/TD]
[/TR]
[TR]
No. of positive specimens* [TD]132[/TD]
[TD]40,043[/TD]
[/TR]
[TR]
Positive specimens by type/subtype [TD] [/TD]
[TD] [/TD]
[/TR]
[TR]
[/TR]
[TR]
Influenza A [TD]104 (78.8%)[/TD]
[TD]38,621 (96.4%)[/TD]
[/TR]
[TR]
(H1N1)pdm09 [TD]33 (33.0%)[/TD]
[TD]21,361 (57.6%)[/TD]
[/TR]
[TR]
H3N2 [TD]67 (67.0%)[/TD]
[TD]15,715 (42.4%)[/TD]
[/TR]
[TR]
Subtyping not performed [TD]4[/TD]
[TD]1,545[/TD]
[/TR]
[TR]
[/TR]
[TR]
Influenza B [TD]28 (21.2%)[/TD]
[TD]1,422 (3.6%)[/TD]
[/TR]
[TR]
Yamagata lineage [TD]7 (30.4%)[/TD]
[TD]361 (39.2%)[/TD]
[/TR]
[TR]
Victoria lineage [TD]16 (69.9%)[/TD]
[TD]561 (60.8%)[/TD]
[/TR]
[TR]
Lineage not performed [TD]5[/TD]
[TD]500[/TD]
[/TR]
[/TABLE]
*The percent of specimens testing positive for influenza is not reported because public health laboratories often receive samples that have already tested positive for influenza at a clinical laboratory and therefore percent positive would not be a valid indicator of influenza activity. Additional information is available at http://www.cdc.gov/flu/weekly/overview.htm.


View National and Regional Level Graphs and Data | View Chart Data | View Full Screen | View PowerPoint Presentation [h=2]Influenza Virus Characterization:[/h] Close monitoring of influenza viruses is required to better assess the potential impact on public health. CDC characterizes influenza viruses through one or more tests including genomic sequencing, hemagglutination inhibition (HI) and/or neutralization based Focus Reduction assays (FRA). These data are used to compare how similar currently circulating influenza viruses are to the reference viruses used for developing new influenza vaccines and to monitor evolutionary changes that continually occur in influenza viruses circulating in humans. Antigenic and genetic characterization of circulating influenza viruses gives an indication of the influenza vaccine's ability to induce an immune response against the wide array of influenza viruses that are co-circulating every season. However, annual vaccine effectiveness estimates are needed to determine how much protection was provided to the population by vaccination. On February 14, 2019, interim influenza effectiveness estimates for the 2018-2019 season were released and are available here.
For nearly all influenza-positive surveillance samples received at CDC, next-generation sequencing is performed to determine the genetic identity of circulating influenza viruses and to monitor the evolutionary trajectory of viruses circulating in our population. Virus gene segments are classified into genetic clades/subclades based on phylogenetic analysis. However, genetic changes that classify the clades/subclades do not always result in antigenic changes. ?Antigenic drift? is a term used to describe gradual antigenic change that occurs as viruses evolve changes to escape host immune pressure. Antigenic drift is evaluated by comparing antigenic properties of cell-propagated reference viruses representing currently recommended vaccine components with those of cell-propagated circulating viruses.
CDC has antigenically or genetically characterized 2,266 influenza viruses collected September 30, 2018 ? April 27, 2019, and submitted by U.S. laboratories, including 1,080 influenza A(H1N1)pdm09 viruses, 869 influenza A(H3N2) viruses, and 317 influenza B viruses.
Influenza A Viruses
Influenza B Viruses

The majority of U.S. viruses submitted for characterization come from state and local public health laboratories. Due to Right Size Roadmapconsiderations, specimen submission guidance to laboratories is that, if available, 2 influenza A(H1N1)pdm09, 2 influenza A(H3N2), and 2 influenza B viruses be submitted every other week. Therefore, the numbers of each virus type/subtype characterized should be more balanced across subtypes/lineages but will not reflect the actual proportion of circulating viruses. In the figure below, the results of tests performed by public health labs are shown on the left and CDC sequence results (by genetic clade/subclade) are shown on the right.
Genetic17_small.gif

View Chart Data | View Full Screen | View PowerPoint Presentation [h=2]2019-2020 Influenza Season - U.S. Influenza Vaccine Composition:[/h] The World Health Organization (WHO) has recommended the Northern Hemisphere 2019-2020 influenza vaccine composition, and the Food and Drug Administration?s Vaccines and Related Biological Products Advisory Committee (VRBPAC) subsequently made the influenza vaccine composition recommendation for the United States. Both agencies recommend that influenza trivalent vaccines contain:
It is recommended that quadrivalent vaccines, which have two influenza B viruses, contain the viruses recommended for the trivalent vaccines, as well as a B/Phuket/3073/2013-like (B/Yamagata lineage) virus. The (H1N1)pdm09 and H3N2 recommendations represents an update to the 2018-2019 Northern Hemisphere vaccines. These vaccine recommendations were based on several factors, including global influenza virologic and epidemiologic surveillance, genetic characterization, antigenic characterization and the candidate vaccine viruses that are available for production.
[h=2]Antiviral Resistance:[/h] Testing of influenza A(H1N1)pdm09, influenza A(H3N2), and influenza B viruses for resistance to the neuraminidase inhibitors (oseltamivir, zanamivir, and peramivir) is performed at CDC using next-generation sequencing analysis and/or a functional assay. Neuraminidase sequences of viruses are inspected to detect the presence of amino acid substitutions,previously associated with reduced or highly reduced inhibition by any of three neuraminidase inhibitors.In addition, a subset of viruses are tested using the neuraminidase inhibition assay with three neuraminidase inhibitors. The level of neuraminidase activity inhibition is reported using the thresholds recommended by the World Health Organization Expert Working Group of the Global Influenza Surveillance and Response System (GISRS)These samples are routinely obtained for surveillance purposes rather than for diagnostic testing of patients suspected to be infected with an antiviral-resistant virus.
Reporting of baloxavir susceptibility testing for the 2018-2019 influenza season will begin later this season. More information regarding influenza antiviral drug resistance can be found here.
High levels of resistance to the adamantanes (amantadine and rimantadine) persist among influenza A(H1N1)pdm09 and influenza A(H3N2) viruses (the adamantanes are not effective against influenza B viruses). Therefore, data from adamantane resistance testing are not presented below.
[h=3]Assessment of Virus Susceptibility to Neuraminidase Inhibitors Using Next-Generation Sequencing Analysis and/or Neuraminidase Inhibition Assay[/h]
[TABLE="class: table table-bordered opt-in, width: 100%"]
[TR]
Type/Subtype or Lineage Inhibition of Neuraminidase Activity by Antiviral Drug [/TR]
[TR]
[TD="colspan: 3"]Oseltamivir[/TD]
[TD="colspan: 3"]Peramivir[/TD]
[TD="colspan: 3"]Zanamivir[/TD]
[/TR]
[TR]
Virus Tested (n) Reduced, Number (%) Highly Reduced, Number (%) Virus Tested (n) Reduced, Number (%) Highly Reduced, Number (%) Virus Tested (n) Reduced, Number (%) Highly Reduced, Number (%) [/TR]
[TR]
Total Viruses [TD]2,203[/TD]
[TD]2 (0.1%)[/TD]
[TD]3 (0.1%)[/TD]
[TD]2,203[/TD]
[TD]0 (0%)[/TD]
[TD]3 (0.1%)[/TD]
[TD]2,203[/TD]
[TD]0 (0%)[/TD]
[TD]0 (0%)[/TD]
[/TR]
[TR]
A(H1N1)pdm09 [TD]1,059[/TD]
[TD]2 (0.2%)[/TD]
[TD]3 (0.3%)[/TD]
[TD]1,059[/TD]
[TD]0 (0%)[/TD]
[TD]3 (0.3%)[/TD]
[TD]1,059[/TD]
[TD]0 (0%)[/TD]
[TD]0 (0%)[/TD]
[/TR]
[TR]
A(H3N2) [TD]847[/TD]
[TD]0 (0%)[/TD]
[TD]0 (0%)[/TD]
[TD]847[/TD]
[TD]0 (0%)[/TD]
[TD]0 (0%)[/TD]
[TD]847[/TD]
[TD]0 (0%)[/TD]
[TD]0 (0%)[/TD]
[/TR]
[TR]
B/Victoria [TD]151[/TD]
[TD]0 (0%)[/TD]
[TD]0 (0%)[/TD]
[TD]151[/TD]
[TD]0 (0%)[/TD]
[TD]0 (0%)[/TD]
[TD]151[/TD]
[TD]0 (0%)[/TD]
[TD]0 (0%)[/TD]
[/TR]
[TR]
B/Yamagata [TD]146[/TD]
[TD]0 (0%)[/TD]
[TD]0 (0%)[/TD]
[TD]146[/TD]
[TD]0 (0%)[/TD]
[TD]0 (0%)[/TD]
[TD]146[/TD]
[TD]0 (0%)[/TD]
[TD]0 (0%)[/TD]
[/TR]
[/TABLE]
Antiviral treatment as early as possible is recommended for patients with confirmed or suspected influenza who have severe, complicated, or progressive illness; who require hospitalization; or who are at high risk for serious influenza-related complications. Additional information on recommendations for treatment and chemoprophylaxis of influenza virus infection with antiviral agents is available at:http://www.cdc.gov/flu/antivirals/index.htm.


[h=2]Outpatient Illness Surveillance:[/h] Nationwide during week 17, 1.8% of patient visits reported through the U.S. Outpatient Influenza-like Illness Surveillance Network (ILINet) were due to influenza-like illness (ILI). This percentage is below the national baseline of 2.2%. (ILI is defined as fever (temperature of 100?F [37.8?C] or greater) and cough and/or sore throat.)
On a regional level, the percentage of outpatient visits for ILI ranged from 0.9% to 2.8% during week 17. All regions reported a percentage of outpatient visits for ILI below their region-specific baseline.
Additional data on medically attended visits for ILI for current and past seasons and by geography (national, HHS region, or select states) are available on FluView Interactive http://gis.cdc.gov/grasp/fluview/fluportaldashboard.html.

View National and Regional Level Graphs and Data | View Chart Data | View Full Screen | View PowerPoint Presentation


[h=2]ILINet State Activity Indicator Map:[/h] Data collected in ILINet are used to produce a measure of ILI activity* by state. Activity levels are based on the percent of outpatient visits in a state due to ILI and are compared to the average percent of ILI visits that occur during weeks with little or no influenza virus circulation. Activity levels range from minimal, which would correspond to ILI activity from outpatient clinics being below, or only slightly above, the average, to high, which would correspond to ILI activity from outpatient clinics being much higher than average.
The ILI Activity Indicator Map displays state-specific activity levels for multiple seasons and allows a visual representation of relative activity from state to state. More information is available on FluView Interactive at https://gis.cdc.gov/grasp/fluview/main.html.
During week 17, the following ILI activity levels were experienced:


*This map uses the proportion of outpatient visits to health care providers for ILI to measure the ILI activity level within a state. It does not, however, measure the extent of geographic spread of flu within a state. Therefore, outbreaks occurring in a single city could cause the state to display high activity levels.
Data collected in ILINet may disproportionally represent certain populations within a state, and therefore, may not accurately depict the full picture of influenza activity for the whole state.
Data displayed in this map are based on data collected in ILINet, whereas the State and Territorial flu activity map is based on reports from state and territorial epidemiologists. The data presented in this map are preliminary and may change as more data are received.
Differences in the data presented here by CDC and independently by some state health departments likely represent differing levels of data completeness with data presented by the state likely being the more complete.


[h=2]Geographic Spread of Influenza as Assessed by State and Territorial Epidemiologists[/h] The influenza activity reported by state and territorial epidemiologists indicates geographic spread of influenza viruses, but does not measure the severity of influenza activity. Additional data displaying the influenza activity reported by state and territorial epidemiologists for the current and past seasons are available on FluView Interactive at https://gis.cdc.gov/grasp/fluview/FluView8.html
During week 17, the following influenza activity was reported:
    • A (H1N1)pdm09: Phylogenetic analysis of the HA genes from 1,080 A(H1N1)pdm09 viruses showed that all belonged to clade 6B.1. Three hundred and five A(H1N1)pdm09 viruses were antigenically characterized, and 296 (97%) were antigenically similar (analyzed using HI with ferret antisera) to A/Michigan/45/2015 (6B.1), a cell-propagated A/Michigan/45/2015-like reference virus representing the A(H1N1)pdm09 component for the 2018-19 Northern Hemisphere influenza vaccines.
    • A (H3N2): Phylogenetic analysis of the HA genes from 869 A(H3N2) viruses revealed extensive genetic diversity with multiple clades/subclades co-circulating. The HA genes of circulating viruses belonged to clade 3C.2a (n=66), subclade 3C.2a1 (n=173) or clade 3C.3a (n=630). Three hundred eighty-two A(H3N2) viruses were antigenically characterized by FRA with ferret antisera, and 168 (44%) were well-inhibited (reacting at titers that were within 4-fold of the homologous virus titer) by ferret antisera raised against A/Singapore/INFIMH-16-0019/2016 (3C.2a1), a cell-propagated reference virus representing the A(H3N2) component of 2018-19 Northern Hemisphere influenza vaccines. Two hundred and fourteen (56%) viruses reacted poorly (at titers that were 8-fold or greater reduced compared with that of the homologous virus A/Singapore/INFIMH-16-0019/2016) and of those, 213 (99.5%) belonged to clade 3C.3a.
    • B/Victoria: Phylogenetic analysis of 164 B/Victoria-lineage viruses indicate that all HA genes belonged to genetic clade V1A, however genetic subclades which are antigenically distinct have emerged. Genetic subclades which are antigenically distinct include viruses with a two amino acid deletion (162-163) in the HA protein (V1A.1, previously abbreviated as V1A-2Del) and viruses with a three amino acid deletion (162-164) in the HA protein (abbreviated as V1A-3Del). One hundred and eight B/Victoria lineage viruses were antigenically characterized and 82 (75.9%) were antigenically similar with ferret antisera raised against cell-propagated B/Colorado/06/2017-like V1A.1 reference virus. Twenty-six (24.1%) viruses reacted poorly (at titers that were 8-fold or greater reduced compared with the homologous virus titer) and belonged to clade V1A or genetic subclade V1A-3Del.
    • B/Yamagata: Phylogenetic analysis of 153 influenza B/Yamagata-lineage viruses indicate that the HA genes belonged to clade Y3. A total of 137 influenza B/Yamagata-lineage viruses were antigenically characterized, and all were antigenically similar to cell-propagated B/Phuket/3073/2013 (Y3), the reference vaccine virus representing the influenza B/Yamagata-lineage component of the 2018-19 Northern Hemisphere quadrivalent vaccines.
    • an A/Brisbane/02/2018 (H1N1)pdm09-like virus
    • an A/Kansas/14/2017 (H3N2)-like virus and
    • a B/Colorado/06/2017-like (B/Victoria lineage) virus
    • Puerto Rico experienced high ILI activity.
    • Four states (Alaska, Arizona, Kentucky and Louisiana) experienced low ILI activity.
    • New York City, the District of Columbia and 46 states (Alabama, Arkansas, California, Colorado, Connecticut, Delaware, Florida, Georgia, Hawaii, Idaho, Illinois, Indiana, Iowa, Kansas, Maine, Maryland, Massachusetts, Michigan, Minnesota, Mississippi, Missouri, Montana, Nebraska, Nevada, New Hampshire, New Jersey, New Mexico, New York, North Carolina, North Dakota, Ohio, Oklahoma, Oregon, Pennsylvania, Rhode Island, South Carolina, South Dakota, Tennessee, Texas, Utah, Vermont, Virginia, Washington, West Virginia, Wisconsin and Wyoming) experienced minimal ILI activity.
    • Data were insufficient to calculate an ILI activity level from the U.S. Virgin Islands.
    • Widespread influenza activity was reported by three states (Connecticut, Massachusetts and New York).
    • Regional influenza activity was reported by Puerto Rico and seven states (Arizona, Georgia, Maine, Nevada, Ohio, Rhode Island and Utah).
    • Local influenza activity was reported by 18 states (Delaware, Florida, Kentucky, Louisiana, Maryland, Michigan, Minnesota, Mississippi, Montana, New Hampshire, New Mexico, North Carolina, North Dakota, Pennsylvania, Tennessee, Washington, West Virginia and Wisconsin).
    • Sporadic influenza activity was reported by the District of Columbia, the U.S. Virgin Islands and 22 states (Alabama, Alaska, Arkansas, California, Colorado, Hawaii, Idaho, Illinois, Indiana, Iowa, Kansas, Missouri, Nebraska, New Jersey, Oklahoma, Oregon, South Carolina, South Dakota, Texas, Vermont, Virginia and Wyoming).
    • Guam did not report.
      [h=2]Influenza-Associated Hospitalizations:[/h] The Influenza Hospitalization Surveillance Network (FluSurv-NET) conducts population-based surveillance for laboratory-confirmed influenza-related hospitalizations in select counties in the Emerging Infections Program (EIP) states and Influenza Hospitalization Surveillance Project (IHSP) states.
      A total of 18,691 laboratory-confirmed influenza-associated hospitalizations were reported by FluSurv-NET sites between October 1, 2018 and April 27, 2019. The overall hospitalization rate was 64.7 per 100,000 population. The highest rate of hospitalization was among adults aged ≥65 (216.6 per 100,000 population), followed by adults aged 50-64 (80.0 per 100,000 population) and children aged 0-4 (74.0 per 100,000 population). Among 18,691 hospitalizations, 17,855 (95.5%) were associated with influenza A virus, 689 (3.7%) with influenza B virus, 43 (0.2%) with influenza A virus and influenza B virus co-infection, and 104 (0.6%) with influenza virus for which the type was not determined. Among those with influenza A subtype information, 3,129 (53.8%) were A(H1N1)pdm09 virus and 2,682 (46.2%) were A(H3N2).
      Among 3,566 hospitalized adults with information on underlying medical conditions, 91.3% had at least one reported underlying medical condition, the most commonly reported were cardiovascular disease, metabolic disorder, and obesity. Among 667 hospitalized children with information on underlying medical conditions, 50.2% had at least one underlying medical condition; the most commonly reported was asthma. Among 519 hospitalized women of childbearing age (15-44 years) with information on pregnancy status, 27.6% were pregnant.
      Additional FluSurv-NET data displaying hospitalization rates for the current and past seasons and different age groups (including rates for patients 65-74 years, 74-84 years, and 85 years of age and older), as well as data on patient characteristics (such as influenza virus type, demographic, and clinical information), are available on FluView Interactive at: http://gis.cdc.gov/GRASP/Fluview/FluHospRates.html and http://gis.cdc.gov/grasp/fluview/FluHospChars.html.
      FluSurv-Net data is used to generate national estimates of the total numbers of flu cases, medical visits, hospitalizations, and deaths. This season, CDC is reporting preliminary cumulative in-season estimates, which are available at https://cdc.gov/flu/about/burden/preliminary-in-season-estimates.htm.
      [SIZE=1.5]Data from the Influenza Hospitalization Surveillance Network (FluSurv-NET), a population-based surveillance for influenza related hospitalizations in children and adults in 13 U.S. states. Cumulative incidence rates are calculated using the National Center for Health Statistics? (NCHS) population estimates for the counties included in the surveillance catchment area.

    • View Interactive Application | View Full Screen | View PowerPoint Presentation
      [SIZE=1.5]FluSurv-NET data are preliminary and displayed as they become available. Therefore, figures are based on varying denominators as some variables represent information that may require more time to be collected. Data are refreshed and updated weekly. Asthma includes a medical diagnosis of asthma or reactive airway disease; Cardiovascular diseases include conditions such as coronary heart disease, cardiac valve disorders, congestive heart failure, and pulmonary hypertension; does not include isolated hypertension; Chronic lung diseases include conditions such as chronic obstructive pulmonary disease, bronchiolitis obliterans, chronic aspiration pneumonia, and interstitial lung disease; Immune suppression includes conditions such as immunoglobulin deficiency, leukemia, lymphoma, HIV/AIDS, and individuals taking immunosuppressive medications; Metabolic disorders include conditions such as diabetes mellitus; Neurologic diseases include conditions such as seizure disorders, cerebral palsy, and cognitive dysfunction; Neuromuscular diseases include conditions such as multiple sclerosis and muscular dystrophy; Obesity was assigned if indicated in patient's medical chart or if body mass index (BMI) >30 kg/m2; Pregnancy percentage calculated using number of female cases aged between 15 and 44 years of age as the denominator; Renal diseases include conditions such as acute or chronic renal failure, nephrotic syndrome, glomerulonephritis, and impaired creatinine clearance; No known condition indicates that the case did not have any known high risk medical condition indicated in medical chart at the time of hospitalization.[/SIZE]
      View Interactive Application | View Full Screen | View PowerPoint Presentation

      [h=2]Pneumonia and Influenza (P&I) Mortality Surveillance:[/h] Based on National Center for Health Statistics (NCHS) mortality surveillance data available on May 2, 2019, 6.3% of the deaths occurring during the week ending April 20, 2019 (week 16) were due to P&I. This percentage is below the epidemic threshold of 6.9% for week 16.
      Additional pneumonia and influenza mortality data for current and past seasons and by geography (national, HHS region, or state) are available on FluView Interactive http://gis.cdc.gov/grasp/fluview/mortality.html. Data displayed on the regional and state-level are aggregated by the state of residence of the decedent.
      NCHS17_small.gif

      View Regional and State Level Data | View Chart Data | View Full Screen | View PowerPoint Presentation

      [h=2]Influenza-Associated Pediatric Mortality:[/h] Five influenza-associated pediatric deaths were reported to CDC during week 17. Three deaths were associated with an influenza A(H3) virus and occurred during weeks 6, 13 and 14 (the weeks ending February 9, March 30, and April 6, 2019). Two deaths were associated with an influenza A virus for which no subtyping was performed and occurred during weeks 8 and 14 (the weeks ending February 23 and April 6, 2019, respectively).
      A total of 101 influenza-associated pediatric deaths occurring during the 2018-2019 season have been reported to CDC.
      Additional information on influenza-associated pediatric deaths including basic demographics, underlying conditions, bacterial co-infections, and place of death for the current and past seasons, is available on FluView Interactive http://gis.cdc.gov/GRASP/Fluview/PedFluDeath.html.

      View Interactive Application | View Full Screen | View PowerPoint Presentation


      [h=2]Additional National and International Influenza Surveillance Information[/h] FluView Interactive: FluView includes enhanced web-based interactive applications that can provide dynamic visuals of the influenza data collected and analyzed by CDC. These FluView Interactive applications allow people to create customized, visual interpretations of influenza data, as well as make comparisons across flu seasons, regions, age groups and a variety of other demographics. To access these tools, visithttp://www.cdc.gov/flu/weekly/fluviewinteractive.htm.
      U.S. State and local influenza surveillance: Click on a jurisdiction below to access the latest local influenza information.

      [TABLE="width: 100%"]
      [TR]
      [TD="width: 139"] Alabama
      [/TD]
      [TD="width: 139"] Alaska
      [/TD]
      [TD="width: 139"] Arizona
      [/TD]
      [TD="width: 139"] Arkansas
      [/TD]
      [TD="width: 139"] California
      [/TD]
      [/TR]
      [TR]
      [TD="width: 139"] Colorado
      [/TD]
      [TD="width: 139"] Connecticut
      [/TD]
      [TD="width: 139"] Delaware
      [/TD]
      [TD="width: 139"] District of Columbia
      [/TD]
      [TD="width: 139"] Florida
      [/TD]
      [/TR]
      [TR]
      [TD="width: 139"] Georgia
      [/TD]
      [TD="width: 139"] Hawaii
      [/TD]
      [TD="width: 139"] Idaho
      [/TD]
      [TD="width: 139"] Illinois
      [/TD]
      [TD="width: 139"] Indiana
      [/TD]
      [/TR]
      [TR]
      [TD="width: 139"] Iowa
      [/TD]
      [TD="width: 139"] Kansas
      [/TD]
      [TD="width: 139"] Kentucky
      [/TD]
      [TD="width: 139"] Louisiana
      [/TD]
      [TD="width: 139"] Maine
      [/TD]
      [/TR]
      [TR]
      [TD="width: 139"] Maryland
      [/TD]
      [TD="width: 139"] Massachusetts
      [/TD]
      [TD="width: 139"] Michigan
      [/TD]
      [TD="width: 139"] Minnesota
      [/TD]
      [TD="width: 139"] Mississippi
      [/TD]
      [/TR]
      [TR]
      [TD="width: 139"] Missouri
      [/TD]
      [TD="width: 139"] Montana
      [/TD]
      [TD="width: 139"] Nebraska
      [/TD]
      [TD="width: 139"] Nevada
      [/TD]
      [TD="width: 139"] New Hampshire
      [/TD]
      [/TR]
      [TR]
      [TD="width: 139"] New Jersey
      [/TD]
      [TD="width: 139"] New Mexico
      [/TD]
      [TD="width: 139"] New York
      [/TD]
      [TD="width: 139"] North Carolina
      [/TD]
      [TD="width: 139"] North Dakota
      [/TD]
      [/TR]
      [TR]
      [TD="width: 139"] Ohio
      [/TD]
      [TD="width: 139"] Oklahoma
      [/TD]
      [TD="width: 139"] Oregon
      [/TD]
      [TD="width: 139"] Pennsylvania
      [/TD]
      [TD="width: 139"] Rhode Island
      [/TD]
      [/TR]
      [TR]
      [TD="width: 139"] South Carolina
      [/TD]
      [TD="width: 139"] South Dakota
      [/TD]
      [TD="width: 139"] Tennessee
      [/TD]
      [TD="width: 139"] Texas
      [/TD]
      [TD="width: 139"] Utah
      [/TD]
      [/TR]
      [TR]
      [TD="width: 139"] Vermont
      [/TD]
      [TD="width: 139"] Virginia
      [/TD]
      [TD="width: 139"] Washington
      [/TD]
      [TD="width: 139"] West Virginia
      [/TD]
      [TD="width: 139"] Wisconsin
      [/TD]
      [/TR]
      [TR]
      [TD="width: 139"] Wyoming
      [/TD]
      [TD="width: 139"] New York City
      [/TD]
      [TD="width: 139"] Puerto Rico
      [/TD]
      [TD="width: 139"] Virgin Islands
      [/TD]
      [TD="width: 139"] [/TD]
      [/TR]
      [/TABLE]
      World Health Organization: Additional influenza surveillance information from participating WHO member nations is available throughFluNet and the Global Epidemiology Reports.
      WHO Collaborating Centers for Influenza located in Australia, China, Japan, the United Kingdom, and the United States (CDC in Atlanta, Georgia).
      Europe: For the most recent influenza surveillance information from Europe, please see WHO/Europe and the European Centre for Disease Prevention and Control at http://www.flunewseurope.org/.
      Public Health Agency of Canada: The most up-to-date influenza information from Canada is available at http://www.phac-aspc.gc.ca/fluwatch/
      Public Health England: The most up-to-date influenza information from the United Kingdom is available athttps://www.gov.uk/government/statistics/weekly-national-flu-reports
      • Any links provided to non-Federal organizations are provided solely as a service to our users. These links do not constitute an endorsement of these organizations or their programs by CDC or the Federal Government, and none should be inferred. CDC is not responsible for the content of the individual organization web pages found at these links.
        An overview of the CDC influenza surveillance system, including methodology and detailed descriptions of each data component, is available at: http://www.cdc.gov/flu/weekly/overview.htm.
        --------------------------------------------------------------------------------
https://www.cdc.gov/flu/weekly/index.htm


[/SIZE]
 
[h=3]2018-2019 Influenza Season Week 18 ending May 4, 2019[/h] All data are preliminary and may change as more reports are received.
An overview of the CDC influenza surveillance system, including methodology and detailed descriptions of each data component, is available at http://www.cdc.gov/flu/weekly/overview.htm.
[h=3]Synopsis:[/h] Influenza activity continues to decrease in the United States. While influenza A(H1N1)pdm09 viruses predominated from October to mid-February, influenza A(H3N2) viruses have been more commonly identified since late February. Small numbers of influenza B viruses also have been reported. Below is a summary of the key influenza indicators for the week ending May 4, 2019:
  • Viral Surveillance:The percentage of respiratory specimens testing positive for influenza viruses in clinical laboratories decreased. During the most recent three weeks, influenza A(H3) viruses were reported more frequently than influenza A(H1N1)pdm09 viruses nationally.
    • Virus Characterization:The majority of influenza A(H1N1)pdm09 and influenza B viruses characterized antigenically are similar to the cell-grown reference viruses representing the 2018?2019 Northern Hemisphere influenza vaccine viruses. However, the majority of influenza A(H3N2) viruses are antigenically distinguishable from A/Singapore/INFIMH-16-0019/2016 (3C.2a1), a cell-propagated reference virus representing the A(H3N2) component of 2018-19 Northern Hemisphere influenza vaccines.
    • Antiviral Resistance:The vast majority of influenza viruses tested (>99%) show susceptibility to oseltamivir and peramivir. All influenza viruses tested showed susceptibility to zanamivir.
  • Influenza-like Illness Surveillance:The proportion of outpatient visits for influenza-like illness (ILI) decreased to 1.6%, which is below the national baseline of 2.2%. One region reported ILI at their region-specific baseline level.
    • ILI State Activity Indictor Map: Two states experienced low ILI activity; and New York City, the District of Columbia, Puerto Rico, the U.S. Virgin Islands and 48 states experienced minimal ILI activity.
  • Geographic Spread of Influenza: The geographic spread of influenza in two states was reported as widespread; Puerto Rico and seven states reported regional activity; 18 states reported local activity; the District of Columbia, the U.S. Virgin Islands and 22 states reported sporadic activity; one state reported no activity; and Guam did not report.
  • Influenza-associated Hospitalizations A cumulative rate of 65.7 laboratory-confirmed influenza-associated hospitalizations per 100,000 population was reported. The highest hospitalization rate is among adults 65 years and older (221.5 hospitalizations per 100,000 population).
  • Pneumonia and Influenza Mortality: The proportion of deaths attributed to pneumonia and influenza (P&I) was below the system-specific epidemic threshold in the National Center for Health Statistics (NCHS) Mortality Surveillance System.
  • Influenza-associated Pediatric Deaths: Five influenza-associated pediatric deaths were reported to CDC during week 18.
[h=3]National and Regional Summary of Select Surveillance Components[/h]
[TABLE="class: table table-bordered, width: 100%"]
[TR]
[/TR]
[TR]
HHS Surveillance Regions* Data for current week National data is for the current week
Regional data is for the most recent three weeks
[/TR]
[TR]
Out-patient ILI? Number of jurisdictions reporting regional or widespread activity? % respiratory specimens positive for flu in clinical laboratories Predominant flu virus reported by public health laboratories [/TR]
[TR]
[/TR]
[TR]
Nation [TD]Normal[/TD]
[TD]10 of 54[/TD]
[TD]4.7%[/TD]
[TD]Influenza A(H3)[/TD]
[/TR]
[TR]
Region 1 [TD]Normal[/TD]
[TD]2 of 6[/TD]
[TD]10.1%[/TD]
[TD]Influenza A[/TD]
[/TR]
[TR]
Region 2 [TD]Normal[/TD]
[TD]2 of 4[/TD]
[TD]6.4%[/TD]
[TD]Influenza A(H3)[/TD]
[/TR]
[TR]
Region 3 [TD]Normal[/TD]
[TD]0 of 6[/TD]
[TD]3.4%[/TD]
[TD]Influenza A(H3)[/TD]
[/TR]
[TR]
Region 4 [TD]Normal[/TD]
[TD]1 of 8[/TD]
[TD]6.2%[/TD]
[TD]Influenza A(H3)[/TD]
[/TR]
[TR]
Region 5 [TD]Normal[/TD]
[TD]1 of 6[/TD]
[TD]8.2%[/TD]
[TD]Influenza A(H3)[/TD]
[/TR]
[TR]
Region 6 [TD]Normal[/TD]
[TD]0 of 5[/TD]
[TD]6.6%[/TD]
[TD]Influenza A[/TD]
[/TR]
[TR]
Region 7 [TD]Normal[/TD]
[TD]0 of 4[/TD]
[TD]4.1%[/TD]
[TD]Influenza A[/TD]
[/TR]
[TR]
Region 8 [TD]Elevated[/TD]
[TD]1 of 6[/TD]
[TD]4.8%[/TD]
[TD]Influenza A(H3)[/TD]
[/TR]
[TR]
Region 9 [TD]Normal[/TD]
[TD]2 of 5[/TD]
[TD]7.0%[/TD]
[TD]Influenza A(H3)[/TD]
[/TR]
[TR]
Region 10 [TD]Normal[/TD]
[TD]1 of 4[/TD]
[TD]4.0%[/TD]
[TD]Influenza A(H3)[/TD]
[/TR]
[/TABLE]

*https://www.hhs.gov/about/agencies/iea/regional-offices/index.html
? Elevated means the % of visits for ILI is at or above the national or region-specific baseline
? Includes all 50 states, the District of Columbia, Guam, Puerto Rico, and U.S. Virgin Islands

[h=2]U.S. Virologic Surveillance:[/h] WHO and NREVSS collaborating laboratories, which include both public health and clinical laboratories located in all 50 states, Puerto Rico, Guam, and the District of Columbia, report to CDC the total number of respiratory specimens tested for influenza and the number positive for influenza by virus type. In addition, public health laboratories also report the influenza A subtype (H1 or H3) and influenza B lineage information of the viruses they test and the age or age group of the persons from whom the specimens were collected.
Additional virologic data, including national, regional and select state-level data, can be found at: http://gis.cdc.gov/grasp/fluview/fluportaldashboard.html. Age group proportions and totals by influenza subtype reported by public health laboratories can be found at: http://gis.cdc.gov/grasp/fluview/flu_by_age_virus.html.
The results of tests performed by clinical laboratories are summarized below.
[TABLE="class: table table-bordered table-condensed opt-in, width: 100%"]
[TR]
[TD="width: 200"] [/TD]
Week 18 Data Cumulative since
September 30, 2018 (Week 40) [/TR]
[TR]
No. of specimens tested [TD]14,666[/TD]
[TD]1,102,844[/TD]
[/TR]
[TR]
No. of positive specimens (%) [TD]686 (4.7%)[/TD]
[TD]175,020 (15.9%)[/TD]
[/TR]
[TR]
Positive specimens by type [TD] [/TD]
[TD] [/TD]
[/TR]
[TR]
Influenza A [TD]453 (66.0%)[/TD]
[TD]166,200 (95.0%)[/TD]
[/TR]
[TR]
Influenza B [TD]233 (34.0%)[/TD]
[TD]8,820 (5.0%)[/TD]
[/TR]
[/TABLE]

View National and Regional Level Graphs and Data | View Chart Data | View Full Screen | View PowerPoint Presentation
The results of tests performed by public health laboratories are summarized below.
[TABLE="class: table table-bordered table-condensed opt-in, width: 100%"]
[TR]
[TD] [/TD]
Week 18 Data Cumulative since
September 30, 2018 (Week 40) [/TR]
[TR]
No. of specimens tested [TD]339[/TD]
[TD]77,361[/TD]
[/TR]
[TR]
No. of positive specimens* [TD]49[/TD]
[TD]40,864[/TD]
[/TR]
[TR]
Positive specimens by type/subtype [TD] [/TD]
[TD] [/TD]
[/TR]
[TR]
[/TR]
[TR]
Influenza A [TD]41 (83.7%)[/TD]
[TD]39,378 (96.4%)[/TD]
[/TR]
[TR]
(H1N1)pdm09 [TD]6 (17.6%)[/TD]
[TD]21,608 (57.1%)[/TD]
[/TR]
[TR]
H3N2 [TD]28 (82.4%)[/TD]
[TD]16,205 (42.9%)[/TD]
[/TR]
[TR]
Subtyping not performed [TD]7[/TD]
[TD]1,565[/TD]
[/TR]
[TR]
[/TR]
[TR]
Influenza B [TD]8 (16.3%)[/TD]
[TD]1,486 (3.6%)[/TD]
[/TR]
[TR]
Yamagata lineage [TD]1 (16.7%)[/TD]
[TD]370 (38.9%)[/TD]
[/TR]
[TR]
Victoria lineage [TD]5 (83.3%)[/TD]
[TD]582 (61.1%)[/TD]
[/TR]
[TR]
Lineage not performed [TD]2[/TD]
[TD]534[/TD]
[/TR]
[/TABLE]
*The percent of specimens testing positive for influenza is not reported because public health laboratories often receive samples that have already tested positive for influenza at a clinical laboratory and therefore percent positive would not be a valid indicator of influenza activity. Additional information is available at http://www.cdc.gov/flu/weekly/overview.htm.


View National and Regional Level Graphs and Data | View Chart Data | View Full Screen | View PowerPoint Presentation
[h=2]Influenza Virus Characterization:[/h] Close monitoring of influenza viruses is required to better assess the potential impact on public health. CDC characterizes influenza viruses through one or more tests including genomic sequencing, hemagglutination inhibition (HI) and/or neutralization based Focus Reduction assays (FRA). These data are used to compare how similar currently circulating influenza viruses are to the reference viruses used for developing new influenza vaccines and to monitor evolutionary changes that continually occur in influenza viruses circulating in humans. Antigenic and genetic characterization of circulating influenza viruses gives an indication of the influenza vaccine's ability to induce an immune response against the wide array of influenza viruses that are co-circulating every season. However, annual vaccine effectiveness estimates are needed to determine how much protection was provided to the population by vaccination. On February 14, 2019, interim influenza effectiveness estimates for the 2018-2019 season were released and are available here.
For nearly all influenza-positive surveillance samples received at CDC, next-generation sequencing is performed to determine the genetic identity of circulating influenza viruses and to monitor the evolutionary trajectory of viruses circulating in our population. Virus gene segments are classified into genetic clades/subclades based on phylogenetic analysis. However, genetic changes that classify the clades/subclades do not always result in antigenic changes. ?Antigenic drift? is a term used to describe gradual antigenic change that occurs as viruses evolve changes to escape host immune pressure. Antigenic drift is evaluated by comparing antigenic properties of cell-propagated reference viruses representing currently recommended vaccine components with those of cell-propagated circulating viruses.
CDC has antigenically or genetically characterized 2,401 influenza viruses collected September 30, 2018 ? May 4, 2019, and submitted by U.S. laboratories, including 1,142 influenza A(H1N1)pdm09 viruses, 907 influenza A(H3N2) viruses, and 352 influenza B viruses.
Influenza A Viruses
Influenza B Viruses

The majority of U.S. viruses submitted for characterization come from state and local public health laboratories. Due to Right Size Roadmapconsiderations, specimen submission guidance to laboratories is that, if available, 2 influenza A(H1N1)pdm09, 2 influenza A(H3N2), and 2 influenza B viruses be submitted every other week. Therefore, the numbers of each virus type/subtype characterized should be more balanced across subtypes/lineages but will not reflect the actual proportion of circulating viruses. In the figure below, the results of tests performed by public health labs are shown on the left and CDC sequence results (by genetic clade/subclade) are shown on the right.
Genetic18_small.gif

View Chart Data | View Full Screen | View PowerPoint Presentation [h=2]2019-2020 Influenza Season - U.S. Influenza Vaccine Composition:[/h] The World Health Organization (WHO) has recommended the Northern Hemisphere 2019-2020 influenza vaccine composition, and the Food and Drug Administration?s Vaccines and Related Biological Products Advisory Committee (VRBPAC) subsequently made the influenza vaccine composition recommendation for the United States. Both agencies recommend that influenza trivalent vaccines contain:
It is recommended that quadrivalent vaccines, which have two influenza B viruses, contain the viruses recommended for the trivalent vaccines, as well as a B/Phuket/3073/2013-like (B/Yamagata lineage) virus. The (H1N1)pdm09 and H3N2 recommendations represents an update to the 2018-2019 Northern Hemisphere vaccines. These vaccine recommendations were based on several factors, including global influenza virologic and epidemiologic surveillance, genetic characterization, antigenic characterization and the candidate vaccine viruses that are available for production.
[h=2]Antiviral Resistance:[/h] Testing of influenza A(H1N1)pdm09, influenza A(H3N2), and influenza B viruses for resistance to the neuraminidase inhibitors (oseltamivir, zanamivir, and peramivir) is performed at CDC using next-generation sequencing analysis and/or a functional assay. Neuraminidase sequences of viruses are inspected to detect the presence of amino acid substitutions,previously associated with reduced or highly reduced inhibition by any of three neuraminidase inhibitors.In addition, a subset of viruses are tested using the neuraminidase inhibition assay with three neuraminidase inhibitors. The level of neuraminidase activity inhibition is reported using the thresholds recommended by the World Health Organization Expert Working Group of the Global Influenza Surveillance and Response System (GISRS)These samples are routinely obtained for surveillance purposes rather than for diagnostic testing of patients suspected to be infected with an antiviral-resistant virus.
Reporting of baloxavir susceptibility testing for the 2018-2019 influenza season will begin later this season. More information regarding influenza antiviral drug resistance can be found here.
High levels of resistance to the adamantanes (amantadine and rimantadine) persist among influenza A(H1N1)pdm09 and influenza A(H3N2) viruses (the adamantanes are not effective against influenza B viruses). Therefore, data from adamantane resistance testing are not presented below.
[h=3]Assessment of Virus Susceptibility to Neuraminidase Inhibitors Using Next-Generation Sequencing Analysis and/or Neuraminidase Inhibition Assay[/h]
[TABLE="class: table table-bordered opt-in, width: 100%"]
[TR]
Type/Subtype or Lineage Inhibition of Neuraminidase Activity by Antiviral Drug [/TR]
[TR]
[TD="colspan: 3"]Oseltamivir[/TD]
[TD="colspan: 3"]Peramivir[/TD]
[TD="colspan: 3"]Zanamivir[/TD]
[/TR]
[TR]
Virus Tested (n) Reduced, Number (%) Highly Reduced, Number (%) Virus Tested (n) Reduced, Number (%) Highly Reduced, Number (%) Virus Tested (n) Reduced, Number (%) Highly Reduced, Number (%) [/TR]
[TR]
Total Viruses [TD]2,369[/TD]
[TD]2 (0.1%)[/TD]
[TD]3 (0.1%)[/TD]
[TD]2,369[/TD]
[TD]0 (0%)[/TD]
[TD]3 (0.1%)[/TD]
[TD]2,369[/TD]
[TD]0 (0%)[/TD]
[TD]0 (0%)[/TD]
[/TR]
[TR]
A(H1N1)pdm09 [TD]1,132[/TD]
[TD]2 (0.2%)[/TD]
[TD]3 (0.3%)[/TD]
[TD]1,132[/TD]
[TD]0 (0%)[/TD]
[TD]3 (0.3%)[/TD]
[TD]1,132[/TD]
[TD]0 (0%)[/TD]
[TD]0 (0%)[/TD]
[/TR]
[TR]
A(H3N2) [TD]901[/TD]
[TD]0 (0%)[/TD]
[TD]0 (0%)[/TD]
[TD]901[/TD]
[TD]0 (0%)[/TD]
[TD]0 (0%)[/TD]
[TD]901[/TD]
[TD]0 (0%)[/TD]
[TD]0 (0%)[/TD]
[/TR]
[TR]
B/Victoria [TD]168[/TD]
[TD]0 (0%)[/TD]
[TD]0 (0%)[/TD]
[TD]168[/TD]
[TD]0 (0%)[/TD]
[TD]0 (0%)[/TD]
[TD]168[/TD]
[TD]0 (0%)[/TD]
[TD]0 (0%)[/TD]
[/TR]
[TR]
B/Yamagata [TD]168[/TD]
[TD]0 (0%)[/TD]
[TD]0 (0%)[/TD]
[TD]168[/TD]
[TD]0 (0%)[/TD]
[TD]0 (0%)[/TD]
[TD]168[/TD]
[TD]0 (0%)[/TD]
[TD]0 (0%)[/TD]
[/TR]
[/TABLE]
Antiviral treatment as early as possible is recommended for patients with confirmed or suspected influenza who have severe, complicated, or progressive illness; who require hospitalization; or who are at high risk for serious influenza-related complications. Additional information on recommendations for treatment and chemoprophylaxis of influenza virus infection with antiviral agents is available at:http://www.cdc.gov/flu/antivirals/index.htm.


[h=2]Outpatient Illness Surveillance:[/h] Nationwide during week 18, 1.6% of patient visits reported through the U.S. Outpatient Influenza-like Illness Surveillance Network (ILINet) were due to influenza-like illness (ILI). This percentage is below the national baseline of 2.2%. (ILI is defined as fever (temperature of 100?F [37.8?C] or greater) and cough and/or sore throat.)
On a regional level, the percentage of outpatient visits for ILI ranged from 0.9% to 2.3% during week 18. One of 10 regions (Region 8) reported a percentage of outpatient visits for ILI at their region-specific baseline.
Additional data on medically attended visits for ILI for current and past seasons and by geography (national, HHS region, or select states) are available on FluView Interactive http://gis.cdc.gov/grasp/fluview/fluportaldashboard.html.

View National and Regional Level Graphs and Data | View Chart Data | View Full Screen | View PowerPoint Presentation


[h=2]ILINet State Activity Indicator Map:[/h] Data collected in ILINet are used to produce a measure of ILI activity* by state. Activity levels are based on the percent of outpatient visits in a state due to ILI and are compared to the average percent of ILI visits that occur during weeks with little or no influenza virus circulation. Activity levels range from minimal, which would correspond to ILI activity from outpatient clinics being below, or only slightly above, the average, to high, which would correspond to ILI activity from outpatient clinics being much higher than average.
The ILI Activity Indicator Map displays state-specific activity levels for multiple seasons and allows a visual representation of relative activity from state to state. More information is available on FluView Interactive at https://gis.cdc.gov/grasp/fluview/main.html.
During week 18, the following ILI activity levels were experienced:


*This map uses the proportion of outpatient visits to health care providers for ILI to measure the ILI activity level within a state. It does not, however, measure the extent of geographic spread of flu within a state. Therefore, outbreaks occurring in a single city could cause the state to display high activity levels.
Data collected in ILINet may disproportionally represent certain populations within a state, and therefore, may not accurately depict the full picture of influenza activity for the whole state.
Data displayed in this map are based on data collected in ILINet, whereas the State and Territorial flu activity map is based on reports from state and territorial epidemiologists. The data presented in this map are preliminary and may change as more data are received.
Differences in the data presented here by CDC and independently by some state health departments likely represent differing levels of data completeness with data presented by the state likely being the more complete.


[h=2]Geographic Spread of Influenza as Assessed by State and Territorial Epidemiologists[/h] The influenza activity reported by state and territorial epidemiologists indicates geographic spread of influenza viruses, but does not measure the severity of influenza activity. Additional data displaying the influenza activity reported by state and territorial epidemiologists for the current and past seasons are available on FluView Interactive at https://gis.cdc.gov/grasp/fluview/FluView8.html
During week 18, the following influenza activity was reported:
    • A (H1N1)pdm09: Phylogenetic analysis of the HA genes from 1,142 A(H1N1)pdm09 viruses showed that all belonged to clade 6B.1. Three hundred and five A(H1N1)pdm09 viruses were antigenically characterized, and 296 (97%) were antigenically similar (analyzed using HI with ferret antisera) to A/Michigan/45/2015 (6B.1), a cell-propagated A/Michigan/45/2015-like reference virus representing the A(H1N1)pdm09 component for the 2018-19 Northern Hemisphere influenza vaccines.
    • A (H3N2): Phylogenetic analysis of the HA genes from 907 A(H3N2) viruses revealed extensive genetic diversity with multiple clades/subclades co-circulating. The HA genes of circulating viruses belonged to clade 3C.2a (n=66), subclade 3C.2a1 (n=180) or clade 3C.3a (n=661). Three hundred eighty two A(H3N2) viruses were antigenically characterized by FRA with ferret antisera, and 168 (44%) A(H3N2) viruses tested were well-inhibited (reacting at titers that were within 4-fold of the homologous virus titer) by ferret antisera raised against A/Singapore/INFIMH-16-0019/2016 (3C.2a1), a cell-propagated reference virus representing the A(H3N2) component of 2018-19 Northern Hemisphere influenza vaccines. Two hundred and fourteen (56%) viruses reacted poorly (at titers that were 8-fold or greater reduced compared with that of the homologous virus A/Singapore/INFIMH-16-0019/2016) and of those, 213 (99.5%) belonged to clade 3C.3a.
    • B/Victoria: Phylogenetic analysis of 178 B/Victoria-lineage viruses indicate that all HA genes belonged to genetic clade V1A, however genetic subclades which are antigenically distinct have emerged. Genetic subclades which are antigenically distinct include viruses with a two amino acid deletion (162-163) in the HA protein (V1A.1, previously abbreviated as V1A-2Del) and viruses with a three amino acid deletion (162-164) in the HA protein (abbreviated as V1A-3Del). One hundred and eight B/Victoria lineage viruses were antigenically characterized and 82 (75.9%) were antigenically similar with ferret antisera raised against cell-propagated B/Colorado/06/2017-like V1A.1 reference virus. Twenty-six (24.1%) viruses reacted poorly (at titers that were 8-fold or greater reduced compared with the homologous virus titer) and belonged to clade V1A or genetic subclade V1A-3Del.
    • B/Yamagata: Phylogenetic analysis of 174 influenza B/Yamagata-lineage viruses indicate that the HA genes belonged to clade Y3. A total of 137 influenza B/Yamagata-lineage viruses were antigenically characterized, and all were antigenically similar to cell-propagated B/Phuket/3073/2013 (Y3), the reference vaccine virus representing the influenza B/Yamagata-lineage component of the 2018-19 Northern Hemisphere quadrivalent vaccines.
    • an A/Brisbane/02/2018 (H1N1)pdm09-like virus
    • an A/Kansas/14/2017 (H3N2)-like virus and
    • a B/Colorado/06/2017-like (B/Victoria lineage) virus
    • Two states (Colorado and Kentucky) experienced low ILI activity.
    • New York City, the District of Columbia, Puerto Rico, the U.S. Virgin Islands and 48 states (Alabama, Alaska, Arizona, Arkansas, California, Connecticut, Delaware, Florida, Georgia, Hawaii, Idaho, Illinois, Indiana, Iowa, Kansas, Louisiana, Maine, Maryland, Massachusetts, Michigan, Minnesota, Mississippi, Missouri, Montana, Nebraska, Nevada, New Hampshire, New Jersey, New Mexico, New York, North Carolina, North Dakota, Ohio, Oklahoma, Oregon, Pennsylvania, Rhode Island, South Carolina, South Dakota, Tennessee, Texas, Utah, Vermont, Virginia, Washington, West Virginia, Wisconsin and Wyoming) experienced minimal ILI activity.
    • Widespread influenza activity was reported by two states (Massachusetts and New York).
    • Regional influenza activity was reported by Puerto Rico and seven states (Arizona, Connecticut, Kentucky, Nevada, Ohio, Utah and Washington).
    • Local influenza activity was reported by 18 states (Colorado, Florida, Georgia, Hawaii, Louisiana, Maine, Maryland, Michigan, Minnesota, Mississippi, Montana, New Hampshire, New Mexico, North Dakota, Pennsylvania, South Carolina, Vermont and Wisconsin).
    • Sporadic influenza activity was reported by the District of Columbia, the U.S. Virgin Islands and 22 states (Alabama, Arkansas, California, Delaware, Idaho, Illinois, Indiana, Iowa, Kansas, Missouri, Nebraska, New Jersey, North Carolina, Oklahoma, Oregon, Rhode Island, South Dakota, Tennessee, Texas, Virginia, West Virginia and Wyoming).
    • No activity was reported by one state (Alaska).
    • Guam did not report.
      [h=2]Influenza-Associated Hospitalizations:[/h] The Influenza Hospitalization Surveillance Network (FluSurv-NET) conducts population-based surveillance for laboratory-confirmed influenza-related hospitalizations in select counties in the Emerging Infections Program (EIP) states and Influenza Hospitalization Surveillance Project (IHSP) states.
      A total of 18,973 laboratory-confirmed influenza-associated hospitalizations were reported by FluSurv-NET sites between October 1, 2018 and April 30, 2019. The overall hospitalization rate was 65.7 per 100,000 population. The highest rate of hospitalization was among adults aged ≥65 (221.5 per 100,000 population), followed by adults aged 50-64 (81.3 per 100,000 population) and children aged 0-4 (73.6 per 100,000 population). Among 18,973 hospitalizations, 18,104 (95.4%) were associated with influenza A virus, 717 (3.8%) with influenza B virus, 41 (0.2%) with influenza A virus and influenza B virus co-infection, and 111 (0.6%) with influenza virus for which the type was not determined. Among those with influenza A subtype information, 3,234 (53.9%) were A(H1N1)pdm09 virus and 2,764 (46.1%) were A(H3N2).
      Among 4,037 hospitalized adults with information on underlying medical conditions, 91.3% had at least one reported underlying medical condition, the most commonly reported were cardiovascular disease, metabolic disorder, and obesity. Among 784 hospitalized children with information on underlying medical conditions, 52.3% had at least one underlying medical condition; the most commonly reported was asthma. Among 554 hospitalized women of childbearing age (15-44 years) with information on pregnancy status, 27.4% were pregnant.
      While patients admitted after April 30, 2019 will not be included, data on patients admitted through April 30, 2019 will continue to be updated as additional information is received.
      Additional FluSurv-NET data displaying hospitalization rates for the current and past seasons and different age groups (including rates for patients 65-74 years, 74-84 years, and 85 years of age and older), as well as data on patient characteristics (such as influenza virus type, demographic, and clinical information), are available on FluView Interactive at: http://gis.cdc.gov/GRASP/Fluview/FluHospRates.html and http://gis.cdc.gov/grasp/fluview/FluHospChars.html.
      FluSurv-Net data is used to generate national estimates of the total numbers of flu cases, medical visits, hospitalizations, and deaths. This season, CDC is reporting preliminary cumulative in-season estimates, which are available at https://cdc.gov/flu/about/burden/preliminary-in-season-estimates.htm.
      [SIZE=1.5]Data from the Influenza Hospitalization Surveillance Network (FluSurv-NET), a population-based surveillance for influenza related hospitalizations in children and adults in 13 U.S. states. Cumulative incidence rates are calculated using the National Center for Health Statistics? (NCHS) population estimates for the counties included in the surveillance catchment area.[/SIZE]
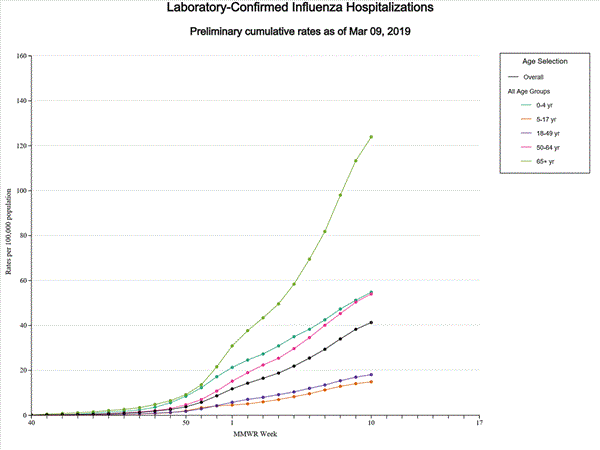
      View Interactive Application | View Full Screen | View PowerPoint Presentation
      [SIZE=1.5]FluSurv-NET data are preliminary and displayed as they become available. Therefore, figures are based on varying denominators as some variables represent information that may require more time to be collected. Data are refreshed and updated weekly. Asthma includes a medical diagnosis of asthma or reactive airway disease; Cardiovascular diseases include conditions such as coronary heart disease, cardiac valve disorders, congestive heart failure, and pulmonary hypertension; does not include isolated hypertension; Chronic lung diseases include conditions such as chronic obstructive pulmonary disease, bronchiolitis obliterans, chronic aspiration pneumonia, and interstitial lung disease; Immune suppression includes conditions such as immunoglobulin deficiency, leukemia, lymphoma, HIV/AIDS, and individuals taking immunosuppressive medications; Metabolic disorders include conditions such as diabetes mellitus; Neurologic diseases include conditions such as seizure disorders, cerebral palsy, and cognitive dysfunction; Neuromuscular diseases include conditions such as multiple sclerosis and muscular dystrophy; Obesity was assigned if indicated in patient's medical chart or if body mass index (BMI) >30 kg/m2; Pregnancy percentage calculated using number of female cases aged between 15 and 44 years of age as the denominator; Renal diseases include conditions such as acute or chronic renal failure, nephrotic syndrome, glomerulonephritis, and impaired creatinine clearance; No known condition indicates that the case did not have any known high risk medical condition indicated in medical chart at the time of hospitalization.[/SIZE]
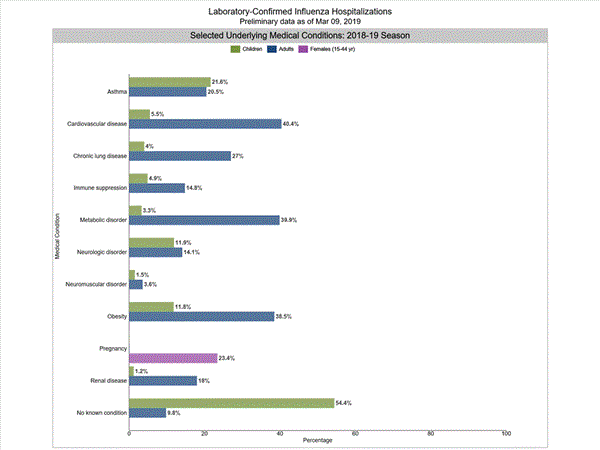
      View Interactive Application | View Full Screen | View PowerPoint Presentation

      [h=2]Pneumonia and Influenza (P&I) Mortality Surveillance:[/h] Based on National Center for Health Statistics (NCHS) mortality surveillance data available on May 9, 2019, 6.0% of the deaths occurring during the week ending April 27, 2019 (week 17) were due to P&I. This percentage is below the epidemic threshold of 6.8% for week 17.
      Additional pneumonia and influenza mortality data for current and past seasons and by geography (national, HHS region, or state) are available on FluView Interactive http://gis.cdc.gov/grasp/fluview/mortality.html. Data displayed on the regional and state-level are aggregated by the state of residence of the decedent.
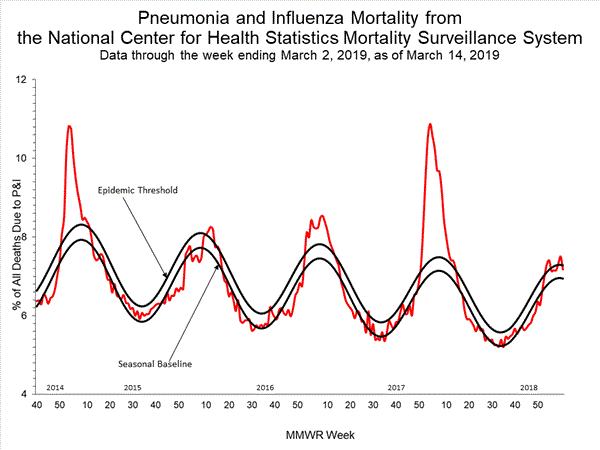
      NCHS18_small.gif

      View Regional and State Level Data | View Chart Data | View Full Screen | View PowerPoint Presentation

      [h=2]Influenza-Associated Pediatric Mortality:[/h] Five influenza-associated pediatric deaths were reported to CDC during week 18. Two deaths were associated with an influenza A(H3) virus and occurred during weeks 13 and 17 (the weeks ending March 30 and April 27, 2019). Two deaths were associated with an influenza A virus for which no subtyping was performed and occurred during weeks 16 and 18 (the weeks ending April 20 and May 4, 2019, respectively). One death was associated with an influenza B virus and occurred during week 16 (the week ending April 20, 2019).
      A total of 106 influenza-associated pediatric deaths occurring during the 2018-2019 season have been reported to CDC.
      Additional information on influenza-associated pediatric deaths including basic demographics, underlying conditions, bacterial co-infections, and place of death for the current and past seasons, is available on FluView Interactive http://gis.cdc.gov/GRASP/Fluview/PedFluDeath.html.
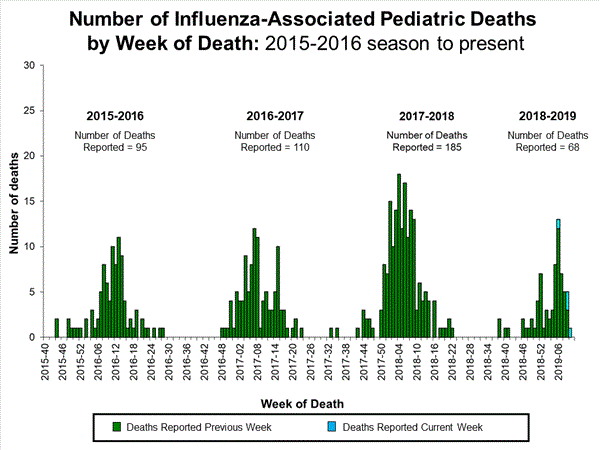
      View Interactive Application | View Full Screen | View PowerPoint Presentation


      [h=2]Additional National and International Influenza Surveillance Information[/h] FluView Interactive: FluView includes enhanced web-based interactive applications that can provide dynamic visuals of the influenza data collected and analyzed by CDC. These FluView Interactive applications allow people to create customized, visual interpretations of influenza data, as well as make comparisons across flu seasons, regions, age groups and a variety of other demographics. To access these tools, visithttp://www.cdc.gov/flu/weekly/fluviewinteractive.htm.
      U.S. State and local influenza surveillance: Click on a jurisdiction below to access the latest local influenza information.

      [TABLE="width: 100%"]
      [TR]
      [TD="width: 139"] Alabama
      [/TD]
      [TD="width: 139"] Alaska
      [/TD]
      [TD="width: 139"] Arizona
      [/TD]
      [TD="width: 139"] Arkansas
      [/TD]
      [TD="width: 139"] California
      [/TD]
      [/TR]
      [TR]
      [TD="width: 139"] Colorado
      [/TD]
      [TD="width: 139"] Connecticut
      [/TD]
      [TD="width: 139"] Delaware
      [/TD]
      [TD="width: 139"] District of Columbia
      [/TD]
      [TD="width: 139"] Florida
      [/TD]
      [/TR]
      [TR]
      [TD="width: 139"] Georgia
      [/TD]
      [TD="width: 139"] Hawaii
      [/TD]
      [TD="width: 139"] Idaho
      [/TD]
      [TD="width: 139"] Illinois
      [/TD]
      [TD="width: 139"] Indiana
      [/TD]
      [/TR]
      [TR]
      [TD="width: 139"] Iowa
      [/TD]
      [TD="width: 139"] Kansas
      [/TD]
      [TD="width: 139"] Kentucky
      [/TD]
      [TD="width: 139"] Louisiana
      [/TD]
      [TD="width: 139"] Maine
      [/TD]
      [/TR]
      [TR]
      [TD="width: 139"] Maryland
      [/TD]
      [TD="width: 139"] Massachusetts
      [/TD]
      [TD="width: 139"] Michigan
      [/TD]
      [TD="width: 139"] Minnesota
      [/TD]
      [TD="width: 139"] Mississippi
      [/TD]
      [/TR]
      [TR]
      [TD="width: 139"] Missouri
      [/TD]
      [TD="width: 139"] Montana
      [/TD]
      [TD="width: 139"] Nebraska
      [/TD]
      [TD="width: 139"] Nevada
      [/TD]
      [TD="width: 139"] New Hampshire
      [/TD]
      [/TR]
      [TR]
      [TD="width: 139"] New Jersey
      [/TD]
      [TD="width: 139"] New Mexico
      [/TD]
      [TD="width: 139"] New York
      [/TD]
      [TD="width: 139"] North Carolina
      [/TD]
      [TD="width: 139"] North Dakota
      [/TD]
      [/TR]
      [TR]
      [TD="width: 139"] Ohio
      [/TD]
      [TD="width: 139"] Oklahoma
      [/TD]
      [TD="width: 139"] Oregon
      [/TD]
      [TD="width: 139"] Pennsylvania
      [/TD]
      [TD="width: 139"] Rhode Island
      [/TD]
      [/TR]
      [TR]
      [TD="width: 139"] South Carolina
      [/TD]
      [TD="width: 139"] South Dakota
      [/TD]
      [TD="width: 139"] Tennessee
      [/TD]
      [TD="width: 139"] Texas
      [/TD]
      [TD="width: 139"] Utah
      [/TD]
      [/TR]
      [TR]
      [TD="width: 139"] Vermont
      [/TD]
      [TD="width: 139"] Virginia
      [/TD]
      [TD="width: 139"] Washington
      [/TD]
      [TD="width: 139"] West Virginia
      [/TD]
      [TD="width: 139"] Wisconsin
      [/TD]
      [/TR]
      [TR]
      [TD="width: 139"] Wyoming
      [/TD]
      [TD="width: 139"] New York City
      [/TD]
      [TD="width: 139"] Puerto Rico
      [/TD]
      [TD="width: 139"] Virgin Islands
      [/TD]
      [TD="width: 139"] [/TD]
      [/TR]
      [/TABLE]
      World Health Organization: Additional influenza surveillance information from participating WHO member nations is available throughFluNet and the Global Epidemiology Reports.
      WHO Collaborating Centers for Influenza located in Australia, China, Japan, the United Kingdom, and the United States (CDC in Atlanta, Georgia).
      Europe: For the most recent influenza surveillance information from Europe, please see WHO/Europe and the European Centre for Disease Prevention and Control at http://www.flunewseurope.org/.
      Public Health Agency of Canada: The most up-to-date influenza information from Canada is available at http://www.phac-aspc.gc.ca/fluwatch/
      Public Health England: The most up-to-date influenza information from the United Kingdom is available athttps://www.gov.uk/government/statistics/weekly-national-flu-reports
      • Any links provided to non-Federal organizations are provided solely as a service to our users. These links do not constitute an endorsement of these organizations or their programs by CDC or the Federal Government, and none should be inferred. CDC is not responsible for the content of the individual organization web pages found at these links.
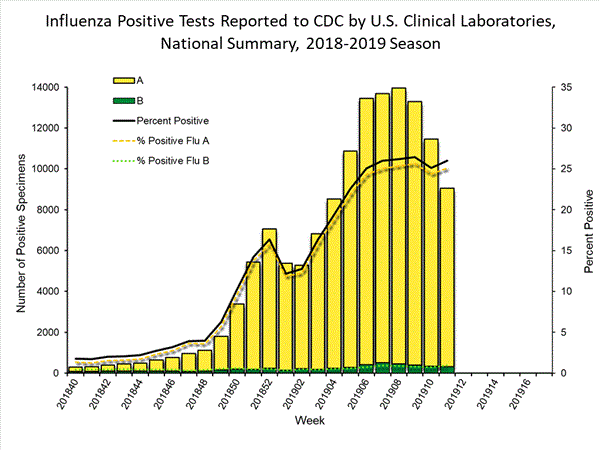
        An overview of the CDC influenza surveillance system, including methodology and detailed descriptions of each data component, is available at: http://www.cdc.gov/flu/weekly/overview.htm.
        --------------------------------------------------------------------------------
https://www.cdc.gov/flu/weekly/index.htm
 
[FONT=&quot] [h=1]Weekly U.S. Influenza Surveillance Report[/h] Espa?ol
fluview_hdr.jpg

[h=3]2018-2019 Influenza Season Week 19 ending May 11, 2019[/h] All data are preliminary and may change as more reports are received.
An overview of the CDC influenza surveillance system, including methodology and detailed descriptions of each data component, is available at http://www.cdc.gov/flu/weekly/overview.htm.
[h=3]Synopsis:[/h] Influenza activity continues to decrease in the United States. While influenza A(H1N1)pdm09 viruses predominated from October to mid-February, influenza A(H3N2) viruses have been more commonly identified since late February. Small numbers of influenza B viruses also have been reported. Below is a summary of the key influenza indicators for the week ending May 11, 2019:
  • Viral Surveillance:The percentage of respiratory specimens testing positive for influenza viruses in clinical laboratories decreased. During the most recent three weeks, influenza A(H3) viruses were reported more frequently than influenza A(H1N1)pdm09 viruses nationally.
    • Virus Characterization:The majority of influenza A(H1N1)pdm09 and influenza B viruses characterized antigenically are similar to the cell-grown reference viruses representing the 2018?2019 Northern Hemisphere influenza vaccine viruses. However, the majority of influenza A(H3N2) viruses are antigenically distinguishable from A/Singapore/INFIMH-16-0019/2016 (3C.2a1), a cell-propagated reference virus representing the A(H3N2) component of 2018-19 Northern Hemisphere influenza vaccines.
    • Antiviral Resistance:The vast majority of influenza viruses tested (>99%) show susceptibility to oseltamivir and peramivir. All influenza viruses tested showed susceptibility to zanamivir.
  • Influenza-like Illness Surveillance:The proportion of outpatient visits for influenza-like illness (ILI) decreased to 1.5%, which is below the national baseline of 2.2%. All regions reported ILI below their region-specific baseline level.
    • ILI State Activity Indictor Map: Puerto Rico and one state experienced low ILI activity; and New York City and 49 states experienced minimal ILI activity; and the District of Columbia and the U.S. Virgin Islands had insufficient data.
  • Geographic Spread of Influenza: The geographic spread of influenza in Puerto Rico and four states was reported as regional; 16 states reported local activity; the District of Columbia, the U.S. Virgin Islands and 28 states reported sporadic activity; two states reported no activity; and Guam did not report.
  • Influenza-associated Hospitalizations A cumulative rate of 65.7 laboratory-confirmed influenza-associated hospitalizations per 100,000 population was reported. The highest hospitalization rate is among adults 65 years and older (221.8 hospitalizations per 100,000 population).
  • Pneumonia and Influenza Mortality: The proportion of deaths attributed to pneumonia and influenza (P&I) was below the system-specific epidemic threshold in the National Center for Health Statistics (NCHS) Mortality Surveillance System.
  • Influenza-associated Pediatric Deaths: Three influenza-associated pediatric deaths were reported to CDC during week 19.
[h=3]National and Regional Summary of Select Surveillance Components[/h]
[TABLE="class: table table-bordered, width: 985"]
[TR]
[/TR]
[TR]
HHS Surveillance Regions* Data for current week National data is for the current week
Regional data is for the most recent three weeks

[/TR]
[TR]
Out-patient ILI? Number of jurisdictions reporting regional or widespread activity? % respiratory specimens positive for flu in clinical laboratories Predominant flu virus reported by public health laboratories [/TR]
[TR]
[/TR]
[TR]
Nation [TD]Normal[/TD]
[TD]5 of 54[/TD]
[TD]3.7%[/TD]
[TD]Influenza A(H3)[/TD]
[/TR]
[TR]
Region 1 [TD]Normal[/TD]
[TD]2 of 6[/TD]
[TD]6.8%[/TD]
[TD]Influenza A[/TD]
[/TR]
[TR]
Region 2 [TD]Normal[/TD]
[TD]2 of 4[/TD]
[TD]3.7%[/TD]
[TD]Influenza A(H3)[/TD]
[/TR]
[TR]
Region 3 [TD]Normal[/TD]
[TD]0 of 6[/TD]
[TD]1.7%[/TD]
[TD]Influenza A[/TD]
[/TR]
[TR]
Region 4 [TD]Normal[/TD]
[TD]0 of 8[/TD]
[TD]5.6%[/TD]
[TD]Influenza A(H3)[/TD]
[/TR]
[TR]
Region 5 [TD]Normal[/TD]
[TD]0 of 6[/TD]
[TD]6.5%[/TD]
[TD]Influenza A(H3)[/TD]
[/TR]
[TR]
Region 6 [TD]Normal[/TD]
[TD]0 of 5[/TD]
[TD]5.0%[/TD]
[TD]Influenza A[/TD]
[/TR]
[TR]
Region 7 [TD]Normal[/TD]
[TD]0 of 4[/TD]
[TD]2.7%[/TD]
[TD]Influenza A[/TD]
[/TR]
[TR]
Region 8 [TD]Normal[/TD]
[TD]0 of 6[/TD]
[TD]3.5%[/TD]
[TD]Influenza A(H3)[/TD]
[/TR]
[TR]
Region 9 [TD]Normal[/TD]
[TD]1 of 5[/TD]
[TD]5.9%[/TD]
[TD]Influenza A(H3)[/TD]
[/TR]
[TR]
Region 10 [TD]Normal[/TD]
[TD]0 of 4[/TD]
[TD]2.7%[/TD]
[TD]Influenza A[/TD]
[/TR]
[/TABLE]

*https://www.hhs.gov/about/agencies/iea/regional-offices/index.html
? Elevated means the % of visits for ILI is at or above the national or region-specific baseline
? Includes all 50 states, the District of Columbia, Guam, Puerto Rico, and U.S. Virgin Islands

[h=2]U.S. Virologic Surveillance:[/h] WHO and NREVSS collaborating laboratories, which include both public health and clinical laboratories located in all 50 states, Puerto Rico, Guam, and the District of Columbia, report to CDC the total number of respiratory specimens tested for influenza and the number positive for influenza by virus type. In addition, public health laboratories also report the influenza A subtype (H1 or H3) and influenza B lineage information of the viruses they test and the age or age group of the persons from whom the specimens were collected.
Additional virologic data, including national, regional and select state-level data, can be found at: http://gis.cdc.gov/grasp/fluview/fluportaldashboard.html. Age group proportions and totals by influenza subtype reported by public health laboratories can be found at: http://gis.cdc.gov/grasp/fluview/flu_by_age_virus.html.
The results of tests performed by clinical laboratories are summarized below.
[TABLE="class: table table-bordered table-condensed opt-in, width: 945"]
[TR]
[TD="width: 200"] [/TD]
Week 19 Data Cumulative since
September 30, 2018 (Week 40) [/TR]
[TR="class: expanded"]
No. of specimens tested [TD]13,661[/TD]
[TD]1,123,357[/TD]
[/TR]
[TR="class: expanded"]
No. of positive specimens (%) [TD]506 (3.7%)[/TD]
[TD]176,109 (15.7%)[/TD]
[/TR]
[TR="class: expanded"]
Positive specimens by type [TD] [/TD]
[TD] [/TD]
[/TR]
[TR="class: expanded"]
Influenza A [TD]308 (60.9%)[/TD]
[TD]166,996 (94.8%)[/TD]
[/TR]
[TR="class: expanded faded"]
Influenza B [TD]198 (39.1%)[/TD]
[TD]9,113 (5.2%)[/TD]
[/TR]
[/TABLE]

View National and Regional Level Graphs and Data | View Chart Data | View Full Screen | View PowerPoint Presentation The results of tests performed by public health laboratories are summarized below.
[TABLE="class: table table-bordered table-condensed opt-in, width: 945"]
[TR]
[TD] [/TD]
Week 19 Data Cumulative since
September 30, 2018 (Week 40) [/TR]
[TR]
No. of specimens tested [TD]336[/TD]
[TD]78,965[/TD]
[/TR]
[TR]
No. of positive specimens* [TD]51[/TD]
[TD]41,452[/TD]
[/TR]
[TR]
Positive specimens by type/subtype [TD] [/TD]
[TD] [/TD]
[/TR]
[TR]
[/TR]
[TR]
Influenza A [TD]35 (68.6%)[/TD]
[TD]39,908 (96.3%)[/TD]
[/TR]
[TR]
(H1N1)pdm09 [TD]14 (43.8%)[/TD]
[TD]21,855 (57.0%)[/TD]
[/TR]
[TR]
H3N2 [TD]18 (56.3%)[/TD]
[TD]16,490 (43.0%)[/TD]
[/TR]
[TR]
Subtyping not performed [TD]3[/TD]
[TD]1,563[/TD]
[/TR]
[TR]
[/TR]
[TR]
Influenza B [TD]16 (31.4%)[/TD]
[TD]1,544 (3.7%)[/TD]
[/TR]
[TR]
Yamagata lineage [TD]2 (25.0%)[/TD]
[TD]381(38.2%)[/TD]
[/TR]
[TR]
Victoria lineage [TD] 6 (75.0%)
[/TD]
[TD]617 (61.8%)[/TD]
[/TR]
[TR]
Lineage not performed [TD]8[/TD]
[TD]546[/TD]
[/TR]
[/TABLE]
*The percent of specimens testing positive for influenza is not reported because public health laboratories often receive samples that have already tested positive for influenza at a clinical laboratory and therefore percent positive would not be a valid indicator of influenza activity. Additional information is available at http://www.cdc.gov/flu/weekly/overview.htm.


View National and Regional Level Graphs and Data | View Chart Data | View Full Screen | View PowerPoint Presentation [h=2]Influenza Virus Characterization:[/h] Close monitoring of influenza viruses is required to better assess the potential impact on public health. CDC characterizes influenza viruses through one or more tests including genomic sequencing, hemagglutination inhibition (HI) and/or neutralization based Focus Reduction assays (FRA). These data are used to compare how similar currently circulating influenza viruses are to the reference viruses used for developing new influenza vaccines and to monitor evolutionary changes that continually occur in influenza viruses circulating in humans. Antigenic and genetic characterization of circulating influenza viruses gives an indication of the influenza vaccine's ability to induce an immune response against the wide array of influenza viruses that are co-circulating every season. However, annual vaccine effectiveness estimates are needed to determine how much protection was provided to the population by vaccination. On February 14, 2019, interim influenza effectiveness estimates for the 2018-2019 season were released and are available here.
For nearly all influenza-positive surveillance samples received at CDC, next-generation sequencing is performed to determine the genetic identity of circulating influenza viruses and to monitor the evolutionary trajectory of viruses circulating in our population. Virus gene segments are classified into genetic clades/subclades based on phylogenetic analysis. However, genetic changes that classify the clades/subclades do not always result in antigenic changes. ?Antigenic drift? is a term used to describe gradual antigenic change that occurs as viruses evolve changes to escape host immune pressure. Antigenic drift is evaluated by comparing antigenic properties of cell-propagated reference viruses representing currently recommended vaccine components with those of cell-propagated circulating viruses.
CDC has antigenically or genetically characterized 2,612 influenza viruses collected September 30, 2018 ? May 11, 2019, and submitted by U.S. laboratories, including 1,199 influenza A(H1N1)pdm09 viruses, 984 influenza A(H3N2) viruses, and 429 influenza B viruses.
Influenza A Viruses
Influenza B Viruses

The majority of U.S. viruses submitted for characterization come from state and local public health laboratories. Due toRight Size Roadmap considerations, specimen submission guidance to laboratories is that, if available, 2 influenza A(H1N1)pdm09, 2 influenza A(H3N2), and 2 influenza B viruses be submitted every other week. Therefore, the numbers of each virus type/subtype characterized should be more balanced across subtypes/lineages but will not reflect the actual proportion of circulating viruses. In the figure below, the results of tests performed by public health labs are shown on the left and CDC sequence results (by genetic clade/subclade) are shown on the right.
Genetic19_small.gif

View Chart Data | View Full Screen | View PowerPoint Presentation [h=2]2019-2020 Influenza Season - U.S. Influenza Vaccine Composition:[/h] The World Health Organization (WHO) has recommended the Northern Hemisphere 2019-2020 influenza vaccine composition, and the Food and Drug Administration?s Vaccines and Related Biological Products Advisory Committee (VRBPAC) subsequently made the influenza vaccine composition recommendation for the United States. Both agencies recommend that influenza trivalent vaccines contain:
It is recommended that quadrivalent vaccines, which have two influenza B viruses, contain the viruses recommended for the trivalent vaccines, as well as a B/Phuket/3073/2013-like (B/Yamagata lineage) virus. The (H1N1)pdm09 and H3N2 recommendations represents an update to the 2018-2019 Northern Hemisphere vaccines. These vaccine recommendations were based on several factors, including global influenza virologic and epidemiologic surveillance, genetic characterization, antigenic characterization and the candidate vaccine viruses that are available for production.
[h=2]Antiviral Resistance:[/h] Testing of influenza A(H1N1)pdm09, influenza A(H3N2), and influenza B viruses for resistance to the neuraminidase inhibitors (oseltamivir, zanamivir, and peramivir) is performed at CDC using next-generation sequencing analysis and/or a functional assay. Neuraminidase sequences of viruses are inspected to detect the presence of amino acid substitutions,previously associated with reduced or highly reduced inhibition by any of three neuraminidase inhibitors. In addition, a subset of viruses are tested using the neuraminidase inhibition assay with three neuraminidase inhibitors. The level of neuraminidase activity inhibition is reported using the thresholds recommended by the World Health Organization Expert Working Group of the Global Influenza Surveillance and Response System (GISRS)These samples are routinely obtained for surveillance purposes rather than for diagnostic testing of patients suspected to be infected with an antiviral-resistant virus.
Reporting of baloxavir susceptibility testing for the 2018-2019 influenza season will begin later this season. More information regarding influenza antiviral drug resistance can be found here.
High levels of resistance to the adamantanes (amantadine and rimantadine) persist among influenza A(H1N1)pdm09 and influenza A(H3N2) viruses (the adamantanes are not effective against influenza B viruses). Therefore, data from adamantane resistance testing are not presented below.
[h=3]Assessment of Virus Susceptibility to Neuraminidase Inhibitors Using Next-Generation Sequencing Analysis and/or Neuraminidase Inhibition Assay[/h]
[TABLE="class: table table-bordered opt-in, width: 990"]
[TR]
Type/Subtype or Lineage Inhibition of Neuraminidase Activity by Antiviral Drug [/TR]
[TR]
[TD="colspan: 3"]Oseltamivir[/TD]
[TD="colspan: 3"]Peramivir[/TD]
[TD="colspan: 3"]Zanamivir[/TD]
[/TR]
[TR]
Virus Tested (n) Reduced, Number (%) Highly Reduced, Number (%) Virus Tested (n) Reduced, Number (%) Highly Reduced, Number (%) Virus Tested (n) Reduced, Number (%) Highly Reduced, Number (%) [/TR]
[TR]
Total Viruses [TD]2,547[/TD]
[TD]2 (0.1%)[/TD]
[TD]4 (0.2%)[/TD]
[TD]2,547[/TD]
[TD]0 (0%)[/TD]
[TD]4 (0.2%)[/TD]
[TD]2,547[/TD]
[TD]0 (0%)[/TD]
[TD]0 (0%)[/TD]
[/TR]
[TR]
A(H1N1)pdm09 [TD]1,183[/TD]
[TD]2 (0.2%)[/TD]
[TD]4 (0.3%)[/TD]
[TD]1,183[/TD]
[TD]0 (0%)[/TD]
[TD]4 (0.3%)[/TD]
[TD]1,183[/TD]
[TD]0 (0%)[/TD]
[TD]0 (0%)[/TD]
[/TR]
[TR]
A(H3N2) [TD]969[/TD]
[TD]0 (0%)[/TD]
[TD]0 (0%)[/TD]
[TD]969[/TD]
[TD]0 (0%)[/TD]
[TD]0 (0%)[/TD]
[TD]969[/TD]
[TD]0 (0%)[/TD]
[TD]0 (0%)[/TD]
[/TR]
[TR]
B/Victoria [TD]215[/TD]
[TD]0 (0%)[/TD]
[TD]0 (0%)[/TD]
[TD]215[/TD]
[TD]0 (0%)[/TD]
[TD]0 (0%)[/TD]
[TD]215[/TD]
[TD]0 (0%)[/TD]
[TD]0 (0%)[/TD]
[/TR]
[TR]
B/Yamagata [TD]180[/TD]
[TD]0 (0%)[/TD]
[TD]0 (0%)[/TD]
[TD]180[/TD]
[TD]0 (0%)[/TD]
[TD]0 (0%)[/TD]
[TD]180[/TD]
[TD]0 (0%)[/TD]
[TD]0 (0%)[/TD]
[/TR]
[/TABLE]

Antiviral treatment as early as possible is recommended for patients with confirmed or suspected influenza who have severe, complicated, or progressive illness; who require hospitalization; or who are at high risk for serious influenza-related complications. Additional information on recommendations for treatment and chemoprophylaxis of influenza virus infection with antiviral agents is available at:http://www.cdc.gov/flu/antivirals/index.htm.


[h=2]Outpatient Illness Surveillance:[/h] Nationwide during week 19, 1.5% of patient visits reported through the U.S. Outpatient Influenza-like Illness Surveillance Network (ILINet) were due to influenza-like illness (ILI). This percentage is below the national baseline of 2.2%. (ILI is defined as fever (temperature of 100?F [37.8?C] or greater) and cough and/or sore throat.)
On a regional level, the percentage of outpatient visits for ILI ranged from 0.7% to 2.2% during week 19. All regions reported a percentage of outpatient visits for ILI below their region-specific baseline..
Additional data on medically attended visits for ILI for current and past seasons and by geography (national, HHS region, or select states) are available on FluView Interactive http://gis.cdc.gov/grasp/fluview/fluportaldashboard.html.

View National and Regional Level Graphs and Data | View Chart Data | View Full Screen | View PowerPoint Presentation


[h=2]ILINet State Activity Indicator Map:[/h] Data collected in ILINet are used to produce a measure of ILI activity* by state. Activity levels are based on the percent of outpatient visits in a state due to ILI and are compared to the average percent of ILI visits that occur during weeks with little or no influenza virus circulation. Activity levels range from minimal, which would correspond to ILI activity from outpatient clinics being below, or only slightly above, the average, to high, which would correspond to ILI activity from outpatient clinics being much higher than average.
The ILI Activity Indicator Map displays state-specific activity levels for multiple seasons and allows a visual representation of relative activity from state to state. More information is available on FluView Interactive at https://gis.cdc.gov/grasp/fluview/main.html.
During week 19, the following ILI activity levels were experienced:


*This map uses the proportion of outpatient visits to health care providers for ILI to measure the ILI activity level within a state. It does not, however, measure the extent of geographic spread of flu within a state. Therefore, outbreaks occurring in a single city could cause the state to display high activity levels.
Data collected in ILINet may disproportionally represent certain populations within a state, and therefore, may not accurately depict the full picture of influenza activity for the whole state.
Data displayed in this map are based on data collected in ILINet, whereas the State and Territorial flu activity map is based on reports from state and territorial epidemiologists. The data presented in this map are preliminary and may change as more data are received.
Differences in the data presented here by CDC and independently by some state health departments likely represent differing levels of data completeness with data presented by the state likely being the more complete.


[h=2]Geographic Spread of Influenza as Assessed by State and Territorial Epidemiologists[/h] The influenza activity reported by state and territorial epidemiologists indicates geographic spread of influenza viruses, but does not measure the severity of influenza activity. Additional data displaying the influenza activity reported by state and territorial epidemiologists for the current and past seasons are available on FluView Interactive at https://gis.cdc.gov/grasp/fluview/FluView8.html
During week 19, the following influenza activity was reported:
    • A (H1N1)pdm09: Phylogenetic analysis of the HA genes from 1,199 A(H1N1)pdm09 viruses showed that all belonged to clade 6B.1. Three hundred and five A(H1N1)pdm09 viruses were antigenically characterized, and 296 (97%) were antigenically similar (analyzed using HI with ferret antisera) to A/Michigan/45/2015 (6B.1), a cell-propagated A/Michigan/45/2015-like reference virus representing the A(H1N1)pdm09 component for the 2018-19 Northern Hemisphere influenza vaccines.
    • A (H3N2): Phylogenetic analysis of the HA genes from 984 A(H3N2) viruses revealed extensive genetic diversity with multiple clades/subclades co-circulating. The HA genes of circulating viruses belonged to clade 3C.2a (n=66), subclade 3C.2a1 (n=195) or clade 3C.3a (n=723). Three hundred eighty-six A(H3N2) viruses were antigenically characterized by FRA with ferret antisera, and 169 (43.8%) A(H3N2) viruses tested were well-inhibited (reacting at titers that were within 4-fold of the homologous virus titer) by ferret antisera raised against A/Singapore/INFIMH-16-0019/2016 (3C.2a1), a cell-propagated reference virus representing the A(H3N2) component of 2018-19 Northern Hemisphere influenza vaccines. Two hundred and seventeen (56.2%) viruses reacted poorly (at titers that were 8-fold or greater reduced compared with that of the homologous virus A/Singapore/INFIMH-16-0019/2016) and of those, 216 (99.5%) belonged to clade 3C.3a.
    • B/Victoria: Phylogenetic analysis of 237 B/Victoria-lineage viruses indicate that all HA genes belonged to genetic clade V1A, however genetic subclades which are antigenically distinct have emerged. Genetic subclades which are antigenically distinct include viruses with a two amino acid deletion (162-163) in the HA protein (V1A.1, previously abbreviated as V1A-2Del) and viruses with a three amino acid deletion (162-164) in the HA protein (abbreviated as V1A-3Del). One hundred sixty B/Victoria lineage viruses were antigenically characterized and 127 (79.4%) were antigenically similar with ferret antisera raised against cell-propagated B/Colorado/06/2017-like V1A.1 reference virus. Thirty-three (20.6%) viruses reacted poorly (at titers that were 8-fold or greater reduced compared with the homologous virus titer) and belonged to clade V1A or genetic subclade V1A-3Del.
    • B/Yamagata: Phylogenetic analysis of 192 influenza B/Yamagata-lineage viruses indicate that the HA genes belonged to clade Y3. A total of 168 influenza B/Yamagata-lineage viruses were antigenically characterized, and all were antigenically similar to cell-propagated B/Phuket/3073/2013 (Y3), the reference vaccine virus representing the influenza B/Yamagata-lineage component of the 2018-19 Northern Hemisphere quadrivalent vaccines.
    • an A/Brisbane/02/2018 (H1N1)pdm09-like virus
    • an A/Kansas/14/2017 (H3N2)-like virus and
    • a B/Colorado/06/2017-like (B/Victoria lineage) virus
    • Puerto Rico and one state (Kentucky) experienced low ILI activity.
    • New York City and 49 states (Alabama, Alaska, Arizona, Arkansas, California, Colorado, Connecticut, Delaware, Florida, Georgia, Hawaii, Idaho, Illinois, Indiana, Iowa, Kansas, Louisiana, Maine, Maryland, Massachusetts, Michigan, Minnesota, Mississippi, Missouri, Montana, Nebraska, Nevada, New Hampshire, New Jersey, New Mexico, New York, North Carolina, North Dakota, Ohio, Oklahoma, Oregon, Pennsylvania, Rhode Island, South Carolina, South Dakota, Tennessee, Texas, Utah, Vermont, Virginia, Washington, West Virginia, Wisconsin and Wyoming) experienced minimal ILI activity.
    • Data were insufficient to calculate an ILI activity level from the District of Columbia and the U.S. Virgin Islands.
    • Regional influenza activity was reported by Puerto Rico and four states (Arizona, Connecticut, Massachusetts and New York).
    • Regional influenza activity was reported by Puerto Rico and seven states (Arizona, Connecticut, Kentucky, Nevada, Ohio, Utah and Washington).
    • Local influenza activity was reported by 16 states (Florida, Georgia, Hawaii, Kentucky, Louisiana, Maine, Michigan, Minnesota, Nevada, New Hampshire, Ohio, Pennsylvania, South Carolina, Utah, Vermont and Washington).
    • Sporadic influenza activity was reported by the District of Columbia, the U.S. Virgin Islands and 28 states (Alabama, Arkansas, California, Colorado, Delaware, Idaho, Illinois, Indiana, Iowa, Maryland, Mississippi, Missouri, Montana, Nebraska, New Jersey, New Mexico, North Carolina, North Dakota, Oklahoma, Oregon, Rhode Island, South Dakota, Tennessee, Texas, Virginia, West Virginia, Wisconsin and Wyoming).
    • No activity was reported by two states (Alaska and Kansas).
    • Guam did not report.
      [h=2]Influenza-Associated Hospitalizations:[/h] The Influenza Hospitalization Surveillance Network (FluSurv-NET) conducts population-based surveillance for laboratory-confirmed influenza-related hospitalizations in select counties in the Emerging Infections Program (EIP) states and Influenza Hospitalization Surveillance Project (IHSP) states.
      A total of 18,973 laboratory-confirmed influenza-associated hospitalizations were reported by FluSurv-NET sites between October 1, 2018 and April 30, 2019. The overall hospitalization rate was 65.7 per 100,000 population. The highest rate of hospitalization was among adults aged ≥65 (221.5 per 100,000 population), followed by adults aged 50-64 (81.3 per 100,000 population) and children aged 0-4 (73.6 per 100,000 population). Among 18,973 hospitalizations, 18,104 (95.4%) were associated with influenza A virus, 717 (3.8%) with influenza B virus, 41 (0.2%) with influenza A virus and influenza B virus co-infection, and 111 (0.6%) with influenza virus for which the type was not determined. Among those with influenza A subtype information, 3,234 (53.9%) were A(H1N1)pdm09 virus and 2,764 (46.1%) were A(H3N2).
      Among 4,565 hospitalized adults with information on underlying medical conditions, 91.7% had at least one reported underlying medical condition, the most commonly reported were cardiovascular disease, metabolic disorder, and obesity. Among 852 hospitalized children with information on underlying medical conditions, 52.7% had at least one underlying medical condition; the most commonly reported was asthma. Among 593 hospitalized women of childbearing age (15-44 years) with information on pregnancy status, 27.2% were pregnant.
      While patients admitted after April 30, 2019 will not be included, data on patients admitted through April 30, 2019 will continue to be updated as additional information is received.
      Additional FluSurv-NET data displaying hospitalization rates for the current and past seasons and different age groups (including rates for patients 65-74 years, 74-84 years, and 85 years of age and older), as well as data on patient characteristics (such as influenza virus type, demographic, and clinical information), are available on FluView Interactive at: http://gis.cdc.gov/GRASP/Fluview/FluHospRates.html and http://gis.cdc.gov/grasp/fluview/FluHospChars.html.
      FluSurv-Net data is used to generate national estimates of the total numbers of flu cases, medical visits, hospitalizations, and deaths. This season, CDC is reporting preliminary cumulative in-season estimates, which are available at https://cdc.gov/flu/about/burden/preliminary-in-season-estimates.htm.
      [SIZE=1.5]Data from the Influenza Hospitalization Surveillance Network (FluSurv-NET), a population-based surveillance for influenza related hospitalizations in children and adults in 13 U.S. states. Cumulative incidence rates are calculated using the National Center for Health Statistics? (NCHS) population estimates for the counties included in the surveillance catchment area.

    • View Interactive Application | View Full Screen | View PowerPoint Presentation
      [SIZE=1.5]FluSurv-NET data are preliminary and displayed as they become available. Therefore, figures are based on varying denominators as some variables represent information that may require more time to be collected. Data are refreshed and updated weekly. Asthma includes a medical diagnosis of asthma or reactive airway disease; Cardiovascular diseases include conditions such as coronary heart disease, cardiac valve disorders, congestive heart failure, and pulmonary hypertension; does not include isolated hypertension; Chronic lung diseasesinclude conditions such as chronic obstructive pulmonary disease, bronchiolitis obliterans, chronic aspiration pneumonia, and interstitial lung disease; Immune suppression includes conditions such as immunoglobulin deficiency, leukemia, lymphoma, HIV/AIDS, and individuals taking immunosuppressive medications; Metabolic disorders include conditions such as diabetes mellitus; Neurologic diseases include conditions such as seizure disorders, cerebral palsy, and cognitive dysfunction; Neuromuscular diseases include conditions such as multiple sclerosis and muscular dystrophy; Obesity was assigned if indicated in patient's medical chart or if body mass index (BMI) >30 kg/m2; Pregnancy percentage calculated using number of female cases aged between 15 and 44 years of age as the denominator; Renal diseases include conditions such as acute or chronic renal failure, nephrotic syndrome, glomerulonephritis, and impaired creatinine clearance; No known condition indicates that the case did not have any known high risk medical condition indicated in medical chart at the time of hospitalization.[/SIZE]
      View Interactive Application | View Full Screen | View PowerPoint Presentation

      [h=2]Pneumonia and Influenza (P&I) Mortality Surveillance:[/h] Based on National Center for Health Statistics (NCHS) mortality surveillance data available on May 16, 2019, 5.6% of the deaths occurring during the week ending May 4, 2019 (week 18) were due to P&I. This percentage is below the epidemic threshold of 6.7% for week 18.
      Additional pneumonia and influenza mortality data for current and past seasons and by geography (national, HHS region, or state) are available on FluView Interactive http://gis.cdc.gov/grasp/fluview/mortality.html. Data displayed on the regional and state-level are aggregated by the state of residence of the decedent.
      NCHS19_small.gif

      View Regional and State Level Data | View Chart Data | View Full Screen | View PowerPoint Presentation

      [h=2]Influenza-Associated Pediatric Mortality:[/h] Three influenza-associated pediatric deaths were reported to CDC during week 19. Two deaths were associated with an influenza A(H1N1)pdm09 virus and occurred during weeks 13 and 18 (the weeks ending March 30 and May 4, 2019). One death was associated with an influenza A virus for which no subtyping was performed and occurred during week 18 (the week ending May 4, 2019).
      A total of 109 influenza-associated pediatric deaths occurring during the 2018-2019 season have been reported to CDC.
      Additional information on influenza-associated pediatric deaths including basic demographics, underlying conditions, bacterial co-infections, and place of death for the current and past seasons, is available on FluView Interactive http://gis.cdc.gov/GRASP/Fluview/PedFluDeath.html.

      View Interactive Application | View Full Screen | View PowerPoint Presentation


      [h=2]Additional National and International Influenza Surveillance Information[/h] FluView Interactive: FluView includes enhanced web-based interactive applications that can provide dynamic visuals of the influenza data collected and analyzed by CDC. These FluView Interactive applications allow people to create customized, visual interpretations of influenza data, as well as make comparisons across flu seasons, regions, age groups and a variety of other demographics. To access these tools, visithttp://www.cdc.gov/flu/weekly/fluviewinteractive.htm.
      U.S. State and local influenza surveillance: Click on a jurisdiction below to access the latest local influenza information.


      [TD="width: 139"] Alabama
      [/TD]
      [TD="width: 139"] Alaska
      [/TD]
      [TD="width: 139"] Arizona
      [/TD]
      [TD="width: 139"] Arkansas
      [/TD]
      [TD="width: 139"] California
      [/TD]

      [TD="width: 139"] Colorado
      [/TD]
      [TD="width: 139"] Connecticut
      [/TD]
      [TD="width: 139"] Delaware
      [/TD]
      [TD="width: 139"] District of Columbia
      [/TD]
      [TD="width: 139"] Florida
      [/TD]

      [TD="width: 139"] Georgia
      [/TD]
      [TD="width: 139"] Hawaii
      [/TD]
      [TD="width: 139"] Idaho
      [/TD]
      [TD="width: 139"] Illinois
      [/TD]
      [TD="width: 139"] Indiana
      [/TD]

      [TD="width: 139"] Iowa
      [/TD]
      [TD="width: 139"] Kansas
      [/TD]
      [TD="width: 139"] Kentucky
      [/TD]
      [TD="width: 139"] Louisiana
      [/TD]
      [TD="width: 139"] Maine
      [/TD]

      [TD="width: 139"] Maryland
      [/TD]
      [TD="width: 139"] Massachusetts
      [/TD]
      [TD="width: 139"] Michigan
      [/TD]
      [TD="width: 139"] Minnesota
      [/TD]
      [TD="width: 139"] Mississippi
      [/TD]

      [TD="width: 139"] Missouri
      [/TD]
      [TD="width: 139"] Montana
      [/TD]
      [TD="width: 139"] Nebraska
      [/TD]
      [TD="width: 139"] Nevada
      [/TD]
      [TD="width: 139"] New Hampshire
      [/TD]

      [TD="width: 139"] New Jersey
      [/TD]
      [TD="width: 139"] New Mexico
      [/TD]
      [TD="width: 139"] New York
      [/TD]
      [TD="width: 139"] North Carolina
      [/TD]
      [TD="width: 139"] North Dakota
      [/TD]

      [TD="width: 139"] Ohio
      [/TD]
      [TD="width: 139"] Oklahoma
      [/TD]
      [TD="width: 139"] Oregon
      [/TD]
      [TD="width: 139"] Pennsylvania
      [/TD]
      [TD="width: 139"] Rhode Island
      [/TD]

      [TD="width: 139"] South Carolina
      [/TD]
      [TD="width: 139"] South Dakota
      [/TD]
      [TD="width: 139"] Tennessee
      [/TD]
      [TD="width: 139"] Texas
      [/TD]
      [TD="width: 139"] Utah
      [/TD]

      [TD="width: 139"] Vermont
      [/TD]
      [TD="width: 139"] Virginia
      [/TD]
      [TD="width: 139"] Washington
      [/TD]
      [TD="width: 139"] West Virginia
      [/TD]
      [TD="width: 139"] Wisconsin
      [/TD]

      [TD="width: 139"] Wyoming
      [/TD]
      [TD="width: 139"] New York City
      [/TD]
      [TD="width: 139"] Puerto Rico
      [/TD]
      [TD="width: 139"] Virgin Islands
      [/TD]
      [TD="width: 139"] [/TD]
      World Health Organization: Additional influenza surveillance information from participating WHO member nations is available through FluNet and the Global Epidemiology Reports.
      WHO Collaborating Centers for Influenza located in Australia, China, Japan, the United Kingdom, and the United States (CDC in Atlanta, Georgia).
      Europe: For the most recent influenza surveillance information from Europe, please see WHO/Europe and the European Centre for Disease Prevention and Control at http://www.flunewseurope.org/.
      Public Health Agency of Canada: The most up-to-date influenza information from Canada is available athttp://www.phac-aspc.gc.ca/fluwatch/
      Public Health England: The most up-to-date influenza information from the United Kingdom is available athttps://www.gov.uk/government/statistics/weekly-national-flu-reports
      • Any links provided to non-Federal organizations are provided solely as a service to our users. These links do not constitute an endorsement of these organizations or their programs by CDC or the Federal Government, and none should be inferred. CDC is not responsible for the content of the individual organization web pages found at these links.
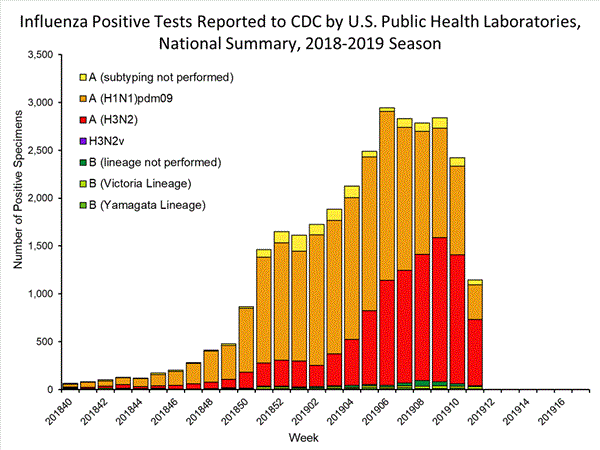
        An overview of the CDC influenza surveillance system, including methodology and detailed descriptions of each data component, is available at: http://www.cdc.gov/flu/weekly/overview.htm.
        --------------------------------------------------------------------------------


[/SIZE][/FONT]

[FONT=&quot]


[/FONT]

[FONT=&quot] [/FONT]
https://www.cdc.gov/flu/weekly/index.htm
 
[h=3]2018-2019 Influenza Season Week 21 ending May 25, 2019[/h] [FONT=&quot]All data are preliminary and may change as more reports are received.[/FONT]
[FONT=&quot]An overview of the CDC influenza surveillance system, including methodology and detailed descriptions of each data component, is available at http://www.cdc.gov/flu/weekly/overview.htm.[/FONT]
[h=2]U.S. Virologic Surveillance:[/h] [FONT=&quot]WHO and NREVSS collaborating laboratories, which include both public health and clinical laboratories located in all 50 states, Puerto Rico, Guam, and the District of Columbia, report to CDC the total number of respiratory specimens tested for influenza and the number positive for influenza by virus type. In addition, public health laboratories also report the influenza A subtype (H1 or H3) and influenza B lineage information of the viruses they test and the age or age group of the persons from whom the specimens were collected.[/FONT]
[FONT=&quot]Additional virologic data, including national, regional and select state-level data, can be found at: http://gis.cdc.gov/grasp/fluview/fluportaldashboard.html. Age group proportions and totals by influenza subtype reported by public health laboratories can be found at: http://gis.cdc.gov/grasp/fluview/flu_by_age_virus.html.[/FONT]

View National and Regional Level Graphs and Data | View Chart Data | View Full Screen | View PowerPoint Presentation

View National and Regional Level Graphs and Data | View Chart Data | View Full Screen | View PowerPoint Presentation [h=2]Novel Influenza A Virus:[/h] [FONT=&quot]One human infection with a novel influenza A virus was reported by Michigan. This person was infected with an influenza A(H1N1) variant (A(H1N1)v) virus. The patient is an adult > 65 years of age, was hospitalized, and completely recovered from their illness. While no exposure to swine has been reported, an investigation is ongoing into the source of the patient?s infection. This is the first A(H1N1)v virus infection detected in the United States in 2019.[/FONT]
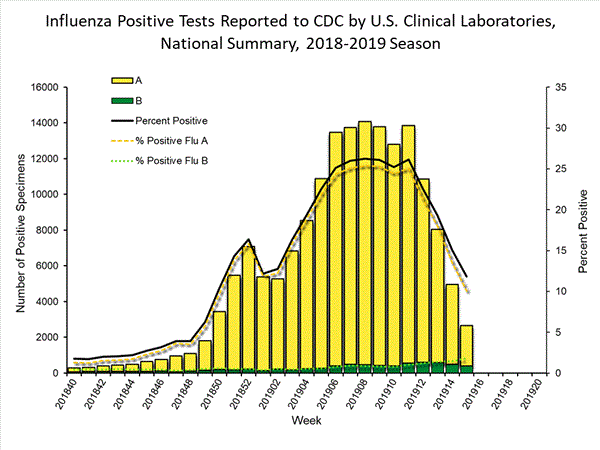
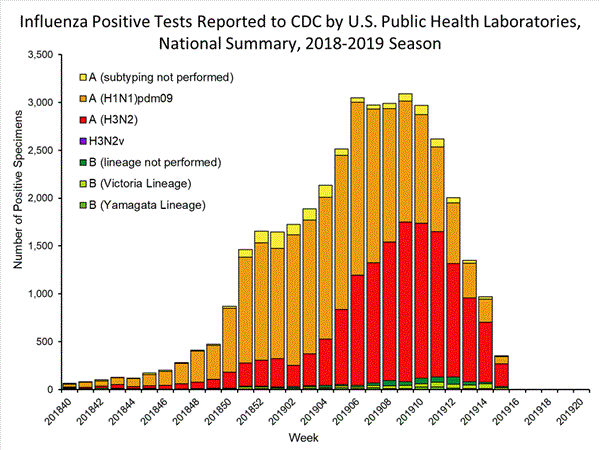
[FONT=&quot]Influenza viruses that circulate in swine are called swine influenza viruses when isolated from swine, but are called variant viruses when isolated from humans. Seasonal influenza viruses that circulate worldwide in the human population have important antigenic and genetic differences from influenza viruses that circulate in swine.[/FONT]
[FONT=&quot]Early identification and investigation of human infections with novel influenza A viruses are critical so that the risk of infection can be more fully understood and appropriate public health measures can be taken. Additional information on influenza in swine, variant influenza infection in humans, and strategies to interact safely with swine can be found athttp://www.cdc.gov/flu/swineflu/index.htm.[/FONT]
[FONT=&quot]Additional information regarding human infections with novel influenza A viruses can be found athttp://gis.cdc.gov/grasp/fluview/Novel_Influenza.html.[/FONT]


[h=2]Outpatient Illness Surveillance:[/h] [FONT=&quot]Nationwide during week 21, 1.5% of patient visits reported through the U.S. Outpatient Influenza-like Illness Surveillance Network (ILINet) were due to influenza-like illness (ILI). This percentage is below the national baseline of 2.2%. (ILI is defined as fever (temperature of 100?F [37.8?C] or greater) and cough and/or sore throat.)[/FONT]
[FONT=&quot]Additional data on medically attended visits for ILI for current and past seasons and by geography (national, HHS region, or select states) are available on FluView Interactive http://gis.cdc.gov/grasp/fluview/fluportaldashboard.html.[/FONT]

View National and Regional Level Graphs and Data | View Chart Data | View Full Screen | View PowerPoint Presentation
[h=2]Influenza-Associated Hospitalizations:[/h] [FONT=&quot]The Influenza Hospitalization Surveillance Network (FluSurv-NET) conducts all age population-based surveillance for laboratory-confirmed influenza-related hospitalizations in select counties in the Emerging Infections Program (EIP) states and Influenza Hospitalization Surveillance Project (IHSP) states.[/FONT]
[FONT=&quot]Additional FluSurv-NET data can be found at: [/FONT]http://gis.cdc.gov/GRASP/Fluview/FluHospRates.html[FONT=&quot] and [/FONT]http://gis.cdc.gov/grasp/fluview/FluHospChars.html[FONT=&quot].[/FONT] [FONT=&quot] [/FONT]


[h=2]Pneumonia and Influenza (P&I) Mortality Surveillance:[/h] [FONT=&quot]Based on National Center for Health Statistics (NCHS) mortality surveillance data available on May 30, 2019, 5.4% of the deaths occurring during the week ending May 18, 2019 (week 20) were due to P&I. This percentage is below the epidemic threshold of 6.5% for week 20.[/FONT]
[FONT=&quot]Additional pneumonia and influenza mortality data for current and past seasons and by geography (national, HHS region, or state) are available on FluView Interactive (http://gis.cdc.gov/grasp/fluview/mortality.html). Data displayed on the regional and state-level are aggregated by the state of residence of the decedent.[/FONT]
NCHS21_small.gif

View Regional and State Level Data | View Chart Data | View Full Screen | View PowerPoint Presentation

[h=2]Influenza-Associated Pediatric Mortality:[/h] [FONT=&quot]Two influenza-associated pediatric deaths were reported to CDC during week 21. Both deaths were associated with an influenza A (H3) virus and occurred during weeks 12 and 19 (the weeks ending March 23, 2019 and May 11, 2019, respectively).[/FONT]
[FONT=&quot]A total of 113 influenza-associated pediatric deaths occurring during the 2018-2019 season have been reported to CDC.[/FONT]
[FONT=&quot]Additional information on influenza-associated pediatric deaths including basic demographics, underlying conditions, bacterial co-infections, and place of death for the current and past seasons, is available on FluView Interactive ([/FONT]http://gis.cdc.gov/GRASP/Fluview/PedFluDeath.html[FONT=&quot]).[/FONT] [FONT=&quot] [/FONT]

View Interactive Application | View Full Screen | View PowerPoint Presentation

[FONT=&quot] [/FONT]
[h=2]Additional National and International Influenza Surveillance Information[/h] [FONT=&quot]FluView Interactive: FluView includes enhanced web-based interactive applications that can provide dynamic visuals of the influenza data collected and analyzed by CDC. These FluView Interactive applications allow people to create customized, visual interpretations of influenza data, as well as make comparisons across flu seasons, regions, age groups and a variety of other demographics. To access these tools, visit http://www.cdc.gov/flu/weekly/fluviewinteractive.htm.[/FONT]
[FONT=&quot]U.S. State and local influenza surveillance: Click on a jurisdiction below to access the latest local influenza information.[/FONT]
[FONT=&quot] [/FONT]

[TD="width: 139"] Alabama
[/TD]
[TD="width: 139"] Alaska
[/TD]
[TD="width: 139"] Arizona
[/TD]
[TD="width: 139"] Arkansas
[/TD]
[TD="width: 139"] California
[/TD]

[TD="width: 139"] Colorado
[/TD]
[TD="width: 139"] Connecticut
[/TD]
[TD="width: 139"] Delaware
[/TD]
[TD="width: 139"] District of Columbia
[/TD]
[TD="width: 139"] Florida
[/TD]

[TD="width: 139"] Georgia
[/TD]
[TD="width: 139"] Hawaii
[/TD]
[TD="width: 139"] Idaho
[/TD]
[TD="width: 139"] Illinois
[/TD]
[TD="width: 139"] Indiana
[/TD]

[TD="width: 139"] Iowa
[/TD]
[TD="width: 139"] Kansas
[/TD]
[TD="width: 139"] Kentucky
[/TD]
[TD="width: 139"] Louisiana
[/TD]
[TD="width: 139"] Maine
[/TD]

[TD="width: 139"] Maryland
[/TD]
[TD="width: 139"] Massachusetts
[/TD]
[TD="width: 139"] Michigan
[/TD]
[TD="width: 139"] Minnesota
[/TD]
[TD="width: 139"] Mississippi
[/TD]

[TD="width: 139"] Missouri
[/TD]
[TD="width: 139"] Montana
[/TD]
[TD="width: 139"] Nebraska
[/TD]
[TD="width: 139"] Nevada
[/TD]
[TD="width: 139"] New Hampshire
[/TD]

[TD="width: 139"] New Jersey
[/TD]
[TD="width: 139"] New Mexico
[/TD]
[TD="width: 139"] New York
[/TD]
[TD="width: 139"] North Carolina
[/TD]
[TD="width: 139"] North Dakota
[/TD]

[TD="width: 139"] Ohio
[/TD]
[TD="width: 139"] Oklahoma
[/TD]
[TD="width: 139"] Oregon
[/TD]
[TD="width: 139"] Pennsylvania
[/TD]
[TD="width: 139"] Rhode Island
[/TD]

[TD="width: 139"] South Carolina
[/TD]
[TD="width: 139"] South Dakota
[/TD]
[TD="width: 139"] Tennessee
[/TD]
[TD="width: 139"] Texas
[/TD]
[TD="width: 139"] Utah
[/TD]

[TD="width: 139"] Vermont
[/TD]
[TD="width: 139"] Virginia
[/TD]
[TD="width: 139"] Washington
[/TD]
[TD="width: 139"] West Virginia
[/TD]
[TD="width: 139"] Wisconsin
[/TD]

[TD="width: 139"] Wyoming
[/TD]
[TD="width: 139"] New York City
[/TD]
[TD="width: 139"] Puerto Rico
[/TD]
[TD="width: 139"] Virgin Islands
[/TD]
[TD="width: 139"] [/TD]

[FONT=&quot]World Health Organization: Additional influenza surveillance information from participating WHO member nations is available through FluNet and the Global Epidemiology Reports.[/FONT]
[FONT=&quot]WHO Collaborating Centers for Influenza located in Australia, China, Japan, the United Kingdom, and the United States (CDC in Atlanta, Georgia).[/FONT]
[FONT=&quot]Europe: For the most recent influenza surveillance information from Europe, please see WHO/Europe and the European Centre for Disease Prevention and Control at http://www.flunewseurope.org/.[/FONT]
[FONT=&quot]Public Health Agency of Canada: The most up-to-date influenza information from Canada is available at http://www.phac-aspc.gc.ca/fluwatch/[/FONT]
[FONT=&quot]Public Health England: The most up-to-date influenza information from the United Kingdom is available athttps://www.gov.uk/government/statistics/weekly-national-flu-reports[/FONT]
[FONT=&quot] [/FONT]

[FONT=&quot] [/FONT]
[FONT=&quot]Any links provided to non-Federal organizations are provided solely as a service to our users. These links do not constitute an endorsement of these organizations or their programs by CDC or the Federal Government, and none should be inferred. CDC is not responsible for the content of the individual organization web pages found at these links.[/FONT] [FONT=&quot] [/FONT]
[FONT=&quot]An overview of the CDC influenza surveillance system, including methodology and detailed descriptions of each data component, is available at: http://www.cdc.gov/flu/weekly/overview.htm.[/FONT]
[FONT=&quot]--------------------------------------------------------------------------------[/FONT]
https://www.cdc.gov/flu/weekly/index.htm
 
Back
Top