
Install the app
How to install the app on iOS
Follow along with the video below to see how to install our site as a web app on your home screen.
Note: This feature may not be available in some browsers.
-
FluTrackers.com Inc. does not provide medical advice. Information on this web site is collected from various internet resources, and the FluTrackers board of directors makes no warranty to the safety, efficacy, correctness or completeness of the information posted on this site by any author or poster. The information collated here is for instructional and/or discussion purposes only and is NOT intended to diagnose or treat any disease, illness, or other medical condition. Every individual reader or poster should seek advice from their personal physician/healthcare practitioner before considering or using any interventions that are discussed on this website. By continuing to access this website you agree to consult your personal physican before using any interventions posted on this website, and you agree to hold harmless FluTrackers.com Inc., the board of directors, the members, and all authors and posters for any effects from use of any medication, supplement, vitamin or other substance, device, intervention, etc. mentioned in posts on this website, or other internet venues referenced in posts on this website. -
We are not asking for any donations. Do not donate to any entity who says they are raising funds for us.
You are using an out of date browser. It may not display this or other websites correctly.
You should upgrade or use an alternative browser.
You should upgrade or use an alternative browser.
USA - Actual ISDS flu trends
- Thread starter gsgs
- Start date

gsgs
Registered User
Re: USA - Actual ISDS flu trends
some seasons have a characteristic dent (delay) in the
positives-curve around week 52 :
2000/1
2002/3
2004/5
2005/6
2006/7
and now maybe 2010/1 if it continues to go up
but not in
1999/0
2001/2
2003/4 (Fujian-semi-pandemic)
2007/8
2008/9
2009/10 (****** pandemic)
what's the reason ? It could be a peak in other infections
(RSV ?) or Christmas-holidays related. But then, why is it in some
seasons and not others ?
maybe I can check for the same thing in Europe-curves
or Hongkong curves
also a smaller dent in week ~46 in
2000/1
2001/2
2002/3
2004/5
2006/7
2007/8
2010/1
another US-holiday ?
----------------------------------
> Thanksgiving Day, celebrated on the fourth Thursday in November,
Thursday, November 24, 2005
Thursday, November 23, 2006
Thursday, November 22, 2007
Thursday, November 27, 2008
Thursday, November 26, 2009
Thursday, November 25, 2010
so, week 47.
Holidays would explain the smaller number of testings in that week,
but not the dent in the positives rate. Not the delay in the total wave.
Children not at school ? But then family meetings
some seasons have a characteristic dent (delay) in the
positives-curve around week 52 :
2000/1
2002/3
2004/5
2005/6
2006/7
and now maybe 2010/1 if it continues to go up
but not in
1999/0
2001/2
2003/4 (Fujian-semi-pandemic)
2007/8
2008/9
2009/10 (****** pandemic)
what's the reason ? It could be a peak in other infections
(RSV ?) or Christmas-holidays related. But then, why is it in some
seasons and not others ?
maybe I can check for the same thing in Europe-curves
or Hongkong curves
also a smaller dent in week ~46 in
2000/1
2001/2
2002/3
2004/5
2006/7
2007/8
2010/1
another US-holiday ?
----------------------------------
> Thanksgiving Day, celebrated on the fourth Thursday in November,
Thursday, November 24, 2005
Thursday, November 23, 2006
Thursday, November 22, 2007
Thursday, November 27, 2008
Thursday, November 26, 2009
Thursday, November 25, 2010
so, week 47.
Holidays would explain the smaller number of testings in that week,
but not the dent in the positives rate. Not the delay in the total wave.
Children not at school ? But then family meetings
gsgs
Registered User
Re: USA - Actual ISDS flu trends
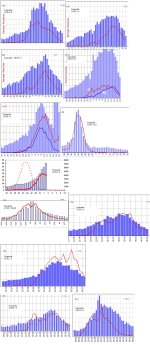
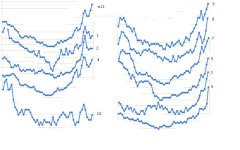
Canada charts are below
do they have thanksgiving ?
no small dents in week ~47
but still the yearly dents in week ~52
.
Canadian dents:
------------------------
1999/2000 week 47),week 1
2000/1:week 2
2001/2week 2)
2002/3:week 4
2003/4:week 46
2004/5:week 49
2005/6:week 1
2006/7:week 52
2007/8:week 2
2008/9:week 49
.

Canada charts are below
do they have thanksgiving ?
no small dents in week ~47
but still the yearly dents in week ~52
.
Canadian dents:
------------------------
1999/2000
week 47),week 12000/1:week 2
2001/2
week 2)2002/3:week 4
2003/4:week 46
2004/5:week 49
2005/6:week 1
2006/7:week 52
2007/8:week 2
2008/9:week 49
.
Attachments
Re: USA - Actual ISDS flu trends
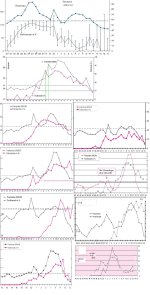
If the reason for the dent is the Christmas holiday, then likewise, there would not be a dent in similar graphs in the non-christian world where the same two week vacation would not occur. Is there data to theorize it is related to holiday and/or rule it out?
A CDC study in the February Emerging Infectious Diseases provides information regarding UK school closure and a 67% reduction in contacts. School closure may work after all.
The HPA shows a similar pattern of dent.
I used the HPA data and CDC data and corresponding "dents" to reconsider school closure in our community - and also to include an intense vaccination campaign at the onset of the school closure in the interest of immunizing the population while 1 - demand is high, and 2 - while the children have an opportunity to allow the immunizations to work.
We won't know if it will work, though, until we have another large event.
If the reason for the dent is the Christmas holiday, then likewise, there would not be a dent in similar graphs in the non-christian world where the same two week vacation would not occur. Is there data to theorize it is related to holiday and/or rule it out?
A CDC study in the February Emerging Infectious Diseases provides information regarding UK school closure and a 67% reduction in contacts. School closure may work after all.
The HPA shows a similar pattern of dent.
I used the HPA data and CDC data and corresponding "dents" to reconsider school closure in our community - and also to include an intense vaccination campaign at the onset of the school closure in the interest of immunizing the population while 1 - demand is high, and 2 - while the children have an opportunity to allow the immunizations to work.
We won't know if it will work, though, until we have another large event.
Re: USA - Actual ISDS flu trends
Another point to consider is that during vacation/holiday, many of the medical providers are also taking similar time off - this may affect specimin collection, clinical diagnosis, and likewise positive percentages... Yet, a corresponding dent exists in the all cause death in the HPA information - perhaps in other regions / countries as well...
Deaths don't take a vacation and there is only one result. (Whether that is positive or negative, however, depends on your disposition )
)
Another point to consider is that during vacation/holiday, many of the medical providers are also taking similar time off - this may affect specimin collection, clinical diagnosis, and likewise positive percentages... Yet, a corresponding dent exists in the all cause death in the HPA information - perhaps in other regions / countries as well...
Deaths don't take a vacation and there is only one result. (Whether that is positive or negative, however, depends on your disposition
)Re: USA - Actual ISDS flu trends
Re: Peaks above 25% in a season.
Is it possible the clinicians have become more consciously aware, educated, and/or experienced with influenza symptoms because of last years event thereby increasing positive rate by recognizing who needs a test vs. the old idea of test everyone?
(This theorizes previous years 25% akin to today's 15%).
Or
Even worse, maybe the economy has created a larger population of persons without insurance that are less inclined to go to the physicians and have tests done unless they really, really feel horrible - a more true influenza symptom? - and less likely to be negative for influenza whereby increasing the positives rate.
Re: Peaks above 25% in a season.
Is it possible the clinicians have become more consciously aware, educated, and/or experienced with influenza symptoms because of last years event thereby increasing positive rate by recognizing who needs a test vs. the old idea of test everyone?
(This theorizes previous years 25% akin to today's 15%).
Or
Even worse, maybe the economy has created a larger population of persons without insurance that are less inclined to go to the physicians and have tests done unless they really, really feel horrible - a more true influenza symptom? - and less likely to be negative for influenza whereby increasing the positives rate.
Last edited:

sharon sanders
Editor-in-Chief & President
Re: USA - Actual ISDS flu trends
Or both?
Or both?

Pathfinder
Editor, Senior Moderator
Re: USA - Actual ISDS flu trends
The two states (Week2) with the highest ILI are Alabama and Louisiana. Alabama has 77% Influenza B, Louisiana, 88% Influenza B.
http://adph.org/influenza/
http://www.dhh.louisiana.gov/office...nza/11/__InfluenzaSurveillanceSummary1102.pdf
http://www.cdc.gov/flu/weekly/
The two states (Week2) with the highest ILI are Alabama and Louisiana. Alabama has 77% Influenza B, Louisiana, 88% Influenza B.
http://adph.org/influenza/
http://www.dhh.louisiana.gov/office...nza/11/__InfluenzaSurveillanceSummary1102.pdf
http://www.cdc.gov/flu/weekly/
Re: USA - Actual ISDS flu trends
The delay, in combination with an intensive vaccine campaign targeting school aged children (theoretically the larger reservoir), may not "weaken" the overall wave potential, but it may carry the wave over a longer period of time with less intensity which will allow the available resources to manage the event rather than overburdening them and creating a cascade of crisis.
the dents however only seem to delay the whole thing,
not to weaken it
The delay, in combination with an intensive vaccine campaign targeting school aged children (theoretically the larger reservoir), may not "weaken" the overall wave potential, but it may carry the wave over a longer period of time with less intensity which will allow the available resources to manage the event rather than overburdening them and creating a cascade of crisis.
gsgs
Registered User
Re: USA - Actual ISDS flu trends
the dents appear too early for that.
The delay usually is at the beginning of the wave, when the level is still low.
It could be a bit different this season ...
you might consider to weaken a strong pandemic wave as in 2003/4
or 2009/10 by starting a seaonal wave shortly before it deliberately
or by aggressively vaxing spreaders (students,teachers,traveling
salesmen,...) aggressively right into the wave
although I'm not sure whether just vaxing has the same protective efect,
the thing that makes the waves go down
the thing that prevents a new wave shortly after another wave
the thing that prevents other strains in a strong (pandemic) wave
the dents appear too early for that.
The delay usually is at the beginning of the wave, when the level is still low.
It could be a bit different this season ...
you might consider to weaken a strong pandemic wave as in 2003/4
or 2009/10 by starting a seaonal wave shortly before it deliberately
or by aggressively vaxing spreaders (students,teachers,traveling
salesmen,...) aggressively right into the wave
although I'm not sure whether just vaxing has the same protective efect,
the thing that makes the waves go down
the thing that prevents a new wave shortly after another wave
the thing that prevents other strains in a strong (pandemic) wave
Re: USA - Actual ISDS flu trends
Interesting thought, starting a seasonal wave before, deliberately - if that's possible - many more than one person would have to spread the virus intentionally.
Agressively vaxing spreaders right into the wave is pretty routine. Unfortunately, it produces more skeptics than takers - especially when the threat is not tangible (until the wave starts) and only theoretical.
Seeing and hearing of severe illness or deaths in the community are often what motivates persons less than 65 to receive the vaccine... again, that doesn't happen until the wave has started. Consider the recent UK vaccine demand. Until the wave began, they had plenty of vaccine for the determined high risk groups.
There are many more takers when it is obvious the threat is severe - i.e., the schools have to be closed preemptively because in other places there are severe deaths and illness. Then, there is always going to be the mentality of "it doesn't happen to me or my family."
On another note, why are there two peaks in the UK graphs this year?
you might consider to weaken a strong pandemic wave as in 2003/4
or 2009/10 by starting a seaonal wave shortly before it deliberately
or by aggressively vaxing spreaders (students,teachers,traveling
salesmen,...) aggressively right into the wave
Interesting thought, starting a seasonal wave before, deliberately - if that's possible - many more than one person would have to spread the virus intentionally.
Agressively vaxing spreaders right into the wave is pretty routine. Unfortunately, it produces more skeptics than takers - especially when the threat is not tangible (until the wave starts) and only theoretical.
Seeing and hearing of severe illness or deaths in the community are often what motivates persons less than 65 to receive the vaccine... again, that doesn't happen until the wave has started. Consider the recent UK vaccine demand. Until the wave began, they had plenty of vaccine for the determined high risk groups.
There are many more takers when it is obvious the threat is severe - i.e., the schools have to be closed preemptively because in other places there are severe deaths and illness. Then, there is always going to be the mentality of "it doesn't happen to me or my family."
On another note, why are there two peaks in the UK graphs this year?
gsgs
Registered User
Re: USA - Actual ISDS flu trends
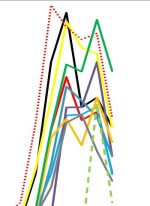
actual UK-graphs:
http://www.hpa.org.uk/web/HPAwebFile/HPAweb_C/1284475036543
2 peaks :
1.) typical new-year delay
2.) South got it earlier
when you concentrate on one region then there is often only one peak
see attachment
I always wondered why seasonal flu-waves go down with only
~20% infected. Maybe 30% of them asymptomatic.
And only ~20 secondary infections in households.
could it be that more are breathing the virus, build shortterm immunity
but no antibodies >5 weeks later ?
actual UK-graphs:
http://www.hpa.org.uk/web/HPAwebFile/HPAweb_C/1284475036543
2 peaks :
1.) typical new-year delay
2.) South got it earlier
when you concentrate on one region then there is often only one peak
see attachment
I always wondered why seasonal flu-waves go down with only
~20% infected. Maybe 30% of them asymptomatic.
And only ~20 secondary infections in households.
could it be that more are breathing the virus, build shortterm immunity
but no antibodies >5 weeks later ?
Attachments
Re: USA - Actual ISDS flu trends
Great question! One would think that the virus would continue to infect the susceptible population - so why would the length of most waves be so predictable and similar regardless of novel or seasonal?
Your hypothesis seems possible - perhaps there is some science to back it up out there?
I always wondered why seasonal flu-waves go down with only
~20% infected. Maybe 30% of them asymptomatic.
And only ~20 secondary infections in households.
could it be that more are breathing the virus, build shortterm immunity
but no antibodies >5 weeks later ?
Great question! One would think that the virus would continue to infect the susceptible population - so why would the length of most waves be so predictable and similar regardless of novel or seasonal?
Your hypothesis seems possible - perhaps there is some science to back it up out there?
Re: USA - Actual ISDS flu trends
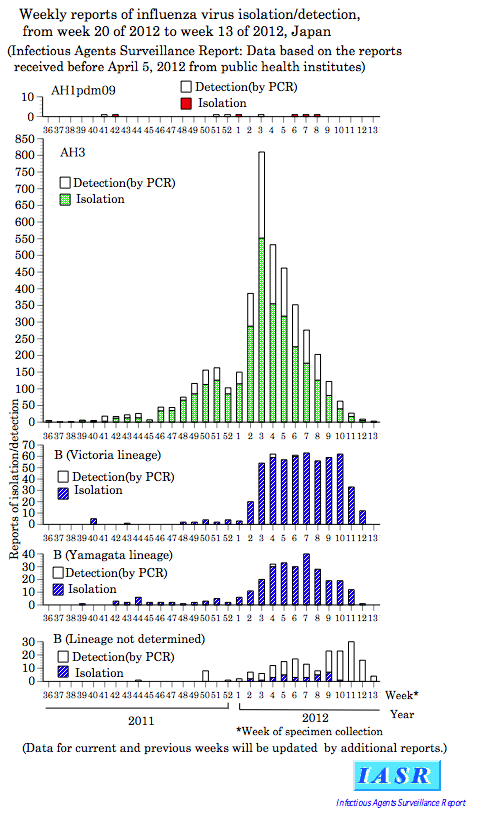
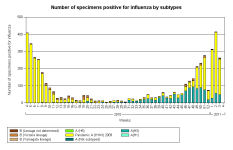
https://hasseidoko.mhlw.go.jp/Byogentai/Pdf/data2e.pdf
A couple of interesting features on these graphs.
The Japanese respond to influenza outbreaks by very quickly closing schools, and the most recent week "dent" is notable, but it is unknown if the wave will increase again next reporting period indicating school closures are "denting" the activity.
Japan had a similar small wave of H3N2 as the US is coming out of currently, with a following relatively agressive H1N1 surge - and school closures.
News Article regarding recent outbreaks
School closures may not stop the wave, but if the Japan graphs are an indication of the effect of school closures, it decreased the trajectory - which is just as critical.
I look at the 1918 NYC Mortality Table and am still amazed at how the trajectory is near 90 degrees. Suddenly, in such a short time, alot of people started dying from influenza. . . Amazing.
https://hasseidoko.mhlw.go.jp/Byogentai/Pdf/data2e.pdf
A couple of interesting features on these graphs.
The Japanese respond to influenza outbreaks by very quickly closing schools, and the most recent week "dent" is notable, but it is unknown if the wave will increase again next reporting period indicating school closures are "denting" the activity.
Japan had a similar small wave of H3N2 as the US is coming out of currently, with a following relatively agressive H1N1 surge - and school closures.
News Article regarding recent outbreaks
School closures may not stop the wave, but if the Japan graphs are an indication of the effect of school closures, it decreased the trajectory - which is just as critical.
I look at the 1918 NYC Mortality Table and am still amazed at how the trajectory is near 90 degrees. Suddenly, in such a short time, alot of people started dying from influenza. . . Amazing.
Attachments
Missouriwatcher
Editor, Senior Moderator
Re: USA - Actual ISDS flu trends
2009(H1N1) is here! It has been the majority virus detected by PCR in Missouri since week 48. I cannot say whether that's what my sister, her daughter, my son and I have contracted in the past couple of weeks (differing onset), but it's not fun...came on within hours of first symptoms. All but one of us had flu shots (additionally my son had H1N1 last year). He did not experience the intensity like me (I'm still in it, so a little groggy). The one not vaxed experienced longer recovery (weeks and still going) with more intense symptoms. http://www.dhss.mo.gov/living/healthcondiseases/communicable/influenza/reports.php#1011
Here are some other states that have been reporting increasing 2009(H1N1) and decreasing H3:
GA http://health.state.ga.us/epi/flu/fluupd10.asp
AZ http://www.azdhs.gov/phs/oids/epi/flu/index.htm
CO http://www.cdphe.state.co.us/dc/Influenza/
FL http://www.doh.state.fl.us/Disease_ctrl/epi/htopics/flu/2011/index.html
DE http://dhss.delaware.gov/dhss/dph/epi/influenzawkly.html
IL http://www.idph.state.il.us/flu/fluupdate10-11.htm
ME http://www.maine.gov/dhhs/boh/influenza_surveillance_weekly_updates.shtml
MD http://dhmh.maryland.gov/fluwatch/
MA http://www.mass.gov/?pageID=eohhs2t...=dph_cdc_p_flu_surveillance_data&csid=Eeohhs2
MI http://www.health.state.mn.us/divs/idepc/diseases/flu/stats/index.html
PA http://www.portal.state.pa.us/portal/server.pt?open=514&objID=557490&mode=2
TX http://www.dshs.state.tx.us/idcu/disease/influenza/surveillance/
May be others, just tired of looking
2009(H1N1) is here! It has been the majority virus detected by PCR in Missouri since week 48. I cannot say whether that's what my sister, her daughter, my son and I have contracted in the past couple of weeks (differing onset), but it's not fun...came on within hours of first symptoms. All but one of us had flu shots (additionally my son had H1N1 last year). He did not experience the intensity like me (I'm still in it, so a little groggy). The one not vaxed experienced longer recovery (weeks and still going) with more intense symptoms. http://www.dhss.mo.gov/living/healthcondiseases/communicable/influenza/reports.php#1011
Here are some other states that have been reporting increasing 2009(H1N1) and decreasing H3:
GA http://health.state.ga.us/epi/flu/fluupd10.asp
AZ http://www.azdhs.gov/phs/oids/epi/flu/index.htm
CO http://www.cdphe.state.co.us/dc/Influenza/
FL http://www.doh.state.fl.us/Disease_ctrl/epi/htopics/flu/2011/index.html
DE http://dhss.delaware.gov/dhss/dph/epi/influenzawkly.html
IL http://www.idph.state.il.us/flu/fluupdate10-11.htm
ME http://www.maine.gov/dhhs/boh/influenza_surveillance_weekly_updates.shtml
MD http://dhmh.maryland.gov/fluwatch/
MA http://www.mass.gov/?pageID=eohhs2t...=dph_cdc_p_flu_surveillance_data&csid=Eeohhs2
MI http://www.health.state.mn.us/divs/idepc/diseases/flu/stats/index.html
PA http://www.portal.state.pa.us/portal/server.pt?open=514&objID=557490&mode=2
TX http://www.dshs.state.tx.us/idcu/disease/influenza/surveillance/
May be others, just tired of looking
sharon sanders
Editor-in-Chief & President
Re: USA - Actual ISDS flu trends
Best wishes Missouriwatcher to you and your family.
Thank you to everyone for a great thread.
Best wishes Missouriwatcher to you and your family.
Thank you to everyone for a great thread.