• FluTrackers.com Inc. does not provide medical advice. Information on this web site is collected from various internet resources, and the FluTrackers board of directors makes no warranty to the safety, efficacy, correctness or completeness of the information posted on this site by any author or poster. The information collated here is for instructional and/or discussion purposes only and is NOT intended to diagnose or treat any disease, illness, or other medical condition. Every individual reader or poster should seek advice from their personal physician/healthcare practitioner before considering or using any interventions that are discussed on this website. By continuing to access this website you agree to consult your personal physican before using any interventions posted on this website, and you agree to hold harmless FluTrackers.com Inc., the board of directors, the members, and all authors and posters for any effects from use of any medication, supplement, vitamin or other substance, device, intervention, etc. mentioned in posts on this website, or other internet venues referenced in posts on this website.
  • We are not asking for any donations. Do not donate to any entity who says they are raising funds for us.

USA - Actual ISDS flu trends

gsgs

Registered User
from the New York thread and the weekly region-data
there was some indication that the
flu-wave did peak already in USA in most places.

So, let's look at the most actual data here.

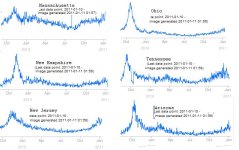
6 selected states with data from 2011/01/10

it's not clear, IMO. Wait some more days ...


attachment.php
 

Attachments

  • use1.jpg
    use1.jpg
    51.1 KB · Views: 1
Re: actual ISDS trends

Re: actual ISDS trends

Could those peaks represent seasonal flu only? We could see a wave of Pandemic 2009 H1N1 like the UK over the next month or so, I would think.
 
Re: actual ISDS trends

Re: actual ISDS trends

these are the proportions of sentinel-doctor visits due to ILI
(fever and (sore throat or cough))

http://www.cdc.gov/flu/weekly/overview.htm
> For this system, ILI is defined as fever (temperature of 100°F [37.8°C] or greater)
> and a cough and/or a sore throat in the absence of a KNOWN cause other than influenza


most flu in USA currently is H3 also some B.
While Europe mainly has H1.
USA had more H1 last season and also higher vaccination rates for H1
so more immunity. But the reason could also just be geographic
(travel from China) or weather


here the proportion of emergency department
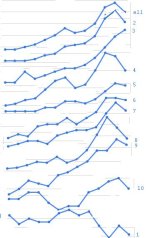
visits due to ILI for the 10 CDC-regions:
(weekly data, last on 2011/01/08)


attachment.php


.
.
regions 1(NE-USA) and 10(NW-USA) are unusual.
Region 1 had the highest vaccination coverage,
but that was the H1-vax)
 

Attachments

  • usre1.jpg
    usre1.jpg
    29.7 KB · Views: 1
Re: actual ISDS trends

Re: actual ISDS trends

the weather in regions 1,2,3 going down the
Atlantic coast Portland,NYC,Norfolk


attachment.php


humidity and temperature was high on Jan.3 in Portland (humidity also high on Dec.13)
and on Jan.2 in Norfolk.

New York has generally lower humidity than Portland and Norfolk.

unfortunately we only have relative humidity, not absolute humidity
 

Attachments

  • weae1.jpg
    weae1.jpg
    226.3 KB · Views: 1
Re: actual ISDS trends

Re: actual ISDS trends

today:

attachment.php
 

Attachments

  • use2.jpg
    use2.jpg
    28.3 KB · Views: 0
Re: USA - Actual ISDS flu trends

CDC says:

> During week 1 (January 2-8, 2011), influenza activity in the United States decreased
> in several indicators, but it is unlikely that influenza activity for this season has peaked.


http://www.cdc.gov/flu/weekly/

image011.gif


image012.gif
 
Re: USA - Actual ISDS flu trends

Perhaps the flu peak is H3N2 relative only.
Those areas beginning to see increase beyond the initial peak where the highest percentages of H3N2 were noted are now displaying higher percentages of H1N1 and age groups within the 15 year to 49 year age group more affected.
Historically, have there been any flu seasons where the US barely touched baseline? Or more specifically that there was a two week downward trend one week after cresting above baseline?
I think this season has a little more in store for the U.S. than what we see now.
 
Re: USA - Actual ISDS flu trends

ahh, now I see that they "updated" the positives-number
for week 52.
It's higher now than in week 51, while last week's chart did show a clear
decline. Although not as much as in week 1.

----------------------------------------------------------

http://www.cdc.gov/flu/weekly/weeklyarchives2010-2011/images/image521.gif


% positives of week 48..., as given in the report for week


48:10.81
49:09.89,11.02
50:10.31,12.77,15.72
51:10.47,13.28,16.41,20.98
52:10.54,13.28,17.50,22.39,20.26,
01:10.63,13.66,18.97,24.90,25.50,16.30


correction in the next week:
-8.5%,+15.9%,+4.4%,+6.7%,+25.9%


2009:
01:07.13
02:07.93,11.54
03:07.55,10.69,15.84
04:07.76,10.89,14.41,16.18
05:07.68,10.95,14.47,17.29,20.62
06:07.74,10.62,14.62,18.56,21.08,24.41
07:08.21,10.69,14.85,19.44,21.77,23.17,24.58
08:08.22,10.70,15.15,19.94,22.67,23.64,22.51,21.23
09:08.33,10.84,15.85,20.80,23.74,24.84,24.20,23.11,21.96,21.71
33:08.14,10.56,15.76,20.57,23.80,25.13,24.63,24.33,24.07,22.21,20.42

+11.2%,-7.4%,-9.0%,+6.9%,+2.2%,-5.1%,-8.4%,+8.8%,
 
Re: USA - Actual ISDS flu trends

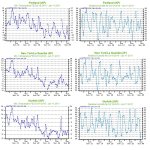
new update for the emergency visits


use2a.JPG


1-4 look like a normal decline after a peak
but 5-9 may get a double peak or may even exceed the first peak ...
 
Re: USA - Actual ISDS flu trends

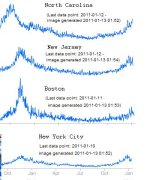
Source: http://isds.cirg.washington.edu/distribute/ili.php#regions

No sure if it's a data glitch, but it appears that there has been a modest to dramatic jump in Federal Regions 1, 3, 4, 6, and 7 from the previous week. Also, note that in most cases, the affected age groups are well represented in the 5 to 59 range. The other odd thing is that most of this is Flu B and AH3N2.

I agree with you gs, in that I suspect that we'll see another wave comprised mostly of H1N1 cases in the next few weeks since the proportion of Pandemic H1N1 to H3N2 and Flu B have started to increase. Sadly, we might see the combined effects of the seasonal flu on the normal risk groups and the Pandemic H1N1 on the rest of the population. If the UK is any indicator, it could be a deadly flu season in North America and Europe.
 
Re: USA - Actual ISDS flu trends

up or down, what will we see tomorrow from CDC ?

I'm not sure. ILI charts from some regions are down, some up.

In total I'd bet it's a bit up but not more than in week 51
 
Re: USA - Actual ISDS flu trends

most interesting will be the poitives-rate (IMO)

just a few hours and we will see ...

http://www.cdc.gov/flu/weekly/weeklyarchives2010-2011/data/whoAllregt01.htm

http://www.cdc.gov/flu/weekly/


old data:


INFLUENZA VIRUSES ISOLATED BY
WHO/NREVSS Collaborating Laboratories
2010 - 2011 Season Week A(H1) 2009 A H1N1 A(H3) A(unable to sub-type)
A(Subtyping not performed) B Total # Tested % Positive

40 0 9 20 0 29 22 3574 2.24
41 0 14 37 0 43 31 3918 3.19
42 0 6 33 0 53 42 4043 3.31
43 0 14 50 0 47 49 4069 3.93
44 0 10 64 0 67 97 4556 5.22
45 0 13 66 0 94 162 5173 6.48
46 0 23 111 0 106 230 5482 8.57
47 0 13 128 0 155 258 5303 10.45
48 0 32 176 0 132 245 5504 10.63
49 0 38 282 0 122 291 5365 13.66
50 0 65 423 0 248 482 6422 18.97 18.91
51 0 67 618 0 404 575 6684 24.90 24.81
52 0 123 678 0 441 520 6911 25.5 25.79
01 0 40 164 0 317 185 4331 16.3 24.54(210)
.......................................................25.85(173)


new data:

INFLUENZA VIRUSES ISOLATED BY
WHO/NREVSS Collaborating Laboratories
2010 - 2011 Season Week A(H1) 2009 A H1N1 A(H3)
A(unable to sub-type) A(Subtyping not performed) B Total # Tested % Positive
40 0 9 20 0 29 22 3574 2.24
41 0 14 37 0 43 31 3932 3.18
42 0 6 33 0 53 42 4043 3.31
43 0 14 50 0 47 49 4069 3.93
44 0 10 64 0 67 97 4556 5.22
45 0 13 66 0 94 162 5228 6.41
46 0 23 111 0 106 230 5493 8.56
47 0 15 128 0 154 258 5355 10.36
48 0 33 175 0 133 229 5492 10.38
49 0 38 284 0 124 293 5416 13.64
50 0 67 424 0 252 487 6504 18.91
51 0 76 629 0 411 591 6879 24.81
52 0 148 702 0 456 550 7197 25.79
01 0 210 818 0 491 419 7898 24.54
02 0 173 487 0 432 196 4983 25.85


the positives rate is almost stable for 4 weeks now,
which is unusual. I think it's because we have peaks in different
weeks in different parts of the country.
Also H3 and B simultaneously
 
Re: USA - Actual ISDS flu trends

So, what do you think, GSGS?
Will H3N2 make another run on the population and keep H1N1 at bay or will H1N1 get a foothold?
 
Re: USA - Actual ISDS flu trends

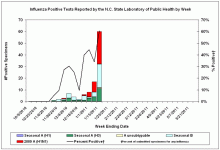
If North Carolina is any indicator, H1N1 will dominate in the next month or so.

NC graph.gif
 
Re: USA - Actual ISDS flu trends

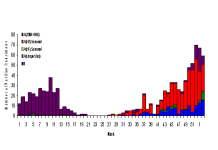
Also, Florida appears to be headed that way if you look at the past 3 weeks, less H3N2 and more pH1N1.

FL graph.png
 
Re: USA - Actual ISDS flu trends

however, when you just had a H3-wave, then I'd expect the H1-wave
to be milder. Maybe compare with Britain,Europe ... but we had no H3


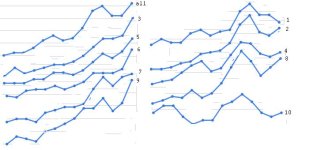
actual ratio of ED-visits that are for ILI : (week 3)
all, and regions 1..10

attachment.php


week 3 looks worse than expected. Seems to be going up again

attachment.php
 

Attachments

  • ede3.jpg
    ede3.jpg
    5.3 KB · Views: 0
  • ede3a.jpg
    ede3a.jpg
    31.5 KB · Views: 0
Re: USA - Actual ISDS flu trends

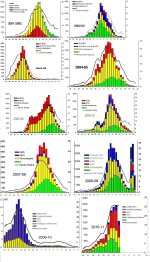
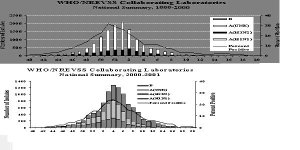
a double-peak in the positives rate at level >25%, has it ever happened ?

here the last years:

attachment.php


attachment.php
 

Attachments

  • vire2.jpg
    vire2.jpg
    222.8 KB · Views: 0
  • flus0.jpg
    flus0.jpg
    33.2 KB · Views: 0
Back
Top