• FluTrackers.com Inc. does not provide medical advice. Information on this web site is collected from various internet resources, and the FluTrackers board of directors makes no warranty to the safety, efficacy, correctness or completeness of the information posted on this site by any author or poster. The information collated here is for instructional and/or discussion purposes only and is NOT intended to diagnose or treat any disease, illness, or other medical condition. Every individual reader or poster should seek advice from their personal physician/healthcare practitioner before considering or using any interventions that are discussed on this website. By continuing to access this website you agree to consult your personal physican before using any interventions posted on this website, and you agree to hold harmless FluTrackers.com Inc., the board of directors, the members, and all authors and posters for any effects from use of any medication, supplement, vitamin or other substance, device, intervention, etc. mentioned in posts on this website, or other internet venues referenced in posts on this website.
  • We are not asking for any donations. Do not donate to any entity who says they are raising funds for us.

USA: 2013-14 FluView: Influenza Season Weekly Summary, Wks 42-38: 108 Total Pediatric Deaths

mixin

Well-known member
Please see previous season here.


http://www.cdc.gov/flu/weekly/
Week 42 ending October 19, 2013

Synopsis:
During week 42 (October 13-19, 2013), influenza activity remained low in the United States.
* Viral Surveillance: Of 3,513 specimens tested and reported by U.S. World Health Organization (WHO) and National Respiratory and Enteric Virus Surveillance System (NREVSS) collaborating laboratories during week 42, 135 (3.8%) were positive for influenza.
* Pneumonia and Influenza Mortality: The proportion of deaths attributed to pneumonia and influenza (P&I) was below the epidemic threshold.
* Influenza-Associated Pediatric Deaths: Two influenza-associated pediatric deaths that occurred during the 2012-2013 season were reported.
* Outpatient Illness Surveillance: The proportion of outpatient visits for influenza-like illness (ILI) was 1.2%, below the national baseline of 2.0%. All 10 regions reported ILI below region-specific baseline levels. Two states experienced low ILI activity, 48 states and New York City experienced minimal ILI activity and the District of Columbia had insufficient data.
* Geographic Spread of Influenza: The geographic spread of influenza in Puerto Rico was reported as regional; 3 states reported local influenza activity; Guam, the District of Columbia, and 28 states reported sporadic influenza activity, and the U.S. Virgin Islands and 19 states reported no influenza activity.

U.S. Virologic Surveillance
WHO and NREVSS collaborating laboratories located in all 50 states, Puerto Rico, and Washington D.C. report to CDC the number of respiratory specimens tested for influenza and the number positive by influenza virus type and influenza A virus subtype. The results of tests performed during the current week are summarized in the table below.

Week 42
No. of specimens tested 3,513
No. of positive specimens (%) 135 (3.8%)
Positive specimens by type/subtype
Influenza A 112 (83.0%)
2009 H1N1 15 (13.4%)
H3 4 (3.6%)
Subtyping not performed 93 (83.0%)
Influenza B 23 (17.0%)
Region specific data can be found at http://gis.cdc.gov/grasp/fluview/fluportaldashboard.html.

Antigenic Characterization
CDC has antigenically characterized three influenza viruses [three 2009 H1N1 viruses] collected by U.S. laboratories since October 1, 2013 by hemagglutination inhibition (HI).

2009 H1N1 [3]: All three 2009 H1N1 viruses tested were characterized as A/California/7/2009-like, the influenza A (H1N1) component of the 2013-2014 Northern Hemisphere influenza vaccine.
*For more information see the section on antigenic characterization in the MMWR ?Update: Influenza Activity ? United States and Worldwide, May 19?September 28, 2013?..

Antiviral Resistance
Testing of 2009 H1N1, influenza A (H3N2), and influenza B virus isolates for resistance to neuraminidase inhibitors (oseltamivir and zanamivir) is performed at CDC using a functional assay. Additional 2009 H1N1 and influenza A (H3N2) clinical samples are tested for mutations of the virus known to confer oseltamivir resistance. The data summarized below combine the results of both testing methods. These samples are routinely obtained for surveillance purposes rather than for diagnostic testing of patients suspected to be infected with antiviral-resistant virus.

High levels of resistance to the adamantanes (amantadine and rimantadine) persist among 2009 influenza A (H1N1) and A (H3N2) viruses (the adamantanes are not effective against influenza B viruses). As a result, data from adamantane resistance testing are not presented below.

Oseltamivir Zanamivir
2009 H1N1 5* 0 (0.0) 1 0 (0.0) (no resistance found in 6 tests)

The majority of currently circulating influenza viruses are susceptible to the neuraminidase inhibitor antiviral medications oseltamivir and zanamivir; however, rare sporadic cases of oseltamivir-resistant 2009 H1N1 and A (H3N2) viruses have been detected worldwide. Antiviral treatment with oseltamivir or zanamivir is recommended as early as possible for patients with confirmed or suspected influenza who have severe, complicated, or progressive illness; who require hospitalization; or who are at greater risk for serious influenza-related complications. Additional information on recommendations for treatment and chemoprophylaxis of influenza virus infection with antiviral agents is available at http://www.cdc.gov/flu/antivirals/index.htm.

Pneumonia and Influenza (P&I) Mortality Surveillance
During week 42, 5.8% of all deaths reported through the 122-Cities Mortality Reporting System were due to P&I. This percentage was below the epidemic threshold of 6.2% for week 42.

Influenza-Associated Pediatric Mortality
Two influenza-associated pediatric deaths that occurred during the 2012-2013 season were reported to CDC during week 42; both were associated with an influenza B virus. These deaths bring the total number of reported pediatric deaths for that season to 167. No influenza-associated pediatric deaths for the 2013-2014 season have been reported to CDC.
Additional data can be found at http://gis.cdc.gov/GRASP/Fluview/PedFluDeath.html

Influenza-Associated Hospitalizations
The Influenza Hospitalization Surveillance Network (FluSurv-NET) conducts all age population-based surveillance for laboratory-confirmed influenza-related hospitalizations in select counties in the Emerging Infections Program (EIP) states and Influenza Hospitalization Surveillance Project (IHSP) states. FluSurv-NET estimated hospitalization rates will be updated weekly starting later this season. Additional FluSurv-NET data can be found at: http://gis.cdc.gov/GRASP/Fluview/FluHospRates.html and http://gis.cdc.gov/grasp/fluview/FluHospChars.html.

Outpatient Illness Surveillance
Nationwide during week 42, 1.2% of patient visits reported through the U.S. Outpatient Influenza-like Illness Surveillance Network (ILINet) were due to influenza-like illness (ILI). This percentage is below the national baseline of 2.0%. (ILI is defined as fever (temperature of 100?F [37.8?C] or greater) and cough and/or sore throat.)
Region specific data is available at http://gis.cdc.gov/grasp/fluview/fluportaldashboard.html.

On a regional level, the percentage of outpatient visits for ILI ranged from 0.4% to 2.6% during week 42. All 10 regions reported a proportion of outpatient visits for ILI below their region-specific baseline levels.

ILINet Activity Indicator Map
Data collected in ILINet are used to produce a measure of ILI activity* by state. Activity levels are based on the percent of outpatient visits in a state due to ILI and are compared to the average percent of ILI visits that occur during weeks with little or no influenza virus circulation. Activity levels range from minimal, which would correspond to ILI activity from outpatient clinics being below the average, to intense, which would correspond to ILI activity from outpatient clinics being much higher than average.

During week 42, the following ILI activity levels were experienced:
Two states experienced low ILI activity (Texas and Mississippi).
Forty-eight states and New York City experienced minimal ILI activity (Alabama, Alaska, Arizona, Arkansas, California, Colorado, Connecticut, Delaware, Florida, Georgia, Hawaii, Idaho, Illinois, Indiana, Iowa, Kansas, Kentucky, Louisiana, Maine, Maryland, Massachusetts, Michigan, Minnesota, Missouri, Montana, Nebraska, Nevada, New Hampshire, New Jersey, New Mexico, New York, North Carolina, North Dakota, Ohio, Oklahoma, Oregon, Pennsylvania, Rhode Island, South Carolina, South Dakota, Tennessee, Utah, Vermont, Virginia, Washington, West Virginia, Wisconsin, and Wyoming).
Data were insufficient to calculate an ILI activity level from the District of Columbia.

Geographic Spread of Influenza as Assessed by State and Territorial Epidemiologists
The influenza activity reported by state and territorial epidemiologists indicates geographic spread of influenza viruses, but does not measure the severity of influenza activity.

During week 42, the following influenza activity was reported:
* Regional influenza activity was reported by Puerto Rico.
* Local influenza activity was reported by three states (Alabama, Mississippi, and South Carolina).
* Sporadic influenza activity was reported by Guam, the District of Columbia, and 28 states (Alaska, Arizona, California, Connecticut, Florida, Georgia, Hawaii, Illinois, Indiana, Iowa, Louisiana, Massachusetts, Michigan, Minnesota, Nebraska, Nevada, New Jersey, New Mexico, New York, North Dakota, Ohio, Oregon, Pennsylvania, Texas, Utah, Washington, Wisconsin, and Wyoming).
* No influenza activity was reported by the U.S. Virgin Islands and 19 states (Arkansas, Colorado, Delaware, Idaho, Kansas, Kentucky, Maine, Maryland, Missouri, Montana, New Hampshire, North Carolina, Oklahoma, Rhode Island, South Dakota, Tennessee, Vermont, Virginia, and West Virginia).

Additional National and International Influenza Surveillance Information
FluView Interactive: This season, FluView includes enhanced web-based interactive applications that can provide dynamic visuals of the influenza data collected and analyzed by CDC. These FluView Interactive applications allow people to create customized, visual interpretations of influenza data, as well as comparisons across flu seasons, regions, age groups and a variety of other demographics. To access these tools visit http://www.cdc.gov/flu/weekly/fluviewinteractive.htm.
 
Last edited:
Re: 2013-2014 FluView - Influenza Season Weekly Summary - Week 42, 2 pediatric deaths reported

Re: 2013-2014 FluView - Influenza Season Weekly Summary - Week 42, 2 pediatric deaths reported

Synopsis:

During week 43 (October 20-26, 2013), influenza activity remained low in the United States.
Viral Surveillance: Of 3,241 specimens tested and reported by U.S. World Health Organization (WHO) and National Respiratory and Enteric Virus Surveillance System (NREVSS) collaborating laboratories during week 43, 145 (4.5%) were positive for influenza.
Pneumonia and Influenza Mortality: The proportion of deaths attributed to pneumonia and influenza (P&I) was below the epidemic threshold.
Influenza-Associated Pediatric Deaths: No influenza-associated pediatric deaths were reported.
Outpatient Illness Surveillance: The proportion of outpatient visits for influenza-like illness (ILI) was 1.2%, below the national baseline of 2.0%. All 10 regions reported ILI below region-specific baseline levels. Three states experienced low ILI activity, 47 states and New York City experienced minimal ILI activity and the District of Columbia had insufficient data.
Geographic Spread of Influenza: The geographic spread of influenza in Puerto Rico and one state was reported as regional; 4 states reported local influenza activity; Guam and 30 states reported sporadic influenza activity; 15 states reported no influenza activity, and the District of Columbia and the U.S. Virgin Islands did not report.

A description of surveillance methods is available at: http://www.cdc.gov/flu/weekly/overview.htm

U.S. Virologic Surveillance

WHO and NREVSS collaborating laboratories located in all 50 states, Puerto Rico, and Washington D.C. report to CDC the number of respiratory specimens tested for influenza and the number positive by influenza virus type and influenza A virus subtype. The results of tests performed during the current week are summarized in the table below.
Region specific data can be found at http://gis.cdc.gov/grasp/fluview/fluportaldashboard.html.

Antigenic Characterization*

CDC has antigenically characterized three influenza viruses [three 2009 H1N1 viruses] collected by U.S. laboratories since October 1, 2013 by hemagglutination inhibition (HI).

2009 H1N1 [3]: All three 2009 H1N1 viruses tested were characterized as A/California/7/2009-like, the influenza A (H1N1) component of the 2013-2014 Northern Hemisphere influenza vaccine.

*For more information see the section on antigenic characterization in the MMWR ?Update: Influenza Activity ? United States and Worldwide, May 19?September 28, 2013?..

Antiviral Resistance

The majority of currently circulating influenza viruses are susceptible to the neuraminidase inhibitor antiviral medications oseltamivir and zanamivir; however, rare sporadic cases of oseltamivir-resistant 2009 H1N1 and A (H3N2) viruses have been detected worldwide. Antiviral treatment with oseltamivir or zanamivir is recommended as early as possible for patients with confirmed or suspected influenza who have severe, complicated, or progressive illness; who require hospitalization; or who are at greater risk for serious influenza-related complications. Additional information on recommendations for treatment and chemoprophylaxis of influenza virus infection with antiviral agents is available at http://www.cdc.gov/flu/antivirals/index.htm.

Pneumonia and Influenza (P&I) Mortality Surveillance

During week 43, 5.6% of all deaths reported through the 122-Cities Mortality Reporting System were due to P&I. This percentage was below the epidemic threshold of 6.3% for week 43.

Influenza-Associated Pediatric Mortality

No influenza-associated pediatric deaths were reported to CDC during week 43. No influenza-associated pediatric deaths for the 2013-2014 season have been reported to CDC.

Additional data can be found at http://gis.cdc.gov/GRASP/Fluview/PedFluDeath.html.

Influenza-Associated Hospitalizations

The Influenza Hospitalization Surveillance Network (FluSurv-NET) conducts all age population-based surveillance for laboratory-confirmed influenza-related hospitalizations in select counties in the Emerging Infections Program (EIP) states and Influenza Hospitalization Surveillance Project (IHSP) states. FluSurv-NET estimated hospitalization rates will be updated weekly starting later this season. Additional FluSurv-NET data can be found at: http://gis.cdc.gov/GRASP/Fluview/FluHospRates.html and http://gis.cdc.gov/grasp/fluview/FluHospChars.html.

Outpatient Illness Surveillance

Nationwide during week 43, 1.2% of patient visits reported through the U.S. Outpatient Influenza-like Illness Surveillance Network (ILINet) were due to influenza-like illness (ILI). This percentage is below the national baseline of 2.0%. (ILI is defined as fever (temperature of 100?F [37.8?C] or greater) and cough and/or sore throat.)

Region specific data is available at http://gis.cdc.gov/grasp/fluview/fluportaldashboard.html.

ILINet Activity Indicator Map

During week 43, the following ILI activity levels were experienced:
* Three states experienced low ILI activity (Louisiana, Mississippi, and Texas).
* Forty-seven states and New York City experienced minimal ILI activity (Alabama, Alaska, Arizona, Arkansas, California, Colorado, Connecticut, Delaware, Florida, Georgia, Hawaii, Idaho, Illinois, Indiana, Iowa, Kansas, Kentucky, Maine, Maryland, Massachusetts, Michigan, Minnesota, Missouri, Montana, Nebraska, Nevada, New Hampshire, New Jersey, New Mexico, New York, North Carolina, North Dakota, Ohio, Oklahoma, Oregon, Pennsylvania, Rhode Island, South Carolina, South Dakota, Tennessee, Utah, Vermont, Virginia, Washington, West Virginia, Wisconsin, and Wyoming).
* Data were insufficient to calculate an ILI activity level from the District of Columbia.

Geographic Spread of Influenza as Assessed by State and Territorial Epidemiologists

The influenza activity reported by state and territorial epidemiologists indicates geographic spread of influenza viruses, but does not measure the severity of influenza activity.

During week 43, the following influenza activity was reported:
* Regional influenza activity was reported by Puerto Rico and one state (Alabama).
* Local influenza activity was reported by four states (Mississippi, Nevada, South Carolina, and Texas).
* Sporadic influenza activity was reported by Guam and 30 states (Arkansas, Alaska, Arizona, California, Connecticut, Delaware, Florida, Georgia, Hawaii, Indiana, Iowa, Kentucky, Louisiana, Maine, Massachusetts, Michigan, Minnesota, Nebraska, New Jersey, New Mexico, New York, North Dakota, Ohio, Oregon, Pennsylvania, South Dakota, Utah, Virginia, Wisconsin, and Wyoming).
* No influenza activity was reported by 15 states (Colorado, Idaho, Illinois, Kansas, Maryland, Missouri, Montana, New Hampshire, North Carolina, Oklahoma, Rhode Island, Tennessee, Vermont, Washington, and West Virginia).
* The District of Columbia and the U.S. Virgin Islands did not report.
 
Re: USA: 2013-2014 FluView - Influenza Season Weekly Summary - Wk 42-44, 0 pediatric deaths reported (2 total)

Re: USA: 2013-2014 FluView - Influenza Season Weekly Summary - Wk 42-44, 0 pediatric deaths reported (2 total)

Week 44 ending November 2, 2013

During week 44 (October 27-November 2, 2013), influenza activity remained low in the United States.

* Viral Surveillance: Of 4,118 specimens tested and reported by U.S. World Health Organization (WHO) and National Respiratory and Enteric Virus Surveillance System (NREVSS) collaborating laboratories during week 44, 201 (4.9%) were positive for influenza.

* Pneumonia and Influenza Mortality: The proportion of deaths attributed to pneumonia and influenza (P&I) was below the epidemic threshold.

* Influenza-Associated Pediatric Deaths: Two influenza-associated pediatric deaths that occurred during the 2012-2013 season were reported.

* Outpatient Illness Surveillance: The proportion of outpatient visits for influenza-like illness (ILI) was 1.4%, below the national baseline of 2.0%. All 10 regions reported ILI below region-specific baseline levels. One state experienced moderate ILI activity, three states experienced low ILI activity, 46 states and New York City experienced minimal ILI activity and the District of Columbia had insufficient data.

* Geographic Spread of Influenza: The geographic spread of influenza in two states was reported as regional; Puerto Rico and 4 states reported local influenza activity; the District of Columbia, Guam and 34 states reported sporadic influenza activity; 10 states reported no influenza activity, and the U.S. Virgin Islands did not report.

Antigenic Characterization*

CDC has antigenically characterized four influenza viruses [three 2009 H1N1 viruses and one influenza B virus] collected by U.S. laboratories since October 1, 2013 by hemagglutination inhibition (HI).

2009 H1N1 [3]:
All three 2009 H1N1 viruses tested were characterized as A/California/7/2009-like, the influenza A (H1N1) component of the 2013-2014 Northern Hemisphere influenza vaccine.

Influenza B (B/Yamagata and B/Victoria lineages) [1]:
Yamagata Lineage [1]: The one influenza B virus tested was characterized as B/Massachusetts/02/2012-like, which is included as an influenza B component in both the 2013-2014 Northern Hemisphere trivalent and quadrivalent influenza vaccines.

*For more information see the section on antigenic characterization in the MMWR ?Update: Influenza Activity ? United States and Worldwide, May 19?September 28, 2013?.

U.S. Virologic Surveillance
No. of specimens tested 4,118
No. of positive specimens 201 (4.9%)
Positive specimens by type/subtype
Influenza A 167 (83.1%)
2009 H1N1 43 (25.7%)
H3 19 (11.4%)
Subtyping not performed 105 (62.9%)
Influenza B 34 (16.9%)

Neuraminidase Inhibitor Resistance Testing Results:
6 H3N2, 0 tested positive for resistance
1 Flu B, 0 tested positive
37 H1N1, 2 tested positive

http://www.cdc.gov/flu/weekly/
 
Re: USA: 2013-2014 FluView - Influenza Season Weekly Summary - Wk 42-44, 0 pediatric deaths reported (2 total)

Re: USA: 2013-2014 FluView - Influenza Season Weekly Summary - Wk 42-44, 0 pediatric deaths reported (2 total)

Week 45, ending Nov 9

During week 45 (November 3-9, 2013), influenza activity increased slightly in the United States.

* Viral Surveillance: Of 4,257 specimens tested and reported by U.S. World Health Organization (WHO) and National Respiratory and Enteric Virus Surveillance System (NREVSS) collaborating laboratories during week 45, 231 (5.4%) were positive for influenza.

* Pneumonia and Influenza Mortality: The proportion of deaths attributed to pneumonia and influenza (P&I) was below the epidemic threshold.
Influenza-Associated Pediatric Deaths: Two influenza-associated pediatric deaths were reported.

* Outpatient Illness Surveillance: The proportion of outpatient visits for influenza-like illness (ILI) was 1.6%, below the national baseline of 2.0%. One region reported ILI above region-specific baseline levels. Two states experienced moderate ILI activity, four states experienced low ILI activity, 44 states and New York City experienced minimal ILI activity and the District of Columbia had insufficient data.

* Geographic Spread of Influenza: The geographic spread of influenza in Puerto Rico and one state was reported as regional; eight states reported local influenza activity; the District of Columbia, Guam and 35 states reported sporadic influenza activity; six states reported no influenza activity, and the U.S. Virgin Islands did not report.

Antigenic Characterization
CDC has antigenically characterized 47 influenza viruses [35 2009 H1N1 viruses, 11 influenza A (H3N2) viruses, and 1 influenza B virus] collected by U.S. laboratories since October 1, 2013 by hemagglutination inhibition (HI).

2009 H1N1 [35]:
All three 2009 H1N1 viruses tested were characterized as A/California/7/2009-like, the influenza A (H1N1) component of the 2013-2014 Northern Hemisphere influenza vaccine.

Influenza A (H3N2) [11]:
All 11 influenza A (H3N2) viruses tested have been characterized as A/Texas/50/2012-like, the influenza A (H3N2) component of the 2013-2014 Northern Hemisphere influenza vaccine.

Influenza B (B/Yamagata and B/Victoria lineages) [1]:
Yamagata Lineage [1]: The one influenza B virus tested was characterized as B/Massachusetts/02/2012-like, which is included as an influenza B component in both the 2013-2014 Northern Hemisphere trivalent and quadrivalent influenza vaccines.

U.S. Virologic Surveillance:
No. of specimens tested 4,257
No. of positive specimens 231 (5.4%)

Positive specimens by type/subtype
Influenza A 203 (87.9%)
2009 H1N1 64 (31.5%)
H3 18 (8.9%)
Subtyping not performed 121 (59.6%)
Influenza B 28 (12.1%)

Neuraminidase Inhibitor Resistance Testing Results:
13 H3N2, 0 tested positive for resistance
6 Flu B, 0 tested positive
106 H1N1, 3 tested positive

http://www.cdc.gov/flu/weekly/
 
Re: USA: 2013-14 FluView - Influenza Season Weekly Summary - Wks 42-46, 0 new pediatric deaths, 2 total

Re: USA: 2013-14 FluView - Influenza Season Weekly Summary - Wks 42-46, 0 new pediatric deaths, 2 total

Week 46, ending Nov 16

Synopsis:
During week 46 (November 10-16, 2013), influenza activity increased slightly in the United States.

Viral Surveillance: Of 4,457 specimens tested and reported by U.S. World Health Organization (WHO) and National Respiratory and Enteric Virus Surveillance System (NREVSS) collaborating laboratories during week 46, 312 (7.0%) were positive for influenza.

Pneumonia and Influenza Mortality: The proportion of deaths attributed to pneumonia and influenza (P&I) was below the epidemic threshold.
Influenza-Associated Pediatric Deaths: No influenza-associated pediatric deaths were reported.

Outpatient Illness Surveillance: The proportion of outpatient visits for influenza-like illness (ILI) was 1.5%, below the national baseline of 2.0%. One region reported ILI above region-specific baseline levels. One state experienced high ILI activity, two states experienced moderate ILI activity, four states experienced low ILI activity, 43 states and New York City experienced minimal ILI activity and the District of Columbia had insufficient data.

Geographic Spread of Influenza: The geographic spread of influenza in four states was reported as regional; nine states reported local influenza activity; Puerto Rico, Guam and 34 states reported sporadic influenza activity; three states reported no influenza activity, and the District of Columbia and the U.S. Virgin Islands did not report.

U.S. Virologic Surveillance, week 46:
No. of specimens tested: 4,457
No. of positive specimens: 312 (7.0%)
Positive specimens by type/subtype
Influenza A: 280 (89.7%)
2009 H1N1: 118 (42.1%)
H3: 14 (5.0%)
Subtyping not performed: 148 (52.9%)
Influenza B: 32 (10.3%)

Antigenic Characterization:
CDC has antigenically characterized 65 influenza viruses [53 2009 H1N1 viruses, 11 influenza A (H3N2) viruses, and 1 influenza B virus] collected by U.S. laboratories since October 1, 2013 by hemagglutination inhibition (HI).

2009 H1N1 [53]:
All 53 2009 H1N1 viruses tested were characterized as A/California/7/2009-like, the influenza A (H1N1) component of the 2013-2014 Northern Hemisphere influenza vaccine.

Influenza A (H3N2) [11]:
All 11 influenza A (H3N2) viruses tested have been characterized as A/Texas/50/2012-like, the influenza A (H3N2) component of the 2013-2014 Northern Hemisphere influenza vaccine.

Influenza B (B/Yamagata and B/Victoria lineages) [1]:
Yamagata Lineage [1]: The one influenza B virus tested was characterized as B/Massachusetts/02/2012-like, which is included as an influenza B component in both the 2013-2014 Northern Hemisphere trivalent and quadrivalent influenza vaccines.

Neuraminidase Inhibitor Resistance Testing Results Since Oct. 1:
34 H3N2, 0 tested positive for resistance
9 Flu B, 0 tested positive
151 H1N1, 4 tested positive

Influenza-Associated Pediatric Mortality:
No influenza-associated pediatric deaths were reported to CDC during week 46. A total of two influenza-associated pediatric deaths for the 2013-2014 season have been reported.

http://www.cdc.gov/flu/weekly/
 
Re: USA: 2013-14 FluView - Influenza Season Weekly Summary - Wks 42-47, 0 new pediatric deaths, 2 total

Re: USA: 2013-14 FluView - Influenza Season Weekly Summary - Wks 42-47, 0 new pediatric deaths, 2 total

Week 47, ending Nov 23

Synopsis:

During week 47 (November 17-23, 2013), influenza activity increased slightly in the United States.

Viral Surveillance: Of 4,996 specimens tested during week 47, 397 (7.9%) were positive for influenza.

Pneumonia and Influenza Mortality: The proportion of deaths attributed to pneumonia and influenza was below the epidemic threshold of 6.6% for week 47.

Influenza-Associated Pediatric Deaths: No influenza-associated pediatric deaths were reported.

Outpatient Illness Surveillance: The proportion of outpatient visits for ILI was 1.7%, below the national baseline of 2.0%. Two regions reported ILI at or above region-specific baseline levels. Two states experienced high ILI activity, one state experienced moderate ILI activity, one state experienced low ILI activity, 45 states and New York City experienced minimal ILI activity and the District of Columbia and one state had insufficient data.

Geographic Spread of Influenza: The geographic spread of influenza in six states was reported as regional; 10 states reported local influenza activity; the District of Columbia, Guam, Puerto Rico, and 32 states reported sporadic influenza activity, and the U.S. Virgin Islands and two states reported no influenza activity.

Week 47:
No. of specimens tested: 4,996
No. of positive specimens: 397 (7.9%)

Positive specimens by type/subtype
Influenza A: 348 (87.7%)
2009 H1N1: 210 (60.3%)
H3: 12 (3.4%)
Subtyping not performed: 126 (36.2%)
Influenza B: 49 (12.3%)

Antigenic Characterization
CDC has antigenically characterized 83 influenza viruses [62 2009 H1N1 viruses, 20 influenza A (H3N2) viruses, and 1 influenza B virus] collected by U.S. laboratories since October 1, 2013 by hemagglutination inhibition (HI).

2009 H1N1 [62]:
All 62 2009 H1N1 viruses tested were characterized as A/California/7/2009-like, the influenza A (H1N1) component of the 2013-2014 Northern Hemisphere influenza vaccine.

Influenza A (H3N2) [20]:
All 20 influenza A (H3N2) viruses tested have been characterized as A/Texas/50/2012-like, the influenza A (H3N2) component of the 2013-2014 Northern Hemisphere influenza vaccine.

Influenza B (B/Yamagata and B/Victoria lineages) [1]:
Yamagata Lineage [1]: The one influenza B virus tested was characterized as B/Massachusetts/02/2012-like, which is included as an influenza B component in both the 2013-2014 Northern Hemisphere trivalent and quadrivalent influenza vaccines.

Neuraminidase Inhibitor Resistance Testing Results:
(Number tested and number of resistant to oseltamivir)
Influenza A (H3N2): 42, 0
Influenza B: 9, 0
2009 H1N1: 217, 6

Influenza-Associated Pediatric Mortality
No influenza-associated pediatric deaths were reported to CDC during week 47. A total of two influenza-associated pediatric deaths for the 2013-2014 season have been reported.

http://www.cdc.gov/flu/weekly/
 
Re: USA: 2013-14 FluView - Influenza Season Weekly Summary - Wks 42-48, 1 new pediatric deaths, 3 total

Re: USA: 2013-14 FluView - Influenza Season Weekly Summary - Wks 42-48, 1 new pediatric deaths, 3 total

Week 48, ending Nov 30

During week 48 (November 24-30, 2013), influenza activity increased slightly in the United States.

? Viral Surveillance: Of 5,306 specimens tested and reported by U.S. World Health Organization (WHO) and National Respiratory and Enteric Virus Surveillance System (NREVSS) collaborating laboratories during week 48, 536 (10.1%) were positive for influenza.

? Pneumonia and Influenza Mortality: The proportion of deaths attributed to pneumonia and influenza (P&I) was below the epidemic threshold.

? Influenza-Associated Pediatric Deaths: One influenza-associated pediatric death was reported.

? Influenza-associated Hospitalizations: A cumulative rate for the season of 1.2 laboratory-confirmed influenza-associated hospitalizations per 100,000 population was reported.

? Outpatient Illness Surveillance: The proportion of outpatient visits for influenza-like illness (ILI) was 1.9%, below the national baseline of 2.0%. Two regions reported ILI above region-specific baseline levels. Two states experienced high ILI activity, two states experienced moderate ILI activity, two states and New York City experienced low ILI activity, 44 states experienced minimal ILI activity and the District of Columbia had insufficient data.

? Geographic Spread of Influenza: The geographic spread of influenza in nine states was reported as regional; 13 states reported local influenza activity; the District of Columbia, Guam, Puerto Rico, and 27 states reported sporadic influenza activity, and the U.S. Virgin Islands and one state reported no influenza activity.

Week 48:
No. of specimens tested: 5,306
No. of positive specimens: 536 (10.1%)

Positive specimens by type/subtype
Influenza A: 501 (93.5%)
2009 H1N1: 213 (42.5%)
H3: 8 (1.6%)
Subtyping not performed: 280 (55.9%)
Influenza B: 35 (6.5%)

Antigenic Characterization*
CDC has antigenically characterized 156 influenza viruses [120 2009 H1N1 viruses, 31 influenza A (H3N2) viruses, and 5 influenza B viruses] collected by U.S. laboratories since October 1, 2013 by hemagglutination inhibition (HI).

2009 H1N1 [120]:
All 120 2009 H1N1 viruses tested were characterized as A/California/7/2009-like, the influenza A (H1N1) component of the 2013-2014 Northern Hemisphere influenza vaccine.

Influenza A (H3N2) [31]:
All 31 influenza A (H3N2) viruses tested have been characterized as A/Texas/50/2012-like, the influenza A (H3N2) component of the 2013-2014 Northern Hemisphere influenza vaccine.

Influenza B (B/Yamagata and B/Victoria lineages) [5]:
Yamagata Lineage [2]: Two (40.0%) of the five influenza B viruses tested were characterized as B/Massachusetts/02/2012-like, which is included as an influenza B component in both the 2013-2014 Northern Hemisphere trivalent and quadrivalent influenza vaccines.
Victoria Lineage [3]: Three (60.0%) of the five influenza B viruses tested were characterized as B/Brisbane/60/2008-like, which is included as a component of the Northern Hemisphere quadrivalent influenza vaccine.

Neuraminidase Inhibitor Resistance Testing Results on Samples Collected Since October 1, 2013
(Number tested and number of resistant to oseltamivir)
Influenza A (H3N2): 46, 0
Influenza B: 11, 0
2009 H1N1: 265, 6
None of those tested were resistant to Zanamivir

Pneumonia and Influenza (P&I) Mortality Surveillance
During week 48, 5.8% of all deaths reported through the 122 Cities Mortality Reporting System were due to P&I. This percentage was below the epidemic threshold of 6.7% for week 48.

Influenza-Associated Hospitalizations
Between October 1, 2013 and November 30, 2013, 333 laboratory-confirmed influenza-associated hospitalizations were reported. This is a rate of 1.2 per 100,000 population.

Among cases, 284 (85.3%) were influenza A, 44 (13.2%) were influenza B, and 3 (0.9%) had no virus type information. Among those with influenza A subtype information, 5 (5.7%) were H3 and 81 (93.1%) were 2009 H1N1.

The most commonly reported underlying medical conditions among adults were obesity, metabolic disorders, chronic lung disease (excluding asthma), and cardiovascular disease. The most commonly reported underlying medical conditions in children were asthma, obesity and metabolic disorders. Approximately 41.7% of hospitalized children had no identified underlying medical conditions. Among 15 hospitalized women of childbearing age (15-44 years), one was pregnant.

http://www.cdc.gov/flu/weekly/
 
Re: USA: 2013-14 FluView - Influenza Season Weekly Summary - Wks 42-49, 0 new pediatric deaths, 3 total

Re: USA: 2013-14 FluView - Influenza Season Weekly Summary - Wks 42-49, 0 new pediatric deaths, 3 total

Week 49, ending Dec 7

Since October 1, 2013, 531 laboratory-confirmed influenza-associated hospitalizations have been reported. This translates to a cumulative rate of 2.0 hospitalizations per 100,000 people in the United States.

The proportion of deaths attributed to pneumonia and influenza (P&I) based on the 122 Cities Mortality Reporting System increased, but remains below the epidemic threshold.

No influenza-associated pediatric deaths were reported to CDC during the week of December 1-7. A total of three influenza-associated pediatric deaths have been reported for the 2013-2014 season.

Nationally, the percentage of respiratory specimens testing positive for influenza viruses in the United States during the week of December 1-7 increased for the seventh consecutive week from 11.1% to 13.3%. During the last three weeks, the regional percentage of respiratory specimens testing positive for influenza viruses ranged from 3.3% to 16.8%.

During the week of December 1-7, 780 of the 830 influenza-positive tests reported to CDC were influenza A viruses and 50 were influenza B viruses. Of the 395 influenza A viruses that were subtyped 3.5% were H3 viruses and 96.5% were 2009 H1N1 viruses.

CDC has antigenically characterized 221 influenza viruses, including 184 2009 influenza A (H1N1) viruses, 31 influenza A (H3N2) viruses, and 6 influenza B virus, collected since October 1, 2013.

All 184 of the 2009 influenza A (H1N1) viruses tested were characterized as A/California/7/2009-like. All 31 of the influenza A (H3N2) viruses tested were characterized as Texas/50/2012-like. Two of the six influenza B viruses tested belonged to the B/Yamagata lineage of viruses, and were characterized as B/Massachusetts/02/2012-like. The four other influenza B viruses belonged to the B/Brisbane lineage of viruses, were characterized as B/Brisbane/60/2008-like.

Since October 1, 2013, CDC has tested 395 2009 influenza A (H1N1), 55 influenza A (H3N2), and 13 influenza B virus samples for resistance to neuraminidase inhibitors. One 2009 H1N1 virus proved resistant to oseltamivir during the week of December 1-7. In total, seven 2009 H1N1 viruses have shown resistance to oseltamivir so far this season, though each of the viruses has been sensitive to zanamivir.

http://www.cdc.gov/flu/weekly/summary.htm
 
Re: USA: 2013-14 FluView - Influenza Season Weekly Summary - Wks 42-49, 1 new pediatric death, 1 last season, 4 total

Re: USA: 2013-14 FluView - Influenza Season Weekly Summary - Wks 42-49, 1 new pediatric death, 1 last season, 4 total

Week 50, ending Dec 14

Influenza-Associated Pediatric Mortality
Two influenza-associated pediatric deaths were reported to CDC during week 50. One death was associated with a 2009 H1N1 virus and occurred during the week ending December 14, 2013 (week 50). A total of four influenza-associated pediatric deaths for the 2013-2014 season have been reported.

One death was associated with an influenza A virus for which no subtyping was performed and occurred during the 2012-13 season. This death brings the total number of reported pediatric deaths for that season to 170.

Viral Surveillance:
Of 7,294 specimens tested and reported by U.S. World Health Organization (WHO) and National Respiratory and Enteric Virus Surveillance System (NREVSS) collaborating laboratories during week 50, 1,301 (17.8%) were positive for influenza.

Positive specimens by type/subtype:
Influenza A 1,261 (96.9%)
2009 H1N1 559 (44.3%)
H3 16 (1.3%)
Subtyping not performed 686 (54.4%)
Influenza B 40 (3.1%)

Pneumonia and Influenza Mortality:
During week 50, 6.6% of all deaths reported through the 122 Cities Mortality Reporting System were due to P&I. This percentage was below the epidemic threshold of 6.9% for week 50.

Outpatient Illness Surveillance:
The proportion of outpatient visits for influenza-like illness (ILI) was 2.3%, above the national baseline of 2.0%. Five regions reported ILI at or above region-specific baseline levels. Four states experienced high ILI activity, one state experienced moderate ILI activity; six states and New York City experienced low ILI activity, 37 states experienced minimal ILI activity and the District of Columbia and two states had insufficient data.

Geographic Spread of Influenza:
The geographic spread of influenza in 4 states was reported as widespread; 20 states reported regional influenza activity; 17 states reported local influenza activity; the District of Columbia, Guam, Puerto Rico, and 8 states reported sporadic influenza activity; one state reported no influenza activity, and the U.S. Virgin Islands did not report.

Antigenic Characterization*
CDC has antigenically characterized 317 influenza viruses [265 2009 H1N1 viruses, 46 influenza A (H3N2) viruses, and 6 influenza B viruses] collected by U.S. laboratories since October 1, 2013 by hemagglutination inhibition (HI).

2009 H1N1 [265]:
All 265 2009 H1N1 viruses tested were characterized as A/California/7/2009-like, the influenza A (H1N1) component of the 2013-2014 Northern Hemisphere influenza vaccine.

Influenza A (H3N2) [46]:
All 46 influenza A (H3N2) viruses tested have been characterized as A/Texas/50/2012-like, the influenza A (H3N2) component of the 2013-2014 Northern Hemisphere influenza vaccine.

Influenza B [6]: Two (33%) of the six influenza B viruses tested belong to B/Yamagata/16/88-lineage and the remaining four (67%) influenza B viruses tested belong to B/Victoria/02/87 lineage.
Yamagata Lineage [2]: Two influenza B/Yamagata-lineage viruses were characterized as B/ Massachusetts/2/1012-like, which is included as an influenza B component of the 2013-2014 Northern Hemisphere trivalent and quadrivalent influenza vaccines.
Victoria Lineage [4]: Four influenza B/Victoria-lineage viruses were characterized as B/Brisbane/60/2008-like, which is included as an influenza B component of the 2013-2014 Northern Hemisphere quadrivalent influenza vaccine.

Neuraminidase Inhibitor Resistance Testing Results on Samples Collected Since October 1, 2013:
No new resistant samples found; current number stands at 7 2009 H1N1

Influenza-Associated Hospitalizations:
Between October 1, 2013 and December 14, 2013, 815 laboratory-confirmed influenza-associated hospitalizations were reported. This is a rate of 3.0 per 100,000 population. Among cases, 744 (91.3%) were influenza A, 61 (7.5%) were influenza B, 6 (0.7%) were influenza A and B co-infection, and 4 (0.5%) had no virus type information. Among those with influenza A subtype information, 7 (2.3%) were H3 and 297 (97.1%) were 2009 H1N1.

The most commonly reported underlying medical conditions among adults were obesity, metabolic disorders, cardiovascular disease, and chronic lung disease (excluding asthma). The most commonly reported underlying medical conditions in children were obesity, asthma, cardiovascular disease and neurologic disorders. Approximately 51.4% of hospitalized children had no identified underlying medical conditions. Among 36 hospitalized women of childbearing age (15-44 years), eight were pregnant.

http://www.cdc.gov/flu/weekly/
 
Re: USA: 2013-14 FluView - Influenza Season Weekly Summary - Wks 42-51, 0 new pediatric deaths, 4 total

Re: USA: 2013-14 FluView - Influenza Season Weekly Summary - Wks 42-51, 0 new pediatric deaths, 4 total

Week 51, ending Dec 21

• Viral Surveillance: Of 6,813 specimens tested and reported by U.S. World Health Organization (WHO) and National Respiratory and Enteric Virus Surveillance System (NREVSS) collaborating laboratories during week 51, 1,639 (24.1%) were positive for influenza.
- 2009 H1N1 915 (56.8%)
- H3 22 (1.4%)
- Subtyping not performed 673 (41.8%)
- Influenza B 28 (1.8%)

• Pneumonia and Influenza Mortality: The proportion of deaths attributed to pneumonia and influenza (P&I) was below the epidemic threshold.

• Influenza-Associated Pediatric Deaths: One influenza-associated pediatric death that occurred during the 2012-2013 season was reported.

• Influenza-associated Hospitalizations: A cumulative rate for the season of 4.3 laboratory-confirmed influenza-associated hospitalizations per 100,000 population was reported.

• Outpatient Illness Surveillance: The proportion of outpatient visits for influenza-like illness (ILI) was 3.0%, above the national baseline of 2.0%. Eight regions reported ILI at or above region-specific baseline levels. Six states experienced high ILI activity; eight states experienced moderate ILI activity; six states experienced low ILI activity; 28 states experienced minimal ILI activity, and the District of Columbia, New York City, and two states had insufficient data.

• Geographic Spread of Influenza: The geographic spread of influenza in 10 states was reported as widespread; Guam and 23 states reported regional influenza activity; 12 states reported local influenza activity; the District of Columbia, Puerto Rico, and four states reported sporadic influenza activity, and the U.S. Virgin Islands and one state did not report.


Antigenic Characterization*
CDC has antigenically characterized 408 influenza viruses [354 2009 H1N1 viruses, 46 influenza A (H3N2) viruses, and 8 influenza B viruses] collected by U.S. laboratories since October 1, 2013 by hemagglutination inhibition (HI).

2009 H1N1 [354]:
• All 354 2009 H1N1 viruses tested were characterized as A/California/7/2009-like, the influenza A (H1N1) component of the 2013-2014 Northern Hemisphere influenza vaccine.

Influenza A (H3N2) [46]:
• All 46 influenza A (H3N2) viruses tested have been characterized as A/Texas/50/2012-like, the influenza A (H3N2) component of the 2013-2014 Northern Hemisphere influenza vaccine.

Influenza B [8]: Three (38%) of the eight influenza B viruses tested belong to B/Yamagata/16/88-lineage and the remaining five (62%) influenza B viruses tested belong to B/Victoria/02/87 lineage.
• Yamagata Lineage [3]: Three influenza B/Yamagata-lineage viruses were characterized as B/ Massachusetts/2/1012-like, which is included as an influenza B component of the 2013-2014 Northern Hemisphere trivalent and quadrivalent influenza vaccines.
• Victoria Lineage [5]: Five influenza B/Victoria-lineage viruses were characterized as B/Brisbane/60/2008-like, which is included as an influenza B component of the 2013-2014 Northern Hemisphere quadrivalent influenza vaccine.

Neuraminidase Inhibitor Resistance Testing Results on Samples Collected Since October 1, 2013
Flu A H3N2: 56 (none resistant)
Flu B: 12 (none resistant)
2009 H1N1: 768 (10 resistant)
None tested have been resistant to Zanamivir

Pneumonia and Influenza (P&I) Mortality Surveillance
During week 51, 6.7% of all deaths reported through the 122 Cities Mortality Reporting System were due to P&I. This percentage was below the epidemic threshold of 6.9% for week 51.

Influenza-Associated Pediatric Mortality
One influenza-associated pediatric death that occurred during the 2012-2013 season was reported to CDC during week 51 and was associated with an influenza B virus. This death brings the total number of reported pediatric deaths for that season to 171. A total of four influenza-associated pediatric deaths for the 2013-2014 season have been reported.

Influenza-Associated Hospitalizations
Between October 1, 2013 and December 21, 2013, 1,156 laboratory-confirmed influenza-associated hospitalizations were reported. This is a rate of 4.3 per 100,000 population. Among cases, 1,071 (92.6%) were influenza A, 72 (6.2%) were influenza B, 6 (0.5%) were influenza A and B co-infection, and 7 (0.6%) had no virus type information. Among those with influenza A subtype information, 7 (1.6%) were H3 and 420 (97.7%) were 2009 H1N1. The most commonly reported underlying medical conditions among adults were obesity, metabolic disorders, cardiovascular disease, and chronic lung disease (excluding asthma). The most commonly reported underlying medical conditions in children were asthma, obesity, neurologic disorders, and cardiovascular disease. Approximately 45.5% of hospitalized children had no identified underlying medical conditions. Among 50 hospitalized women of childbearing age (15-44 years), eleven were pregnant.

http://www.cdc.gov/flu/weekly/
 
Re: USA: 2013-14 FluView - Influenza Season Weekly Summary - Wks 42-51, 2 new pediatric deaths, 6 total

Re: USA: 2013-14 FluView - Influenza Season Weekly Summary - Wks 42-51, 2 new pediatric deaths, 6 total

Week 52, ending Dec 28

Influenza-Associated Pediatric Mortality
Two influenza-associated pediatric deaths were reported to CDC during week 52. One death was associated with a 2009 H1N1 virus and occurred during week 51 (week ending December 21, 2013) and one was associated with an influenza A virus for which no subtyping was performed and occurred during week 50 (week ending December 14, 2013). A total of six influenza-associated pediatric deaths for the 2013-2014 season have been reported.

Pneumonia and Influenza (P&I) Mortality Surveillance
During week 52, 6.5% of all deaths reported through the 122 Cities Mortality Reporting System were due to P&I. This percentage was below the epidemic threshold of 7.0% for week 52.

Geographic Spread of Influenza:
The geographic spread of influenza in 25 states was reported as widespread; 19 states reported regional influenza activity; Puerto Rico and three states reported local influenza activity; the District of Columbia and two states reported sporadic influenza activity, and the U.S. Virgin Islands and Guam did not report.

Outpatient Illness Surveillance:
The proportion of outpatient visits for influenza-like illness (ILI) was 4.3%, above the national baseline of 2.0%. All 10 regions reported ILI at or above region-specific baseline levels. Twenty states experienced high ILI activity; eight states and New York City experienced moderate ILI activity; six states experienced low ILI activity; 16 states experienced minimal ILI activity, and the District of Columbia had insufficient data.

Viral Surveillance:
Of 6,419 specimens tested and reported by U.S. World Health Organization (WHO) and National Respiratory and Enteric Virus Surveillance System (NREVSS) collaborating laboratories during week 52, 1,711 (26.7%) were positive for influenza.

Week 52:
No. of specimens tested 6,419
No. of positive specimens (%) 1,711 (26.7%)

Positive specimens by type/subtype
Influenza A 1,667 (97.4%)
2009 H1N1 915 (54.9%)
H3 7 (0.4%)
Subtyping not performed 745 (44.7%)
Influenza B 44 (2.6%)

Influenza-Associated Hospitalizations
Between October 1, 2013 and December 28, 2013, 1,583 laboratory-confirmed influenza-associated hospitalizations were reported. This is a rate of 5.8 per 100,000 population. Among cases, 1,492 (94.3%) were influenza A, 76 (4.8%) were influenza B, 8 (0.5%) were influenza A and B co-infection, and 7 (0.4%) had no virus type information. Among those with influenza A subtype information, 8 (1.2%) were H3 and 660 (98.2%) were 2009 H1N1. The most commonly reported underlying medical conditions among adults were obesity, metabolic disorders, cardiovascular disease, chronic lung disease (excluding asthma), and asthma. The most commonly reported underlying medical conditions in children were asthma, obesity, neurologic disorders, and chronic lung disease. Approximately 43.5% of hospitalized children had no identified underlying medical conditions. Among 60 hospitalized women of childbearing age (15-44 years), twelve were pregnant.

Neuraminidase Inhibitor Resistance Testing Results on Samples Collected Since October 1, 2013 (0 have been found to be resistant to zanamivir
Influenza A (H3N2): 66, 0 resistant
Influenza B; 15, 0 resistant
2009 H1N1: 910*, 10 resistant

Antigenic Characterization*
CDC has antigenically characterized 452 influenza viruses [398 2009 H1N1 viruses, 46 influenza A (H3N2) viruses, and 8 influenza B viruses] collected by U.S. laboratories since October 1, 2013 by hemagglutination inhibition (HI).

2009 H1N1 [398]:
All 398 2009 H1N1 viruses tested were characterized as A/California/7/2009-like, the influenza A (H1N1) component of the 2013-2014 Northern Hemisphere influenza vaccine.

Influenza A (H3N2) [46]:
All 46 influenza A (H3N2) viruses tested have been characterized as A/Texas/50/2012-like, the influenza A (H3N2) component of the 2013-2014 Northern Hemisphere influenza vaccine.

Influenza B [8]: Three (38%) of the eight influenza B viruses tested belong to B/Yamagata/16/88-lineage and the remaining five (62%) influenza B viruses tested belong to B/Victoria/02/87 lineage.
Yamagata Lineage [3]: Three influenza B/Yamagata-lineage viruses were characterized as B/ Massachusetts/2/1012-like, which is included as an influenza B component of the 2013-2014 Northern Hemisphere trivalent and quadrivalent influenza vaccines.
Victoria Lineage [5]: Five influenza B/Victoria-lineage viruses were characterized as B/Brisbane/60/2008-like, which is included as an influenza B component of the 2013-2014 Northern Hemisphere quadrivalent influenza vaccine.

http://www.cdc.gov/flu/weekly/#S2
 
Re: USA: 2013-14 FluView - Influenza Season Weekly Summary - Wks 42-01, 4 new pediatric deaths, 10 total

Re: USA: 2013-14 FluView - Influenza Season Weekly Summary - Wks 42-01, 4 new pediatric deaths, 10 total

Wk 01, ending Jan 4

Influenza-Associated Pediatric Mortality:
Four influenza-associated pediatric deaths were reported to CDC during week 1. Note: As per MMWR: Influenza-associated pediatric mortality: 4 = OR (1), MS (1), TX (1), WV (1)

Three deaths were associated with a 2009 H1N1 virus and occurred during week 52 (week ending December 28, 2013) and week 1 (week ending January 4, 2014). One was associated with an influenza A virus for which no subtyping was performed and occurred during week 51 (week ending December 21, 2013). A total of 10 influenza-associated pediatric deaths for the 2013-2014 season have been reported.

Pneumonia and Influenza (P&I) Mortality Surveillance
During week 1, 6.9% of all deaths reported through the 122 Cities Mortality Reporting System were due to P&I. This percentage was below the epidemic threshold of 7.1% for week 1.

Influenza-associated Hospitalizations:
A cumulative rate for the season of 9.7 laboratory-confirmed influenza-associated hospitalizations per 100,000 population was reported. 2,622 laboratory-confirmed influenza-associated hospitalizations were reported. This is a rate of 9.7 per 100,000 population.

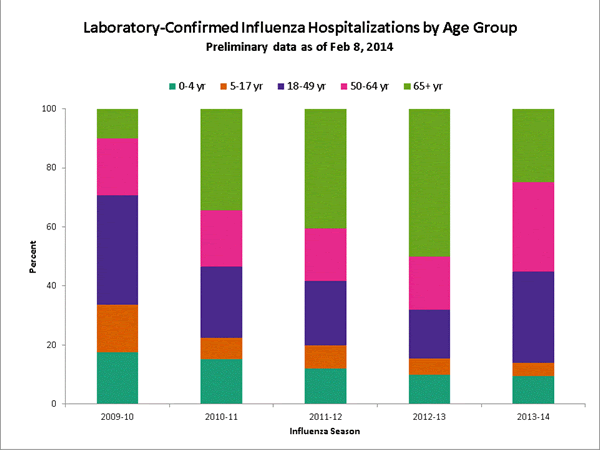
The most affected age groups are those 0-4 and ≥65 years; however, those aged 18-64 years account for 61% of reported hospitalized cases. Among all hospitalizations, 2,499 (95.3%) were influenza A, 96 (3.7%) were influenza B, 11 (0.4%) were influenza A and B co-infection, and 16 (0.6%) had no virus type information. Among those with influenza A subtype information, 14 (1.4%) were H3 and 1,001 (98.6 %) were 2009 H1N1.

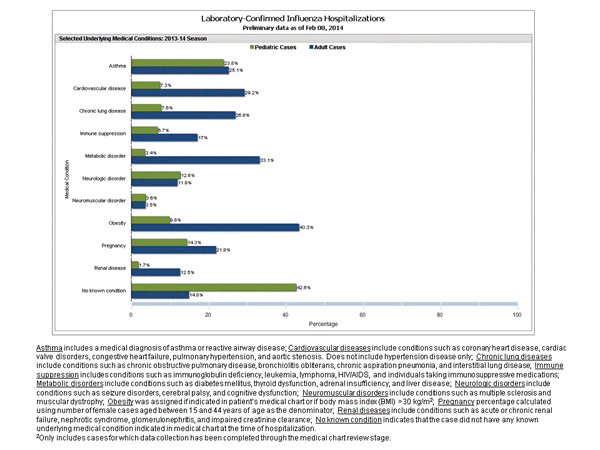
The most commonly reported underlying medical conditions among adults were obesity, metabolic disorders, cardiovascular disease, and asthma. The most commonly reported underlying medical conditions in children were asthma, obesity, neurologic disorders, chronic lung disease (excluding asthma), and cardiovascular disease. Approximately 43.0% of hospitalized children had no identified underlying medical conditions. Among 84 hospitalized women of childbearing age (15-44 years), nineteen were pregnant.

Outpatient Illness Surveillance:
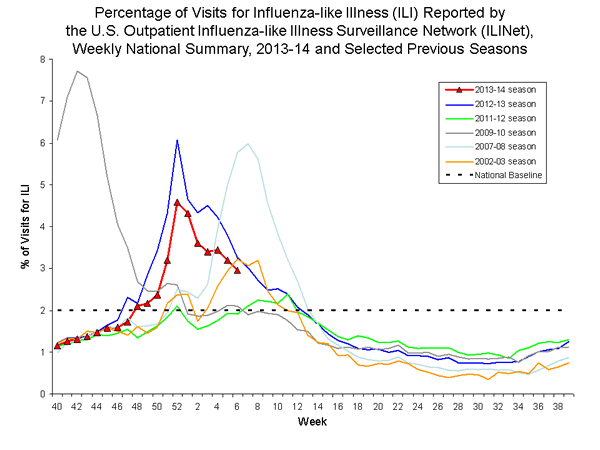
The proportion of outpatient visits for influenza-like illness (ILI) was 4.4%, above the national baseline of 2.0%. All 10 regions reported ILI above region-specific baseline levels. Twenty states experienced high ILI activity; seven states and New York City experienced moderate ILI activity; 11 states experienced low ILI activity; 12 states experienced minimal ILI activity, and the District of Columbia had insufficient data.

Viral Surveillance:
Of 9,482 specimens tested and reported by U.S. World Health Organization (WHO) and National Respiratory and Enteric Virus Surveillance System (NREVSS) collaborating laboratories during week 1, 2,486 (26.2%) were positive for influenza.

Geographic Spread of Influenza:
The geographic spread of influenza in 35 states was reported as widespread; 12 states and Guam reported regional influenza activity; the District of Columbia, Puerto Rico, and two states reported local influenza activity; and one state reported sporadic influenza activity, and the U.S. Virgin Islands did not report.

Antigenic Characterization*
CDC has antigenically characterized 639 influenza viruses [572 2009 H1N1 viruses, 59 influenza A (H3N2) viruses, and 8 influenza B viruses] collected by U.S. laboratories since October 1, 2013 by hemagglutination inhibition (HI).

2009 H1N1 [572]:
All 572 2009 H1N1 viruses tested were characterized as A/California/7/2009-like, the influenza A (H1N1) component of the 2013-2014 Northern Hemisphere influenza vaccine.

Influenza A (H3N2) [59]:
All 59 influenza A (H3N2) viruses tested have been characterized as A/Texas/50/2012-like, the influenza A (H3N2) component of the 2013-2014 Northern Hemisphere influenza vaccine.

Influenza B [8]: Three (38%) of the eight influenza B viruses tested belong to B/Yamagata/16/88-lineage and the remaining five (62%) influenza B viruses tested belong to B/Victoria/02/87 lineage.
Yamagata Lineage [3]: Three influenza B/Yamagata-lineage viruses were characterized as B/ Massachusetts/2/1012-like, which is included as an influenza B component of the 2013-2014 Northern Hemisphere trivalent and quadrivalent influenza vaccines.
Victoria Lineage [5]: Five influenza B/Victoria-lineage viruses were characterized as B/Brisbane/60/2008-like, which is included as an influenza B component of the 2013-2014 Northern Hemisphere quadrivalent influenza vaccine.

Neuraminidase Inhibitor Resistance Testing Results on Samples Collected Since October 1, 2013
Flu A: 76, 0 resistant
Flu B: 17, 0 resistant
2009H1N1: 1100, 13 resistant
No samples have been resistant to Zanamivir

http://www.cdc.gov/flu/weekly/
 
Re: USA: 2013-14 FluView - Influenza Season Weekly Summary - Wks 42-02, 10 new pediatric deaths, 20 total

Re: USA: 2013-14 FluView - Influenza Season Weekly Summary - Wks 42-02, 10 new pediatric deaths, 20 total

Wk 2, ending Jan 11

Influenza-Associated Pediatric Mortality
Ten influenza-associated pediatric deaths were reported to CDC during week 2. Seven deaths were associated with a 2009 H1N1 virus and occurred during weeks 52, 1, and 2 (weeks ending December 28, 2013, January 4, and January 11, 2014). Two deaths were associated with an influenza A virus for which no subtyping was performed and occurred during weeks 51 and 2 (weeks ending December 21, 2013 and January 11, 2014) and one death was associated with an influenza virus for which the type was not determined and occurred during week 52 (week ending December 28, 2013).

A total of 20 influenza-associated pediatric deaths have been reported during the 2013-2014 season from 13 states (AR [2], FL [1], GA [1], KY [1], LA [1], MA [1], MI [1], MS [1], OK [1], OR [1], TN [3], TX [5], and WV [1]).

Influenza-Associated Hospitalizations
Between October 1, 2013 and January 11, 2014, 3,745 laboratory-confirmed influenza-associated hospitalizations were reported. This is a rate of 13.8 per 100,000 population.

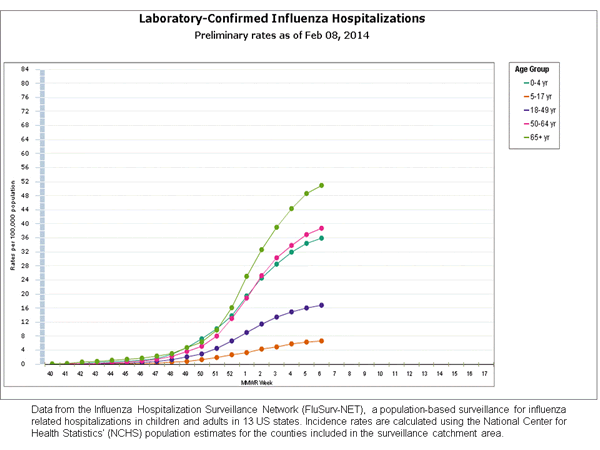
The highest hospitalization rate is among adults aged ≥65 years, followed by those in age groups 0-4 years and 50-64 years. However, those aged 18-64 years still account for 61% of reported hospitalized cases.

Among all hospitalizations, 3,583 (95.7%) were influenza A, 134 (3.6%) were influenza B, 12 (0.3%) were influenza A and B co-infection, and 16 (0.4%) had no virus type information. Among those with influenza A subtype information, 22 (1.5%) were H3 and 1,433 (98.5 %) were 2009 H1N1.

The most commonly reported underlying medical conditions among adults were obesity, metabolic disorders, cardiovascular disease, and asthma. The most commonly reported underlying medical conditions in children were asthma, obesity, neurologic disorders, and cardiovascular disease. Approximately 40% of hospitalized children had no identified underlying medical conditions. Among 125 hospitalized women of childbearing age (15-44 years), 27 (21.6%) were pregnant.

Viral Surveillance:
Of 10,841 specimens tested and reported during week 2 by U.S. World Health Organization (WHO) and National Respiratory and Enteric Virus Surveillance System (NREVSS) collaborating laboratories, 2,721 (25.1%) were positive for influenza.


Outpatient Illness Surveillance:
The proportion of outpatient visits for influenza-like illness (ILI) was 3.6%, above the national baseline of 2.0%. All 10 regions reported ILI above region-specific baseline levels.


U.S. Virologic Surveillance
No. of specimens tested 10,841
No. of positive specimens (%) 2,721 (25.1%)
Positive specimens by type/subtype
Influenza A 2,662 (97.8%)
2009 H1N1 1,730 (65.0%)
H3 55 (2.1%)
Subtyping not performed 877 (32.9%)
Influenza B 59 (2.2%)

Antigenic Characterization*
CDC has antigenically characterized 736 influenza viruses [648 2009 H1N1 viruses, 72 influenza A (H3N2) viruses, and 16 influenza B viruses] collected by U.S. laboratories since October 1, 2013 by hemagglutination inhibition (HI).

2009 H1N1 [648]:
647 (99.8%) of 648 2009 H1N1 viruses tested were characterized as A/California/7/2009-like, the influenza A (H1N1) component of the 2013-2014 Northern Hemisphere influenza vaccine. One (0.2%) virus showed reduced titers with antiserum produced against A/California/7/2009.

Influenza A (H3N2) [72]:
All 72 influenza A (H3N2) viruses tested have been characterized as A/Texas/50/2012-like, the influenza A (H3N2) component of the 2013-2014 Northern Hemisphere influenza vaccine.

Influenza B [16]: Nine (56%) of the 16 influenza B viruses tested belong to B/Yamagata/16/88-lineage and the remaining seven (44%) influenza B viruses tested belong to B/Victoria/02/87 lineage.
Yamagata Lineage [9]: Nine influenza B/Yamagata-lineage viruses were characterized as B/ Massachusetts/2/2012-like, which is included as an influenza B component of the 2013-2014 Northern Hemisphere trivalent and quadrivalent influenza vaccines.
Victoria Lineage [7]: Seven influenza B/Victoria-lineage viruses were characterized as B/Brisbane/60/2008-like, which is included as an influenza B component of the 2013-2014 Northern Hemisphere quadrivalent influenza vaccine.

Neuraminidase Inhibitor Resistance Testing Results on Samples Collected Since October 1, 2013
Flu A: 85, 0 resistant
Flu B: 20, 0 resistant
2009H1N1: 1553, 13 resistant
No samples have been resistant to Zanamivir

http://www.cdc.gov/flu/weekly/
 
Re: USA: 2013-14 FluView - Influenza Season Weekly Summary, Wks 42-03 = 8 new pediatric deaths, 28 total

Re: USA: 2013-14 FluView - Influenza Season Weekly Summary, Wks 42-03 = 8 new pediatric deaths, 28 total

Wk 03, ending Jan 18

Deaths
Eight influenza-associated pediatric deaths were reported
As per MMWR: IA (1), VA (1), NC (1), TN (1), TX (2), CA (2)

Five deaths were associated with a 2009 H1N1 virus and occurred during weeks 1, 2, and 3 (weeks ending January 4, January 11, and January 18, 2014). Three deaths were associated with an influenza A virus for which no subtyping was performed and occurred during week 2 (week ending January 11, 2014).

A total of 28 influenza-associated pediatric deaths have been reported during the 2013-2014 season from 17 states (AR [2], CA [2], FL [1], GA [1], IA [1], KY [1], LA [1], MA [1], MI [1], MS [1], NC [1], OK [1], OR [1], TN [4], TX [7], VA [1], and WV [1]).

Neuraminidase Inhibitor Resistance Testing Results on Samples Collected Since October 1, 2013
2009 H1N1: 1,827 tested, 20 (1.1) are resistant
All other samples tested found 0 resistant
Note: Last week's numbers: 2009H1N1: 1553 tested, 13 resistant

Hospitalizations
Between October 1, 2013 and January 18, 2014, 4,615 laboratory-confirmed influenza-associated hospitalizations were reported. This is a rate of 17.0 per 100,000 population. The highest hospitalization rate is among adults aged ≥65 years, followed by those in the 0-4 years and 50-64 years age groups. Those aged 18-64 years still account for 61% of reported hospitalized cases. Among all hospitalizations, 4,427 (95.9%) were associated with influenza A, 147 (3.2%) with influenza B, 13 (0.3%) with influenza A and B co-infection, and 28 (0.6%) had no virus type information. Among those with influenza A subtype information, 26 (1.4%) were H3 and 1,782 (98.6 %) were 2009 H1N1.

The most commonly reported underlying medical conditions among adults were obesity, metabolic disorders, cardiovascular disease, and asthma. The most commonly reported underlying medical conditions in children were asthma, neurologic disorders, obesity, and cardiovascular disease. Approximately 43% of hospitalized children had no identified underlying medical conditions. Among 168 hospitalized women of childbearing age (15-44 years), thirty-nine (23%) were pregnant.

Antigenic Characterization
? 710 (99.8%) of 711 2009 H1N1 viruses tested were characterized as A/California/7/2009-like, the influenza A (H1N1) component of the 2013-2014 Northern Hemisphere influenza vaccine. One (0.2%) virus showed reduced titers with antiserum produced against A/California/7/2009.
? All 72 influenza A (H3N2) viruses tested have been characterized as A/Texas/50/2012-like, the influenza A (H3N2) component of the 2013-2014 Northern Hemisphere influenza vaccine.
? Nine (56%) of the 16 influenza B viruses tested belong to B/Yamagata/16/88-lineage
?the remaining seven (44%) influenza B viruses tested belong to B/Victoria/02/87 lineage.

http://www.cdc.gov/flu/weekly/
 
Re: USA: 2013-14 FluView - Influenza Season Weekly Summary, Wks 42-04: 9 New Pediatric Deaths, 37 Total

Re: USA: 2013-14 FluView - Influenza Season Weekly Summary, Wks 42-04: 9 New Pediatric Deaths, 37 Total

Wk 04, ending Jan 25

Influenza-Associated Pediatric Mortality
9 influenza-associated pediatric deaths were reported to CDC during week 4. As reported in the MMWR: Wk 4: Influenza-associated pediatric mortality: CA (1), FL (2), LA (1), NYC (1), OK (1), TX (2), UT (1).

Four of the nine deaths were associated with a 2009 H1N1 virus and occurred during weeks 52, 2, 3, and 4 (weeks ending December 28, 2013, January 11, and January 18, and January 25, 2014). Three deaths were associated with an influenza A virus for which no subtyping was performed and occurred during weeks 3 and 4 (weeks ending January 18 and January 25, 2014) and one death was associated with an influenza B virus and occurred during week 3 (week ending January 18, 2014). One death was associated with an influenza virus for which the type was not determined and occurred during week 1 (week ending January 4, 2014).

A total of 37 influenza-associated pediatric deaths have been reported during the 2013-2014 season from New York City [1] and 18 states (AR [2], CA [3], FL [3], GA [1], IA [1], KY [1], LA [2], MA [1], MI [1], MS [1], NC [1], OK [2], OR [1], TN [4], TX [9], UT [1], VA [1], and WV [1]).

Influenza-Associated Hospitalizations
Between October 1, 2013 and January 25, 2014, 5,494 laboratory-confirmed influenza-associated hospitalizations were reported. This is a rate of 20.3 per 100,000 population. The highest hospitalization rate remains among adults aged ≥65 years, followed by those within the 50-64 years and 0-4 years age groups. Those aged 18-64 years account for over 60% of reported hospitalized cases. Among all hospitalizations, 5,259 (95.7%) were associated with influenza A, 185 (3.4%) with influenza B, 16 (0.3%) with influenza A and B co-infection, and 34 (0.6%) had no virus type information. Among those with influenza A subtype information, 29 (1.3%) were H3 and 2,121 (98.7 %) were 2009 H1N1.

Clinical findings are preliminary and based on a subset number of cases (~25%) with complete medical chart abstraction. The most commonly reported underlying medical conditions among adults were obesity, metabolic disorders, cardiovascular disease, and chronic lung disease (excluding asthma). The most commonly reported underlying medical conditions in children were asthma, neurologic disorders, obesity, and cardiovascular disease. Approximately 43% of hospitalized children had no identified underlying medical conditions. Among 217 hospitalized women of childbearing age (15-44 years), 55 (25.4%) were pregnant.

Neuraminidase Inhibitor Resistance Testing Results on Samples Collected Since October 1, 2013
2009 H1N1: 2254 tested, 21 (0.9%) are resistant
All other samples tested found 0 resistant

Antigenic Characterization*
CDC has antigenically characterized 978 influenza viruses [890 2009 H1N1 viruses, 72 influenza A (H3N2) viruses, and 16 influenza B viruses] collected by U.S. laboratories since October 1, 2013 by hemagglutination inhibition (HI).

2009 H1N1 [890]:
* 889 (99.9%) of 890 2009 H1N1 viruses tested were characterized as A/California/7/2009-like, the influenza A (H1N1) component of the 2013-2014 Northern Hemisphere influenza vaccine. One (0.1%) virus showed reduced titers with antiserum produced against A/California/7/2009.

Influenza A (H3N2) [72]:
* All 72 influenza A (H3N2) viruses tested have been characterized as A/Texas/50/2012-like, the influenza A (H3N2) component of the 2013-2014 Northern Hemisphere influenza vaccine.

Influenza B [16]: Nine (56%) of the 16 influenza B viruses tested belong to B/Yamagata/16/88-lineage and the remaining seven (44%) influenza B viruses tested belong to B/Victoria/02/87 lineage.
* Yamagata Lineage [9]: Nine influenza B/Yamagata-lineage viruses were characterized as B/ Massachusetts/2/2012-like, which is included as an influenza B component of the 2013-2014 Northern Hemisphere trivalent and quadrivalent influenza vaccines.
* Victoria Lineage [7]: Seven influenza B/Victoria-lineage viruses were characterized as B/Brisbane/60/2008-like, which is included as an influenza B component of the 2013-2014 Northern Hemisphere quadrivalent influenza vaccine.

http://www.cdc.gov/flu/weekly/
 
Re: USA: 2013-14 FluView: Influenza Season Weekly Summary, Wks 42-04: 9 New Pediatric Deaths, 37 Total

Re: USA: 2013-14 FluView: Influenza Season Weekly Summary, Wks 42-04: 9 New Pediatric Deaths, 37 Total

2013-2014 Influenza Season Week 5 ending February 1, 2014


All data are preliminary and may change as more reports are received.
Synopsis:

During week 5 (January 26-February 1, 2014), influenza activity remained high in the United States.

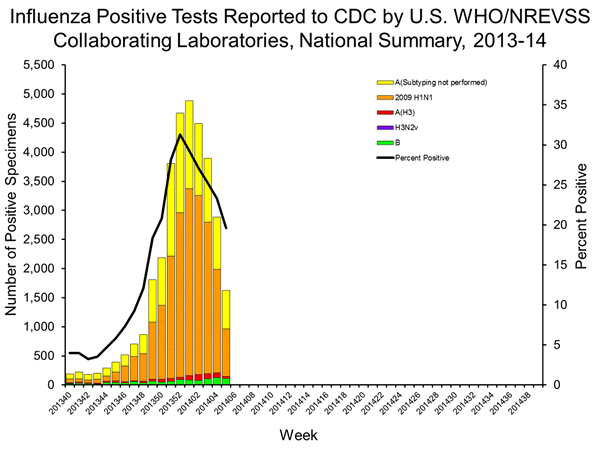
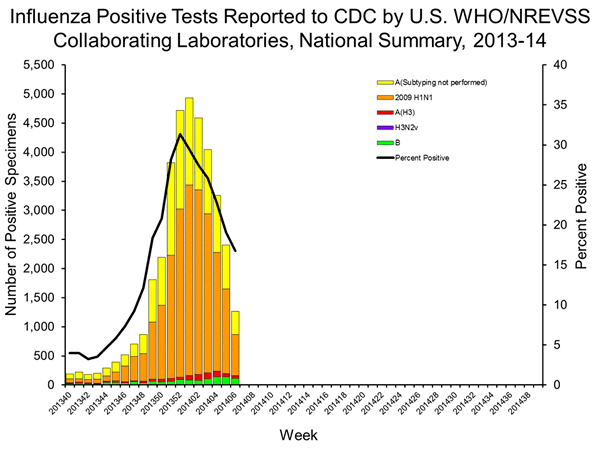
  • Viral Surveillance: Of 8,282 specimens tested and reported during week 5 by U.S. World Health Organization (WHO) and National Respiratory and Enteric Virus Surveillance System (NREVSS) collaborating laboratories, 1,626 (19.6%) were positive for influenza.
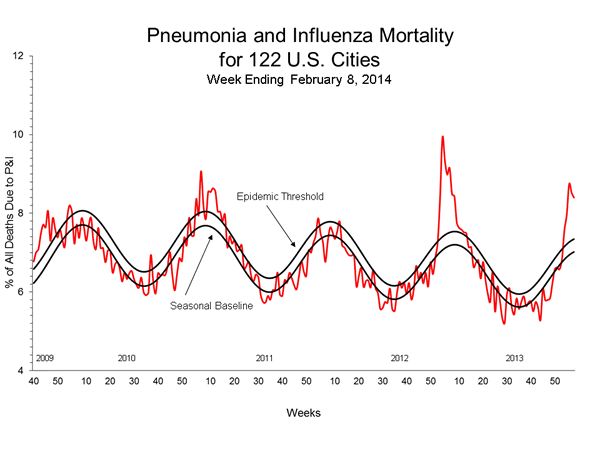
  • Pneumonia and Influenza Mortality: The proportion of deaths attributed to pneumonia and influenza (P&I) was above the epidemic threshold.
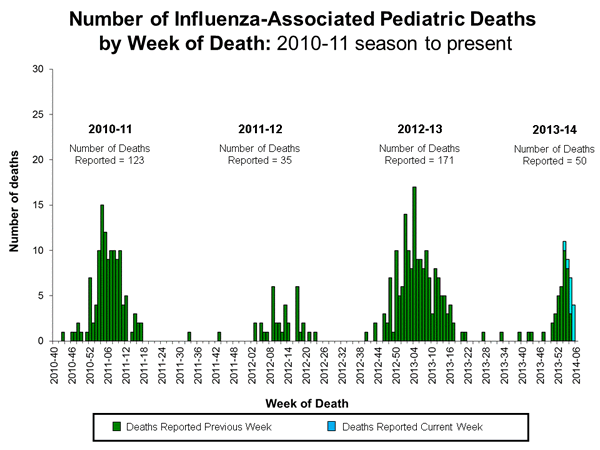
  • Influenza-Associated Pediatric Deaths: Three influenza-associated pediatric deaths were reported.
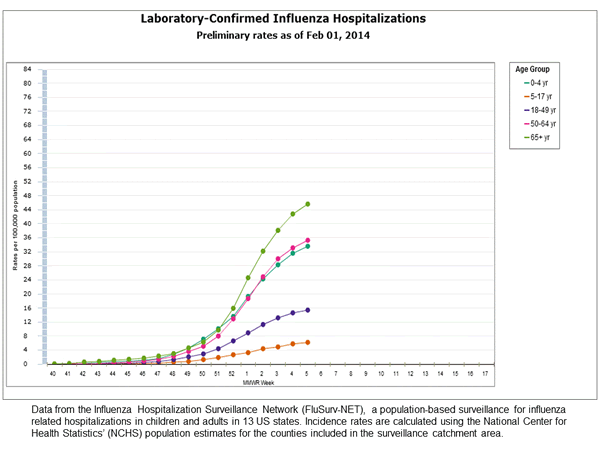
  • Influenza-associated Hospitalizations:A season-cumulative rate of 22.5 laboratory-confirmed influenza-associated hospitalizations per 100,000 population was reported.
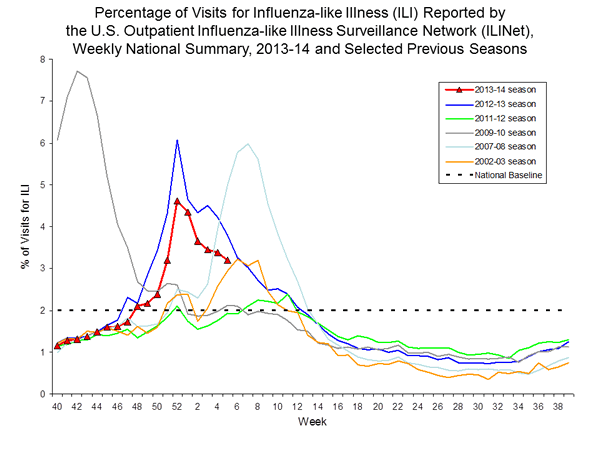
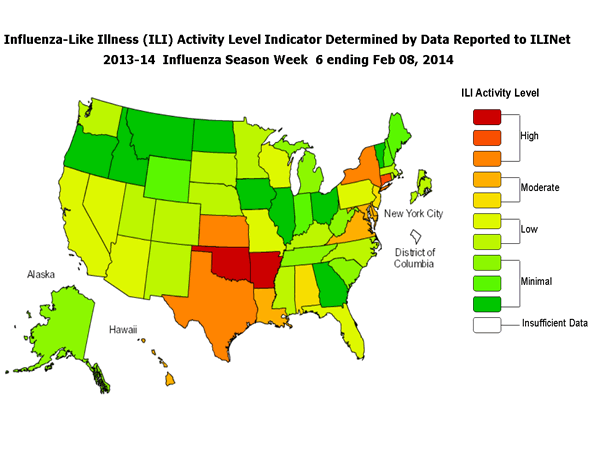
  • Outpatient Illness Surveillance: The proportion of outpatient visits for influenza-like illness (ILI) was 3.2%, above the national baseline of 2.0%. All 10 regions reported ILI above region-specific baseline levels. Seven states experienced high ILI activity; 12 states experienced moderate ILI activity; 14 states and New York City experienced low ILI activity; 17 states experienced minimal ILI activity, and the District of Columbia had insufficient data.
  • Geographic Spread of Influenza: The geographic spread of influenza in 29 states was reported as widespread; 19 states reported regional influenza activity; the District of Columbia and one state reported local influenza activity; Guam, Puerto Rico, and one state reported sporadic influenza activity, and the U.S. Virgin Islands reported no influenza activity.
A description of surveillance methods is available at: http://www.cdc.gov/flu/weekly/overview.htm
<table class="table" border="0" cellpadding="3" cellspacing="0" width="100%"> <caption>National and Regional Summary of Select Surveillance Components

</caption> <tbody><tr style="vertical-align:top" bgcolor="#c5bee1"> <th rowspan="2" style="vertical-align:bottom" width="12%">HHS Surveillance Regions*</th> <th colspan="3" style="text-align: center;" nowrap="nowrap" width="34%">Data for current week</th> <th colspan="7" style="text-align: center;" nowrap="nowrap" width="54%">Data cumulative since September 29, 2013 (Week 40)</th> </tr> <tr style="vertical-align:middle; background-image: url(images/purplegrad.jpg); background-repeat: repeat-x;"> <th style="text-align: center;" width="8%">Out-patient ILI?</th> <th style="text-align: center;" width="8%">% positive for flu?</th> <th style="text-align: center;" width="15%">Number of jurisdictions reporting regional or widespread activity?</th> <th style="text-align: center;" nowrap="nowrap" width="7%">2009 H1N1</th> <th style="text-align: center;" width="11%">A (H3)</th> <th style="text-align: center;" width="18%">A(Subtyping not performed)</th> <th style="text-align: center;" nowrap="nowrap" width="7%">B</th> <th style="text-align: center;" width="11%">Pediatric Deaths</th> </tr> <tr> <td style="text-align: left;" width="12%">Nation</td> <td style="text-align: center;" nowrap="nowrap" width="8%">Elevated</td> <td style="text-align: center;" nowrap="nowrap" width="8%">19.6%</td> <td style="text-align: center;" nowrap="nowrap" width="15%">48 of 54</td> <td style="text-align: center;" nowrap="nowrap" width="7%">20,270</td> <td style="text-align: center;" nowrap="nowrap" width="11%">753</td> <td style="text-align: center;" nowrap="nowrap" width="18%">11,719</td> <td style="text-align: center;" nowrap="nowrap" width="7%">1,098</td> <td style="text-align: center;" nowrap="nowrap" width="11%">40</td> </tr> <tr> <td style="text-align: left;" width="12%">Region 1</td> <td style="text-align: center;" nowrap="nowrap" width="8%">Elevated</td> <td style="text-align: center;" nowrap="nowrap" width="8%">32.6%</td> <td style="text-align: center;" nowrap="nowrap" width="15%">6 of 6</td> <td style="text-align: center;" nowrap="nowrap" width="7%">1,100</td> <td style="text-align: center;" nowrap="nowrap" width="11%">107</td> <td style="text-align: center;" nowrap="nowrap" width="18%">186</td> <td style="text-align: center;" nowrap="nowrap" width="7%">23</td> <td style="text-align: center;" nowrap="nowrap" width="11%">1</td> </tr> <tr> <td style="text-align: left;" width="12%">Region 2</td> <td style="text-align: center;" nowrap="nowrap" width="8%">Elevated</td> <td style="text-align: center;" nowrap="nowrap" width="8%">22.8%</td> <td style="text-align: center;" nowrap="nowrap" width="15%">2 of 4</td> <td style="text-align: center;" nowrap="nowrap" width="7%">1,184</td> <td style="text-align: center;" nowrap="nowrap" width="11%">45</td> <td style="text-align: center;" nowrap="nowrap" width="18%">734</td> <td style="text-align: center;" nowrap="nowrap" width="7%">54</td> <td style="text-align: center;" nowrap="nowrap" width="11%">1</td> </tr> <tr> <td style="text-align: left;" width="12%">Region 3</td> <td style="text-align: center;" nowrap="nowrap" width="8%">Elevated</td> <td style="text-align: center;" nowrap="nowrap" width="8%">37.0%</td> <td style="text-align: center;" nowrap="nowrap" width="15%">5 of 6</td> <td style="text-align: center;" nowrap="nowrap" width="7%">2,668</td> <td style="text-align: center;" nowrap="nowrap" width="11%">70</td> <td style="text-align: center;" nowrap="nowrap" width="18%">194</td> <td style="text-align: center;" nowrap="nowrap" width="7%">27</td> <td style="text-align: center;" nowrap="nowrap" width="11%">2</td> </tr> <tr> <td style="text-align: left;" width="12%">Region 4</td> <td style="text-align: center;" nowrap="nowrap" width="8%">Elevated</td> <td style="text-align: center;" nowrap="nowrap" width="8%">19.7%</td> <td style="text-align: center;" nowrap="nowrap" width="15%">7 of 8</td> <td style="text-align: center;" nowrap="nowrap" width="7%">1,658</td> <td style="text-align: center;" nowrap="nowrap" width="11%">14</td> <td style="text-align: center;" nowrap="nowrap" width="18%">4,153</td> <td style="text-align: center;" nowrap="nowrap" width="7%">622</td> <td style="text-align: center;" nowrap="nowrap" width="11%">11</td> </tr> <tr> <td style="text-align: left;" width="12%">Region 5</td> <td style="text-align: center;" nowrap="nowrap" width="8%">Elevated</td> <td style="text-align: center;" nowrap="nowrap" width="8%">31.8%</td> <td style="text-align: center;" nowrap="nowrap" width="15%">6 of 6</td> <td style="text-align: center;" nowrap="nowrap" width="7%">2,165</td> <td style="text-align: center;" nowrap="nowrap" width="11%">72</td> <td style="text-align: center;" nowrap="nowrap" width="18%">575</td> <td style="text-align: center;" nowrap="nowrap" width="7%">24</td> <td style="text-align: center;" nowrap="nowrap" width="11%">2</td> </tr> <tr> <td style="text-align: left;" width="12%">Region 6</td> <td style="text-align: center;" nowrap="nowrap" width="8%">Elevated</td> <td style="text-align: center;" nowrap="nowrap" width="8%">19.3%</td> <td style="text-align: center;" nowrap="nowrap" width="15%">5 of 5</td> <td style="text-align: center;" nowrap="nowrap" width="7%">2,552</td> <td style="text-align: center;" nowrap="nowrap" width="11%">97</td> <td style="text-align: center;" nowrap="nowrap" width="18%">3,781</td> <td style="text-align: center;" nowrap="nowrap" width="7%">209</td> <td style="text-align: center;" nowrap="nowrap" width="11%">16</td> </tr> <tr> <td style="text-align: left;" width="12%">Region 7</td> <td style="text-align: center;" nowrap="nowrap" width="8%">Elevated</td> <td style="text-align: center;" nowrap="nowrap" width="8%">19.4%</td> <td style="text-align: center;" nowrap="nowrap" width="15%">4 of 4</td> <td style="text-align: center;" nowrap="nowrap" width="7%">1,099</td> <td style="text-align: center;" nowrap="nowrap" width="11%">24</td> <td style="text-align: center;" nowrap="nowrap" width="18%">40</td> <td style="text-align: center;" nowrap="nowrap" width="7%">12</td> <td style="text-align: center;" nowrap="nowrap" width="11%">1</td> </tr> <tr> <td style="text-align: left;" width="12%">Region 8</td> <td style="text-align: center;" nowrap="nowrap" width="8%">Elevated</td> <td style="text-align: center;" nowrap="nowrap" width="8%">17.9%</td> <td style="text-align: center;" nowrap="nowrap" width="15%">6 of 6</td> <td style="text-align: center;" nowrap="nowrap" width="7%">4,165</td> <td style="text-align: center;" nowrap="nowrap" width="11%">73</td> <td style="text-align: center;" nowrap="nowrap" width="18%">1,083</td> <td style="text-align: center;" nowrap="nowrap" width="7%">49</td> <td style="text-align: center;" nowrap="nowrap" width="11%">1</td> </tr> <tr> <td style="text-align: left;" width="12%">Region 9</td> <td style="text-align: center;" nowrap="nowrap" width="8%">Elevated</td> <td style="text-align: center;" nowrap="nowrap" width="8%">22.6%</td> <td style="text-align: center;" nowrap="nowrap" width="15%">3 of 5</td> <td style="text-align: center;" nowrap="nowrap" width="7%">1,715</td> <td style="text-align: center;" nowrap="nowrap" width="11%">155</td> <td style="text-align: center;" nowrap="nowrap" width="18%">858</td> <td style="text-align: center;" nowrap="nowrap" width="7%">57</td> <td style="text-align: center;" nowrap="nowrap" width="11%">4</td> </tr> <tr> <td style="text-align: left;" width="12%">Region 10</td> <td style="text-align: center;" nowrap="nowrap" width="8%">Elevated</td> <td style="text-align: center;" nowrap="nowrap" width="8%">21.4%</td> <td style="text-align: center;" nowrap="nowrap" width="15%">4 of 4</td> <td style="text-align: center;" nowrap="nowrap" width="7%">1,944</td> <td style="text-align: center;" nowrap="nowrap" width="11%">96</td> <td style="text-align: center;" nowrap="nowrap" width="18%">115</td> <td style="text-align: center;" nowrap="nowrap" width="7%">21</td> <td style="text-align: center;" nowrap="nowrap" width="11%">1</td> </tr> </tbody></table>​
*HHS regions (Region 1 CT, ME, MA, NH, RI, VT; Region 2: NJ, NY, Puerto Rico, US Virgin Islands; Region 3: DE, DC, MD, PA, VA, WV; Region 4: AL, FL, GA, KY, MS, NC, SC, TN; Region 5: IL, IN, MI, MN, OH, WI; Region 6: AR, LA, NM, OK, TX; Region 7: IA, KS, MO, NE; Region 8: CO, MT, ND, SD, UT, WY; Region 9: AZ, CA, Guam, HI, NV; and Region 10: AK, ID, OR, WA).
? Elevated means the % of visits for ILI is at or above the national or region-specific baseline
? National data are for current week; regional data are for the most recent three weeks
? Includes all 50 states, the District of Columbia, Guam, Puerto Rico, and U.S. Virgin Islands


U.S. Virologic Surveillance

WHO and NREVSS collaborating laboratories located in all 50 states, Puerto Rico, and Washington D.C. report to CDC the number of respiratory specimens tested for influenza and the number positive by influenza virus type and influenza A virus subtype. The results of tests performed during the current week are summarized in the table below.

Region specific data can be found at http://gis.cdc.gov/grasp/fluview/fluportaldashboard.html.

<table class="table" align="center" border="0" cellpadding="2" cellspacing="0"> <tbody><tr style="background-image: url(images/purplegrad.jpg); background-repeat: repeat-x;"> <th style="text-align: left;" width="270">
</th> <th style="text-align: center;" nowrap="nowrap" width="150">Week 5</th> </tr> <tr> <th style="text-align: left;" width="270">No. of specimens tested</th> <td style="text-align: center;" nowrap="nowrap" width="150">8,282</td> </tr> <tr> <th style="text-align: left;" width="270">No. of positive specimens (%)</th> <td style="text-align: center;" nowrap="nowrap" width="150">1,626 (19.6%)</td> </tr> <tr> <th style="text-align: left;" width="270">Positive specimens by type/subtype</th> <td style="text-align: center;" nowrap="nowrap" width="150">
</td> </tr> <tr> <th style="text-align: left;" width="270"> Influenza A</th> <td style="text-align: center;" nowrap="nowrap" width="150">1,511 (92.9%)</td> </tr> <tr> <th style="text-align: left;" width="270"> 2009 H1N1</th> <td style="text-align: right;" nowrap="nowrap" width="150"> 816 (54.0%) </td> </tr> <tr> <th style="text-align: left;" width="270"> H3</th> <td style="text-align: right;" nowrap="nowrap" width="150">31 (2.1%) </td> </tr> <tr> <th style="text-align: left;" width="270"> Subtyping not performed</th> <td style="text-align: right;" nowrap="nowrap" width="150"> 664 (43.9%) </td> </tr> <tr> <th style="text-align: left;" width="270"> Influenza B</th> <td style="text-align: center;" nowrap="nowrap" width="150">115 (7.1%)</td> </tr> </tbody></table>
<center> </center>


Antigenic Characterization*

CDC has antigenically characterized 1,044 influenza viruses [920 2009 H1N1 viruses, 86 influenza A (H3N2) viruses, and 38 influenza B viruses] collected by U.S. laboratories since October 1, 2013 by hemagglutination inhibition (HI).
2009 H1N1 [920]:

  • 919 (99.9%) of 920 2009 H1N1 viruses tested were characterized as A/California/7/2009-like, the influenza A (H1N1) component of the 2013-2014 Northern Hemisphere influenza vaccine. One (0.1%) virus showed reduced titers with antiserum produced against A/California/7/2009.
Influenza A (H3N2) [86]:

  • All 86 influenza A (H3N2) viruses tested have been characterized as A/Texas/50/2012-like, the influenza A (H3N2) component of the 2013-2014 Northern Hemisphere influenza vaccine.
Influenza B [38]: 21 (55%) of the 38 influenza B viruses tested belong to B/Yamagata/16/88-lineage and the remaining 17 (45%) influenza B viruses tested belong to B/Victoria/02/87 lineage.

  • Yamagata Lineage [21]: 21 influenza B/Yamagata-lineage viruses were characterized as B/ Massachusetts/2/2012-like, which is included as an influenza B component of the 2013-2014 Northern Hemisphere trivalent and quadrivalent influenza vaccines.
  • Victoria Lineage [17]: 17 influenza B/Victoria-lineage viruses were characterized as B/Brisbane/60/2008-like, which is included as an influenza B component of the 2013-2014 Northern Hemisphere quadrivalent influenza vaccine.
*For more information see the section on antigenic characterization in the MMWR ?Update: Influenza Activity ? United States and Worldwide, May 19?September 28, 2013?.


Antiviral Resistance

Testing of 2009 H1N1, influenza A (H3N2), and influenza B virus isolates for resistance to neuraminidase inhibitors (oseltamivir and zanamivir) is performed at CDC using a functional assay. Additional 2009 H1N1 and influenza A (H3N2) clinical samples are tested for mutations of the virus known to confer oseltamivir resistance. The data summarized below combine the results of both testing methods. These samples are routinely obtained for surveillance purposes rather than for diagnostic testing of patients suspected to be infected with antiviral-resistant virus.
High levels of resistance to the adamantanes (amantadine and rimantadine) persist among 2009 influenza A (H1N1) and A (H3N2) viruses (the adamantanes are not effective against influenza B viruses). Therefore, data from adamantane resistance testing are not presented below.
<table class="table" style="text-align: center;" align="center" border="0" cellpadding="3" cellspacing="0"> <caption> Neuraminidase Inhibitor Resistance Testing Results on Samples Collected Since October 1, 2013

</caption> <tbody><tr bgcolor="#c5bee1"> <td rowspan="2" style="width:81.0pt;border:1.0pt; padding:0in 5.4pt 0in 5.4pt;height:27.85pt;" width="108">
</td> <th colspan="2" style="width:2.0in;border:1.0pt;vertical-align:middle;height:27.85pt" width="192">Oseltamivir</th> <th colspan="2" style="width:2.0in;border:1.0pt;vertical-align:middle;;height:27.85pt" width="192">Zanamivir</th> </tr> <tr style="height:25.15pt;text-align:center;background-image: url(images/purplegrad.jpg); background-repeat:repeat-x;"> <th style="width:63.0pt;text-align:center;" align="center" width="84">Virus Samples tested (n)</th> <th style="width:63.0pt;text-align:center;" align="center" width="84">Resistant Viruses, Number (%)</th> <th style="width:63.0pt;text-align:center;" align="center" width="84">Virus Samples tested (n)</th> <th style="width:63.0pt;text-align:center;" align="center" width="84">Resistant Viruses, Number (%)</th> </tr> <tr> <th style="text-align: left;" bgcolor="#dad5eb" nowrap="nowrap" width="160">Influenza A (H3N2)</th> <td style="text-align: center;" nowrap="nowrap" width="100">138</td> <td style="text-align: center;" nowrap="nowrap" width="100">0 (0.0)</td> <td style="text-align: center;" nowrap="nowrap" width="100">138</td> <td style="text-align: center;" nowrap="nowrap" width="100">0 (0.0)</td> </tr> <tr> <th style="text-align: left;" bgcolor="#dad5eb" nowrap="nowrap" width="160">Influenza B</th> <td style="text-align: center;" nowrap="nowrap" width="100">43</td> <td style="text-align: center;" nowrap="nowrap" width="100">0 (0.0)</td> <td style="text-align: center;" nowrap="nowrap" width="100">43</td> <td style="text-align: center;" nowrap="nowrap" width="100">0 (0.0)</td> </tr> <tr> <th style="text-align: left;" bgcolor="#dad5eb" nowrap="nowrap" width="160">2009 H1N1</th> <td style="text-align: center;" nowrap="nowrap" width="100">2,778*</td> <td style="text-align: center;" nowrap="nowrap" width="100">23 (0.8)</td> <td style="text-align: center;" nowrap="nowrap" width="100">969</td> <td style="text-align: center;" nowrap="nowrap" width="100">0 (0.0)</td> </tr> </tbody></table> <center>
*Includes specimens tested in national surveillance and additional specimens tested at public health laboratories in 17 states (AZ, CA, CO, DE, FL, GA, HI, MA, ME, MD, MI, NY, PA, TX, UT, WA, and WI) who share testing results with CDC.

</center>
The majority of currently circulating influenza viruses are susceptible to the neuraminidase inhibitor antiviral medications, oseltamivir and zanamivir; however, rare sporadic cases of oseltamivir-resistant 2009 H1N1 and A (H3N2) viruses have been detected worldwide. Antiviral treatment with oseltamivir or zanamivir is recommended as early as possible for patients with confirmed or suspected influenza who have severe, complicated, or progressive illness; who require hospitalization; or who are at greater risk for serious influenza-related complications. Additional information on recommendations for treatment and chemoprophylaxis of influenza virus infection with antiviral agents is available at http://www.cdc.gov/flu/antivirals/index.htm.

Pneumonia and Influenza (P&I) Mortality Surveillance

During week 5, 8.6% of all deaths reported through the 122 Cities Mortality Reporting System were due to P&I. This percentage was above the epidemic threshold of 7.3% for week 5.
<center>
picurve05.gif

View Full Screen | View PowerPoint Presentation </center>


Influenza-Associated Pediatric Mortality

Three influenza-associated pediatric deaths were reported to CDC during week 5. All three deaths were associated with an influenza A virus for which no subtyping was performed and occurred during weeks 1, 3 and 4 (weeks ending January 4, January 18, and January 25, 2014).
A total of 40 influenza-associated pediatric deaths have been reported during the 2013-2014 season from New York City [1] and 19 states (AR [3], CA [4], FL [3], GA [1], IA [1], KY [1], LA [2], MA [1], MI [1], MS [1], NC [1], OK [2], OR [1], TN [4], TX [9], UT [1], VA [1], WI [1], and WV [1]).
Additional data can be found at http://gis.cdc.gov/GRASP/Fluview/PedFluDeath.html.

<center>
View Interactive Application | View Full Screen | View PowerPoint Presentation </center>

Influenza-Associated Hospitalizations

The Influenza Hospitalization Surveillance Network (FluSurv-NET) conducts population-based surveillance for laboratory-confirmed influenza-related hospitalizations in children younger than 18 years of age (since the 2003-2004 influenza season) and adults (since the 2005-2006 influenza season).
The FluSurv-NET covers more than 70 counties in the 10 Emerging Infections Program (EIP) states (CA, CO, CT, GA, MD, MN, NM, NY, OR, TN) and additional Influenza Hospitalization Surveillance Project (IHSP) states. The IHSP began during the 2009-2010 season to enhance surveillance during the 2009 H1N1 pandemic. IHSP sites included IA, ID, MI, OK and SD during the 2009-2010 season; ID, MI, OH, OK, RI, and UT during the 2010-2011 season; MI, OH, RI, and UT during the 2011-2012 season; IA, MI, OH, RI, and UT during the 2012-2013 season; and MI, OH, and UT during the 2013-2014 season.
Data gathered are used to estimate age-specific hospitalization rates on a weekly basis, and describe characteristics of persons hospitalized with severe influenza illness. The rates provided are likely to be an underestimate as influenza-related hospitalizations can be missed, either because testing is not performed, or because cases may be attributed to other causes of pneumonia or other common influenza-related complications.
Between October 1, 2013 and February 1, 2014, 6,081 laboratory-confirmed influenza-associated hospitalizations were reported. This is a rate of 22.5 per 100,000 population. The highest rate of hospitalization remains among adults aged ≥65 years, followed by those within the 50-64 years and 0-4 years age groups. Those aged 18-64 years accounted for over 60% of reported hospitalized cases. Among all hospitalizations, 5,795 (95.3%) were associated with influenza A, 218 (3.6%) with influenza B, 19 (0.3%) with influenza A and B co-infection, and 49 (0.8%) had no virus type information. Among those with influenza A subtype information, 32 (1.3%) were H3 and 2,456 (98.7%) were 2009 H1N1.
Clinical findings are preliminary and based on a subset number of cases (~30%) with complete medical chart abstraction. The most commonly reported underlying medical conditions among adults were obesity, metabolic disorders, cardiovascular disease, and chronic lung disease (excluding asthma). The most commonly reported underlying medical conditions in children were asthma, neurologic disorders, obesity, cardiovascular disease, and chronic lung disease (excluding asthma). Approximately 44% of hospitalized children had no identified underlying medical conditions. Among 249 hospitalized women of childbearing age (15-44 years), 57 (22.9%) were pregnant.
Additional FluSurv-NET data can be found at:http://gis.cdc.gov/GRASP/Fluview/FluHospRates.html and http://gis.cdc.gov/grasp/fluview/FluHospChars.html.

<center>
View Interactive Application | View Full Screen | View PowerPoint Presentation


</center> Outpatient Illness Surveillance

Nationwide during week 5, 3.2% of patient visits reported through the U.S. Outpatient Influenza-like Illness Surveillance Network (ILINet) were due to influenza-like illness (ILI). This percentage is above the national baseline of 2.0%. (ILI is defined as fever (temperature of 100?F [37.8?C] or greater) and cough and/or sore throat.)

<center> </center>
On a regional level, the percentage of outpatient visits for ILI ranged from 1.7% to 5.1% during week 5. All 10 regions reported a proportion of outpatient visits for ILI above their region-specific baseline level.
Region specific data is available at http://gis.cdc.gov/grasp/fluview/fluportaldashboard.html.

ILINet Activity Indicator Map

Data collected in ILINet are used to produce a measure of ILI activity* by state. Activity levels are based on the percent of outpatient visits in a state due to ILI and are compared to the average percent of ILI visits that occur during weeks with little or no influenza virus circulation. Activity levels range from minimal, which would correspond to ILI activity from outpatient clinics being below, or only slightly above, the average, to high, which would correspond to ILI activity from outpatient clinics being much higher than average.
During week 5, the following ILI activity levels were experienced:

  • Seven states experienced high ILI activity (Alabama, Arkansas, Kansas, Louisiana, Oklahoma, Texas, and Virginia).
  • Twelve states experienced moderate ILI activity (California, Delaware, Hawaii, Minnesota, Mississippi, Missouri, New Jersey, New Mexico, North Carolina, South Dakota, Tennessee, and Vermont).
  • Fourteen states and New York City experienced low ILI activity (Alaska, Arizona, Colorado, Connecticut, Florida, Indiana, Kentucky, Nebraska, Nevada, New York, Pennsylvania, South Carolina, Utah, and Washington).
  • Seventeen states experienced minimal ILI activity (Georgia, Idaho, Illinois, Iowa, Maine, Maryland, Massachusetts, Michigan, Montana, New Hampshire, North Dakota, Ohio, Oregon, Rhode Island, West Virginia, Wisconsin, and Wyoming).
  • Data were insufficient to calculate an ILI activity level from the District of Columbia.
Click on map to launch interactive tool

*This map uses the proportion of outpatient visits to health care providers for influenza-like illness to measure the ILI activity level within a state. It does not, however, measure the extent of geographic spread of flu within a state. Therefore, outbreaks occurring in a single city could cause the state to display high activity levels.
Data collected in ILINet may disproportionately represent certain populations within a state, and therefore, may not accurately depict the full picture of influenza activity for the whole state.
Data displayed in this map are based on data collected in ILINet, whereas the State and Territorial flu activity map is based on reports from state and territorial epidemiologists. The data presented in this map is preliminary and may change as more data is received.
Differences in the data presented here by CDC and independently by some state health departments likely represent differing levels of data completeness with data presented by the state likely being the more complete.

Geographic Spread of Influenza as Assessed by State and Territorial Epidemiologists

The influenza activity reported by state and territorial epidemiologists indicates geographic spread of influenza viruses, but does not measure the severity of influenza activity.
During week 5, the following influenza activity was reported:

  • Widespread influenza activity was reported by 29 states (Arizona, Arkansas, California, Connecticut, Delaware, Idaho, Illinois, Indiana, Iowa, Kansas, Maine, Maryland, Massachusetts, Michigan, Missouri, Nebraska, New Hampshire, New Jersey, New York, North Carolina, North Dakota, Ohio, Oklahoma, Pennsylvania, Rhode Island, South Carolina, Vermont, Virginia, and West Virginia).
  • Regional influenza activity was reported by 19 states (Alabama, Alaska, Colorado, Florida, Georgia, Kentucky, Louisiana, Montana, Minnesota, Nevada, New Mexico, Oregon, South Dakota, Tennessee, Texas, Utah, Washington, Wisconsin, and Wyoming).
  • The District of Columbia and one state (Mississippi) reported local influenza activity.
  • Sporadic influenza activity was reported by Guam, Puerto Rico, and one state (Hawaii).
  • The U.S. Virgin Islands reported no influenza activity.


Additional National and International Influenza Surveillance Information


FluView Interactive: FluView includes enhanced web-based interactive applications that can provide dynamic visuals of the influenza data collected and analyzed by CDC. These FluView Interactive applications allow people to create customized, visual interpretations of influenza data, as well as make comparisons across flu seasons, regions, age groups and a variety of other demographics. To access these tools visit http://www.cdc.gov/flu/weekly/fluviewinteractive.htm.
U.S. State and local influenza surveillance: Click on a jurisdiction below to access the latest local influenza information.
<table> <tbody><tr border="1"> <td width="139" height="8">Alabama
</td> <td width="139" height="8">Alaska
</td> <td width="139" height="8">Arizona
</td> <td width="139" height="8">Arkansas
</td> <td width="139" height="8">California
</td> </tr> <tr border="1"> <td width="139" height="8">Colorado
</td> <td width="139" height="8">Connecticut
</td> <td width="139" height="8">Delaware
</td> <td width="139" height="8">District of Columbia
</td> <td width="139" height="8">Florida
</td> </tr> <tr border="1"> <td width="139" height="8">Georgia
</td> <td width="139" height="8">Hawaii
</td> <td width="139" height="8">Idaho
</td> <td width="139" height="8">Illinois
</td> <td width="139" height="8">Indiana
</td> </tr> <tr border="1"> <td width="139" height="8">Iowa
</td> <td width="139" height="8">Kansas
</td> <td width="139" height="8">Kentucky
</td> <td width="139" height="8">Louisiana
</td> <td width="139" height="8">Maine
</td> </tr> <tr border="1"> <td width="139" height="8">Maryland
</td> <td width="139" height="8">Massachusetts
</td> <td width="139" height="8">Michigan
</td> <td width="139" height="8">Minnesota
</td> <td width="139" height="8">Mississippi
</td> </tr> <tr border="1"> <td width="139" height="8">Missouri
</td> <td width="139" height="8">Montana
</td> <td width="139" height="8">Nebraska
</td> <td width="139" height="8">Nevada
</td> <td width="139" height="8">New Hampshire
</td> </tr> <tr border="1"> <td width="139" height="8">New Jersey
</td> <td width="139" height="8">New Mexico
</td> <td width="139" height="8">New York
</td> <td width="139" height="8">North Carolina
</td> <td width="139" height="8">North Dakota
</td> </tr> <tr border="1"> <td width="139" height="8">Ohio
</td> <td width="139" height="8">Oklahoma
</td> <td width="139" height="8">Oregon
</td> <td width="139" height="8">Pennsylvania
</td> <td width="139" height="8">Rhode Island
</td> </tr> <tr border="1"> <td width="139" height="8">South Carolina
</td> <td width="139" height="8">South Dakota
</td> <td width="139" height="8">Tennessee
</td> <td width="139" height="8">Texas
</td> <td width="139" height="8">Utah
</td> </tr> <tr border="1"> <td width="139" height="8">Vermont
</td> <td width="139" height="8">Virginia
</td> <td width="139" height="8">Washington
</td> <td width="139" height="8">West Virginia
</td> <td width="139" height="8">Wisconsin
</td> </tr> <tr border="1"> <td width="139" height="8">Wyoming
</td> <td width="139" height="8">New York City
</td> <td width="139" height="8">Virgin Islands
</td> <td width="139" height="8">
</td> </tr> </tbody></table>

Google Flu Trends: Google Flu Trends uses aggregated Google search data in a model created in collaboration with CDC to estimate influenza activity in the United States. For more information and activity estimates from the U.S. and worldwide, see http://www.google.org/flutrends/
World Health Organization: Additional influenza surveillance information from participating WHO member nations is available through FluNet and the Global Epidemiology Reports.
WHO Collaborating Centers for Influenza located in Australia, China, Japan, and the United Kingdom.
Europe: for the most recent influenza surveillance information from Europe, please see WHO/Europe at http://www.euroflu.org/index.php and visit the European Centre for Disease Prevention and Control at http://ecdc.europa.eu/en/publications/surveillance_reports/influenza/Pages/weekly_influenza_surveillance_overview.aspx
Public Health Agency of Canada: The most up-to-date influenza information from Canada is available at http://www.phac-aspc.gc.ca/fluwatch/
Health Protection Agency (United Kingdom): The most up-to-date influenza information from the United Kingdom is available at http://www.hpa.org.uk/Topics/InfectiousDiseases/InfectionsAZ/SeasonalInfluenza/


Any links provided to non-Federal organizations are provided solely as a service to our users. These links do not constitute an endorsement of these organizations or their programs by CDC or the Federal Government, and none should be inferred. CDC is not responsible for the content of the individual organization web pages found at these links.

http://www.cdc.gov/flu/weekly/

 
Re: USA: 2013-14 FluView: Influenza Season Weekly Summary, Wks 42-06: 10 New Pediatric Deaths

Re: USA: 2013-14 FluView: Influenza Season Weekly Summary, Wks 42-06: 10 New Pediatric Deaths

2013-2014 Influenza Season Week 6 ending February 8, 2014


All data are preliminary and may change as more reports are received.
Synopsis:

During week 6 (February 2-8, 2014), influenza activity decreased, but remained high in the United States.

  • Viral Surveillance: Of 7,562 specimens tested and reported during week 6 by U.S. World Health Organization (WHO) and National Respiratory and Enteric Virus Surveillance System (NREVSS) collaborating laboratories, 1,268 (16.8%) were positive for influenza.
  • Pneumonia and Influenza Mortality: The proportion of deaths attributed to pneumonia and influenza (P&I) was above the epidemic threshold.
  • Influenza-Associated Pediatric Deaths: Ten influenza-associated pediatric deaths were reported.
  • Influenza-associated Hospitalizations:A season-cumulative rate of 22.5 laboratory-confirmed influenza-associated hospitalizations per 100,000 population was reported.
  • Outpatient Illness Surveillance: The proportion of outpatient visits for influenza-like illness (ILI) was 3.0%, above the national baseline of 2.0%. All 10 regions reported ILI above region-specific baseline levels. Six states experienced high ILI activity; seven states experienced moderate ILI activity; 19 states and New York City experienced low ILI activity; 18 states experienced minimal ILI activity, and the District of Columbia had insufficient data.
  • Geographic Spread of Influenza: The geographic spread of influenza in 24 states was reported as widespread; 20 states reported regional influenza activity; the District of Columbia, Guam, and five states reported local influenza activity; Puerto Rico and one state reported sporadic influenza activity, and the U.S. Virgin Islands reported no influenza activity.
A description of surveillance methods is available at: http://www.cdc.gov/flu/weekly/overview.htm
<table class="table" border="0" cellpadding="3" cellspacing="0" width="100%"> <caption>National and Regional Summary of Select Surveillance Components

</caption> <tbody><tr style="vertical-align:top" bgcolor="#c5bee1"> <th rowspan="2" style="vertical-align:bottom" width="12%">HHS Surveillance Regions*</th> <th colspan="3" style="text-align: center;" width="34%" nowrap="nowrap">Data for current week</th> <th colspan="7" style="text-align: center;" width="54%" nowrap="nowrap">Data cumulative since September 29, 2013 (Week 40)</th> </tr> <tr style="vertical-align:middle; background-image: url(images/purplegrad.jpg); background-repeat: repeat-x;"> <th style="text-align: center;" width="8%">Out-patient ILI?</th> <th style="text-align: center;" width="8%">% positive for flu?</th> <th style="text-align: center;" width="15%">Number of jurisdictions reporting regional or widespread activity?</th> <th style="text-align: center;" width="7%" nowrap="nowrap">2009 H1N1</th> <th style="text-align: center;" width="11%">A (H3)</th> <th style="text-align: center;" width="18%">A(Subtyping not performed)</th> <th style="text-align: center;" width="7%" nowrap="nowrap">B</th> <th style="text-align: center;" width="11%">Pediatric Deaths</th> </tr> <tr> <td style="text-align: left;" width="12%">Nation</td> <td style="text-align: center;" width="8%" nowrap="nowrap">Elevated</td> <td style="text-align: center;" width="8%" nowrap="nowrap">16.8%</td> <td style="text-align: center;" width="15%" nowrap="nowrap">44 of 54</td> <td style="text-align: center;" width="7%" nowrap="nowrap">22,265</td> <td style="text-align: center;" width="11%" nowrap="nowrap">845</td> <td style="text-align: center;" width="18%" nowrap="nowrap">12,254</td> <td style="text-align: center;" width="7%" nowrap="nowrap">1,254</td> <td style="text-align: center;" width="11%" nowrap="nowrap">50</td> </tr> <tr> <td style="text-align: left;" width="12%">Region 1</td> <td style="text-align: center;" width="8%" nowrap="nowrap">Elevated</td> <td style="text-align: center;" width="8%" nowrap="nowrap">28.9%</td> <td style="text-align: center;" width="15%" nowrap="nowrap">6 of 6</td> <td style="text-align: center;" width="7%" nowrap="nowrap">1,217</td> <td style="text-align: center;" width="11%" nowrap="nowrap">118</td> <td style="text-align: center;" width="18%" nowrap="nowrap">216</td> <td style="text-align: center;" width="7%" nowrap="nowrap">26</td> <td style="text-align: center;" width="11%" nowrap="nowrap">1</td> </tr> <tr> <td style="text-align: left;" width="12%">Region 2</td> <td style="text-align: center;" width="8%" nowrap="nowrap">Elevated</td> <td style="text-align: center;" width="8%" nowrap="nowrap">22.3%</td> <td style="text-align: center;" width="15%" nowrap="nowrap">2 of 4</td> <td style="text-align: center;" width="7%" nowrap="nowrap">1,371</td> <td style="text-align: center;" width="11%" nowrap="nowrap">58</td> <td style="text-align: center;" width="18%" nowrap="nowrap">777</td> <td style="text-align: center;" width="7%" nowrap="nowrap">68</td> <td style="text-align: center;" width="11%" nowrap="nowrap">1</td> </tr> <tr> <td style="text-align: left;" width="12%">Region 3</td> <td style="text-align: center;" width="8%" nowrap="nowrap">Elevated</td> <td style="text-align: center;" width="8%" nowrap="nowrap">29.6%</td> <td style="text-align: center;" width="15%" nowrap="nowrap">4 of 6</td> <td style="text-align: center;" width="7%" nowrap="nowrap">3,176</td> <td style="text-align: center;" width="11%" nowrap="nowrap">80</td> <td style="text-align: center;" width="18%" nowrap="nowrap">199</td> <td style="text-align: center;" width="7%" nowrap="nowrap">36</td> <td style="text-align: center;" width="11%" nowrap="nowrap">3</td> </tr> <tr> <td style="text-align: left;" width="12%">Region 4</td> <td style="text-align: center;" width="8%" nowrap="nowrap">Elevated</td> <td style="text-align: center;" width="8%" nowrap="nowrap">17.3%</td> <td style="text-align: center;" width="15%" nowrap="nowrap">6 of 8</td> <td style="text-align: center;" width="7%" nowrap="nowrap">1,820</td> <td style="text-align: center;" width="11%" nowrap="nowrap">17</td> <td style="text-align: center;" width="18%" nowrap="nowrap">4,279</td> <td style="text-align: center;" width="7%" nowrap="nowrap">683</td> <td style="text-align: center;" width="11%" nowrap="nowrap">13</td> </tr> <tr> <td style="text-align: left;" width="12%">Region 5</td> <td style="text-align: center;" width="8%" nowrap="nowrap">Elevated</td> <td style="text-align: center;" width="8%" nowrap="nowrap">29.2%</td> <td style="text-align: center;" width="15%" nowrap="nowrap">6 of 6</td> <td style="text-align: center;" width="7%" nowrap="nowrap">2,349</td> <td style="text-align: center;" width="11%" nowrap="nowrap">76</td> <td style="text-align: center;" width="18%" nowrap="nowrap">613</td> <td style="text-align: center;" width="7%" nowrap="nowrap">26</td> <td style="text-align: center;" width="11%" nowrap="nowrap">3</td> </tr> <tr> <td style="text-align: left;" width="12%">Region 6</td> <td style="text-align: center;" width="8%" nowrap="nowrap">Elevated</td> <td style="text-align: center;" width="8%" nowrap="nowrap">15.5%</td> <td style="text-align: center;" width="15%" nowrap="nowrap">4 of 5</td> <td style="text-align: center;" width="7%" nowrap="nowrap">2,783</td> <td style="text-align: center;" width="11%" nowrap="nowrap">113</td> <td style="text-align: center;" width="18%" nowrap="nowrap">3,923</td> <td style="text-align: center;" width="7%" nowrap="nowrap">242</td> <td style="text-align: center;" width="11%" nowrap="nowrap">18</td> </tr> <tr> <td style="text-align: left;" width="12%">Region 7</td> <td style="text-align: center;" width="8%" nowrap="nowrap">Elevated</td> <td style="text-align: center;" width="8%" nowrap="nowrap">15.0%</td> <td style="text-align: center;" width="15%" nowrap="nowrap">4 of 4</td> <td style="text-align: center;" width="7%" nowrap="nowrap">1,150</td> <td style="text-align: center;" width="11%" nowrap="nowrap">25</td> <td style="text-align: center;" width="18%" nowrap="nowrap">43</td> <td style="text-align: center;" width="7%" nowrap="nowrap">16</td> <td style="text-align: center;" width="11%" nowrap="nowrap">3</td> </tr> <tr> <td style="text-align: left;" width="12%">Region 8</td> <td style="text-align: center;" width="8%" nowrap="nowrap">Elevated</td> <td style="text-align: center;" width="8%" nowrap="nowrap">14.2%</td> <td style="text-align: center;" width="15%" nowrap="nowrap">5 of 6</td> <td style="text-align: center;" width="7%" nowrap="nowrap">4,358</td> <td style="text-align: center;" width="11%" nowrap="nowrap">76</td> <td style="text-align: center;" width="18%" nowrap="nowrap">1,128</td> <td style="text-align: center;" width="7%" nowrap="nowrap">52</td> <td style="text-align: center;" width="11%" nowrap="nowrap">1</td> </tr> <tr> <td style="text-align: left;" width="12%">Region 9</td> <td style="text-align: center;" width="8%" nowrap="nowrap">Elevated</td> <td style="text-align: center;" width="8%" nowrap="nowrap">19.3%</td> <td style="text-align: center;" width="15%" nowrap="nowrap">3 of 5</td> <td style="text-align: center;" width="7%" nowrap="nowrap">1,971</td> <td style="text-align: center;" width="11%" nowrap="nowrap">183</td> <td style="text-align: center;" width="18%" nowrap="nowrap">954</td> <td style="text-align: center;" width="7%" nowrap="nowrap">80</td> <td style="text-align: center;" width="11%" nowrap="nowrap">6</td> </tr> <tr> <td style="text-align: left;" width="12%">Region 10</td> <td style="text-align: center;" width="8%" nowrap="nowrap">Elevated</td> <td style="text-align: center;" width="8%" nowrap="nowrap">16.4%</td> <td style="text-align: center;" width="15%" nowrap="nowrap">4 of 4</td> <td style="text-align: center;" width="7%" nowrap="nowrap">2,070</td> <td style="text-align: center;" width="11%" nowrap="nowrap">99</td> <td style="text-align: center;" width="18%" nowrap="nowrap">122</td> <td style="text-align: center;" width="7%" nowrap="nowrap">25</td> <td style="text-align: center;" width="11%" nowrap="nowrap">1</td> </tr> </tbody></table>​
*HHS regions (Region 1 CT, ME, MA, NH, RI, VT; Region 2: NJ, NY, Puerto Rico, US Virgin Islands; Region 3: DE, DC, MD, PA, VA, WV; Region 4: AL, FL, GA, KY, MS, NC, SC, TN; Region 5: IL, IN, MI, MN, OH, WI; Region 6: AR, LA, NM, OK, TX; Region 7: IA, KS, MO, NE; Region 8: CO, MT, ND, SD, UT, WY; Region 9: AZ, CA, Guam, HI, NV; and Region 10: AK, ID, OR, WA).
? Elevated means the % of visits for ILI is at or above the national or region-specific baseline
? National data are for current week; regional data are for the most recent three weeks
? Includes all 50 states, the District of Columbia, Guam, Puerto Rico, and U.S. Virgin Islands


U.S. Virologic Surveillance

WHO and NREVSS collaborating laboratories located in all 50 states, Puerto Rico, and Washington D.C. report to CDC the number of respiratory specimens tested for influenza and the number positive by influenza virus type and influenza A virus subtype. The results of tests performed during the current week are summarized in the table below.

Region specific data can be found at http://gis.cdc.gov/grasp/fluview/fluportaldashboard.html.

<table class="table" align="center" border="0" cellpadding="2" cellspacing="0"> <tbody><tr style="background-image: url(images/purplegrad.jpg); background-repeat: repeat-x;"> <th style="text-align: left;" width="270">
</th> <th style="text-align: center;" width="150" nowrap="nowrap">Week 6</th> </tr> <tr> <th style="text-align: left;" width="270">No. of specimens tested</th> <td style="text-align: center;" width="150" nowrap="nowrap">7,562</td> </tr> <tr> <th style="text-align: left;" width="270">No. of positive specimens (%)</th> <td style="text-align: center;" width="150" nowrap="nowrap">1,268 (16.8%)</td> </tr> <tr> <th style="text-align: left;" width="270">Positive specimens by type/subtype</th> <td style="text-align: center;" width="150" nowrap="nowrap">
</td> </tr> <tr> <th style="text-align: left;" width="270"> Influenza A</th> <td style="text-align: center;" width="150" nowrap="nowrap">1,154 (91.0%)</td> </tr> <tr> <th style="text-align: left;" width="270"> 2009 H1N1</th> <td style="text-align: right;" width="150" nowrap="nowrap"> 708 (61.4%) </td> </tr> <tr> <th style="text-align: left;" width="270"> H3</th> <td style="text-align: right;" width="150" nowrap="nowrap">45 (3.9%) </td> </tr> <tr> <th style="text-align: left;" width="270"> Subtyping not performed</th> <td style="text-align: right;" width="150" nowrap="nowrap"> 401 (34.7%) </td> </tr> <tr> <th style="text-align: left;" width="270"> Influenza B</th> <td style="text-align: center;" width="150" nowrap="nowrap">114 (9.0%)</td> </tr> </tbody></table>
<center> </center>


Antigenic Characterization*

CDC has antigenically characterized 1,046 influenza viruses [920 2009 H1N1 viruses, 86 influenza A (H3N2) viruses, and 40 influenza B viruses] collected by U.S. laboratories since October 1, 2013 by hemagglutination inhibition (HI).
2009 H1N1 [920]:

  • 919 (99.9%) of 920 2009 H1N1 viruses tested were characterized as A/California/7/2009-like, the influenza A (H1N1) component of the 2013-2014 Northern Hemisphere influenza vaccine. One (0.1%) virus showed reduced titers with antiserum produced against A/California/7/2009.
Influenza A (H3N2) [86]:

  • All 86 influenza A (H3N2) viruses tested have been characterized as A/Texas/50/2012-like, the influenza A (H3N2) component of the 2013-2014 Northern Hemisphere influenza vaccine.
Influenza B [40]: 21 (52.5%) of the 40 influenza B viruses tested belong to B/Yamagata/16/88-lineage and the remaining 19 (47.5%) influenza B viruses tested belong to B/Victoria/02/87 lineage.

  • Yamagata Lineage [21]: 21 influenza B/Yamagata-lineage viruses were characterized as B/ Massachusetts/2/2012-like, which is included as an influenza B component of the 2013-2014 Northern Hemisphere trivalent and quadrivalent influenza vaccines.
  • Victoria Lineage [19]: 19 influenza B/Victoria-lineage viruses were characterized as B/Brisbane/60/2008-like, which is included as an influenza B component of the 2013-2014 Northern Hemisphere quadrivalent influenza vaccine.
*For more information see the section on antigenic characterization in the MMWR ?Update: Influenza Activity ? United States and Worldwide, May 19?September 28, 2013?.


Antiviral Resistance

Testing of 2009 H1N1, influenza A (H3N2), and influenza B virus isolates for resistance to neuraminidase inhibitors (oseltamivir and zanamivir) is performed at CDC using a functional assay. Additional 2009 H1N1 and influenza A (H3N2) clinical samples are tested for mutations of the virus known to confer oseltamivir resistance. The data summarized below combine the results of both testing methods. These samples are routinely obtained for surveillance purposes rather than for diagnostic testing of patients suspected to be infected with antiviral-resistant virus.
High levels of resistance to the adamantanes (amantadine and rimantadine) persist among 2009 influenza A (H1N1) and A (H3N2) viruses (the adamantanes are not effective against influenza B viruses). Therefore, data from adamantane resistance testing are not presented below.
<table class="table" style="text-align: center;" align="center" border="0" cellpadding="3" cellspacing="0"> <caption> Neuraminidase Inhibitor Resistance Testing Results on Samples Collected Since October 1, 2013

</caption> <tbody><tr bgcolor="#c5bee1"> <td rowspan="2" style="width:81.0pt;border:1.0pt; padding:0in 5.4pt 0in 5.4pt;height:27.85pt;" width="108">
</td> <th colspan="2" style="width:2.0in;border:1.0pt;vertical-align:middle;height:27.85pt" width="192">Oseltamivir</th> <th colspan="2" style="width:2.0in;border:1.0pt;vertical-align:middle;;height:27.85pt" width="192">Zanamivir</th> </tr> <tr style="height:25.15pt;text-align:center;background-image: url(images/purplegrad.jpg); background-repeat:repeat-x;"> <th style="width:63.0pt;text-align:center;" align="center" width="84">Virus Samples tested (n)</th> <th style="width:63.0pt;text-align:center;" align="center" width="84">Resistant Viruses, Number (%)</th> <th style="width:63.0pt;text-align:center;" align="center" width="84">Virus Samples tested (n)</th> <th style="width:63.0pt;text-align:center;" align="center" width="84">Resistant Viruses, Number (%)</th> </tr> <tr> <th style="text-align: left;" bgcolor="#dad5eb" width="160" nowrap="nowrap">Influenza A (H3N2)</th> <td style="text-align: center;" width="100" nowrap="nowrap">151</td> <td style="text-align: center;" width="100" nowrap="nowrap">0 (0.0)</td> <td style="text-align: center;" width="100" nowrap="nowrap">151</td> <td style="text-align: center;" width="100" nowrap="nowrap">0 (0.0)</td> </tr> <tr> <th style="text-align: left;" bgcolor="#dad5eb" width="160" nowrap="nowrap">Influenza B</th> <td style="text-align: center;" width="100" nowrap="nowrap">54</td> <td style="text-align: center;" width="100" nowrap="nowrap">0 (0.0)</td> <td style="text-align: center;" width="100" nowrap="nowrap">54</td> <td style="text-align: center;" width="100" nowrap="nowrap">0 (0.0)</td> </tr> <tr> <th style="text-align: left;" bgcolor="#dad5eb" width="160" nowrap="nowrap">2009 H1N1</th> <td style="text-align: center;" width="100" nowrap="nowrap">3,109*</td> <td style="text-align: center;" width="100" nowrap="nowrap">25 (0.8)</td> <td style="text-align: center;" width="100" nowrap="nowrap">1,120</td> <td style="text-align: center;" width="100" nowrap="nowrap">0 (0.0)</td> </tr> </tbody></table> <center>
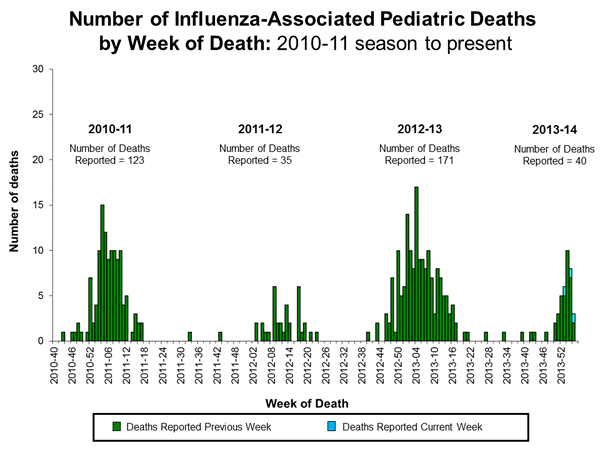
*Includes specimens tested in national surveillance and additional specimens tested at public health laboratories in 17 states (AZ, CA, CO, DE, FL, GA, HI, MA, ME, MD, MI, NY, PA, TX, UT, WA, and WI) who share testing results with CDC.

</center>
The majority of currently circulating influenza viruses are susceptible to the neuraminidase inhibitor antiviral medications, oseltamivir and zanamivir; however, rare sporadic cases of oseltamivir-resistant 2009 H1N1 and A (H3N2) viruses have been detected worldwide. Antiviral treatment with oseltamivir or zanamivir is recommended as early as possible for patients with confirmed or suspected influenza who have severe, complicated, or progressive illness; who require hospitalization; or who are at greater risk for serious influenza-related complications. Additional information on recommendations for treatment and chemoprophylaxis of influenza virus infection with antiviral agents is available at http://www.cdc.gov/flu/antivirals/index.htm.

Pneumonia and Influenza (P&I) Mortality Surveillance

During week 6, 8.4% of all deaths reported through the 122 Cities Mortality Reporting System were due to P&I. This percentage was above the epidemic threshold of 7.3% for week 6.
<center>
picurve06.gif

View Full Screen | View PowerPoint Presentation </center>


Influenza-Associated Pediatric Mortality

Ten influenza-associated pediatric deaths were reported to CDC during week 6. Six deaths were associated with a 2009 H1N1 virus and occurred during weeks 4 and 5 (weeks ending January 25 and February 1, 2014). Four deaths were associated with an influenza A virus for which no subtyping was performed and occurred during weeks 2, 3, 4, and 5 (weeks ending January 11, January 18, January 25, and February 1, 2014).
A total of 50 influenza-associated pediatric deaths have been reported during the 2013-2014 season from New York City [1] and 24 states (AR [3], AZ [1], CA [4]; FL [3], GA [1]; IA [1]; KS [1], KY [1]; LA [4]; MA [1]; MI [2], MS [1], NC [3]; NE [1], NV [1], OK [2]; OR [1], PA [1], TN [4]; TX [9]; UT [1]; VA [1]; WI [1]; and WV [1]).
Additional data can be found at http://gis.cdc.gov/GRASP/Fluview/PedFluDeath.html.

<center>
View Interactive Application | View Full Screen | View PowerPoint Presentation </center>

Influenza-Associated Hospitalizations

The Influenza Hospitalization Surveillance Network (FluSurv-NET) conducts population-based surveillance for laboratory-confirmed influenza-related hospitalizations in children younger than 18 years of age (since the 2003-2004 influenza season) and adults (since the 2005-2006 influenza season).
The FluSurv-NET covers more than 70 counties in the 10 Emerging Infections Program (EIP) states (CA, CO, CT, GA, MD, MN, NM, NY, OR, TN) and additional Influenza Hospitalization Surveillance Project (IHSP) states. The IHSP began during the 2009-2010 season to enhance surveillance during the 2009 H1N1 pandemic. IHSP sites included IA, ID, MI, OK and SD during the 2009-2010 season; ID, MI, OH, OK, RI, and UT during the 2010-2011 season; MI, OH, RI, and UT during the 2011-2012 season; IA, MI, OH, RI, and UT during the 2012-2013 season; and MI, OH, and UT during the 2013-2014 season.
Data gathered are used to estimate age-specific hospitalization rates on a weekly basis, and describe characteristics of persons hospitalized with severe influenza illness. The rates provided are likely to be an underestimate as influenza-related hospitalizations can be missed, either because testing is not performed, or because cases may be attributed to other causes of pneumonia or other common influenza-related complications.
Between October 1, 2013 and February 8, 2014, 6,655 laboratory-confirmed influenza-associated hospitalizations were reported. This is a rate of 24.6 per 100,000 population. The highest rate of hospitalization remains among adults aged ≥65 years, followed by those within the 50-64 years and 0-4 years age groups. Those aged 18-64 years accounted for over 60% of reported hospitalized cases. Among all hospitalizations, 6,328 (95.1%) were associated with influenza A, 253 (3.8%) with influenza B, 21 (0.3%) with influenza A and B co-infection, and 53 (0.8%) had no virus type information. Among those with influenza A subtype information, 39 (1.4%) were H3 and 2,766 (98.6%) were 2009 H1N1.
Clinical findings are preliminary and based on a subset number of cases (~30%) with complete medical chart abstraction. The most commonly reported underlying medical conditions among adults were obesity, metabolic disorders, cardiovascular disease, and chronic lung disease (excluding asthma). The most commonly reported underlying medical conditions in children were asthma, neurologic disorders, obesity, and chronic lung disease (excluding asthma). Approximately 43% of hospitalized children had no identified underlying medical conditions. Among 301 hospitalized women of childbearing age (15-44 years), 65 (21.6%) were pregnant.
Additional FluSurv-NET data can be found at:http://gis.cdc.gov/GRASP/Fluview/FluHospRates.html and http://gis.cdc.gov/grasp/fluview/FluHospChars.html.

<center>
View Interactive Application | View Full Screen | View PowerPoint Presentation


</center> Outpatient Illness Surveillance

Nationwide during week 6, 3.0% of patient visits reported through the U.S. Outpatient Influenza-like Illness Surveillance Network (ILINet) were due to influenza-like illness (ILI). This percentage is above the national baseline of 2.0%. (ILI is defined as fever (temperature of 100?F [37.8?C] or greater) and cough and/or sore throat.)

<center> </center>
On a regional level, the percentage of outpatient visits for ILI ranged from 1.6% to 4.5% during week 6. All 10 regions reported a proportion of outpatient visits for ILI above their region-specific baseline level.
Region specific data is available at http://gis.cdc.gov/grasp/fluview/fluportaldashboard.html.

ILINet Activity Indicator Map

Data collected in ILINet are used to produce a measure of ILI activity* by state. Activity levels are based on the percent of outpatient visits in a state due to ILI and are compared to the average percent of ILI visits that occur during weeks with little or no influenza virus circulation. Activity levels range from minimal, which would correspond to ILI activity from outpatient clinics being below, or only slightly above, the average, to high, which would correspond to ILI activity from outpatient clinics being much higher than average.
During week 6, the following ILI activity levels were experienced:

  • Six states experienced high ILI activity (Arkansas, Connecticut, Kansas, New York, Oklahoma, and Texas).
  • Seven states experienced moderate ILI activity (Alabama, Delaware, Hawaii, Louisiana, Maryland, New Jersey, and Virginia).
  • Nineteen states and New York City experienced low ILI activity (Arizona, California, Colorado, Florida, Kentucky, Massachusetts, Minnesota, Mississippi, Missouri, Nebraska, New Mexico, Nevada, North Carolina, Pennsylvania, Rhode Island, South Dakota, Utah, Washington, and Wisconsin).
  • Eighteen states experienced minimal ILI activity (Alaska, Georgia, Idaho, Illinois, Indiana, Iowa, Maine, Michigan, Montana, New Hampshire, North Dakota, Ohio, Oregon, South Carolina, Tennessee, Vermont, West Virginia, and Wyoming).
  • Data were insufficient to calculate an ILI activity level from the District of Columbia.
Click on map to launch interactive tool

*This map uses the proportion of outpatient visits to health care providers for influenza-like illness to measure the ILI activity level within a state. It does not, however, measure the extent of geographic spread of flu within a state. Therefore, outbreaks occurring in a single city could cause the state to display high activity levels.
Data collected in ILINet may disproportionately represent certain populations within a state, and therefore, may not accurately depict the full picture of influenza activity for the whole state.
Data displayed in this map are based on data collected in ILINet, whereas the State and Territorial flu activity map is based on reports from state and territorial epidemiologists. The data presented in this map is preliminary and may change as more data is received.
Differences in the data presented here by CDC and independently by some state health departments likely represent differing levels of data completeness with data presented by the state likely being the more complete.

Geographic Spread of Influenza as Assessed by State and Territorial Epidemiologists

The influenza activity reported by state and territorial epidemiologists indicates geographic spread of influenza viruses, but does not measure the severity of influenza activity.
During week 6, the following influenza activity was reported:

  • Widespread influenza activity was reported by 24 states (Arizona, Arkansas, California, Connecticut, Delaware, Florida, Illinois, Indiana, Maine, Maryland, Massachusetts, Missouri, New Hampshire, New Jersey, New York, North Carolina, Ohio, Oklahoma, Pennsylvania, Rhode Island, South Carolina, Vermont, Virginia, and Utah).
  • Regional influenza activity was reported by 20 states (Alabama, Alaska, Colorado, Idaho, Iowa, Kansas, Kentucky, Louisiana, Montana, Michigan, Minnesota, Nebraska, Nevada, North Dakota, Oregon, South Dakota, Tennessee, Texas, Washington, and Wisconsin).
  • The District of Columbia, Guam, and five states (Georgia, Mississippi, New Mexico, West Virginia and Wyoming) reported local influenza activity.
  • Sporadic influenza activity was reported by Puerto Rico and one state (Hawaii).
  • The U.S. Virgin Islands reported no influenza activity.


Additional National and International Influenza Surveillance Information


FluView Interactive: FluView includes enhanced web-based interactive applications that can provide dynamic visuals of the influenza data collected and analyzed by CDC. These FluView Interactive applications allow people to create customized, visual interpretations of influenza data, as well as make comparisons across flu seasons, regions, age groups and a variety of other demographics. To access these tools visit http://www.cdc.gov/flu/weekly/fluviewinteractive.htm.
U.S. State and local influenza surveillance: Click on a jurisdiction below to access the latest local influenza information.
<table> <tbody><tr border="1"> <td height="8" width="139">Alabama
</td> <td height="8" width="139">Alaska
</td> <td height="8" width="139">Arizona
</td> <td height="8" width="139">Arkansas
</td> <td height="8" width="139">California
</td> </tr> <tr border="1"> <td height="8" width="139">Colorado
</td> <td height="8" width="139">Connecticut
</td> <td height="8" width="139">Delaware
</td> <td height="8" width="139">District of Columbia
</td> <td height="8" width="139">Florida
</td> </tr> <tr border="1"> <td height="8" width="139">Georgia
</td> <td height="8" width="139">Hawaii
</td> <td height="8" width="139">Idaho
</td> <td height="8" width="139">Illinois
</td> <td height="8" width="139">Indiana
</td> </tr> <tr border="1"> <td height="8" width="139">Iowa
</td> <td height="8" width="139">Kansas
</td> <td height="8" width="139">Kentucky
</td> <td height="8" width="139">Louisiana
</td> <td height="8" width="139">Maine
</td> </tr> <tr border="1"> <td height="8" width="139">Maryland
</td> <td height="8" width="139">Massachusetts
</td> <td height="8" width="139">Michigan
</td> <td height="8" width="139">Minnesota
</td> <td height="8" width="139">Mississippi
</td> </tr> <tr border="1"> <td height="8" width="139">Missouri
</td> <td height="8" width="139">Montana
</td> <td height="8" width="139">Nebraska
</td> <td height="8" width="139">Nevada
</td> <td height="8" width="139">New Hampshire
</td> </tr> <tr border="1"> <td height="8" width="139">New Jersey
</td> <td height="8" width="139">New Mexico
</td> <td height="8" width="139">New York
</td> <td height="8" width="139">North Carolina
</td> <td height="8" width="139">North Dakota
</td> </tr> <tr border="1"> <td height="8" width="139">Ohio
</td> <td height="8" width="139">Oklahoma
</td> <td height="8" width="139">Oregon
</td> <td height="8" width="139">Pennsylvania
</td> <td height="8" width="139">Rhode Island
</td> </tr> <tr border="1"> <td height="8" width="139">South Carolina
</td> <td height="8" width="139">South Dakota
</td> <td height="8" width="139">Tennessee
</td> <td height="8" width="139">Texas
</td> <td height="8" width="139">Utah
</td> </tr> <tr border="1"> <td height="8" width="139">Vermont
</td> <td height="8" width="139">Virginia
</td> <td height="8" width="139">Washington
</td> <td height="8" width="139">West Virginia
</td> <td height="8" width="139">Wisconsin
</td> </tr> <tr border="1"> <td height="8" width="139">Wyoming
</td> <td height="8" width="139">New York City
</td> <td height="8" width="139">Virgin Islands
</td> <td height="8" width="139">
</td> </tr> </tbody></table>

Google Flu Trends: Google Flu Trends uses aggregated Google search data in a model created in collaboration with CDC to estimate influenza activity in the United States. For more information and activity estimates from the U.S. and worldwide, see http://www.google.org/flutrends/
World Health Organization: Additional influenza surveillance information from participating WHO member nations is available through FluNet and the Global Epidemiology Reports.
WHO Collaborating Centers for Influenza located in Australia, China, Japan, and the United Kingdom.
Europe: for the most recent influenza surveillance information from Europe, please see WHO/Europe at http://www.euroflu.org/index.php and visit the European Centre for Disease Prevention and Control at http://ecdc.europa.eu/en/publications/surveillance_reports/influenza/Pages/weekly_influenza_surveillance_overview.aspx
Public Health Agency of Canada: The most up-to-date influenza information from Canada is available at http://www.phac-aspc.gc.ca/fluwatch/
Health Protection Agency (United Kingdom): The most up-to-date influenza information from the United Kingdom is available at http://www.hpa.org.uk/Topics/InfectiousDiseases/InfectionsAZ/SeasonalInfluenza/


http://www.cdc.gov/flu/weekly/
 
Re: USA: 2013-14 FluView: Influenza Season Weekly Summary, Wks 42-07: 2 New Pediatric Deaths, 52 Total

Re: USA: 2013-14 FluView: Influenza Season Weekly Summary, Wks 42-07: 2 New Pediatric Deaths, 52 Total

Wk 07, ending Feb 17

Influenza-Associated Pediatric Mortality
Two influenza-associated pediatric deaths were reported to CDC during week 7. One death was associated with a 2009 H1N1 virus and occurred during week 6 (week ending February 8, 2014) and one death was associated with an influenza A virus for which no subtyping was performed and occurred during week 5 (week ending February 1, 2014).

A total of 52 influenza-associated pediatric deaths have been reported during the 2013-2014 season from New York City [1] and 24 states (AR [3], AZ [1], CA [4]; FL [3], GA [1]; IA [1]; KS [1], KY [1]; LA [4]; MA [2]; MI [2], MS [1], NC [3]; NE [1], NV [1], OK [2]; OR [1], PA [1], TN [4]; TX [9]; UT [2]; VA [1]; WI [1]; and WV [1]).

Influenza-Associated Hospitalizations
Between October 1, 2013 and February 15, 2014, 7,073 laboratory-confirmed influenza-associated hospitalizations were reported. This is a rate of 26.1 per 100,000 population. The highest rate of hospitalization remains among adults aged ≥65 years, followed by the 50-64 years and 0-4 years age groups. People 18-64 years accounted for more than 60% of reported hospitalized cases. Among all hospitalizations, 6,710 (94.9%) were associated with influenza A, 284 (4.0%) with influenza B, 23 (0.3%) with influenza A and B co-infection, and 56 (0.8%) had no virus type information. Among those with influenza A subtype information, 45 (1.5%) were H3 and 2,903 (98.5%) were 2009 H1N1.

The most commonly reported underlying medical conditions among adults were obesity, metabolic disorders, cardiovascular disease, and chronic lung disease (excluding asthma). Approximately 15% of hospitalized adults had no identified underlying medical conditions. The most commonly reported underlying medical conditions in children were asthma, neurologic disorders, obesity, and chronic lung disease (excluding asthma). Approximately 44% of hospitalized children had no identified underlying medical conditions. Among 340 hospitalized women of childbearing age (15-44 years), 74 (21.8%) were pregnant.

Outpatient Illness Surveillance:
The proportion of outpatient visits for influenza-like illness (ILI) was 2.5%, above the national baseline of 2.0%. Nine of 10 regions reported ILI at or above region-specific baseline levels. Seven states experienced moderate ILI activity; 16 states and New York City experienced low ILI activity; 27 states experienced minimal ILI activity, and the District of Columbia had insufficient data.

U.S. Virologic Surveillance for Wk 7
No. of specimens tested: 6,887
No. of positive specimens (%): 958 (13.9%)
Positive specimens by type/subtype
Influenza A: 865 (90.3%)
2009 H1N1: 416 (48.1%)
H3: 23 (2.7%)
Subtyping not performed: 426 (49.2%)
Influenza B: 93 (9.7%)

Antigenic Characterization*
CDC has antigenically characterized 1,056 influenza viruses [920 2009 H1N1 viruses, 86 influenza A (H3N2) viruses, and 50 influenza B viruses] collected by U.S. laboratories since October 1, 2013 by hemagglutination inhibition (HI).

2009 H1N1 [920]:
? 919 (99.9%) of 920 2009 H1N1 viruses tested were characterized as A/California/7/2009-like, the influenza A (H1N1) component of the 2013-2014 Northern Hemisphere influenza vaccine. One (0.1%) virus showed reduced titers with antiserum produced against A/California/7/2009.

Influenza A (H3N2) [86]:
? All 86 influenza A (H3N2) viruses tested have been characterized as A/Texas/50/2012-like, the influenza A (H3N2) component of the 2013-2014 Northern Hemisphere influenza vaccine.

Influenza B [50]: 31 (62%) of the 50 influenza B viruses tested belong to B/Yamagata/16/88-lineage and the remaining 19 (38%) influenza B viruses tested belong to B/Victoria/02/87 lineage.
? Yamagata Lineage [31]: 31 influenza B/Yamagata-lineage viruses were characterized as B/ Massachusetts/2/2012-like, which is included as an influenza B component of the 2013-2014 Northern Hemisphere trivalent and quadrivalent influenza vaccines.
? Victoria Lineage [19]: 19 influenza B/Victoria-lineage viruses were characterized as B/Brisbane/60/2008-like, which is included as an influenza B component of the 2013-2014 Northern Hemisphere quadrivalent influenza vaccine.

Neuraminidase Inhibitor Resistance Testing Results on Samples Collected Since October 1, 2013
2009 H1N1: 3471 tested, 26 (0.7%) are resistant
All other samples tested found 0 resistant

http://www.cdc.gov/flu/weekly/
 
Re: USA: 2013-14 FluView: Influenza Season Weekly Summary, Wks 42-08: 9 New Pediatric Deaths, 61 Total

Re: USA: 2013-14 FluView: Influenza Season Weekly Summary, Wks 42-08: 9 New Pediatric Deaths, 61 Total

Wk 08, ending Feb 22

Influenza-Associated Pediatric Mortality
Nine influenza-associated pediatric deaths were reported to CDC during week 8. Five deaths were associated with a 2009 H1N1 virus and occurred during weeks 1, 3, 6, and 7 (weeks ending January 4, January 18, February 8, and February 15, 2014) and three deaths were associated with an influenza A virus for which no subtyping was performed and occurred during weeks 3 and 6 (weeks ending January 18 and February 8, 2014). One death was associated with an influenza B virus and occurred during week 8 (week ending February 22, 2014).

A total of 61 influenza-associated pediatric deaths have been reported during the 2013-2014 season from New York City [1] and 25 states (AR [3], AZ [1], CA [6]; FL [3], GA [1]; IA [1]; KS [2], KY [1]; LA [4]; MA [2]; MI [2], MS [1], NC [5]; NE [1], NV [1], OK [2]; OR [1], PA [1], SC [2], TN [4]; TX [10]; UT [2]; VA [1]; WI [1]; and WV [2]).

Influenza-Associated Hospitalizations
Between October 1, 2013 and February 22, 2014, 7,406 laboratory-confirmed influenza-associated hospitalizations were reported. This is a rate of 27.4 per 100,000 population. The highest rate of hospitalization remains among adults aged ≥65 years, followed by the 50-64 years and 0-4 years age groups. People 18-64 years accounted for more than 60% of reported hospitalized cases. Among all hospitalizations, 7,009 (94.6%) were associated with influenza A, 318 (4.3%) with influenza B, 26 (0.4%) with influenza A and B co-infection, and 53 (0.7%) had no virus type information. Among those with influenza A subtype information, 58 (1.9%) were H3 and 3,050 (98.1%) were 2009 H1N1.

Clinical findings are preliminary and based on a subset of cases (~36%) with complete medical chart abstraction. The most commonly reported underlying medical conditions among adults were obesity, metabolic disorders, cardiovascular disease, and chronic lung disease (excluding asthma). Approximately 14% of hospitalized adults had no identified underlying medical conditions. The most commonly reported underlying medical conditions in children were asthma, neurologic disorders, obesity, and chronic lung disease (excluding asthma). Approximately 44% of hospitalized children had no identified underlying medical conditions. Among 374 hospitalized women of childbearing age (15-44 years), 79 (21.1%) were pregnant.

Outpatient Illness Surveillance
The proportion of outpatient visits for influenza-like illness (ILI) was 2.3%, above the national baseline of 2.0%. Eight of 10 regions reported ILI above region-specific baseline levels. Two states experienced high ILI activity; two states experienced moderate ILI activity; 10 states experienced low ILI activity; 36 states and New York City experienced minimal ILI activity, and the District of Columbia had insufficient data.

U.S. Virologic Surveillance for Wk 8
No. of specimens tested: 6,813
No. of positive specimens (%): 738 (10.8%)
Positive specimens by type/subtype
Influenza A: 612 (82.9%)
2009 H1N1: 337 (55.1%)
H3: 25 (4.1%)
Subtyping not performed: 250 (40.8%)
Influenza B: 126 (17.1%)

Antigenic Characterization
CDC has antigenically characterized 1,281 influenza viruses [1,113 2009 H1N1 viruses, 118 influenza A (H3N2) viruses, and 50 influenza B viruses] collected by U.S. laboratories since October 1, 2013 by hemagglutination inhibition (HI).

2009 H1N1 [1,113]:
1,112 (99.9%) of 1,113 2009 H1N1 viruses tested were characterized as A/California/7/2009-like, the influenza A (H1N1) component of the 2013-2014 Northern Hemisphere influenza vaccine. One (0.1%) virus showed reduced titers with antiserum produced against A/California/7/2009.

Influenza A (H3N2) [118]:
All 118 influenza A (H3N2) viruses tested have been characterized as A/Texas/50/2012-like, the influenza A (H3N2) component of the 2013-2014 Northern Hemisphere influenza vaccine.

Influenza B [50]: 31 (62%) of the 50 influenza B viruses tested belong to B/Yamagata/16/88-lineage and the remaining 19 (38%) influenza B viruses tested belong to B/Victoria/02/87 lineage.
Yamagata Lineage [31]: 31 influenza B/Yamagata-lineage viruses were characterized as B/ Massachusetts/2/2012-like, which is included as an influenza B component of the 2013-2014 Northern Hemisphere trivalent and quadrivalent influenza vaccines.
Victoria Lineage [19]: 19 influenza B/Victoria-lineage viruses were characterized as B/Brisbane/60/2008-like, which is included as an influenza B component of the 2013-2014 Northern Hemisphere quadrivalent influenza vaccine.

Neuraminidase Inhibitor Resistance Testing Results on Samples Collected Since October 1, 2013
2009 H1N1: 3733 tested, 28 (0.8%) are resistant
All other samples tested found 0 resistant

http://www.cdc.gov/flu/weekly/
 
Re: USA: 2013-14 FluView: Influenza Season Weekly Summary, Wks 42-09: 4 New Pediatric Deaths, 65 Total

Re: USA: 2013-14 FluView: Influenza Season Weekly Summary, Wks 42-09: 4 New Pediatric Deaths, 65 Total

Wk 09, ending Mar 1

Influenza-Associated Pediatric Mortality
Four influenza-associated pediatric deaths were reported to CDC during week 9: IL (1), LA (1), TX (1), AR (1)

Two deaths were associated with an influenza A virus for which no subtyping was performed and occurred during weeks 3 and 9 (weeks ending January 18 and March 1, 2014). One death was associated with an influenza B virus and occurred during week 8 (week ending February 22, 2014) and one death was associated with an influenza A and B virus co-infection and occurred during week 8 (week ending February 22, 2014).

A total of 65 influenza-associated pediatric deaths have been reported during the 2013-2014 season from Chicago [1], New York City [1] and 25 states (AR [4], AZ [1], CA [6]; FL [3], GA [1]; IA [1]; KS [2], KY [1]; LA [5]; MA [2]; MI [2], MS [1], NC [5]; NE [1], NV [1], OK [2]; OR [1], PA [1], SC [2], TN [4]; TX [11]; UT [2]; VA [1]; WI [1]; and WV [2]).

Influenza-Associated Hospitalizations
Between October 1, 2013 and March 1, 2014, 7,725 laboratory-confirmed influenza-associated hospitalizations were reported. This is a rate of 28.5 per 100,000 population. The highest rate of hospitalization remains among adults aged ≥65 years, followed by the 50-64 years and 0-4 years age groups. People 18-64 years accounted for more than 60% of reported hospitalized cases. Among all hospitalizations, 7,298 (94.5%) were associated with influenza A, 355 (4.6%) with influenza B, 27 (0.3%) with influenza A and B co-infection, and 45 (0.6%) had no virus type information. Among those with influenza A subtype information, 68 (2.0%) were H3 and 3,272 (98.0%) were 2009 H1N1.

Clinical findings are preliminary and based on approximately 41% of cases with complete medical chart abstraction. The most commonly reported underlying medical conditions among adults were obesity, metabolic disorders, cardiovascular disease, and chronic lung disease (excluding asthma). Approximately 13% of hospitalized adults had no identified underlying medical conditions. The most commonly reported underlying medical conditions in children were asthma, neurologic disorders, obesity, and chronic lung disease (excluding asthma). Approximately 43% of hospitalized children had no identified underlying medical conditions. Among 446 hospitalized women of childbearing age (15-44 years), 96 (21.5%) were pregnant.

Outpatient Illness Surveillance:
The proportion of outpatient visits for influenza-like illness (ILI) was 2.0%, which is at the national baseline. Five of 10 regions reported ILI at or above region-specific baseline levels. One state experienced high ILI activity; one state experienced moderate ILI activity; six states experienced low ILI activity; 42 states and New York City experienced minimal ILI activity, and the District of Columbia had insufficient data

U.S. Virologic Surveillance for Wk 9
No. of specimens tested: 6,748
No. of positive specimens (%): 587 (8.7%)
Positive specimens by type/subtype
Influenza A: 470 (80.1%)
2009 H1N1: 204 (43.4%)
H3: 49 (10.4%)
Subtyping not performed: 217 (46.2%)
Influenza B: 117 (19.9%)

Neuraminidase Inhibitor Resistance Testing Results on Samples Collected Since October 1, 2013
2009 H1N1: 4002 tested, 34 (0.8%) are resistant
All other samples tested found 0 resistant

Antigenic Characterization*
CDC has antigenically characterized 1,541 influenza viruses [1,321 2009 H1N1 viruses, 170 influenza A (H3N2) viruses, and 50 influenza B viruses] collected by U.S. laboratories since October 1, 2013 by hemagglutination inhibition (HI).

2009 H1N1 [1,321]:
* 1,320 (99.9%) of 1,321 2009 H1N1 viruses tested were characterized as A/California/7/2009-like, the influenza A (H1N1) component of the 2013-2014 Northern Hemisphere influenza vaccine. One (0.1%) virus showed reduced titers with antiserum produced against A/California/7/2009.

Influenza A (H3N2) [170]:
* All 170 influenza A (H3N2) viruses tested have been characterized as A/Texas/50/2012-like, the influenza A (H3N2) component of the 2013-2014 Northern Hemisphere influenza vaccine.

Influenza B [50]: 31 (62%) of the 50 influenza B viruses tested belong to B/Yamagata/16/88-lineage and the remaining 19 (38%) influenza B viruses tested belong to B/Victoria/02/87 lineage.
* Yamagata Lineage [31]: 31 influenza B/Yamagata-lineage viruses were characterized as B/ Massachusetts/2/2012-like, which is included as an influenza B component of the 2013-2014 Northern Hemisphere trivalent and quadrivalent influenza vaccines.
* Victoria Lineage [19]: 19 influenza B/Victoria-lineage viruses were characterized as B/Brisbane/60/2008-like, which is included as an influenza B component of the 2013-2014 Northern Hemisphere quadrivalent influenza vaccine.

http://www.cdc.gov/flu/weekly/
 
Back
Top