• FluTrackers.com Inc. does not provide medical advice. Information on this web site is collected from various internet resources, and the FluTrackers board of directors makes no warranty to the safety, efficacy, correctness or completeness of the information posted on this site by any author or poster. The information collated here is for instructional and/or discussion purposes only and is NOT intended to diagnose or treat any disease, illness, or other medical condition. Every individual reader or poster should seek advice from their personal physician/healthcare practitioner before considering or using any interventions that are discussed on this website. By continuing to access this website you agree to consult your personal physican before using any interventions posted on this website, and you agree to hold harmless FluTrackers.com Inc., the board of directors, the members, and all authors and posters for any effects from use of any medication, supplement, vitamin or other substance, device, intervention, etc. mentioned in posts on this website, or other internet venues referenced in posts on this website.
  • We are not asking for any donations. Do not donate to any entity who says they are raising funds for us.

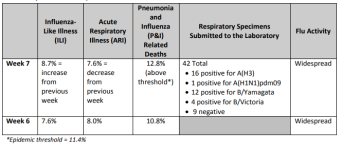
US State by state flu reports 2017-18 season; 15,534 confirmed fatalities; 80,000 estimated deaths

Note: Individual threads exist for each state that are updated several times a day by FluTrackers Newshounds (hattip Jim Oliveros, Pathfinder & Shiloh). For up to date information see this forum https://flutrackers.com/forum/forum/...ndemic-2009-aj and click on any state for more information. The media reported fatality figures included here are for direct cause deaths only and do not include the total of pneumonia and influenza deaths which is many times higher.

Updates marked with a *

*Alabama
Influenza in Alabama

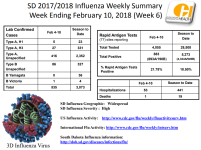
Influenza activity levels continue to remain significant across the state. During Week 06 (February 4-10, 2018), the geographic spread in Alabama was observed to be ?widespread?. Widespread indicates lab-confirmed case(s) along with elevated influenza-like illness (ILI) or reported ILI outbreaks in five or more of the eight Public Health Districts (PHD). Several positive flu specimens in the Northern, Northeastern, West Central, East Central, Southwestern, and Southeastern Districts of the state were identified during this week. Influenza A (H3), Influenza A (2009 H1N1), Influenza B/Yamagata, and Influenza B/Victoria were identified in specimens submitted to the State Laboratory. Potential variant flu viruses are monitored through surveillance.

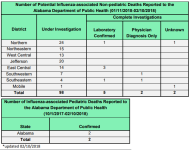
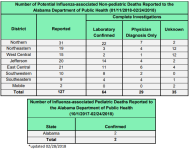
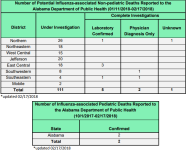
Since October 1, 2017, there have been two confirmed influenza-associated pediatric deaths. As of January 11, 2018, 98 persons are being investigated for influenza-associated deaths, 5 have received laboratory confirmation, 2 have received a physician diagnosis, and 2 are unknown. Medical records have been requested to confirm the remaining diagnoses.

It is not too late to get vaccinated! For those who have not received their annual influenza shot, the quadrivalent vaccine, which protects against four (quad) strains, is the only vaccine available that provides protection against Influenza B (Yamagata).

To review the geographic spread of ILI in Alabama, please visit the Influenza Surveillance Map (this map works best with recent supported versions of Google Chrome, Internet Explorer 11, Mozilla Firefox, Safari, Opera, and many mobile devices).
A graph displaying ILI data and positive influenza specimens submitted to the Bureau of Clinical Laboratories (BCL) is also available.
Alabama.png

http://www.alabamapublichealth.gov/Influenza/


*District of Columbia
https://doh.dc.gov/page/influenza-surveillance-reports

Week 6 (February 4th, 2018 ? February 10th, 2018)
(All data are preliminary and may change as more reports are received)
SUMMARY
 332 new cases of influenza were reported by hospitals during this reporting period
 Zero pediatric deaths were reported during this period
 For the 2017-2018 influenza season to-date, 1823 positive Influenza cases have been reported
 DC PHL did not report any specimens tested for week 6
 Flu activity increased since last week, and remains elevated
https://doh.dc.gov/sites/default/fi...chments/Influenza Weekly Summary MMWR_6_0.pdf

*Puerto Rico
http://www.salud.gov.pr/Estadisticas...Influenza.aspx
Influenza Semana 6* // Temporada 2016 ? 2017 // Temporada 2017 ? 2018**
Casos totales reportados (incluye hospitalizaciones) 2,197 // 53,708 // 16,875
Regiones de salud con tasas m?s altas Ponce // Ponce // Ponce
Fatalidades 0 // 14 // 4
Hospitalizaciones 76 // 1,919 // 656
http://www.salud.gov.pr/Estadistica...Influenza/Informe Influenza Semana 6 2018.pdf

*Alaska
http://dhss.alaska.gov/dph/epi/id/pa...influenza.aspx
Updated to Feb 7
Influenza A dominating, % Influenza B increasing, Activity steady.
Month // cases
September // 0
October // 228
November // 378
December // 836
Jan // 854
Feb // 488

2 fatalities have been reported in the media.

*Arizona
http://www.azdhs.gov/preparedness/ep...veillance-home
ARIZONA ? INFLUENZA SUMMARY
Week 6 (2/04/2018 ? 2/10/2018)

Synopsis:
Influenza activity is elevated. Arizona reported Widespread Activity for week 6. Subscribe to the Flu & RSV report at
azhealth.gov/email.

Influenza activity highlights:

 The numbers in this report are based on processed cases. There are a large number of
reports that are still being processed.
 968 laboratory-confirmed cases of influenza were reported in the past week, from 15
counties. 22,917 cases have been reported this season, with laboratory-confirmed cases
identified in 15 counties.
 19,807 (86%) reports this season are influenza A, 2,846 (12%) are influenza B, and 264 (2%)
are of unknown type.
 New data from the death certificate database were not available. To date, 461 pneumonia and
influenza deaths were identified this season.
 Two influenza-associated pediatric deaths have been reported for the 2017?2018 season
in Maricopa County residents. One case was PCR positive for influenza A (H3), and one for
influenza B/Victoria.
http://www.azdhs.gov/documents/prep...illance/2017-2018/influenza-2017-18-week6.pdf
There have been 11 fatalities reported in the media.

*Arkansas
http://www.healthy.arkansas.gov/prog...fluenza#Weekly
Week Ending Saturday 02/10/2018

 For Week 6, Arkansas reported ?Widespread? activity to the Centers for Disease Control and Prevention
(CDC) for geographic spread of influenza, and ?High? or 10/10 for ILI intensity.
 Since October 1, 2017, over 43,000 positive influenza tests have been reported to the ADH online database
by health care providers. Thus far in Week 6, 72 counties reported influenza cases. The majority of reports
came from Benton, Pulaski, Faulkner, White, Lonoke, Jefferson, Washington, Independence, Craighead,
Sebastian, Saline, Randolph, Franklin, and Garland.
 Among total flu antigen tests that can distinguish between influenza A and B virus types, 66 percent were
influenza A, and 34 percent were influenza B. Reported influenza B exceeded A in this week.
 There are 330 positive PCR flu tests this week from private labs: 116 influenza A, and 211 influenza B; 2
positive influenza A subtype H3N2, and 1 undetermined. At the ADH lab, there were 3 positive influenza A
subtype H3N2, and 6 influenza B subtype Yamagata; 4 samples tested negative this week.
 About 8.8 percent of patients visiting emergency rooms this week, as of Friday, were there for ILI. About
11.5 percent of outpatient visits were for ILI.
 The average school absenteeism rate last week was 8.7 percent among public schools.
To date, 140 influenza-related deaths have been reported in Arkansas this flu season, 137 among adult
persons and 3 pediatric deaths.
CDC has reported a total of 63 pediatric deaths nationwide this season.
 Since October 1, 2017, 52 facilities including 41 nursing homes have reported influenza outbreaks.
 The proportion of deaths reported to the National Center for Health Statistics attributed to pneumonia and
influenza (P&I) was above the system-specific epidemic threshold.
 For Week 5, the geographic spread of influenza was reported as widespread in Puerto Rico and 48 states,
Hawaii and Oregon reported regional activity, the District of Columbia and Guam reported local activity,
the U.S. Virgin Islands reported sporadic activities.
 You can report flu year-round and view the weekly influenza report during the influenza season at:
http://www.healthy.arkansas.gov/programs-services/topics/influenza.
You can also access the reporting website directly at: https://FluReport.ADH.Arkansas.gov
http://www.healthy.arkansas.gov/ima...ort_Week_Ending_Saturday_February_10_2018.pdf

*California
https://www.cdph.ca.gov/Programs/CID...Influenza.aspx

Highlights (Week 6: February 4, 2018 ? February 10, 2018)
Statewide Activity Widespread

 Deaths: 22 (Age 0-64)
 Outbreaks: 29
 Laboratory: 19.8% positive
 Outpatient ILI: Above expected levels
 Hospitalizations: Above expected levels
Click on images and links for more information
Key messages:
? Influenza activity is decreasing but remains
elevated throughout California.
? Several more weeks of flu activity are expected.
? Influenza B viruses are now more common than
influenza A viruses in California.
? This season?s preliminary flu vaccine efficacy
estimates are 42% for influenza B, 25% for A
(H3N2), and 67% for A (H1N1).
? Based on these estimates, flu vaccination will
still prevent a substantial amount of illness.

Twenty-two laboratory-confirmed influenza-associated fatalities were reported to CDPH
during Week 6 (Figure 6). To date, CDPH has received 185 reports of laboratoryconfirmed
influenza-associated deaths among patients <65 years of age during the
2017?2018 influenza season.

https://www.cdph.ca.gov/Programs/CI...ry/Immunization/Week2017-1806_FINALReport.pdf

*- San Diego
http://www.sandiegocounty.gov/conten...uenzaWatch.pdf
Current Week 6 (ending 2/10/2018)
? 941 new influenza detections reported: Elevated level
? 5% influenza-like-illness (ILI) among emergency department visits: Expected level
? 20 new influenza-related deaths reported this week (tot 251)
? 7 new ICU cases reported this week
? 11% of deaths registered with pneumonia and/or influenza: Elevated level

557 fatal cases from California have been reported in the media as follows;
Contra Costa: 7
Fresno: 1
Kern: 1
Long Beach: 1
LA: 158
Marin: 1
Monterey: 6
Orange: 11
Placer: 1
Riverside: 20
Sacramento: 3
San Benito: 2
San Bernadino: 3
San Diego: 251
San Joaquin: 3
San Luis Obispo: 15
San Mateo: 4
Santa Barbara: 9
Santa Clara: 5
Santa Cruz: 3
Shasta: 1
Stanislaus: 6
Solano: 3
Sonoma: 2
Tulare: 4
Ventura: 34
Yolo: 2


*Colorado
https://www.colorado.gov/pacific/cdphe/influenza-data
Synopsis for the Week Ending February 10th:

During the week ending Feb. 10, 2018, there were 145 additional hospitalized influenza cases reported. The total number of hospitalizations since the beginning of the 2017-18 season is now 3,306.
Influenza-like illness reported by Kaiser Permanente (which includes providers from the North Central, Northeast, Northwest, South and South Central regions of the state) decreased from 3.57% to 3.48%. Influenza-like illness reported by Primary Care Partners (Northwest region) decreased from 4.22% to 1.37%.
Sentinel hospital labs (24 of 24 reporting) tested 3,835 specimens and 650 (16.9%) were positive for influenza.
There have been a total of 150 outbreaks associated with influenza for the 2017-18 influenza season. This is the highest number of influenza-associated outbreaks recorded in Colorado.
Mortality due to pneumonia and influenza is above the epidemic threshold and decreased from 8.2% to 7.9%. This is below national level of 10.1%.
One novel influenza A variant (H1N2v) was detected. An individual hospitalized with influenza in the San Luis Valley was found to be infected with a novel influenza A virus, H1N2v. This individual had exposure to swine at an agricultural event in the week preceding illness onset.
One pediatric death associated with influenza was reported for the 2017-18 influenza season. This was associated with influenza A (not subtyped) and had an onset of the week ending December 30, 2017.
https://docs.google.com/document/d/e...MJwzs8u8p9/pub
2 fatal cases have been reported in the media.

*Connecticut
http://portal.ct.gov/DPH/Infectious-...and-Statistics

2017-2018 Influenza Season, Update for Week 6*
(Week ending Saturday, 02/10/2018)
Key Points
 National influenza activity continues to increase and remains widespread within most of the continental United States. The US Centers for Disease Control and Prevention (CDC) recently reported an additional increase in the percentage (7.7%) of people seeing their health care provider with influenza-like-illness (ILI), the same percentage observed during the peak week of the 2009 H1N1 pandemic.
 In Connecticut, influenza activity remains high and widespread with a continuing high percentage of patients presenting to hospital emergency departments, an increasing percentage of patients presenting to outpatient providers with ILI, and increasing numbers of flu-associated hospitalizations and deaths.
 Classification of Connecticut geographic activity remains at widespread**.
 Influenza A (H3N2) viruses continue to predominate within the US and Connecticut although influenza A (H1N1) and influenza B viruses are also being reported.
 There is still time to obtain your flu vaccine and take other important steps to prevent influenza-related illness and hospitalization:
http://www.portal.ct.gov/DPH/Infectious-Diseases/Immunization/Seasonal-Influenza

A total of 1,638 hospitalized patients with laboratory-confirmed influenza admitted between August 27 and February 10, 2018 have been reported to date. Of these 1,638 reports, 1,064 were Type A (subtype unspecified), 294 were Type A (H3N2), 9 were Type A (2009 H1N1), 268 were influenza B virus, and 3 of unknown type. A total of 77 influenza-associated deaths (61 associated with flu A, 16 with flu B). Of these deaths, 62 were among patients greater than 65 years of age, 9 were 50-64 years of age, 4 were 25-49 years of
age, 1 was between 19-24 years of age, and 1 was between 5-18 years of age. The current season total of 77 deaths is above the range of influenza-associated deaths (1-65) reported during the previous five seasons

http://portal.ct.gov/-/media/Depart...eases/flu/stats/flusummary_1718_wk6.pdf?la=en


*Delaware
http://dhss.delaware.gov/dhss/dph/ep...uenzawkly.html
Delaware Influenza Surveillance 2017-2018:
During MMWR Week 5, there were 995 laboratory-confirmed cases of influenza reported among Delaware residents, bringing
the total to 2,966 confirmed cases for the 2017-2018 season. Reports of influenza-like illness (ILI) received from participating
providers, facilities and institutions in Delaware show ILI is 3.5% compared with Delaware?s 2017-2018 baseline of 2.0%.
Nationally, ILI is 7.7% compared with the 2017-2018 national baseline of 2.2%.
http://dhss.delaware.gov/dhss/dph/epi/files/flu2018wk05.pdf

11 fatalities have been reported in the media

*Florida
http://www.floridahealth.gov/disease...nza/index.html
Week 6: February 4-10, 2018

State influenza and influenza-like illness (ILI) activity:
? In week 6, despite small declines, influenza activity remained higher than peak levels
observed in past flu seasons.
? People at high-risk for complications from influenza infection, such as children, adults aged 65
years and older and pregnant women continued to be most impacted.
? One new influenza-associated pediatric deaths was confirmed. Six influenza-associated
pediatric deaths have been confirmed so far in the 2017-18 influenza season.

? Overall, deaths due to pneumonia and influenza were higher than expected. Given the
increase in emergency department visits for flu, excess deaths due to pneumonia and
influenza are also expected to increase over the coming weeks. Most deaths occurred in
people aged 65 years and older. The majority of deaths in people aged 64 years and younger
occurred in people with underlying health conditions (64%).
? Seventy-one outbreaks of influenza and ILI were reported: 35 with confirmation of influenza
and 36 ILI. As of week 6 (ending February 10, 2018), 388 outbreaks of influenza and ILI have
been reported since the start of the 2017-18 season.
? The Florida Department of Health is conducting enhanced surveillance of intensive-care unit
(ICU) patients aged <65 with laboratory-confirmed influenza. From February 1-10, 2018, 138
such cases were reported. The majority of these cases occurred in unvaccinated people with
underlying health conditions.
http://www.floridahealth.gov/diseas...nza/_documents/2017-18/2018-w6-flu-review.pdf
12 fatalities have been reported in the media.

*Georgia
https://dph.georgia.gov/flu-activity-georgia
Week 06 (February 4 ? February 10, 2018) Synopsis

During week 06 there was HIGH influenza-like illness intensity with
WIDESPREAD occurrences throughout Georgia.
 Outpatient Illness Surveillance (ILINet): The proportion of outpatient
visits for ILI was 15.2%, which is above the regional baseline of 1.9%.
 Geographic Spread of Influenza: The geographic spread of influenza in
Georgia was WIDESPREAD during week 06.
 Metro Area Hospitalizations: There were 165 hospitalizations due to influenza
infection during week 06. There have been 1,801 hospitalizations due
to influenza so far this season.
Influenza Related Deaths: As of week 06, there have been 79 confirmed
influenza-associated deaths (3 pediatric) for the 2017-2018 season.

 Viral Surveillance: Of the 2,240 specimens tested by Georgia clinical laboratories
reporting to the National Respiratory and Enteric Virus Surveillance
System (NREVSS) during week 06, 787 (35.1%) were positive for influenza.
Public Health Laboratories tested 50 specimens during week 06, 14 specimens
were positive for influenza.
 Reported Influenza Outbreaks: There have been 131 influenza outbreaks
reported to DPH so far this season.
 RSV Viral Surveillance: Of the 585 specimens tested and reported by the
Georgia Public Health Laboratory (GPHL) and the National Respiratory and
Enteric Virus Surveillance System (NREVSS) collaborating laboratories during
week 06, the percent positive of ALL laboratory tests was 7.35%
https://dph.georgia.gov/sites/dph.g...d_files/document/Weekly Flu Report 201806.pdf

Hawaii
http://health.hawaii.gov/docd/diseas...influenza-flu/
WEEK 4: JANUARY 21, 2018?JANUARY 27, 2018
For week 4 of the current influenza season:
 7.6% (season to date: 4.2%) of the outpatient visits recorded by Hawaii sentinel providers were for ILI.
 ILI visits were higher than the historical baseline in Hawaii2,3
(i.e., outside the 95% confidence interval).
 Hawaii?s ILI outpatient visits were higher than the national baseline (2.2%)4
(i.e., outside the 95% confidence
interval) and comparable to the national ILI rate (7.1%) (i.e., inside the 95% confidence interval).
 Geographic Spread: Local Activity5
 ILI Cluster Activity: Two clusters were reported to HDOH during week 4. These clusters occurred at a long
term care facility and a school on Oahu. These clusters included cases of influenza B.

 The following reflects laboratory findings for week 4 of the 2017?18 influenza season:
o A total of 2,107 specimens have been tested statewide for influenza viruses (positive: 629 [29.9%]).
(Season to date: 27,199 tested [30.2% positive])
 1,260 (59.8%) were screened only by rapid antigen tests with no confirmatory testing
 847 (40.2%) underwent confirmatory testing (either RT-PCR or viral culture)
 1,478 (70.1%) were negative

For week 4 of the current influenza season:
 13.3% of all deaths that occurred in Honolulu during week 4 were related to pneumonia or influenza. For the
current season (season to date: 14.1%), there have been 1,436 deaths from any cause, 203 of which were due
to P&I.
 The P&I rate was comparable to the historical baseline in Hawaii8
(i.e., inside the 95% confidence interval).
 National P&I data are backlogged by two weeks and current data for weeks 3?4 are unavailable at this time.
Based on NCHS mortality surveillance data available for week 29
(week ending January 13, 2018), 9.7% of
deaths that occurred nationally were due to P&I. This percentage is above the national epidemic threshold of
7.2% for week 2
https://health.hawaii.gov/docd/files...rveillance.pdf

1 fatality reported in the media.

*Idaho
http://healthandwelfare.idaho.gov/He...5/Default.aspx
Week #2018-06: February 4-10, 2018
Current Week Idaho Quick Stats
Percent of Outpatient Visits for Influenza-like Illness (ILI)
Region 10: AK, ID, OR, WA 2.27%
(Region 10 Baseline 1.4%)
Percent Emergency Department Visits for ILI Syndrome 8.7% (Baseline 2.4%)
Virologic Surveillance Influenza A(H3) is predominating
Influenza-related deaths (season total) 8 new deaths (season total 66)
http://healthandwelfare.idaho.gov/P...fluenza Surveillance weekly update_2018 6.pdf

*Illinois
http://dph.illinois.gov/topics-servi...a/surveillance
Current Week Quick Stats
Illinois Influenza Geographic Spread Widespread
Percent of Outpatient Visits for ILI 5.56% (baseline 1.8%)
Percent/Number of Influenza Positive Tests Current Week: 29.4% (443/1505);
Season: 21.7% (4403/20328)
Influenza-Associated ICU Admissions3Current Week: 93; Season: 1526
Influenza Outbreaks Current Week: 10; Season: 350
Influenza-Associated Pediatric Deaths (Season Total) 4
http://dph.illinois.gov/sites/defau...-2017-2018-Influenza-Report-Week-6-021518.pdf
24 deaths have been reported in the media.

*Indiana
http://www.in.gov/isdh/22104.htm
Influenza-like Illness - Week Ending February 10, 2018
ILI Geographic Distribution Widespread
ILI Activity Code High
Percent of ILI reported by sentinel outpatient providers 8.57%
Percent of ILI reported by emergency department chief
complaints 6.82%
Percent positivity of influenza specimens tested at ISDH 66%
Number of influenza-associated deaths this season 195
Number of long-term care facility outbreaks this season 95
Number of school-wide outbreaks this season 4
http://www.in.gov/isdh/files/Weekly Influenza Report-Week 6-2017-2018_v2.pdf

*Iowa
https://idph.iowa.gov/influenza/reports
For the week ending February 10, 2018 - Week 6

Quick Stats
Percent of influenza rapid test positive 28% (1490/5249)
Percent of RSV rapid tests positive 32% (261/815)
Influenza-associated hospitalizations 125/6721 inpatients
Percent of outpatient visits for ILI 5.12% (baseline 1.9%)
Percent school absence due to illness 4.53%
Number of long-term care influenza outbreaks 2
Number of schools with ≥10% absence due to illness 63
Influenza-associated mortality -all ages (Cumulative) 126
Influenza-associated pediatric mortality (Cumulative) 0
https://idph.iowa.gov/Portals/1/use...Reports/IA Influenza Report - Week 6 2018.pdf

*Kansas
http://www.kdheks.gov/flu/surveillance.htm
KS.png


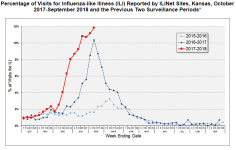
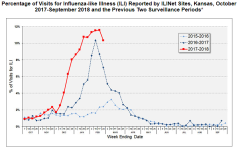
Chart based report at link. 70 direct cause deaths reported.

*Kentucky
https://healthalerts.ky.gov/Pages/FluActivity.aspx
February 4, 2018 ? February 10, 2018

Current Influenza Activity Level: Widespread for Ninth Consecutive Week

Update for week 6:
Lab Confirmed Influenza: 1,023 Cases
Number of Regions with Long Term Care Facility Outbreaks:
6 of 17 Regions
Number of Regions with
Confirmed Flu Cases: 17 of 17 Regions
Deaths Reported: 0 (under 18 years) 31 (18 years & older)
Number of Regions with Increased ILI Activity: 11 of 17 Regions
Number of Regions with Increased Influenza Activity: 14 of 17 Regions

Update Total for weeks 36-6:
Lab Confirmed Total: 6,287 Cases
Total Number of Long Term Care Facility Outbreaks: 10 Outbreaks
Total Number of Regions with Confirmed Flu Cases: 17 of 17 Regions
Total Deaths Reported: 4 (under 18 years) 128 (18 years & older)
https://healthalerts.ky.gov/Documents/Kentucky Influenza Activity Report - 2017-2018 Week 6.pdf

Louisiana
http://new.dhh.louisiana.gov/index.cfm/page/1591
Week 6: 2/4/2018-2/10/2018
Influenza activity decreased slightly this week in Louisiana but remains very high.
Influenza A viruses represent 79% of positive samples tested at the State Laboratory
(65% A/H3N2, 35% A/H1N1). Positive tests reported from clinical laboratories remain
extremely high (~27%). The most commonly reported other respiratory viruses are
Rhino/Enterovirus.

http://new.dhh.louisiana.gov/assets...enzaSurveillance/Weekly2018/Influenza1806.pdf

*Maine
http://www.maine.gov/dhhs/mecdc/infe...-updates.shtml
For MMWR week 6 (ending 2/10/2018)
New This Week
? Federal Flu Code: Widespread
? 125 new hospitalizations
? 18 new outbreaks
Surveillance Information ? Maine, 2017-2018 Influenza Season
? Number of ILINet Providers reporting: 18
o % of visits for Influenza-Like Illness (ILI): 1.68
? Syndromic Surveillance
o % of Emergency Room visits for ILI: 5.6
o % of Emergency Medical Services (EMS) runs for ILI: 1.7
? Influenza Hospitalizations
o # of hospitalizations: 125
? Electronic Death Reporting System
o % of deaths due to P&I: 8.6

Influenza Deaths
? # deaths reported this week: 4
? Total influenza deaths 2017-18 season: 43
Pediatric Influenza Deaths
? No pediatric influenza-associated deaths reported during the 2017-18 influenza season
http://www.maine.gov/tools/whatsnew/attach.php?id=787374&an=2

*Maryland
http://phpa.dhmh.maryland.gov/influe...ages/Home.aspx
for the week ending February 10, 2018
During the week ending February 10, 2018, influenza-like illness (ILI) intensity in Maryland
was HIGH and there was WIDESPREAD geographic activity. The proportion of outpatient
visits for ILI reported by Sentinel Providers and by Maryland Emergency Departments
increased. The proportion of MRITS respondents reporting ILI increased. Clinical
laboratories reported an increase in the proportion of specimens testing positive for
influenza. Two hundred thirty-eight specimens tested positive for influenza at the MDH lab.
There were 308 influenza-associated hospitalizations. Nineteen respiratory outbreaks were
reported to MDH.
https://phpa.health.maryland.gov/in...ages/Home/Weekly Influenza Report_2018-06.pdf

4 fatalities have been reported in the media

*Massachusetts
http://blog.mass.gov/publichealth/category/flu-facts/
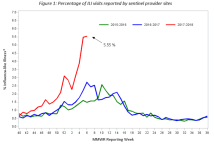
Week 6 Activity1 (representing geographic distribution): Widespread
Week 6 ILI Activity2 (representing intensity of ILI activity): 10 (High)
Mass.png

http://blog.mass.gov/publichealth/w...s/11/2018/02/Weekly-Flu-Report-02-16-2018.pdf

13 fatalities have been reported in the media

*Michigan
http://www.michigan.gov/mdhhs/0,5885...1722--,00.html
Week Ending February 10, 2018 │ WEEK 6
Activity: Widespread
One pediatric influenza death (A/H3) has been
confirmed by MDHHS to date for the 2017-2018 flu
season.
Nationally, eighty-four (84) influenzaassociated
pediatric deaths have been reported thus
far for the 2017-2018 flu season.

? Number of reports by region: 33 total [C(10), N(2), SE(14), SW(7)]
? Proportion of visits due to ILI: ↓ 5.6 % (regional baseline*: 1.8%)
? A total of 634 patient visits due to ILI were reported out of 11,258 office visits
http://www.michigan.gov/documents/MIFluFocus_1_5_06_146893_7.pdf

3 fatalities have been reported in the media

*Minnesota
http://www.health.state.mn.us/divs/i...ses/flu/stats/
During the week ending February 10, 2018 (Week 6),
surveillance indicators showed
widespread geographic spread of influenza.
Since the start of the influenza season, four pediatric
influenza-related deaths
have been reported.

http://www.health.state.mn.us/divs/idepc/diseases/flu/stats/flustats6.pdf

Mississippi
http://www.msdh.state.ms.us/msdhsite...0,199,777.html

Influenza Surveillance Report
Week 05
Jan. 28 ? Feb. 03, 2018
During week 05 (01/28/18- 02/03/18), the overall state ILI rate (9.7%) decreased
slightly from the previous week (10.3%), but was above this time last year (5.5%)

Between week 40 (week ending October 7th) and week 05 (week ending February 3rd), 138 influenza
outbreaks were reported to MSDH. MSDH investigates all reported outbreaks, and of the 138
reported outbreaks, complete information was available for 119 of them. Twenty-three (19%) of the
outbreaks were attributed to influenza A (H1), 54 (45%) were due to influenza A (H3), 12 (10%) were
due to influenza A, unknown subtype, 22 (18%) were due to influenza B (Yamagata), two (2%) were
due to influenza B, unknown lineage, and eight (7%) were due to an unknown influenza type. (Note:
Two outbreaks were associated with two different influenza strains.)
http://www.msdh.state.ms.us/msdhsite...urces/7540.pdf

5 fatalities have been reported in the media

*Missouri
http://health.mo.gov/living/healthco...za/reports.php
Week 6: February 4 ? 10, 2018

The estimated influenza activity in Missouri is Widespread
.
? During Week 6, a total of 8,499 laboratory-positive influenza cases (4,652 influenza A, 3,725 influenza B, and
122 untyped) were reported. A season-to-date total of 92,863 laboratory-positive influenza cases (67,455
influenza A, 24,155 influenza B, and 1,253 untyped) have been reported in Missouri as of Week 6. The influenza
type for reported season-to date cases includes 73% influenza A, 26% influenza B, and 1% untyped. Nineteen
laboratory-positive cases of influenza (seven influenza A (H3), four influenza A (H1N1), and eight influenza B
(Yamagata)) were reported by the Missouri State Public Health Laboratory (MSPHL) during Week 6.
? Influenza-like illness (ILI) activity was above baseline for both the Missouri Outpatient ILI Surveillance Network
(ILINet) and the hospital emergency room visit chief complaint data reported through ESSENCE. The reported
percentage of visits for ILI was 9.61% (Figure 5) and 7.46% (Figure 7) through ILINet and ESSENCE
respectively.

The ILI data from a small number of sites located in the Northwest Region of the state is
temporarily unavailable in ESSENCE. Therefore, the ILI data for the Northwest Region should be interpreted
with caution. The percentage of respiratory specimens testing positive for influenza in Missouri laboratories
reporting to the National Respiratory and Enteric Virus Surveillance System (NREVSS) increased during Week 6
(Figure 6).
? One hundred and thirty-six influenza-associated deaths have been reported in Missouri as of Week 6.
During
Week 5, 47 deaths involving Pneumonia and Influenza (P&I) were reported to the Bureau of Vital Records,
resulting in a season-to-date total of 1,077 P&I associated deaths in Missouri.

? Sixty-five outbreaks of influenza or ILI have been reported and 13 influenza or ILI-associated school closures
have been reported in Missouri as of Week 6.
? Influenza activity increased in the U.S. during Week 5. National influenza surveillance information is prepared
by CDC and is included in the weekly FluView report, which is available online
at http://www.cdc.gov/flu/weekly/fluactivitysurv.htm.
http://health.mo.gov/living/healthcondiseases/communicable/influenza/pdf/week61718.pdf

*Montana
http://dphhs.mt.gov/publichealth/cde...influenza.aspx
Cases reported as of February 10, 2018 (MMWR Week 06)
State Summary: Flu activity is defined as WIDESPREAD1
? Influenza activity increased during week 6 of 2018 with 859 new cases reported from 42 counties.
? Season to date, at least one case of influenza has been reported from all counties in Montana.
? Season to date, 5,168 cases, 557 hospitalizations, and 24 deaths due to influenza have been
reported.

? The most common influenza type identified this season is Influenza A H3. However, the
proportion of influenza B strains detected has increased over the last three weeks and is now at
36%
? During week 6, the proportion of healthcare provider and emergency room visits for influenza like
illness (ILI) decreased slightly.
? Two new influenza outbreaks were reported during week 6. Season to date, 18 outbreaks have
been reported.
? RSV activity decreased slightly during week 6 but remains above the 10% positivity threshold
(16.7%). RSV season onset has occurred. Detailed RSV information is found on page 6.
http://dphhs.mt.gov/Portals/85/publ...tActivity/MontanaInfluenzaSummary_current.pdf

*Nebraska
http://dhhs.ne.gov/publichealth/Documents/Report.pdf
SUMMARY STATS
Percent of influenza tests positive 26.7% (1631/6108)
Percent of RSV rapid tests positive 25.28% (365/1444)
Percent of outpatient visits for ILI 7.09% (regional baseline 1.8%)
Influenza-associated hospitalizations 414 inpatients
Percent of emergency department visits due to ILI 10.5%
Percent school absence due to illness 3.91%
Number of schools with ≥11% absence due to illness 36
Number of influenza outbreaks reported 63
Influenza-associated mortality-all ages (Cumulative) 46
Influenza-associated pediatric mortality (Cumulative) 1

http://dhhs.ne.gov/publichealth/Documents/Report.pdf

*Nevada
Do not seem to be any state level reports.
Southern Nevada health district: https://www.southernnevadahealthdist...rveillance.php

Southern Nevada Weekly Influenza Surveillance Snapshot
CDC Week 6, Feb 04, 2018 to Feb 10, 2018
Summary:
Influenza surveillance for Clark County, Nevada includes data collected from 17 local hospital emergency
rooms and 66 healthcare providers. During week 6, the influenza activity remained elevated in the United
States and Nevada was one of 43 states that experienced high influenza-like illness (ILI) activity. In Clark
County, as of 2/10/2018, the total number of confirmed cases of influenza during the season was 1003, the
proportion of emergency room (ER) visits for Influenza-like Illness (ILI) decreased from 5.8% in week 5 to
5.3% in week 6. Approximately 53% of area ER visits for ILI were children under 18 years of age. Influenza
A was the dominant type circulating but the proportion of influenza B has been increasing. Twenty-four
influenza-associated deaths including 3 deaths of children under age 18 occurred this season in Clark
County.
Southern Nevada Health District will continue to update the public on the progression of the
season and encourage influenza vaccination for all persons 6 months of age and older.
https://www.southernnevadahealthdistrict.org/download/epi/2017-18/Snapshot_Week06-2018.pdf

19 fatalities have been reported from Washoe county.
43 fatalities reported across those two counties alone.

*New Hampshire
http://www.dhhs.nh.gov/dphs/cdcs/influenza/activity.htm
Weekly Influenza Surveillance Report
Week Ending February 3, 2018
MMWR Week 5
NH.png
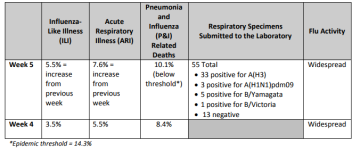
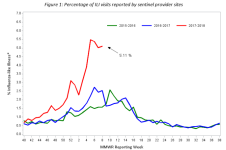
 10.1% of all deaths recorded in NH were reported as due to P&I. This is below the epidemic
threshold of 14.3%.
Twenty-four adult influenza-related deaths have been identified so far this influenza season. The
counties of residence for the persons with an identified influenza-related death are Belknap, Carroll,
Cheshire, Coos, Grafton, Hillsborough, Merrimack, Rockingham, and Strafford. No pediatric
influenza-related deaths have been identified this influenza season. Due to delays in electronic filing
of death certificates, newly identified deaths in the last week may have occurred at any point during
the flu season and not necessarily within the last week.
https://www.dhhs.nh.gov/dphs/cdcs/in.../weeklyflu.pdf

*New Jersey
http://nj.gov/health/cd/statistics/flu-stats/

Week ending February 10, 2018 (MMWR week 6)
New Jersey Activity Level: HIGH
Current week last year: HIGH
Regional4 Data
Northwest: HIGH
Northeast: HIGH
Central West: HIGH
Central East: HIGH
South: HIGH
http://nj.gov/health/cd/documents/flu/surveillance/flu_report_week_06.pdf

2 pediatric fatalities reported in the media

*New Mexico
https://nmhealth.org/about/erd/ideb/isp/data/
Summary of Activity: Week 6
February 4th ? February 10th, 2018
▪ New Mexico ILI activity is currently 8.5% which is above the
national baseline of 2.2%
▪ US ILI is 7.5% which is above the national baseline of 2.2%
▪ Influenza activity is above the NM baseline of 2.6% in all five
health regions
▪ There was PCR confirmed lab activity from the Scientific
Laboratory Division (SLD) in all New Mexico health regions
▪ One new influenza outbreaks were reported this week
34 adult flu deaths reported
https://nmhealth.org/data/view/infectious/2105/

*New York
https://www.health.ny.gov/diseases/c.../surveillance/
During the week ending February 10, 2018
? Influenza activity level was categorized as geographically widespread2
. This is the 10th consecutive week that widespread
activity has been reported.
? There were 16,804 laboratory-confirmed influenza reports, a 7% increase over last week.
? Of the 5,449 specimens submitted to WHO/NREVSS laboratories, 1,665 (30.56%) were positive for influenza.
? Of the 192 specimens tested at Wadsworth Center, 100 were positive for influenza. 17 were Influenza A (H1),
69 were influenza A (H3), and 14 were influenza B (Yamagata).
? Reports of percent of patient visits for influenza-like illness (ILI3
) from ILINet providers was 11.23%, which is above the
regional baseline of 3.10%.
? The number of patients hospitalized with laboratory-confirmed influenza was 2,409 a 3% decrease over last week.
? There were two influenza-associated pediatric deaths reported this week. There have been five influenza-associated
pediatric deaths reported this season.
? Preliminary results for influenza vaccine effectiveness (VE) are published on CDC?s website at https://www.cdc.gov/
mmwr/volumes/67/wr/mm6706a2.htm?s_cid=mm6706a2_w .
https://www.health.ny.gov/diseases/...illance/2017-2018/flu_report_current_week.pdf

16 fatalities have been reported in the media.

*North Carolina
http://www.flu.nc.gov/
WEEK 06: ENDING FEBRUARY 10, 2018

Influenza-like illness (ILI) increased during week 6.
The geographic spread of flu was WIDESPREAD for the week ending 2/10/2018.
Of the 56 samples submitted to the State Laboratory of Public Health (SLPH) for viral testing this week, 18
were positive for influenza A(H3), 8 were positive for influenza B, 4 were positive for influenza A(H1N1),
and 2 were positive for influenza A(unknown).
Hospital-based Public Health Epidemiologists (PHEs) reported 1,438 positive influenza results out of 4,184
samples tested during week 6 (ending 2/10/2018); 846 were positive for influenza A(unknown), 327 were
positive for influenza B, 212 were positive for influenza A(H3), and 53 were positive for influenza A(H1).

Influenza-Associated Deaths
This Week (02/04/2018 ? 02/10/2018)
17
Total Influenza-Associated Deaths
This Season (starting 10/01/2017)
165


http://flu.nc.gov/data/documents/flu1718.pdf

North Dakota
http://www.ndflu.com/
Through week 201806, the week ending 2/10/2018
Total influenza cases reported for the week declined slightly for the second week since the season
picked up. Activity is still widespread. It is likely that the influenza season peaked the week ending
January 27, 2018, but influenza B activity is increasing. An increase in influenza B is typical for this
part of the season.
Although activity is declining, it is likely widespread influenza activity will continue for some time, so
it is not too late to get vaccinated. Handwashing and staying home when you are sick are also
important for reducing the spread of influenza. It is recommended children with influenza be kept
out of school or child care until they have been fever free, without the use of fever-reducing
medication, for 24 hours regardless if the child is taking influenza antivirals.

20 fatalities reported
http://www.ndflu.com/DataStats/Docs/...entSummary.pdf

*Ohio
https://www.odh.ohio.gov/en/seasflu/Ohio-Flu-Activity
MMWR Week 6
February 4th- February 10th, 2018

Current Ohio Activity Level (Geographic Spread) ? Widespread

During MMWR Week 6, public health surveillance data
sources indicate elevated influenza-like illness (ILI) activity
in outpatient settings reported by Ohio?s sentinel ILINet
providers. Outpatient medical claims related to influenzalike
illness decreased slightly during MMWR Week 6. The
percentage of emergency department visits with patients
exhibiting constitutional symptoms and fever and ILI
specified ED visits decreased. Reported cases of influenzaassociated
hospitalizations are above the seasonal
threshold*. There were 1098 influenza-associated
hospitalizations reported.

https://www.odh.ohio.gov/-/media/OD...Activity-Summary-201718-MMWR-Week-6.pdf?la=en

41 fatalities have been reported in the media.

*Oregon
http://public.health.oregon.gov/Dise...s/surveil.aspx
Data at a Glance
February 4?10, 2018 (Week 6)
Current Week (6) Previous Week (5)
Percentage of emergency department visits for ILI 4.0% 5.1%
Percentage positive influenza tests 17.9% 20.6%
Influenza-associated hospitalizations 25 59
Reported ILI/influenza outbreaks 8 4
Influenza-associated pediatric mortality 0 0
Percentage of ILI at sentinel providers 1.4% 2.2%
Respiratory Syncytial Virus (RSV) activity 21% 17%

Hospitalizations:
In Clackamas, Multnomah, and Washington counties, 25 influenza-associated hospitalizations were reported
during week 6 of 2018, for a total of 1,247 cases reported during this season; 922 (74%) cases were Flu
A, 324 were flu B (26%), 1 was coinfected with flu A and B.
Of 251 subtyped flu A cases 122 (49%) were A/2009 H1N1, and 129 (51%) were A/H3N2. Of 72 subtyped
flu B cases 71 (99%) were B/Yamagata and 1 (1%) was B/Victoria.
http://www.oregon.gov/oha/PH/DISEASE...a/FluBites.pdf

5 fatalities have been reported in the media.

*Oklahoma
https://www.ok.gov/health/Disease,_P..._Flu_View.html

Influenza-Associated Hospitalization Surveillance for 2017-2018 Season
Number of Reported Influenza-Associated Hospitalizations and Deaths, Oklahoma [TABLE="border: 0, cellpadding: 0, cellspacing: 0, width: 694"]
[TR]
[TD]Number of New Hospitalizations Reported with Testing between
Feb. 7 ?
Feb. 13, 2018[/TD]
[TD]Number of New and Previously Reported Hospitalizations with Testing between
Sept. 1, 2017 ? Feb. 6, 2018[/TD]
[TD]Cumulative Hospitalizations and/or Deaths Since
Sept. 1, 2017[/TD]
[TD]Number of New Deaths Reported with Testing between
Feb. 7 ?
Feb. 13, 2018[/TD]
[TD]Number of New and Previously Reported Deaths with Testing between
Sept. 1, 2017 ? Feb. 6, 2018[/TD]
[TD]Cumulative Deaths since Sept. 1, 2017[/TD]
[/TR]
[TR]
[TD]308[/TD]
[TD]3,132[/TD]
[TD]3,440[/TD]
[TD]6[/TD]
[TD]147[/TD]
[TD]153[/TD]
[/TR]
[/TABLE]
Sentinel Surveillance Summary for February 4 through February 10, 2018
  • The percentage of outpatient visits meeting the criteria for ILI[SUP]1[/SUP] was 7.7% (768/9,982).
  • Thirty-two percent of rapid influenza tests performed by sentinel sites were positive; 57% were positive for influenza A.
  • Sentinel surveillance data indicates that overall influenza activity in Oklahoma peaked during week ending January 20, 2018. However, we are likely seeing the beginning of a second wave of influenza activity due to influenza B.
  • Nine percent of RSV tests performed by sentinel laboratories were positive.
https://www.ok.gov/health/Disease,_..._Service/Disease_Information/OK_Flu_View.html

*Pennsylvania
http://www.health.pa.gov/My%20Health...x#.WggyTmiPKUk

Flu Activity Code: WIDESPREAD (week 6 ending February 10, 2018)
Summary:
- Laboratory, hospital emergency department, and sentinel medical provider data all indicate that the flu activity decreased slightly from past weeks, but it is too early to say whether this will be the peak for the season.
- Flu activity for MMWR week 6 has decreased in all the state regions except the SE region.
- Pennsylvania?s current influenza activity code is "WIDESPREAD"
- Sixteen influenza associated deaths were reported during week 6 and total number of reported influenza associated death is 107, season to date, including two pediatric cases


*Rhode Island
http://www.health.ri.gov/data/flu/
Geographic Spread: Widespread

Last updated: February 7, 2018

Graph based report at link. Activity increasing.

11 fatalities reported in the media.

*South Carolina
http://www.scdhec.gov/Health/Disease...s/Flu/FluData/
MMWR Week 6: February 4 to February 10, 2018

Geographic Spread
South Carolina reported widespread
activity this week. This is the ninth
consecutive week at widespread activity.

Influenza-Associated Hospitalizations
and Deaths
A total of 518 influenza-associated hospitalizations were
reported by 52 hospitals. The cumulative hospitalization rate is
68.8 per 100,000. There were 22 laboratory-confirmed influenzaassociated
deaths reported; however, 6 deaths occurred in
previous weeks. The cumulative mortality rate is 2.6 per 100,000.
Compared to the previous week, the number of reported
hospitalizations remained the same and number of reported
deaths decreased by 1 (5.9%). In the current flu season, there
have been 3,412 influenza-associated hospitalizations and 128
influenza-associated deaths reported.


Virologic Surveillance
A total of 18,372 influenza cases (18,000 positive rapid antigen
detection tests; 372 lab-confirmed tests) were reported from 45
counties representing all four DHEC Public Health regions.
Influenza A was most frequently reported by clinical labs.
Compared to the previous week, this is a decrease of 622 cases
(3.3%). In the current flu season, there have been 99,791
influenza cases (97,407 positive rapid antigen detection tests;
2,384 lab-confirmed tests) reported.

Influenza-Like Illness Surveillance
The percent of patient visits to sentinel providers for an
influenza-like illness (ILI) was 16.50%, which is above South
Carolina?s baseline (3.13%). Compared to the previous week, this
is an increase of 0.96%.
The ILI activity level was high.
http://www.scdhec.gov/Health/docs/HAN/Flu/Flu Watch MMWR Week 6.pdf

*South Dakota
http://doh.sd.gov/diseases/infectiou...veillance.aspx SD.png


http://doh.sd.gov/documents/diseases/flu/Week6.pdf


*Tennessee
https://www.tn.gov/health/cedep/immu...tennessee.html

for the Week of Feb. 4-10, 2018 (Week 6)

Influenza activity in Tennessee
? The percentage of outpatients with ILI visiting the state's Sentinel
clinic sites was 6.22%. The CDC's baseline rate is 2.2%.
? 22.2% of specimens tested positive for influenza viruses .
? 64 of 95 Tennessee counties have had at least one confirmed
influenza-positive result in recent weeks.
? Influenza-related deaths reported in 2017-18 season: 8 pediatric
and 1 pregnancy-associated
https://www.tn.gov/content/dam/tn/h...eports/flu_summary/ILI_spnreport_2018_06c.pdf

21 fatalities have been reported in the media.

*Texas
http://www.dshs.texas.gov/IDCU/disea...ity-Report.xls
Texas Influenza Surveillance Report
2017?2018 Season/2018 MMWR Week 06
(Feb. 4, 2018 ? Feb. 10, 2018)
Report produced on 2/16/2018
Summary
Influenza activity remains high across the state of Texas although activity has slightly decreased over the past few weeks. Compared to the previous week, the percentage of patient visits due to influenza-like illness (ILI) and the percentage of specimens testing positive for influenza reported by public health and hospital laboratories has marginally decreased. One influenza-associated pediatric death was reported. Fourteen ILI or influenza-associated outbreaks were reported. In addition to flu, other respiratory viruses?especially rhinovirus/enterovirus?were detected in Texas during week 06. It is too early to tell if influenza activity has peaked for the season in Texas.

Four thousand one hundred and fifty-three P&I deaths have been reported in Texas during the 2017-2018 influenza season.

One influenza-associated pediatric death was reported in week 06 in a 10-year-old resident of HSR 6/5S with underlying health conditions. A specimen collected from the child was positive for influenza B by PCR. The child did not receive the influenza vaccine for the current season.
Six influenza-associated pediatric death has been reported in Texas during the 2017-2018 influenza season. Cases of influenza-associated pediatric mortality (children <18 years of age) are reportable year-round and by law in Texas.
http://www.dshs.texas.gov/IDCU/dise...llance-Activity-Report/18Wk06Feb16_Update.pdf

182 fatalities have been confirmed as follows;
Bexar: 1
Collin: 14
Dallas: 67
Denton: 8
El Paso: 11
Galveston: 2
Harris (including Houston): 5
Hays: 1
McLennan: 2
Midland: 7
Montgomery: 3
Parker: 1
Tarrant: 23
Travis (including Austin): 37

*Utah
http://health.utah.gov/epi/diseases/...nce/index.html
This report contains data through the week ending 02/10/2018 (MMWR week 6).
Current activity moderate, steady
http://health.utah.gov/epi/diseases/influenza/surveillance/2017-2018/021018.pdf
16 fatalities have been reported in the media

*Vermont
http://healthvermont.gov/immunizatio...d-surveillance
February 4, 2018 ? February 10, 2018 ǀ MMWR WEEK 6

Influenza activity was categorized as
Widespread for MMWR Week 6
 Decreased levels of Influenza-like
Illness (ILI) activity seen in emergency
departments
 Of the total emergency room
visits, 6.9% were due to ILI
 Increased levels of ILI activity
reported by outpatient providers
 Sentinel providers reported
6.5% of patients had ILI
 Vermont Department of Health
Laboratory reported 14 positive flu
tests
 National Respiratory and Enteric Virus
Surveillance System reported 181
positive flu tests
 4 Outbreaks
 1 outbreak at a LTCF in the
Northwest Region
 3 outbreaks at schools: 2 in
the Southwest and 1 in the
Northwest
http://www.healthvermont.gov/sites/default/files/documents/pdf/hs_id_Flu Report Week 6.pdf

*Virginia
http://www.vdh.virginia.gov/epidemio...-surveillance/

Virginia Influenza Activity Level: Widespread
Data From Week Ending Date: 2/10/2018
Week Number: 6
Activity rising
Graph based weekly report here: http://www.vdh.virginia.gov/content/...nza-Report.pdf

2 fatalities have been reported in the media.

*West Virginia
http://www.dhhr.wv.gov/oeps/disease/...rveillance.pdf

Graph based report at link updated to February 16.
activity rising.

2 fatalities reported in the media

*Wisconsin
https://www.dhs.wisconsin.gov/influenza/index.htm
Week Ending February 10, 2018

Predominant Virus of the Week:
Influenza A/H3N2
CURRENT ALERTS:
 Influenza activity appears to have peaked,
although high activity can be expected for several
more weeks. Record number of hospitalizations,
admissions to ICU and mechanical ventilation
cases have been identified this season.
https://www.dhs.wisconsin.gov/influenza/weekly-influenza-report.pdf

*Wyoming
https://health.wyo.gov/publichealth/...uenza-reports/

Week 5 report available here: https://health.wyo.gov/wp-content/uploads/2018/02/Summary-2018-05-.pdf

11 fatalities reported in the media

*Washington
http://www.doh.wa.gov/DataandStatist...rveillanceData
Week 06: February 4, 2018-February 10, 2018

State Summary: Flu activity remains elevated
? One hundred and seventy six lab-confirmed influenza deaths have been reported for the 2017-2018 season to
date.

? One hundred and fifty influenza-like illness outbreaks in long term care facilities have been reported for the
2017-2018 season to date.
? During week 06, 2.4 percent of visits among Influenza-like illness Network participants were for influenza-like
illness, above the baseline of 1.1 percent.
? During week 06, 19.1 percent of specimens tested by WHO/NREVSS collaborating laboratories in Washington
were positive for influenza.
? Influenza A and influenza B were reported during week 06
https://www.doh.wa.gov/Portals/1/Doc...-FluUpdate.pdf

*National
https://www.cdc.gov/flu/weekly/index.htm
Synopsis:
During week 6 (February 4-10, 2018), influenza activity remained elevated in the United States.

Viral Surveillance: The most frequently identified influenza virus subtype reported by public health laboratories during week 6 was influenza A(H3). The percentage of respiratory specimens testing positive for influenza in clinical laboratories remained elevated.
Pneumonia and Influenza Mortality: The proportion of deaths attributed to pneumonia and influenza (P&I) was above the system-specific epidemic threshold in the National Center for Health Statistics (NCHS) Mortality Surveillance System.
Influenza-associated Pediatric Deaths: Twenty-two influenza-associated pediatric deaths were reported.
Influenza-associated Hospitalizations: A cumulative rate of 67.9 laboratory-confirmed influenza-associated hospitalizations per 100,000 population was reported.
Outpatient Illness Surveillance:The proportion of outpatient visits for influenza-like illness (ILI) was 7.5%, which is above the national baseline of 2.2%. All 10 regions reported ILI at or above region-specific baseline levels. New York City, the District of Columbia, Puerto Rico and 43 states experienced high ILI activity; two states experienced moderate ILI activity; three states experienced low ILI activity; and two states experienced minimal ILI activity.
Geographic Spread of Influenza:The geographic spread of influenza in Puerto Rico and 48 states was reported as widespread; one state reported regional activity; the District of Columbia, Guam and one state reported local activity; and the U.S. Virgin Islands reported no activity.

https://www.cdc.gov/flu/weekly/index.htm

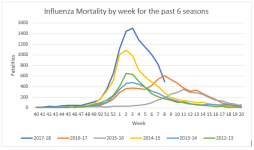
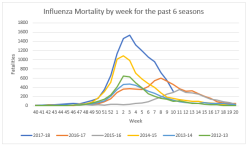
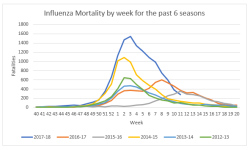
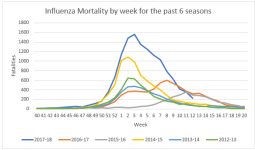
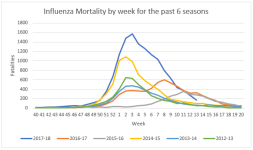
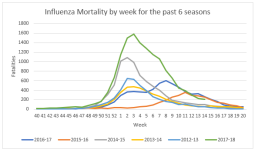
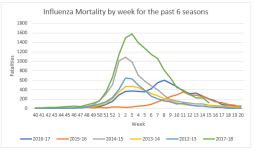
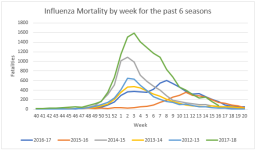
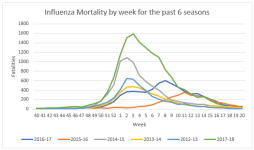
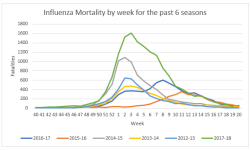
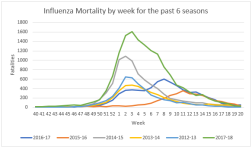
Comparison of confirmed CDC fatalities Weeks 40-4 with corresponding period from previous years (note figures for 2017-18 are preliminary and are likely to increase)
2017-18: 5,825
2016-17: 1,877
2015-16: 377
2014-15: 5,611
2013-14: 2,294
2012-13: 2,833
Data source: https://gis.cdc.gov/grasp/fluview/mortality.html
 
The CDC has tracked 7,025 Influenza fatalities from Weeks 40-5
Week Fatalities
40: 16
41: 17
42: 26
43: 22
44: 36
45: 45
46: 48
47: 48
48: 78
49: 114
50: 151
51: 330
52: 592
1: 1,049
2: 1,305
3: 1,331
4: 1,041
5: 776

Total: 7,025
https://gis.cdc.gov/grasp/fluview/mortality.html

Comparison of confirmed CDC fatalities Weeks 40-5 with corresponding period from previous years (note figures for 2017-18 are preliminary and are likely to increase)
2017-18: 7,025
2016-17: 2,228
2015-16: 438
2014-15: 6,095
2013-14: 2,679
2012-13: 3,225
 
Last edited:
Note: Individual threads exist for each state that are updated several times a day by FluTrackers Newshounds (hattip Jim Oliveros, Pathfinder & Shiloh). For up to date information see this forum https://flutrackers.com/forum/forum/...ndemic-2009-aj and click on any state for more information. The media reported fatality figures included here are for direct cause deaths only and do not include the total of pneumonia and influenza deaths which is many times higher.

Updates marked with a *

*Alabama
Influenza in Alabama

Influenza activity levels continue to remain significant across the state. During Week 07 (February 11-17, 2018), the geographic spread in Alabama was observed to be &#147;widespread&#148;. Widespread indicates lab-confirmed case(s) along with elevated influenza-like illness (ILI) or reported ILI outbreaks in five or more of the eight Public Health Districts (PHD). Several positive flu specimens in the Northern, Northeastern, West Central, East Central, and Southeastern Districts of the state were identified during this week. Influenza A (H3), Influenza A (2009 H1N1), Influenza B/Yamagata, and Influenza B/Victoria were identified in specimens submitted to the State Laboratory. Potential variant flu viruses are monitored through surveillance.

Since October 1, 2017, there have been two confirmed influenza-associated pediatric deaths. As of January 11, 2018, 111 persons are being investigated for influenza-associated deaths, 5 have received laboratory confirmation, 2 have received a physician diagnosis, and 1 is unknown. Medical records have been requested to confirm the remaining diagnoses.

It is not too late to get vaccinated! For those who have not received their annual influenza shot, the quadrivalent vaccine, which protects against four (quad) strains, is the only vaccine available that provides protection against Influenza B (Yamagata).

To review the geographic spread of ILI in Alabama, please visit the Influenza Surveillance Map (this map works best with recent supported versions of Google Chrome, Internet Explorer 11, Mozilla Firefox, Safari, Opera, and many mobile devices).
A graph displaying ILI data and positive influenza specimens submitted to the Bureau of Clinical Laboratories (BCL) is also available. Alabama.png


http://www.alabamapublichealth.gov/Influenza/


*District of Columbia
https://doh.dc.gov/page/influenza-surveillance-reports

Week 7 (February 11th, 2018 &#150; February 17th, 2018)
(All data are preliminary and may change as more reports are received)
SUMMARY
 327 new cases of influenza were reported by hospitals during this reporting period
 Zero pediatric deaths were reported during this period
 For the 2017-2018 influenza season to-date, 2150 positive Influenza cases have been reported
 For the 2017-2018 influenza season, DC PHL has completed testing for 91 specimens
 Flu activity is similar to that of the previous week
https://doh.dc.gov/sites/default/fil...20MMWR_7_0.pdf

*Puerto Rico
http://www.salud.gov.pr/Estadisticas...Influenza.aspx
Influenza Semana 7* // Temporada 2016 &#150; 2017 // Temporada 2017 &#150; 2018**
Casos totales reportados (incluye hospitalizaciones) 1,666 // 53,708 // 18,568
Regiones de salud con tasas m?s altas Ponce // Ponce // Ponce
Fatalidades 0 // 14 // 4
Hospitalizaciones 40 // 1,919 // 696
http://www.salud.gov.pr/Estadisticas...207%202018.pdf

*Alaska
http://dhss.alaska.gov/dph/epi/id/pa...influenza.aspx
Updated to Feb 7
Influenza A decreasing, % Influenza B increasing, Activity steady.
Month // cases
September // 315
October // 227
November // 378
December // 865
Jan // 858
Feb // 584

2 fatalities have been reported in the media.

*Arizona
http://www.azdhs.gov/preparedness/ep...veillance-home
ARIZONA &#150; INFLUENZA SUMMARY
Week 7 (2/11/2018 &#150; 2/17/2018)

Synopsis:
Synopsis:
Influenza activity is elevated. Arizona reported Widespread Activity for week 7. Subscribe to the Flu & RSV report at
azhealth.gov/email.

Influenza activity highlights:

 The numbers in this report are based on processed cases. There are a large number of
reports that are still being processed.
 983 laboratory-confirmed cases of influenza were reported in the past week, from 15
counties. 24,667 cases have been reported this season, with laboratory-confirmed cases
identified in 15 counties.
 20,878 (85%) reports this season are influenza A, 3,511 (14%) are influenza B, and 278 (1%)
are of unknown type.
 To date, 523 pneumonia and influenza deaths were identified this season.
Two influenza-associated pediatric deaths have been reported for the 2017&#150;2018 season
in Maricopa County residents. One case was PCR positive for influenza A (H3), and one for
influenza B/Victoria.

http://www.azdhs.gov/documents/prepa...7-18-week7.pdf

There have been 11 fatalities reported in the media.

*Arkansas
http://www.healthy.arkansas.gov/prog...fluenza#Weekly
Week Ending Saturday 02/17/2018

For Week 7, Arkansas reported &#147;Widespread&#148; activity to the Centers for Disease Control and Prevention
(CDC) for geographic spread of influenza, and &#147;High&#148; or 10/10 for ILI intensity.
 Since October 1, 2017, over 46,900 positive influenza tests have been reported to the ADH online database
by health care providers. In Week 7, 74 counties reported influenza cases. The majority of reports came
from Pulaski, Benton, Craighead, White, Jefferson, Lonoke, Independence, Faulkner, Washington,
Sebastian, and Stone.
 Among total flu antigen tests that can distinguish between influenza A and B virus types, 64 percent were
influenza A, and 36 percent were influenza B.
 There are 363 positive PCR flu tests this week from private labs: 109 influenza A, and 250 influenza B; 1
positive influenza A subtype H1N1, and 3 undetermined. At the ADH lab, 9 samples tested negative this
week.
 About 7.6 percent of patients visiting emergency rooms this week were there for ILI. About 7.5 percent of
outpatient visits were for ILI.
 The average school absenteeism rate last week was 7.4 percent among public schools.
To date, 159 influenza-related deaths have been reported in Arkansas this flu season, 156 among adult
persons and 3 pediatric deaths.
CDC has reported a total of 84 pediatric deaths nationwide this season.
 Since October 1, 2017, 56 facilities including 46 nursing homes have reported influenza outbreaks.
 The proportion of deaths reported to the National Center for Health Statistics attributed to pneumonia and
influenza (P&I) was above the system-specific epidemic threshold.
 For Week 6, the geographic spread of influenza was reported as widespread in Puerto Rico and 48 states;
Oregon reported regional activity; the District of Columbia, Guam and Hawaii reported local activity; and
the U.S. Virgin Islands reported no activities.
 You can report flu year-round and view the weekly influenza report during the influenza season at:
http://www.healthy.arkansas.gov/prog...pics/influenza.
You can also access the reporting website directly at: https://FluReport.ADH.Arkansas.gov
http://www.healthy.arkansas.gov/imag...y_17,_2018.pdf

*California
https://www.cdph.ca.gov/Programs/CID...Influenza.aspx

Highlights (Week 7: February 11, 2018 &#150; February 17, 2018)
Statewide Activity Widespread

 Deaths: 17 (Age 0-64)
 Outbreaks: 29
 Laboratory: 18.7% positive
 Outpatient ILI: Above expected levels
 Hospitalizations: Above expected levels
Click on images and links for more information
Key messages:
&#149; Influenza activity is decreasing, but remains
elevated throughout California.
&#149; Several more weeks of flu activity are expected
and may continue through the spring.
&#149; Influenza B viruses are now more common than
influenza A viruses in California.
&#149; Flu vaccination is still the best way to prevent
a substantial amount of illness and flu-related
hospitalizations.

Seventeen laboratory-confirmed influenza-associated fatalities were reported to CDPH
during Week 7 (Figure 6). To date, CDPH has received 202 reports of laboratoryconfirmed
influenza-associated deaths among patients <65 years of age during the
2017&#150;2018 influenza season

https://www.cdph.ca.gov/Programs/CID...INALReport.pdf

*- San Diego
http://www.sandiegocounty.gov/conten...uenzaWatch.pdf
Current Week 7 (ending 2/17/2018)
&#149; 721 new influenza detections reported: Elevated level
&#149; 5% influenza-like-illness (ILI) among emergency department visits: Expected level
&#149; 18 new influenza-related deaths reported this week (tot 269)
&#149; 14 new ICU cases reported this week
&#149; 10% of deaths registered with pneumonia and/or influenza: Expected level

576 fatal cases from California have been reported in the media as follows;
Contra Costa: 7
Fresno: 1
Kern: 1
Long Beach: 1
LA: 158
Marin: 1
Monterey: 6
Orange: 11
Placer: 1
Riverside: 20
Sacramento: 3
San Benito: 2
San Bernadino: 3
San Diego: 269
San Joaquin: 3
San Luis Obispo: 15
San Mateo: 4
Santa Barbara: 10
Santa Clara: 5
Santa Cruz: 3
Shasta: 1
Stanislaus: 6
Solano: 3
Sonoma: 2
Tulare: 4
Ventura: 34
Yolo: 2


*Colorado
https://www.colorado.gov/pacific/cdphe/influenza-data
Synopsis for the Week Ending February 17th:

During the week ending Feb. 17, 2018, there were 149 additional hospitalized influenza cases reported. The total number of hospitalizations since the beginning of the 2017-18 season is now 3,550. This is the highest number of influenza-associated hospitalizations in a single season for Colorado.
Influenza-like illness reported by Kaiser Permanente (which includes providers from the North Central, Northeast, Northwest, South and South Central regions of the state) decreased from 3.48% to 2.84%. Influenza-like illness reported by Primary Care Partners (Northwest region) increased from 1.37% to 2.84%.
Sentinel hospital labs (20 of 24 reporting) tested 2,820 specimens and 372 (13.2%) were positive for influenza.
There have been a total of 155 outbreaks associated with influenza for the 2017-18 influenza season. This is the highest number of influenza-associated outbreaks recorded in Colorado.
Mortality due to pneumonia and influenza is above the epidemic threshold and increased from 7.9% to 10.0%. This is above national level of 9.8%.
One novel influenza A variant (H1N2v) was detected. An individual hospitalized with influenza in the San Luis Valley was found to be infected with a novel influenza A virus, H1N2v. This individual had exposure to swine at an agricultural event in the week preceding illness onset.
One pediatric death associated with influenza was reported for the 2017-18 influenza season. This was associated with influenza A (not subtyped) and had an onset of the week ending December 30, 2017.
https://docs.google.com/document/d/e...MJwzs8u8p9/pub
2 fatal cases have been reported in the media.

*Connecticut
http://portal.ct.gov/DPH/Infectious-...and-Statistics

2017-2018 Influenza Season, Update for Week 7*
(Week ending Saturday, 02/17/2018)
Key Points
 Although national influenza activity many have peaked in many areas, it remains high and widespread within most regions of the continental United States. The US Centers for Disease Control and Prevention (CDC) reported a continued high percentage (7.7%) of people seeing their health care provider with influenza-like-illness (ILI), the same percentage observed during the peak week of the 2009 H1N1 pandemic.
 In Connecticut, influenza activity show signs of peaking but remains high and widespread with a continuing high percentage of patients presenting to hospital emergency departments and outpatient providers with ILI, along with increasing numbers of flu-associated hospitalizations and deaths.
 Classification of Connecticut geographic activity remains at widespread**.
 Influenza A (H3N2) viruses continue to predominate within the US and Connecticut although more influenza A (H1N1) and influenza B viruses appear to be circulating.
 There is still time to obtain your flu vaccine and take other important steps to prevent influenza-related illness and hospitalization:
http://www.portal.ct.gov/DPH/Infecti...onal-Influenza

A total of 1,951 hospitalized patients with laboratory-confirmed influenza admitted between August 27 and February 17, 2018 have been reported to date. Of these 1,951 reports, 1,256 were Type A (subtype unspecified), 332 were Type A (H3N2), 13 were Type A (2009 H1N1), 347 were influenza B virus, and 3 of unknown type. A total of 97 influenza-associated deaths (75 associated with flu A, 22 with flu B). Of these deaths, 78 were among patients greater than 65 years of age, 11 were 50-64 years of age, 5 were 25-49 years of age, 1 was between 19-24 years of age, and 2 were between 5-18 years of age. The current season total of 97 deaths is above the range of influenza-associated deaths (1-65) reported during the previous five seasons
http://portal.ct.gov/-/media/Departm..._wk7.pdf?la=en

*Delaware
http://dhss.delaware.gov/dhss/dph/ep...uenzawkly.html
Delaware Influenza Surveillance 2017-2018:
During MMWR Week 6, there were 1,268 laboratory-confirmed cases of influenza reported among Delaware residents, bringing
the total to 4,235 confirmed cases for the 2017-2018 season. Reports of influenza-like illness (ILI) received from participating
providers, facilities and institutions in Delaware show ILI is 6.4% compared with Delaware&#146;s 2017-2018 baseline of 2.0%.
Nationally, ILI is 7.5% compared with the 2017-2018 national baseline of 2.2%.
http://dhss.delaware.gov/dhss/dph/ep...lu2018wk06.pdf

18 fatalities have been reported in the media

*Florida
http://www.floridahealth.gov/disease...nza/index.html
Week 7: February 11-17, 2018

State influenza and influenza-like illness (ILI) activity:
&#149; In week 7, influenza activity decreased for the second consecutive week. Despite these
declines, influenza activity remains higher than peak levels observed in past flu seasons.
&#149; People at high-risk for complications from influenza infection, such as children, adults aged 65
years and older, and pregnant women continued to be most impacted.
&#149; No new influenza-associated pediatric deaths were confirmed. Six influenza-associated
pediatric deaths have been confirmed so far in the 2017-18 influenza season.

&#149; Overall, deaths due to pneumonia and influenza were higher than expected. Increases in
deaths due to pneumonia and influenza are also expected over the coming weeks given the
amount of widespread illness in the preceding weeks. Most pneumonia and influenza deaths
continued to occur in people aged 65 years and older; of the deaths in people aged 64 years
and younger, most occurred in people with underlying health conditions (68%).
&#149; Thirty-one outbreaks of influenza or ILI were reported: 19 with laboratory confirmation of
influenza and 12 ILI. As of week 7 (ending February 17, 2018), 420 outbreaks of influenza and
ILI have been reported since the start of the 2017-18 season.
&#149; The Florida Department of Health is conducting enhanced surveillance of intensive-care unit
(ICU) patients aged <65 with laboratory-confirmed influenza. In week 7, 69 cases were
reported, bringing the total number of cases reported up to 201 since February 1, 2018. The
majority of these cases occurred in unvaccinated people with underlying health conditions
http://www.floridahealth.gov/disease...flu-review.pdf
12 fatalities have been reported in the media.

*Georgia
https://dph.georgia.gov/flu-activity-georgia
Week 07 (February 11 &#151; February 17, 2018) Synopsis

During week 07 there was HIGH influenza-like illness intensity with
WIDESPREAD occurrences throughout Georgia.
&#149; Outpatient Illness Surveillance (ILINet): The proportion of outpatient
visits for ILI was 11.9%, which is above the regional baseline of 1.9%.
&#149; Geographic Spread of Influenza: The geographic spread of influenza in
Georgia was WIDESPREAD during week 07.
&#149; Metro Area Hospitalizations: There were 91 hospitalizations due to influenza
infection during week 07. There have been 2,0341 hospitalizations due to
influenza so far this season.
&#149; Influenza Related Deaths: As of week 07, there have been 98 confirmed
influenza-associated deaths (4 pediatric) for the 2017-2018 season.

&#149; Viral Surveillance: Of the 1,341 specimens tested by Georgia clinical laboratories
reporting to the National Respiratory and Enteric Virus Surveillance
System (NREVSS) during week 07, 470 (35.1%) were positive for influenza.
There is a delay in Public Health Laboratories tested for week 07.
&#149; Reported Influenza Outbreaks: There have been 155 influenza outbreaks
reported to DPH so far this season.
&#149; RSV Viral Surveillance: Of the 440 specimens tested and reported by the
Georgia Public Health Laboratory (GPHL) and the National Respiratory and
Enteric Virus Surveillance System (NREVSS) collaborating laboratories during
week 07, the percent positive of ALL laboratory tests was 6.82%.
https://dph.georgia.gov/sites/dph.ge...t%20201807.pdf

Hawaii
http://health.hawaii.gov/docd/diseas...influenza-flu/
WEEK 4: JANUARY 21, 2018&#150;JANUARY 27, 2018
For week 4 of the current influenza season:
 7.6% (season to date: 4.2%) of the outpatient visits recorded by Hawaii sentinel providers were for ILI.
 ILI visits were higher than the historical baseline in Hawaii2,3
(i.e., outside the 95% confidence interval).
 Hawaii&#146;s ILI outpatient visits were higher than the national baseline (2.2%)4
(i.e., outside the 95% confidence
interval) and comparable to the national ILI rate (7.1%) (i.e., inside the 95% confidence interval).
 Geographic Spread: Local Activity5
 ILI Cluster Activity: Two clusters were reported to HDOH during week 4. These clusters occurred at a long
term care facility and a school on Oahu. These clusters included cases of influenza B.

 The following reflects laboratory findings for week 4 of the 2017&#150;18 influenza season:
o A total of 2,107 specimens have been tested statewide for influenza viruses (positive: 629 [29.9%]).
(Season to date: 27,199 tested [30.2% positive])
 1,260 (59.8%) were screened only by rapid antigen tests with no confirmatory testing
 847 (40.2%) underwent confirmatory testing (either RT-PCR or viral culture)
 1,478 (70.1%) were negative

For week 4 of the current influenza season:
 13.3% of all deaths that occurred in Honolulu during week 4 were related to pneumonia or influenza. For the
current season (season to date: 14.1%), there have been 1,436 deaths from any cause, 203 of which were due
to P&I.
 The P&I rate was comparable to the historical baseline in Hawaii8
(i.e., inside the 95% confidence interval).
 National P&I data are backlogged by two weeks and current data for weeks 3&#150;4 are unavailable at this time.
Based on NCHS mortality surveillance data available for week 29
(week ending January 13, 2018), 9.7% of
deaths that occurred nationally were due to P&I. This percentage is above the national epidemic threshold of
7.2% for week 2
https://health.hawaii.gov/docd/files...rveillance.pdf

1 fatality reported in the media.

*Idaho
http://healthandwelfare.idaho.gov/He...5/Default.aspx
Week #2018-07: February 11-17, 2018
Current Week Idaho Quick Stats
Percent of Outpatient Visits for Influenza-like Illness (ILI) Region 10: AK, ID, OR, WA 2.01%
(Region 10 Baseline 1.4%)
Percent Emergency Department Visits for ILI Syndrome 6.9% (Baseline 2.4%)
Virologic Surveillance Influenza B- Yamagata is predominating
Influenza-related deaths (season total) 7 new deaths (season total 73)
http://healthandwelfare.idaho.gov/Po...e_2018%207.pdf

*Illinois
http://dph.illinois.gov/topics-servi...a/surveillance
Current Week Quick Stats
Illinois Influenza Geographic Spread Widespread
Percent of Outpatient Visits for ILI 4.64% (baseline 1.8%)
Percent/Number of Influenza Positive Tests Current Week: 27.6% (467/1693); Season: 22.4% (5010/22398)
Influenza-Associated ICU Admissions Current Week: 80; Season: 1629
Influenza Outbreaks Current Week: 8; Season: 364
Influenza-Associated Pediatric Deaths (Season Total) 5
http://dph.illinois.gov/sites/defaul...k-7-022218.pdf
24 deaths have been reported in the media.

*Indiana
http://www.in.gov/isdh/22104.htm
Influenza-like Illness - Week Ending February 17, 2018
ILI Geographic Distribution Widespread
ILI Activity Code High
Percent of ILI reported by sentinel outpatient providers 6.38%
Percent of ILI reported by emergency department chief
complaints 6.41%
Percent positivity of influenza specimens tested at ISDH 63%
Number of influenza-associated deaths this season 219
Number of long-term care facility outbreaks this season 98
Number of school-wide outbreaks this season 6
http://www.in.gov/isdh/files/Weekly%...-2017-2018.pdf

*Iowa
https://idph.iowa.gov/influenza/reports
For the week ending February 17, 2018 - Week 7

Quick Stats
Percent of influenza rapid test positive 27% (1125/4137)
Percent of RSV rapid tests positive 28% (193/694)
Influenza-associated hospitalizations 135/6869 inpatients
Percent of outpatient visits for ILI 3.14% (baseline 1.9%)
Percent school absence due to illness 3.40%
Number of long-term care influenza outbreaks 2
Number of schools with ≥10% absence due to illness 24
Influenza-associated mortality -all ages (Cumulative) 157
Influenza-associated pediatric mortality (Cumulative) 0
https://idph.iowa.gov/Portals/1/user...207%202018.pdf

*Kansas
http://www.kdheks.gov/flu/surveillance.htm
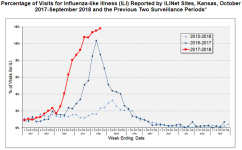
KS.png


Chart based report at link. 100 direct cause deaths reported.

Kentucky
https://healthalerts.ky.gov/Pages/FluActivity.aspx
February 4, 2018 &#150; February 10, 2018

Current Influenza Activity Level: Widespread for Ninth Consecutive Week

Update for week 6:
Lab Confirmed Influenza: 1,023 Cases
Number of Regions with Long Term Care Facility Outbreaks:
6 of 17 Regions
Number of Regions with
Confirmed Flu Cases: 17 of 17 Regions
Deaths Reported: 0 (under 18 years) 31 (18 years & older)
Number of Regions with Increased ILI Activity: 11 of 17 Regions
Number of Regions with Increased Influenza Activity: 14 of 17 Regions

Update Total for weeks 36-6:
Lab Confirmed Total: 6,287 Cases
Total Number of Long Term Care Facility Outbreaks: 10 Outbreaks
Total Number of Regions with Confirmed Flu Cases: 17 of 17 Regions
Total Deaths Reported: 4 (under 18 years) 128 (18 years & older)
https://healthalerts.ky.gov/Document...20Week%206.pdf

Louisiana
http://new.dhh.louisiana.gov/index.cfm/page/1591
Week 7: 2/11/2018-2/17/2018
Influenza activity decreased again this week in Louisiana but remains high. Influenza
A viruses represent 79% of positive samples tested at the State Laboratory (67%
A/H3N2, 33% A/H1N1). Positive tests reported from clinical laboratories remain
extremely high (~27%). The most commonly reported other respiratory viruses are
Rhino/Enterovirus.
http://new.dhh.louisiana.gov/assets/...luenza1807.pdf

*Maine
http://www.maine.gov/dhhs/mecdc/infe...-updates.shtml
February 20, 2018
For MMWR week 7 (ending 2/17/2018)
New This Week
&#149; Federal Flu Code: Widespread
&#149; 115 new hospitalizations
&#149; 11 new outbreaks
Surveillance Information &#150; Maine, 2017-2018 Influenza Season
&#149; Number of ILINet Providers reporting: 21
o % of visits for Influenza-Like Illness (ILI): 1.55
&#149; Syndromic Surveillance
o % of Emergency Room visits for ILI: 6.1
o % of Emergency Medical Services (EMS) runs for ILI: 2.2
&#149; Influenza Hospitalizations
o # of hospitalizations: 115
&#149; Electronic Death Reporting System
o % of deaths due to P&I: 6.5

Influenza Deaths
This number represents the number of individuals who had influenza specifically listed on their death certificate. This is likely an underrepresentation of the true burden as many influenza-associated deaths are due to secondary infections which is why the Pneumonia and Influenza (P&I) death information is on page 1 of this report.
&#149; # deaths reported this week: 2
&#149; Total influenza deaths 2017-18 season: 48

http://www.maine.gov/tools/whatsnew/...id=788136&an=2

*Maryland
http://phpa.dhmh.maryland.gov/influe...ages/Home.aspx
for the week ending February 17, 2018
During the week ending February 17, 2018, influenza-like illness (ILI) intensity in Maryland
was HIGH and there was WIDESPREAD geographic activity. The proportion of outpatient
visits for ILI reported by Sentinel Providers decreased. The proportion of outpatient visits
for ILI reported by Maryland Emergency Departments remained similar. The proportion of
MRITS respondents reporting ILI decreased. Clinical laboratories reported an increase in
the proportion of specimens testing positive for influenza. One hundred forty-three
specimens tested positive for influenza at the MDH lab. There were 310 influenzaassociated
hospitalizations. Twelve respiratory outbreaks were reported to MDH.
https://phpa.health.maryland.gov/inf...rt_2018-07.pdf

4 fatalities have been reported in the media

*Massachusetts
http://blog.mass.gov/publichealth/category/flu-facts/
Week 7 Activity1 (representing geographic distribution): Widespread
Week 7 ILI Activity2 (representing intensity of ILI activity): 10 (High) Mass.png
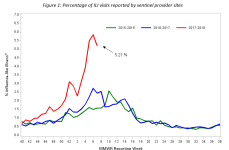

http://blog.mass.gov/publichealth/wp...02-23-2018.pdf

13 fatalities have been reported in the media

*Michigan
http://www.michigan.gov/mdhhs/0,5885...1722--,00.html
Week Ending February 17, 2018 │ WEEK 7
Activity: Widespread
Influenza-associated Pediatric Mortality
Two pediatric influenza deaths (A/H3) have been
confirmed by MDHHS to date for the 2017-2018 flu
season.
Nationally, ninety-seven (97) influenzaassociated
pediatric deaths have been reported thus
far for the 2017-2018 flu season

Number of reports by region: 28 total [C(8), N(3), SE(10), SW(7)]
&#149; Proportion of visits due to ILI: ↓ 4.0 % (regional baseline*: 1.8%)
&#149; A total of 368 patient visits due to ILI were reported out of 9,090 office visits
http://www.michigan.gov/documents/MI...6_146893_7.pdf

4 fatalities have been reported in the media

*Minnesota
http://www.health.state.mn.us/divs/i...ses/flu/stats/
During the week ending February 17, 2018 (Week 7),
surveillance indicators showed
widespread geographic spread of influenza.
Since the start of the influenza season, four pediatric
influenza-related deaths
have been reported.

http://www.health.state.mn.us/divs/i.../flustats7.pdf

*Mississippi
http://www.msdh.state.ms.us/msdhsite...0,199,777.html

During week 07 (02/11/18- 02/17/18), the overall state ILI rate (7.8%) decreased from
the previous week (8.5%), but was still above this time last year (6.4%).
Week 07 marks the third week in which the state ILI rate continued on a downward trend.

Between week 40 (week ending October 7th) and week 07 (week ending February 17th), 155 influenza
outbreaks were reported to MSDH. MSDH investigates all reported outbreaks, and of the 155
reported outbreaks, complete information was available for 137 of them. Twenty-four (17%) of the
outbreaks were attributed to influenza A (H1), 58 (41%) were due to influenza A (H3), 12 (9%) were
due to influenza A, unknown subtype, 31 (22%) were due to influenza B (Yamagata), two (1%) were
due to influenza B, unknown lineage, and 13 (9%) were due to an unknown influenza type. (Note:
Three outbreaks were associated with two different influenza strains.)
http://www.msdh.state.ms.us/msdhsite...urces/7557.pdf

5 fatalities have been reported in the media

*Missouri
http://health.mo.gov/living/healthco...za/reports.php
Week 7: February 11 &#150; 17, 2018

The estimated influenza activity in Missouri is Widespread
.
&#149; During Week 7, a total of 7,289 laboratory-positive influenza cases (3,607 influenza A, 3,577 influenza B, and
105 untyped) were reported. A season-to-date total of 103,631 laboratory-positive influenza cases (72,779
influenza A, 29,418 influenza B, and 1,434 untyped) have been reported in Missouri as of Week 7. The influenza
type for reported season-to date cases includes 70% influenza A, 29% influenza B, and 1% untyped. Fifteen
laboratory-positive cases of influenza (three influenza A (H3), seven influenza A (H1N1), and five influenza B
(Yamagata)) were reported by the Missouri State Public Health Laboratory (MSPHL) during Week 7.
&#149; Influenza-like illness (ILI) activity was above baseline for both the Missouri Outpatient ILI Surveillance Network
(ILINet) and the hospital emergency room visit chief complaint data reported through ESSENCE. The reported
percentage of visits for ILI was 8.74% (Figure 5) and 6.94% (Figure 7) through ILINet and ESSENCE
respectively.

The ILI data from a small number of sites located in the Northwest Region of the state is
temporarily unavailable in ESSENCE. Therefore, the ILI data for the Northwest Region should be interpreted
with caution. The percentage of respiratory specimens testing positive for influenza in Missouri laboratories
reporting to the National Respiratory and Enteric Virus Surveillance System (NREVSS) decreased during Week 7
(Figure 6).
&#149; One hundred and sixty-two influenza-associated deaths have been reported in Missouri as of Week 7.

During
Week 6, 119 deaths involving Pneumonia and Influenza (P&I) were reported to the Bureau of Vital Records,
resulting in a season-to-date total of 1,196 P&I associated deaths in Missouri.

&#149; Sixty-six outbreaks of influenza or ILI have been reported and 13 influenza or ILI-associated school closures have
been reported in Missouri as of Week 7.
&#149; Influenza activity remained elevated in the U.S. during Week 6. National influenza surveillance information is
prepared by CDC and is included in the weekly FluView report, which is available online at
http://www.cdc.gov/flu/weekly/fluactivitysurv.htm.
http://health.mo.gov/living/healthco.../week71718.pdf

*Montana
http://dphhs.mt.gov/publichealth/cde...influenza.aspx
State Summary: Flu activity is defined as WIDESPREAD
&#149; Influenza activity increased during week 7 of 2018 with 685 new cases reported from 35 counties.
&#149; Season to date, at least one case of influenza has been reported from all counties in Montana.
&#149; Season to date, 5,854 cases, 622 hospitalizations, and 31 deaths due to influenza have been
reported.

&#149; The most common influenza type identified this season is Influenza A H3. However, the
proportion of influenza B strains detected has increased over the last three weeks and is now at
36.5%. Influenza A H1N1 strains have also been identified (3%).
&#149; During week 7, the proportion of healthcare provider and emergency room visits for influenza like
illness (ILI) decreased slightly.
&#149; Three new influenza outbreaks were reported during week 7. Season to date, 21 outbreaks have
been reported.
&#149; RSV activity increased slightly during week 7 and remains above the 10% positivity threshold
(18.1%). Detailed RSV information is found on page 6.
http://dphhs.mt.gov/Portals/85/publi...ry_current.pdf

*Nebraska
http://dhhs.ne.gov/publichealth/Documents/Report.pdf
Synopsis for Week Ending February 17th, 2018
SUMMARY STATS
Percent of influenza tests positive 28.59% (1577/5516)
Percent of RSV rapid tests positive 23.18% (305/1316)
Percent of outpatient visits for ILI 7.44% (regional baseline 1.8%)
Influenza-associated hospitalizations 376 inpatients
Percent of emergency department visits due to ILI 8.6%
Percent school absence due to illness 2.63%
Number of schools with ≥11% absence due to illness 15
Number of influenza outbreaks reported (Cumulative) 66
Influenza-associated mortality-all ages (Cumulative) 50
Influenza-associated pediatric mortality (Cumulative) 1

http://dhhs.ne.gov/publichealth/Documents/Report.pdf

*Nevada
Do not seem to be any state level reports.
Southern Nevada health district: https://www.southernnevadahealthdist...rveillance.php

Southern Nevada Weekly Influenza Surveillance Snapshot
CDC Week 7, Feb 11, 2018 to Feb 17, 2018
Summary:
Influenza surveillance for Clark County, Nevada includes data collected from 16 local hospital emergency
rooms and 66 healthcare providers. During week 7, the influenza activity remained elevated in the United
States and Nevada was one of 39 states that experienced high influenza-like illness (ILI) activity. In Clark
County, as of 2/17/2018, the total number of confirmed cases of influenza during the season was 1046, the
proportion of emergency room (ER) visits for Influenza-like Illness (ILI) decreased from 5.3% in week 6 to
5.2% in week 7. Approximately 53% of area ER visits for ILI were children under 18 years of age. Influenza
B was the dominant type circulating in Week 7. Twenty-four influenza-associated deaths including 3
deaths of children under age 18 occurred this season in Clark County.
Southern Nevada Health District will
continue to update the public on the progression of the season and encourage influenza vaccination for all
persons 6 months of age and older.
https://www.southernnevadahealthdist...eek07-2018.pdf

19 fatalities have been reported from Washoe county.
43 fatalities reported across those two counties alone.

*New Hampshire
http://www.dhhs.nh.gov/dphs/cdcs/influenza/activity.htm
Weekly Influenza Surveillance Report
Week Ending February 10, 2018
MMWR Week 6 NH.png
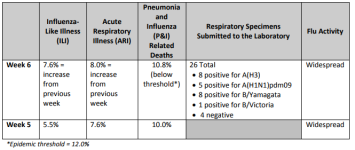
 10.8% of all deaths recorded in NH were reported as due to P&I. This is below the epidemic
threshold of 12.0%.
Twenty-six adult influenza-related deaths have been identified so far this influenza season. The
counties of residence for the persons with an identified influenza-related death are Belknap, Carroll,
Cheshire, Coos, Grafton, Hillsborough, Merrimack, Rockingham, and Strafford. No pediatric
influenza-related deaths have been identified this influenza season. Due to delays in electronic filing
of death certificates, newly identified deaths in the last week may have occurred at any point during
the flu season and not necessarily within the last week.

https://www.dhhs.nh.gov/dphs/cdcs/in.../weeklyflu.pdf

*New Jersey
http://nj.gov/health/cd/statistics/flu-stats/

Week ending February 17, 2018 (MMWR week 7)
New Jersey Activity Level: HIGH
Current week last year: HIGH
Regional4 Data
Northwest: HIGH
Northeast: HIGH
Central West: HIGH
Central East: HIGH
South: HIGH
http://nj.gov/health/cd/documents/fl...rt_week_07.pdf

3 pediatric fatalities reported in the media

*New Mexico
https://nmhealth.org/about/erd/ideb/isp/data/
Summary of Activity: Week 7
February 11th &#150; February 17th, 2018
▪ New Mexico ILI activity is currently 7.1% which is above the
national baseline of 2.2%
▪ US ILI is 6.4% which is above the national baseline of 2.2%
▪ Influenza activity is above the NM baseline of 2.6% in all five
health regions
▪ There was PCR confirmed lab activity from the Scientific
Laboratory Division (SLD) in all New Mexico health regions
▪ No new influenza outbreaks were reported this week
38 adult flu deaths reported
https://nmhealth.org/data/view/infectious/2105/

*New York
https://www.health.ny.gov/diseases/c.../surveillance/
During the week ending February 17, 2018
&#149; Influenza activity level was categorized as geographically widespread2
. This is the 11th consecutive week that widespread
activity has been reported.
&#149; There were 18,258 laboratory-confirmed influenza reports, a 9% increase over last week.
&#149; Of the 7,398 specimens submitted to WHO/NREVSS laboratories, 2,445 (33.05%) were positive for influenza.
&#149; Of the 184 specimens tested at Wadsworth Center, 112 were positive for influenza. 17 were Influenza A (H1),
94 were influenza A (H3), and 1 was influenza B (Yamagata).
&#149; Reports of percent of patient visits for influenza-like illness (ILI3
) from ILINet providers was 10.66%, which is above the
regional baseline of 3.10%.
&#149; The number of patients hospitalized with laboratory-confirmed influenza was 2,160 a 13% decrease over last week.
&#149; There were no influenza-associated pediatric deaths reported this week. There have been five influenza-associated
pediatric deaths reported this season.

&#149; Preliminary results for influenza vaccine effectiveness (VE) are published on CDC&#146;s website at https://www.cdc.gov/
mmwr/volumes/67/wr/mm6706a2.htm?s_cid=mm6706a2_w .
https://www.health.ny.gov/diseases/c...rrent_week.pdf

16 fatalities have been reported in the media.

*North Carolina
http://www.flu.nc.gov/
WEEK 07: ENDING FEBRUARY 17, 2018

Influenza-like illness (ILI) decreased slightly during week 7.
The geographic spread of flu was WIDESPREAD for the week ending 2/17/2018.
Of the 55 samples submitted to the State Laboratory of Public Health (SLPH) for viral testing this week, 27
(49%) were positive; 14 were positive for influenza B, 10 were positive for influenza A(H3), 3 were positive
for influenza A(H1N1).
Hospital-based Public Health Epidemiologists (PHEs) reported 1,297 positive influenza results out of 3,886
samples tested during week 7 (ending 2/17/2018); 663 were positive for influenza A(unknown), 432 were
positive for influenza B, 149 were positive for influenza A(H3), and 53 were positive for influenza A(H1)

Influenza-Associated Deaths
This Week (02/11/2018 &#150; 02/17/2018)
27
Total Influenza-Associated Deaths
This Season (starting 10/01/2017)
200


http://flu.nc.gov/data/documents/flu1718.pdf

North Dakota
http://www.ndflu.com/
Through week 201807, the week ending 2/17/2018
Total influenza cases reported for the week declined for the third week since the season picked
up. Activity is still widespread. It is likely that the influenza season peaked the week ending
January 27, 2018, but influenza B activity is increasing. An increase in influenza B is typical for this
part of the season.
Although activity is declining, it is likely widespread influenza activity will continue for some time, so
it is not too late to get vaccinated. Handwashing and staying home when you are sick are also
important for reducing the spread of influenza. It is recommended children with influenza be kept
out of school or child care until they have been fever free, without the use of fever-reducing
medication, for 24 hours regardless if the child is taking influenza antivirals.

20 fatalities reported
http://www.ndflu.com/DataStats/Docs/...entSummary.pdf

*Ohio
https://www.odh.ohio.gov/en/seasflu/Ohio-Flu-Activity
MMWR Week 7 February 11th- February 17th, 2018

Current Ohio Activity Level (Geographic Spread) &#150; Widespread

During MMWR Week 7, public health surveillance data
sources indicate elevated influenza-like illness (ILI) activity
in outpatient settings reported by Ohio&#146;s sentinel ILINet
providers, although the overall percentage of ILI
decreased. Outpatient medical claims related to
influenza-like illness decreased again during MMWR Week
7. The percentage of emergency department visits with
patients exhibiting constitutional symptoms and fever and
ILI specified ED visits decreased. Reported cases of
influenza-associated hospitalizations are above the
seasonal threshold*. There were 1135 influenzaassociated
hospitalizations reported.
https://www.odh.ohio.gov/-/media/ODH...ek-7.pdf?la=en

51 fatalities have been reported in the media.

*Oregon
http://public.health.oregon.gov/Dise...s/surveil.aspx
Data at a Glance
February 11&#150;17, 2018 (Week 7)
Current Week (7) Previous Week (6)
Percentage of emergency department visits for ILI 3.6% 4.1%
Percentage positive influenza tests 15.6% 17.9%
Influenza-associated hospitalizations 31 33
Reported ILI/influenza outbreaks 2 8
Influenza-associated pediatric mortality 0 0
Percentage of ILI at sentinel providers 1.7% 1.4%
Respiratory Syncytial Virus (RSV) activity 19% 21%

Hospitalizations:
In Clackamas, Multnomah, and Washington counties, 31 influenza-associated hospitalizations were reported
during week 7 of 2018, for a total of 1,304 cases reported during this season; 942 (72%) cases were Flu
A, 361 were flu B (28%), 1 was coinfected with flu A and B.
Of 251 subtyped flu A cases 122 (49%) were A/2009 H1N1, and 129 (51%) were A/H3N2. Of 72 subtyped
flu B cases 71 (99%) were B/Yamagata and 1 (1%) was B/Victoria.
http://www.oregon.gov/oha/PH/DISEASE...a/FluBites.pdf

5 fatalities have been reported in the media.

*Oklahoma
https://www.ok.gov/health/Disease,_P..._Flu_View.html
[TABLE="border: 0, cellpadding: 0, cellspacing: 0, width: 920"]
[TR]
[TD]Influenza-Associated Hospitalization Surveillance for 2017-2018 Season
Number of Reported Influenza-Associated Hospitalizations and Deaths, Oklahoma [TABLE="border: 0, cellpadding: 0, cellspacing: 0, width: 694"]
[TR]
[TD]Number of New Hospitalizations Reported with Testing between
Feb. 14 &#150;
Feb. 20, 2018[/TD]
[TD]Number of New and Previously Reported Hospitalizations with Testing between
Sept. 1, 2017 &#150; Feb. 13, 2018[/TD]
[TD]Cumulative Hospitalizations and/or Deaths Since
Sept. 1, 2017[/TD]
[TD]Number of New Deaths Reported with Testing between
Feb. 14 &#150;
Feb. 20, 2018[/TD]
[TD]Number of New and Previously Reported Deaths with Testing between
Sept. 1, 2017 &#150; Feb. 13, 2018[/TD]
[TD]Cumulative Deaths since Sept. 1, 2017[/TD]
[/TR]
[TR]
[TD]300[/TD]
[TD]3,560[/TD]
[TD]3,860[/TD]
[TD]5[/TD]
[TD]168[/TD]
[TD]173[/TD]
[/TR]
[/TABLE]
Sentinel Surveillance Summary for February 11 through February 17, 2018
  • The percentage of outpatient visits meeting the criteria for ILI[SUP]1[/SUP] was 6.2% (569/9,149).
  • Thirty-three percent of rapid influenza tests performed by sentinel sites were positive; 53% were positive for influenza B.
  • Sentinel surveillance data indicates that overall influenza activity in Oklahoma peaked during week ending January 20, 2018. However, we are seeing a second wave of influenza activity due to influenza B.
  • Seven percent of RSV tests performed by sentinel laboratories were positive.
[/TD]
[/TR]
[/TABLE]
*Pennsylvania
http://www.health.pa.gov/My%20Health...x#.WggyTmiPKUk

​Flu Activity Code: WIDESPREAD (week 7 ending February 17, 2018)
Summary:
- Laboratory, hospital emergency department, and sentinel medical provider data all indicate that the flu activity decreased slightly from past weeks, but it is too early to say whether this will be the peak for the season.
- Flu activity for MMWR week 7 has decreased in all the state regions except the SE region.
- Pennsylvania&#146;s current influenza activity code is "WIDESPREAD"
- Twenty-eight influenza associated deaths were reported during week 7 and total number of reported influenza associated death is 135, season to date, including two pediatric cases


*Rhode Island
http://www.health.ri.gov/data/flu/
Geographic Spread: Widespread

Last updated: February 21, 2018

Graph based report at link. Activity high.

11 fatalities reported in the media.

*South Carolina
http://www.scdhec.gov/Health/Disease...s/Flu/FluData/
MMWR Week 7: February 11 to February 17, 2018

Geographic Spread
South Carolina reported widespread
activity this week. This is the tenth
consecutive week at widespread activity.

Influenza-Associated Hospitalizations
and Deaths
A total of 373 influenza-associated hospitalizations were
reported by 56 hospitals. The cumulative hospitalization rate is
76.3 per 100,000. There were 23 laboratory-confirmed influenzaassociated
deaths reported; however, 14 deaths occurred in
previous weeks. The cumulative mortality rate is 3.0 per 100,000.
Compared to the previous week, the number of reported
hospitalizations decreased by 145 (28.0%) and number of
reported deaths decreased by 9 (50.0%). In the current flu
season, there have been 3,785 influenza-associated
hospitalizations and 151 influenza-associated deaths reported.


Virologic Surveillance
A total of 10,600 influenza cases (10,294 positive rapid antigen
detection tests; 306 lab-confirmed tests) were reported from 44
counties representing all four DHEC Public Health regions.
Influenza A was most frequently reported by clinical labs.
Compared to the previous week, this is a decrease of 8,216
cases (43.7%). In the current flu season, there have been
110,960 influenza cases (108,162 positive rapid antigen
detection tests; 2,798 lab-confirmed tests) reported.

Influenza-Like Illness Surveillance
The percent of patient visits to sentinel providers for an
influenza-like illness (ILI) was 12.65%, which is above South
Carolina&#146;s baseline (3.13%). Compared to the previous week, this
is a decrease of 3.85%.
The ILI activity level was high.
http://www.scdhec.gov/Health/docs/HA...20Week%207.pdf

*South Dakota
http://doh.sd.gov/diseases/infectiou...veillance.aspx SD.png
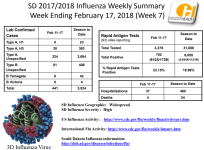

http://doh.sd.gov/documents/diseases/flu/Week7.pdf


*Tennessee
https://www.tn.gov/health/cedep/immu...tennessee.html

for the Week of Feb. 11-17, 2018 (Week 7)

Influenza activity in Tennessee
&#149; The percentage of outpatients with ILI visiting the state's Sentinel clinic
sites was 5.51%. The CDC's baseline rate is 2.2%.
&#149; 25.7% of specimens tested positive for influenza viruses .
&#149; 63 of 95 Tennessee counties have had at least one confirmed influenzapositive
result in recent weeks.
&#149; Influenza-related deaths reported in 2017-18 season: 10 pediatric and
1 pregnancy-associated

https://www.tn.gov/content/dam/tn/he...t_2018_07c.pdf

33 fatalities have been reported in the media.

*Texas
http://www.dshs.texas.gov/IDCU/disea...ity-Report.xls
2017&#150;2018 Season/2018 MMWR Week 07
(Feb. 11, 2018 &#150; Feb. 17, 2018)
Report produced on 2/23/2018
Summary
Influenza activity remains high across the state of Texas although activity has slightly decreased over the past few weeks. Compared to the previous week, the percentage of patient visits due to influenza-like illness (ILI) and the percentage of specimens testing positive for influenza reported by hospital laboratories has marginally decreased. The percentage of specimens testing positive for influenza reported by public health laboratories has slightly increased. One influenza-associated pediatric death was reported. Twenty ILI or influenza-associated outbreaks were reported. In addition to flu, other respiratory viruses&#151;especially rhinovirus/enterovirus&#151;were detected in Texas during week 07. It is too early to tell if influenza activity has peaked for the season in Texas.

Four thousand one hundred and fifty-three P&I deaths have been reported in Texas during the 2017-2018 influenza season.

One influenza-associated pediatric death was reported in week 07 in a 13-year-old resident of HSR 8 with underlying health conditions. A specimen collected from the child was positive for influenza B by PCR. The child did not receive the influenza vaccine for the current season.
Seven influenza-associated pediatric death has been reported in Texas during the 2017-2018 influenza season. Cases of influenza-associated pediatric mortality (children <18 years of age) are reportable year-round and by law in Texas.
http://www.dshs.texas.gov/IDCU/disea...8Wk07Feb23.pdf

194 fatalities have been confirmed as follows;
Bexar: 2
Collin: 14
Dallas: 69
Denton: 9
El Paso: 13
Galveston: 2
Harris (including Houston): 7
Hays: 1
McLennan: 2
Midland: 7
Montgomery: 3
Parker: 1
Tarrant: 24
Travis (including Austin): 40

*Utah
http://health.utah.gov/epi/diseases/...nce/index.html
This report contains data through the week ending 02/17/2018 (MMWR week 7)
Current activity high, increasing
http://health.utah.gov/epi/diseases/...018/021718.pdf
16 fatalities have been reported in the media

*Vermont
http://healthvermont.gov/immunizatio...d-surveillance
February 11, 2018 &#150; February 17, 2018 ǀ MMWR WEEK 7

Influenza activity was categorized as
Widespread for MMWR Week 7
 Decreased levels of Influenza-like Illness
(ILI) activity seen in emergency
departments
 Of the total emergency room visits,
6.6% were due to ILI
 Decreased levels of ILI activity reported by
outpatient providers
 Sentinel providers reported 5.7% of
patients had ILI
 Vermont Department of Health
Laboratory reported 20 positive flu tests
 National Respiratory and Enteric Virus
Surveillance System reported 180
positive flu tests
 9 Outbreaks
 4 outbreak at a LTCFs: 3 in the
Northwest and 1 in the Southeast
Region
 3 outbreaks at schools: 1 in the
Northeast, 1 in the Southwest,
and 1 in the Northwest Region
 1 outbreak at a correctional
facility in the Southeast Region
 1 outbreak at a child care facility
in the Northwest Region
http://www.healthvermont.gov/sites/d...20Week%207.pdf

*Virginia
http://www.vdh.virginia.gov/epidemio...-surveillance/

Virginia Influenza Activity Level: Widespread
Data From Week Ending Date: 2/17/2018
Week Number: 7
Activity steady
Graph based weekly report here: http://www.vdh.virginia.gov/content/...nza-Report.pdf

3 fatalities have been reported in the media.

West Virginia
http://www.dhhr.wv.gov/oeps/disease/...rveillance.pdf

Graph based report at link updated to February 16.
activity rising.

2 fatalities reported in the media

*Wisconsin
https://www.dhs.wisconsin.gov/influenza/index.htm
Week Ending February 17, 2018

Predominant Virus of the Week:
Influenza A/H3N2
CURRENT ALERTS:
 Influenza activity has peaked, although high activity can
be expected for several more weeks. Record number of
hospitalizations, admissions to ICU and mechanical
ventilation cases have occurred. Influenza B and
A/H1N1 are becoming more common.
https://www.dhs.wisconsin.gov/influe...nza-report.pdf

Wyoming
https://health.wyo.gov/publichealth/...uenza-reports/

Week 5 report available here: https://health.wyo.gov/wp-content/up...y-2018-05-.pdf

11 fatalities reported in the media

*Washington
http://www.doh.wa.gov/DataandStatist...rveillanceData
Week 07: February 11, 2018-February 17, 2018

State Summary: Flu activity is decreasing
&#149; One hundred and eighty nine lab-confirmed influenza deaths have been reported for the 2017-2018 season to
date.

&#149; One hundred and fifty three influenza-like illness outbreaks in long term care facilities have been reported for
the 2017-2018 season to date.
&#149; During week 07, 2.5 percent of visits among Influenza-like illness Network participants were for influenza-like
illness, above the baseline of 1.1 percent.
&#149; During week 07, 17.7 percent of specimens tested by WHO/NREVSS collaborating laboratories in Washington
were positive for influenza.
&#149; Influenza A and influenza B were reported during week 07.
https://www.doh.wa.gov/Portals/1/Doc...-FluUpdate.pdf

*National
https://www.cdc.gov/flu/weekly/index.htm
Synopsis:
During week 7 (February 11-17, 2018), influenza activity remained elevated in the United States.

Viral Surveillance: The most frequently identified influenza virus subtype reported by public health laboratories during week 7 was influenza A(H3). The percentage of respiratory specimens testing positive for influenza in clinical laboratories remained elevated.
Pneumonia and Influenza Mortality: The proportion of deaths attributed to pneumonia and influenza (P&I) was above the system-specific epidemic threshold in the National Center for Health Statistics (NCHS) Mortality Surveillance System.
Influenza-associated Pediatric Deaths: Thirteen influenza-associated pediatric deaths were reported.
Influenza-associated Hospitalizations: A cumulative rate of 74.5 laboratory-confirmed influenza-associated hospitalizations per 100,000 population was reported.
Outpatient Illness Surveillance:The proportion of outpatient visits for influenza-like illness (ILI) was 6.4%, which is above the national baseline of 2.2%. All 10 regions reported ILI at or above region-specific baseline levels. New York City, the District of Columbia, Puerto Rico and 39 states experienced high ILI activity; five states experienced moderate ILI activity; three states experienced low ILI activity; and three states experienced minimal ILI activity.
Geographic Spread of Influenza:The geographic spread of influenza in Puerto Rico and 48 states was reported as widespread; the District of Columbia, Guam and two states reported local activity; and the U.S. Virgin Islands reported no activity.

https://www.cdc.gov/flu/weekly/index.htm

The CDC has tracked 7,025 Influenza fatalities from Weeks 40-5
Week Fatalities
40: 16
41: 17
42: 26
43: 22
44: 36
45: 45
46: 48
47: 48
48: 78
49: 114
50: 151
51: 330
52: 592
1: 1,049
2: 1,305
3: 1,331
4: 1,041
5: 776

Total: 7,025
https://gis.cdc.gov/grasp/fluview/mortality.html

Comparison of confirmed CDC fatalities Weeks 40-5 with corresponding period from previous years (note figures for 2017-18 are preliminary and are likely to increase)
2017-18: 7,025
2016-17: 2,228
2015-16: 438
2014-15: 6,095
2013-14: 2,679
2012-13: 3,225

 
The CDC has tracked 8,332 Influenza fatalities from Weeks 40-6
Week Fatalities
40: 16
41: 17
42: 27
43: 23
44: 36
45: 45
46: 49
47: 48
48: 78
49: 115
50: 152
51: 337
52: 617
1: 1,087
2: 1,391
3: 1,419
4: 1,173
5: 993
6: 709

Total: 8,332


Comparison of confirmed CDC fatalities Weeks 40-6 with corresponding period from previous years (note figures for 2017-18 are preliminary and are likely to increase)
2017-18: 8,332
2016-17: 2,647
2015-16: 531
2014-15: 6,500
2013-14: 2,994
2012-13: 3,492


https://gis.cdc.gov/grasp/fluview/mortality.html
 
Last edited:
Note: Individual threads exist for each state that are updated frequently by FluTrackers Newshounds (hattip Jim Oliveros, Pathfinder & Shiloh). For up to date information see this forum https://flutrackers.com/forum/forum/...ndemic-2009-aj and click on any state for more information. The media reported fatality figures included here are for direct cause deaths only and do not include the total of pneumonia and influenza deaths which is many times higher.

Updates marked with a *

*Alabama
During Week 08 (February 18-24, 2018),
  • Activity levels continue to remain significant across the state (5.6%)
  • Geographic spread was reported as widespread to the Centers for Disease Control and Prevention (CDC)
  • PCR positive specimens were identified in the following districts: Northeastern, East Central, and Southwestern
  • Current circulating strains: Influenza A (H3), Influenza A (2009 H1), and Influenza B (Yamagata)
  • To view the latest trends in Alabama, click here
Alabama.png


http://www.alabamapublichealth.gov/Influenza/


*District of Columbia
https://dchealth.dc.gov/page/influenza-surveillance-and-reporting

Week 8 (February 18th, 2018 ? February 24th, 2018)
(All data are preliminary and may change as more reports are received)
SUMMARY
 209 new cases of influenza were reported by hospitals during this reporting period
 Zero pediatric deaths were reported during this period
 For the 2017-2018 influenza season to-date, 2359 positive Influenza cases have been reported
 For the 2017-2018 influenza season to-date, DC PHL has completed testing for 123 specimens
 Flu activity has decreased since previous week
https://dchealth.dc.gov/sites/defau...chments/Influenza Weekly Summary MMWR_8_2.pdf

*Puerto Rico
http://www.salud.gov.pr/Estadisticas...Influenza.aspx
Influenza Semana 8* // Temporada 2016 ? 2017 // Temporada 2017 ? 2018**
Casos totales reportados (incluye hospitalizaciones) 1,547 // 53,708 // 20,149
Regiones de salud con tasas m?s altas Ponce // Ponce // Ponce
Fatalidades 0 // 14 // 5
Hospitalizaciones 33 // 1,919 // 729
http://www.salud.gov.pr/Estadistica...Influenza/Informe Influenza Semana 8 2018.pdf

*Alaska
http://dhss.alaska.gov/dph/epi/id/pa...influenza.aspx
Updated to Mar 1
Influenza A decreasing, % Influenza B increasing, Activity increasing.
Month // cases
September // 0 * Last week this was 315, 2nd time this has happened.
October // 227
November // 378
December // 865
Jan // 866
Feb // 1,151

2 fatalities have been reported in the media.

*Arizona
http://www.azdhs.gov/preparedness/ep...veillance-home
ARIZONA ? INFLUENZA SUMMARY
Week 8 (2/18/2018 ? 2/24/2018)

Synopsis:
Influenza activity is elevated. Arizona reported Widespread Activity for week 8. Subscribe to the Flu & RSV report at
azhealth.gov/email.


Influenza activity highlights:

 The numbers in this report are based on processed cases. There are a large number of
reports that are still being processed.
 649 laboratory-confirmed cases of influenza were reported in the past week, from 15
counties. 26,001 cases have been reported this season, with laboratory-confirmed cases
identified in 15 counties.
 21,608 (83%) reports this season are influenza A, 4,092 (16%) are influenza B, and 301 (1%)
are of unknown type.
 New data from the death certificate database were not available. To date, 523 pneumonia and
influenza deaths were identified this season.
Two influenza-associated pediatric deaths have been reported for the 2017?2018 season
in Maricopa County residents. One case was PCR positive for influenza A (H3), and one for
influenza B/Victori
a.
http://www.azdhs.gov/documents/prep...illance/2017-2018/influenza-2017-18-week8.pdf

There have been 11 fatalities reported in the media.

*Arkansas
http://www.healthy.arkansas.gov/prog...fluenza#Weekly
Week Ending Saturday 02/24/2018

For Week 8, Arkansas reported ?Widespread? activity to the Centers for Disease Control and Prevention
(CDC) for geographic spread of influenza, and ?High? or 10/10 for ILI intensity.
 Since October 1, 2017, over 49,600 positive influenza tests have been reported to the ADH online database
by health care providers. In Week 8, 71 counties reported influenza cases. The majority of reports came
from White, Pulaski, Benton, Craighead, Jefferson, Stone, Washington, Faulkner, Sebastian, Independence,
Baxter, Bradley, and Lonoke.
 Among total flu antigen tests that can distinguish between influenza A and B virus types, 63 percent were
influenza A, and 37 percent were influenza B.
 There are 311 positive PCR flu tests this week from private labs: 68 influenza A, and 239 influenza B, 1
positive influenza A subtype H1N1, and 3 undetermined. At the ADH lab, 3 samples tested positive
influenza B subtype Yamagata, and 1 sample tested negative this week.
 About 5.4 percent of patients visiting emergency rooms this week were there for ILI. About 6.6 percent of
outpatient visits were for ILI.
 The average school absenteeism rate last week was 7.4 percent among public schools.
To date, 179 influenza-related deaths have been reported in Arkansas this flu season, 176 among adult
persons and 3 pediatric deaths.
CDC has reported a total of 97 pediatric deaths nationwide this season.
 Since October 1, 2017, 59 facilities including 47 nursing homes have reported influenza outbreaks.
 The proportion of deaths reported to the National Center for Health Statistics attributed to pneumonia and
influenza (P&I) was above the system-specific epidemic threshold.
 For Week 7, the geographic spread of influenza was reported as widespread in Puerto Rico and 48 states;
the District of Columbia, Guam and two states reported regional activity; and the U.S. Virgin Islands
reported no activities.
 You can report flu year-round and view the weekly influenza report during the influenza season at:
http://www.healthy.arkansas.gov/programs-services/topics/influenza.
You can also access the reporting website directly at: https://FluReport.ADH.Arkansas.gov
http://www.healthy.arkansas.gov/ima...rt_Week_Ending_Saturday_February_24,_2018.pdf

*California
https://www.cdph.ca.gov/Programs/CID...Influenza.aspx

Highlights (Week 8: February 18, 2018 ? February 24, 2018)
Statewide Activity: Widespread

 Deaths: 12 (Age 0-64)
 Outbreaks: 29
 Laboratory: 18.4% positive
 Outpatient ILI: Above expected levels
 Hospitalizations: Above expected levels
Click on images and links for more information
Key messages:
? Influenza activity is decreasing, but remains
elevated throughout California.
? Several more weeks of flu activity are expected
and may continue through the spring.
? Flu vaccination is still the best way to prevent
illness and flu-related hospitalizations

Twelve laboratory-confirmed influenza-associated fatalities were reported to CDPH
during Week 8 (Figure 6). To date, CDPH has received 214 reports of laboratoryconfirmed
influenza-associated deaths among patients <65 years of age during the
2017?2018 influenza season

https://www.cdph.ca.gov/Programs/CI...ry/Immunization/Week2017-1808_FINALReport.pdf

*- San Diego
http://www.sandiegocounty.gov/conten...uenzaWatch.pdf
Current Week 8 (ending 2/24/2018)
? 501 new influenza detections reported: Elevated level
? 3% influenza-like-illness (ILI) among emergency department visits: Expected level
? 14 new influenza-related deaths reported this week (tot 283)
? 10 new ICU cases reported this week
? 8% of deaths registered with pneumonia and/or influenza: Expected level

646 fatal cases from California have been reported in the media as follows;
Contra Costa: 7
Fresno: 1
Kern: 1
Long Beach: 1
LA: 206
Marin: 1
Monterey: 6
Orange: 12
Placer: 1
Riverside: 21
Sacramento: 3
San Benito: 2
San Bernadino: 3
San Diego: 283
San Joaquin: 3
San Luis Obispo: 15
San Mateo: 4
Santa Barbara: 12
Santa Clara: 5
Santa Cruz: 3
Shasta: 1
Stanislaus: 6
Solano: 7
Sonoma: 2
Tulare: 4
Ventura: 34
Yolo: 2


*Colorado
https://www.colorado.gov/pacific/cdphe/influenza-data
Synopsis for the Week Ending February 10th:

During the week ending Feb. 24, 2018, there were 88 additional hospitalized influenza cases reported. The total number of hospitalizations since the beginning of the 2017-18 season is now 3,690. This is higher than any end of season cumulative count of influenza-associated hospitalizations in Colorado.
Influenza-like illness reported by Kaiser Permanente (which includes providers from the North Central, Northeast, Northwest, South and South Central regions of the state) decreased from 2.84% to 2.72%. Influenza-like illness reported by Primary Care Partners (Northwest region) decreased from 2.84% to 2.74%.
Sentinel hospital labs (23 of 24 reporting) tested 2,953 specimens and 352 (11.9%) were positive for influenza.
There have been a total of 156 outbreaks associated with influenza for the 2017-18 influenza season. This is the highest number of influenza-associated outbreaks recorded in Colorado.
Mortality due to pneumonia and influenza is above the epidemic threshold and decreased from 10.6% to 7.0%. This is below national level of 9.5%.
One novel influenza A variant (H1N2v) was detected. An individual hospitalized with influenza in the San Luis Valley was found to be infected with a novel influenza A virus, H1N2v. This individual had exposure to swine at an agricultural event in the week preceding illness onset.
One pediatric death associated with influenza was reported for the 2017-18 influenza season. This was associated with influenza A (not subtyped) and had an onset of the week ending December 30, 2017.
https://docs.google.com/document/d/...bDLOojR7mL9x9DIctQ8jvbLd0yayioNMJwzs8u8p9/pub
2 fatal cases have been reported in the media.

*Connecticut
http://portal.ct.gov/DPH/Infectious-...and-Statistics

2017-2018 Influenza Season, Update for Week 8*
(Week ending Saturday, 02/24/2018)
Key Points
 Although national influenza activity has peaked in many areas, it remains high and widespread within most regions of the continental United States. The US Centers for Disease Control and Prevention (CDC) reported a continued high percentage (6.4%) of people seeing their health care provider with influenza-like-illness (ILI), although below the very high percentage (7.7%) observed during the peak weeks of both this current season and during the 2009 H1N1 pandemic.
 In Connecticut, influenza activity has apparently peaked, but remains high and widespread with a continuing high percentage of patients presenting to hospital emergency departments and outpatient providers with ILI, along with high numbers of flu-associated hospitalizations and deaths.
 Classification of Connecticut geographic activity remains at widespread**.
 Influenza A (H3N2) viruses continue to predominate within the US and Connecticut although more influenza A (H1N1) and influenza B viruses appear to be circulating.
 There is still time to obtain your flu vaccine and take other important steps to prevent influenza-related illness and hospitalization:
http://www.portal.ct.gov/DPH/Infectious-Diseases/Immunization/Seasonal-Influenza

A total of 2,161 hospitalized patients with laboratory-confirmed influenza admitted between August 27 and February 24, 2018 have been reported to date. Of these 2,161 reports, 1,347 were Type A (subtype unspecified), 382 were Type A (H3N2), 19 were Type A (2009 H1N1), 409 were influenza B virus, and 4 of unknown type. A total of 105 influenza-associated deaths (80 associated with flu A, 25 with flu B). Of these deaths, 85 were among patients greater than 65 years of age, 11 were 50-64 years of age, 5 were 25-49 years of age, 1 was between 19-24 years of age, and 3 were between ≤18 years of age. The current season total of 105 deaths is above the range of influenza-associated deaths (1-65) reported during the previous five seasons (Figures 4 & 5).
http://portal.ct.gov/-/media/Depart...eases/flu/stats/flusummary_1718_wk8.pdf?la=en

*Delaware
http://dhss.delaware.gov/dhss/dph/ep...uenzawkly.html
During MMWR Week 8, there were 893 laboratory-confirmed cases of influenza reported among Delaware residents, bringing
the total to 6,674 confirmed cases for the 2017-2018 season. Reports of influenza-like illness (ILI) received from participating
providers, facilities and institutions in Delaware show ILI is 2.7% compared with Delaware?s 2017-2018 baseline of 2.0%.
Nationally, ILI is 5.0% compared with the 2017-2018 national baseline of 2.2%.

24 fatalities have been reported.
http://dhss.delaware.gov/dhss/dph/epi/files/flu2018wk08.pdf

*Florida
http://www.floridahealth.gov/disease...nza/index.html
Week 8: February 18-24, 2018

State influenza and influenza-like illness (ILI) activity:
? In week 8, influenza activity decreased for the third consecutive week. Preliminary data
indicate influenza activity peaked during week 5 (ending February 3, 2018). While
decreases have been observed, influenza activity remains elevated statewide.
? No new influenza-associated pediatric deaths were confirmed. Six influenza-associated
pediatric deaths have been confirmed so far in the 2017-18 influenza season.

? Overall, deaths due to pneumonia and influenza were higher than expected. Increases in
deaths due to pneumonia and influenza are also expected over the coming weeks given the
amount of widespread illness in the preceding weeks. Most pneumonia and influenza
deaths continued to occur in people aged 65 years and older; of the deaths in people aged 64
years and younger, most occurred in people with underlying health conditions (65%).
? Twenty-seven outbreaks of influenza or ILI were reported: 14 with laboratory confirmation of
influenza and 13 ILI. As of week 8 (ending February 24, 2018), 447 outbreaks of influenza and
ILI have been reported since the start of the 2017-18 season.
? The Florida Department of Health is conducting enhanced surveillance of intensive-care unit
(ICU) patients aged <65 with laboratory-confirmed influenza. In week 8, 41 cases were
reported, bringing the total number of cases reported up to 241 since February 1, 2018. The
majority of these cases occurred in unvaccinated people with underlying health conditions.
http://www.floridahealth.gov/diseas...nza/_documents/2017-18/2018-w8-flu-review.pdf
12 fatalities have been reported in the media.

Georgia
https://dph.georgia.gov/flu-activity-georgia
Week 07 (February 11 ? February 17, 2018) Synopsis

During week 07 there was HIGH influenza-like illness intensity with
WIDESPREAD occurrences throughout Georgia.
? Outpatient Illness Surveillance (ILINet): The proportion of outpatient
visits for ILI was 11.9%, which is above the regional baseline of 1.9%.
? Geographic Spread of Influenza: The geographic spread of influenza in
Georgia was WIDESPREAD during week 07.
? Metro Area Hospitalizations: There were 91 hospitalizations due to influenza
infection during week 07. There have been 2,0341 hospitalizations due to
influenza so far this season.
? Influenza Related Deaths: As of week 07, there have been 98 confirmed
influenza-associated deaths (4 pediatric) for the 2017-2018 season.

? Viral Surveillance: Of the 1,341 specimens tested by Georgia clinical laboratories
reporting to the National Respiratory and Enteric Virus Surveillance
System (NREVSS) during week 07, 470 (35.1%) were positive for influenza.
There is a delay in Public Health Laboratories tested for week 07.
? Reported Influenza Outbreaks: There have been 155 influenza outbreaks
reported to DPH so far this season.
? RSV Viral Surveillance: Of the 440 specimens tested and reported by the
Georgia Public Health Laboratory (GPHL) and the National Respiratory and
Enteric Virus Surveillance System (NREVSS) collaborating laboratories during
week 07, the percent positive of ALL laboratory tests was 6.82%.
https://dph.georgia.gov/sites/dph.ge...t%20201807.pdf
118 fatalities have been reported in the media.

Hawaii
http://health.hawaii.gov/docd/diseas...influenza-flu/
WEEK 7: FEBRUARY 11, 2018?FEBRUARY 17, 2018
For week 7 of the current influenza season:
 5.9% (season to date: 4.4%) of the outpatient visits recorded by Hawaii sentinel providers were for ILI.
 ILI visits were higher than the historical baseline in Hawaii2,3
(i.e., outside the 95% confidence interval).
 Hawaii?s ILI outpatient visits were higher than the national baseline (2.2%)4
(i.e., outside the 95% confidence
interval) and comparable to the national ILI rate (6.4%) (i.e., inside the 95% confidence interval).
 Geographic Spread: Local Activity5
 ILI Cluster Activity: One cluster was reported to HDOH during week 7. This cluster occurred at a long term
care facility on Oahu. This cluster included cases of influenza B.

 The following reflects laboratory findings for week 7 of the 2017?18 influenza season:
o A total of 2,005 specimens have been tested statewide for influenza viruses (positive: 440 [21.9%]).
(Season to date: 33,401 tested [29.1% positive])
 1,196 (59.7%) were screened only by rapid antigen tests with no confirmatory testing
 809 (40.3%) underwent confirmatory testing (either RT-PCR or viral culture)
 1,565 (78.1%) were negative

For week 7 of the current influenza season:
 10.9% of all deaths that occurred in Honolulu during week 7 were related to pneumonia or influenza. For the
current season (season to date: 13.8%), there have been 1,684 deaths from any cause, 233 of which were due
to P&I.
 The P&I rate was comparable to the historical baseline in Hawaii
(i.e., inside the 95% confidence interval).
 National P&I data are backlogged by two weeks and current data for weeks 6?7 are unavailable at this time.
Based on NCHS mortality surveillance data available for week 59
(week ending February 3, 2018), 9.5% of
deaths that occurred nationally were due to P&I. This percentage is above the national epidemic threshold of
7.4% for week 5.
https://health.hawaii.gov/docd/files/2018/03/FLU_Influenza_Surveillance.pdf

1 fatality reported in the media.

*Idaho
http://healthandwelfare.idaho.gov/He...5/Default.aspx
Week #2018-08: February 18-24, 2018
Current Week Idaho Quick Stats
Percent of Outpatient Visits for Influenza-like Illness (ILI) Region 10: AK, ID, OR, WA 2.43%
(Region 10 Baseline 1.4%)
Percent Emergency Department Visits for ILI Syndrome 6.2% (Baseline 2.4%)
Virologic Surveillance Influenza B-Yamagata is predominating
Influenza-related deaths (season total) 5 new deaths (season total 78)
http://healthandwelfare.idaho.gov/P...fluenza Surveillance weekly update_2018 8.pdf

*Illinois
http://dph.illinois.gov/topics-servi...a/surveillance
Week 8: Week Ending Saturday, February 24, 2018
Current Week Quick Stats
Illinois Influenza Geographic Spread Widespread
Percent of Outpatient Visits for ILI 3.81% (baseline 1.8%)
Percent/Number of Influenza Positive Tests Current Week: 23.5% (355/1509); Season: 22.5% (5386/23938)
Influenza-Associated ICU Admissions Current Week: 77; Season: 1739
Influenza Outbreaks Current Week: 12; Season: 389
Influenza-Associated Pediatric Deaths (Season Total) 5

http://dph.illinois.gov/sites/defau...-2017-2018-Influenza-Report-Week-8-030118.pdf
24 deaths have been reported in the media.

*Indiana
http://www.in.gov/isdh/22104.htm
Influenza-like Illness - Week Ending February 24, 2018
ILI Geographic Distribution Widespread
ILI Activity Code High
Percent of ILI reported by sentinel outpatient providers 3.89%
Percent of ILI reported by emergency department chief
complaints 5.14%
Percent positivity of influenza specimens tested at ISDH 48%
Number of influenza-associated deaths this season 244
Number of long-term care facility outbreaks this season 102
Number of school-wide outbreaks this season 6
http://www.in.gov/isdh/files/Weekly Influenza Report-Week 8-2017-2018_v2.pdf

*Iowa
https://idph.iowa.gov/influenza/reports
For the week ending February 24, 2018 - Week 8

Quick Stats
Percent of influenza rapid test positive 27% (967/3561)
Percent of RSV rapid tests positive 22% (145/647)
Influenza-associated hospitalizations 73/3897 inpatients
Percent of outpatient visits for ILI 2.30% (baseline 1.9%)
Percent school absence due to illness 3.40%
Number of long-term care influenza outbreaks 3
Number of schools with ≥10% absence due to illness 9
Influenza-associated mortality -all ages (Cumulative) 185
Influenza-associated pediatric mortality (Cumulative) 0
https://idph.iowa.gov/Portals/1/use...Reports/IA Influenza Report - Week 8 2018.pdf

*Kansas
http://www.kdheks.gov/flu/surveillance.htm

KS.png


Chart based report at link. 114 direct cause deaths reported.

Kentucky
https://healthalerts.ky.gov/Pages/FluActivity.aspx
February 11 2018 ? February 17, 2018

Current Influenza Activity Level: Widespread for Tenth Consecutive Week

Update for week 7:
Lab Confirmed Influenza: 1,015 Cases
Number of Regions with Long Term Care Facility Outbreaks:
2 of 17 Regions
Number of Regions with
Confirmed Flu Cases: 17 of 17 Regions
Deaths Reported: 0 (under 18 years) 19 (18 years & older)
Number of Regions with Increased ILI Activity: 17 of 17 Regions
Number of Regions with Increased Influenza Activity: 17 of 17 Regions

Update Total for weeks 36-7:
Lab Confirmed Total: 7,302 Cases
Total Number of Long Term Care Facility Outbreaks: 102 Outbreaks
Total Number of Regions with Confirmed Flu Cases: 17 of 17 Regions
Total Deaths Reported: 4 (under 18 years) 147 (18 years & older)
https://healthalerts.ky.gov/Documents/Kentucky Influenza Activity Report - 2017-2018 Week 7.pdf
160 fatalities have been reported in the media.

Louisiana
http://new.dhh.louisiana.gov/index.cfm/page/1591
Week 8: 2/18/2018-2/24/2018
Influenza activity decreased again this week in Louisiana. Influenza A viruses
represent the majority of positives at the state public health laboratory but Influenza B
has been dominant the last 4 weeks from clinical laboratories. Positive tests reported
from clinical laboratories remain high (~20%). The most commonly reported other
respiratory viruses are Rhino/Enterovirus.

http://new.dhh.louisiana.gov/assets...enzaSurveillance/Weekly2018/Influenza1808.pdf

*Maine
http://www.maine.gov/dhhs/mecdc/infe...-updates.shtml
For MMWR week 8 (ending 2/14/2018)
New This Week
? Federal Flu Code: Widespread
? 113 new hospitalizations
? 6 new outbreaks
Surveillance Information ? Maine, 2017-2018 Influenza Season
? Number of ILINet Providers reporting: 18
o % of visits for Influenza-Like Illness (ILI): 1.93
? Syndromic Surveillance
o % of Emergency Room visits for ILI: 5.5
o % of Emergency Medical Services (EMS) runs for ILI: 1.7
? Influenza Hospitalizations
o # of hospitalizations: 113
? Electronic Death Reporting System
o % of deaths due to P&I: 17.7
Influenza Deaths
This number represents the number of individuals who had influenza specifically listed on their death certificate. This is likely an underrepresentation of the true burden as many influenza-associated deaths are due to secondary infections which is why the Pneumonia and Influenza (P&I) death information is on page 1 of this report.
? # deaths reported this week: 3
http://www.maine.gov/tools/whatsnew/attach.php?id=788723&an=2

*Maryland
http://phpa.dhmh.maryland.gov/influe...ages/Home.aspx
During the week ending February 24, 2018, influenza-like illness (ILI) intensity in Maryland
was HIGH and there was WIDESPREAD geographic activity. The proportion of outpatient
visits for ILI reported by Sentinel Providers and by Maryland Emergency Departments
decreased. The proportion of MRITS respondents reporting ILI decreased. Clinical
laboratories reported a decrease in the proportion of specimens testing positive for influenza.
Eighty-four specimens tested positive for influenza at the MDH lab. There were 253
influenza-associated hospitalizations. The cumulative season number of influenzaassociated
deaths among hospitalized adults was 46. Seven respiratory outbreaks were
reported to MDH
https://phpa.health.maryland.gov/in...ages/Home/Weekly Influenza Report_2018-08.pdf

4 fatalities have been reported in the media

*Massachusetts
http://blog.mass.gov/publichealth/category/flu-facts/
Week 8 Activity1 (representing geographic distribution): Widespread
Week 8 ILI Activity2 (representing intensity of ILI activity): 10 (High)
Mass.png


http://blog.mass.gov/publichealth/w...s/11/2018/03/Weekly-Flu-Report-03-02-2018.pdf

13 fatalities have been reported in the media

*Michigan
http://www.michigan.gov/mdhhs/0,5885...1722--,00.html
Week Ending February 24, 2018 │ WEEK 8
Activity: Widespread
Influenza-associated Pediatric Mortality
Two pediatric influenza deaths (A/H3) have been
confirmed by MDHHS to date for the 2017-2018 flu
season.
Nationally, one hundred fourteen (114)
influenza-associated pediatric deaths have been
reported thus far for the 2017-2018 flu season.

? Number of reports by region: 33 total [C(8), N(4), SE(15), SW(6)]
? Proportion of visits due to ILI: ↑ 5.0 % (regional baseline*: 1.8%)
? A total of 460 patient visits due to ILI were reported out of 9,222 office visits
http://www.michigan.gov/documents/MIFluFocus_1_5_06_146893_7.pdf

4 fatalities have been reported in the media

*Minnesota
http://www.health.state.mn.us/divs/i...ses/flu/stats/
During the week ending February 24, 2018 (Week 8),
surveillance indicators showed
regional geographic spread of influenza.
Since the start of the influenza season, five pediatric
influenza-related deaths
have been reported

http://www.health.state.mn.us/divs/idepc/diseases/flu/stats/flustats8.pdf

Mississippi
http://www.msdh.state.ms.us/msdhsite...0,199,777.html

During week 07 (02/11/18- 02/17/18), the overall state ILI rate (7.8%) decreased from
the previous week (8.5%), but was still above this time last year (6.4%).
Week 07 marks the third week in which the state ILI rate continued on a downward trend.

Between week 40 (week ending October 7th) and week 07 (week ending February 17th), 155 influenza
outbreaks were reported to MSDH. MSDH investigates all reported outbreaks, and of the 155
reported outbreaks, complete information was available for 137 of them. Twenty-four (17%) of the
outbreaks were attributed to influenza A (H1), 58 (41%) were due to influenza A (H3), 12 (9%) were
due to influenza A, unknown subtype, 31 (22%) were due to influenza B (Yamagata), two (1%) were
due to influenza B, unknown lineage, and 13 (9%) were due to an unknown influenza type. (Note:
Three outbreaks were associated with two different influenza strains.)
http://www.msdh.state.ms.us/msdhsite...urces/7557.pdf

5 fatalities have been reported in the media

*Missouri
http://health.mo.gov/living/healthco...za/reports.php
Week 8: February 18 ? 24, 2018

? The estimated influenza activity in Missouri is Widespread2
.
? During Week 8, a total of 5,064 laboratory-positive3 influenza cases (2,118 influenza A, 2,855 influenza B, and
91 untyped) were reported. A season-to-date total of 112,746 laboratory-positive influenza cases (76,866
influenza A, 34,308 influenza B, and 1,572 untyped) have been reported in Missouri as of Week 8. The influenza
type for reported season-to date cases includes 68% influenza A, 31% influenza B, and 1% untyped. Nineteen
laboratory-positive cases of influenza (eight influenza A (H3), two influenza A (H1N1), and nine influenza B
(Yamagata)) were reported by the Missouri State Public Health Laboratory (MSPHL) during Week 8.
? Influenza-like illness (ILI) activity was above baseline for both the Missouri Outpatient ILI Surveillance Network
(ILINet) and the hospital emergency room visit chief complaint data reported through ESSENCE. The reported
percentage of visits for ILI was 6.27% (Figure 5) and 5.04% (Figure 7) through ILINet and ESSENCE
respectively.

The ILI data from a small number of sites located in the Northwest Region of the state is
temporarily unavailable in ESSENCE. Therefore, the ILI data for the Northwest Region should be interpreted
with caution. The percentage of respiratory specimens testing positive for influenza in Missouri laboratories
reporting to the National Respiratory and Enteric Virus Surveillance System (NREVSS) decreased during Week 8
(Figure 6).
? One hundred and seventy-seven influenza-associated deaths have been reported in Missouri as of Week 8.

During Week 7, 113 deaths involving Pneumonia and Influenza (P&I) were reported to the Bureau of Vital
Records, resulting in a season-to-date total of 1,309 P&I associated deaths in Missouri.

? Sixty-six outbreaks of influenza or ILI have been reported and 14 influenza or ILI-associated school closures have
been reported in Missouri as of Week 8.
? Influenza activity remained elevated in the U.S. during Week 7. National influenza surveillance information is
prepared by CDC and is included in the weekly FluView report, which is available online at
http://www.cdc.gov/flu/weekly/fluactivitysurv.htm.
http://health.mo.gov/living/healthcondiseases/communicable/influenza/pdf/week81718.pdf

*Montana
http://dphhs.mt.gov/publichealth/cde...influenza.aspx
State Summary: Flu activity is defined as WIDESPREAD1
? Influenza activity continued during week 8 of 2018 with 652 new cases reported from 37 counties.
One pediatric death (<18 years) was reported.
? Season to date, 6,581 cases, 674 hospitalizations, and 33 deaths due to influenza have been
reported. Peak activity occurred during MMWR weeks 5?6.

? The most common influenza type identified this season is Influenza A H3. However, the
proportion of influenza B strains detected has increased over the last several weeks and is now at
49.6%. Influenza A H1N1 strains have also been identified (4.6%).
? During week 8, the proportion of healthcare provider and emergency room visits for influenza like
illness (ILI) decreased slightly.
? No new influenza outbreaks were reported during week 8. Season to date, 21 outbreaks have
been reported.
? RSV activity increased slightly during week 8 and remains above the 10% positivity threshold
(19.3%). Detailed RSV information is found on page 6.
http://dphhs.mt.gov/Portals/85/publ...tActivity/MontanaInfluenzaSummary_current.pdf

Nebraska
http://dhhs.ne.gov/publichealth/Documents/Report.pdf
Synopsis for Week Ending February 17th, 2018
SUMMARY STATS
Percent of influenza tests positive 28.59% (1577/5516)
Percent of RSV rapid tests positive 23.18% (305/1316)
Percent of outpatient visits for ILI 7.44% (regional baseline 1.8%)
Influenza-associated hospitalizations 376 inpatients
Percent of emergency department visits due to ILI 8.6%
Percent school absence due to illness 2.63%
Number of schools with ≥11% absence due to illness 15
Number of influenza outbreaks reported (Cumulative) 66
Influenza-associated mortality-all ages (Cumulative) 50
Influenza-associated pediatric mortality (Cumulative) 1

http://dhhs.ne.gov/publichealth/Documents/Report.pdf

*Nevada
Do not seem to be any state level reports.
Southern Nevada health district: https://www.southernnevadahealthdist...rveillance.php
Southern Nevada Weekly Influenza
Surveillance Snapshot
CDC Week 8, Feb 18, 2018 to Feb 24, 2018
Summary:
Influenza surveillance for Clark County, Nevada includes data collected from 15 local hospital emergency
rooms and 67 healthcare providers. During week 8, the influenza activity decreased in the United States
and the state of Nevada. In Clark County, as of 2/24/2018, the total number of confirmed cases of influenza
during the season was 1084, the proportion of emergency room (ER) visits for Influenza-like Illness (ILI)
decreased from 5.2% in week 7 to 4.6% in week 8. Approximately 53% of area ER visits for ILI were
children under 18 years of age. Influenza B was the dominant type circulating in Week 8. Twenty-five
influenza-associated deaths including 3 deaths of children under age 18 occurred this season in Clark
County.
Southern Nevada Health District will continue to update the public on the progression of the
season and encourage influenza vaccination for all persons 6 months of age and older
...
https://www.southernnevadahealthdist...eek08-2018.pdf

21 fatalities have been reported from Washoe county.
46 fatalities reported across those two counties alone.

*New Hampshire
http://www.dhhs.nh.gov/dphs/cdcs/influenza/activity.htm
Weekly Influenza Surveillance Report
Week Ending February 17, 2018
MMWR Week 7
NH.png

 12.8% of all deaths recorded in NH were reported as due to P&I. This is above the epidemic
threshold of 11.4%.
Twenty-nine adult influenza-related deaths have been identified so far this influenza season. The
counties of residence for the persons with an identified influenza-related death are Belknap, Carroll,
Cheshire, Coos, Grafton, Hillsborough, Merrimack, Rockingham, and Strafford. No pediatric
influenza-related deaths have been identified this influenza season. Due to delays in electronic filing
of death certificates, newly identified deaths in the last week may have occurred at any point during
the flu season and not necessarily within the last week.

https://www.dhhs.nh.gov/dphs/cdcs/in.../weeklyflu.pdf

*New Jersey
http://nj.gov/health/cd/statistics/flu-stats/
Week ending February 24, 2018 (MMWR week 8)
New Jersey Activity Level: HIGH
Current week last year: HIGH
Regional4 Data
Northwest: HIGH
Northeast: HIGH
Central West: HIGH
Central East: HIGH
South: HIGH

3 pediatric fatalities reported.
http://nj.gov/health/cd/documents/flu/surveillance/flu_report_week_08.pdf

*New Mexico
https://nmhealth.org/about/erd/ideb/isp/data/
Summary of Activity: Week 8
February 18th ? February 24th, 2018
▪ New Mexico ILI activity is currently 5.7% which is above the
national baseline of 2.2%
▪ US ILI is 5.0% which is above the national baseline of 2.2%
▪ Influenza activity is above the NM baseline of 2.6% in all five
health regions
▪ There was PCR confirmed lab activity from the Scientific
Laboratory Division (SLD) in all New Mexico health regions
▪ No new influenza outbreaks were reported this week

40 adult flu deaths reported
https://nmhealth.org/data/view/infectious/2108/

*New York
https://www.health.ny.gov/diseases/c.../surveillance/
During the week ending February 24, 2018
? Influenza activity level was categorized as geographically widespread2
. This is the 12th consecutive week that widespread
activity has been reported.
? There were 13,703 laboratory-confirmed influenza reports, a 25% decrease over last week.
? Of the 3,331 specimens submitted to WHO/NREVSS laboratories, 957 (28.90%) were positive for influenza.
? Of the 161 specimens tested at Wadsworth Center, 123 were positive for influenza. 12 were Influenza A (H1),
88 were influenza A (H3), and 23 were influenza B (Yamagata).
? Reports of percent of patient visits for influenza-like illness (ILI3
) from ILINet providers was 7.38%, which is above the
regional baseline of 3.10%.
? The number of patients hospitalized with laboratory-confirmed influenza was 1,702 a 21% decrease over last week.
? There were no influenza-associated pediatric deaths reported this week. There have been five influenza-associated
pediatric deaths reported this season.
? Preliminary results for influenza vaccine effectiveness (VE) are published on CDC?s website at https://www.cdc.gov/
mmwr/volumes/67/wr/mm6706a2.htm?s_cid=mm6706a2_w .
https://www.health.ny.gov/diseases/...illance/2017-2018/flu_report_current_week.pdf

16 fatalities have been reported in the media.

*North Carolina
http://www.flu.nc.gov/
WEEK 08: ENDING FEBRUARY 24, 2018
Statewide
Updates
Influenza-like illness (ILI) decreased during week 8.
The geographic spread of flu was WIDESPREAD for the week ending 2/24/2018.
Of the 39 samples submitted to the State Laboratory of Public Health (SLPH) for viral testing this week, 18
(46%) were positive; 11 were positive for influenza B, 4 were positive for influenza A(H3), 3 were positive
for influenza A(H1N1).
Hospital-based Public Health Epidemiologists (PHEs) reported 737 positive influenza results out of 2,851
samples tested during week 8 (ending 2/24/2018); 331 were positive for influenza A(unknown), 302 were
positive for influenza B, 74 were positive for influenza A(H3), and 30 were positive for influenza A(H1).

NC Influenza-Associated Deaths*
Influenza-Associated Deaths
This Week (02/18/2018 ? 02/24/2018)
18
Total Influenza-Associated Deaths
This Season (starting 10/01/2017)
253


http://flu.nc.gov/data/documents/flu1718.pdf

North Dakota
http://www.ndflu.com/
Through week 201808, the week ending 2/24/2018
Reported influenza cases continue to decline. Activity is still widespread. It is likely that the
influenza season peaked the week ending January 27, 2018, but influenza B activity continues to
increase. An increase in influenza B is typical for this part of the season.
Although activity is declining, it is likely widespread influenza activity will continue for some time, so
it is not too late to get vaccinated. Handwashing and staying home when you are sick are also
important for reducing the spread of influenza. It is recommended children with influenza be kept
out of school or child care until they have been fever free, without the use of fever-reducing
medication, for 24 hours regardless if the child is taking influenza antivirals.

20 fatalities reported
http://www.ndflu.com/DataStats/Docs/...entSummary.pdf

*Ohio
https://www.odh.ohio.gov/en/seasflu/Ohio-Flu-Activity
MMWR Week 8
February 18th - February 24th, 2018

Current Ohio Activity Level (Geographic Spread) ? Widespread

During MMWR Week 8, public health surveillance data
sources indicate decreased influenza-like illness (ILI)
activity in outpatient settings reported by Ohio?s sentinel
ILINet providers. Outpatient medical claims related to
influenza-like illness decreased again during MMWR Week
8. The percentage of emergency department visits with
patients exhibiting constitutional symptoms and fever and
ILI specified ED visits also decreased. Reported cases of
influenza-associated hospitalizations are above the
seasonal threshold*. There were 1,059 influenzaassociated
hospitalizations reported.
https://www.odh.ohio.gov/-/media/OD...Activity-Summary-201718-MMWR-Week-8.pdf?la=en

60 fatalities have been reported in the media.

*Oregon
http://public.health.oregon.gov/Dise...s/surveil.aspx
Data at a Glance
February 18?24, 2018 (Week 8)
Current Week (8) Previous Week (7)
Percentage of emergency department visits for ILI 3.3% 3.6%
Percentage positive influenza tests 17.7% 15.6%
Influenza-associated hospitalizations 41 32
Reported ILI/influenza outbreaks 2 2
Influenza-associated pediatric deaths 0 0
Percentage of ILI at sentinel providers 2.5% 1.5%
Respiratory Syncytial Virus (RSV) activity 18% 19%

Hospitalizations:
In Clackamas, Multnomah, and Washington counties, 41 influenza-associated hospitalizations were reported
during week 8 of 2018, for a total of 1,358 cases reported during this season; 959 (71%) cases were Flu
A, 398 were flu B (29%), 1 was coinfected with flu A and B.
Of 256 subtyped flu A cases 123 (48%) were A/2009 H1N1, and 133 (52%) were A/H3N2. Of 72 subtyped
flu B cases 71 (99%) were B/Yamagata and 1 (1%) was B/Victoria.
http://www.oregon.gov/oha/PH/DISEAS...NCEDATA/INFLUENZA/Documents/data/FluBites.pdf

5 fatalities have been reported in the media.

*Oklahoma
https://www.ok.gov/health/Disease,_P..._Flu_View.html [TABLE="border: 0, cellpadding: 0, cellspacing: 0, width: 920"]
[TR]
[TD]Influenza-Associated Hospitalization Surveillance for 2017-2018 Season
Number of Reported Influenza-Associated Hospitalizations and Deaths, Oklahoma [TABLE="border: 0, cellpadding: 0, cellspacing: 0, width: 694"]
[TR]
[TD]Number of New Hospitalizations Reported with Testing between
Feb. 21 ?
Feb. 27, 2018[/TD]
[TD]Number of New and Previously Reported Hospitalizations with Testing between
Sept. 1, 2017 ? Feb. 20, 2018[/TD]
[TD]Cumulative Hospitalizations and/or Deaths Since
Sept. 1, 2017[/TD]
[TD]Number of New Deaths Reported with Testing between
Feb. 21 ?
Feb. 27, 2018[/TD]
[TD]Number of New and Previously Reported Deaths with Testing between
Sept. 1, 2017 ? Feb. 20, 2018[/TD]
[TD]Cumulative Deaths since Sept. 1, 2017[/TD]
[/TR]
[TR]
[TD]157[/TD]
[TD]3,962[/TD]
[TD]4,119[/TD]
[TD]0[/TD]
[TD]194[/TD]
[TD]194[/TD]
[/TR]
[/TABLE]
Sentinel Surveillance Summary for February 18 through February 24, 2018
  • The percentage of outpatient visits meeting the criteria for ILI[SUP]1[/SUP] was 5.3% (445/8,437).
  • Thirty percent of rapid influenza tests performed by sentinel sites were positive; 61% were positive for influenza B.
  • Sentinel surveillance data indicates that overall influenza activity in Oklahoma peaked during week ending January 20, 2018. However, we are seeing a second wave of influenza activity due to influenza B.
  • Seven percent of RSV tests performed by sentinel laboratories were positive.
[/TD]
[/TR]
[/TABLE]

*Pennsylvania
http://www.health.pa.gov/My%20Health...x#.WggyTmiPKUk

​Flu Activity Code: WIDESPREAD (week 8 ending February 24, 2018)
Summary:
- Laboratory, hospital emergency department, and sentinel medical provider data all indicate that the flu activity decreased slightly from past weeks, it is likely the influenza activity has peaked.
- There is usually co-circulation of influenza viruses during any one season and it?s not uncommon for there to be second waves of influenza B activity during an influenza season.
- Flu activity for MMWR week 8 has decreased in all the state regions.
- Pennsylvania?s current influenza activity code is "WIDESPREAD"
- Fifteen influenza associated deaths were reported during week 8 and total number of reported influenza associated death is 150, season to date, including five pediatric cases


*Rhode Island
http://www.health.ri.gov/data/flu/
Geographic Spread: Widespread

Last updated: February 28, 2018

Graph based report at link. Activity high, decreasing

34 fatalities reported in the media.

*South Carolina
http://www.scdhec.gov/Health/Disease...s/Flu/FluData/
MMWR Week 8: February 18 to February 24, 2018

Geographic Spread
South Carolina reported widespread
activity this week. This is the eleventh
consecutive week at widespread activity.

Influenza-Associated Hospitalizations
and Deaths
A total of 191 influenza-associated hospitalizations were
reported by 53 hospitals. The cumulative hospitalization rate is
80.4 per 100,000. There were 16 laboratory-confirmed influenzaassociated
deaths reported; however, 7 deaths occurred in
previous weeks. The cumulative mortality rate is 3.4 per 100,000.
Compared to the previous week, the number of reported
hospitalizations decreased by 184 (49.1%) and number of
reported deaths decreased by 2 (18.2%). In the current flu
season, there have been 3,989 influenza-associated
hospitalizations and 167 influenza-associated deaths reported.


Virologic Surveillance
A total of 6,332 influenza cases (6,186 positive rapid antigen
detection tests; 146 lab-confirmed tests) were reported from 43
counties representing all four DHEC Public Health regions.
Influenza B was most frequently reported by clinical labs.
Compared to the previous week, this is a decrease of 7,968
cases (55.7%). In the current flu season, there have been
121,208 influenza cases (118,184 positive rapid antigen
detection tests; 3,024 lab-confirmed tests) reported.

Influenza-Like Illness Surveillance
The percent of patient visits to sentinel providers for an
influenza-like illness (ILI) was 8.04%, which is above South
Carolina?s baseline (3.13%). Compared to the previous week, this
is a decrease of 3.95%.
The ILI activity level was high
http://www.scdhec.gov/Health/docs/HAN/Flu/Flu Watch MMWR Week 8.pdf

*South Dakota
http://doh.sd.gov/diseases/infectiou...veillance.aspx

SD.png

http://doh.sd.gov/documents/diseases/flu/Week8.pdf


Tennessee
https://www.tn.gov/health/cedep/immu...tennessee.html

for the Week of Feb. 11-17, 2018 (Week 7)

Influenza activity in Tennessee
? The percentage of outpatients with ILI visiting the state's Sentinel clinic
sites was 5.51%. The CDC's baseline rate is 2.2%.
? 25.7% of specimens tested positive for influenza viruses .
? 63 of 95 Tennessee counties have had at least one confirmed influenzapositive
result in recent weeks.
? Influenza-related deaths reported in 2017-18 season: 10 pediatric and
1 pregnancy-associated

https://www.tn.gov/content/dam/tn/he...t_2018_07c.pdf

33 fatalities have been reported in the media.

*Texas
http://www.dshs.texas.gov/IDCU/disea...ity-Report.xls
2017?2018 Season/2018 MMWR Week 08
Summary
Influenza activity remains high across the state of Texas although activity has slightly decreased over the past few weeks. It appears that influenza activity peaked in late January. Compared to the previous week, the percentage of patient visits due to influenza-like illness (ILI) and the percentage of specimens testing positive for influenza reported by public health and hospital laboratories has marginally decreased. One influenza-associated pediatric death was reported. Three ILI or influenza-associated outbreaks were reported. In addition to flu, other respiratory viruses?especially rhinovirus/enterovirus?were detected in Texas during week 08.

Five thousand two hundred and twenty-eight P&I deaths have been reported in Texas during the 2017-2018 influenza season.

One influenza-associated pediatric death was reported in week 08 in a 15-year-old resident of HSR 8 with no underlying health conditions. A specimen collected from the child was positive for influenza B by rapid test. The child did not receive the influenza vaccine for the current season.
Eight influenza-associated pediatric death has been reported in Texas during the 2017-2018 influenza season. Cases of influenza-associated pediatric mortality (children <18 years of age) are reportable year-round and by law in Texas.
http://www.dshs.texas.gov/IDCU/dise...-Surveillance-Activity-Report/18Wk08Mar02.pdf

216 fatalities have been confirmed as follows;
Bexar: 2
Collin: 14
Dallas: 72
Denton: 12
El Paso: 15
Galveston: 2
Harris (including Houston): 7
Hays: 1
McLennan: 2
Midland: 7
Montgomery: 3
Parker: 1
Tarrant: 33
Travis (including Austin): 45

*Utah
http://health.utah.gov/epi/diseases/...nce/index.html
This report contains data through the week ending 02/24/2018 (MMWR week 8).
Current activity high, increasing
http://health.utah.gov/epi/diseases/influenza/surveillance/2017-2018/022418.pdf
16 fatalities have been reported in the media

Vermont
http://healthvermont.gov/immunizatio...d-surveillance
February 11, 2018 ? February 17, 2018 ǀ MMWR WEEK 7

Influenza activity was categorized as
Widespread for MMWR Week 7
 Decreased levels of Influenza-like Illness
(ILI) activity seen in emergency
departments
 Of the total emergency room visits,
6.6% were due to ILI
 Decreased levels of ILI activity reported by
outpatient providers
 Sentinel providers reported 5.7% of
patients had ILI
 Vermont Department of Health
Laboratory reported 20 positive flu tests
 National Respiratory and Enteric Virus
Surveillance System reported 180
positive flu tests
 9 Outbreaks
 4 outbreak at a LTCFs: 3 in the
Northwest and 1 in the Southeast
Region
 3 outbreaks at schools: 1 in the
Northeast, 1 in the Southwest,
and 1 in the Northwest Region
 1 outbreak at a correctional
facility in the Southeast Region
 1 outbreak at a child care facility
in the Northwest Region
http://www.healthvermont.gov/sites/d...20Week%207.pdf

*Virginia
http://www.vdh.virginia.gov/epidemio...-surveillance/
Virginia Influenza Activity Level: Widespread
Data From Week Ending Date: 2/24/2018
Week Number: 8
Activity declining
Graph based weekly report here: http://www.vdh.virginia.gov/content/...nza-Report.pdf

3 fatalities have been reported in the media.

West Virginia
http://www.dhhr.wv.gov/oeps/disease/...rveillance.pdf

Graph based report at link updated to February 16.
activity rising.

2 fatalities reported in the media

Wisconsin
https://www.dhs.wisconsin.gov/influenza/index.htm
Week Ending February 17, 2018

Predominant Virus of the Week:
Influenza A/H3N2
CURRENT ALERTS:
 Influenza activity has peaked, although high activity can
be expected for several more weeks. Record number of
hospitalizations, admissions to ICU and mechanical
ventilation cases have occurred. Influenza B and
A/H1N1 are becoming more common.
https://www.dhs.wisconsin.gov/influe...nza-report.pdf

*Wyoming
https://health.wyo.gov/publichealth/...uenza-reports/

Week 6 report available here: https://health.wyo.gov/wp-content/uploads/2018/03/Summary-2018-06-.pdf

11 fatalities reported in the media

*Washington
http://www.doh.wa.gov/DataandStatist...rveillanceData
Week 08: February 18, 2018-February 24, 2018

State Summary: Flu activity remains elevated
? Two hundred lab-confirmed influenza deaths have been reported for the 2017-2018 season to date.
? One hundred and seventy three influenza-like illness outbreaks in long term care facilities have been reported
for the 2017-2018 season to date.
? During week 08, 2.3 percent of visits among Influenza-like illness Network participants were for influenza-like
illness, above the baseline of 1.1 percent.
? During week 08, 19.3 percent of specimens tested by WHO/NREVSS collaborating laboratories in Washington
were positive for influenza.
? Influenza A and influenza B were reported during week 08.
https://www.doh.wa.gov/Portals/1/Doc...-FluUpdate.pdf

*National
https://www.cdc.gov/flu/weekly/index.htm
2017-2018 Influenza Season Week 8 ending February 24, 2018

All data are preliminary and may change as more reports are received.

Synopsis:
During week 8 (February 18-24, 2018), influenza activity decreased in the United States.

Viral Surveillance: While influenza A(H3) viruses continue to be predominant this season, during week 8 the overall proportion of influenza A viruses is declining and the proportion of influenza B viruses is increasing. The percentage of respiratory specimens testing positive for influenza in clinical laboratories decreased.
Pneumonia and Influenza Mortality: The proportion of deaths attributed to pneumonia and influenza (P&I) was above the system-specific epidemic threshold in the National Center for Health Statistics (NCHS) Mortality Surveillance System.
Influenza-associated Pediatric Deaths: Seventeen influenza-associated pediatric deaths were reported.
Influenza-associated Hospitalizations: A cumulative rate of 81.7 laboratory-confirmed influenza-associated hospitalizations per 100,000 population was reported.
Outpatient Illness Surveillance:The proportion of outpatient visits for influenza-like illness (ILI) was 5.0%, which is above the national baseline of 2.2%. All 10 regions reported ILI at or above region-specific baseline levels. New York City, the District of Columbia, and 32 states experienced high ILI activity; Puerto Rico and nine states experienced moderate ILI activity; six states experienced low ILI activity; and three states experienced minimal ILI activity.
Geographic Spread of Influenza:The geographic spread of influenza in Puerto Rico and 45 states was reported as widespread; Guam and two states reported regional activity; the District of Columbia and three states reported local activity; and the U.S. Virgin Islands reported no activity.

https://www.cdc.gov/flu/weekly/index.htm
 
The CDC has tracked 9,402 Influenza fatalities from Weeks 40-7
Week Fatalities
40: 16
41: 17
42: 27
43: 23
44: 36
45: 45
46: 49
47: 48
48: 79
49: 115
50: 157
51: 347
52: 634
1: 1,103
2: 1,408
3: 1,458
4: 1,216
5: 1,085
6: 886
7: 653

Total: 9,402


Comparison of confirmed CDC fatalities Weeks 40-7 with corresponding period from previous years (note figures for 2017-18 are preliminary and are likely to increase)
2017-18: 9,402
2016-17: 3,066
2015-16: 624
2014-15: 6,905
2013-14: 3,309
2012-13: 3,759
https://gis.cdc.gov/grasp/fluview/mortality.html
 
Last edited:
The CDC has tracked 10,418 Influenza fatalities from Weeks 40-8
Week Fatalities
40: 16
41: 18
42: 27
43: 23
44: 36
45: 45
46: 50
47: 48
48: 80
49: 116
50: 158
51: 350
52: 638
1: 1,117
2: 1,443
3: 1,501
4: 1,286
5: 1,145
6: 1,004
7: 822
8: 495

Total: 10,418


Comparison of confirmed CDC fatalities Weeks 40-8 with corresponding period from previous years (note figures for 2017-18 are preliminary and are likely to increase)
2017-18: 10,418
2016-17: 3,672
2015-16: 811
2014-15: 7,190
2013-14: 3,518
2012-13: 3,926

USInfluenzaMortality.png
Data from:
https://gis.cdc.gov/grasp/fluview/mortality.html
 
The CDC has tracked 11,207 Influenza fatalities from Weeks 40-9
Week Fatalities
40: 16
41: 18
42: 27
43: 23
44: 36
45: 45
46: 50
47: 48
48: 81
49: 116
50: 159
51: 352
52: 646
1: 1,123
2: 1,454
3: 1,526
4: 1,307
5: 1,171
6: 1,038
7: 908
8: 629
9: 436

Total: 11,207


Comparison of confirmed CDC fatalities Weeks 40-9 with corresponding period from previous years (note figures for 2017-18 are preliminary and are likely to increase)
2017-18: 11,207
2016-17: 4,207
2015-16: 1,068
2014-15: 7,380
2013-14: 3,679
2012-13: 4,074
USInfluenzaMortality.png

Data from: https://gis.cdc.gov/grasp/fluview/mortality.html
 
The CDC has tracked 11,898 Influenza fatalities from Weeks 40-10
Week Fatalities
40: 16
41: 18
42: 27
43: 23
44: 36
45: 45
46: 51
47: 48
48: 82
49: 116
50: 159
51: 355
52: 658
1: 1,131
2: 1,464
3: 1,534
4: 1,325
5: 1,196
6: 1,061
7: 960
8: 720
9: 554
10: 319

Total: 11,898


Comparison of confirmed CDC fatalities Weeks 40-10 with corresponding period from previous years (note figures for 2017-18 are preliminary and are likely to increase)
2017-18: 11,898
2016-17: 4,676
2015-16: 1,362
2014-15: 7,539
2013-14: 3,804
2012-13: 4,177

USInfluenzaMortality.png

Data from: https://gis.cdc.gov/grasp/fluview/mortality.html
 
The CDC has tracked 12,443 Influenza fatalities from Weeks 40-11
Week Fatalities
40: 16
41: 18
42: 27
43: 23
44: 36
45: 45
46: 51
47: 48
48: 82
49: 116
50: 161
51: 356
52: 663
1: 1,135
2: 1,468
3: 1,548
4: 1,341
5: 1,222
6: 1,088
7: 987
8: 746
9: 601
10: 385
11: 280

Total: 12,443


Comparison of confirmed CDC fatalities Weeks 40-11 with corresponding period from previous years (note figures for 2017-18 are preliminary and are likely to increase)
2017-18: 12,443
2016-17: 5,053
2015-16: 1,713
2014-15: 7,678
2013-14: 3,897
2012-13: 4,286

USInfluenzaMortality.png

Data from: https://gis.cdc.gov/grasp/fluview/mortality.html
 
The CDC has tracked 12,994 Influenza fatalities from Weeks 40-12
Week Fatalities
40: 16
41: 18
42: 28
43: 23
44: 36
45: 45
46: 51
47: 48
48: 82
49: 116
50: 161
51: 356
52: 667
1: 1,141
2: 1,478
3: 1,563
4: 1,354
5: 1,247
6: 1,122
7: 1,029
8: 784
9: 628
10: 420
11: 353
12: 228

Total: 12,994


Comparison of confirmed CDC fatalities Weeks 40-12 with corresponding period from previous years (note figures for 2017-18 are preliminary and are likely to increase)
2017-18: 12,994
2016-17: 5,372
2015-16: 2,008
2014-15: 7,799
2013-14: 3,913
2012-13: 4,369

Inf. Mortality.png

Data from: https://gis.cdc.gov/grasp/fluview/mortality.html
 
The CDC has tracked 13,314 Influenza fatalities from Weeks 40-13
Week Fatalities
40: 16
41: 18
42: 28
43: 23
44: 36
45: 45
46: 51
47: 48
48: 82
49: 117
50: 161
51: 356
52: 668
1: 1,142
2: 1,484
3: 1,567
4: 1,360
5: 1,257
6: 1,132
7: 1,034
8: 790
9: 641
10: 437
11: 375
12: 270
13: 176

Total: 13,314
Inf. Mortality.png


Comparison of confirmed CDC fatalities Weeks 40-13 with corresponding period from previous years (note figures for 2017-18 are preliminary and are likely to increase)
2017-18: 13,314
2016-17: 5,703
2015-16: 2,290
2014-15: 7,896
2013-14: 3,978
2012-13: 4,425

Data from: https://gis.cdc.gov/grasp/fluview/mortality.html
 
Last edited:
The CDC has tracked 13,805 Influenza fatalities from Weeks 40-14
Week Fatalities
40: 16
41: 18
42: 28
43: 23
44: 36
45: 45
46: 51
47: 48
48: 82
49: 117
50: 162
51: 356
52: 669
1: 1,148
2: 1,500
3: 1,580
4: 1,394
5: 1,282
6: 1,152
7: 1,063
8: 809
9: 653
10: 447
11: 392
12: 302
13: 224
14: 208

Total: 13,805

Inf. Mortality.png

Comparison of confirmed CDC fatalities Weeks 40-14 with corresponding period from previous years (note figures for 2017-18 are preliminary and are likely to increase)
2017-18: 13,805
2016-17: 5,967
2015-16: 2,540
2014-15: 7,996
2013-14: 4,033
2012-13: 4,475

Data from: https://gis.cdc.gov/grasp/fluview/mortality.html
 
The CDC has tracked 13,959 Influenza fatalities from Weeks 40-15
Week Fatalities
40: 16
41: 18
42: 28
43: 23
44: 36
45: 45
46: 51
47: 48
48: 82
49: 117
50: 162
51: 357
52: 669
1: 1,148
2: 1,500
3: 1,582
4: 1,395
5: 1,282
6: 1,152
7: 1,063
8: 810
9: 654
10: 447
11: 392
12: 303
13: 225
14: 226
15: 128

Total: 13,959 Inf. Mortality.png


Comparison of confirmed CDC fatalities Weeks 40-15 with corresponding period from previous years (note figures for 2017-18 are preliminary and are likely to increase)
2017-18: 13,959
2016-17: 6,175
2015-16: 2,736
2014-15: 8,071
2013-14: 4,107
2012-13: 4,510

Data from: https://gis.cdc.gov/grasp/fluview/mortality.html
 
Last edited:
The CDC has tracked 14,256 Influenza fatalities from Weeks 40-16
Week Fatalities
40: 16
41: 19
42: 28
43: 23
44: 36
45: 45
46: 51
47: 48
48: 82
49: 117
50: 163
51: 358
52: 669
1: 1,148
2: 1,506
3: 1,585
4: 1,406
5: 1,288
6: 1,170
7: 1,086
8: 828
9: 675
10: 460
11: 402
12: 308
13: 236
14: 254
15: 166
16: 83

Total: 14,256

Inf. Mortality.png

Comparison of confirmed CDC fatalities Weeks 40-16 with corresponding period from previous years (note figures for 2017-18 are preliminary and are likely to increase)
2017-18: 14,256
2016-17: 6,338
2015-16: 2,884
2014-15: 8,134
2013-14: 4,162
2012-13: 4,532

Data from: https://gis.cdc.gov/grasp/fluview/mortality.html
 
The CDC has tracked 14,460 Influenza fatalities from Weeks 40-17
Week: Fatalities
40: 16
41: 18
42: 28
43: 23
44: 36
45: 45
46: 50
47: 48
48: 82
49: 117
50: 163
51: 358
52: 669
1: 1,150
2: 1,507
3: 1,592
4: 1,414
5: 1,293
6: 1,175
7: 1,098
8: 829
9: 677
10: 468
11: 406
12: 317
13: 243
14: 264
15: 183
16: 114
17: 77

Total: 14,460
Inf. Mortality.png


Comparison of confirmed CDC fatalities Weeks 40-17 with corresponding period from previous years (note figures for 2017-18 are preliminary and are likely to increase)
2017-18: 14,460
2016-17: 6,426
2015-16: 3,011
2014-15: 8,184
2013-14: 4,216
2012-13: 4,559

Data from: https://gis.cdc.gov/grasp/fluview/mortality.html
 
The CDC has tracked 14,609 Influenza fatalities from Weeks 40-18
Week: Fatalities
40: 16
41: 18
42: 28
43: 23
44: 36
45: 45
46: 50
47: 48
48: 83
49: 118
50: 163
51: 359
52: 669
1: 1,150
2: 1,510
3: 1,595
4: 1,414
5: 1,296
6: 1,181
7: 1,104
8: 830
9: 686
10: 472
11: 406
12: 319
13: 248
14: 268
15: 188
16: 127
17: 97
18: 62

Total: 14,609


Comparison of confirmed CDC fatalities Weeks 40-18 with corresponding period from previous years (note figures for 2017-18 are preliminary and are likely to increase)
2017-18: 14,609
2016-17: 6,489
2015-16: 3,102
2014-15: 8,212
2013-14: 4,269
2012-13: 4,569

Data from: https://gis.cdc.gov/grasp/fluview/mortality.html
 
The CDC has tracked 14,853 Influenza fatalities from Weeks 40-19
Week: Fatalities
40: 16
41: 18
42: 28
43: 23
44: 36
45: 45
46: 50
47: 48
48: 83
49: 118
50: 164
51: 359
52: 669
1: 1,155
2: 1,523
3: 1,611
4: 1,429
5: 1,323
6: 1,202
7: 1,132
8: 856
9: 694
10: 477
11: 414
12: 324
13: 253
14: 268
15: 193
16: 131
17: 102
18: 78
19: 31

Total: 14,853
Inf. Mortality.png


Comparison of confirmed CDC fatalities Weeks 40-19 with corresponding period from previous years (note figures for 2017-18 are preliminary and are likely to increase)
2017-18: 14,853
2016-17: 6,538
2015-16: 3,176
2014-15: 8,234
2013-14: 4,308
2012-13: 4,580

Data from: https://gis.cdc.gov/grasp/fluview/mortality.html
 
Last edited:
The CDC has tracked 14,913 Influenza fatalities from Weeks 40-20
Week: Fatalities
40: 16
41: 18
42: 28
43: 23
44: 36
45: 45
46: 50
47: 48
48: 83
49: 118
50: 164
51: 359
52: 669
1: 1,155
2: 1,523
3: 1,611
4: 1,430
5: 1,324
6: 1,204
7: 1,133
8: 859
9: 696
10: 478
11: 416
12: 325
13: 255
14: 274
15: 194
16: 135
17: 104
18: 80
19: 36
20: 24

Total: 14,913

Inf. Mortality.png

Comparison of confirmed CDC fatalities Weeks 40-20 with corresponding period from previous years (note figures for 2017-18 are preliminary and are likely to increase)
2017-18: 14,913
2016-17: 6,591
2015-16: 3,210
2014-15: 8,248
2013-14: 4,335
2012-13: 4,584

Data from: https://gis.cdc.gov/grasp/fluview/mortality.html
 
Back
Top