• FluTrackers.com Inc. does not provide medical advice. Information on this web site is collected from various internet resources, and the FluTrackers board of directors makes no warranty to the safety, efficacy, correctness or completeness of the information posted on this site by any author or poster. The information collated here is for instructional and/or discussion purposes only and is NOT intended to diagnose or treat any disease, illness, or other medical condition. Every individual reader or poster should seek advice from their personal physician/healthcare practitioner before considering or using any interventions that are discussed on this website. By continuing to access this website you agree to consult your personal physican before using any interventions posted on this website, and you agree to hold harmless FluTrackers.com Inc., the board of directors, the members, and all authors and posters for any effects from use of any medication, supplement, vitamin or other substance, device, intervention, etc. mentioned in posts on this website, or other internet venues referenced in posts on this website.
  • We are not asking for any donations. Do not donate to any entity who says they are raising funds for us.

US FluView - Weekly Surveillance Flu report 2022/2023 season - for trend analysis

Weekly U.S. Influenza Surveillance Report


Print
Updated August 11, 2023

fluview-banner2.jpg


2022-2023 Influenza Season

Week 31 ending August 5, 2023

All data in this report are preliminary and may change as more reports are received.

A description of the CDC influenza surveillance system, including methodology and detailed descriptions of each data component, is available on the surveillance methods page.

Additional information on the current and previous influenza seasons for each surveillance component is available on FluView Interactive. U.S. Virologic Surveillance

Clinical Laboratories


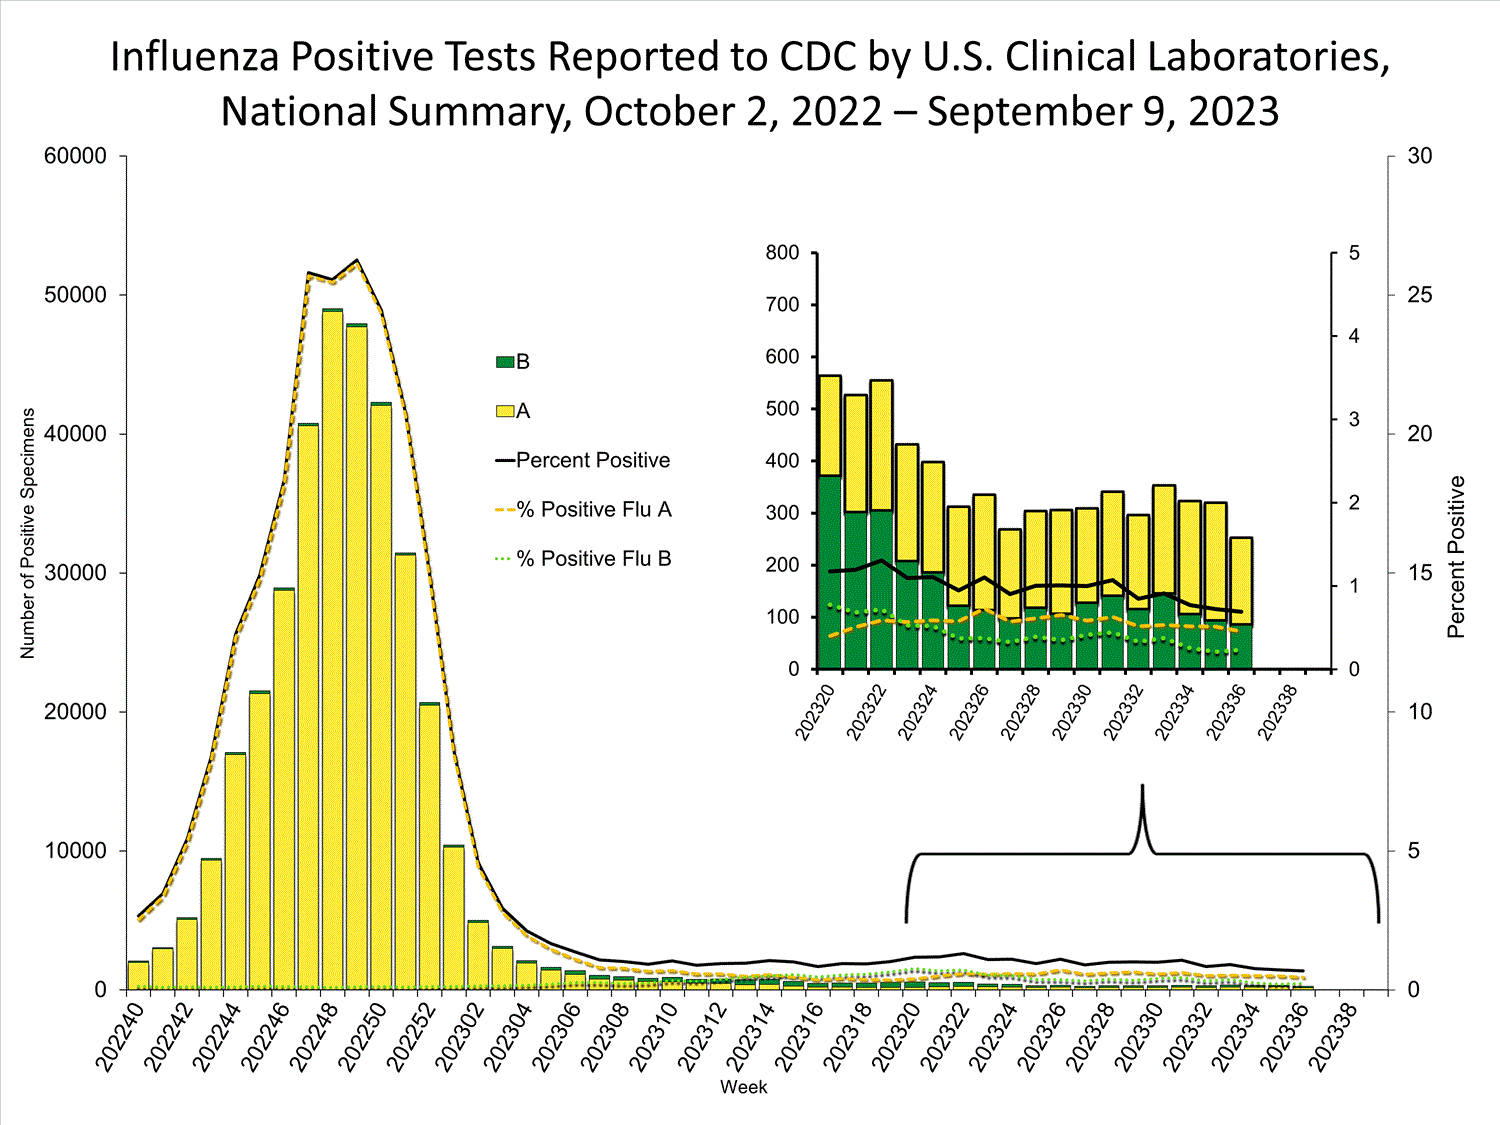
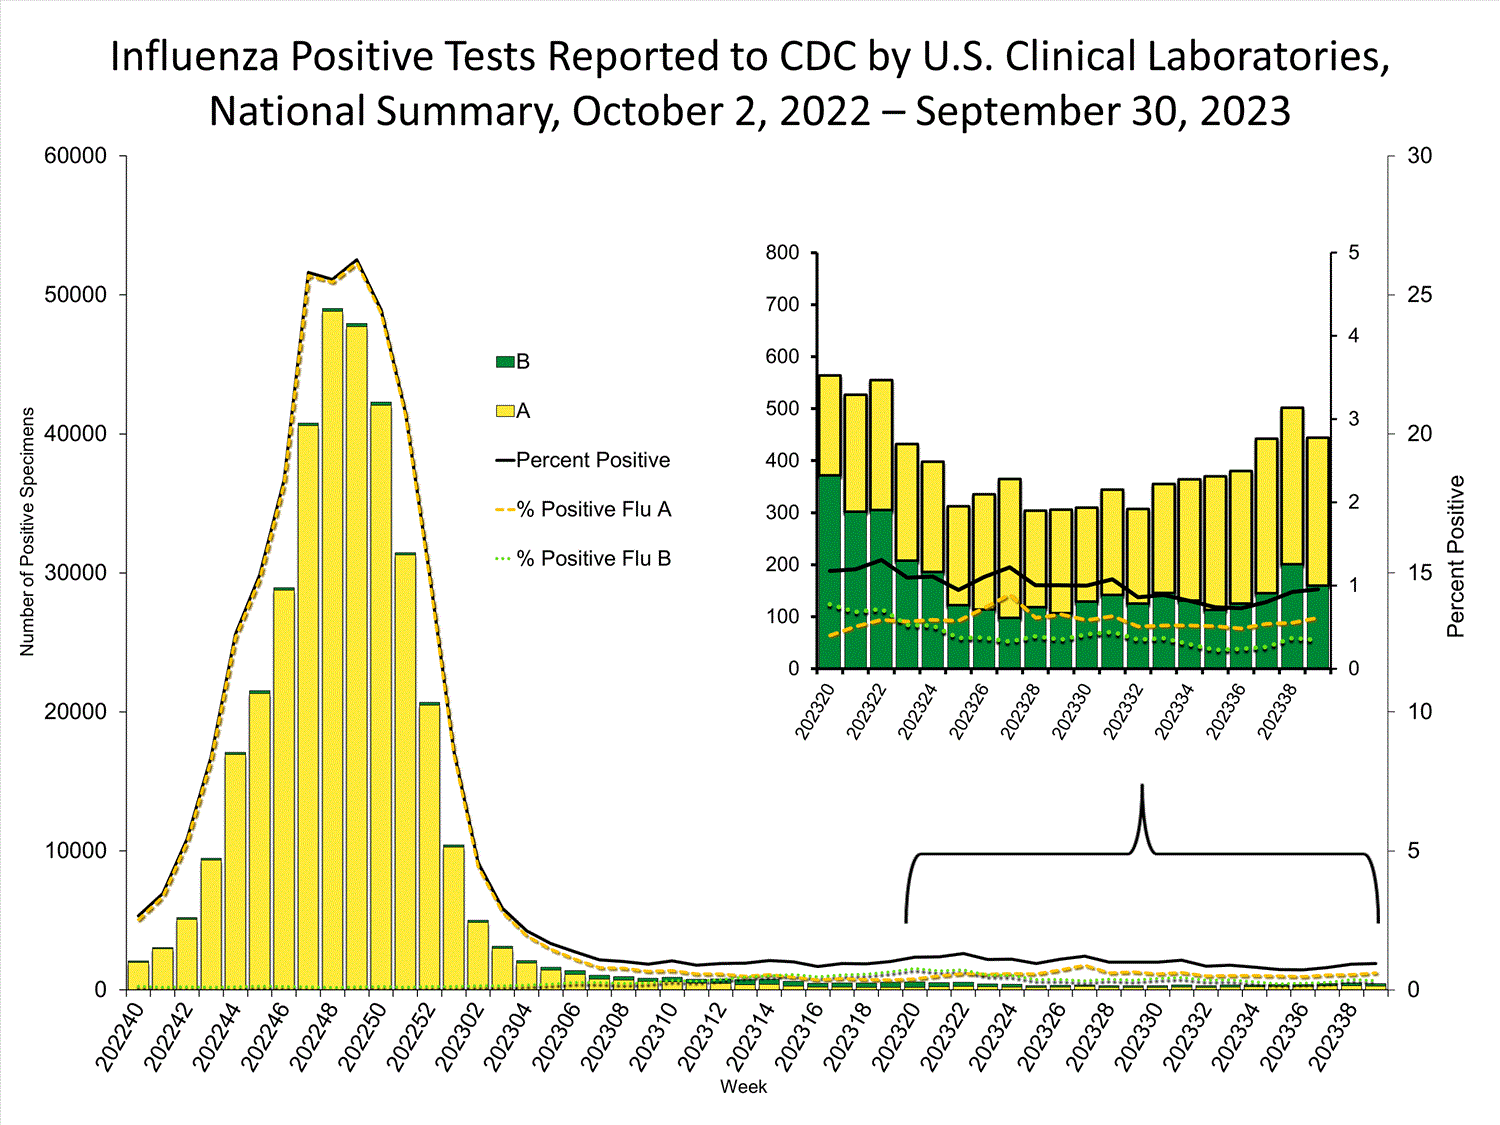
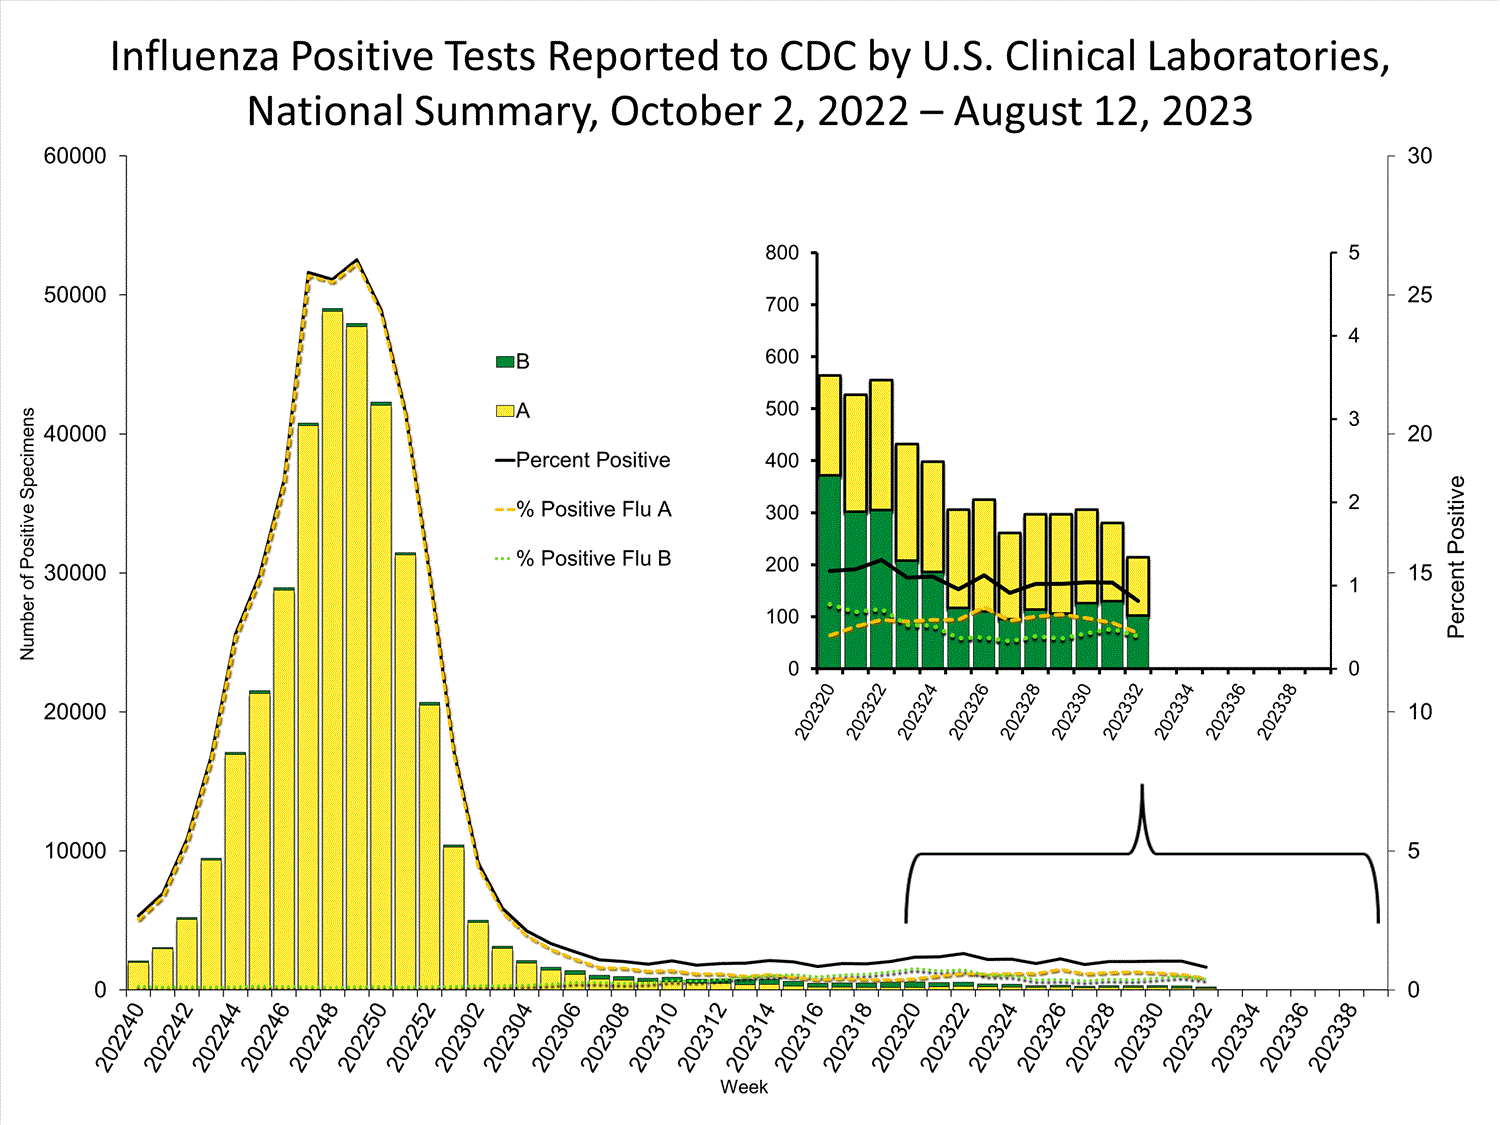
The results of tests performed by clinical laboratories nationwide are summarized below. Data from clinical laboratories (the percentage of specimens tested that are positive for influenza) are used to monitor whether influenza activity is increasing or decreasing.
No. of specimens tested25,1623,812,287
No. of positive specimens (%)263 (1.0%)357,111 (9.4%)
Positive specimens by type
Influenza A147 (55.9%)347,976 (97.4%)
Influenza B116 (44.1%)9,135 (2.6%)
INFLUENZA Virus Isolated

View Chart Data | View Full Screen Public Health Laboratories


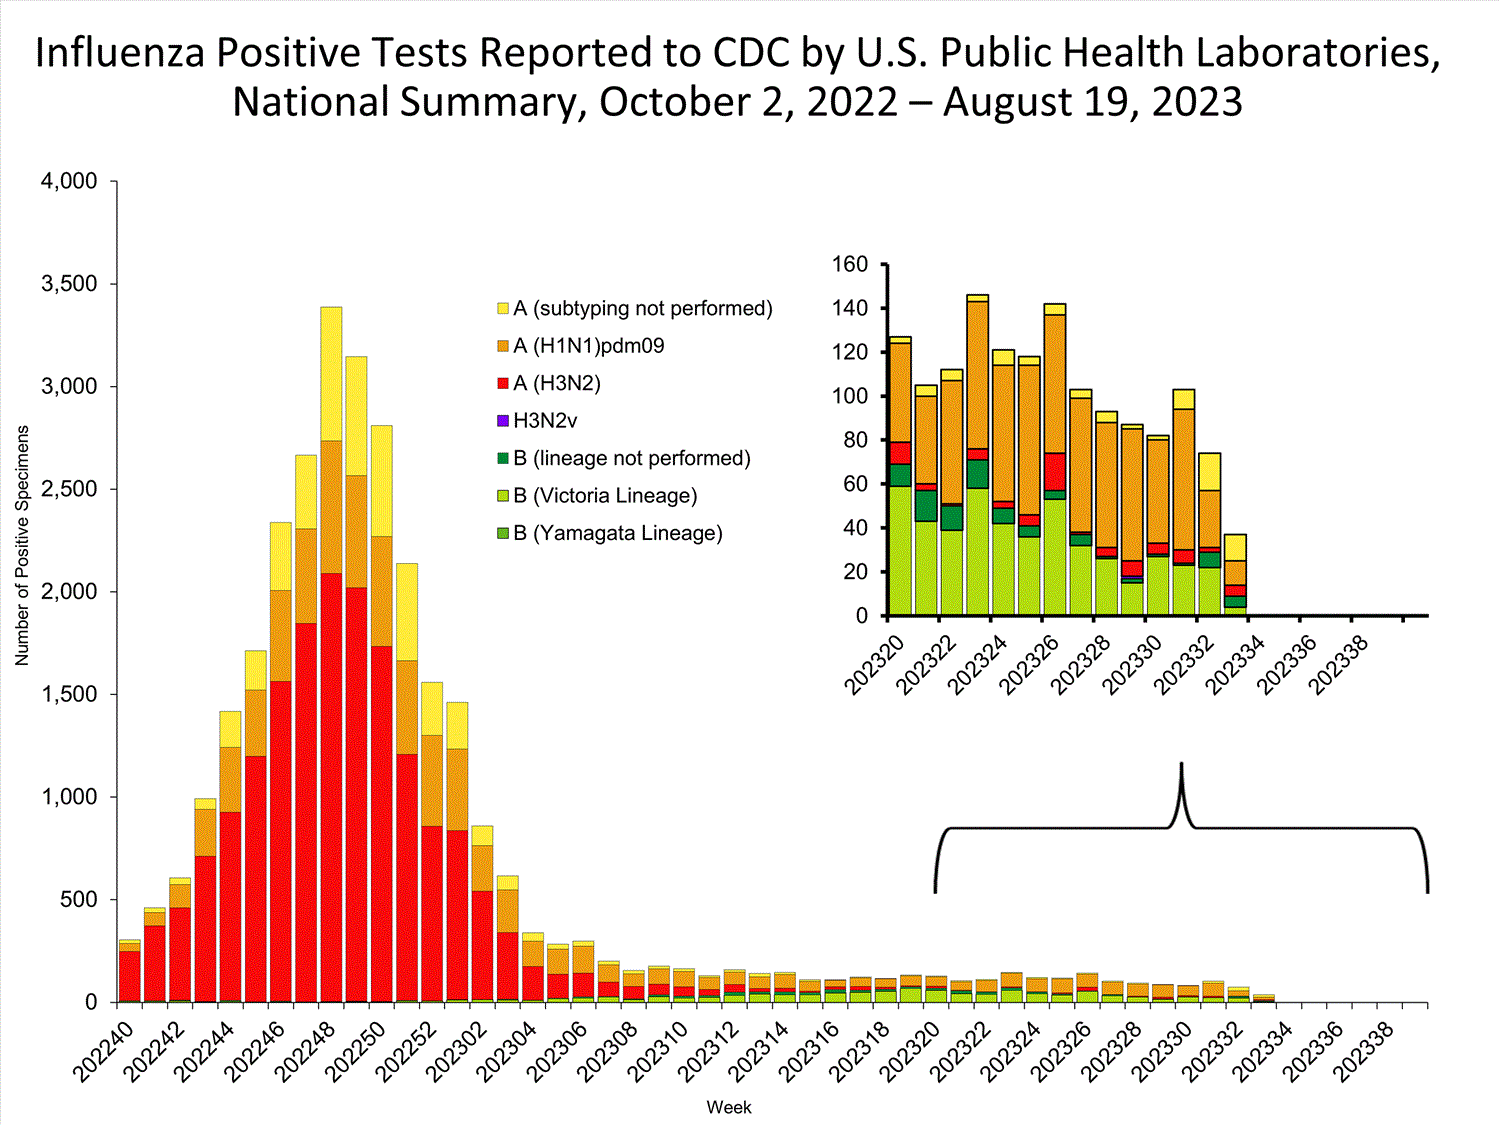
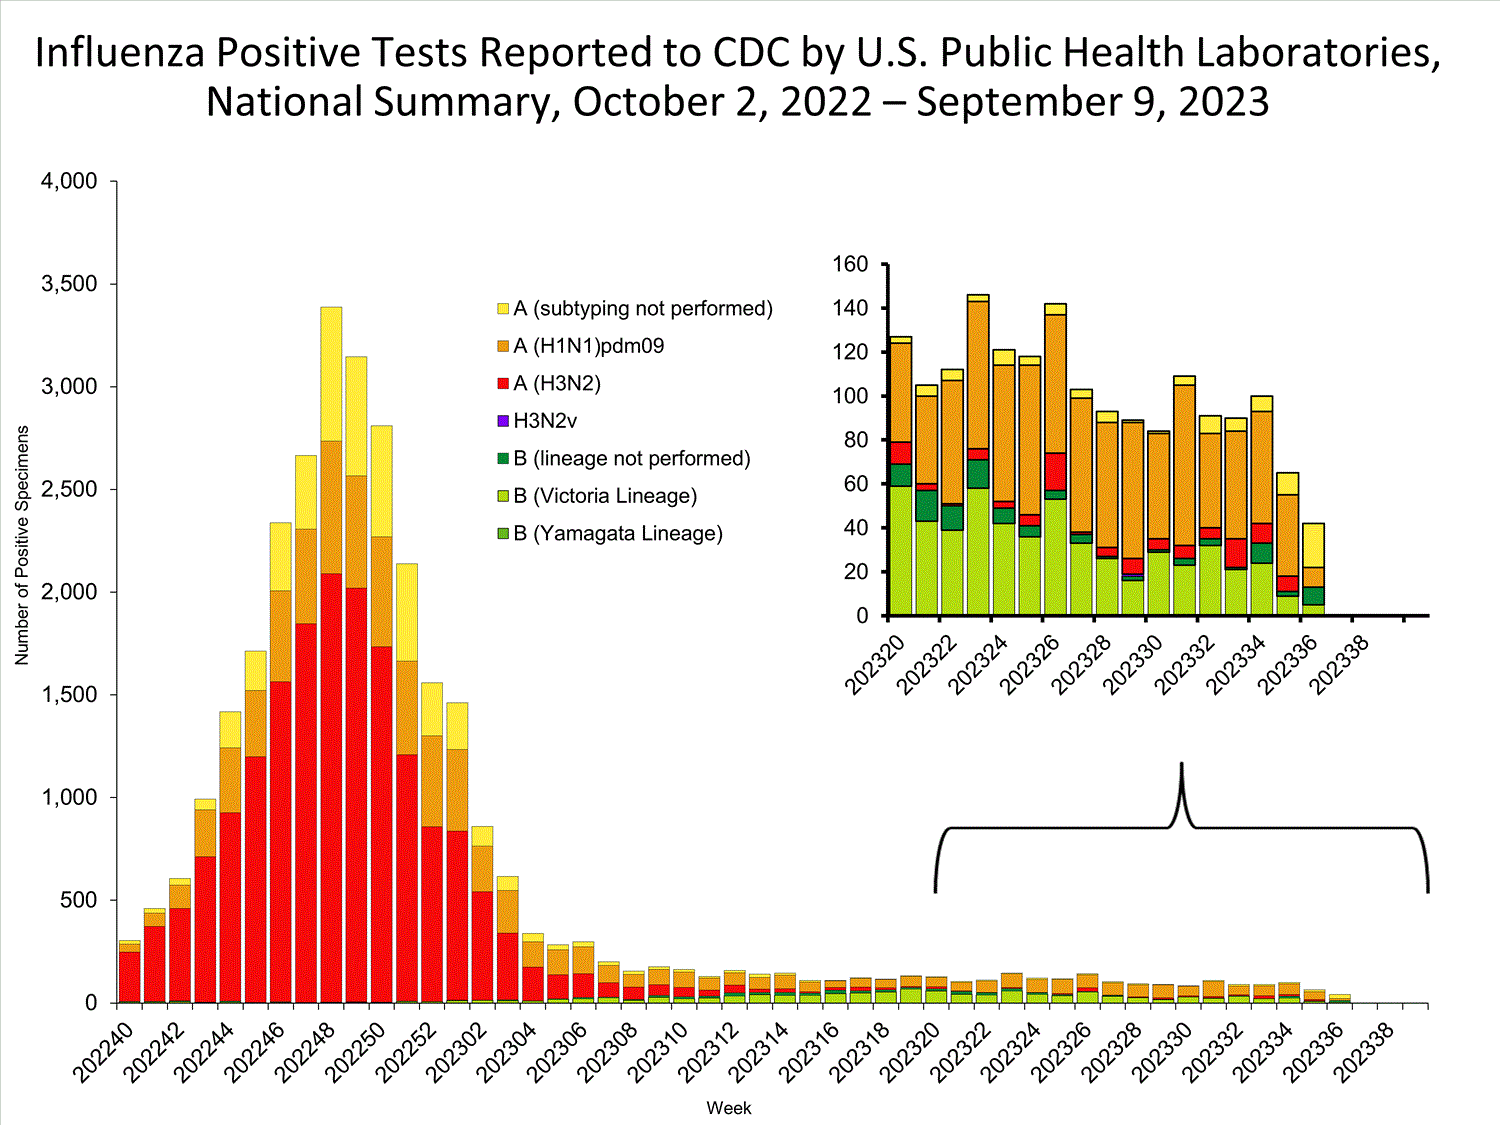
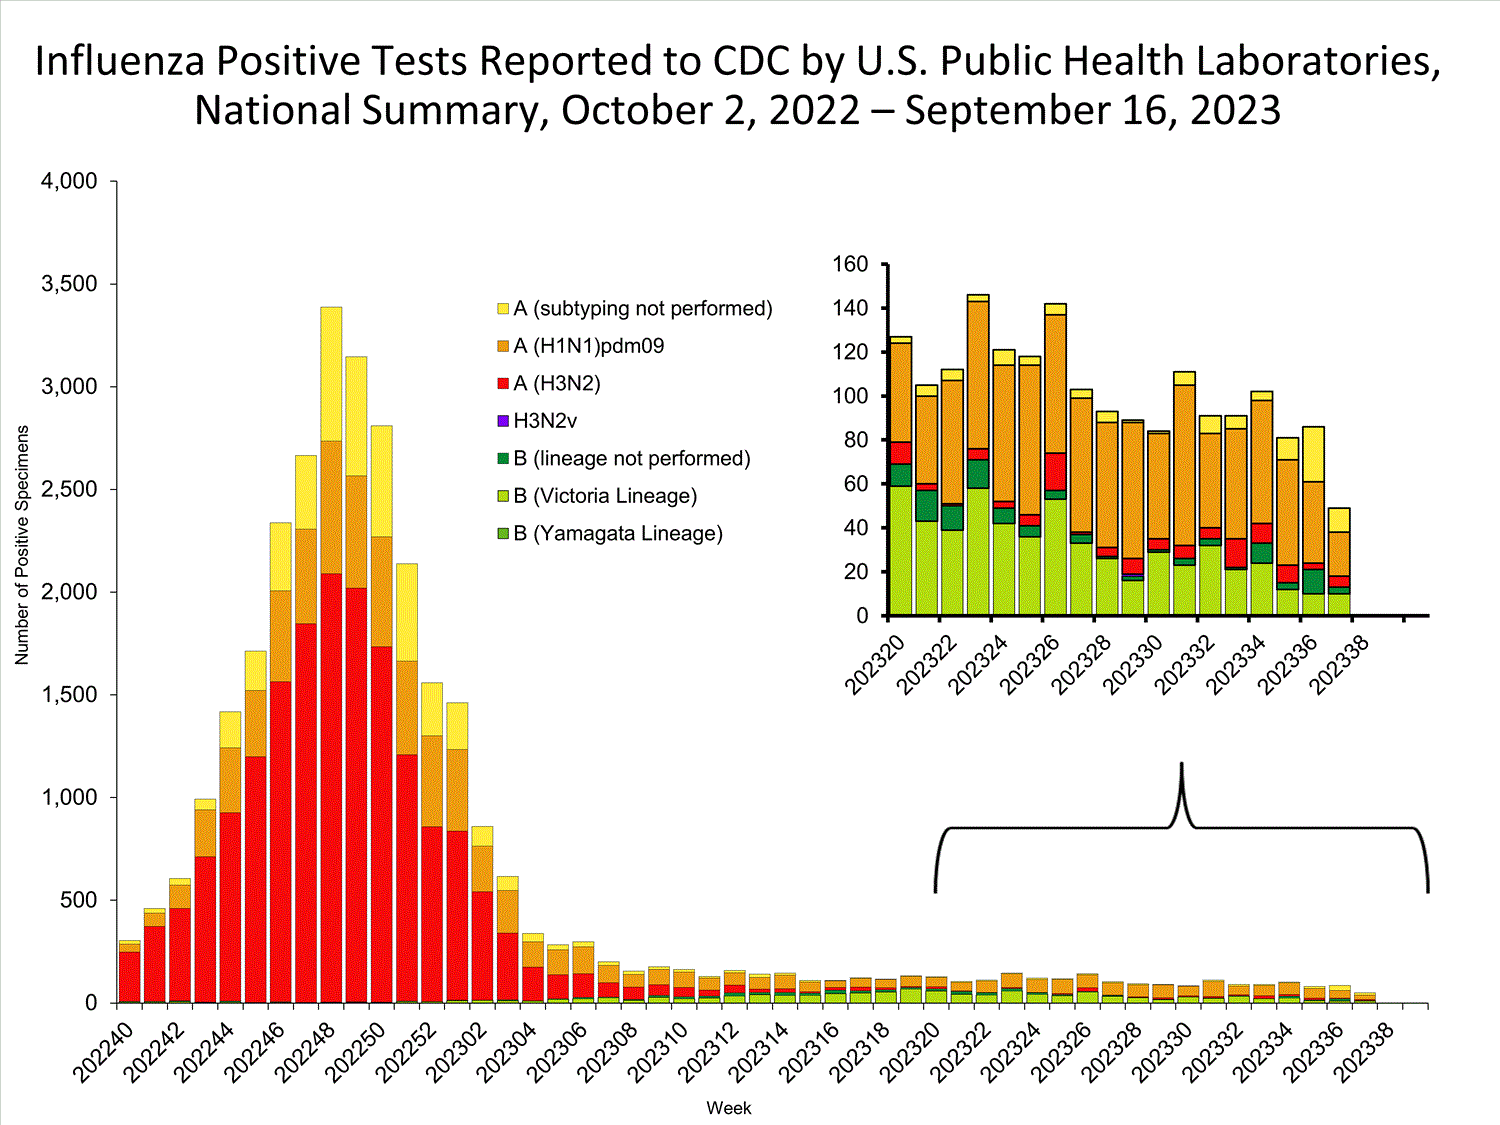
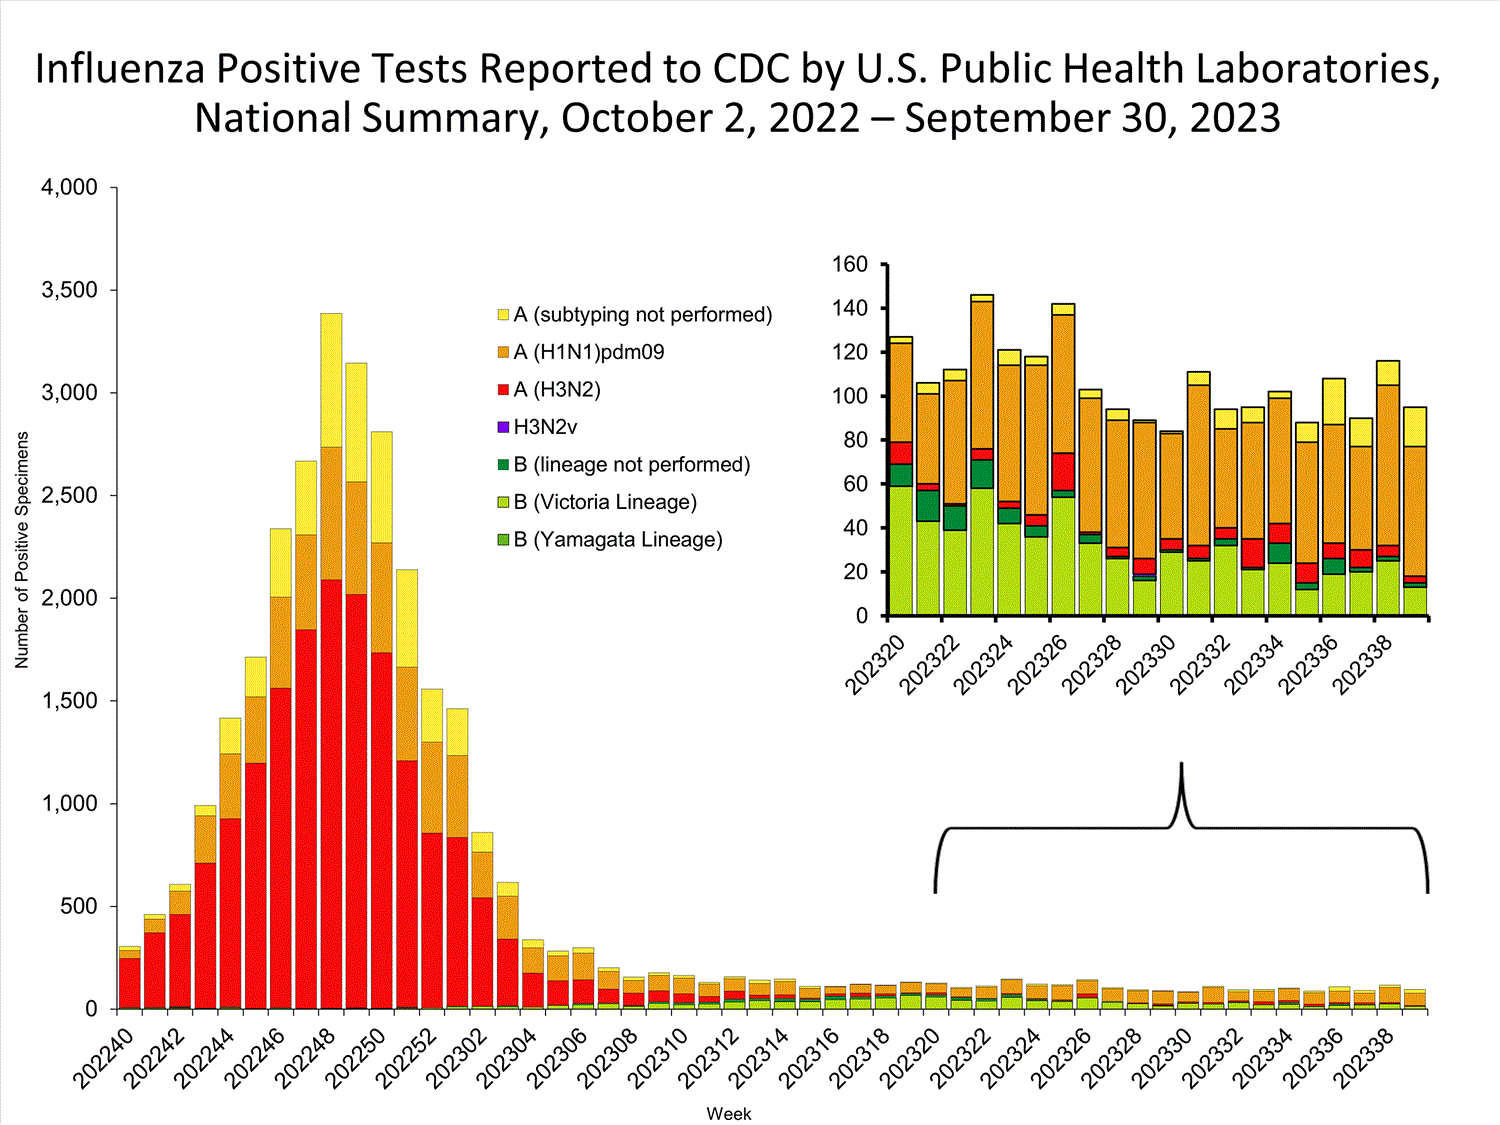
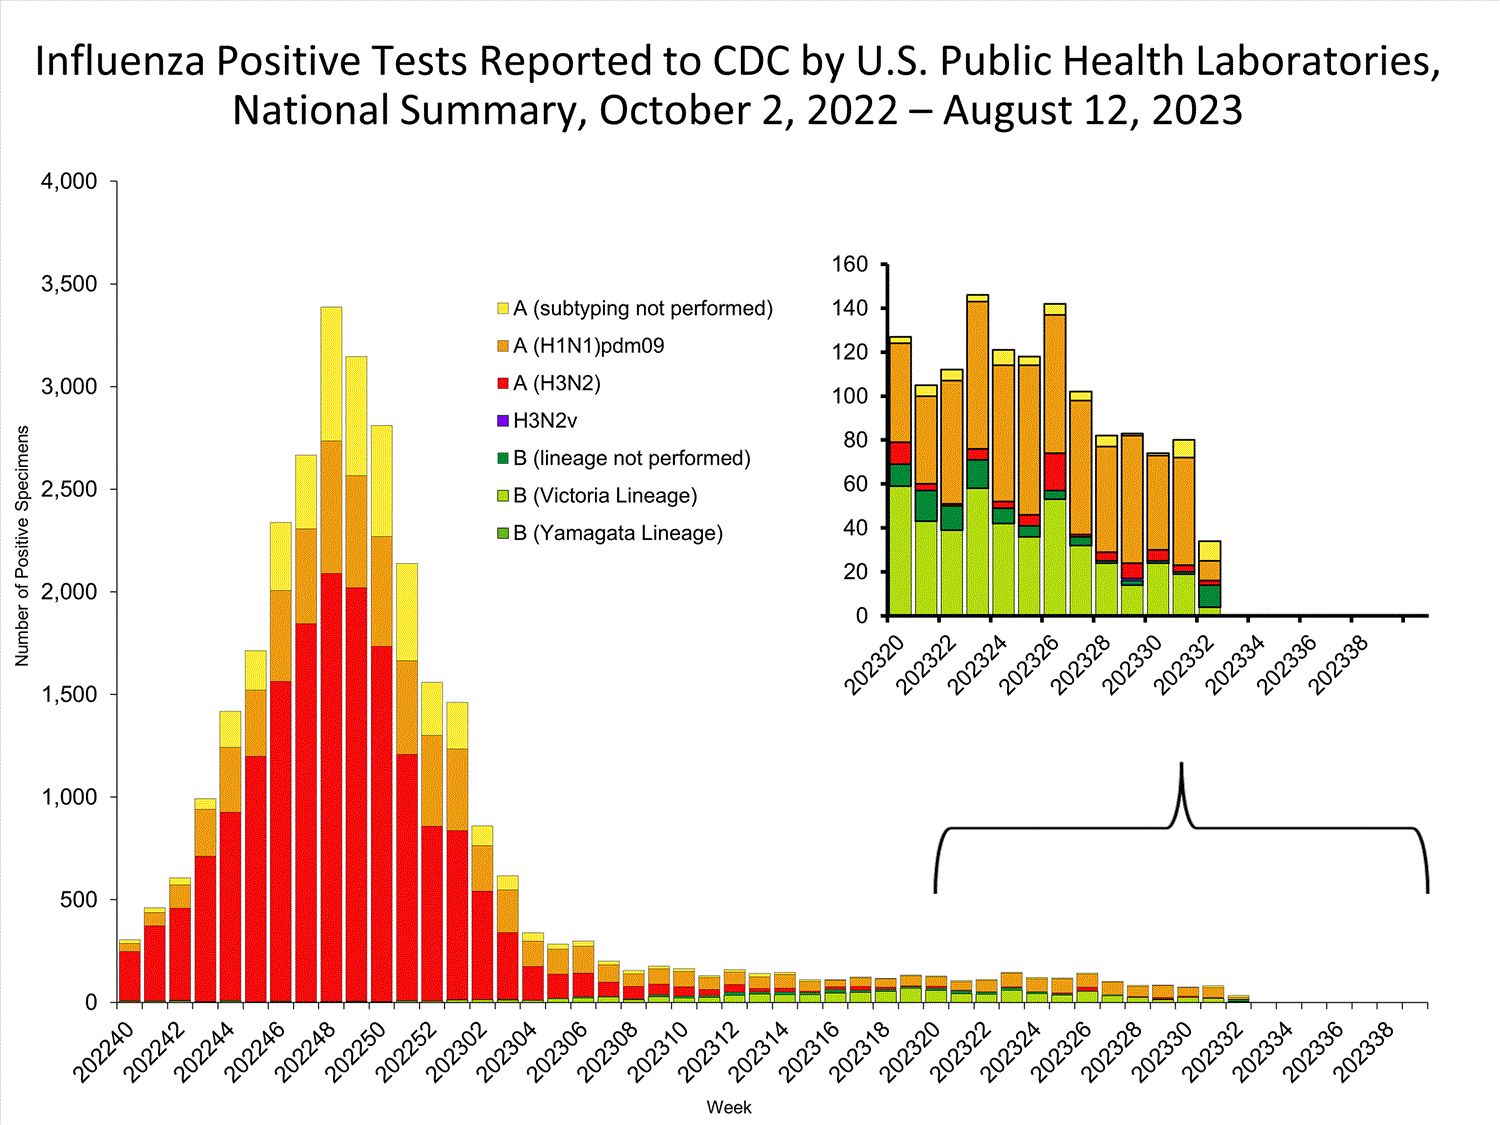
The results of tests performed by public health laboratories nationwide are summarized below. Data from public health laboratories are used to monitor the proportion of circulating viruses that belong to each influenza virus type/subtype/lineage. Viruses known to be associated with recent live attenuated influenza vaccine (LAIV) receipt or found upon further testing to be a vaccine virus are not included as they are not circulating influenza viruses.
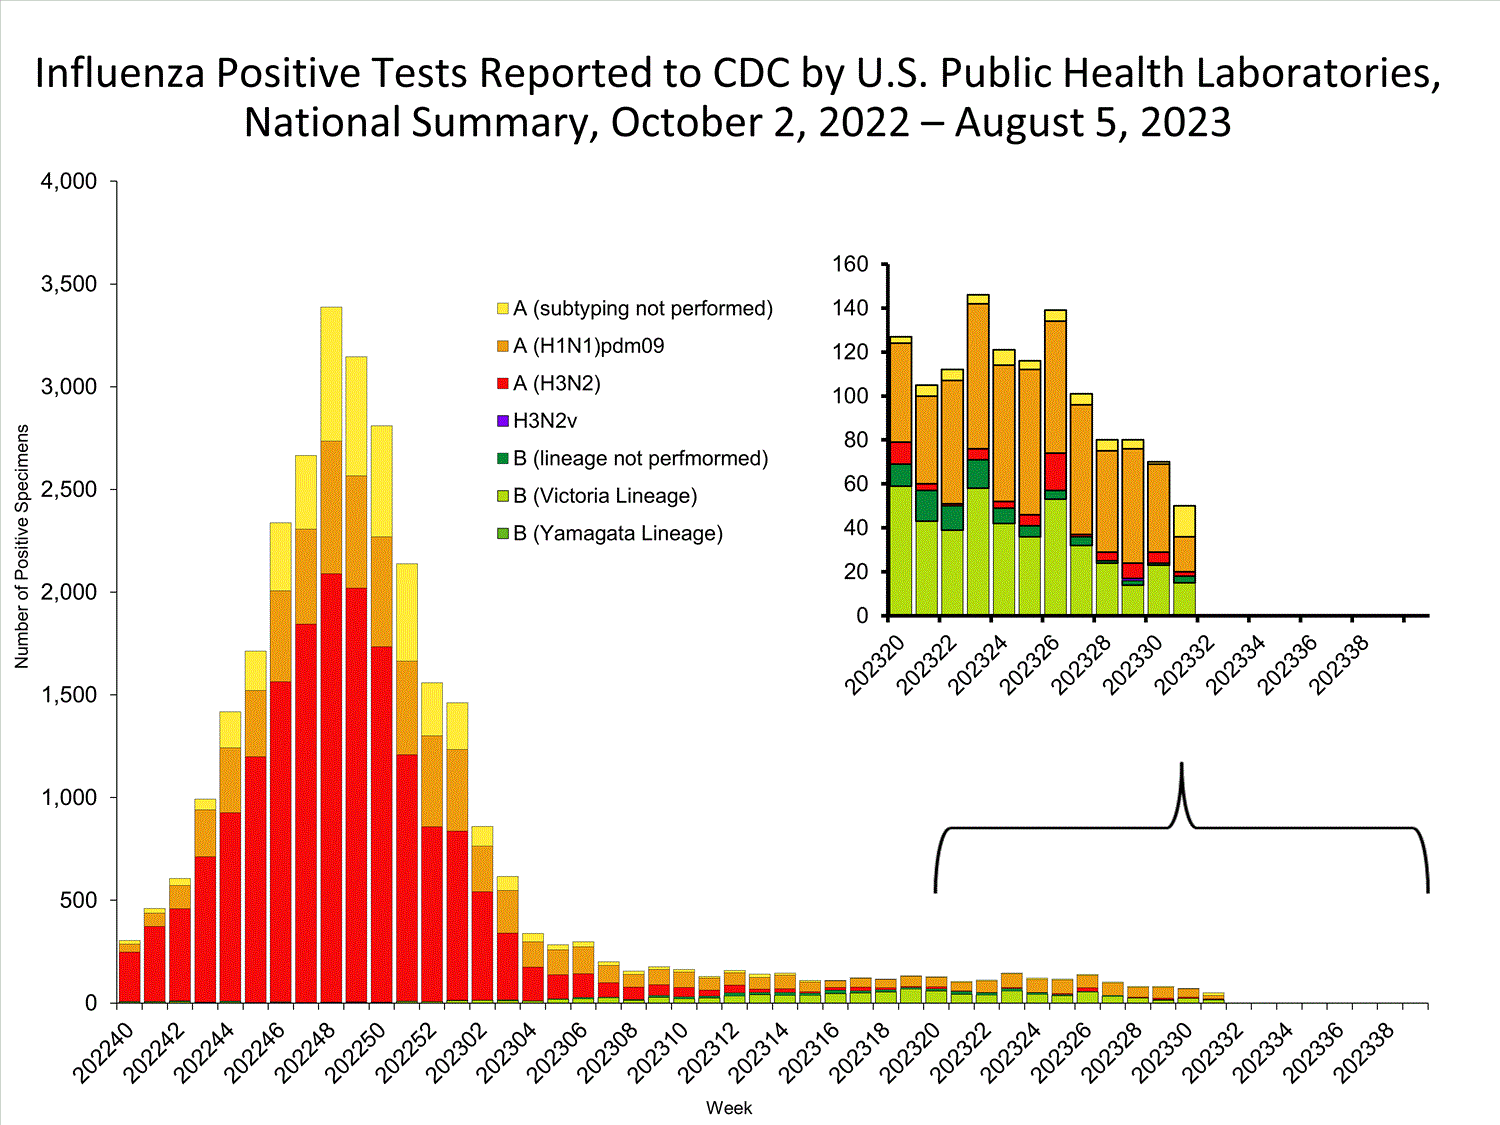
No. of specimens tested1,072273,164
No. of positive specimens5030,503
Positive specimens by type/subtype
Influenza A32 (64.0%)29,195 (95.7%)
(H1N1)pdm0916 (88.9%)7,181 (28.9%)
H3N22 (11.1%)17,655 (71.1%)
H3N2v02 (<0.1%)
Subtyping not performed144,357
Influenza B18 (36.0%)1,308 (4.3%)
Yamagata lineage0 (0%)0
Victoria lineage15 (100%)1,058 (100%)
Lineage not performed3250


INFLUENZA Virus Isolated
View Chart Data | View Full Screen
Additional virologic surveillance information for current and past seasons:
Surveillance Methods | FluView Interactive: National, Regional, and State Data or Age Data Outpatient Respiratory Illness Surveillance


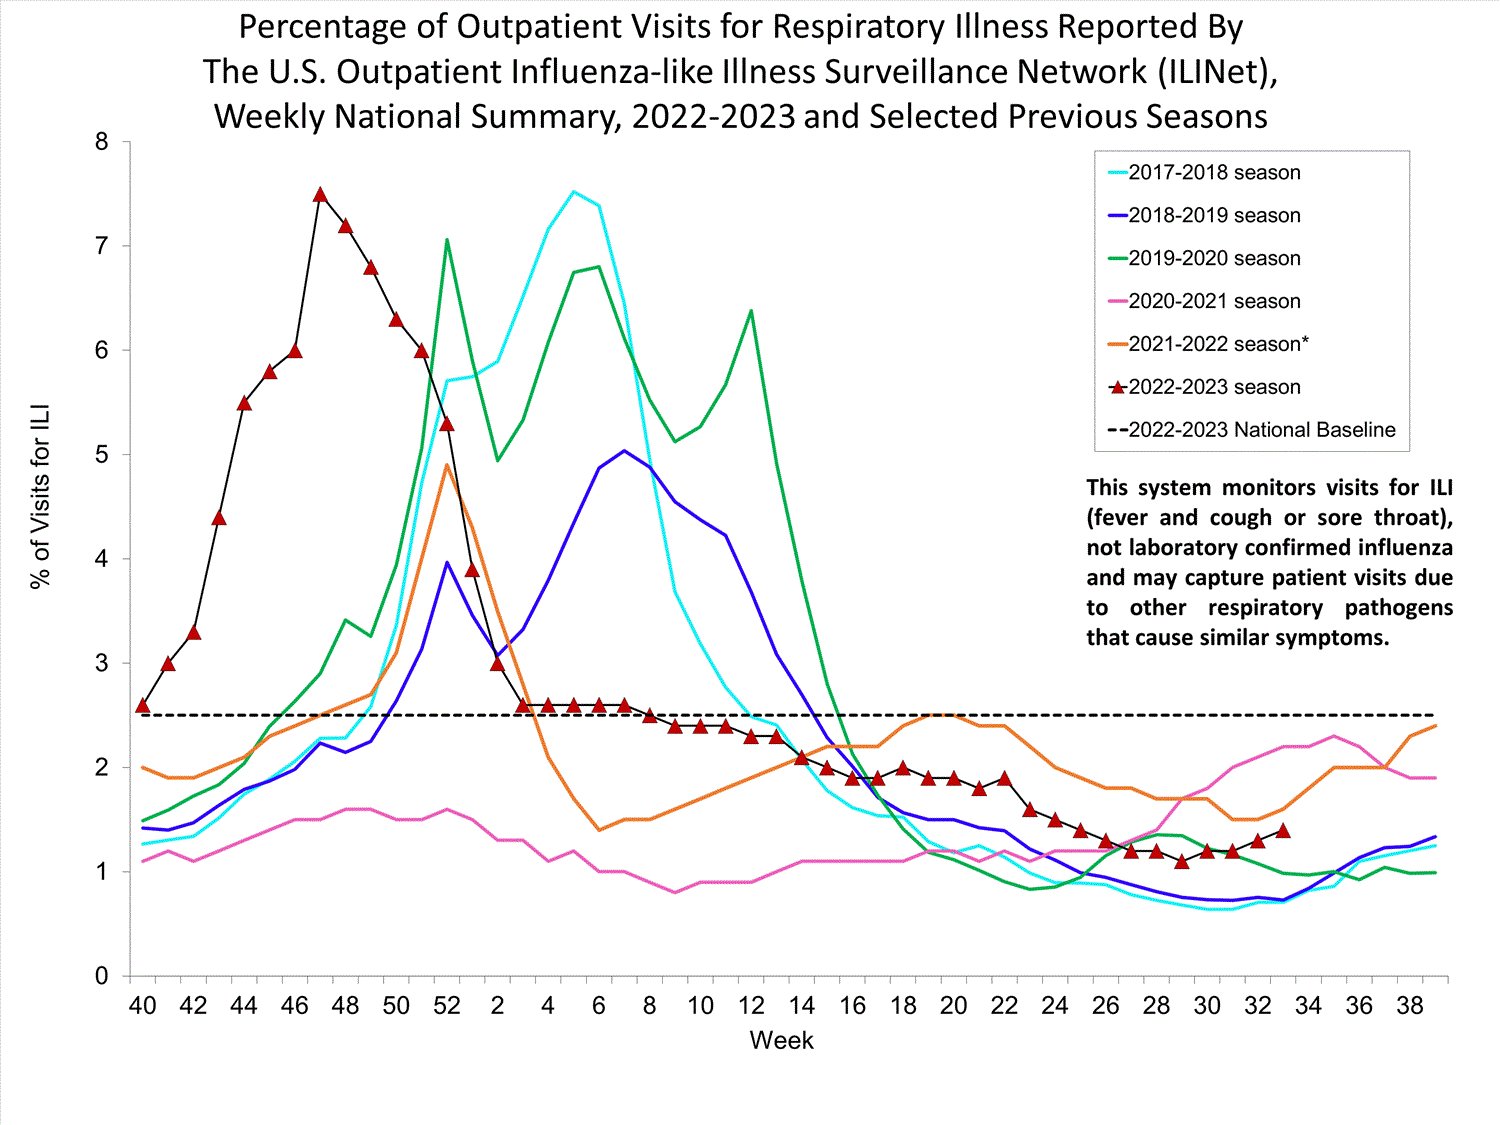
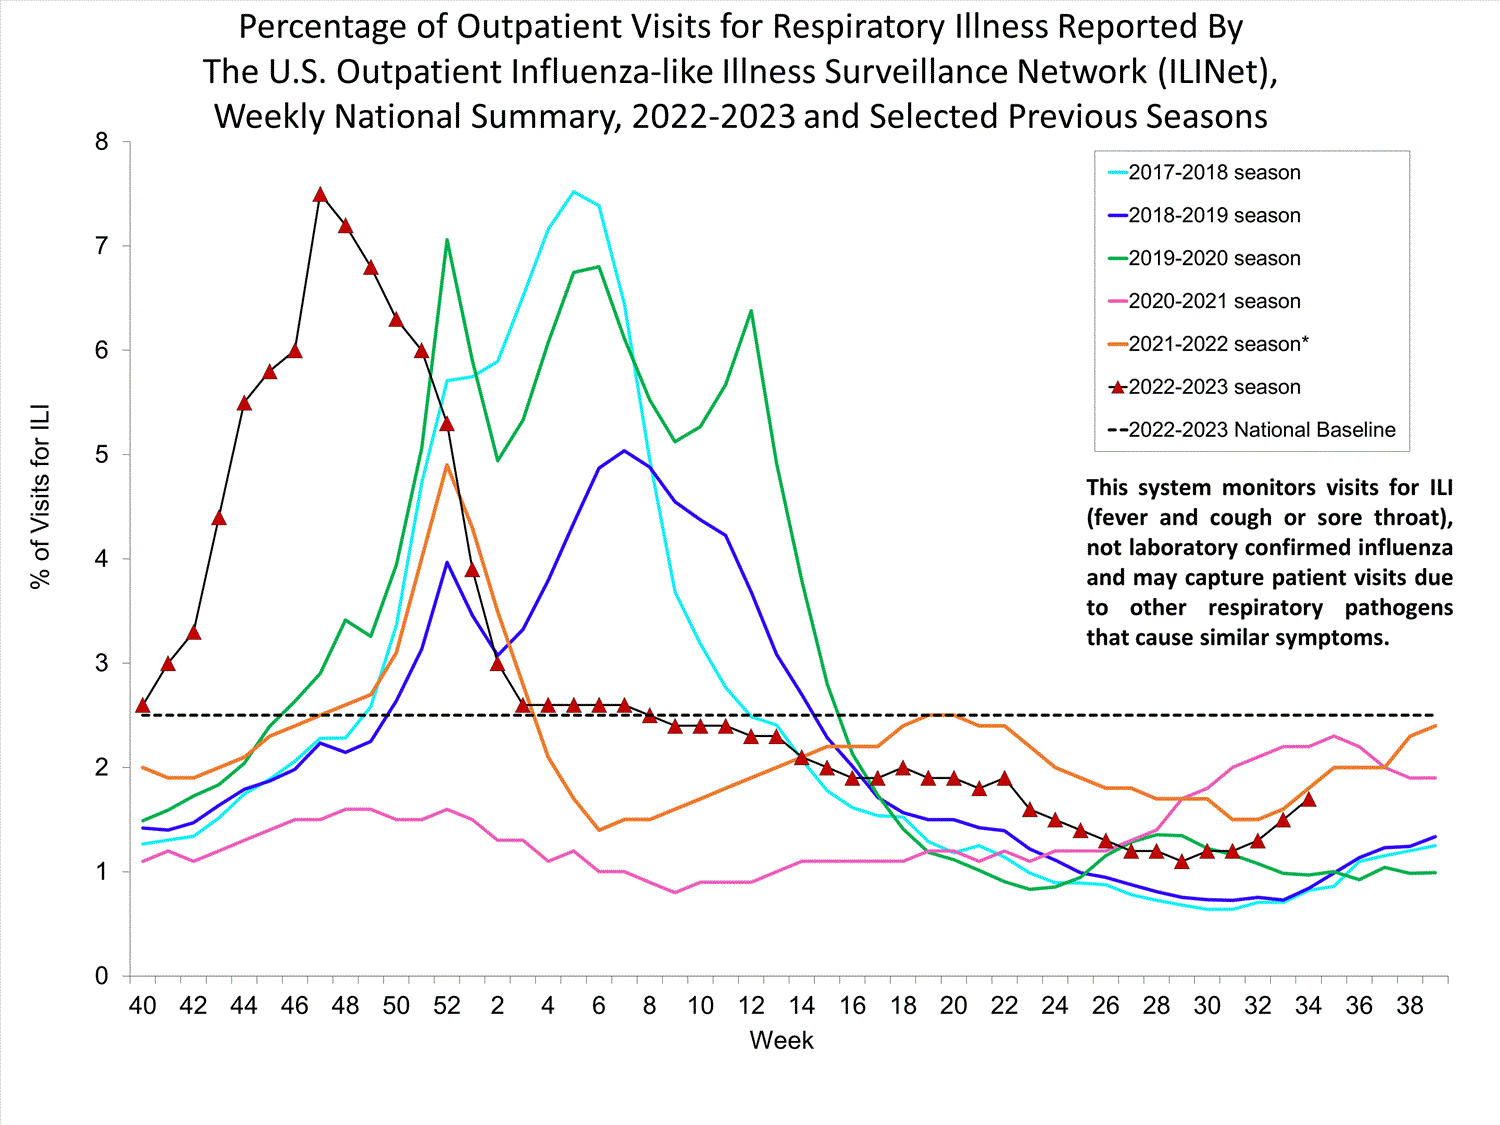
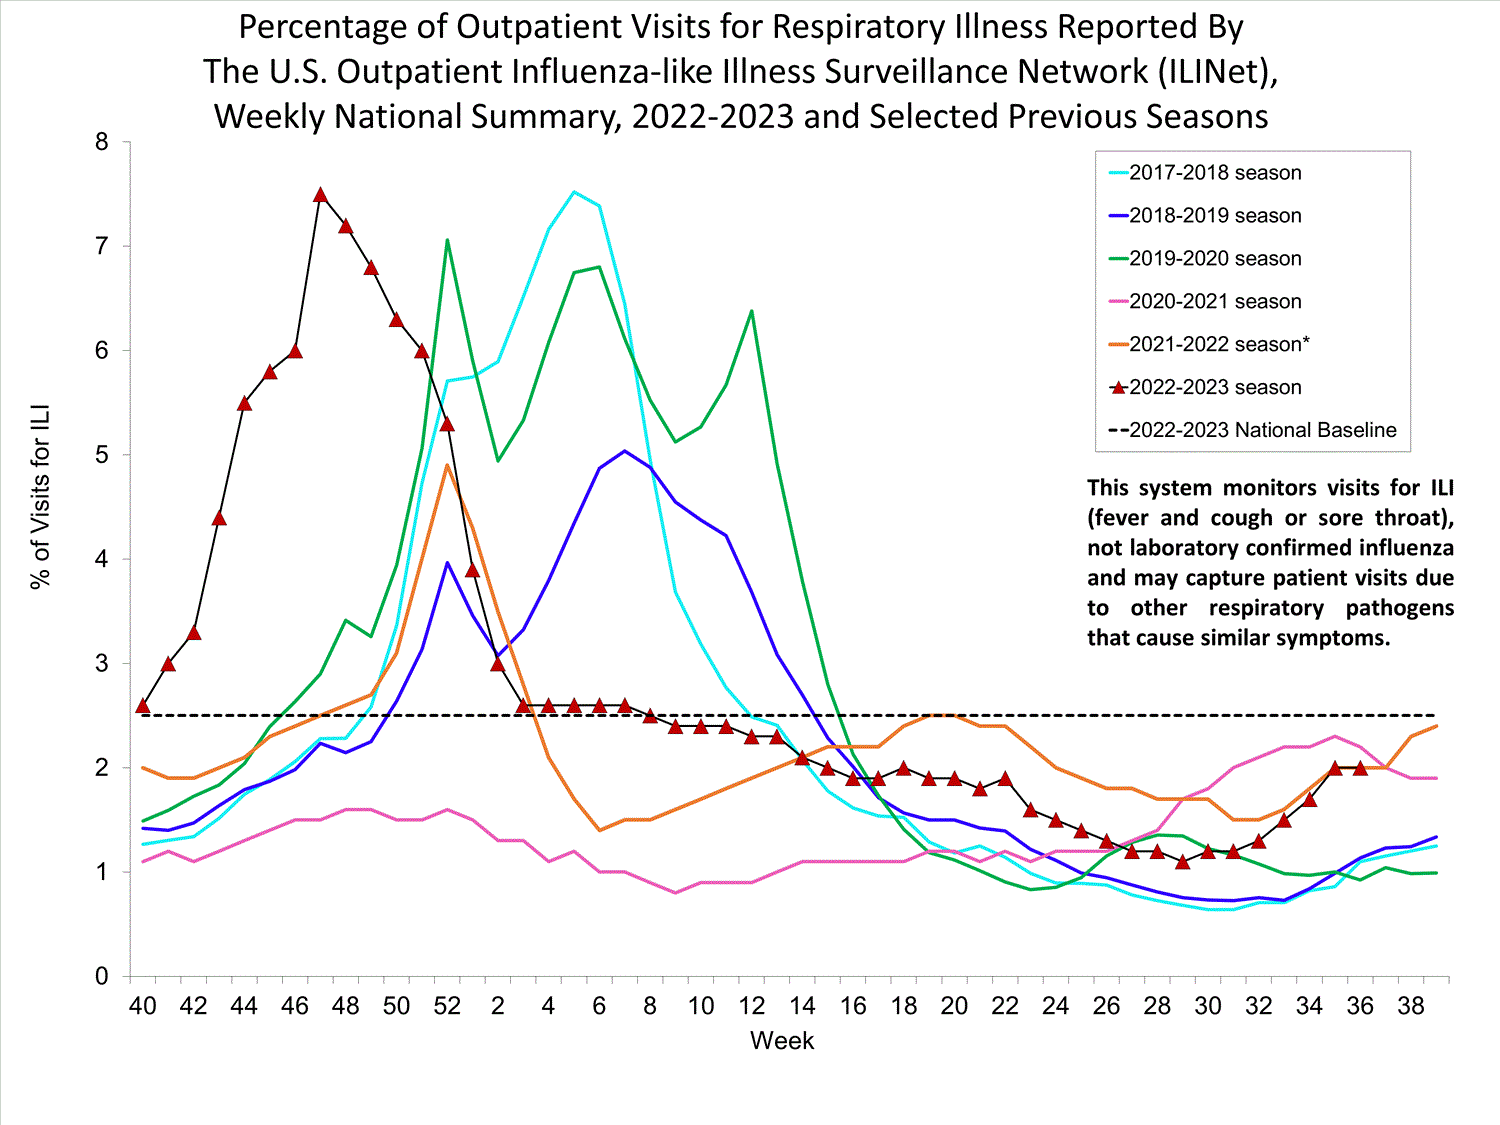
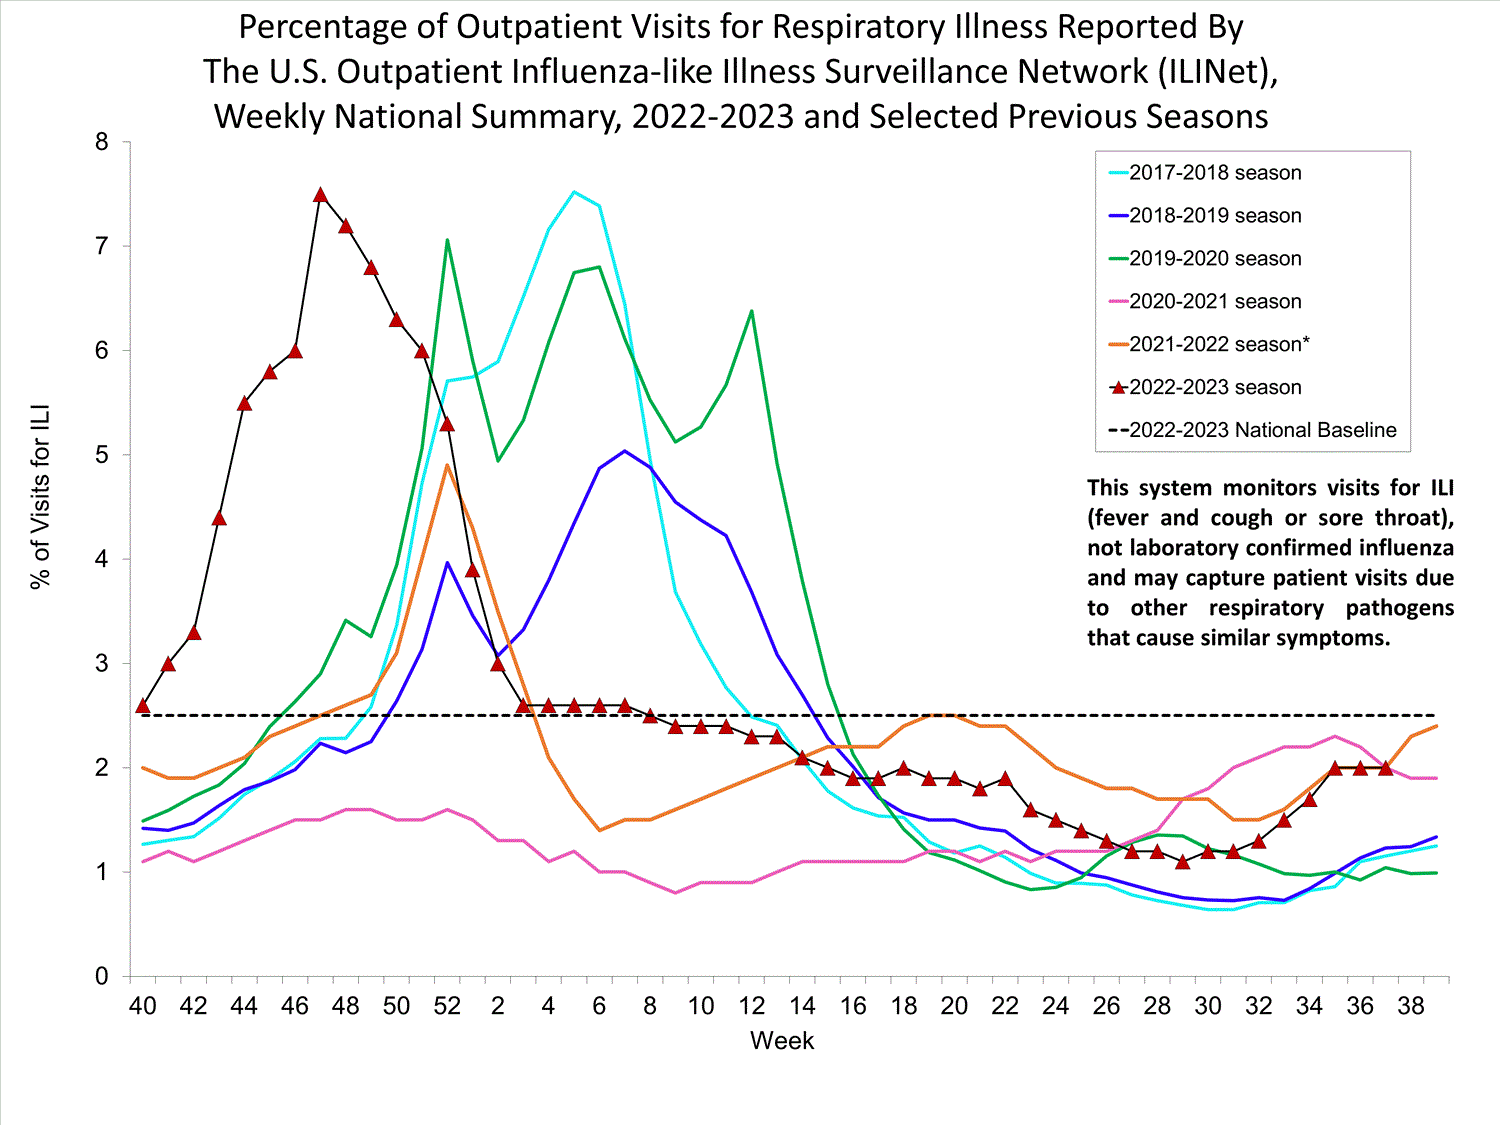
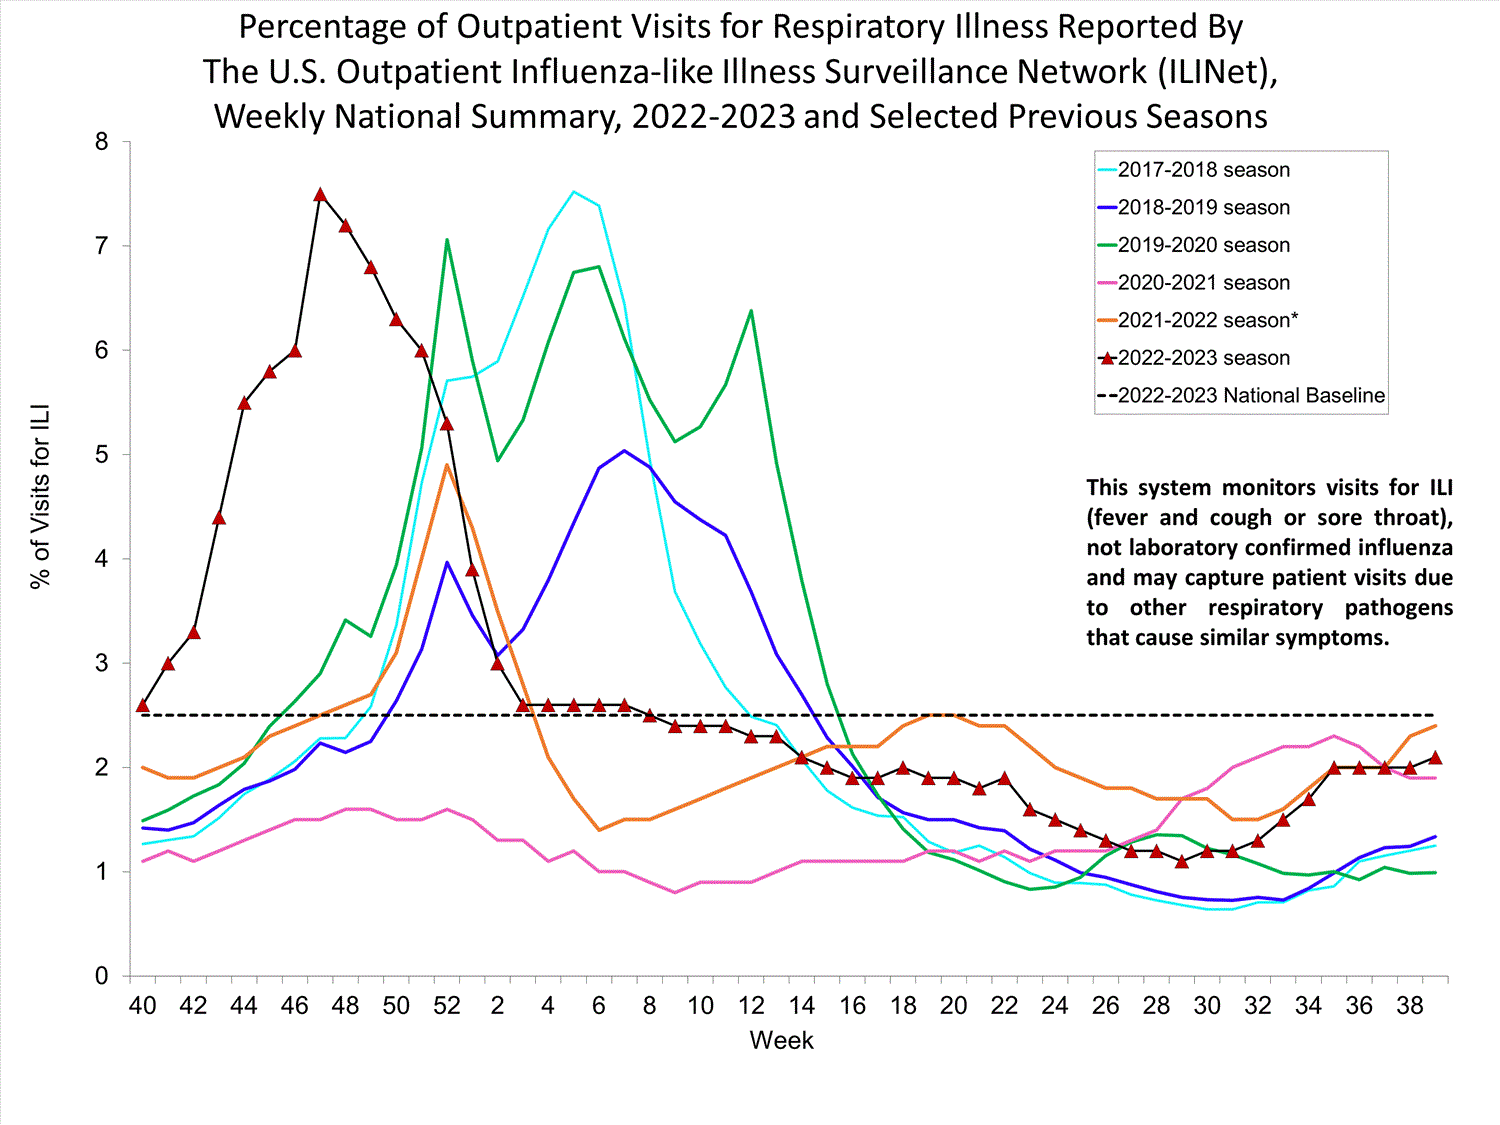
The U.S. Outpatient Influenza-like Illness Surveillance Network (ILINet) monitors outpatient visits for respiratory illness referred to as influenza-like illness [ILI (fever plus cough or sore throat)], not laboratory-confirmed influenza, and may capture respiratory illness visits due to infection with any pathogen that can present with similar symptoms, including influenza, SARS-CoV-2, and RSV. Therefore, it is important to evaluate syndromic surveillance data, including that from ILINet, in the context of other sources of surveillance data to obtain a complete and accurate picture of influenza, SARS-CoV-2, and other respiratory virus activity. Other respiratory virus surveillance data can be found on CDC’s COVID Data Tracker, NCIRD Surveillance Systems website and National Respiratory and Enteric Virus Surveillance System (NREVSS) website. Outpatient Respiratory Illness Visits


Nationwide during week 31 1.1% of patient visits reported through ILINet were due to respiratory illness that included fever plus a cough or sore throat, also referred to as ILI. Multiple respiratory viruses are co-circulating, and the relative contribution of influenza virus infection to ILI varies by location.
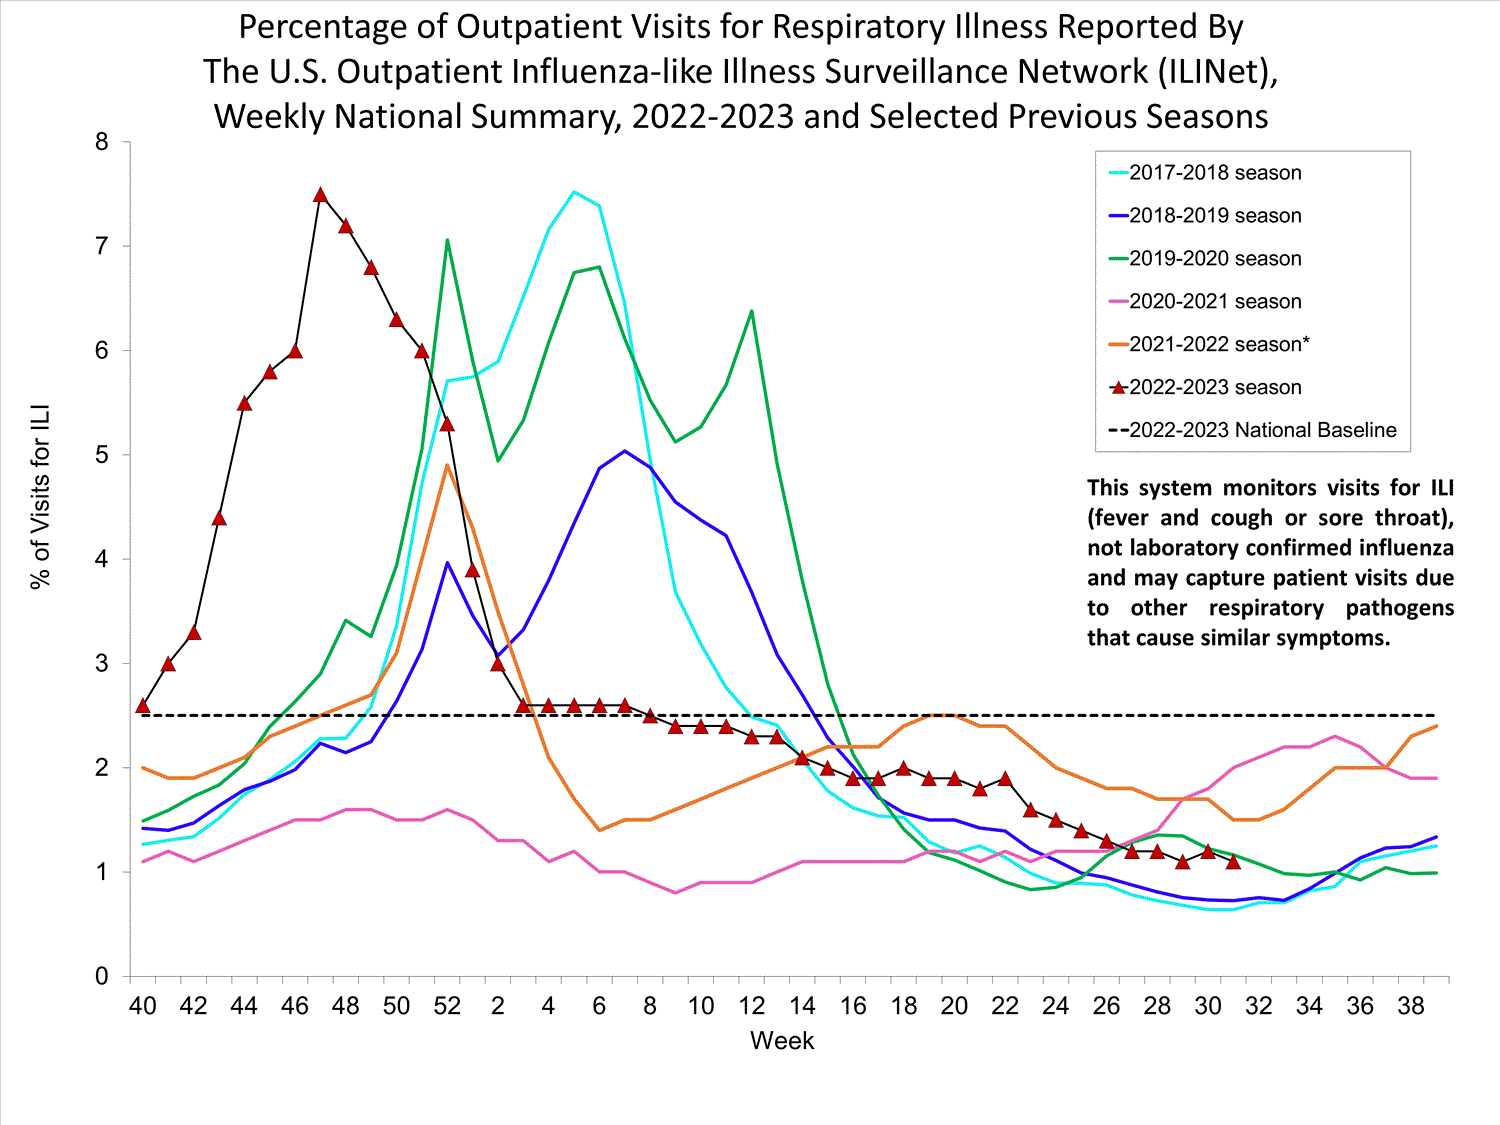
national levels of ILI and ARI

* Effective October 3, 2021 (week 40), the ILI definition (fever plus cough or sore throat) no longer includes “without a known cause other than influenza.”

View Chart Data (current season only) | View Full Screen Outpatient Respiratory Illness Visits by Age Group


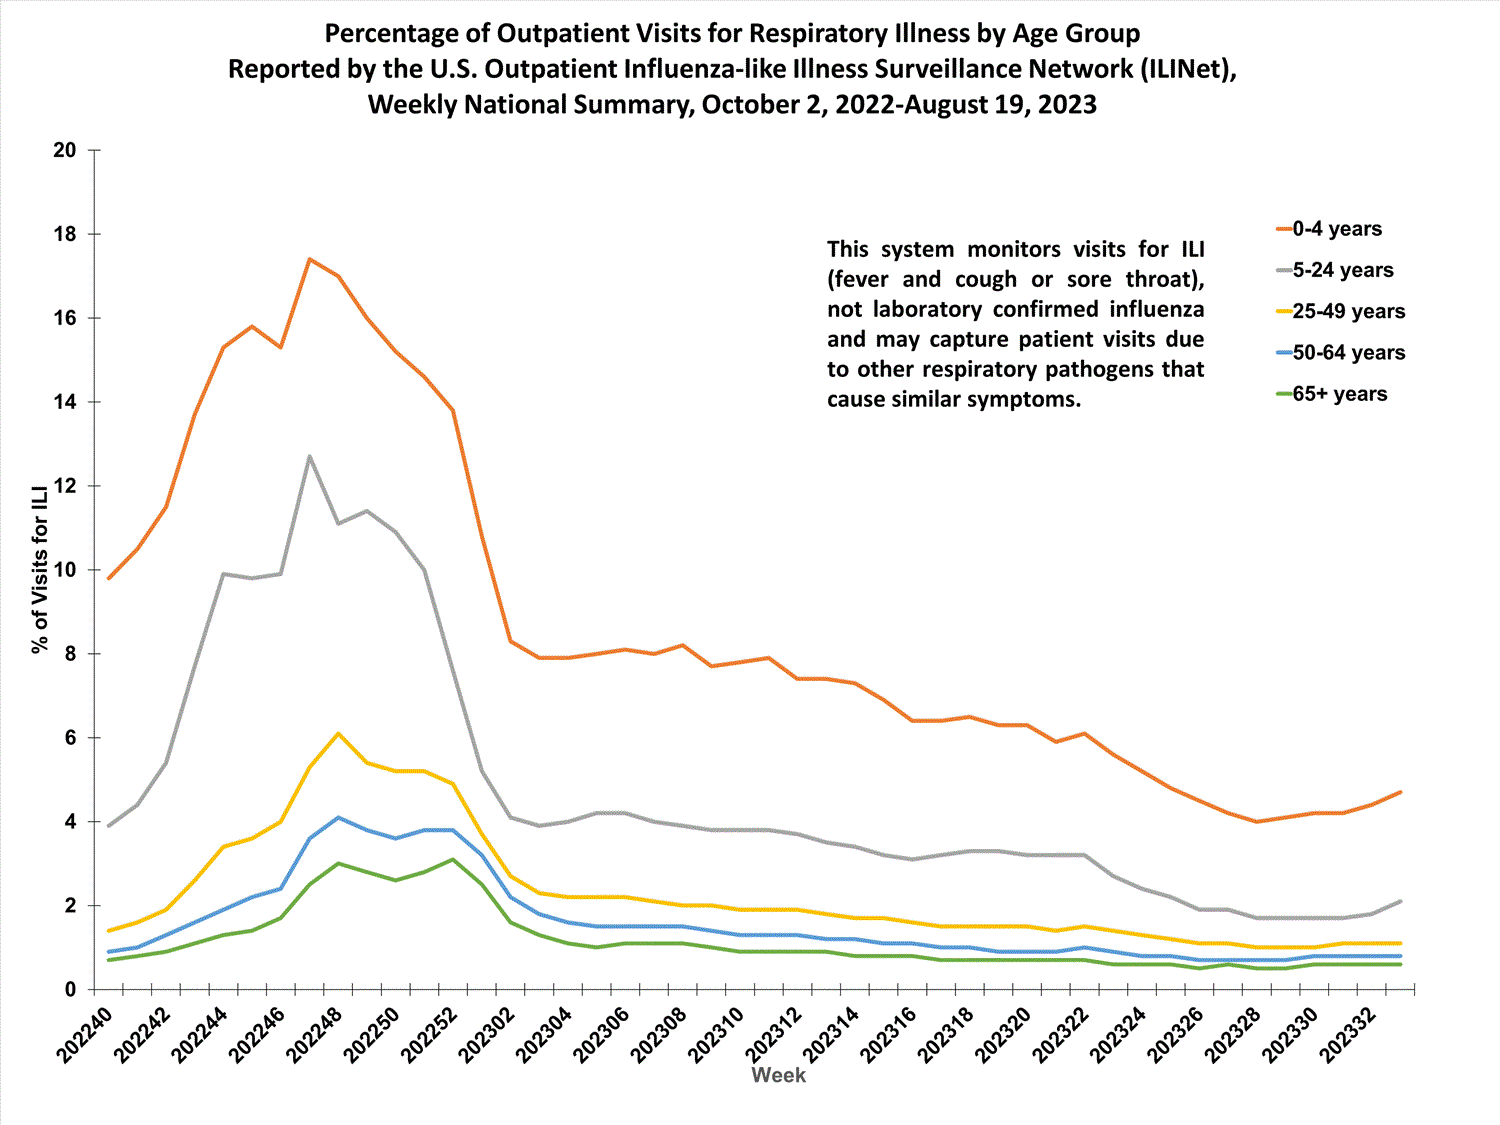
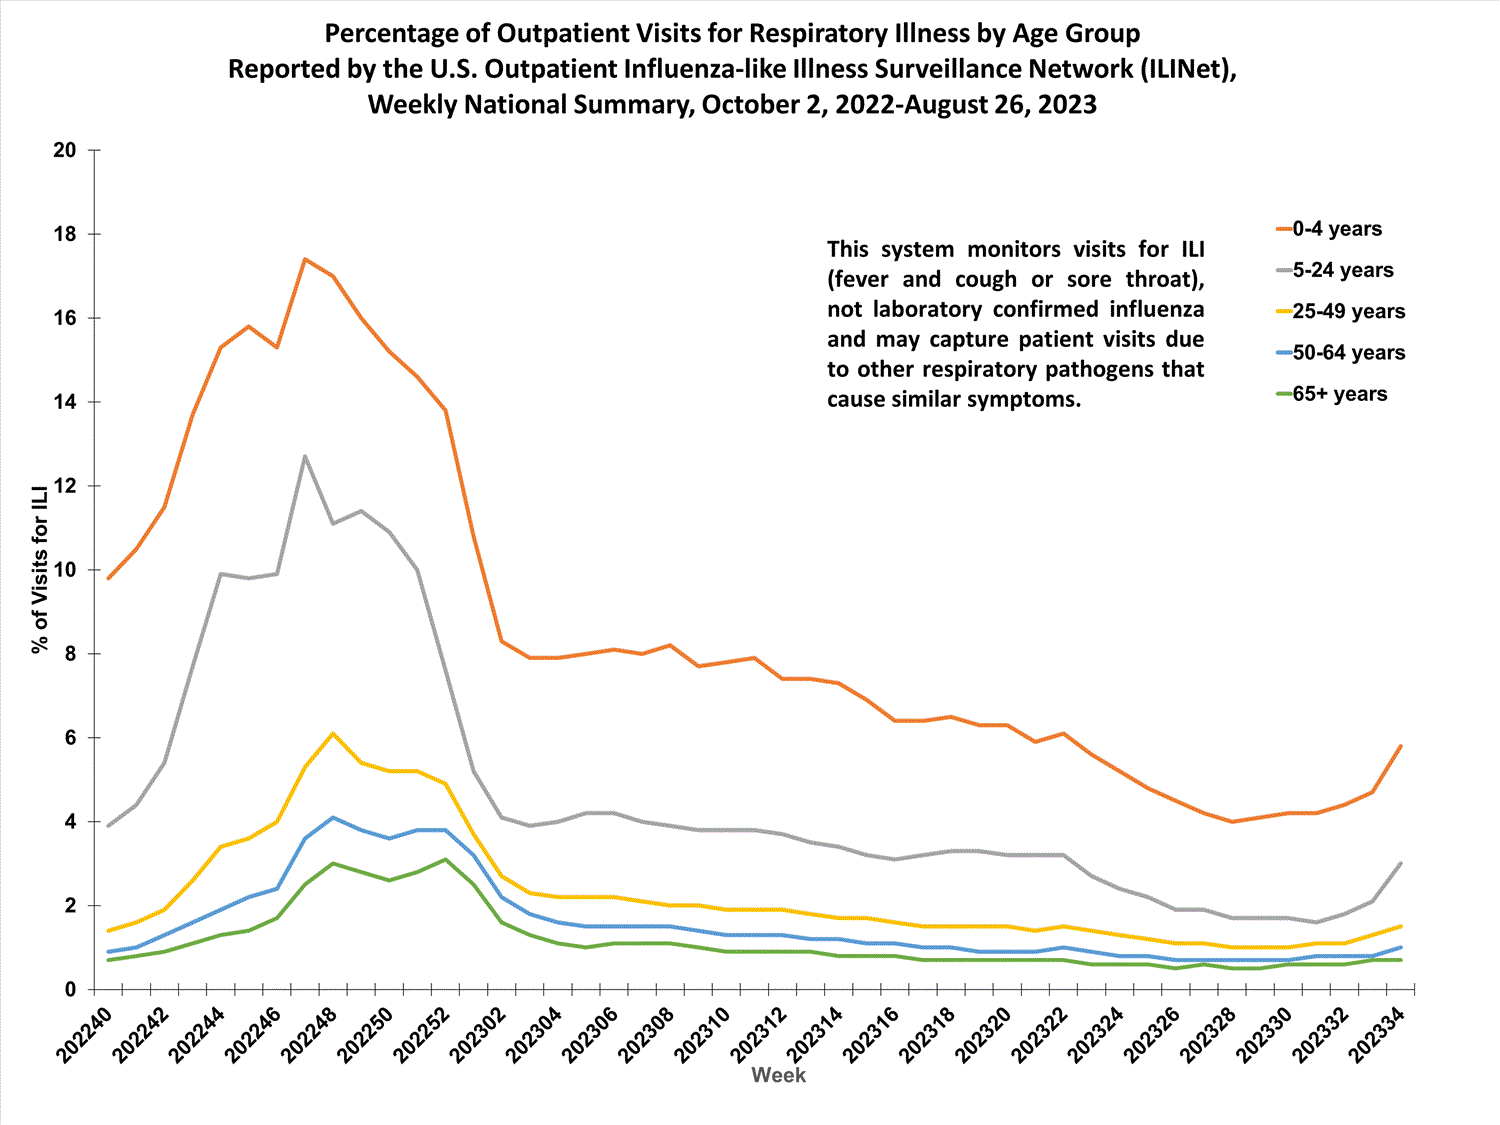
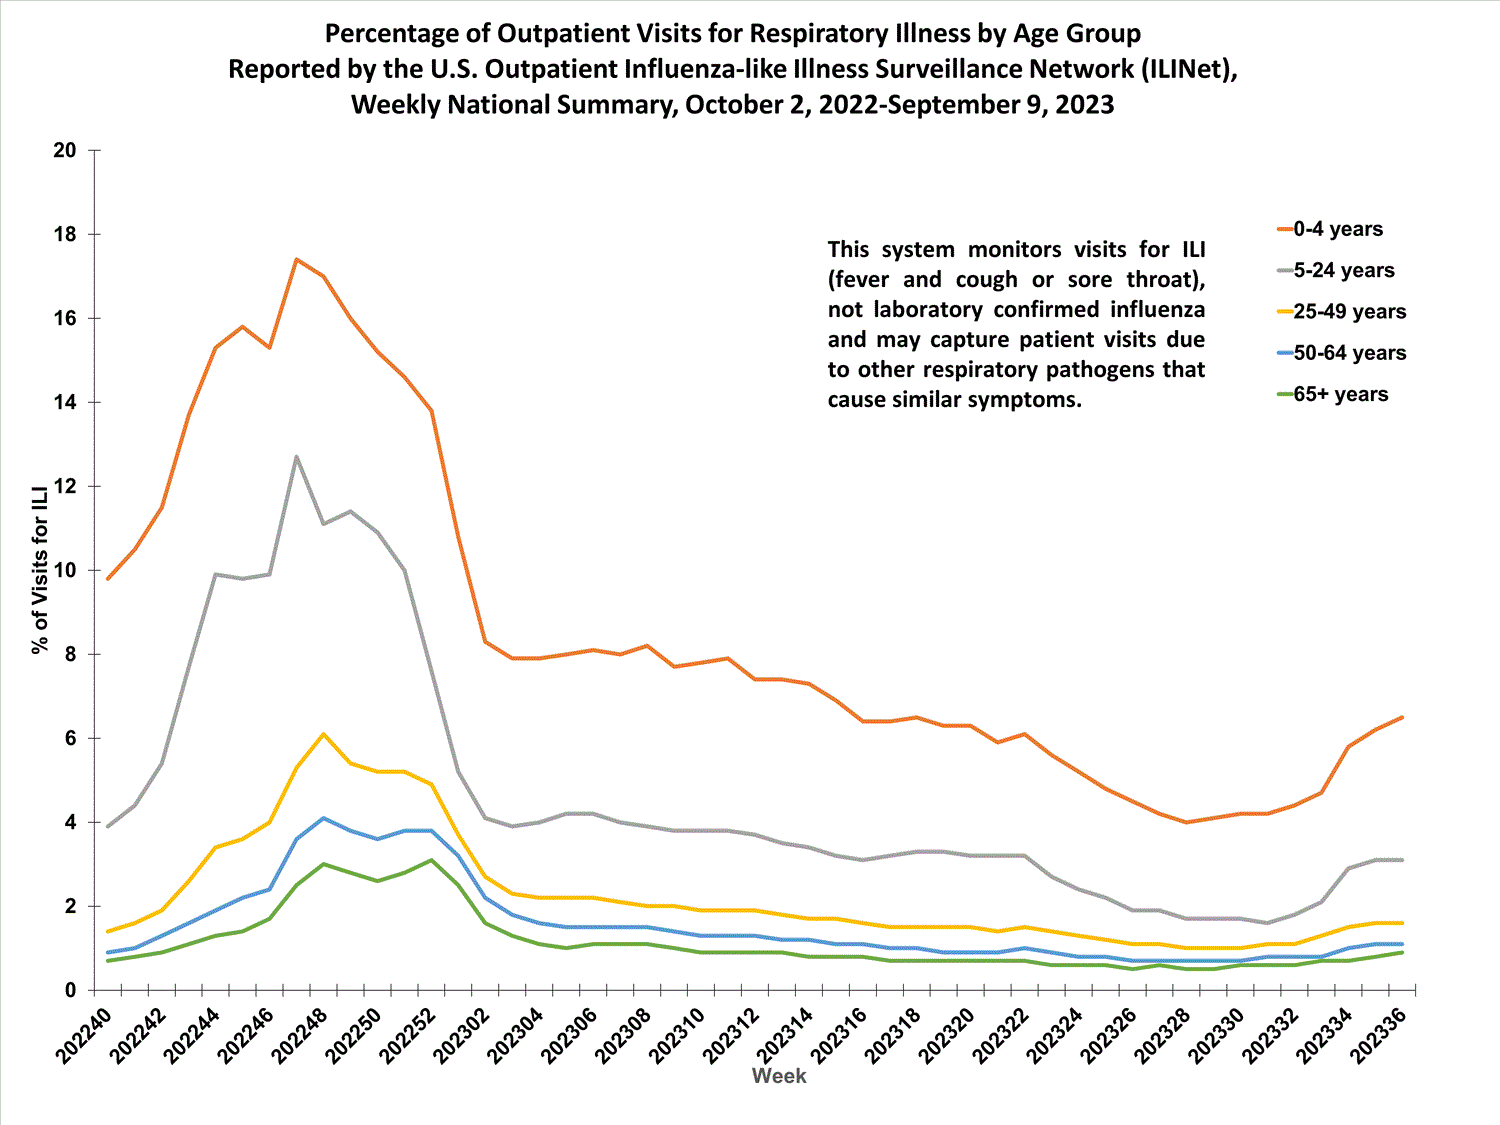
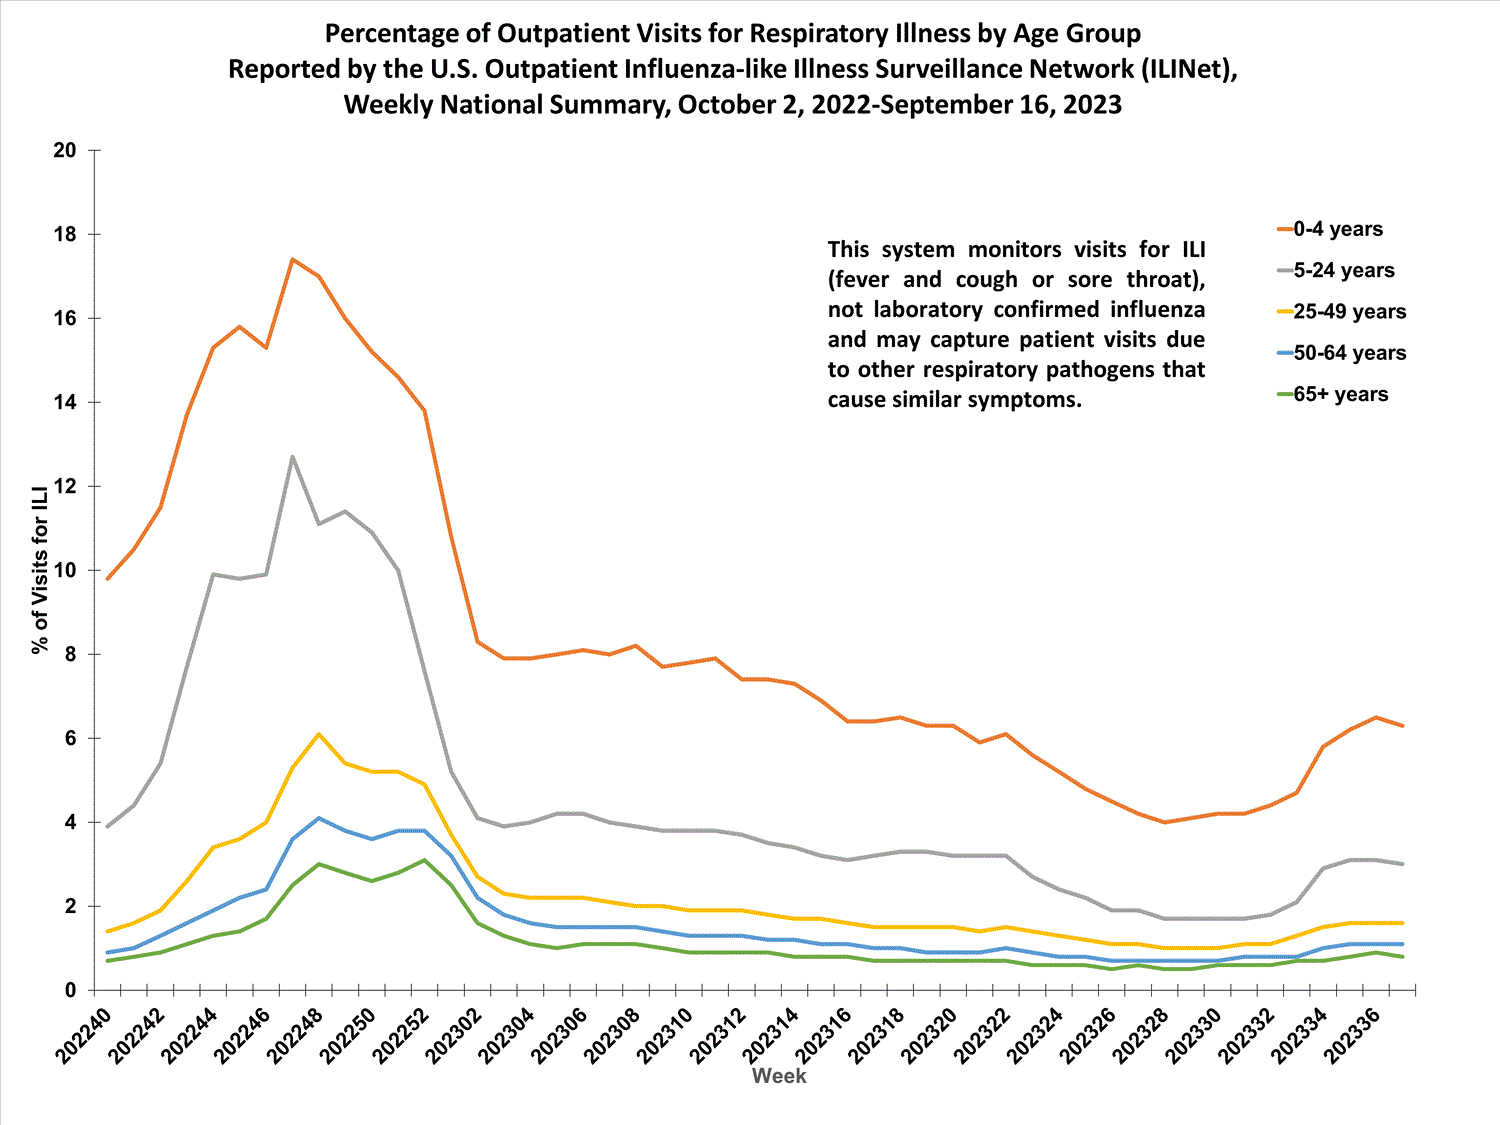
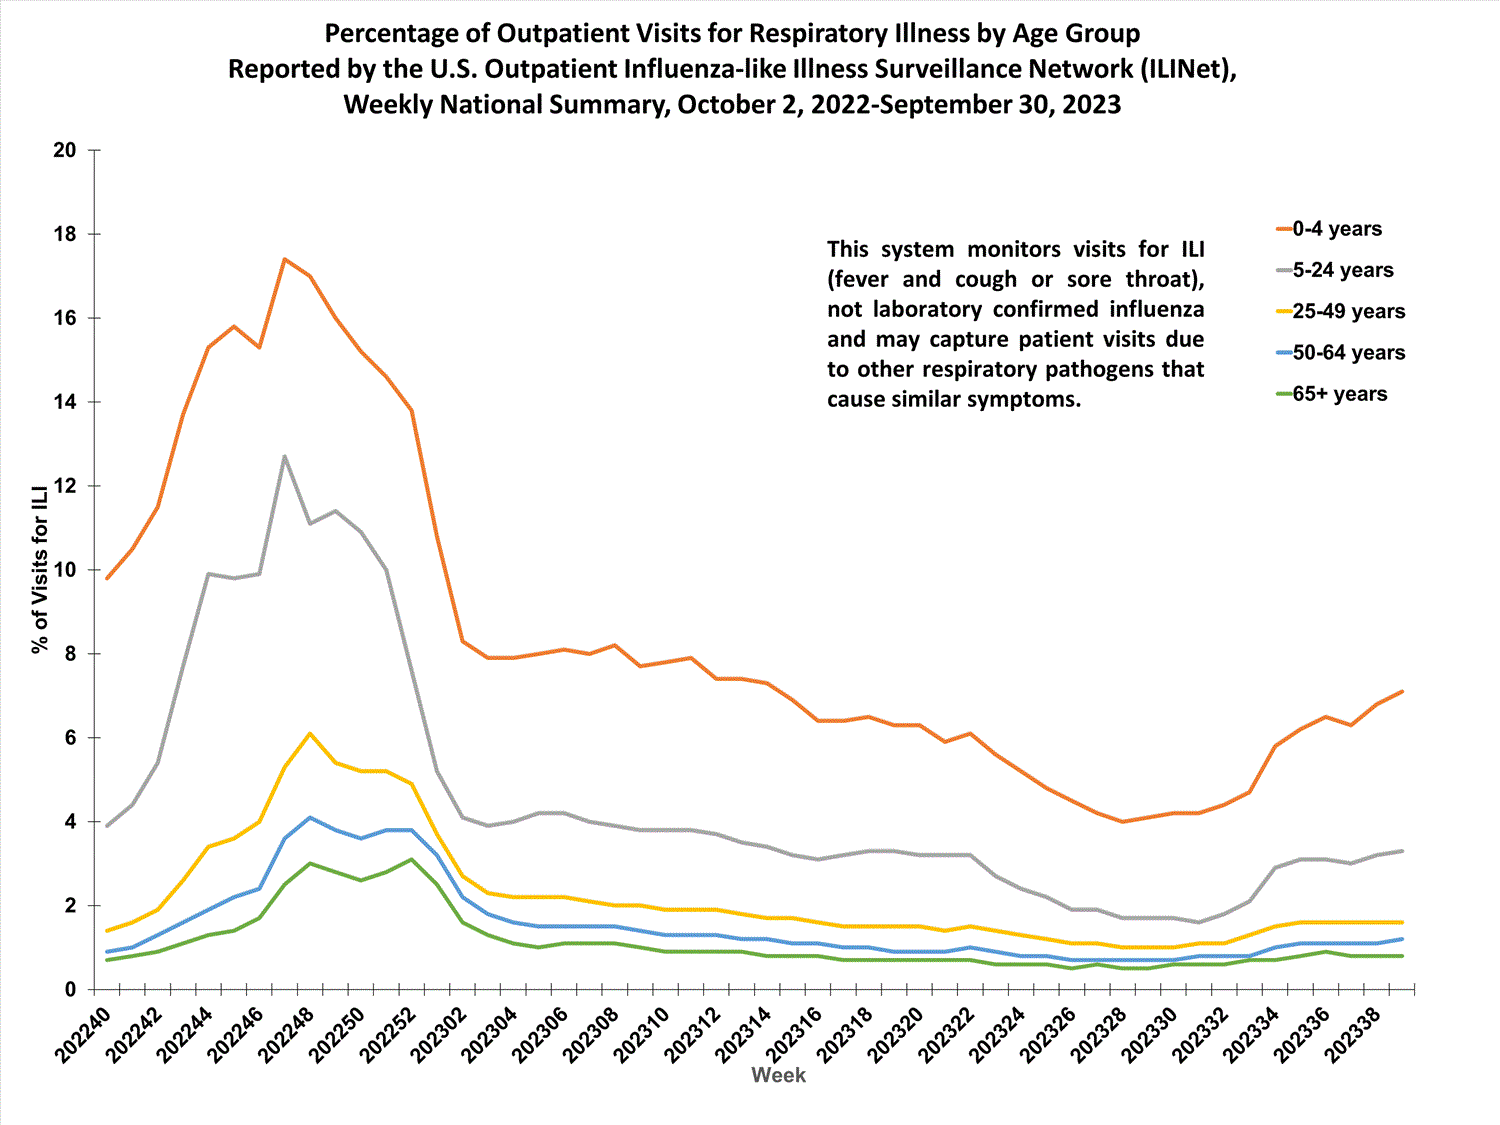
More than 70% of ILINet participants provide both the number of patient visits for respiratory illness and the total number of patient visits for the week broken out by age group. Data from this subset of providers are used to calculate the percentages of patient visits for respiratory illness by age group.

During week 31, the percentage of visits for respiratory illness reported in ILINet was 4.1% among those 0-4 years, 1.7% among those 5-24 years, 1.1% among those 25-49 years, 0.8% among those 50-64 years, and 0.6% among those 65 years and older.
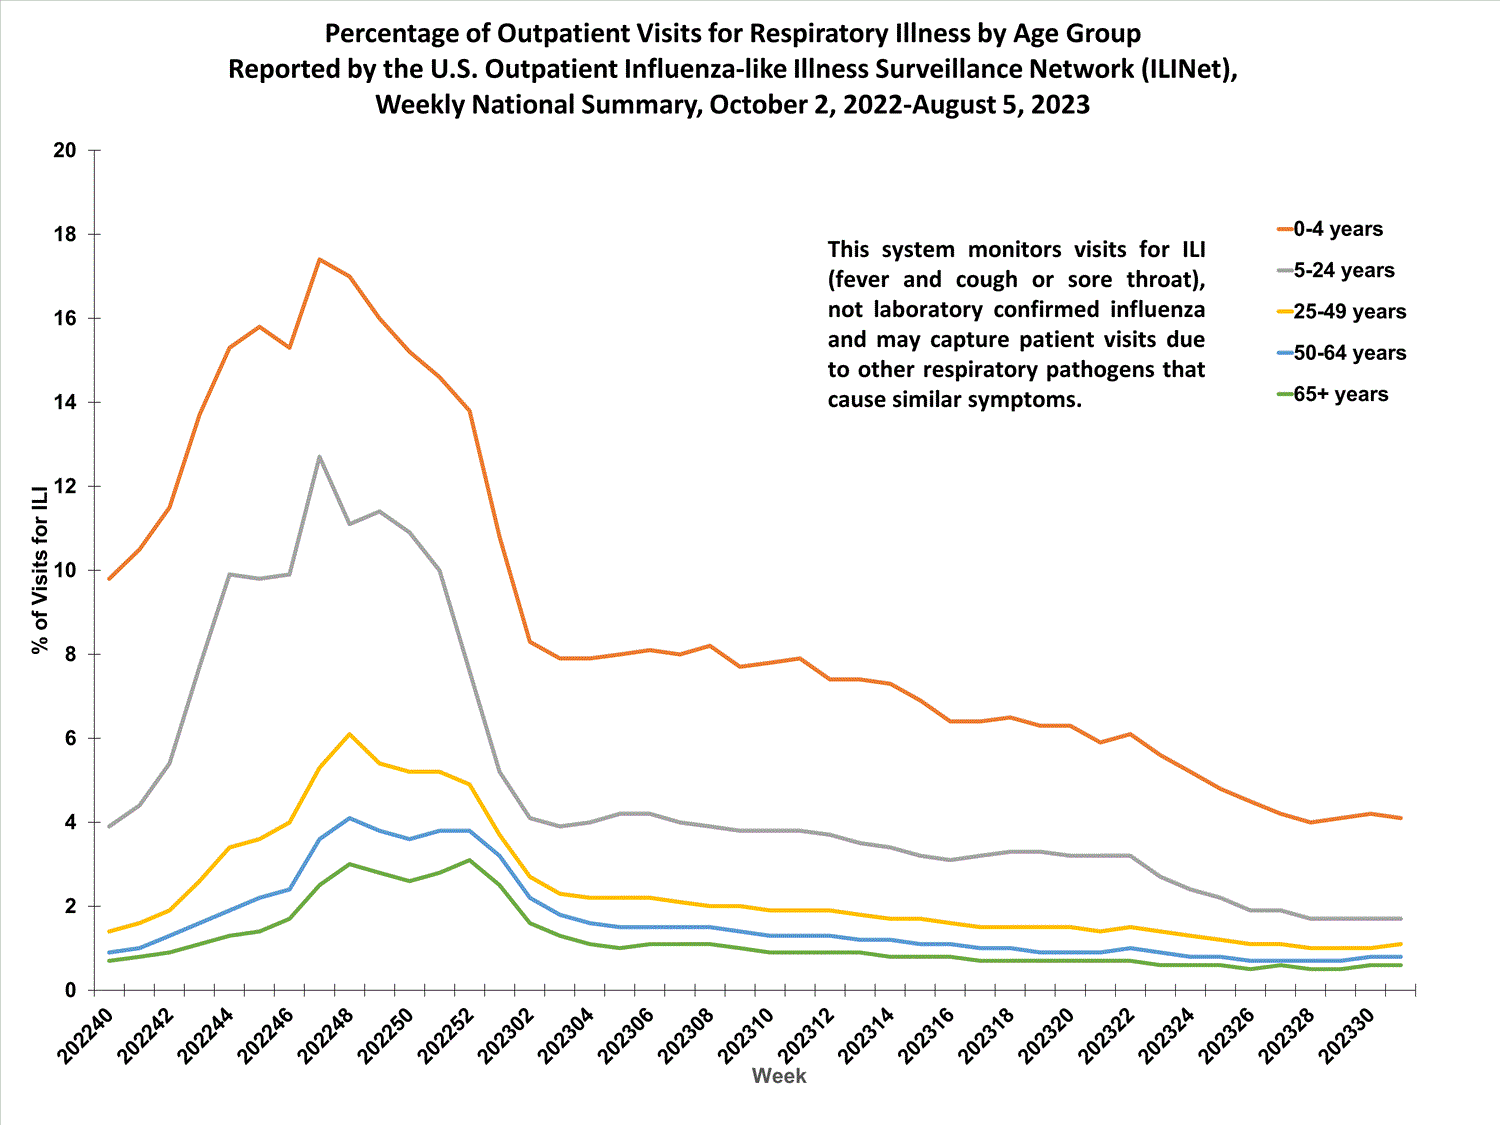
national levels of ILI and ARI by age group

View Chart Data | View Full Screen Outpatient Respiratory Illness Activity Map


Data collected in ILINet are used to produce a measure of ILI activity* by state/jurisdiction and Core Based Statistical Areas (CBSA).
Week 31
(Week ending
Aug. 5, 2023)
Week 30
(Week ending
Jul. 29, 2023)
Week 31
(Week ending
Aug. 5, 2023)
Week 30
(Week ending
Jul. 29, 2023)
Very High0000
High0010
Moderate0022
Low101015
Minimal5355625645
Insufficient Data10291267


*Data collected in ILINet may disproportionally represent certain populations within a jurisdiction or CBSA, and therefore, may not accurately depict the full picture of influenza activity for the entire jurisdiction or CBSA. Differences in the data presented here by CDC and independently by some health departments likely represent differing levels of data completeness with data presented by the health department likely being the more complete.
Additional information about medically attended visits for ILI for current and past seasons:
Surveillance Methods | FluView Interactive: National, Regional, and State Data or ILI Activity Map Hospitalization Surveillance

FluSurv-NET


The Influenza Hospitalization Surveillance Network (FluSurv-NET) conducts population-based surveillance for laboratory-confirmed influenza-related hospitalizations in select counties in 13 states and represents approximately 9% of the U.S. population. FluSurv-NET hospitalization data are preliminary. Patients admitted for laboratory-confirmed influenza-related hospitalization after April 30, 2023, will not be included in FluSurv-NET for the 2022-2023 season. Data on patients admitted through April 30, 2023, will continue to be updated on FluView Interactive as additional information is received.
Additional FluSurv-NET hospitalization surveillance information for current and past seasons and additional age groups:
Surveillance Methods |FluView Interactive: Rates by Age, Sex, and Race/Ethnicity or Data on Patient Characteristics | RESP-NET Interactive HHS Protect Hospitalization Surveillance


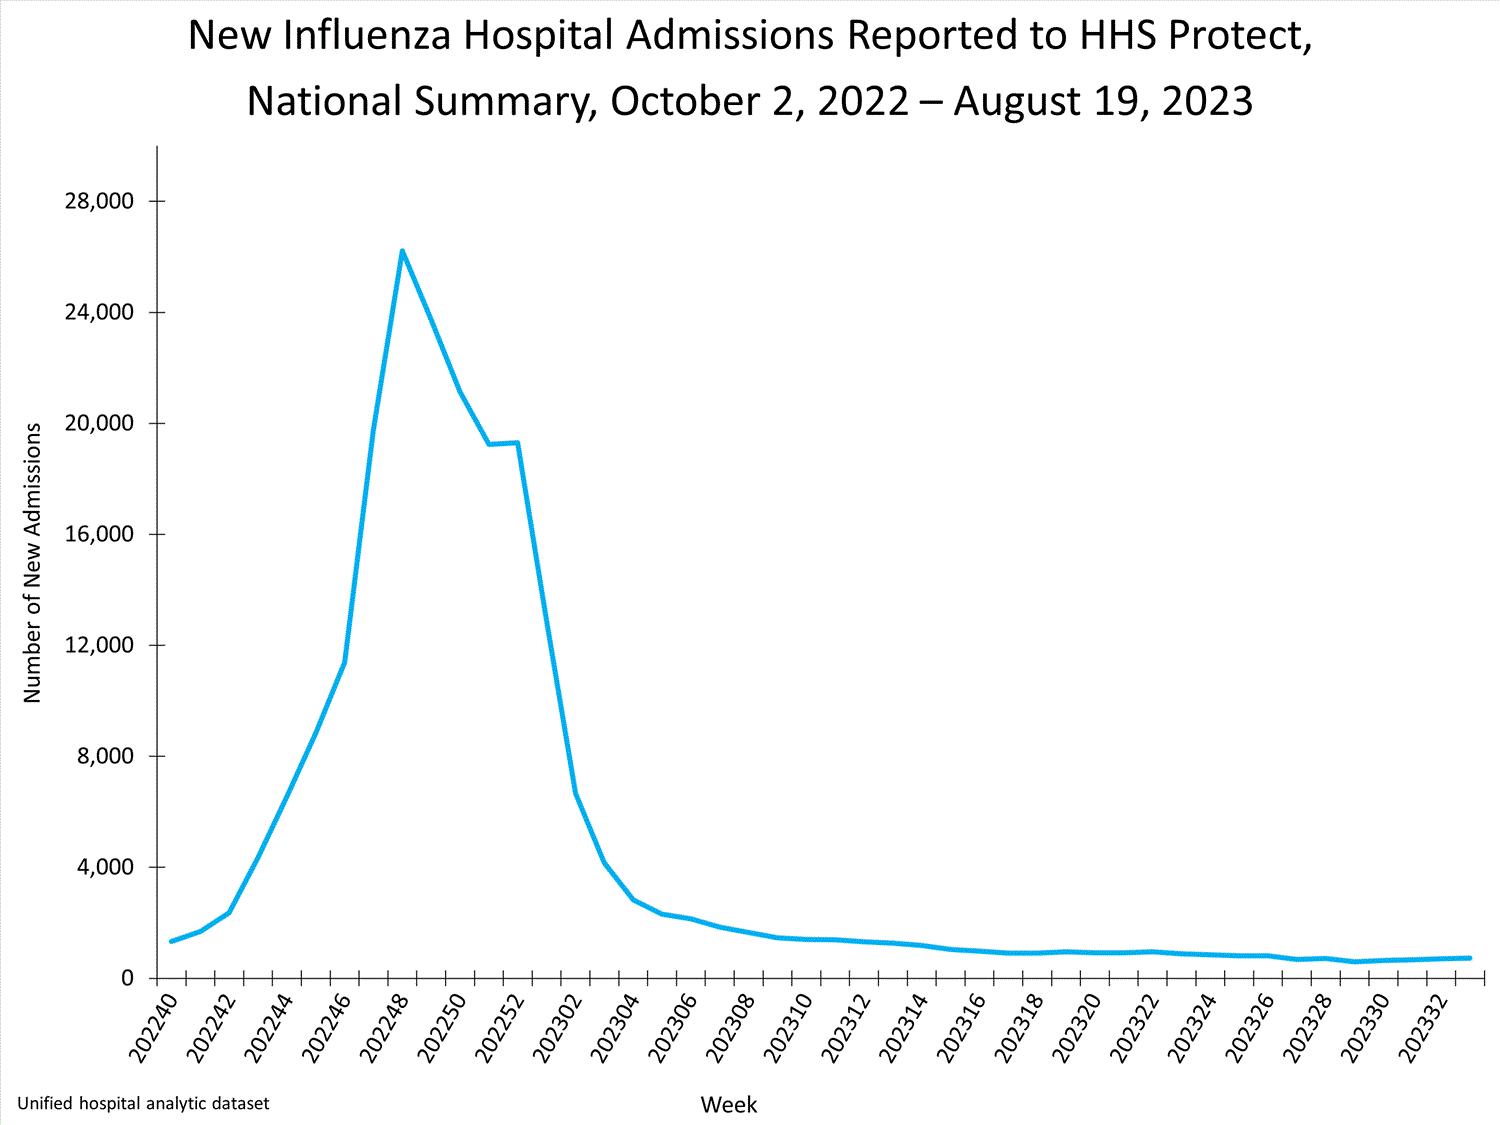
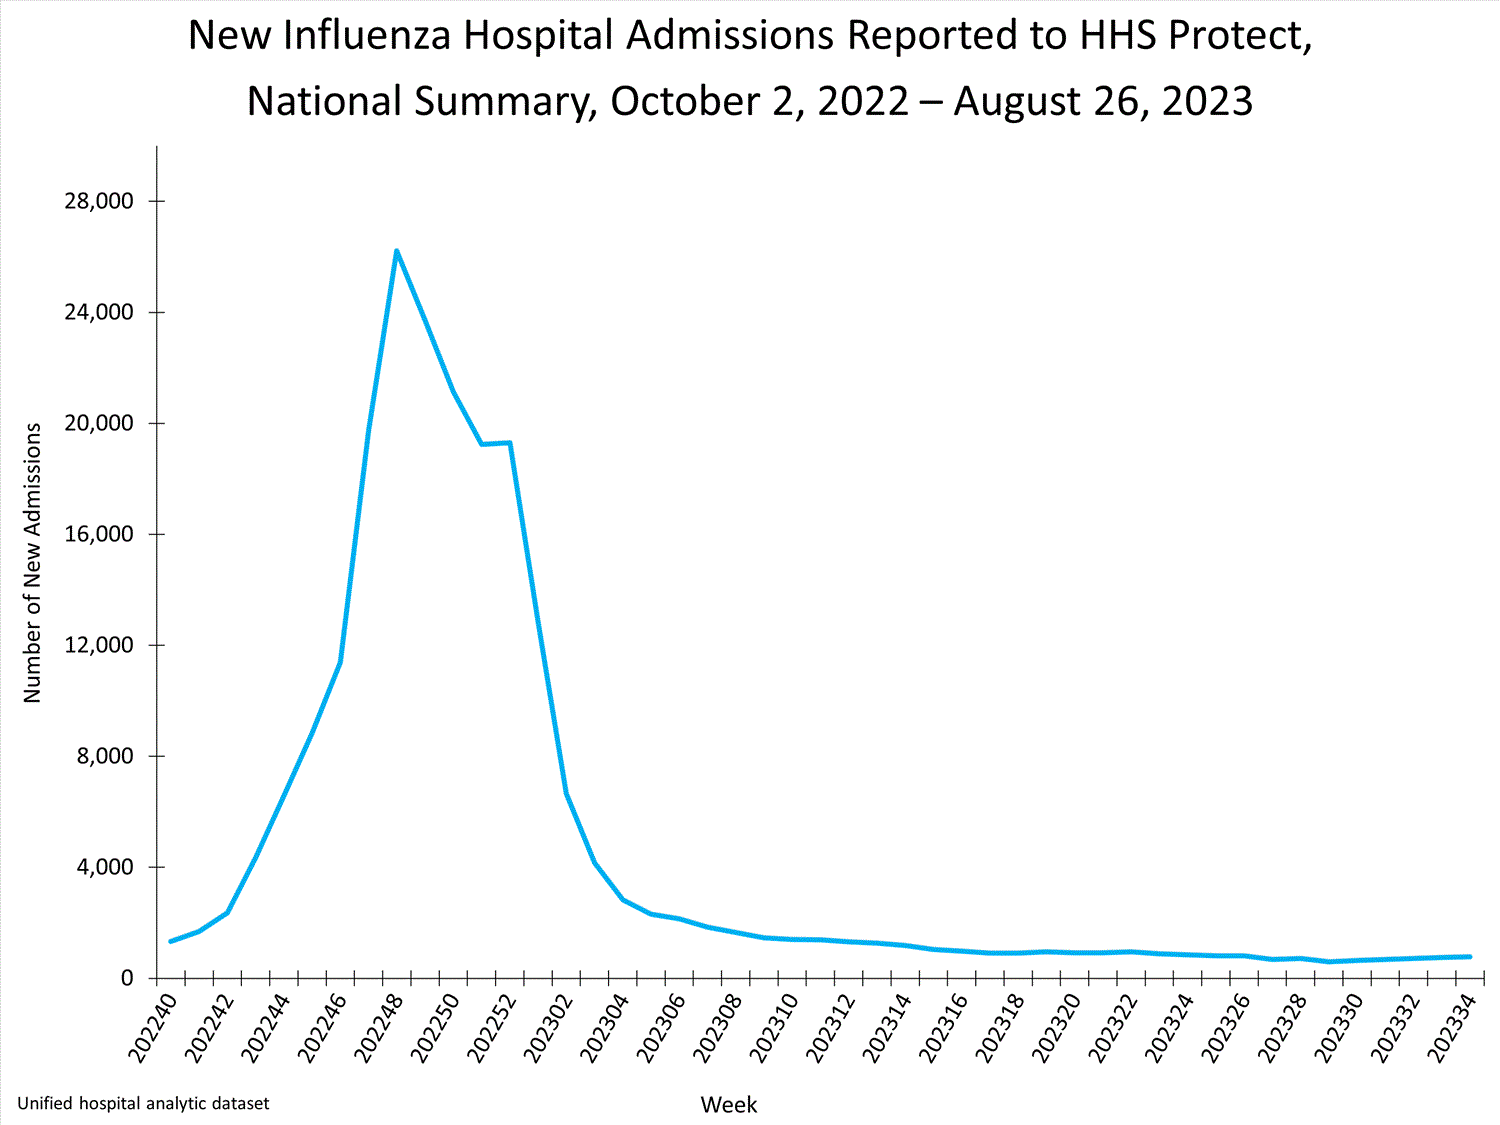
Hospitals report to HHS Protect the number of patients admitted with laboratory-confirmed influenza. During week 31, 638 patients with laboratory-confirmed influenza were admitted to a hospital.
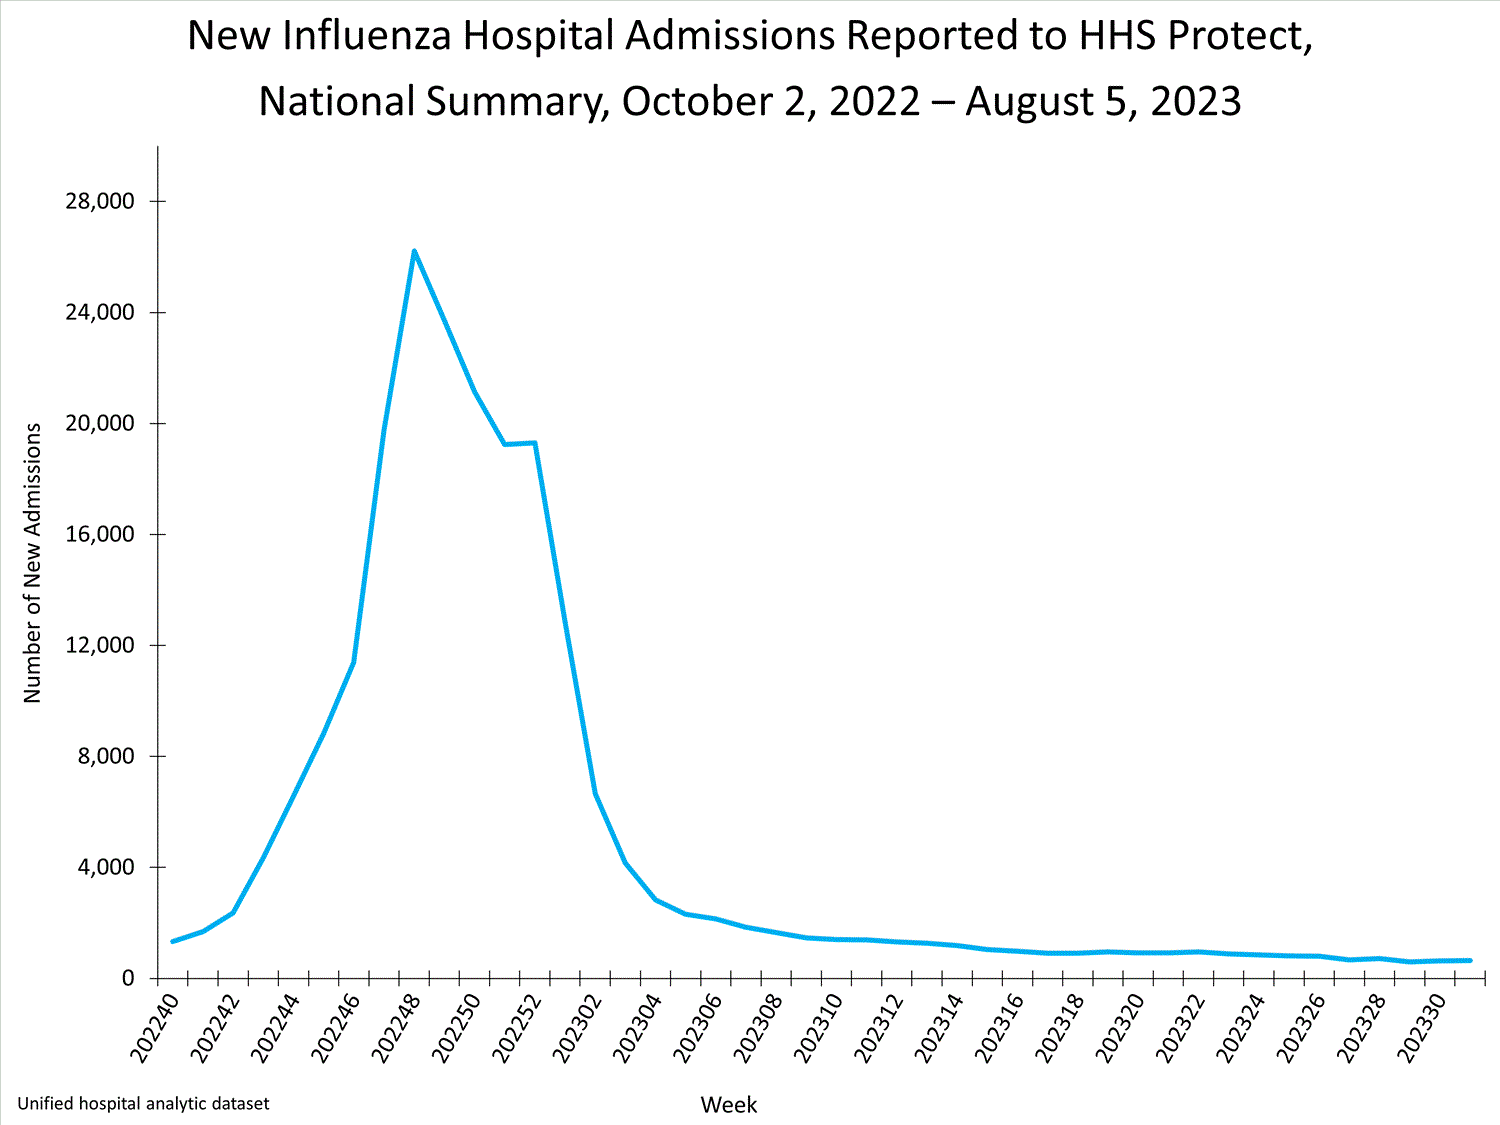
national levels of influenza hospitalizations
View Chart Data | View Full Screen
Additional HHS Protect hospitalization surveillance information:
Surveillance Methods | Additional Data Mortality Surveillance

National Center for Health Statistics (NCHS) Mortality Surveillance


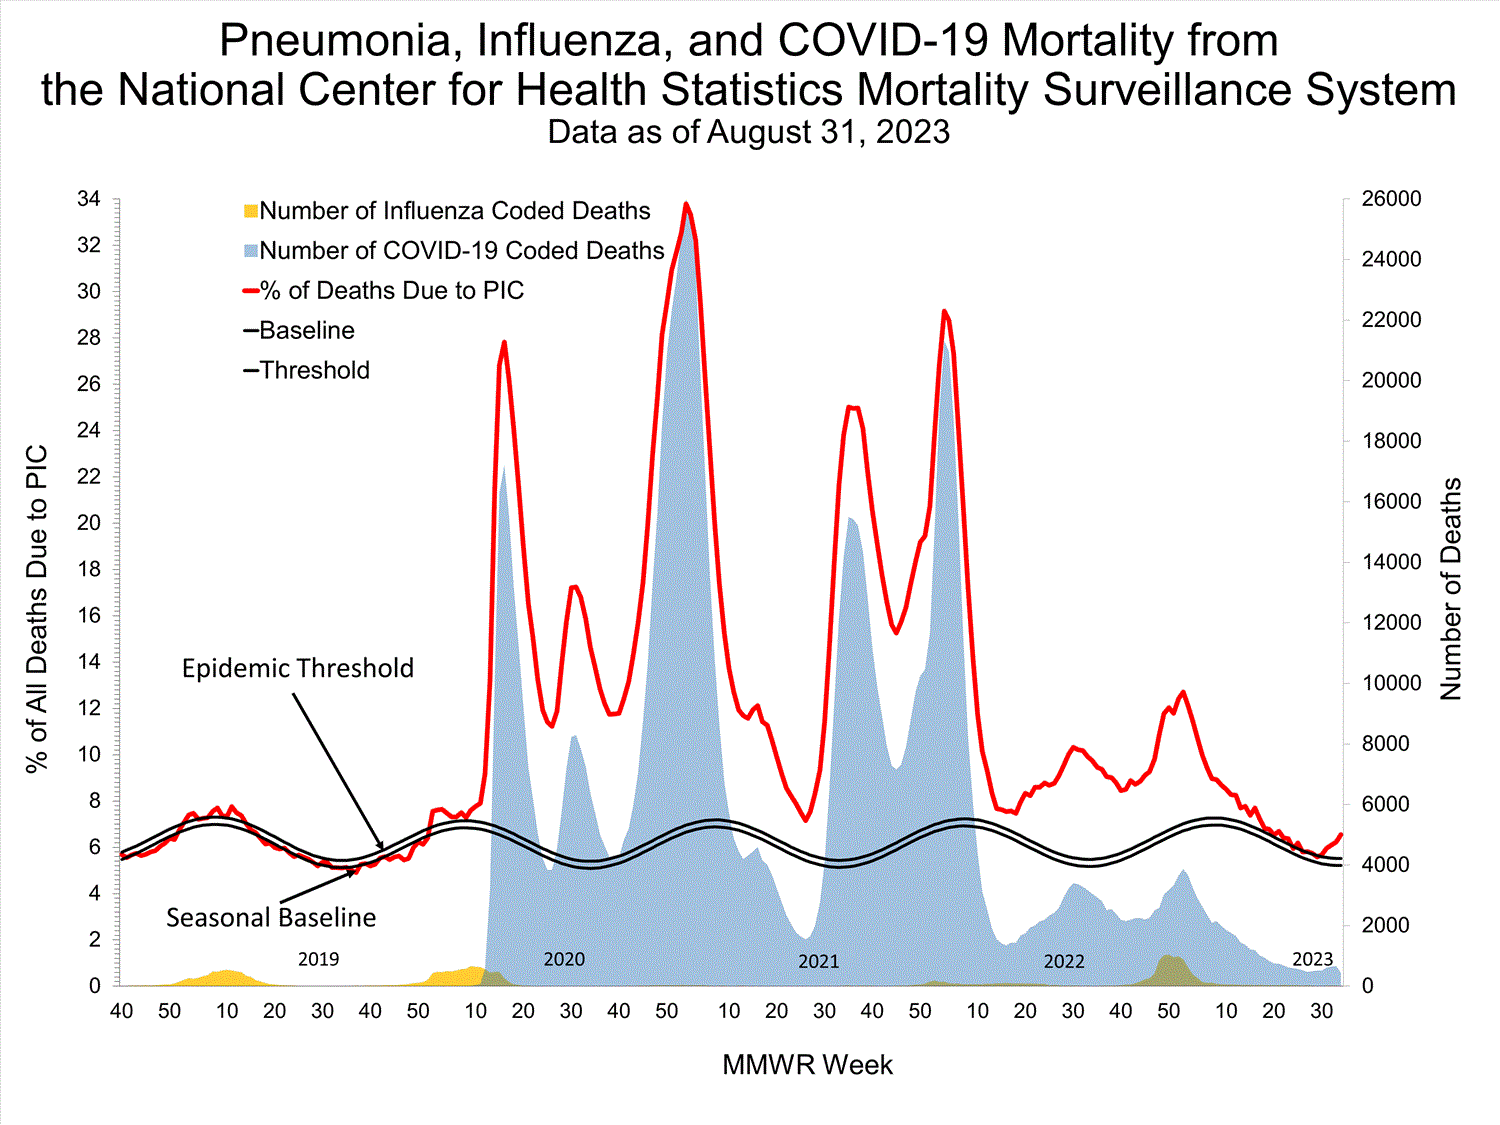
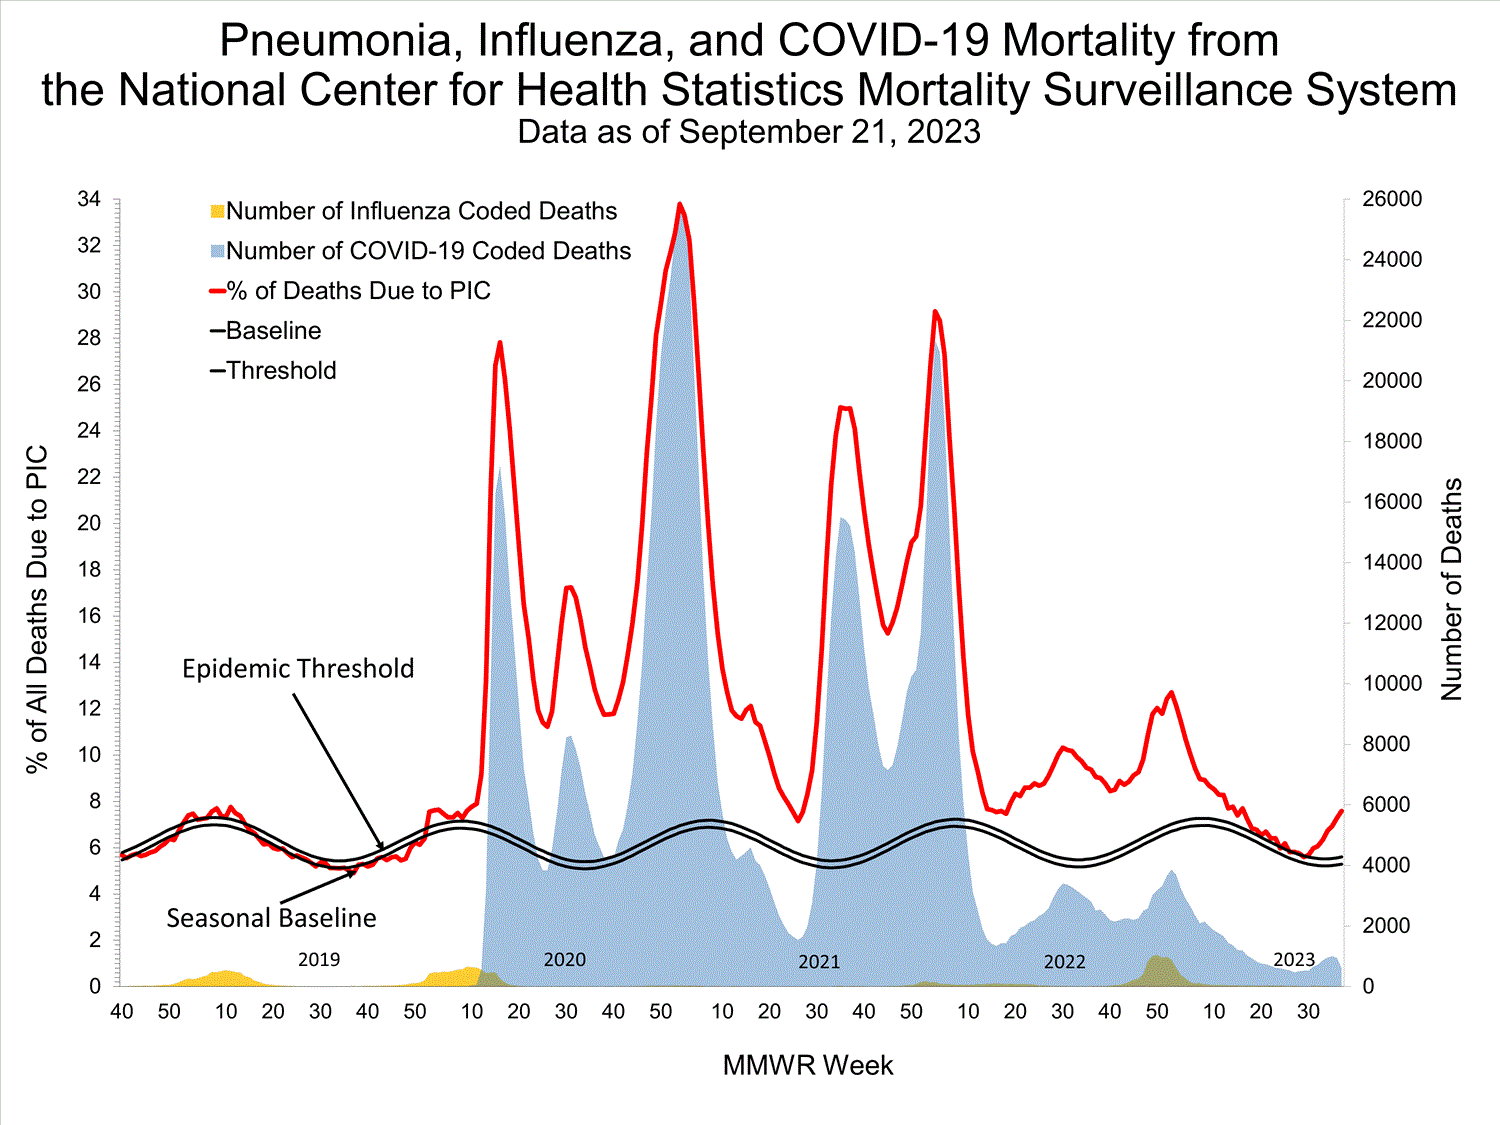
Based on NCHS mortality surveillance data available on August 10, 2023, 5.9% of the deaths that occurred during the week ending August 5, 2023 (week 31), were due to pneumonia, influenza, and/or COVID-19 (PIC). This percentage is above the epidemic threshold of 5.6% for this week. Among the 1,295 PIC deaths reported for this week, 262 had COVID-19 listed as an underlying or contributing cause of death on the death certificate, and 12 listed influenza. The data presented are preliminary and may change as more data are received and processed.
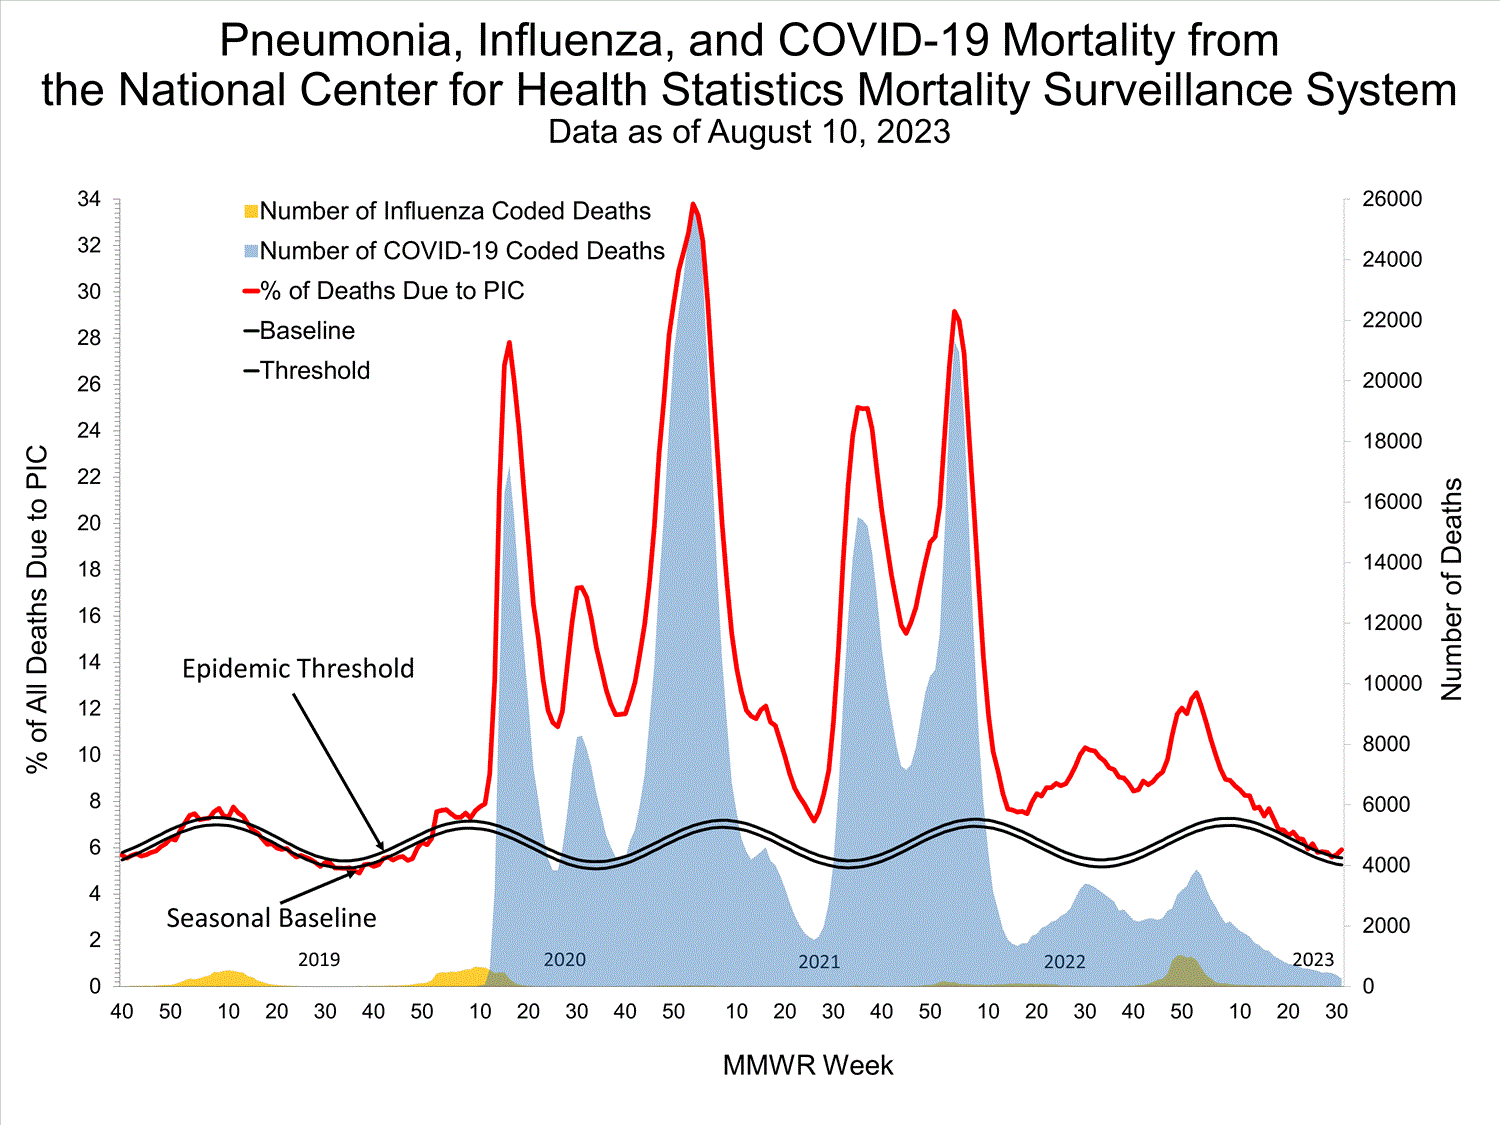
Click on image to launch interactive toolView Chart Data | View Full Screen
Additional pneumonia, influenza and COVID-19 mortality surveillance information for current and past seasons:
Surveillance Methods | FluView Interactive Influenza-Associated Pediatric Mortality


No influenza-associated pediatric deaths were reported to CDC during week 31.

A total of 166 influenza-associated pediatric deaths occurring during the 2022-2023 season have been reported to CDC.
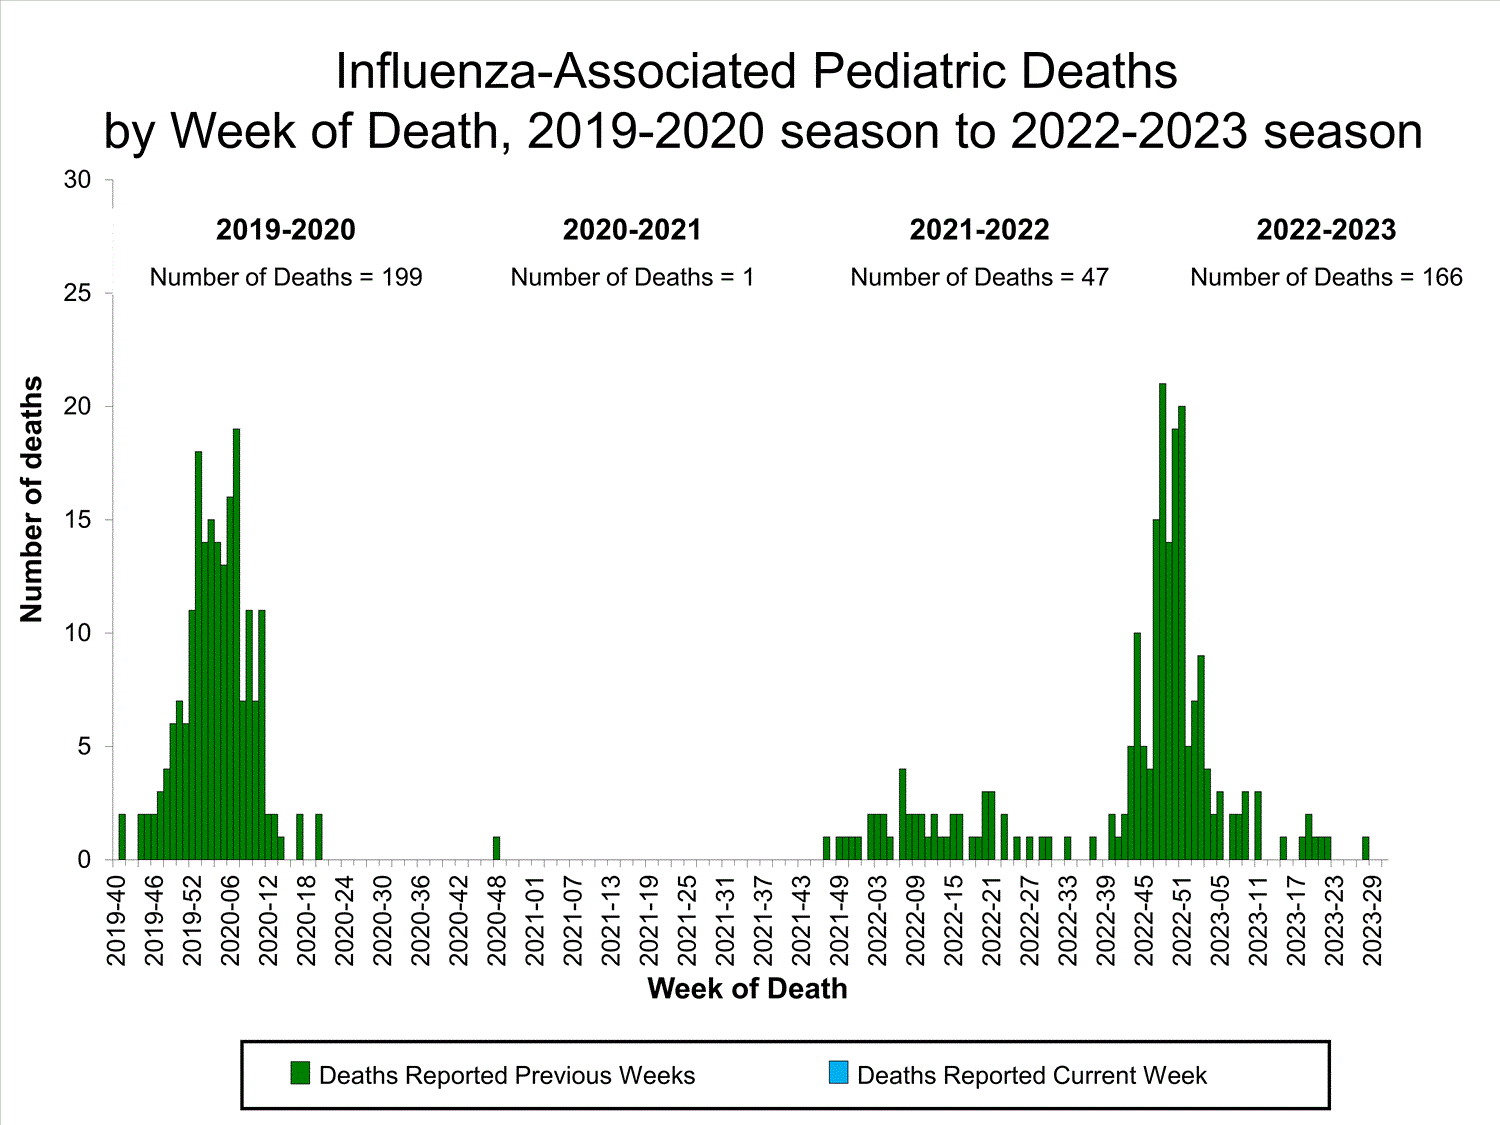
Click on image to launch interactive tool View Full Screen
Additional pediatric mortality surveillance information for current and past seasons:
Surveillance Methods | FluView Interactive

Additional National and International Influenza Surveillance Information


FluView Interactive: FluView includes enhanced web-based interactive applications that can provide dynamic visuals of the influenza data collected and analyzed by CDC. These FluView Interactive applications allow people to create customized, visual interpretations of influenza data, as well as make comparisons across flu seasons, regions, age groups and a variety of other demographics.

National Institute for Occupational Safety and Health: Monthly surveillance data on the prevalence of health-related workplace absenteeism among full-time workers in the United States are available from NIOSH.

U.S. State and local influenza surveillance: Select a jurisdiction below to access the latest local influenza information.

https://www.cdc.gov/flu/weekly/index.htm
 
Weekly U.S. Influenza Surveillance Report


Print
Updated August 18, 2023
fluview-banner2.jpg


2022-2023 Influenza Season

Week 32 ending August 12, 2023

All data in this report are preliminary and may change as more reports are received.

A description of the CDC influenza surveillance system, including methodology and detailed descriptions of each data component, is available on the surveillance methods page.

Additional information on the current and previous influenza seasons for each surveillance component is available on FluView Interactive. U.S. Virologic Surveillance

Clinical Laboratories


The results of tests performed by clinical laboratories nationwide are summarized below. Data from clinical laboratories (the percentage of specimens tested that are positive for influenza) are used to monitor whether influenza activity is increasing or decreasing.
No. of specimens tested26,2173,841,281
No. of positive specimens (%)214 (0.8%)357,346 (9.3%)
Positive specimens by type
Influenza A112 (52.3%)348,091 (97.4%)
Influenza B102 (47.7%)9,255 (2.6%)
INFLUENZA Virus Isolated

View Chart Data | View Full Screen Public Health Laboratories


The results of tests performed by public health laboratories nationwide are summarized below. Data from public health laboratories are used to monitor the proportion of circulating viruses that belong to each influenza virus type/subtype/lineage. Viruses known to be associated with recent live attenuated influenza vaccine (LAIV) receipt or found upon further testing to be a vaccine virus are not included as they are not circulating influenza viruses.
No. of specimens tested1,533274,960
No. of positive specimens3430,582
Positive specimens by type/subtype
Influenza A20 (58.8%)29,257 (95.7%)
(H1N1)pdm099 (81.8%)7,243 (29.1%)
H3N22 (18.2%)17,658 (70.9%)
H3N2v02 (<0.1%)
Subtyping not performed94,354
Influenza B14 (41.2%)1,325 (4.3%)
Yamagata lineage0 (0%)0
Victoria lineage4 (100%)1,067 (100%)
Lineage not performed10258


INFLUENZA Virus Isolated
View Chart Data | View Full Screen
Additional virologic surveillance information for current and past seasons:
Surveillance Methods | FluView Interactive: National, Regional, and State Data or Age Data Outpatient Respiratory Illness Surveillance


The U.S. Outpatient Influenza-like Illness Surveillance Network (ILINet) monitors outpatient visits for respiratory illness referred to as influenza-like illness [ILI (fever plus cough or sore throat)], not laboratory-confirmed influenza, and may capture respiratory illness visits due to infection with any pathogen that can present with similar symptoms, including influenza, SARS-CoV-2, and RSV. Therefore, it is important to evaluate syndromic surveillance data, including that from ILINet, in the context of other sources of surveillance data to obtain a complete and accurate picture of influenza, SARS-CoV-2, and other respiratory virus activity. Other respiratory virus surveillance data can be found on CDC’s COVID Data Tracker, NCIRD Surveillance Systems website and National Respiratory and Enteric Virus Surveillance System (NREVSS) website. Outpatient Respiratory Illness Visits


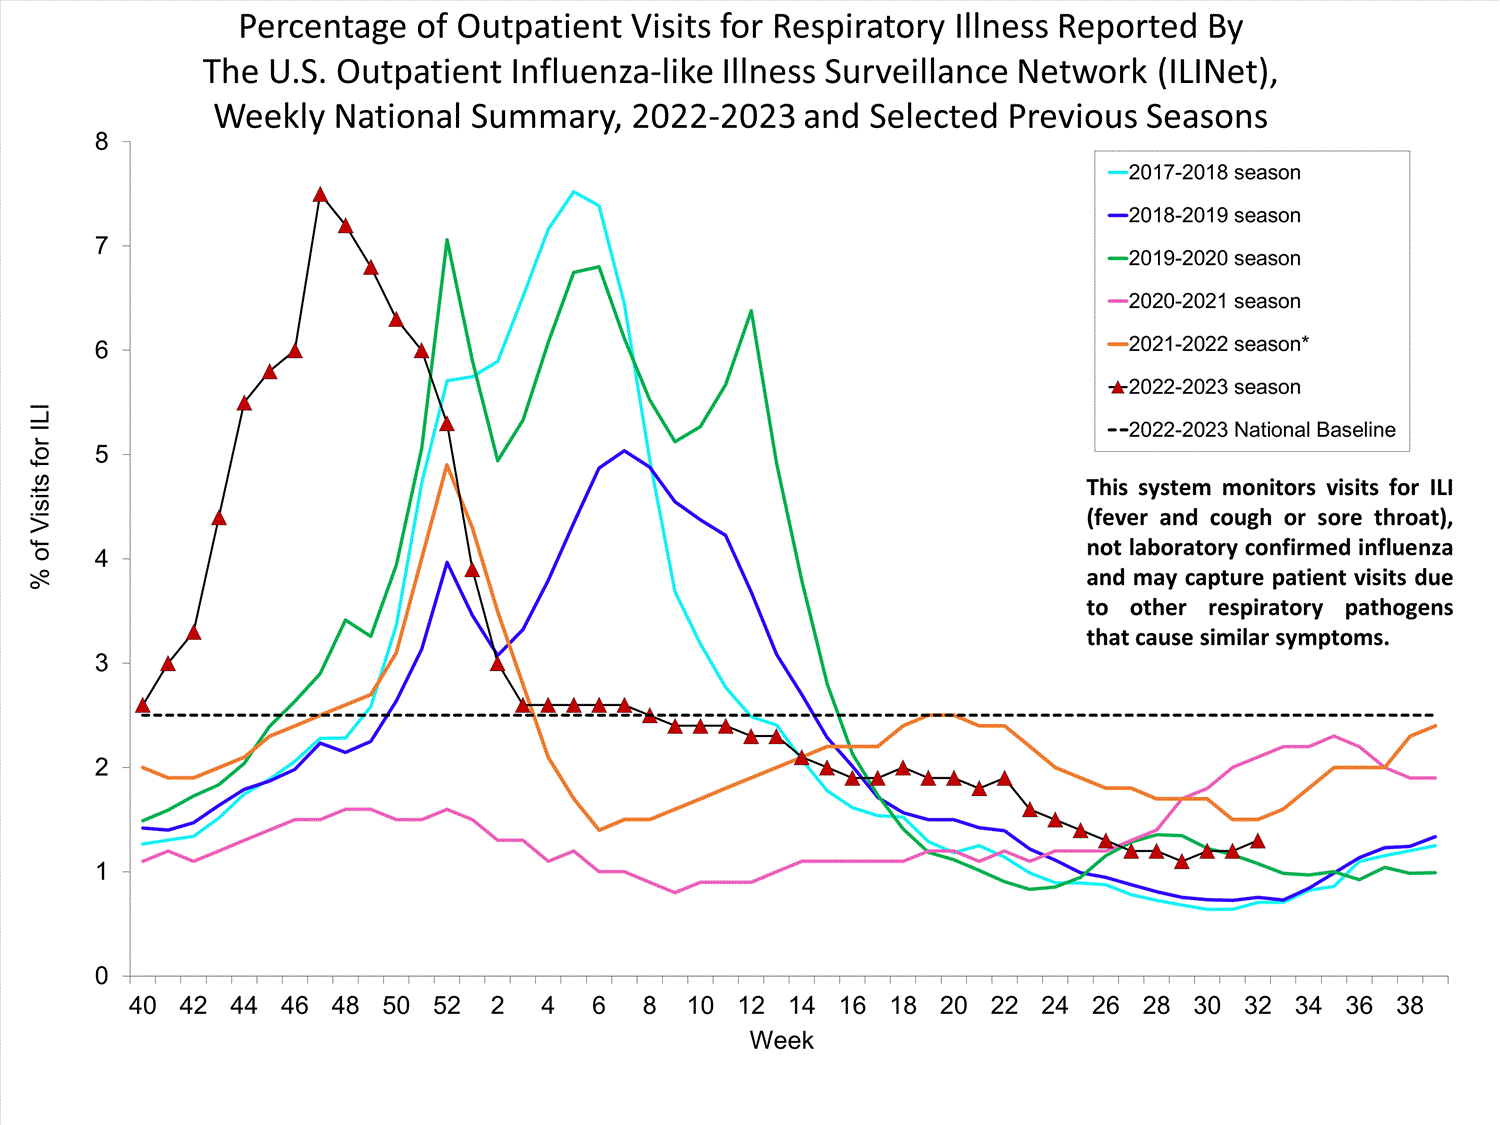
Nationwide during week 32 1.3% of patient visits reported through ILINet were due to respiratory illness that included fever plus a cough or sore throat, also referred to as ILI. Multiple respiratory viruses are co-circulating, and the relative contribution of influenza virus infection to ILI varies by location.

national levels of ILI and ARI

* Effective October 3, 2021 (week 40), the ILI definition (fever plus cough or sore throat) no longer includes “without a known cause other than influenza.”

View Chart Data (current season only) | View Full Screen Outpatient Respiratory Illness Visits by Age Group


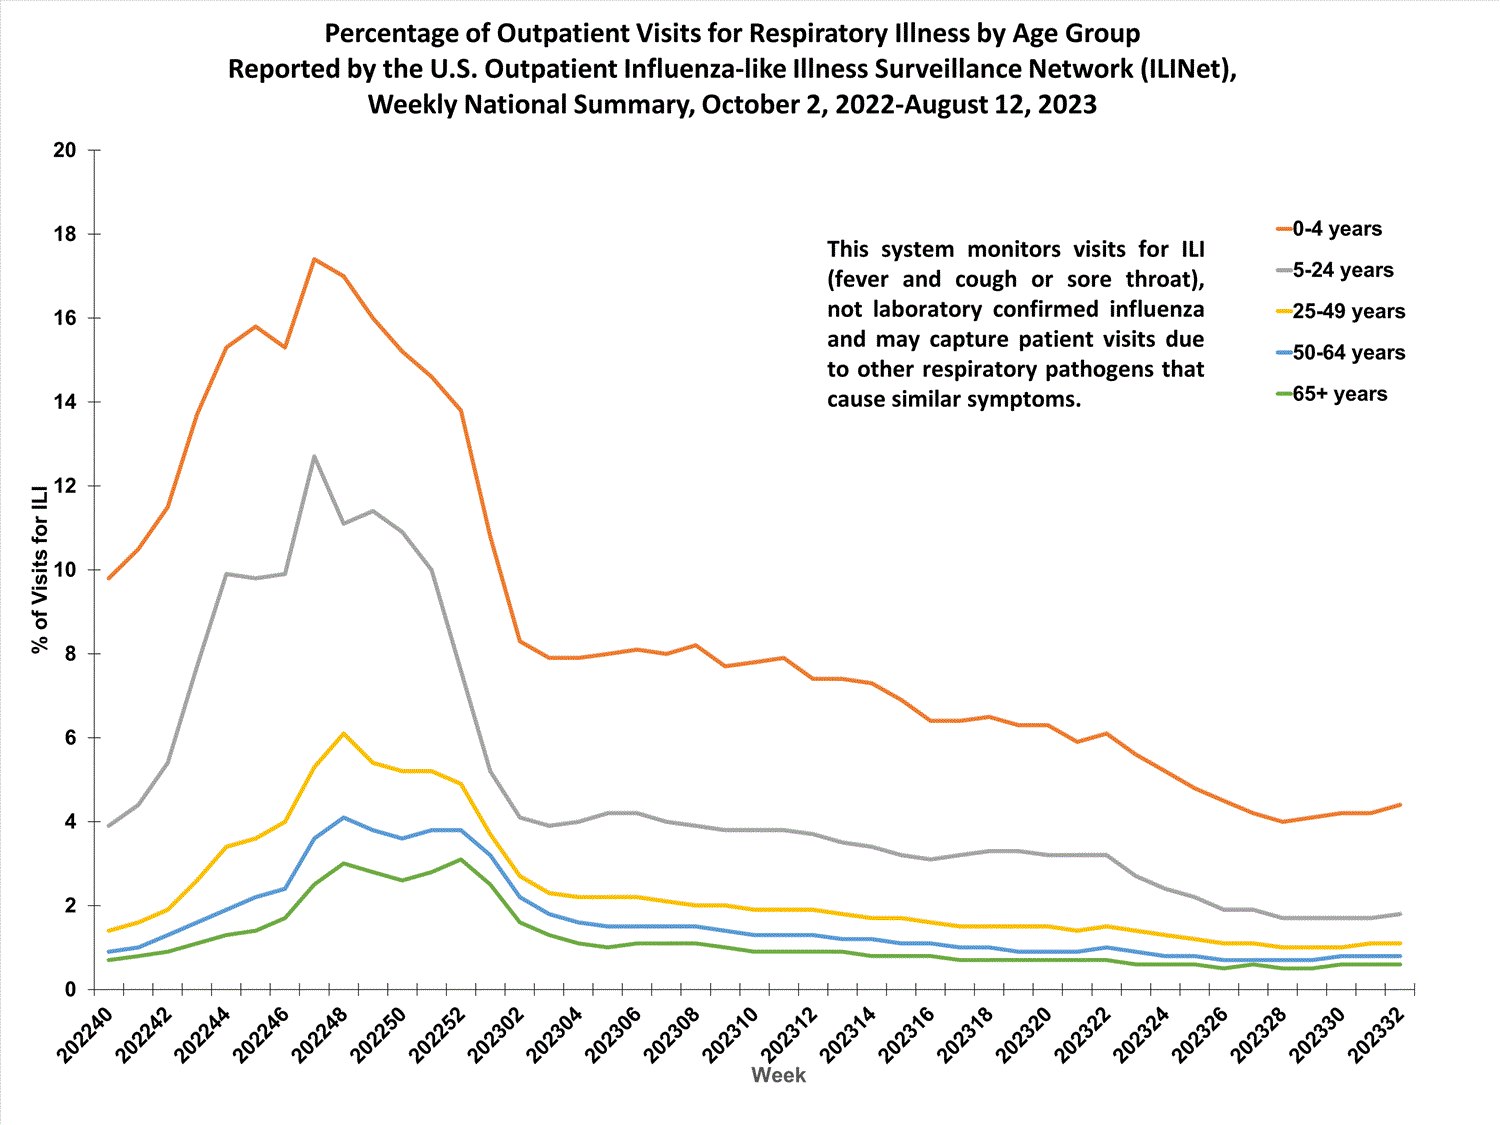
More than 70% of ILINet participants provide both the number of patient visits for respiratory illness and the total number of patient visits for the week broken out by age group. Data from this subset of providers are used to calculate the percentages of patient visits for respiratory illness by age group.

During week 32, the percentage of visits for respiratory illness reported in ILINet was 4.4% among those 0-4 years, 1.8% among those 5-24 years, 1.1% among those 25-49 years, 0.8% among those 50-64 years, and 0.6% among those 65 years and older.

national levels of ILI and ARI by age group

View Chart Data | View Full Screen Outpatient Respiratory Illness Activity Map


Data collected in ILINet are used to produce a measure of ILI activity* by state/jurisdiction and Core Based Statistical Areas (CBSA).
Week 32
(Week ending
Aug. 12, 2023)
Week 31
(Week ending
Aug. 5, 2023)
Week 32
(Week ending
Aug. 12, 2023)
Week 31
(Week ending
Aug. 5, 2023)
Very High0011
High0022
Moderate0062
Low111712
Minimal5454628643
Insufficient Data00275269


*Data collected in ILINet may disproportionally represent certain populations within a jurisdiction or CBSA, and therefore, may not accurately depict the full picture of influenza activity for the entire jurisdiction or CBSA. Differences in the data presented here by CDC and independently by some health departments likely represent differing levels of data completeness with data presented by the health department likely being the more complete.
Additional information about medically attended visits for ILI for current and past seasons:
Surveillance Methods | FluView Interactive: National, Regional, and State Data or ILI Activity Map Hospitalization Surveillance

FluSurv-NET


The Influenza Hospitalization Surveillance Network (FluSurv-NET) conducts population-based surveillance for laboratory-confirmed influenza-related hospitalizations in select counties in 13 states and represents approximately 9% of the U.S. population. FluSurv-NET hospitalization data are preliminary. Patients admitted for laboratory-confirmed influenza-related hospitalization after April 30, 2023, will not be included in FluSurv-NET for the 2022-2023 season. Data on patients admitted through April 30, 2023, will continue to be updated on FluView Interactive as additional information is received.
Additional FluSurv-NET hospitalization surveillance information for current and past seasons and additional age groups:
Surveillance Methods |FluView Interactive: Rates by Age, Sex, and Race/Ethnicity or Data on Patient Characteristics | RESP-NET Interactive HHS Protect Hospitalization Surveillance


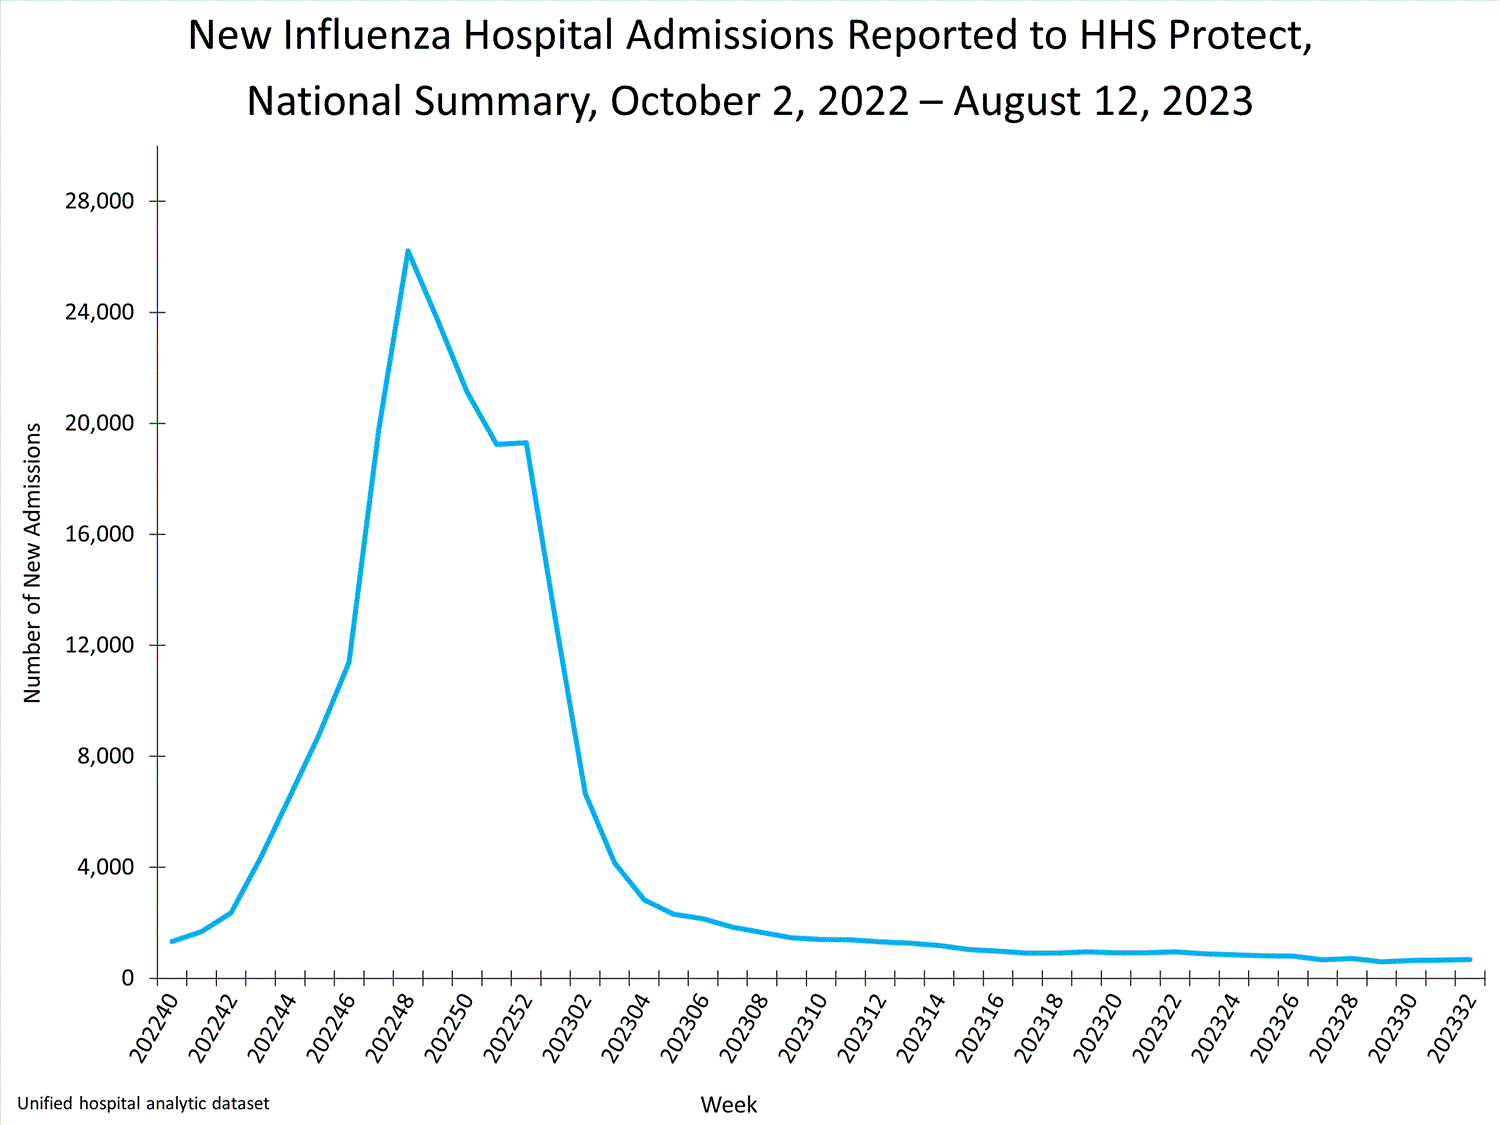
Hospitals report to HHS Protect the number of patients admitted with laboratory-confirmed influenza. During week 32, 677 patients with laboratory-confirmed influenza were admitted to a hospital.

national levels of influenza hospitalizations
View Chart Data | View Full Screen
Additional HHS Protect hospitalization surveillance information:
Surveillance Methods | Additional Data Mortality Surveillance

National Center for Health Statistics (NCHS) Mortality Surveillance


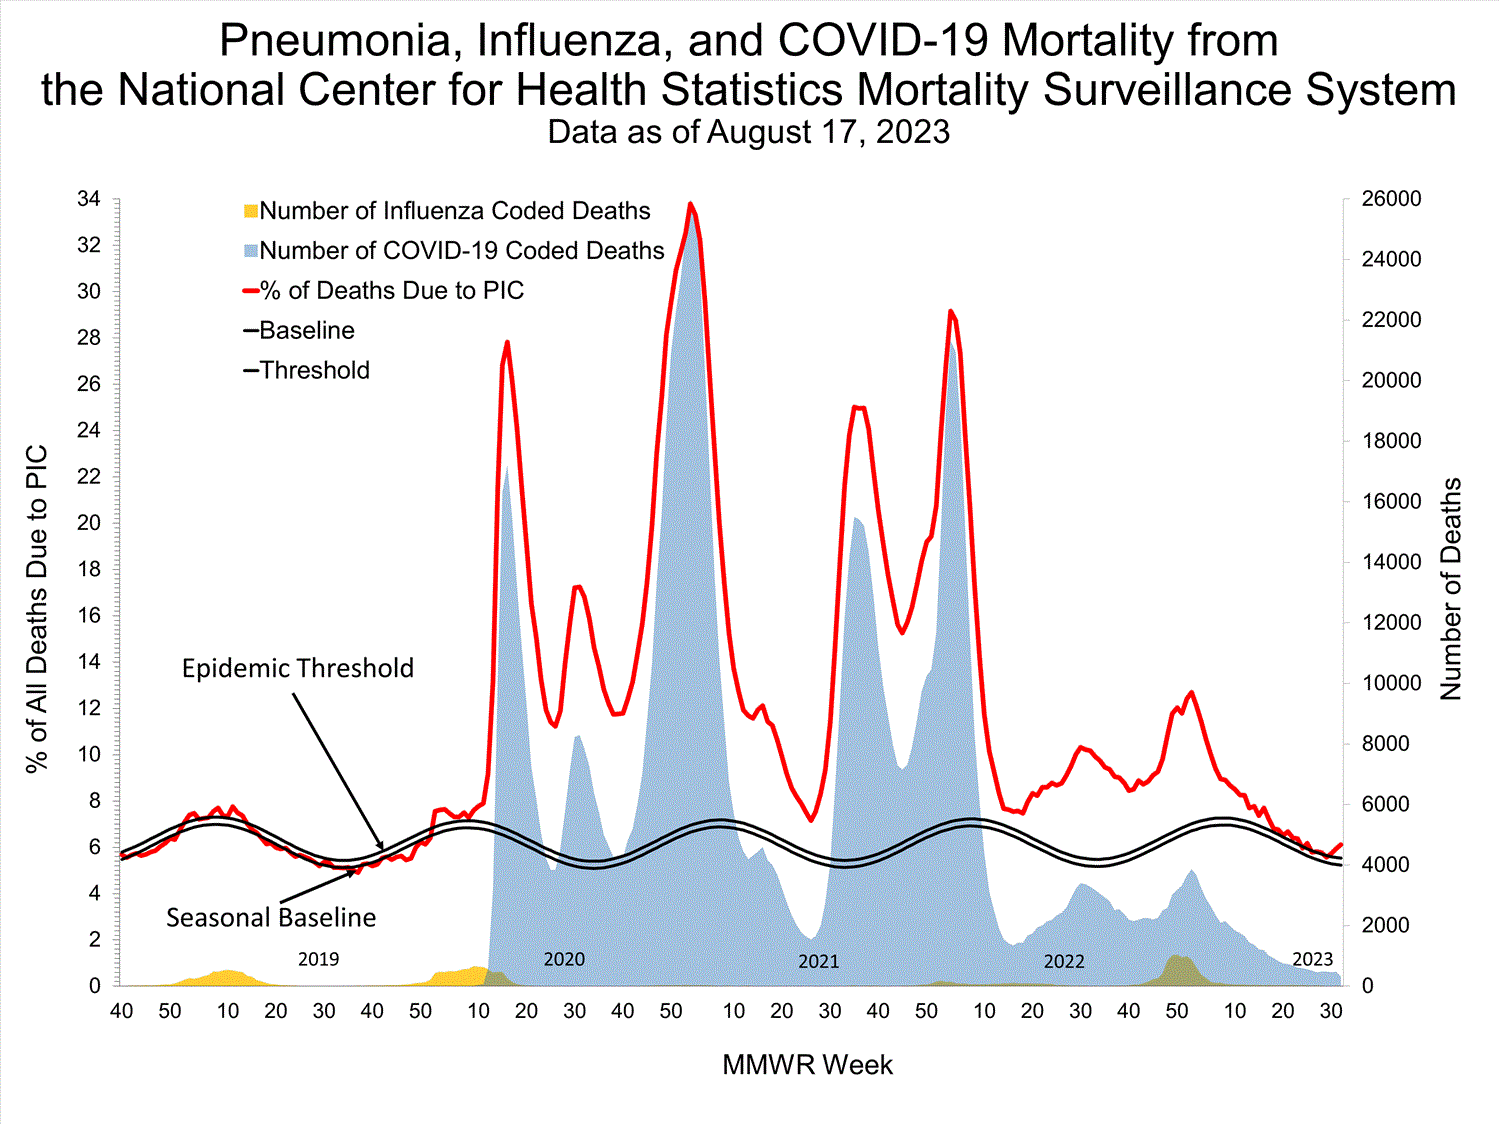
Based on NCHS mortality surveillance data available on August 17, 2023, 6.1% of the deaths that occurred during the week ending August 12, 2023 (week 32), were due to pneumonia, influenza, and/or COVID-19 (PIC). This percentage is above the epidemic threshold of 5.5% for this week. Among the 1,414 PIC deaths reported for this week, 313 had COVID-19 listed as an underlying or contributing cause of death on the death certificate, and 6 listed influenza. The data presented are preliminary and may change as more data are received and processed.

Click on image to launch interactive toolView Chart Data | View Full Screen
Additional pneumonia, influenza and COVID-19 mortality surveillance information for current and past seasons:
Surveillance Methods | FluView Interactive Influenza-Associated Pediatric Mortality


Four influenza-associated pediatric deaths were reported to CDC during week 32.

Two deaths occurred during the 2022-2023 season, bringing the total number of pediatric deaths for this season to 168. One of these deaths was associated with an influenza A(H1N1) virus and occurred during week 46 of 2022 (the week ending November 19, 2022). The other death was associated with an influenza A virus for which no subtyping was performed and occurred during week 51 of 2022 (the week ending December 24, 2022).

Two deaths occurred during the 2021-2022 season, which brings the total number of pediatric deaths for the season to 49. One death occurred during week 1 of 2022 (the week ending January 8, 2022) and the other death occurred during week 7 of 2022 (the week ending February 19, 2022). Both deaths were associated with influenza A(H3) viruses.

Click on image to launch interactive tool View Full Screen
Additional pediatric mortality surveillance information for current and past seasons:
Surveillance Methods | FluView Interactive

Additional National and International Influenza Surveillance Information


FluView Interactive: FluView includes enhanced web-based interactive applications that can provide dynamic visuals of the influenza data collected and analyzed by CDC. These FluView Interactive applications allow people to create customized, visual interpretations of influenza data, as well as make comparisons across flu seasons, regions, age groups and a variety of other demographics.

National Institute for Occupational Safety and Health: Monthly surveillance data on the prevalence of health-related workplace absenteeism among full-time workers in the United States are available from NIOSH.

U.S. State and local influenza surveillance: Select a jurisdiction below to access the latest local influenza information.
 
Weekly U.S. Influenza Surveillance Report


Print
Updated August 25, 2023
fluview-banner2.jpg


2022-2023 Influenza Season

Week 33 ending August 19, 2023

All data in this report are preliminary and may change as more reports are received.

A description of the CDC influenza surveillance system, including methodology and detailed descriptions of each data component, is available on the surveillance methods page.

Additional information on the current and previous influenza seasons for each surveillance component is available on FluView Interactive. U.S. Virologic Surveillance

Clinical Laboratories


The results of tests performed by clinical laboratories nationwide are summarized below. Data from clinical laboratories (the percentage of specimens tested that are positive for influenza) are used to monitor whether influenza activity is increasing or decreasing.
No. of specimens tested29,3803,880,893
No. of positive specimens (%)257 (0.9%)357,737 (9.2%)
Positive specimens by type
Influenza A153 (59.5%)348,355 (97.4%)
Influenza B104 (40.5%)9,382 (2.6%)
INFLUENZA Virus Isolated

View Chart Data | View Full Screen Public Health Laboratories


The results of tests performed by public health laboratories nationwide are summarized below. Data from public health laboratories are used to monitor the proportion of circulating viruses that belong to each influenza virus type/subtype/lineage. Viruses known to be associated with recent live attenuated influenza vaccine (LAIV) receipt or found upon further testing to be a vaccine virus are not included as they are not circulating influenza viruses.
No. of specimens tested1,442277,334
No. of positive specimens3730,706
Positive specimens by type/subtype
Influenza A28 (75.7%)29,346 (95.6%)
(H1N1)pdm0911 (68.8%)7,301 (29.2%)
H3N25 (31.3%)17,668 (70.8%)
H3N2v02 (<0.1%)
Subtyping not performed124,375
Influenza B9 (24.3%)1,360 (4.4%)
Yamagata lineage0 (0%)0
Victoria lineage4 (100%)1,099 (100%)
Lineage not performed5261


INFLUENZA Virus Isolated
View Chart Data | View Full Screen
Additional virologic surveillance information for current and past seasons:
Surveillance Methods | FluView Interactive: National, Regional, and State Data or Age Data Outpatient Respiratory Illness Surveillance


The U.S. Outpatient Influenza-like Illness Surveillance Network (ILINet) monitors outpatient visits for respiratory illness referred to as influenza-like illness [ILI (fever plus cough or sore throat)], not laboratory-confirmed influenza, and may capture respiratory illness visits due to infection with any pathogen that can present with similar symptoms, including influenza, SARS-CoV-2, and RSV. Therefore, it is important to evaluate syndromic surveillance data, including that from ILINet, in the context of other sources of surveillance data to obtain a complete and accurate picture of influenza, SARS-CoV-2, and other respiratory virus activity. Other respiratory virus surveillance data can be found on CDC’s COVID Data Tracker, NCIRD Surveillance Systems website and National Respiratory and Enteric Virus Surveillance System (NREVSS) website. Outpatient Respiratory Illness Visits


Nationwide during week 33, 1.4% of patient visits reported through ILINet were due to respiratory illness that included fever plus a cough or sore throat, also referred to as ILI. Multiple respiratory viruses are co-circulating, and the relative contribution of influenza virus infection to ILI varies by location.

national levels of ILI and ARI

* Effective October 3, 2021 (week 40), the ILI definition (fever plus cough or sore throat) no longer includes “without a known cause other than influenza.”

View Chart Data (current season only) | View Full Screen Outpatient Respiratory Illness Visits by Age Group


More than 70% of ILINet participants provide both the number of patient visits for respiratory illness and the total number of patient visits for the week broken out by age group. Data from this subset of providers are used to calculate the percentages of patient visits for respiratory illness by age group.

During week 33, the percentage of visits for respiratory illness reported in ILINet was 4.7% among those 0-4 years, 2.1% among those 5-24 years, 1.1% among those 25-49 years, 0.8% among those 50-64 years, and 0.6% among those 65 years and older.

national levels of ILI and ARI by age group

View Chart Data | View Full Screen Outpatient Respiratory Illness Activity Map


Data collected in ILINet are used to produce a measure of ILI activity* by state/jurisdiction and Core Based Statistical Areas (CBSA).
Week 33
(Week ending
Aug. 19, 2023)
Week 32
(Week ending
Aug. 12, 2023)
Week 33
(Week ending
Aug. 19, 2023)
Week 32
(Week ending
Aug. 12, 2023)
Very High0001
High0052
Moderate00106
Low313517
Minimal5254609633
Insufficient Data00270270


*Data collected in ILINet may disproportionally represent certain populations within a jurisdiction or CBSA, and therefore, may not accurately depict the full picture of influenza activity for the entire jurisdiction or CBSA. Differences in the data presented here by CDC and independently by some health departments likely represent differing levels of data completeness with data presented by the health department likely being the more complete.
Additional information about medically attended visits for ILI for current and past seasons:
Surveillance Methods | FluView Interactive: National, Regional, and State Data or ILI Activity Map Hospitalization Surveillance

FluSurv-NET


The Influenza Hospitalization Surveillance Network (FluSurv-NET) conducts population-based surveillance for laboratory-confirmed influenza-related hospitalizations in select counties in 13 states and represents approximately 9% of the U.S. population. FluSurv-NET hospitalization data are preliminary. Patients admitted for laboratory-confirmed influenza-related hospitalization after April 30, 2023, will not be included in FluSurv-NET for the 2022-2023 season. Data on patients admitted through April 30, 2023, will continue to be updated on FluView Interactive as additional information is received.
Additional FluSurv-NET hospitalization surveillance information for current and past seasons and additional age groups:
Surveillance Methods |FluView Interactive: Rates by Age, Sex, and Race/Ethnicity or Data on Patient Characteristics | RESP-NET Interactive HHS Protect Hospitalization Surveillance


Hospitals report to HHS Protect the number of patients admitted with laboratory-confirmed influenza. During week 33, 727 patients with laboratory-confirmed influenza were admitted to a hospital.

national levels of influenza hospitalizations
View Chart Data | View Full Screen
Additional HHS Protect hospitalization surveillance information:
Surveillance Methods | Additional Data Mortality Surveillance

National Center for Health Statistics (NCHS) Mortality Surveillance


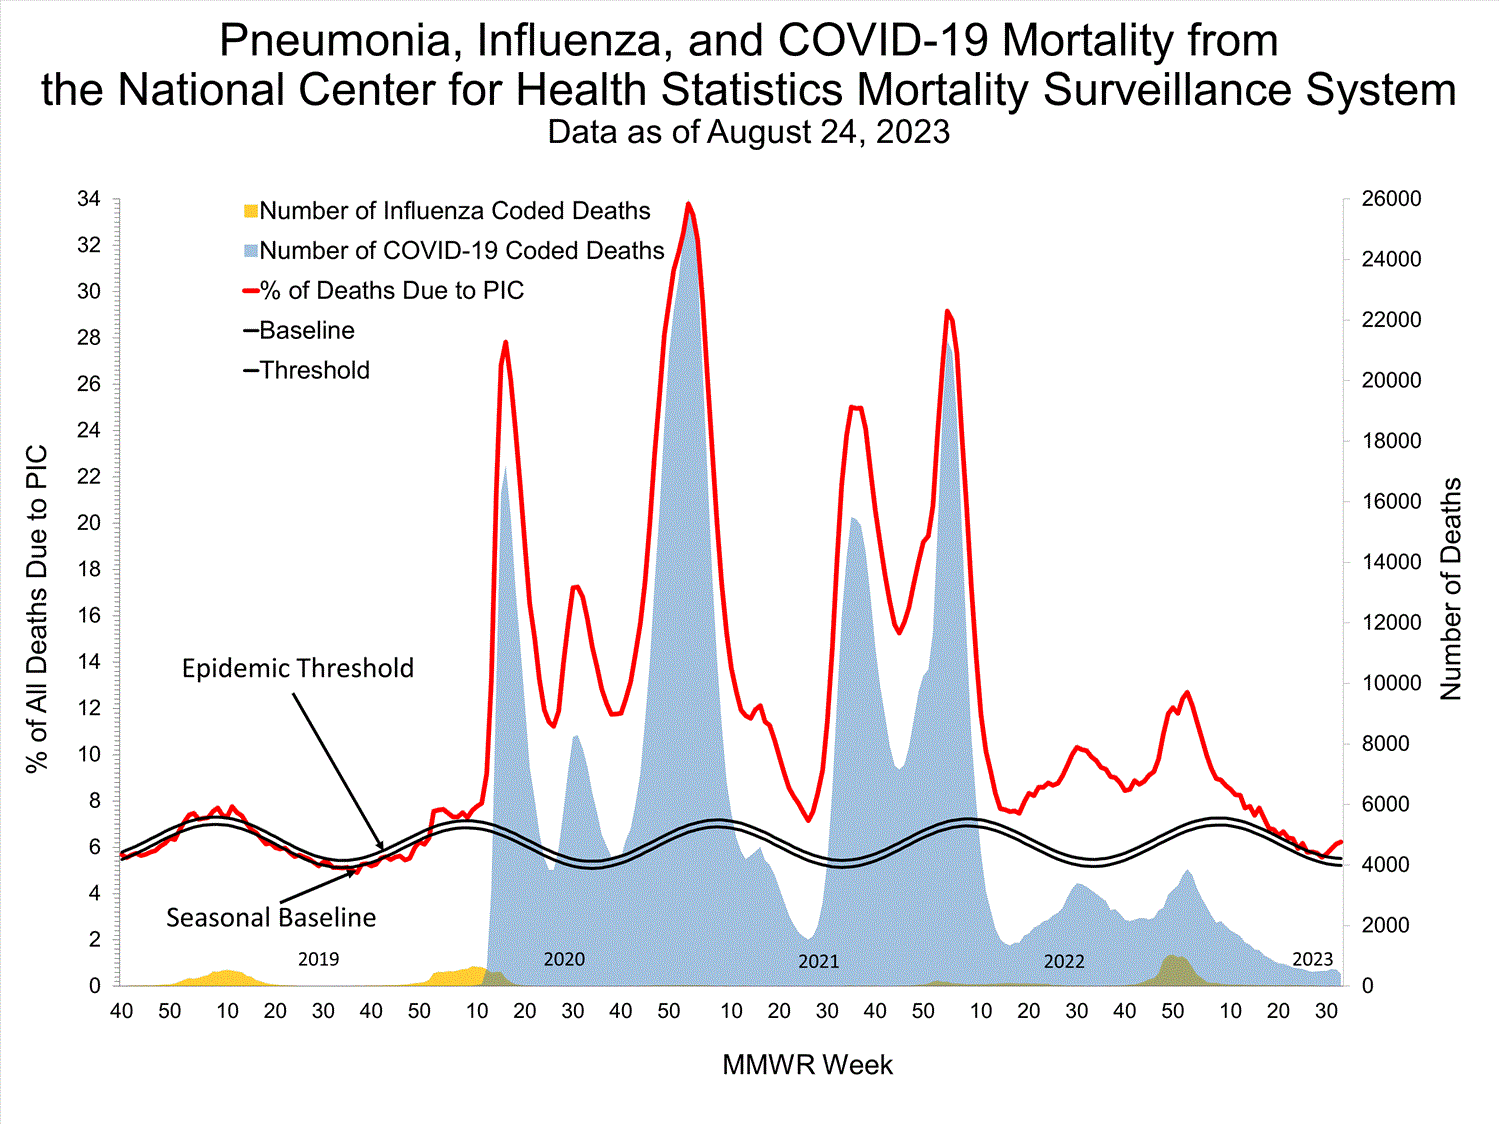
Based on NCHS mortality surveillance data available on August 24, 2023, 6.2% of the deaths that occurred during the week ending August 19, 2023 (week 33), were due to pneumonia, influenza, and/or COVID-19 (PIC). This percentage is above the epidemic threshold of 5.5% for this week. Among the 1,453 PIC deaths reported for this week, 406 had COVID-19 listed as an underlying or contributing cause of death on the death certificate, and 7 listed influenza. The data presented are preliminary and may change as more data are received and processed.

Click on image to launch interactive toolView Chart Data | View Full Screen
Additional pneumonia, influenza and COVID-19 mortality surveillance information for current and past seasons:
Surveillance Methods | FluView Interactive Influenza-Associated Pediatric Mortality


Four influenza-associated pediatric deaths occurring during the 2022-2023 season were reported to CDC during week 33. One death occurred during week 49, one death occurred during week 50, and two deaths occurred during week 52 of 2022 (the weeks ending December 10, December 17, and December 31 of 2022, respectively). All four deaths were associated with influenza A viruses. Three of the influenza A viruses had subtyping performed; all three were A(H3) viruses.

Click on image to launch interactive tool View Full Screen
Additional pediatric mortality surveillance information for current and past seasons:
Surveillance Methods | FluView Interactive

Additional National and International Influenza Surveillance Information


FluView Interactive: FluView includes enhanced web-based interactive applications that can provide dynamic visuals of the influenza data collected and analyzed by CDC. These FluView Interactive applications allow people to create customized, visual interpretations of influenza data, as well as make comparisons across flu seasons, regions, age groups and a variety of other demographics.

National Institute for Occupational Safety and Health: Monthly surveillance data on the prevalence of health-related workplace absenteeism among full-time workers in the United States are available from NIOSH.

U.S. State and local influenza surveillance: Select a jurisdiction below to access the latest local influenza information.

https://www.cdc.gov/flu/weekly/index.htm
 
Weekly U.S. Influenza Surveillance Report


Print
Updated September 1, 2023
fluview-banner2.jpg


2022-2023 Influenza Season

Week 34 ending August 26, 2023

All data in this report are preliminary and may change as more reports are received.

A description of the CDC influenza surveillance system, including methodology and detailed descriptions of each data component, is available on the surveillance methods page.

Additional information on the current and previous influenza seasons for each surveillance component is available on FluView Interactive. U.S. Virologic Surveillance

Clinical Laboratories


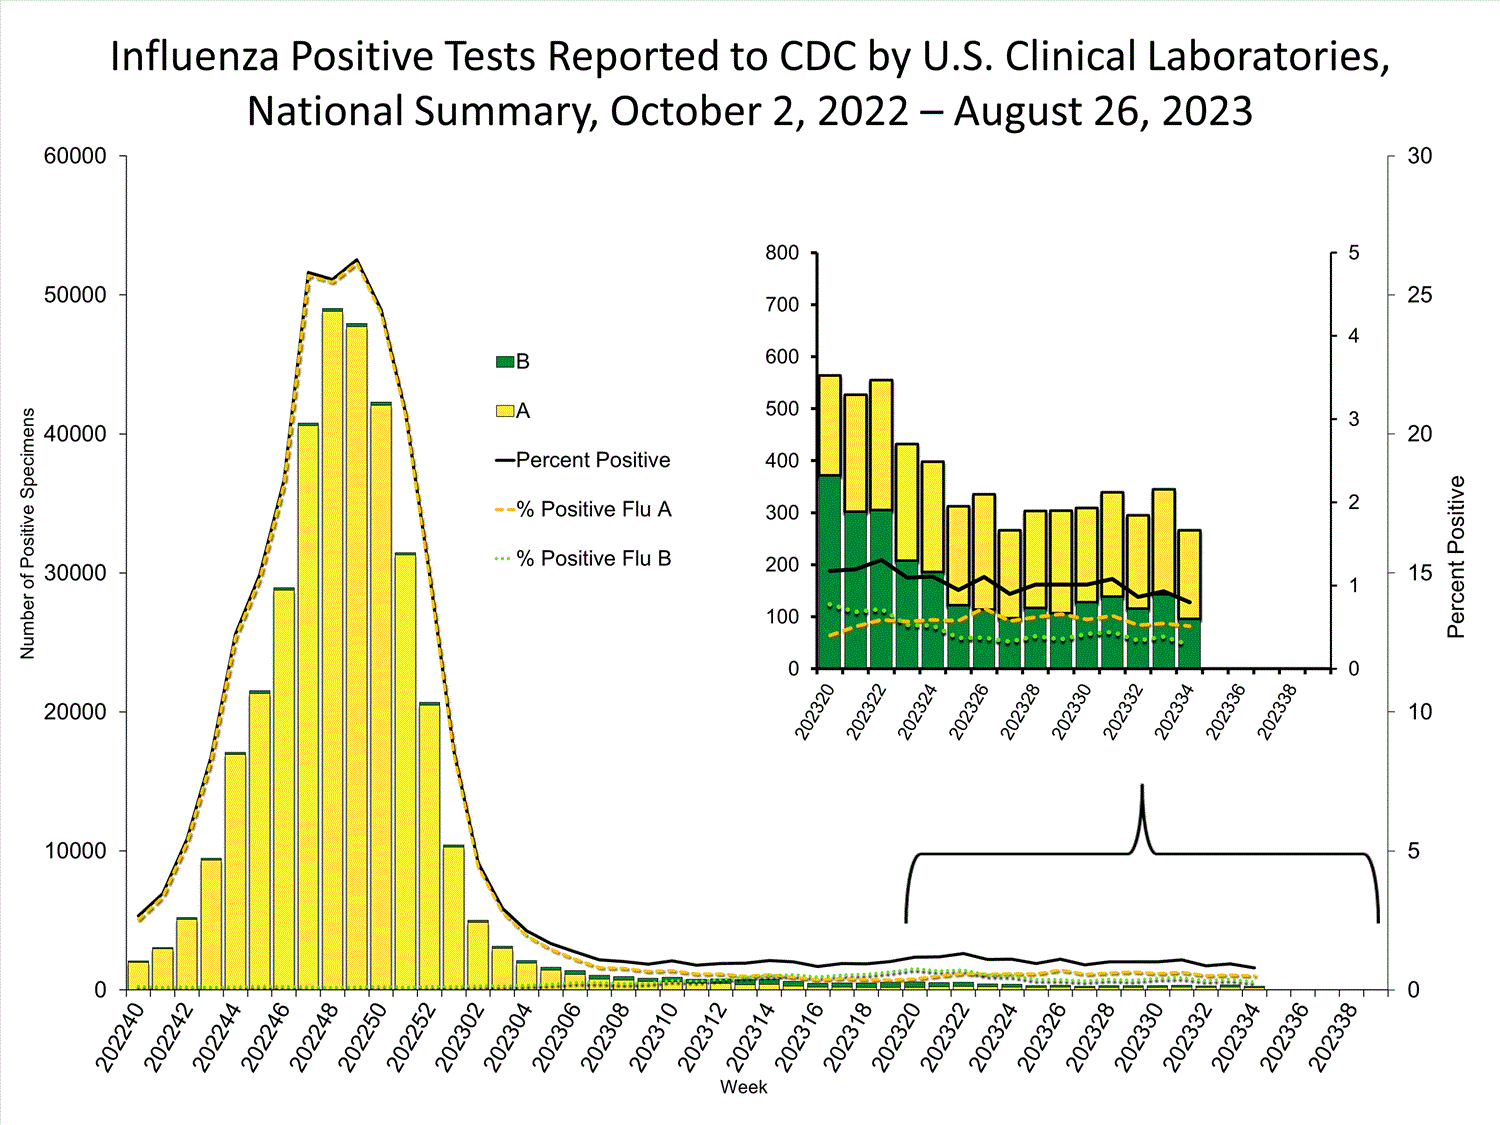
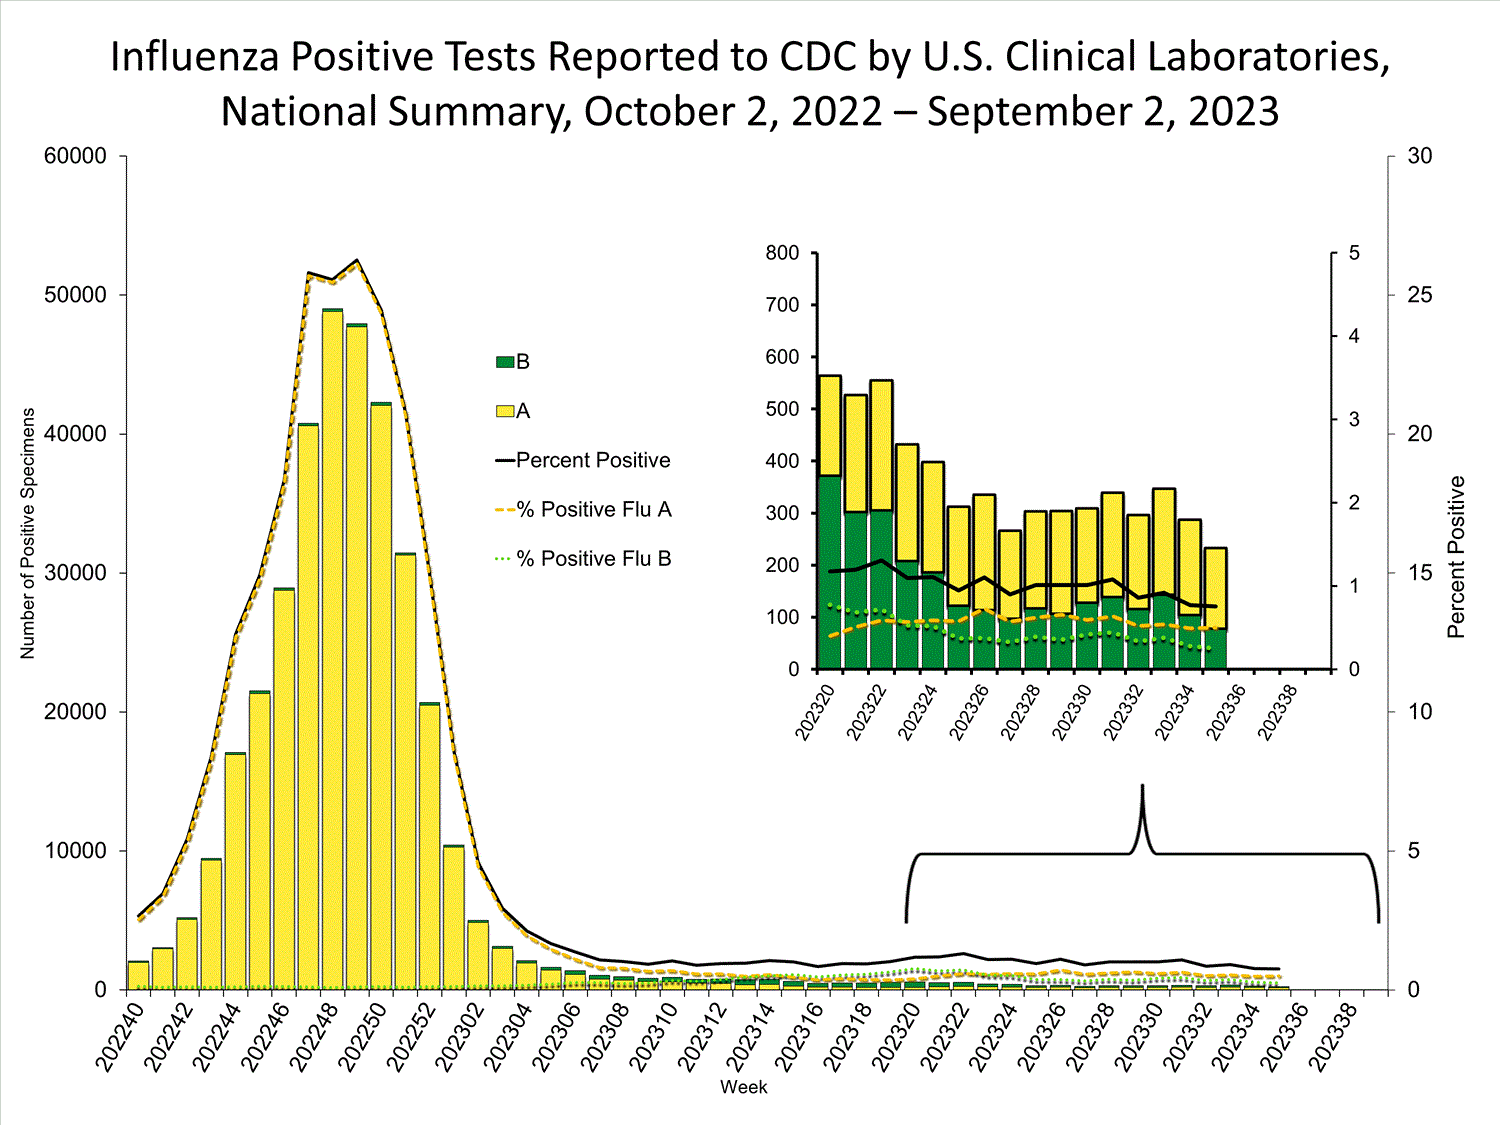
The results of tests performed by clinical laboratories nationwide are summarized below. Data from clinical laboratories (the percentage of specimens tested that are positive for influenza) are used to monitor whether influenza activity is increasing or decreasing.
No. of specimens tested33,2513,929,713
No. of positive specimens (%)266 (0.8%)358,134 (9.1%)
Positive specimens by type
Influenza A170 (63.9%)348,600 (97.3%)
Influenza B96 (36.1%)9,534 (2.7%)
INFLUENZA Virus Isolated

View Chart Data | View Full Screen Public Health Laboratories


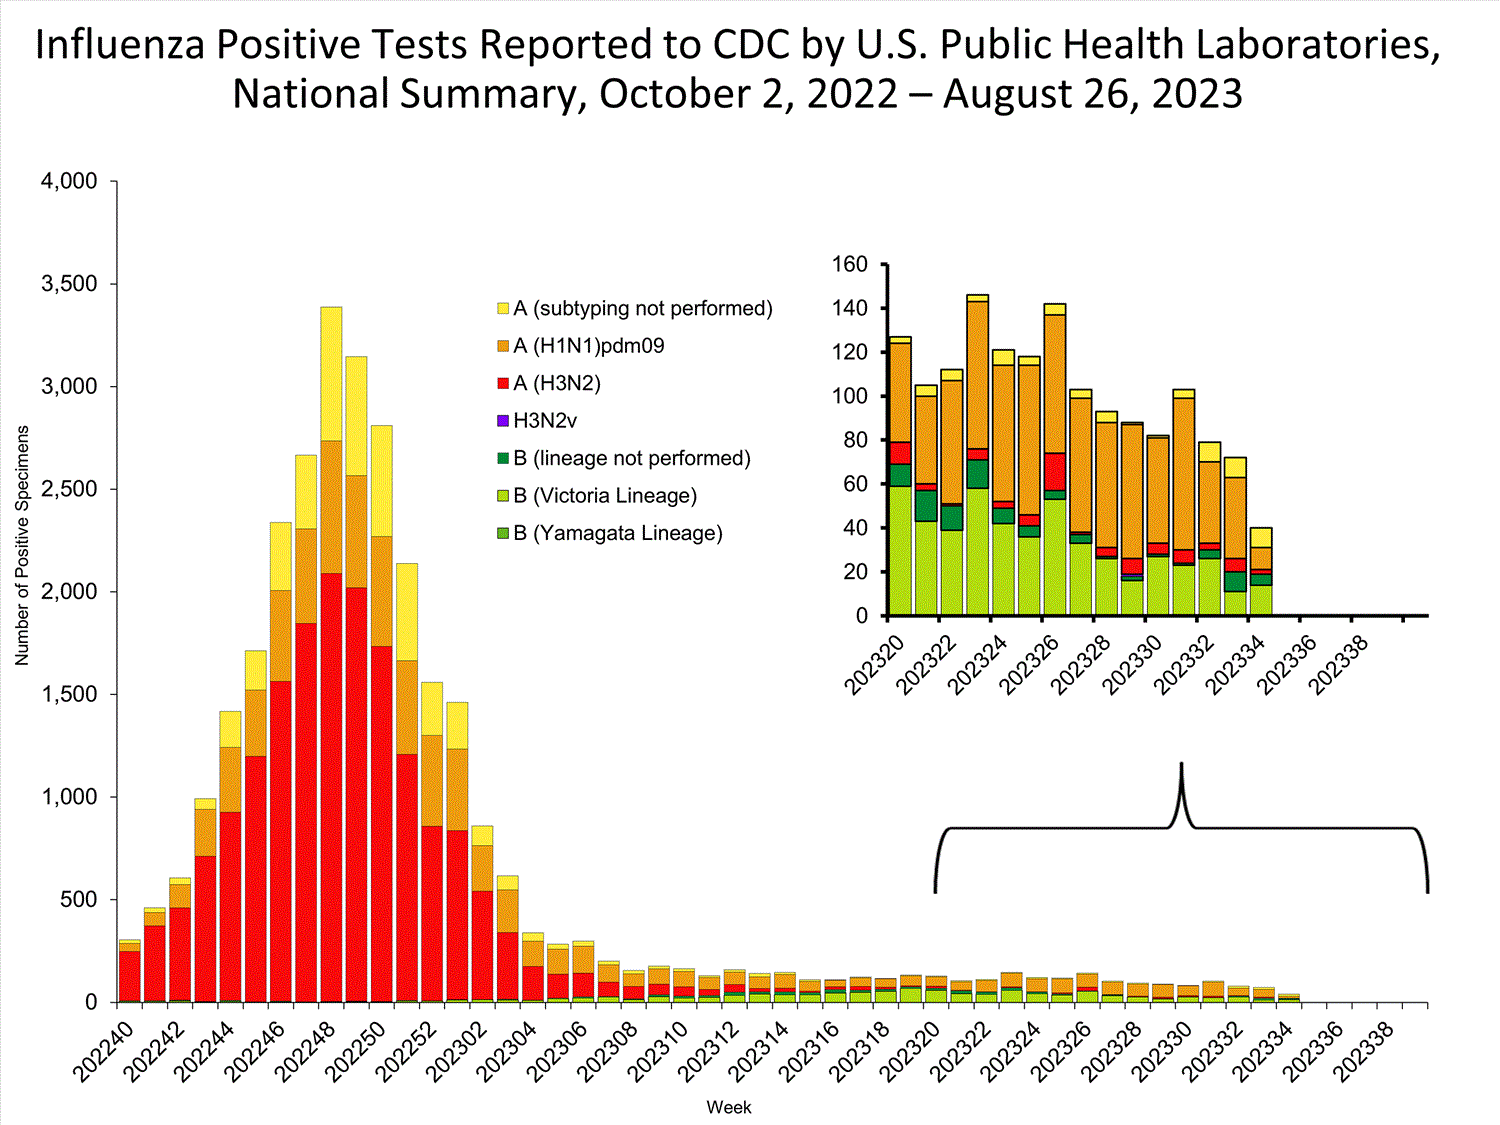
The results of tests performed by public health laboratories nationwide are summarized below. Data from public health laboratories are used to monitor the proportion of circulating viruses that belong to each influenza virus type/subtype/lineage. Viruses known to be associated with recent live attenuated influenza vaccine (LAIV) receipt or found upon further testing to be a vaccine virus are not included as they are not circulating influenza viruses.
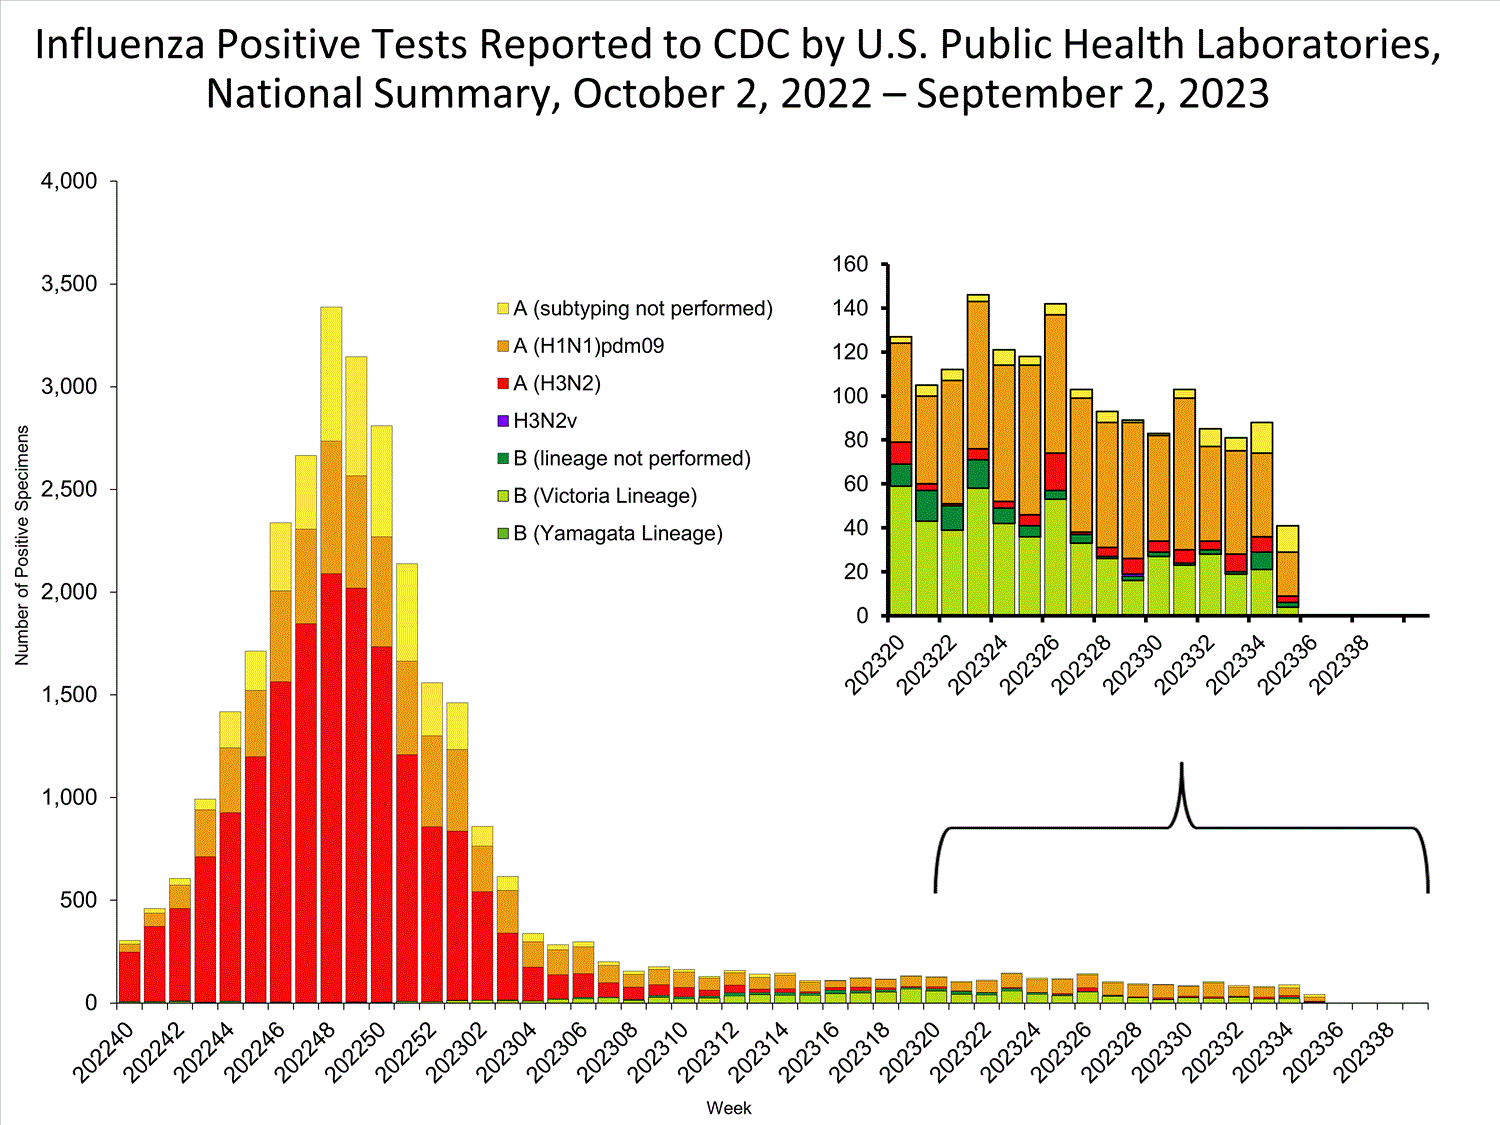
No. of specimens tested1,479279,183
No. of positive specimens4030,787
Positive specimens by type/subtype
Influenza A21 (52.5%)29,395 (95.5%)
(H1N1)pdm0910 (83.3%)7,355 (29.4%)
H3N22 (16.7%)17,672 (70.6%)
H3N2v02 (<0.1%)
Subtyping not performed94,366
Influenza B19 (47.5%)1,392 (4.5%)
Yamagata lineage0 (0%)0
Victoria lineage14 (100%)1,126 (100%)
Lineage not performed5266


INFLUENZA Virus Isolated
View Chart Data | View Full Screen
Additional virologic surveillance information for current and past seasons:
Surveillance Methods | FluView Interactive: National, Regional, and State Data or Age Data Outpatient Respiratory Illness Surveillance


The U.S. Outpatient Influenza-like Illness Surveillance Network (ILINet) monitors outpatient visits for respiratory illness referred to as influenza-like illness [ILI (fever plus cough or sore throat)], not laboratory-confirmed influenza, and may capture respiratory illness visits due to infection with any pathogen that can present with similar symptoms, including influenza, SARS-CoV-2, and RSV. Therefore, it is important to evaluate syndromic surveillance data, including that from ILINet, in the context of other sources of surveillance data to obtain a complete and accurate picture of influenza, SARS-CoV-2, and other respiratory virus activity. Other respiratory virus surveillance data can be found on CDC’s COVID Data Tracker, NCIRD Surveillance Systems website and National Respiratory and Enteric Virus Surveillance System (NREVSS) website. Outpatient Respiratory Illness Visits


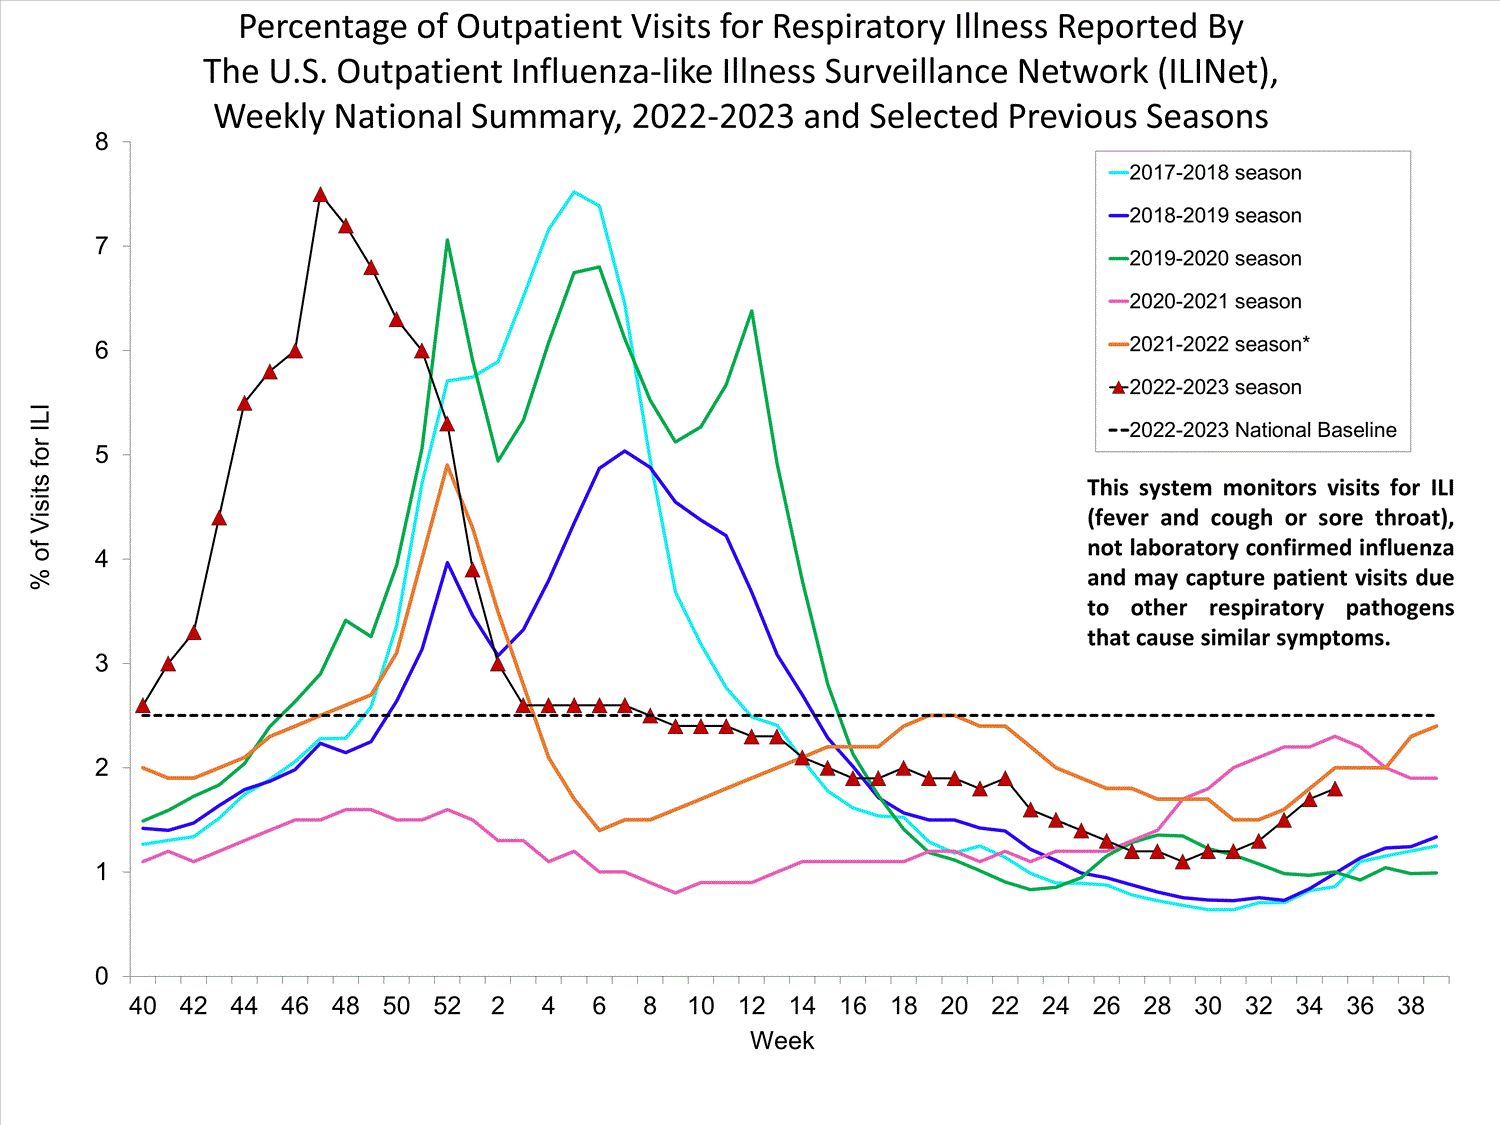
Nationwide during week 34, 1.7% of patient visits reported through ILINet were due to respiratory illness that included fever plus a cough or sore throat, also referred to as ILI. Multiple respiratory viruses are co-circulating, and the relative contribution of influenza virus infection to ILI varies by location.

national levels of ILI and ARI

* Effective October 3, 2021 (week 40), the ILI definition (fever plus cough or sore throat) no longer includes “without a known cause other than influenza.”

View Chart Data (current season only) | View Full Screen Outpatient Respiratory Illness Visits by Age Group


More than 70% of ILINet participants provide both the number of patient visits for respiratory illness and the total number of patient visits for the week broken out by age group. Data from this subset of providers are used to calculate the percentages of patient visits for respiratory illness by age group.

During week 34, the percentage of visits for respiratory illness reported in ILINet was 5.8% among those 0-4 years, 3.0% among those 5-24 years, 1.5% among those 25-49 years, 1.0% among those 50-64 years, and 0.7% among those 65 years and older.

national levels of ILI and ARI by age group

View Chart Data | View Full Screen Outpatient Respiratory Illness Activity Map


Data collected in ILINet are used to produce a measure of ILI activity* by state/jurisdiction and Core Based Statistical Areas (CBSA).
Week 34
(Week ending
Aug. 26, 2023)
Week 33
(Week ending
Aug. 19, 2023)
Week 34
(Week ending
Aug. 26, 2023)
Week 33
(Week ending
Aug. 19, 2023)
Very High0021
High00155
Moderate102610
Low635436
Minimal4552553620
Insufficient Data30279257


*Data collected in ILINet may disproportionally represent certain populations within a jurisdiction or CBSA, and therefore, may not accurately depict the full picture of influenza activity for the entire jurisdiction or CBSA. Differences in the data presented here by CDC and independently by some health departments likely represent differing levels of data completeness with data presented by the health department likely being the more complete.
Additional information about medically attended visits for ILI for current and past seasons:
Surveillance Methods | FluView Interactive: National, Regional, and State Data or ILI Activity Map Hospitalization Surveillance

FluSurv-NET


The Influenza Hospitalization Surveillance Network (FluSurv-NET) conducts population-based surveillance for laboratory-confirmed influenza-related hospitalizations in select counties in 13 states and represents approximately 9% of the U.S. population. FluSurv-NET hospitalization data are preliminary. Patients admitted for laboratory-confirmed influenza-related hospitalization after April 30, 2023, will not be included in FluSurv-NET for the 2022-2023 season. Data on patients admitted through April 30, 2023, will continue to be updated on FluView Interactive as additional information is received.
Additional FluSurv-NET hospitalization surveillance information for current and past seasons and additional age groups:
Surveillance Methods |FluView Interactive: Rates by Age, Sex, and Race/Ethnicity or Data on Patient Characteristics | RESP-NET Interactive HHS Protect Hospitalization Surveillance


Hospitals report to HHS Protect the number of patients admitted with laboratory-confirmed influenza. During week 34, 779 patients with laboratory-confirmed influenza were admitted to a hospital.

national levels of influenza hospitalizations
View Chart Data | View Full Screen
Additional HHS Protect hospitalization surveillance information:
Surveillance Methods | Additional Data Mortality Surveillance

National Center for Health Statistics (NCHS) Mortality Surveillance


Based on NCHS mortality surveillance data available on August 31, 2023, 6.5% of the deaths that occurred during the week ending August 26, 2023 (week 34), were due to pneumonia, influenza, and/or COVID-19 (PIC). This percentage is above the epidemic threshold of 5.5% for this week. Among the 1,484 PIC deaths reported for this week, 436 had COVID-19 listed as an underlying or contributing cause of death on the death certificate, and 9 listed influenza. The data presented are preliminary and may change as more data are received and processed.

Click on image to launch interactive toolView Chart Data | View Full Screen
Additional pneumonia, influenza and COVID-19 mortality surveillance information for current and past seasons:
Surveillance Methods | FluView Interactive Influenza-Associated Pediatric Mortality


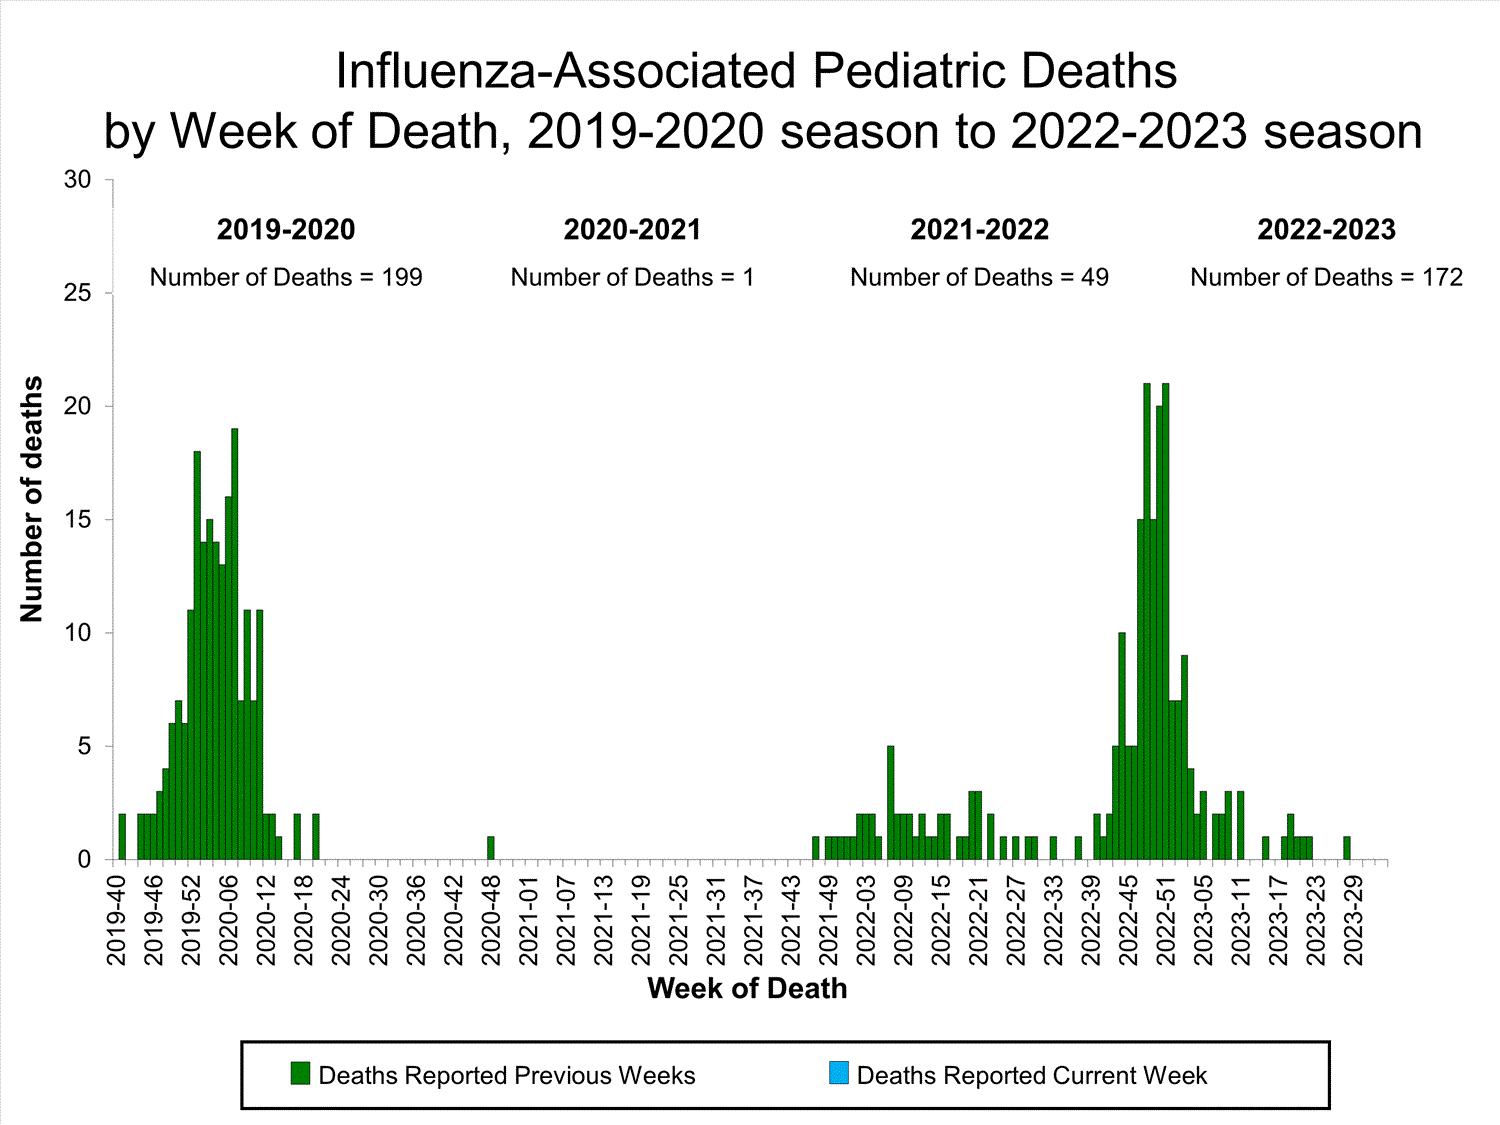
No influenza-associated pediatric deaths were reported to CDC during week 34.

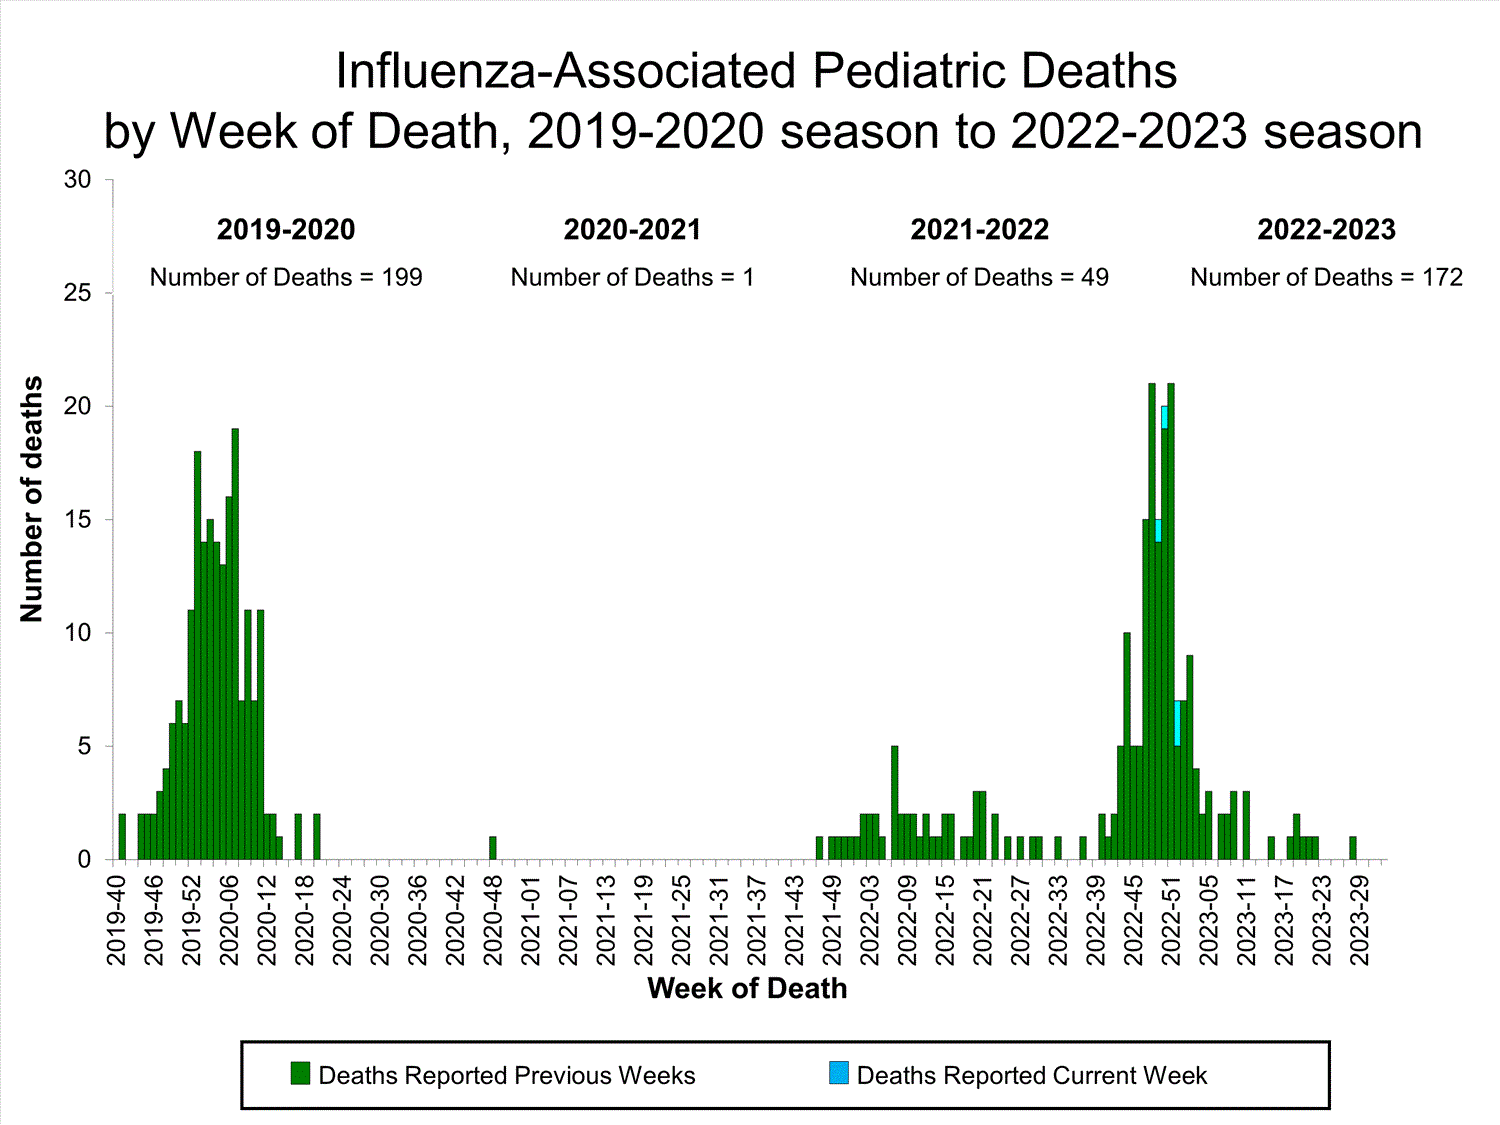
A total of 172 influenza-associated pediatric deaths occurring during the 2022-2023 season have been reported to CDC.

Click on image to launch interactive tool View Full Screen
Additional pediatric mortality surveillance information for current and past seasons:
Surveillance Methods | FluView Interactive

Additional National and International Influenza Surveillance Information


FluView Interactive: FluView includes enhanced web-based interactive applications that can provide dynamic visuals of the influenza data collected and analyzed by CDC. These FluView Interactive applications allow people to create customized, visual interpretations of influenza data, as well as make comparisons across flu seasons, regions, age groups and a variety of other demographics.

National Institute for Occupational Safety and Health: Monthly surveillance data on the prevalence of health-related workplace absenteeism among full-time workers in the United States are available from NIOSH.

U.S. State and local influenza surveillance: Select a jurisdiction below to access the latest local influenza information.

https://www.cdc.gov/flu/weekly/index.htm
 
Weekly U.S. Influenza Surveillance Report


Print
Updated September 8, 2023
fluview-banner2.jpg


2022-2023 Influenza Season

Week 35 ending September 2, 2023

All data in this report are preliminary and may change as more reports are received.

A description of the CDC influenza surveillance system, including methodology and detailed descriptions of each data component, is available on the surveillance methods page.

Additional information on the current and previous influenza seasons for each surveillance component is available on FluView Interactive. U.S. Virologic Surveillance

Clinical Laboratories


The results of tests performed by clinical laboratories nationwide are summarized below. Data from clinical laboratories (the percentage of specimens tested that are positive for influenza) are used to monitor whether influenza activity is increasing or decreasing.
No. of specimens tested30,8673,965,616
No. of positive specimens (%)233 (0.8%)358,391 (9.0%)
Positive specimens by type
Influenza A155 (66.5%)348,771 (97.3%)
Influenza B78 (33.5%)9,620 (2.7%)
INFLUENZA Virus Isolated

View Chart Data | View Full Screen Public Health Laboratories


The results of tests performed by public health laboratories nationwide are summarized below. Data from public health laboratories are used to monitor the proportion of circulating viruses that belong to each influenza virus type/subtype/lineage. Viruses known to be associated with recent live attenuated influenza vaccine (LAIV) receipt or found upon further testing to be a vaccine virus are not included as they are not circulating influenza viruses.
No. of specimens tested1,466281,013
No. of positive specimens4130,893
Positive specimens by type/subtype
Influenza A35 (85.4%)29,484 (95.4%)
(H1N1)pdm0920 (87.0%)7,420 (29.6%)
H3N23 (13.0%)17,683 (70.4%)
H3N2v02 (<0.1%)
Subtyping not performed124,379
Influenza B6 (14.6%)1,409 (4.6%)
Yamagata lineage0 (0%)0
Victoria lineage4 (100%)1,147 (100%)
Lineage not performed2262


INFLUENZA Virus Isolated
View Chart Data | View Full Screen
Additional virologic surveillance information for current and past seasons:
Surveillance Methods | FluView Interactive: National, Regional, and State Data or Age Data Outpatient Respiratory Illness Surveillance


The U.S. Outpatient Influenza-like Illness Surveillance Network (ILINet) monitors outpatient visits for respiratory illness referred to as influenza-like illness [ILI (fever plus cough or sore throat)], not laboratory-confirmed influenza, and may capture respiratory illness visits due to infection with any pathogen that can present with similar symptoms, including influenza, SARS-CoV-2, and RSV. Therefore, it is important to evaluate syndromic surveillance data, including that from ILINet, in the context of other sources of surveillance data to obtain a complete and accurate picture of influenza, SARS-CoV-2, and other respiratory virus activity. Other respiratory virus surveillance data can be found on CDC’s COVID Data Tracker, NCIRD Surveillance Systems website and National Respiratory and Enteric Virus Surveillance System (NREVSS) website. Outpatient Respiratory Illness Visits


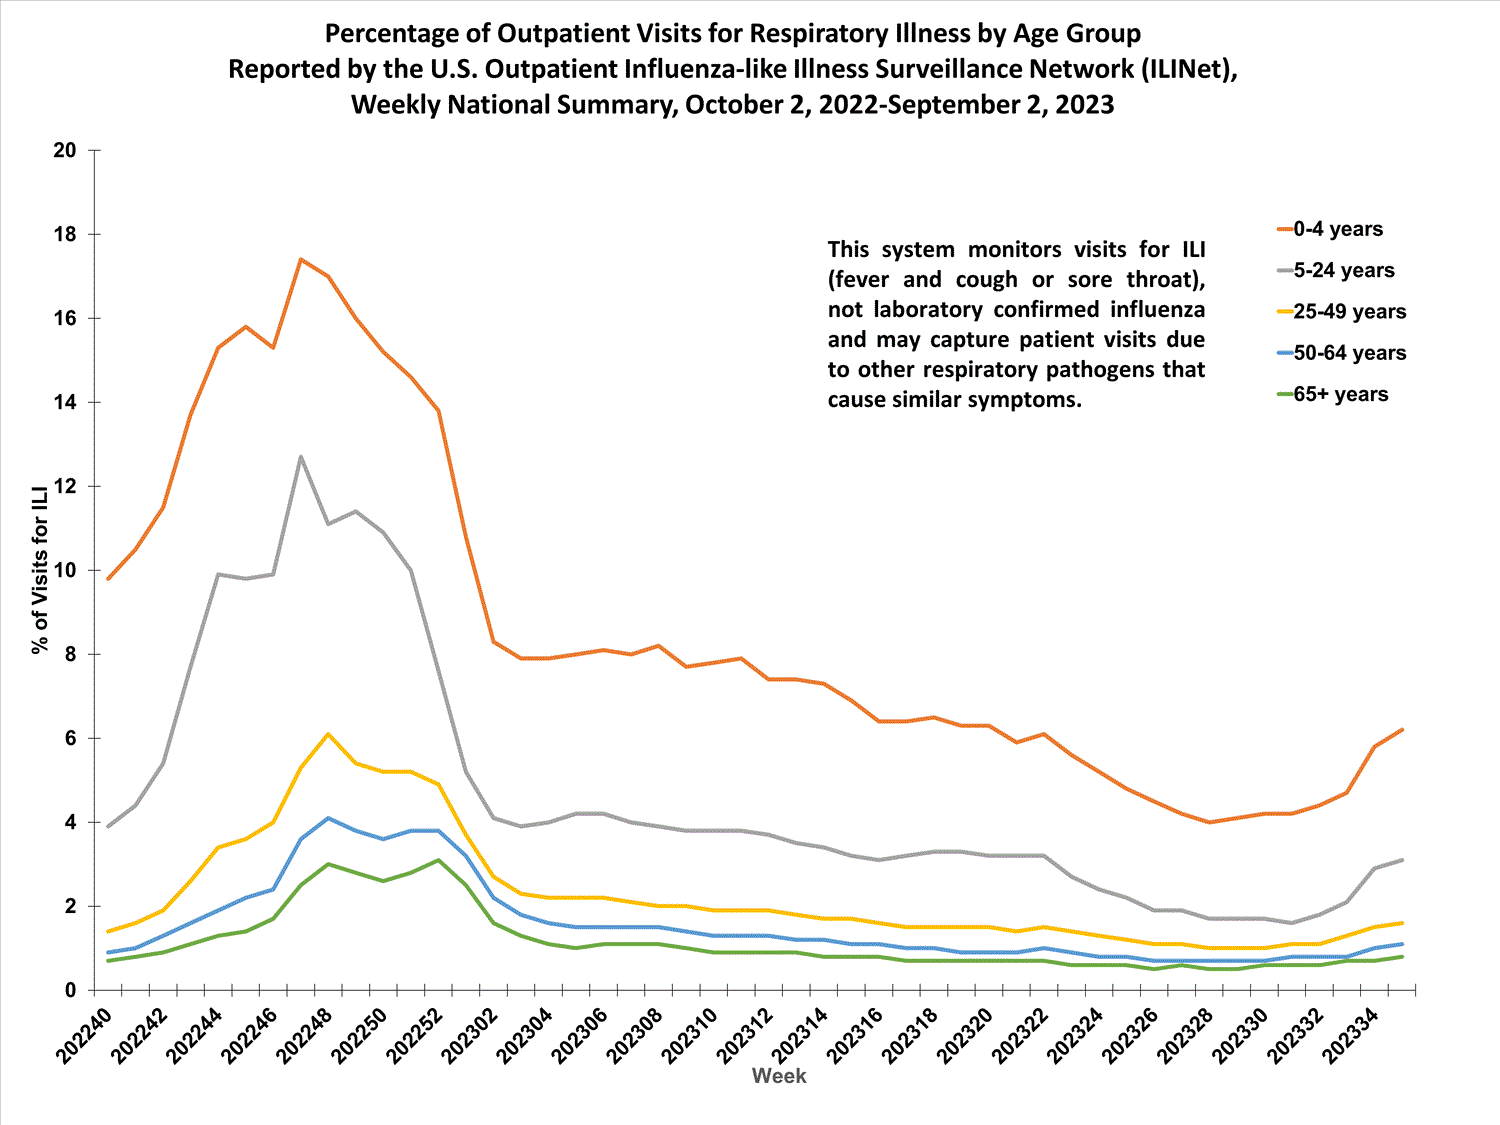
Nationwide during week 35 1.8% of patient visits reported through ILINet were due to respiratory illness that included fever plus a cough or sore throat, also referred to as ILI. Multiple respiratory viruses are co-circulating, and the relative contribution of influenza virus infection to ILI varies by location.

national levels of ILI and ARI

* Effective October 3, 2021 (week 40), the ILI definition (fever plus cough or sore throat) no longer includes “without a known cause other than influenza.”

View Chart Data (current season only) | View Full Screen Outpatient Respiratory Illness Visits by Age Group


More than 70% of ILINet participants provide both the number of patient visits for respiratory illness and the total number of patient visits for the week broken out by age group. Data from this subset of providers are used to calculate the percentages of patient visits for respiratory illness by age group.

During week 35, the percentage of visits for respiratory illness reported in ILINet was 6.2% among those 0-4 years, 3.1% among those 5-24 years, 1.6% among those 25-49 years, 1.1% among those 50-64 years, and 0.8% among those 65 years and older.

national levels of ILI and ARI by age group

View Chart Data | View Full Screen Outpatient Respiratory Illness Activity Map


Data collected in ILINet are used to produce a measure of ILI activity* by state/jurisdiction and Core Based Statistical Areas (CBSA).
Week 35
(Week ending
Sept. 2, 2023)
Week 34
(Week ending
Aug. 26, 2023)
Week 35
(Week ending
Sept. 2, 2023)
Week 34
(Week ending
Aug. 26, 2023)
Very High0022
High001315
Moderate113226
Low875755
Minimal4546562562
Insufficient Data11263269


*Data collected in ILINet may disproportionally represent certain populations within a jurisdiction or CBSA, and therefore, may not accurately depict the full picture of influenza activity for the entire jurisdiction or CBSA. Differences in the data presented here by CDC and independently by some health departments likely represent differing levels of data completeness with data presented by the health department likely being the more complete.
Additional information about medically attended visits for ILI for current and past seasons:
Surveillance Methods | FluView Interactive: National, Regional, and State Data or ILI Activity Map Hospitalization Surveillance

FluSurv-NET


The Influenza Hospitalization Surveillance Network (FluSurv-NET) conducts population-based surveillance for laboratory-confirmed influenza-related hospitalizations in select counties in 13 states and represents approximately 9% of the U.S. population. FluSurv-NET hospitalization data are preliminary. Patients admitted for laboratory-confirmed influenza-related hospitalization after April 30, 2023, will not be included in FluSurv-NET for the 2022-2023 season. Data on patients admitted through April 30, 2023, will continue to be updated on FluView Interactive as additional information is received.
Additional FluSurv-NET hospitalization surveillance information for current and past seasons and additional age groups:
Surveillance Methods |FluView Interactive: Rates by Age, Sex, and Race/Ethnicity or Data on Patient Characteristics | RESP-NET Interactive HHS Protect Hospitalization Surveillance


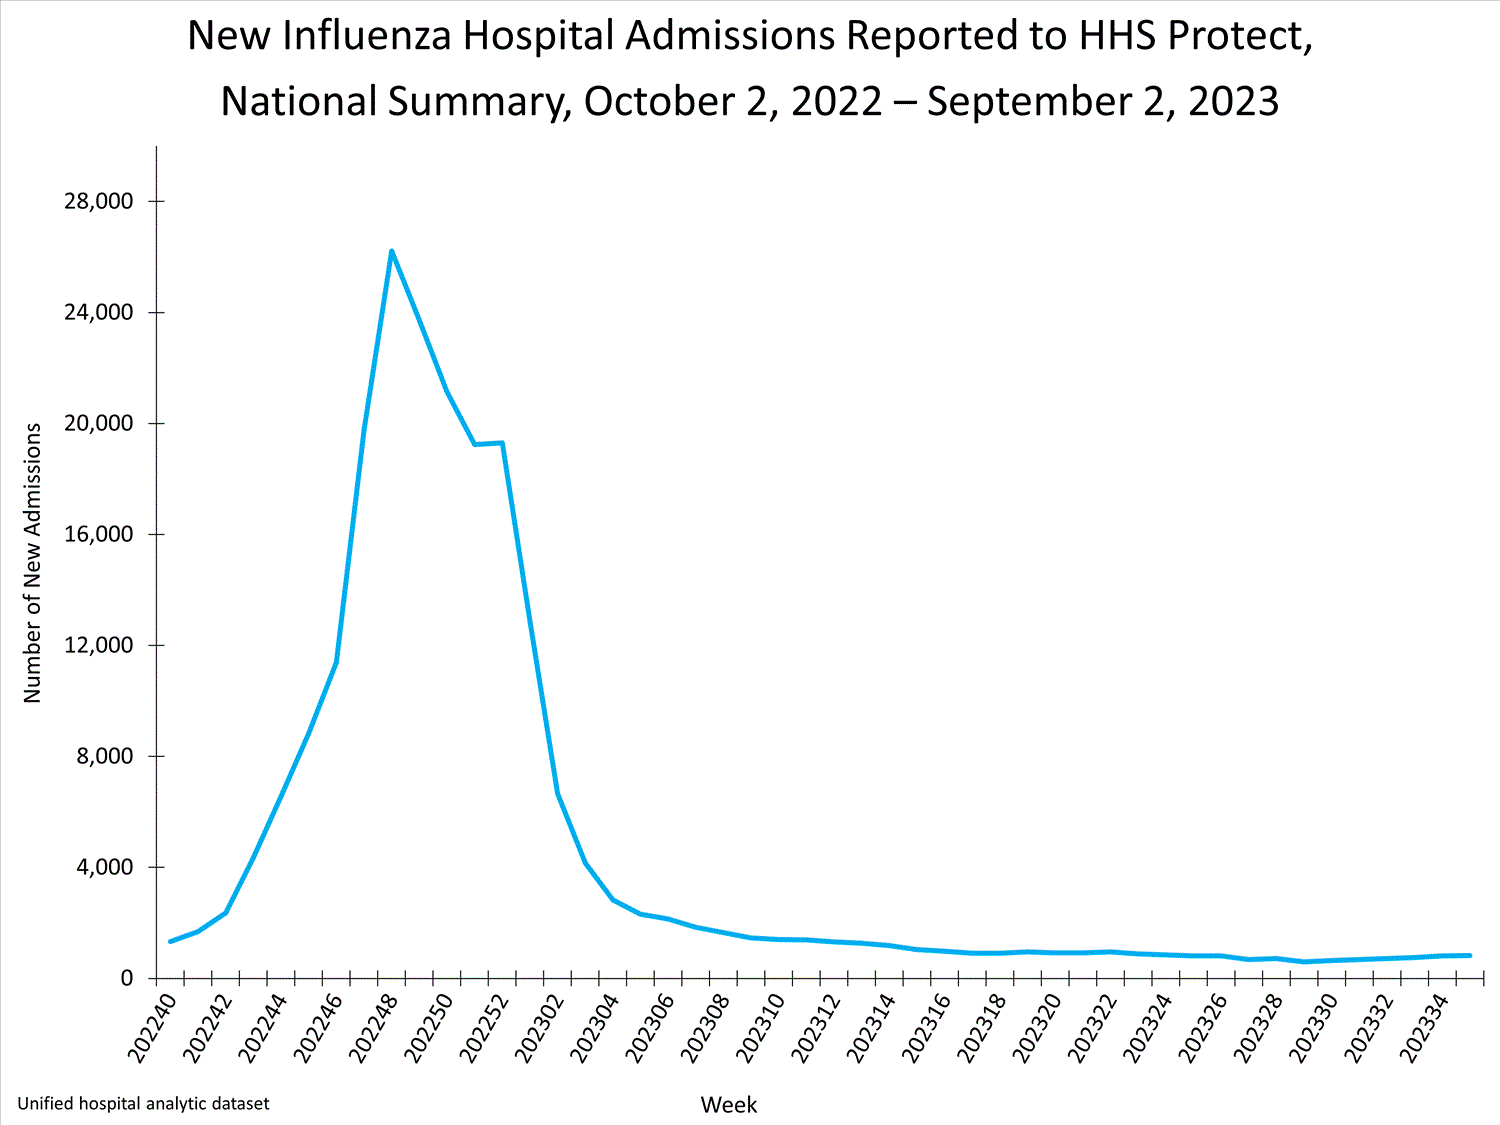
Hospitals report to HHS Protect the number of patients admitted with laboratory-confirmed influenza. During week 35, 823 patients with laboratory-confirmed influenza were admitted to a hospital.

national levels of influenza hospitalizations
View Chart Data | View Full Screen
Additional HHS Protect hospitalization surveillance information:
Surveillance Methods | Additional Data Mortality Surveillance

National Center for Health Statistics (NCHS) Mortality Surveillance


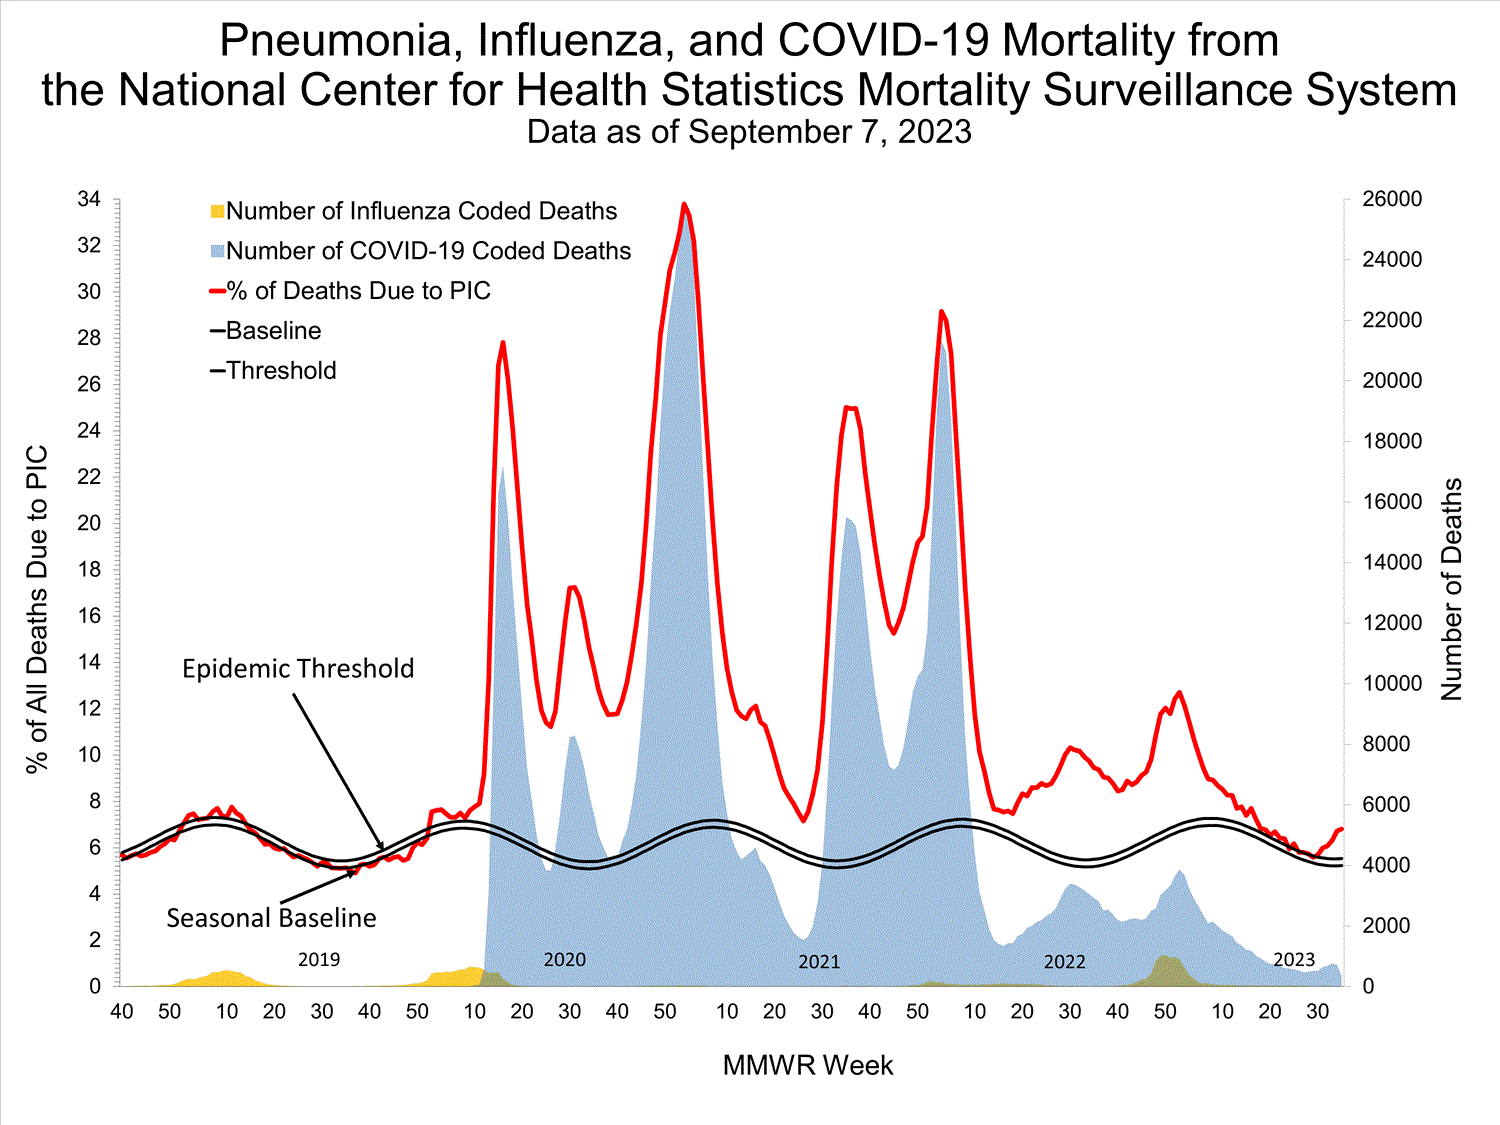
Based on NCHS mortality surveillance data available on September 7, 2023, 6.8% of the deaths that occurred during the week ending September 2, 2023 (week 35), were due to pneumonia, influenza, and/or COVID-19 (PIC). This percentage is above the epidemic threshold of 5.5% for this week. Among the 1,160 PIC deaths reported for this week, 352 had COVID-19 listed as an underlying or contributing cause of death on the death certificate, and 4 listed influenza. The data presented are preliminary and may change as more data are received and processed.

Click on image to launch interactive toolView Chart Data | View Full Screen
Additional pneumonia, influenza and COVID-19 mortality surveillance information for current and past seasons:
Surveillance Methods | FluView Interactive Influenza-Associated Pediatric Mortality


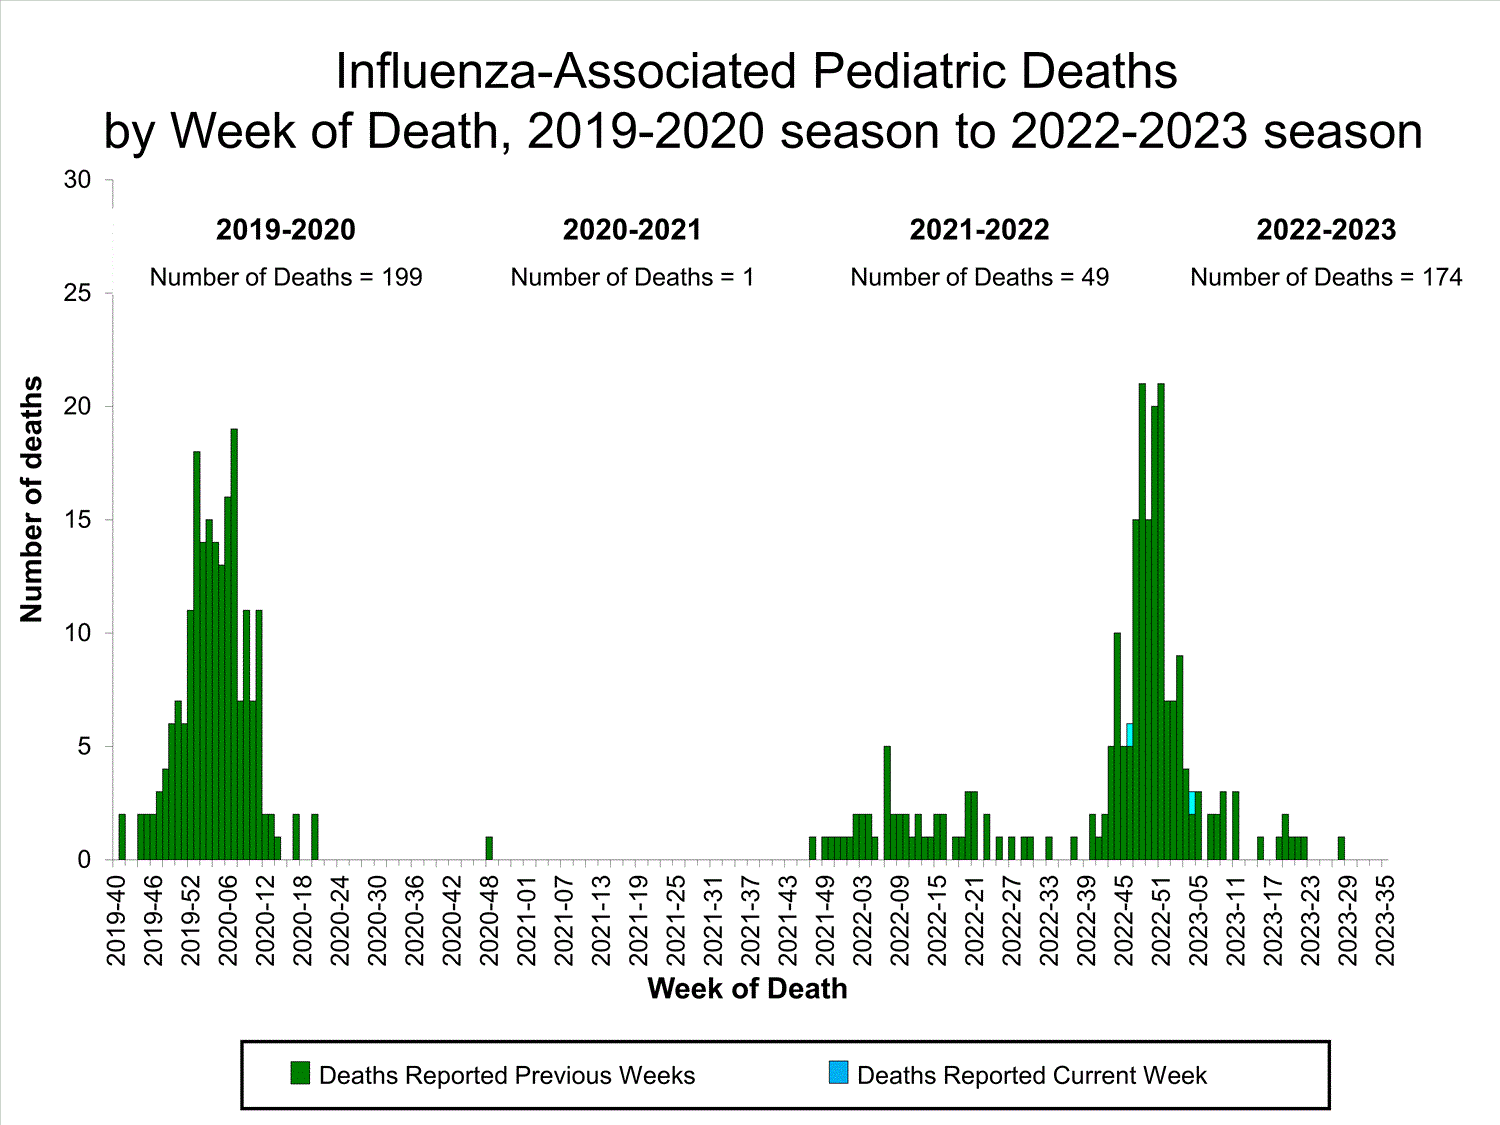
Two influenza-associated pediatric deaths occurring during the 2022-2023 season were reported to CDC during week 35. One death was associated with an influenza A(H3) virus and occurred during week 46 of 2022 (the week ending November 19, 2022). The other death was associated with an influenza A virus for which no subtyping was performed and occurred during week 4 of 2023 (the week ending January 28, 2023).

A total of 174 influenza-associated pediatric deaths occurring during the 2022-2023 season have been reported to CDC.

Click on image to launch interactive tool View Full Screen
Additional pediatric mortality surveillance information for current and past seasons:
Surveillance Methods | FluView Interactive

Additional National and International Influenza Surveillance Information


FluView Interactive: FluView includes enhanced web-based interactive applications that can provide dynamic visuals of the influenza data collected and analyzed by CDC. These FluView Interactive applications allow people to create customized, visual interpretations of influenza data, as well as make comparisons across flu seasons, regions, age groups and a variety of other demographics.

National Institute for Occupational Safety and Health: Monthly surveillance data on the prevalence of health-related workplace absenteeism among full-time workers in the United States are available from NIOSH.

U.S. State and local influenza surveillance: Select a jurisdiction below to access the latest local influenza information.

https://www.cdc.gov/flu/weekly/index.htm
 
Weekly U.S. Influenza Surveillance Report


Print
Updated September 15, 2023
fluview-banner2.jpg


2022-2023 Influenza Season

Week 36 ending September 9, 2023

All data in this report are preliminary and may change as more reports are received.

A description of the CDC influenza surveillance system, including methodology and detailed descriptions of each data component, is available on the surveillance methods page.

Additional information on the current and previous influenza seasons for each surveillance component is available on FluView Interactive. U.S. Virologic Surveillance

Clinical Laboratories


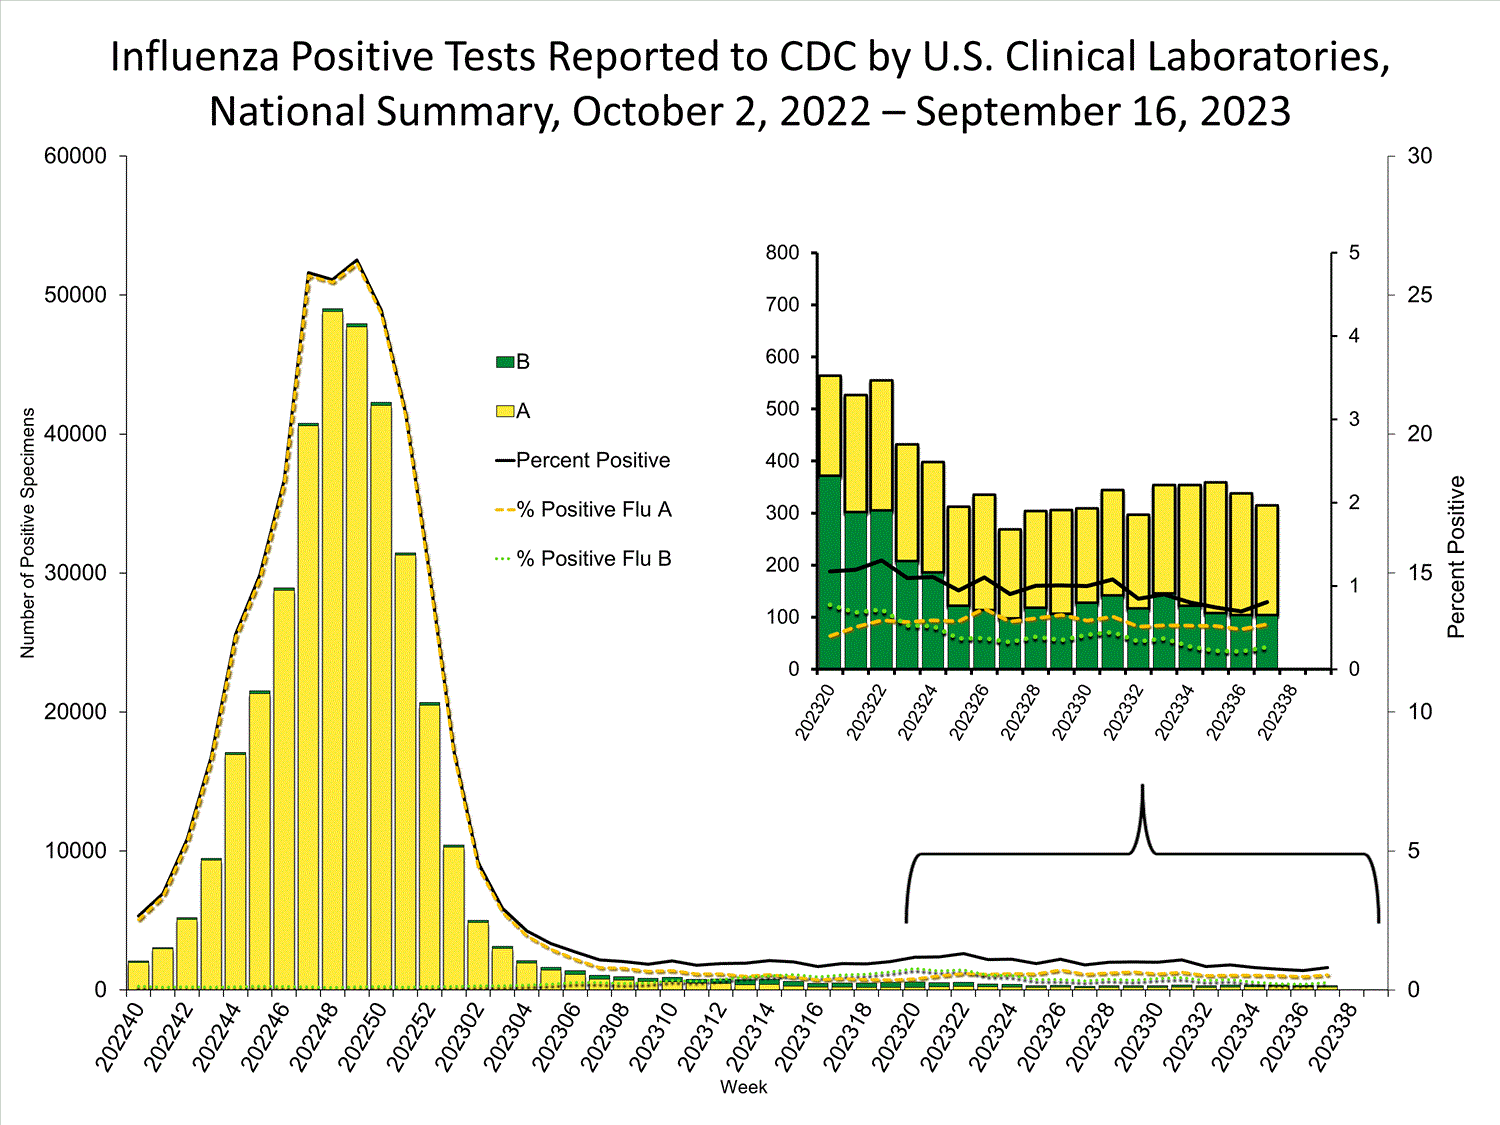
The results of tests performed by clinical laboratories nationwide are summarized below. Data from clinical laboratories (the percentage of specimens tested that are positive for influenza) are used to monitor whether influenza activity is increasing or decreasing.
No. of specimens tested36,6004,023,390
No. of positive specimens (%)253 (0.7%)358,781 (8.9%)
Positive specimens by type
Influenza A167 (66.0%)349,050 (97.3%)
Influenza B86 (34.0%)9,731 (2.7%)
INFLUENZA Virus Isolated

View Chart Data | View Full Screen Public Health Laboratories


The results of tests performed by public health laboratories nationwide are summarized below. Data from public health laboratories are used to monitor the proportion of circulating viruses that belong to each influenza virus type/subtype/lineage. Viruses known to be associated with recent live attenuated influenza vaccine (LAIV) receipt or found upon further testing to be a vaccine virus are not included as they are not circulating influenza viruses.
No. of specimens tested1,981283,440
No. of positive specimens4230,993
Positive specimens by type/subtype
Influenza A29 (69.0%)29,552 (95.4%)
(H1N1)pdm099 (100%)7,465 (29.7%)
H3N20 (0%)17,695 (70.3%)
H3N2v02 (<0.1%)
Subtyping not performed204,390
Influenza B13 (31.0%)1,441 (4.6%)
Yamagata lineage0 (0%)0
Victoria lineage5 (100%)1,168 (100%)
Lineage not performed8273


INFLUENZA Virus Isolated
View Chart Data | View Full Screen
Additional virologic surveillance information for current and past seasons:
Surveillance Methods | FluView Interactive: National, Regional, and State Data or Age Data Outpatient Respiratory Illness Surveillance


The U.S. Outpatient Influenza-like Illness Surveillance Network (ILINet) monitors outpatient visits for respiratory illness referred to as influenza-like illness [ILI (fever plus cough or sore throat)], not laboratory-confirmed influenza, and may capture respiratory illness visits due to infection with any pathogen that can present with similar symptoms, including influenza, SARS-CoV-2, and RSV. Therefore, it is important to evaluate syndromic surveillance data, including that from ILINet, in the context of other sources of surveillance data to obtain a complete and accurate picture of influenza, SARS-CoV-2, and other respiratory virus activity. Other respiratory virus surveillance data can be found on CDC’s COVID Data Tracker, NCIRD Surveillance Systems website and National Respiratory and Enteric Virus Surveillance System (NREVSS) website. Outpatient Respiratory Illness Visits


Nationwide during week 36, 2.0% of patient visits reported through ILINet were due to respiratory illness that included fever plus a cough or sore throat, also referred to as ILI. Multiple respiratory viruses are co-circulating, and the relative contribution of influenza virus infection to ILI varies by location.

national levels of ILI and ARI

* Effective October 3, 2021 (week 40), the ILI definition (fever plus cough or sore throat) no longer includes “without a known cause other than influenza.”

View Chart Data (current season only) | View Full Screen Outpatient Respiratory Illness Visits by Age Group


More than 70% of ILINet participants provide both the number of patient visits for respiratory illness and the total number of patient visits for the week broken out by age group. Data from this subset of providers are used to calculate the percentages of patient visits for respiratory illness by age group.

During week 36, the percentage of visits for respiratory illness reported in ILINet was 6.5% among those 0-4 years, 3.1% among those 5-24 years, 1.6% among those 25-49 years, 1.1% among those 50-64 years, and 0.9% among those 65 years and older.

national levels of ILI and ARI by age group

View Chart Data | View Full Screen Outpatient Respiratory Illness Activity Map


Data collected in ILINet are used to produce a measure of ILI activity* by state/jurisdiction and Core Based Statistical Areas (CBSA).
Week 36
(Week ending
Sept. 9, 2023)
Week 35
(Week ending
Sept. 2, 2023)
Week 36
(Week ending
Sept. 9, 2023)
Week 35
(Week ending
Sept. 2, 2023)
Very High0033
High10814
Moderate312531
Low998257
Minimal4245543569
Insufficient Data00268255


*Data collected in ILINet may disproportionally represent certain populations within a jurisdiction or CBSA, and therefore, may not accurately depict the full picture of influenza activity for the entire jurisdiction or CBSA. Differences in the data presented here by CDC and independently by some health departments likely represent differing levels of data completeness with data presented by the health department likely being the more complete.
Additional information about medically attended visits for ILI for current and past seasons:
Surveillance Methods | FluView Interactive: National, Regional, and State Data or ILI Activity Map Hospitalization Surveillance

FluSurv-NET


The Influenza Hospitalization Surveillance Network (FluSurv-NET) conducts population-based surveillance for laboratory-confirmed influenza-related hospitalizations in select counties in 13 states and represents approximately 9% of the U.S. population. FluSurv-NET hospitalization data are preliminary. Patients admitted for laboratory-confirmed influenza-related hospitalization after April 30, 2023, will not be included in FluSurv-NET for the 2022-2023 season. Data on patients admitted through April 30, 2023, will continue to be updated on FluView Interactive as additional information is received.
Additional FluSurv-NET hospitalization surveillance information for current and past seasons and additional age groups:
Surveillance Methods |FluView Interactive: Rates by Age, Sex, and Race/Ethnicity or Data on Patient Characteristics | RESP-NET Interactive HHS Protect Hospitalization Surveillance


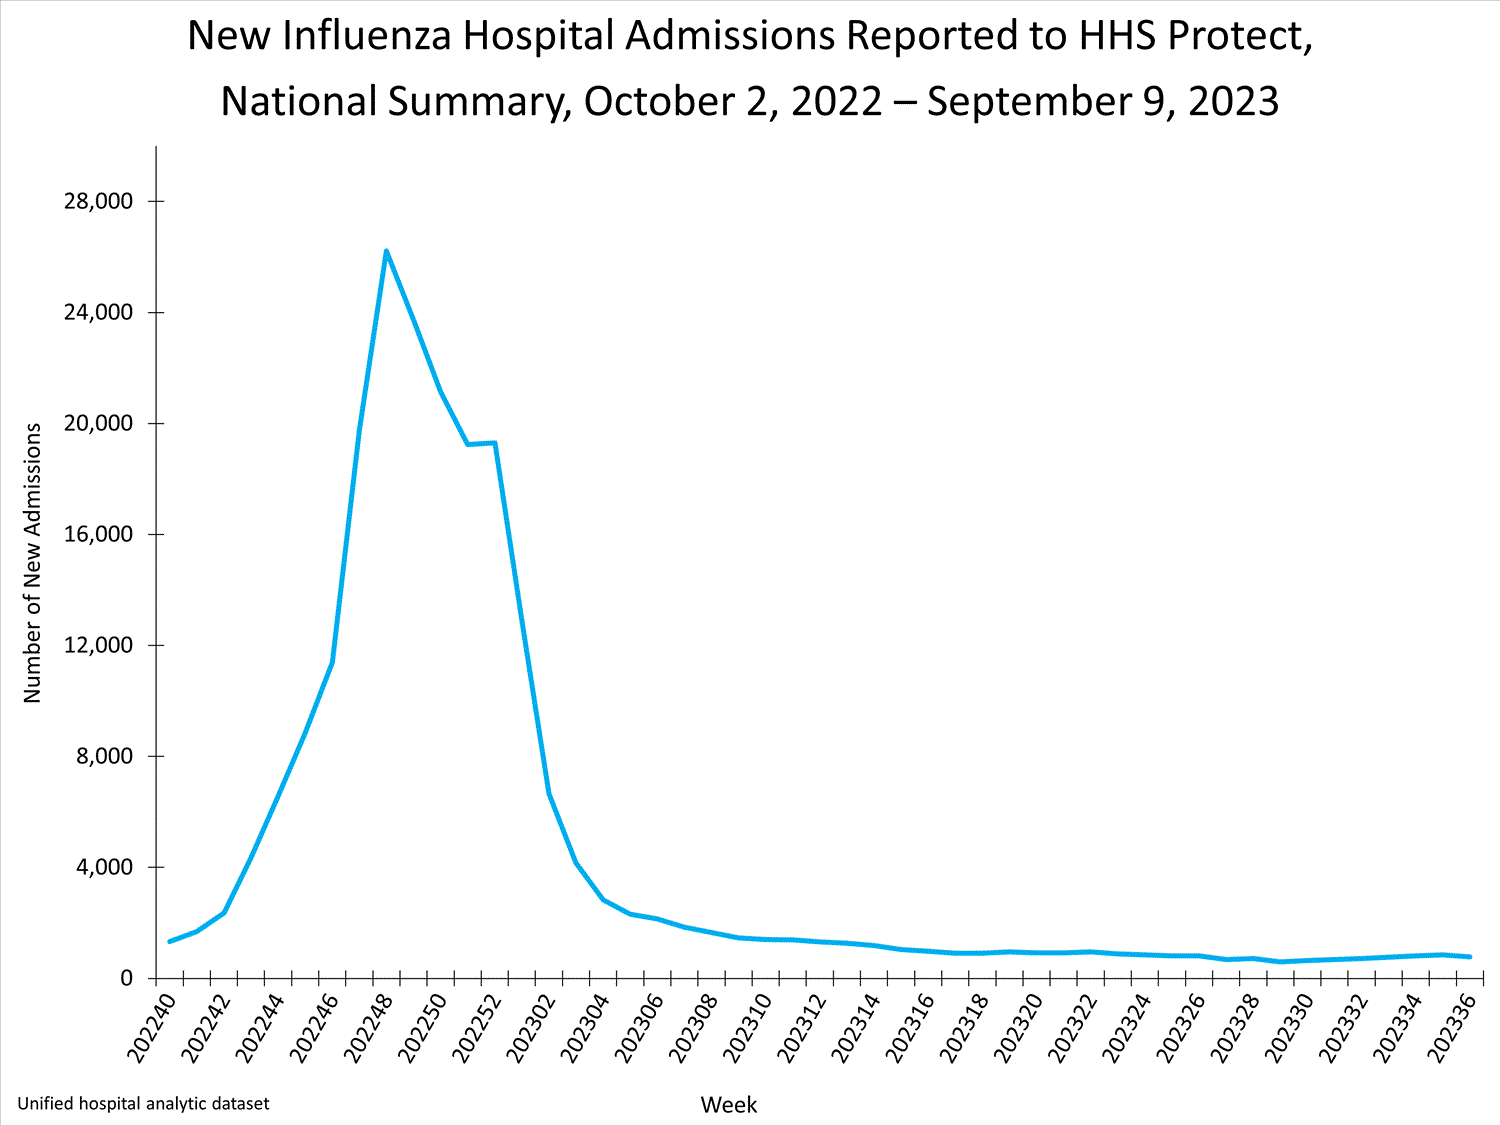
Hospitals report to HHS Protect the number of patients admitted with laboratory-confirmed influenza. During week 36, 775 patients with laboratory-confirmed influenza were admitted to a hospital.

national levels of influenza hospitalizations
View Chart Data | View Full Screen
Additional HHS Protect hospitalization surveillance information:
Surveillance Methods | Additional Data Mortality Surveillance

National Center for Health Statistics (NCHS) Mortality Surveillance


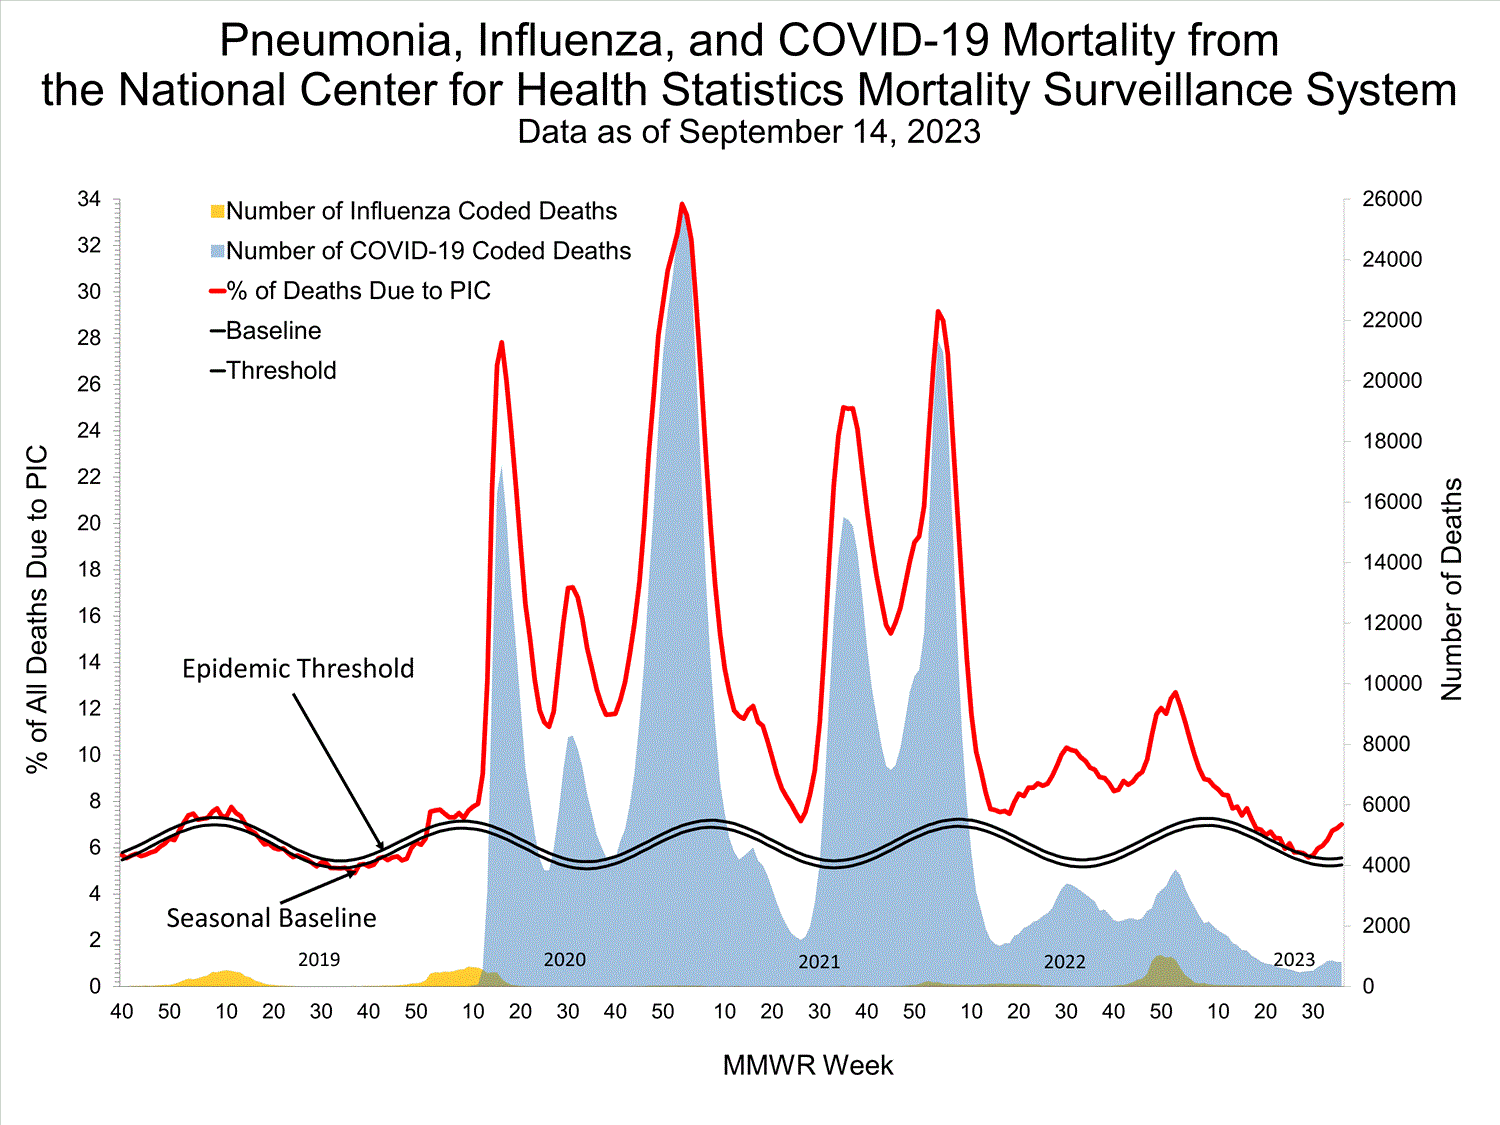
Based on NCHS mortality surveillance data available on September 14, 2023, 7.0% of the deaths that occurred during the week ending September 9, 2023 (week 36), were due to pneumonia, influenza, and/or COVID-19 (PIC). This percentage is above the epidemic threshold of 5.6% for this week. Among the 1,548 PIC deaths reported for this week, 507 had COVID-19 listed as an underlying or contributing cause of death on the death certificate, and 12 listed influenza. The data presented are preliminary and may change as more data are received and processed.

Click on image to launch interactive toolView Chart Data | View Full Screen
Additional pneumonia, influenza and COVID-19 mortality surveillance information for current and past seasons:
Surveillance Methods | FluView Interactive Influenza-Associated Pediatric Mortality


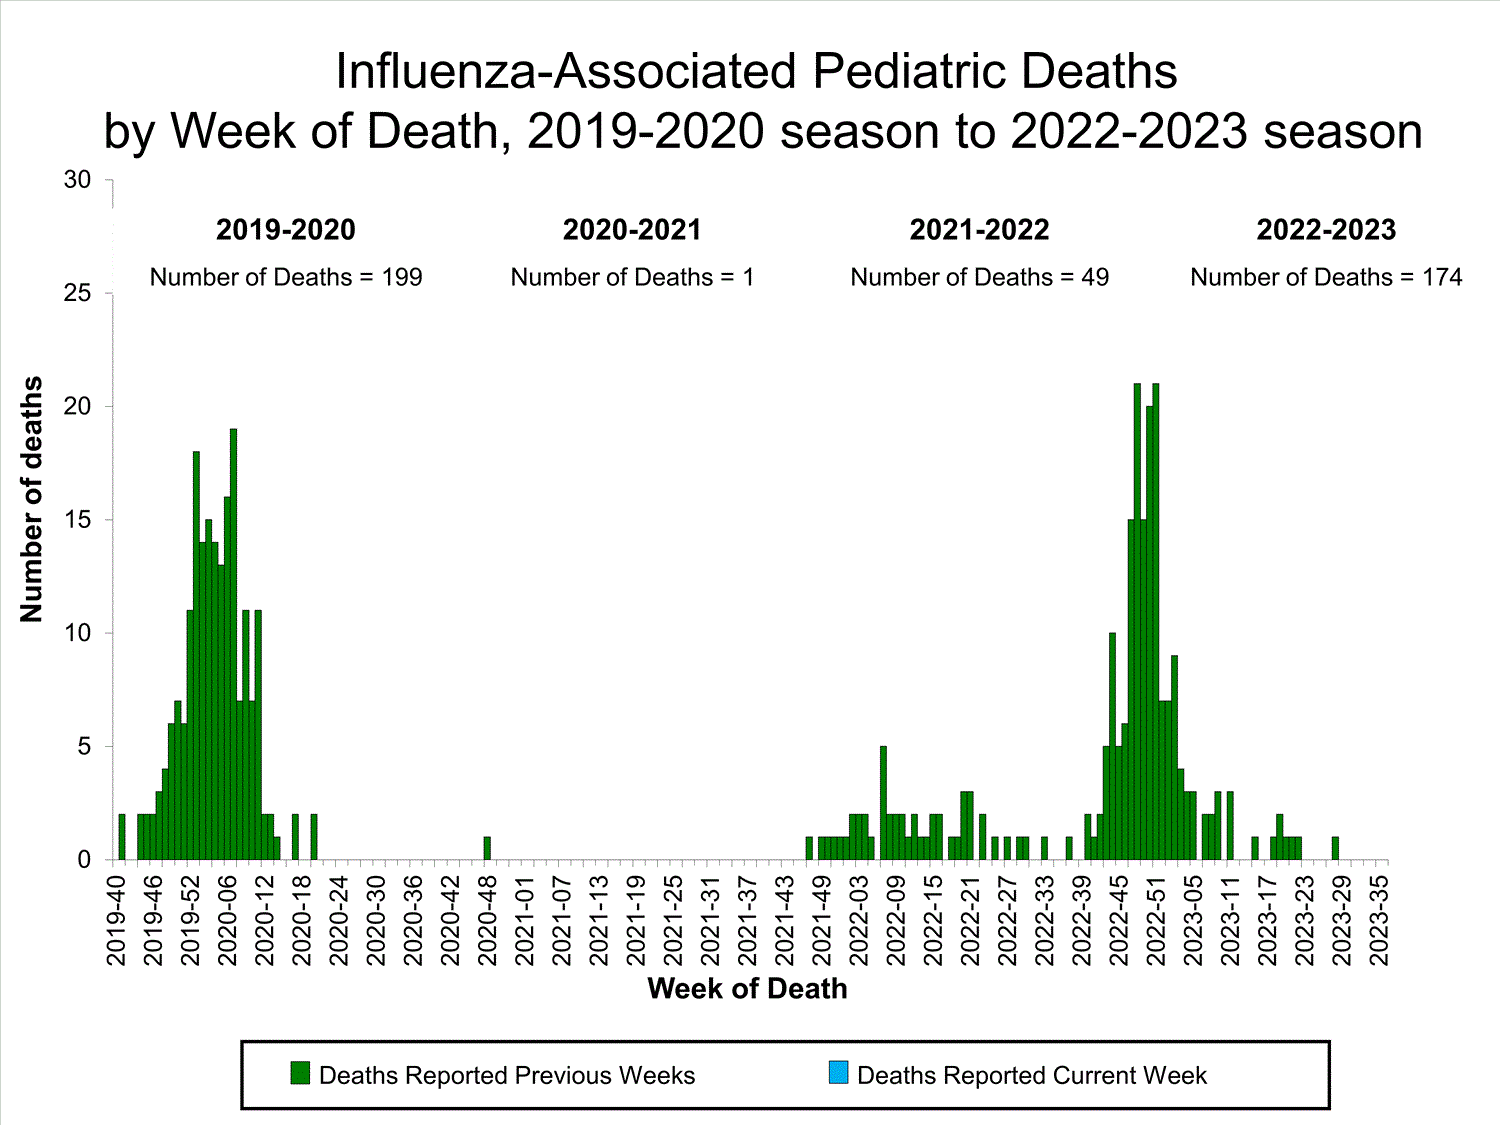
No influenza-associated pediatric deaths were reported to CDC during week 36.

A total of 174 influenza-associated pediatric deaths occurring during the 2022-2023 season have been reported to CDC.

Click on image to launch interactive tool View Full Screen
Additional pediatric mortality surveillance information for current and past seasons:
Surveillance Methods | FluView Interactive

Additional National and International Influenza Surveillance Information


FluView Interactive: FluView includes enhanced web-based interactive applications that can provide dynamic visuals of the influenza data collected and analyzed by CDC. These FluView Interactive applications allow people to create customized, visual interpretations of influenza data, as well as make comparisons across flu seasons, regions, age groups and a variety of other demographics.

National Institute for Occupational Safety and Health: Monthly surveillance data on the prevalence of health-related workplace absenteeism among full-time workers in the United States are available from NIOSH.

U.S. State and local influenza surveillance: Select a jurisdiction below to access the latest local influenza information.

https://www.cdc.gov/flu/weekly/index.htm
 
Weekly U.S. Influenza Surveillance Report


Print
Updated September 22, 2023
fluview-banner2.jpg


2022-2023 Influenza Season

Week 37 ending September 16, 2023

All data in this report are preliminary and may change as more reports are received.

A description of the CDC influenza surveillance system, including methodology and detailed descriptions of each data component, is available on the surveillance methods page.

Additional information on the current and previous influenza seasons for each surveillance component is available on FluView Interactive. U.S. Virologic Surveillance

Clinical Laboratories


The results of tests performed by clinical laboratories nationwide are summarized below. Data from clinical laboratories (the percentage of specimens tested that are positive for influenza) are used to monitor whether influenza activity is increasing or decreasing.
No. of specimens tested39,0314,081,761
No. of positive specimens (%)315 (0.8%)359,256 (8.8%)
Positive specimens by type
Influenza A211 (67.0%)349,371 (97.2%)
Influenza B104 (33.0%)9,885 (2.8%)
INFLUENZA Virus Isolated

View Chart Data | View Full Screen Public Health Laboratories


The results of tests performed by public health laboratories nationwide are summarized below. Data from public health laboratories are used to monitor the proportion of circulating viruses that belong to each influenza virus type/subtype/lineage. Viruses known to be associated with recent live attenuated influenza vaccine (LAIV) receipt or found upon further testing to be a vaccine virus are not included as they are not circulating influenza viruses.
No. of specimens tested2,801286,709
No. of positive specimens4931,107
Positive specimens by type/subtype
Influenza A36 (73.5%)29,641 (95.3%)
(H1N1)pdm0920 (80.0%)7,530 (29.8%)
H3N25 (20.0%)17,704 (70.2%)
H3N2v02 (<0.1%)
Subtyping not performed114,405
Influenza B13 (26.5%)1,466 (4.7%)
Yamagata lineage0 (0%)0 (0%)
Victoria lineage10 (100%)1,186 (100%)
Lineage not performed3280


INFLUENZA Virus Isolated
View Chart Data | View Full Screen
Additional virologic surveillance information for current and past seasons:
Surveillance Methods | FluView Interactive: National, Regional, and State Data or Age Data Novel Influenza A Virus


A human infection with a novel influenza A virus was reported by the Montana Department of Public Health and Human Services. The patient was infected with an influenza A(H1N2) variant (A(H1N2)v) virus. The patient was < 18 years of age at the time of infection, sought health care during the week ending August 5, 2023 (week 31), and has not been hospitalized. An investigation by local public health officials found that prior to their illness onset the patient attended an agricultural fair. The investigation is currently ongoing.

This is the third human infection with a variant influenza A virus reported in the United States in 2023, including one infection with an H3v (Michigan) virus and two infections with H1N2v (Michigan, Montana) viruses.

When an influenza virus that normally circulates in swine (but not people) is detected in a person, it is called a “variant” influenza virus. Most human infections with variant influenza viruses occur following exposure to swine, but human-to-human transmission can occur. It is important to note that in most cases, variant influenza viruses have not shown the ability to spread easily and sustainably from person to person.

Early identification and investigation of human infections with novel influenza A viruses are critical so that the risk of infection can be understood, and appropriate public health measures can be taken.

Additional information on influenza in swine, variant influenza virus infection in humans, and guidance to interact safely with swine can be found at www.cdc.gov/flu/swineflu/index.htm.
Additional information regarding human infections with novel influenza A viruses:
Surveillance Methods | FluView Interactive Outpatient Respiratory Illness Surveillance


The U.S. Outpatient Influenza-like Illness Surveillance Network (ILINet) monitors outpatient visits for respiratory illness referred to as influenza-like illness [ILI (fever plus cough or sore throat)], not laboratory-confirmed influenza, and may capture respiratory illness visits due to infection with any pathogen that can present with similar symptoms, including influenza, SARS-CoV-2, and RSV. Therefore, it is important to evaluate syndromic surveillance data, including that from ILINet, in the context of other sources of surveillance data to obtain a complete and accurate picture of influenza, SARS-CoV-2, and other respiratory virus activity. Other respiratory virus surveillance data can be found on CDC’s COVID Data Tracker, NCIRD Surveillance Systems website and National Respiratory and Enteric Virus Surveillance System (NREVSS) website. Outpatient Respiratory Illness Visits


Nationwide during week 37, 2.0% of patient visits reported through ILINet were due to respiratory illness that included fever plus a cough or sore throat, also referred to as ILI. Multiple respiratory viruses are co-circulating, and the relative contribution of influenza virus infection to ILI varies by location.

national levels of ILI and ARI

* Effective October 3, 2021 (week 40), the ILI definition (fever plus cough or sore throat) no longer includes “without a known cause other than influenza.”

View Chart Data (current season only) | View Full Screen Outpatient Respiratory Illness Visits by Age Group


More than 70% of ILINet participants provide both the number of patient visits for respiratory illness and the total number of patient visits for the week broken out by age group. Data from this subset of providers are used to calculate the percentages of patient visits for respiratory illness by age group.

During week 37, the percentage of visits for respiratory illness reported in ILINet was 6.3% among those 0-4 years, 3.0% among those 5-24 years, 1.6% among those 25-49 years, 1.1% among those 50-64 years, and 0.8% among those 65 years and older.

national levels of ILI and ARI by age group

View Chart Data | View Full Screen Outpatient Respiratory Illness Activity Map


Data collected in ILINet are used to produce a measure of ILI activity* by state/jurisdiction and Core Based Statistical Areas (CBSA).
Week 37
(Week ending
Sept. 16, 2023)
Week 36
(Week ending
Sept. 9, 2023)
Week 37
(Week ending
Sept. 16, 2023)
Week 36
(Week ending
Sept. 9, 2023)
Very High0013
High11129
Moderate422025
Low6106685
Minimal4442562547
Insufficient Data00268260


*Data collected in ILINet may disproportionally represent certain populations within a jurisdiction or CBSA, and therefore, may not accurately depict the full picture of influenza activity for the entire jurisdiction or CBSA. Differences in the data presented here by CDC and independently by some health departments likely represent differing levels of data completeness with data presented by the health department likely being the more complete.
Additional information about medically attended visits for ILI for current and past seasons:
Surveillance Methods | FluView Interactive: National, Regional, and State Data or ILI Activity Map Hospitalization Surveillance

FluSurv-NET


The Influenza Hospitalization Surveillance Network (FluSurv-NET) conducts population-based surveillance for laboratory-confirmed influenza-related hospitalizations in select counties in 13 states and represents approximately 9% of the U.S. population. FluSurv-NET hospitalization data are preliminary. Patients admitted for laboratory-confirmed influenza-related hospitalization after April 30, 2023, will not be included in FluSurv-NET for the 2022-2023 season. Data on patients admitted through April 30, 2023, will continue to be updated on FluView Interactive as additional information is received.
Additional FluSurv-NET hospitalization surveillance information for current and past seasons and additional age groups:
Surveillance Methods |FluView Interactive: Rates by Age, Sex, and Race/Ethnicity or Data on Patient Characteristics | RESP-NET Interactive HHS Protect Hospitalization Surveillance


Hospitals report to HHS Protect the number of patients admitted with laboratory-confirmed influenza. During week 37, 820 patients with laboratory-confirmed influenza were admitted to a hospital.

national levels of influenza hospitalizations
View Chart Data | View Full Screen
Additional HHS Protect hospitalization surveillance information:
Surveillance Methods | Additional Data Mortality Surveillance

National Center for Health Statistics (NCHS) Mortality Surveillance


Based on NCHS mortality surveillance data available on September 21, 2023, 7.6% of the deaths that occurred during the week ending September 16, 2023 (week 37), were due to pneumonia, influenza, and/or COVID-19 (PIC). This percentage is above the epidemic threshold of 5.6% for this week. Among the 1,716 PIC deaths reported for this week, 615 had COVID-19 listed as an underlying or contributing cause of death on the death certificate, and 13 listed influenza. The data presented are preliminary and may change as more data are received and processed.

Click on image to launch interactive toolView Chart Data | View Full Screen
Additional pneumonia, influenza and COVID-19 mortality surveillance information for current and past seasons:
Surveillance Methods | FluView Interactive Influenza-Associated Pediatric Mortality


Two influenza-associated pediatric deaths occurring during the 2022-2023 season were reported to CDC during week 37. One death was associated with an influenza A virus for which no subtyping was performed and occurred during week 47 of 2022 (the week ending November 26, 2022). The other death was associated with an influenza B virus with no lineage determined and occurred during week 32 of 2023 (the week ending August 12, 2023).

A total of 176 influenza-associated pediatric deaths occurring during the 2022-2023 season have been reported to CDC.

Click on image to launch interactive tool View Full Screen
Additional pediatric mortality surveillance information for current and past seasons:
Surveillance Methods | FluView Interactive

Additional National and International Influenza Surveillance Information


FluView Interactive: FluView includes enhanced web-based interactive applications that can provide dynamic visuals of the influenza data collected and analyzed by CDC. These FluView Interactive applications allow people to create customized, visual interpretations of influenza data, as well as make comparisons across flu seasons, regions, age groups and a variety of other demographics.

National Institute for Occupational Safety and Health: Monthly surveillance data on the prevalence of health-related workplace absenteeism among full-time workers in the United States are available from NIOSH.

U.S. State and local influenza surveillance: Select a jurisdiction below to access the latest local influenza information.

https://www.cdc.gov/flu/weekly/index.htm
 
Weekly U.S. Influenza Surveillance Report


Print
Updated September 29, 2023
fluview-banner2.jpg


2022-2023 Influenza Season

Week 38 ending September 23, 2023

All data in this report are preliminary and may change as more reports are received.

A description of the CDC influenza surveillance system, including methodology and detailed descriptions of each data component, is available on the surveillance methods page.

Additional information on the current and previous influenza seasons for each surveillance component is available on FluView Interactive. U.S. Virologic Surveillance

Clinical Laboratories


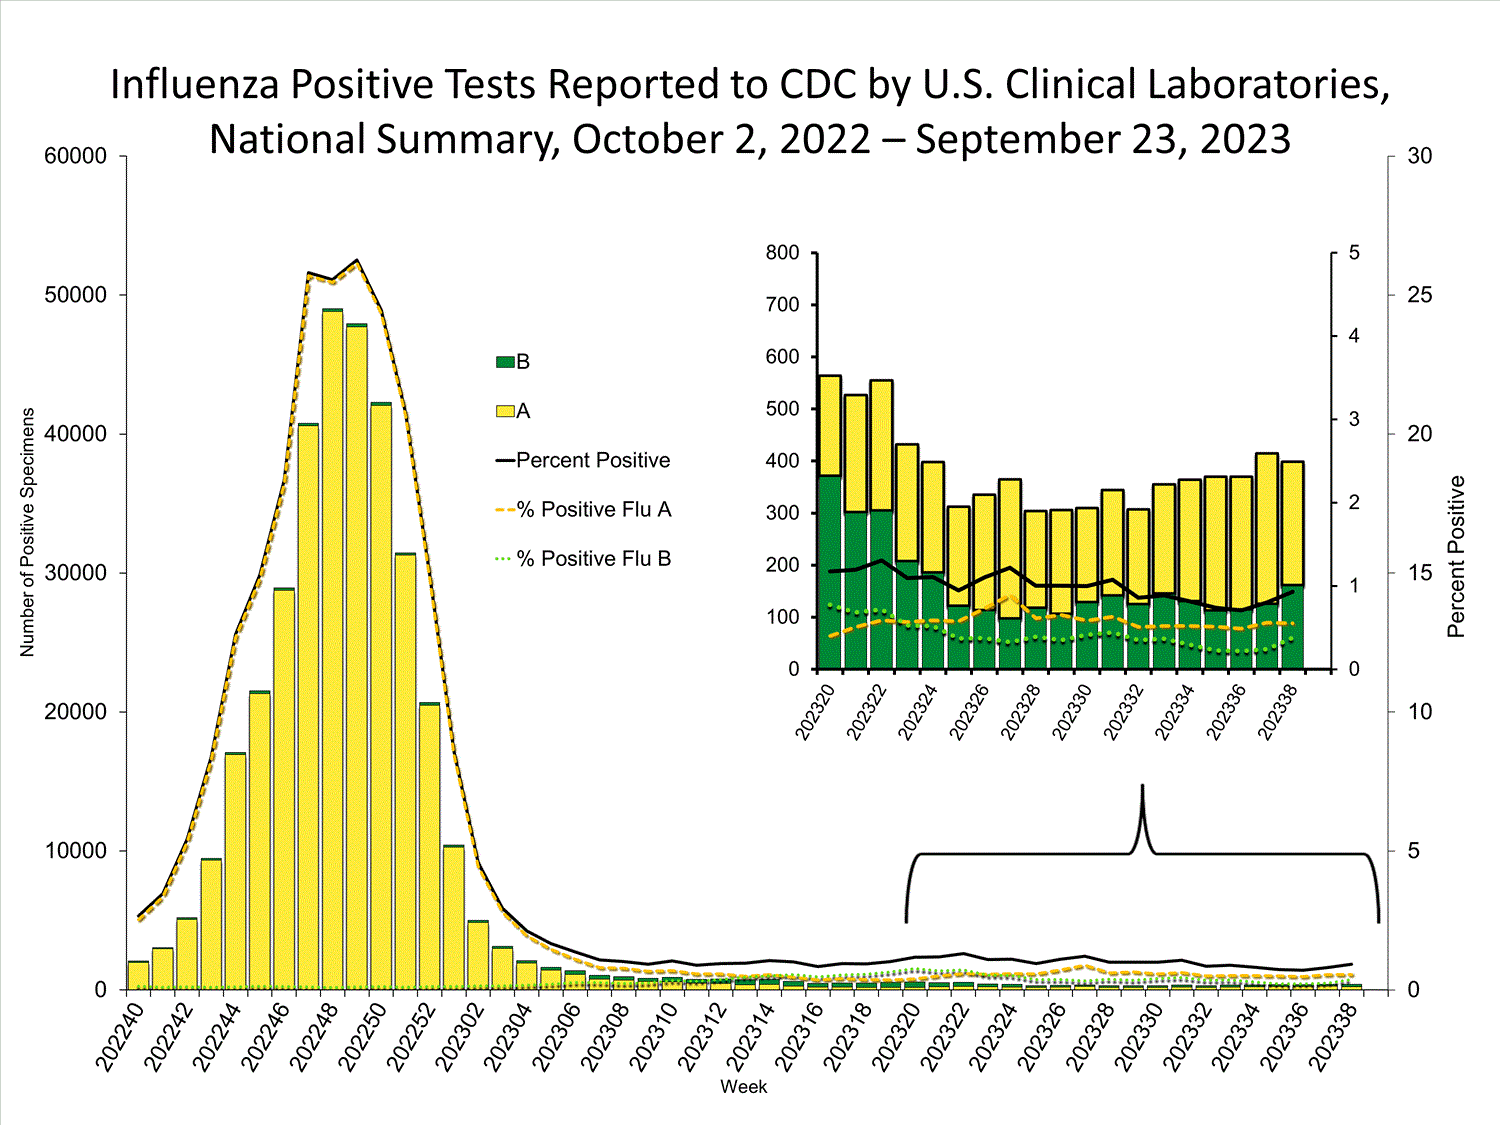
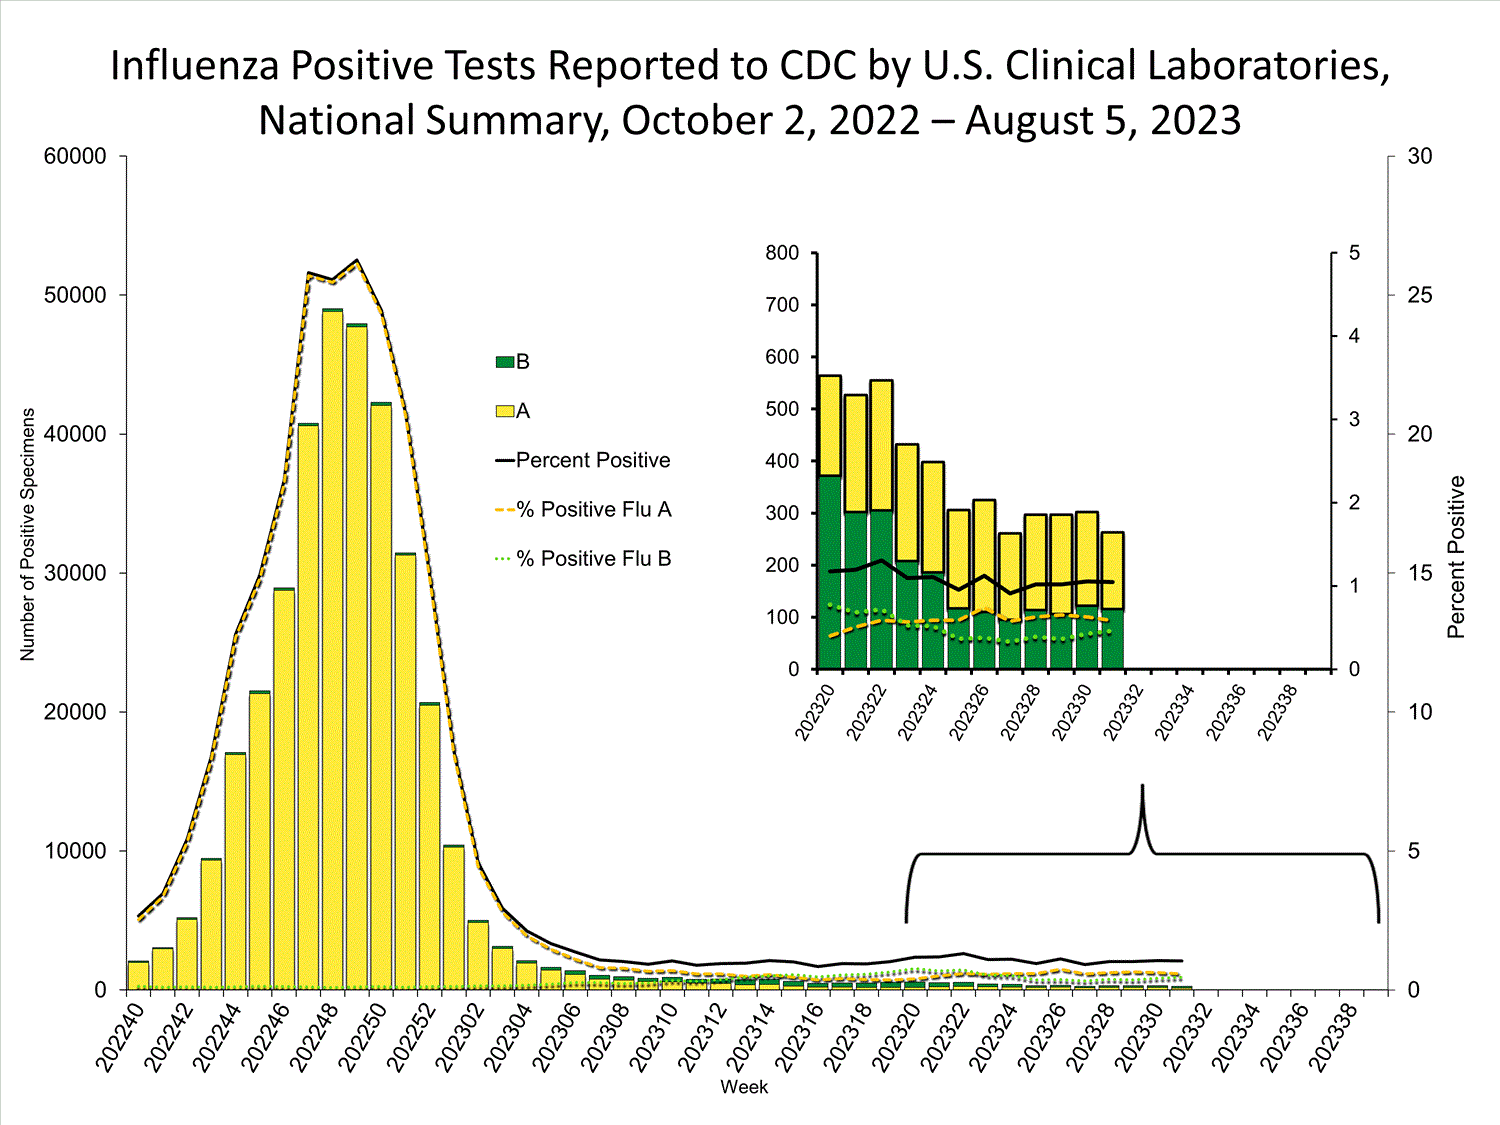
The results of tests performed by clinical laboratories nationwide are summarized below. Data from clinical laboratories (the percentage of specimens tested that are positive for influenza) are used to monitor whether influenza activity is increasing or decreasing.
No. of specimens tested42,9044,144,631
No. of positive specimens (%)399 (0.9%)359,916 (8.7%)
Positive specimens by type
Influenza A237 (59.4%)349,813 (97.2%)
Influenza B162 (40.6%)10,103 (2.8%)
INFLUENZA Virus Isolated

View Chart Data | View Full Screen Public Health Laboratories


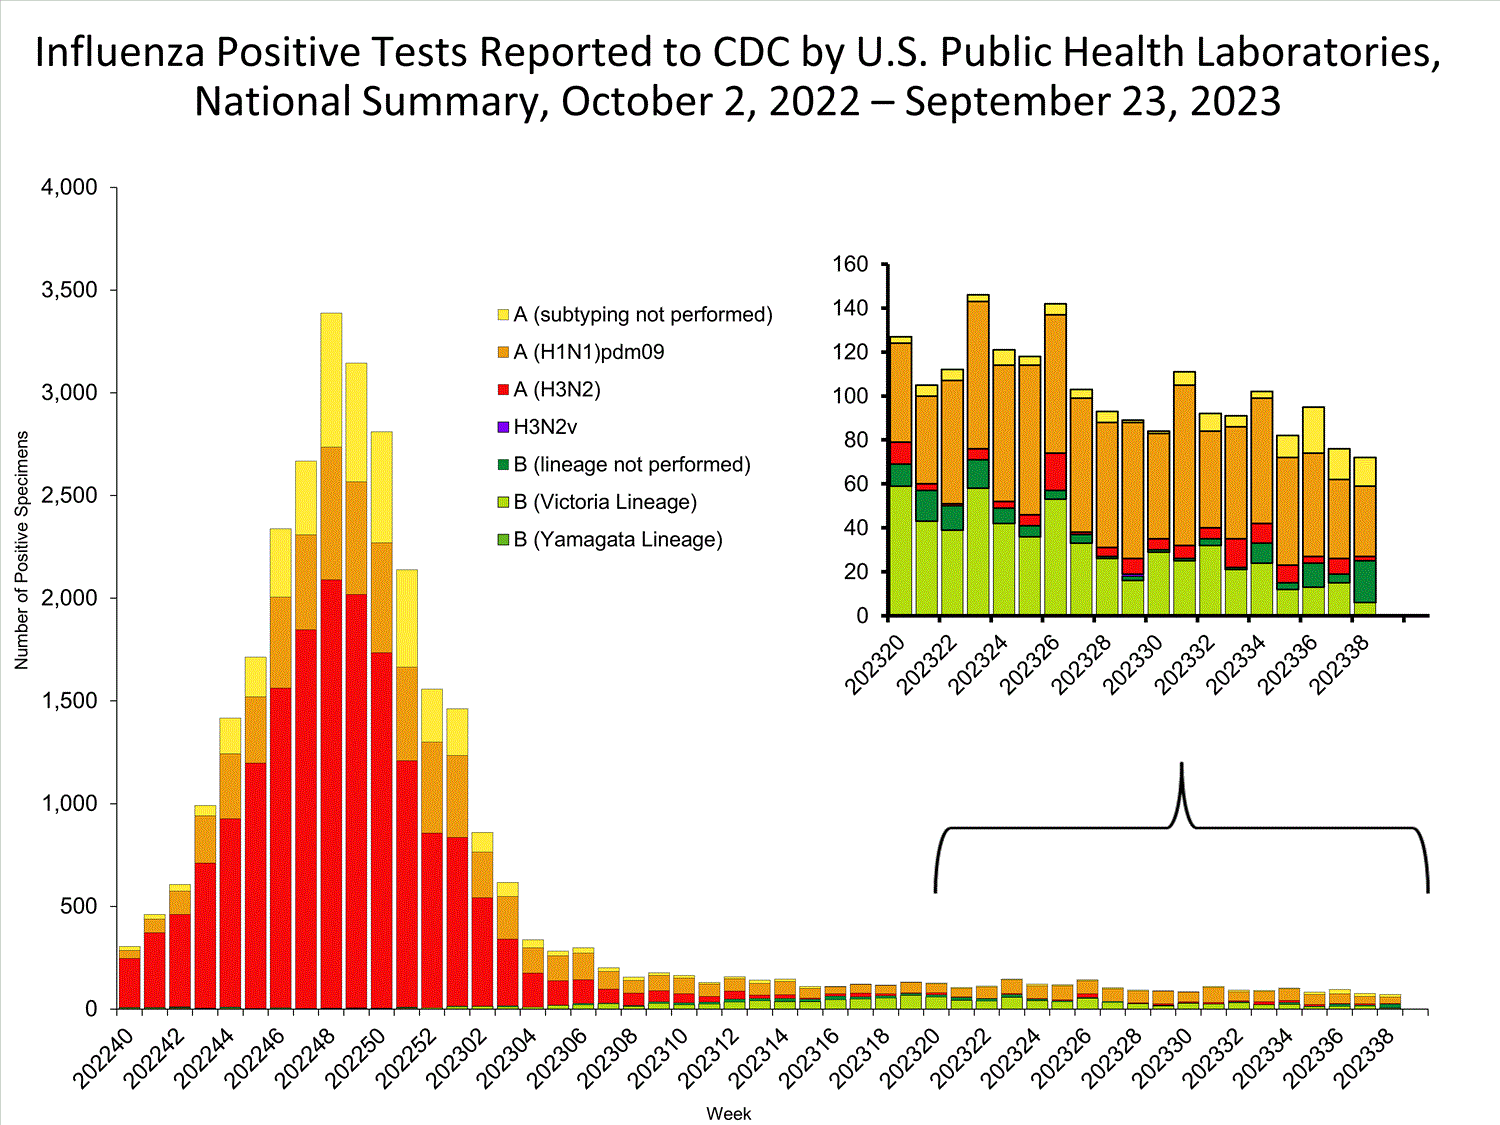
The results of tests performed by public health laboratories nationwide are summarized below. Data from public health laboratories are used to monitor the proportion of circulating viruses that belong to each influenza virus type/subtype/lineage. Viruses known to be associated with recent live attenuated influenza vaccine (LAIV) receipt or found upon further testing to be a vaccine virus are not included as they are not circulating influenza viruses.
No. of specimens tested2,717289,867
No. of positive specimens7231,218
Positive specimens by type/subtype
Influenza A47 (65.3%)29,718 (95.2%)
(H1N1)pdm0932 (94.1%)7,592 (30%)
H3N22 (5.9%)17,709 (70%)
H3N2v02 (<0.1%)
Subtyping not performed134,415
Influenza B25 (34.7%)1,500 (4.8%)
Yamagata lineage0 (0%)0 (0%)
Victoria lineage6 (100%)1,202 (100%)
Lineage not performed19298


INFLUENZA Virus Isolated
View Chart Data | View Full Screen
Additional virologic surveillance information for current and past seasons:
Surveillance Methods | FluView Interactive: National, Regional, and State Data or Age Data Outpatient Respiratory Illness Surveillance


The U.S. Outpatient Influenza-like Illness Surveillance Network (ILINet) monitors outpatient visits for respiratory illness referred to as influenza-like illness [ILI (fever plus cough or sore throat)], not laboratory-confirmed influenza, and may capture respiratory illness visits due to infection with any pathogen that can present with similar symptoms, including influenza, SARS-CoV-2, and RSV. Therefore, it is important to evaluate syndromic surveillance data, including that from ILINet, in the context of other sources of surveillance data to obtain a complete and accurate picture of influenza, SARS-CoV-2, and other respiratory virus activity. Other respiratory virus surveillance data can be found on CDC’s COVID Data Tracker, NCIRD Surveillance Systems website and National Respiratory and Enteric Virus Surveillance System (NREVSS) website. Outpatient Respiratory Illness Visits


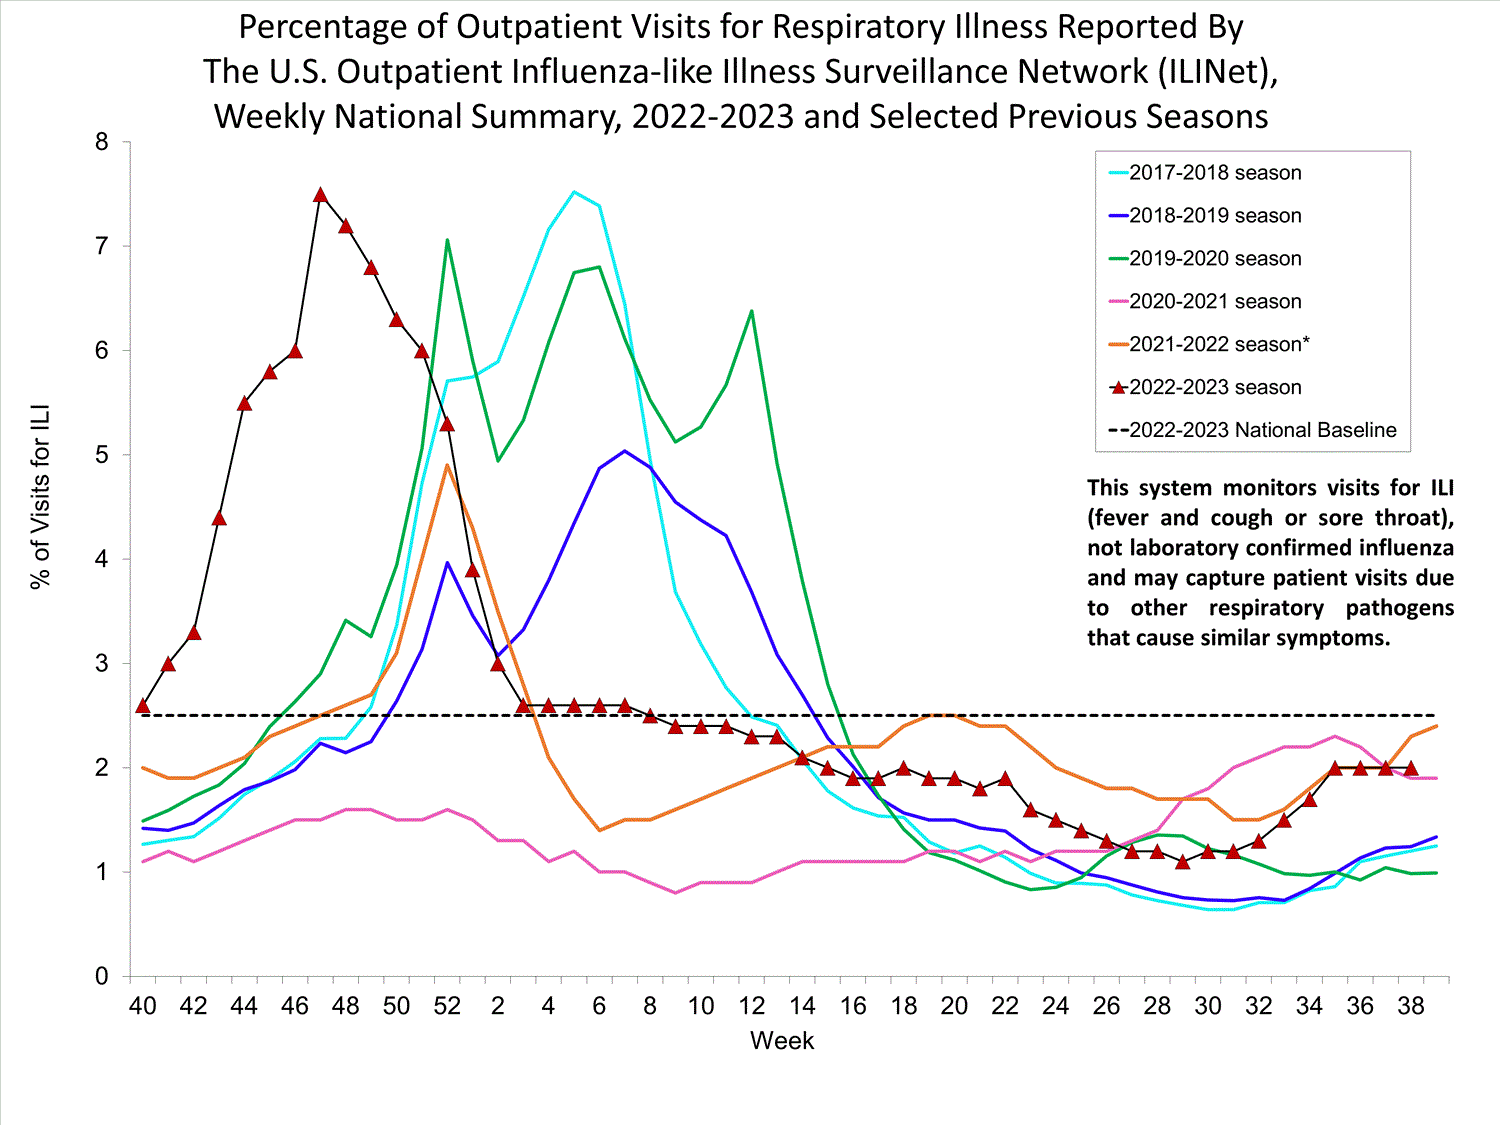
Nationwide during week 38, 2.0% of patient visits reported through ILINet were due to respiratory illness that included fever plus a cough or sore throat, also referred to as ILI. Multiple respiratory viruses are co-circulating, and the relative contribution of influenza virus infection to ILI varies by location.

national levels of ILI and ARI

* Effective October 3, 2021 (week 40), the ILI definition (fever plus cough or sore throat) no longer includes “without a known cause other than influenza.”

View Chart Data (current season only) | View Full Screen Outpatient Respiratory Illness Visits by Age Group


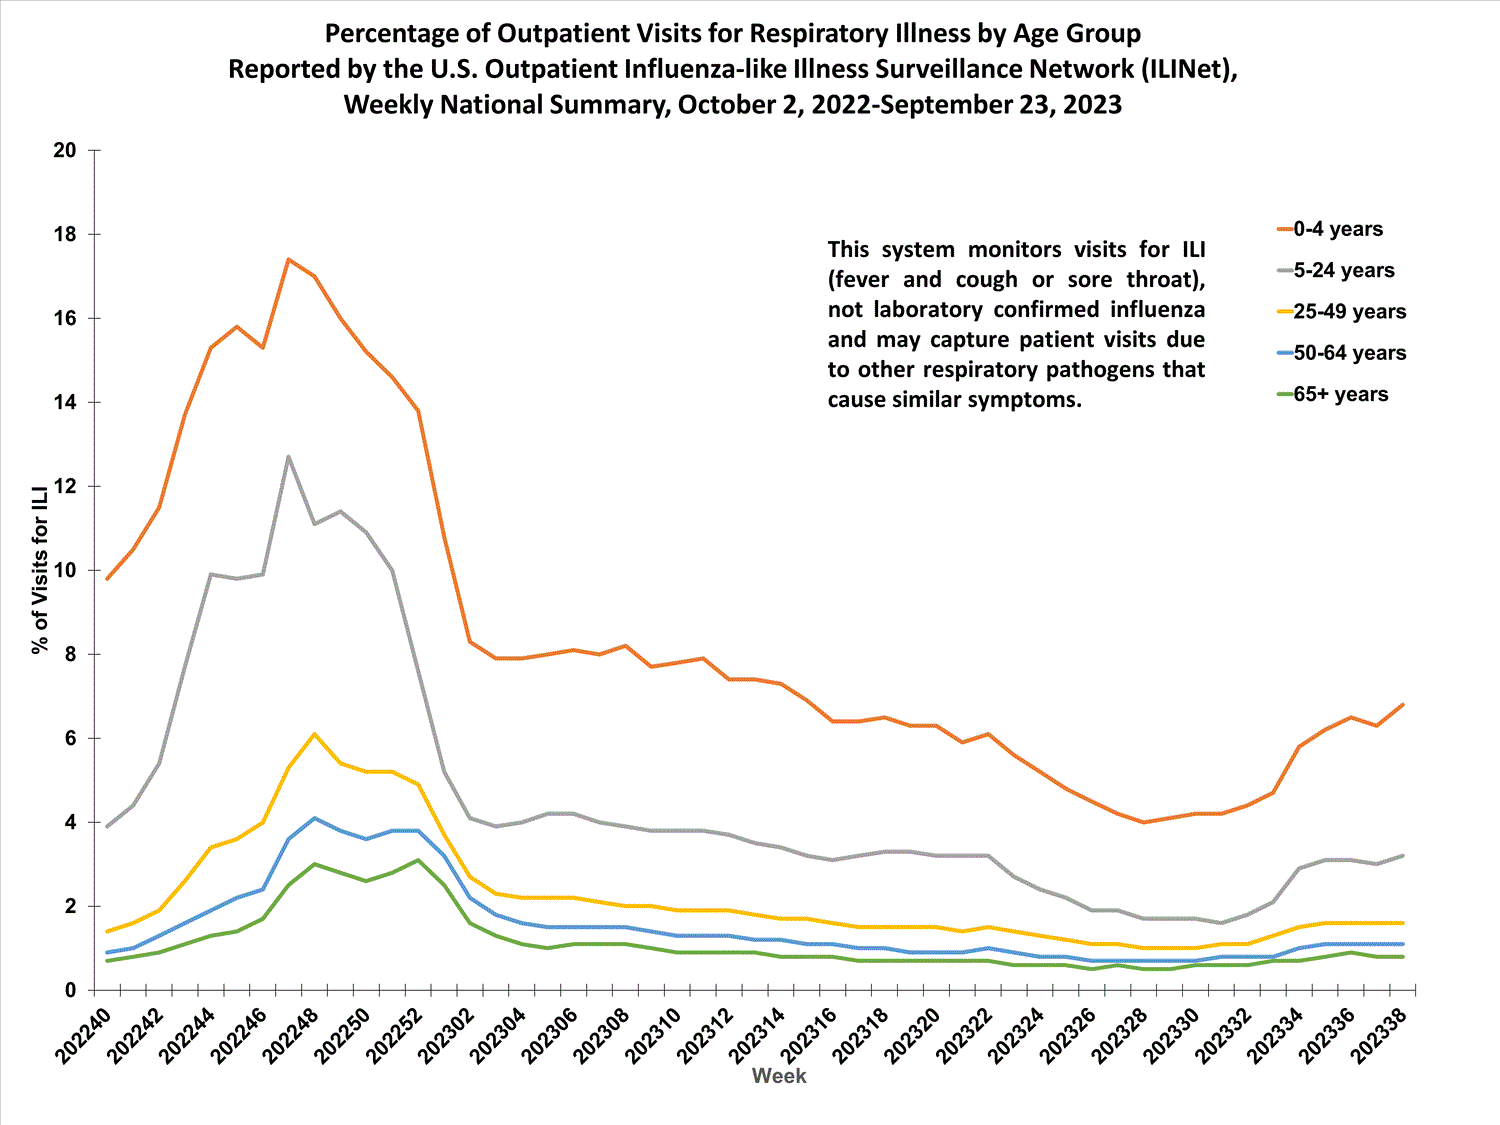
More than 70% of ILINet participants provide both the number of patient visits for respiratory illness and the total number of patient visits for the week broken out by age group. Data from this subset of providers are used to calculate the percentages of patient visits for respiratory illness by age group.

During week 38, the percentage of visits for respiratory illness reported in ILINet was 6.8% among those 0-4 years, 3.2% among those 5-24 years, 1.6% among those 25-49 years, 1.1% among those 50-64 years, and 0.8% among those 65 years and older.

national levels of ILI and ARI by age group

View Chart Data | View Full Screen Outpatient Respiratory Illness Activity Map


Data collected in ILINet are used to produce a measure of ILI activity* by state/jurisdiction and Core Based Statistical Areas (CBSA).
Week 38
(Week ending
Sept. 23, 2023)
Week 37
(Week ending
Sept. 16, 2023)
Week 38
(Week ending
Sept. 23, 2023)
Week 37
(Week ending
Sept. 16, 2023)
Very High0011
High311111
Moderate022623
Low878465
Minimal4345548574
Insufficient Data10259255


*Data collected in ILINet may disproportionally represent certain populations within a jurisdiction or CBSA, and therefore, may not accurately depict the full picture of influenza activity for the entire jurisdiction or CBSA. Differences in the data presented here by CDC and independently by some health departments likely represent differing levels of data completeness with data presented by the health department likely being the more complete.
Additional information about medically attended visits for ILI for current and past seasons:
Surveillance Methods | FluView Interactive: National, Regional, and State Data or ILI Activity Map Hospitalization Surveillance

FluSurv-NET


The Influenza Hospitalization Surveillance Network (FluSurv-NET) conducts population-based surveillance for laboratory-confirmed influenza-related hospitalizations in select counties in 13 states and represents approximately 9% of the U.S. population. FluSurv-NET hospitalization data are preliminary. Patients admitted for laboratory-confirmed influenza-related hospitalization after April 30, 2023, will not be included in FluSurv-NET for the 2022-2023 season. Data on patients admitted through April 30, 2023, will continue to be updated on FluView Interactive as additional information is received.
Additional FluSurv-NET hospitalization surveillance information for current and past seasons and additional age groups:
Surveillance Methods |FluView Interactive: Rates by Age, Sex, and Race/Ethnicity or Data on Patient Characteristics | RESP-NET Interactive National Healthcare Safety Network (NHSN) Hospitalization Surveillance


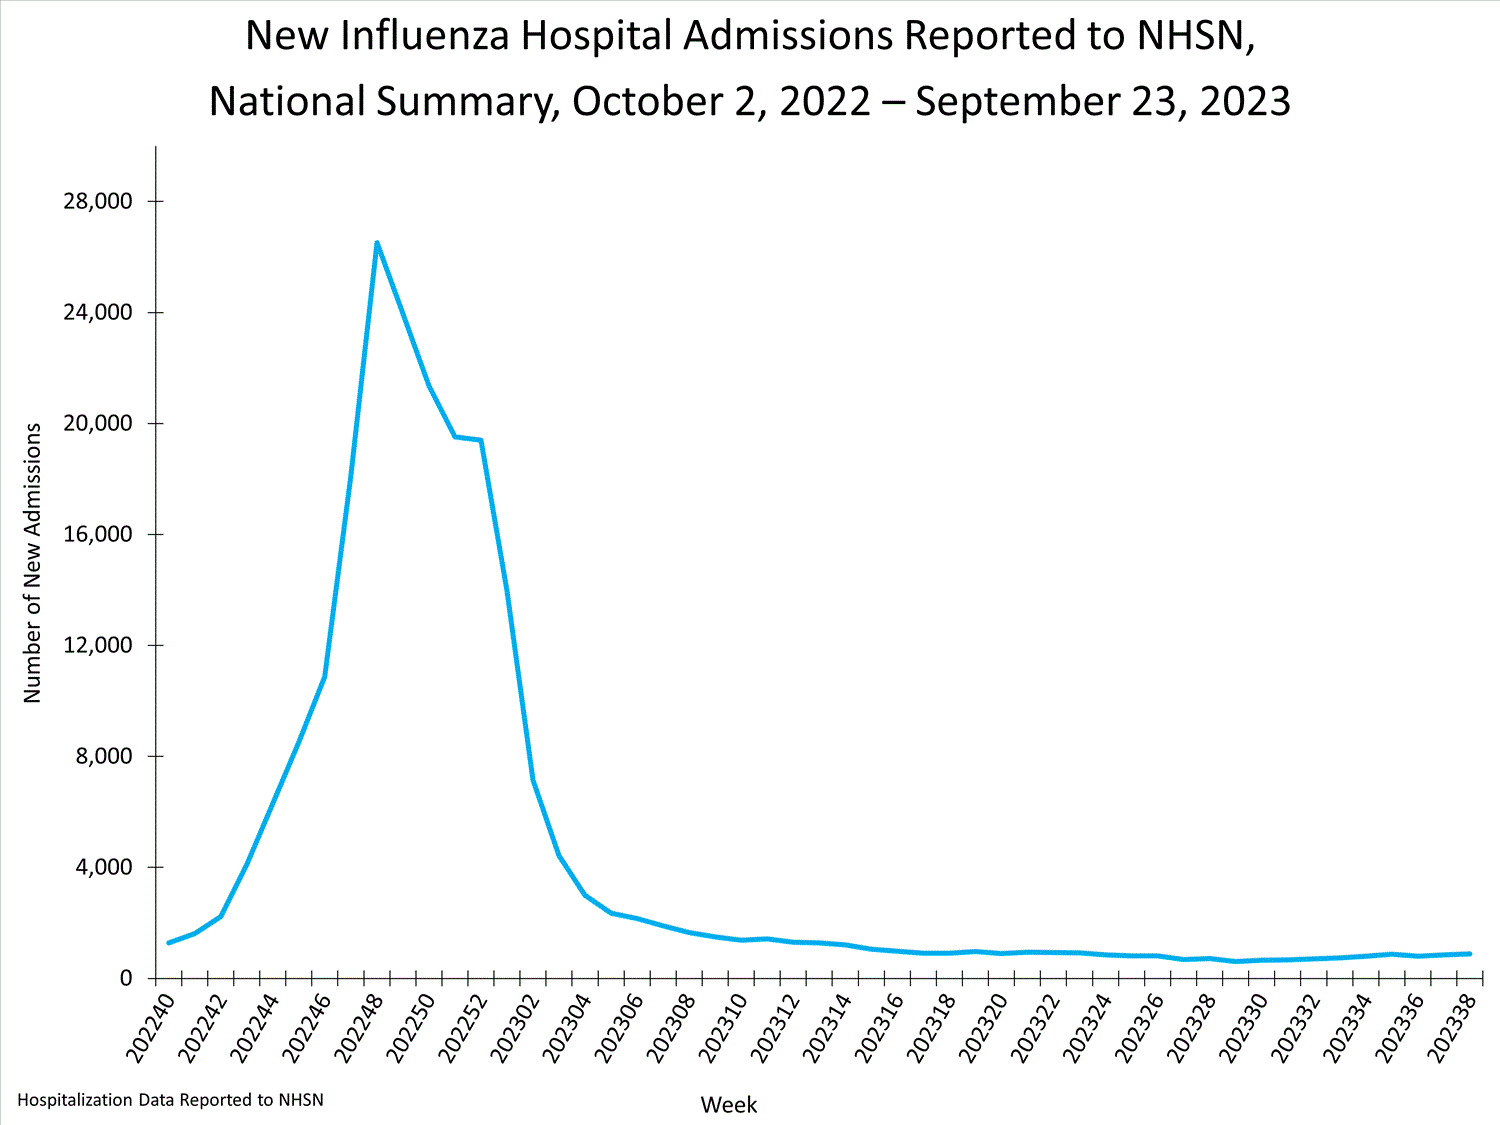
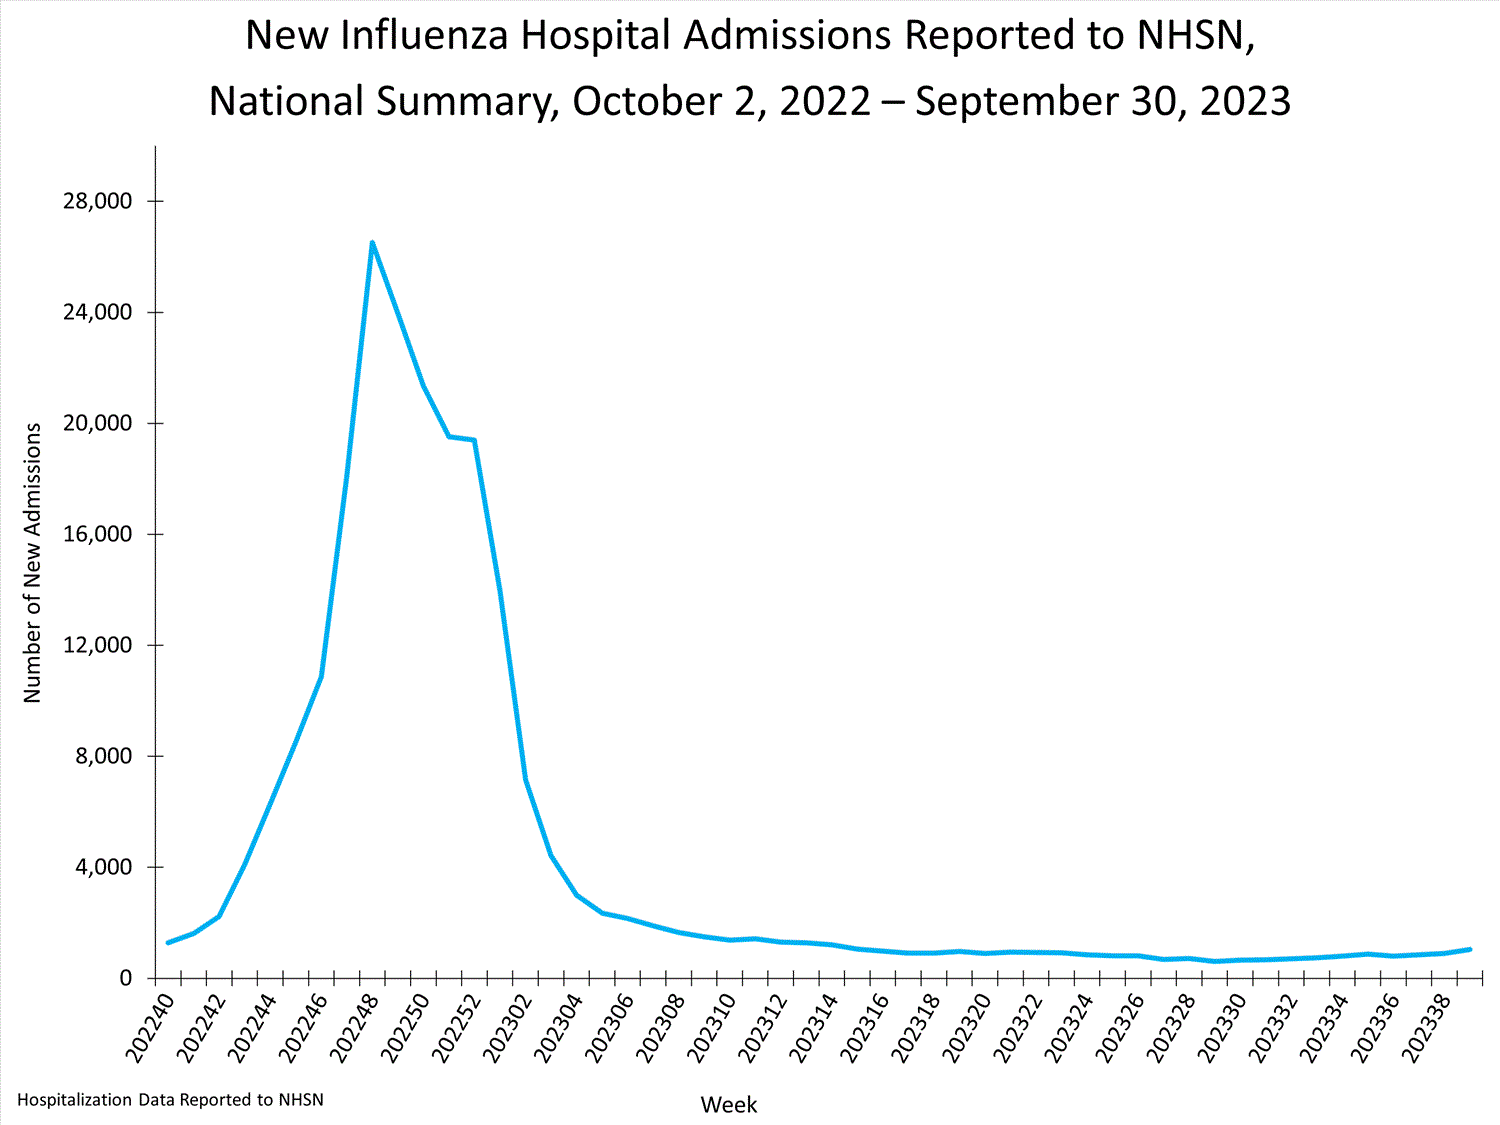
Hospitals report to NHSN the number of patients admitted with laboratory-confirmed influenza. During week 38, 880 patients with laboratory-confirmed influenza were admitted to a hospital.

national levels of influenza hospitalizations
View Chart Data | View Full Screen
Additional NHSN Hospitalization Surveillance information:
Surveillance Methods | Additional Data Mortality Surveillance

National Center for Health Statistics (NCHS) Mortality Surveillance


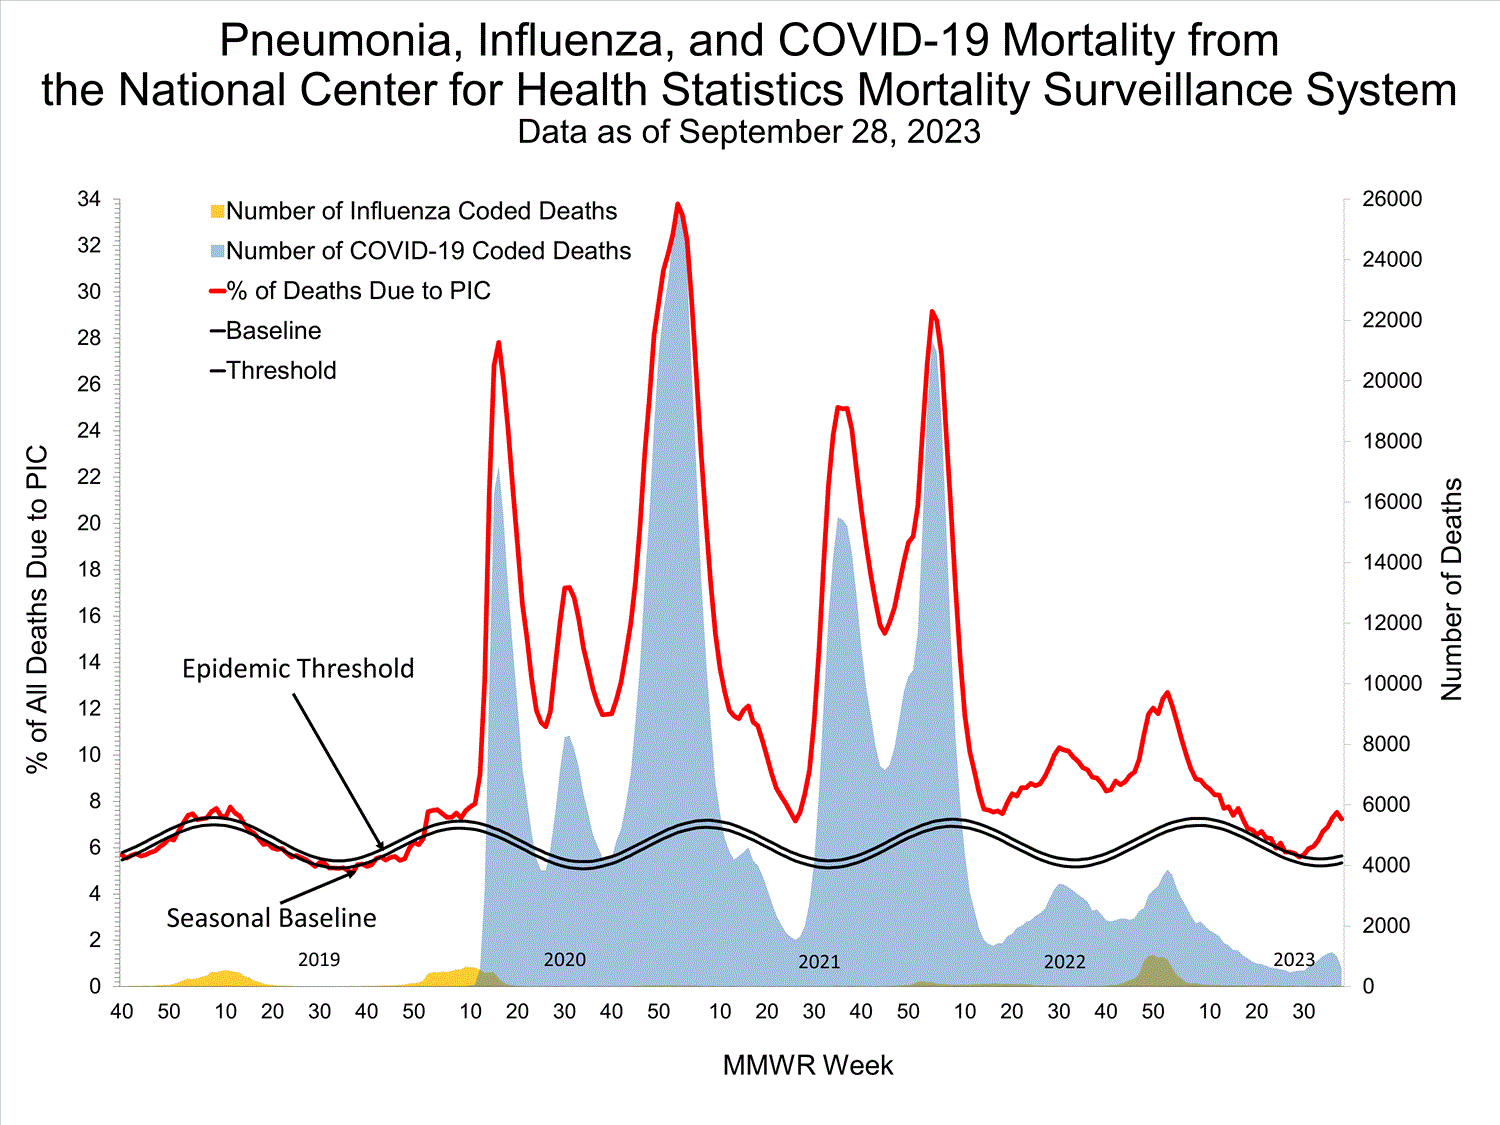
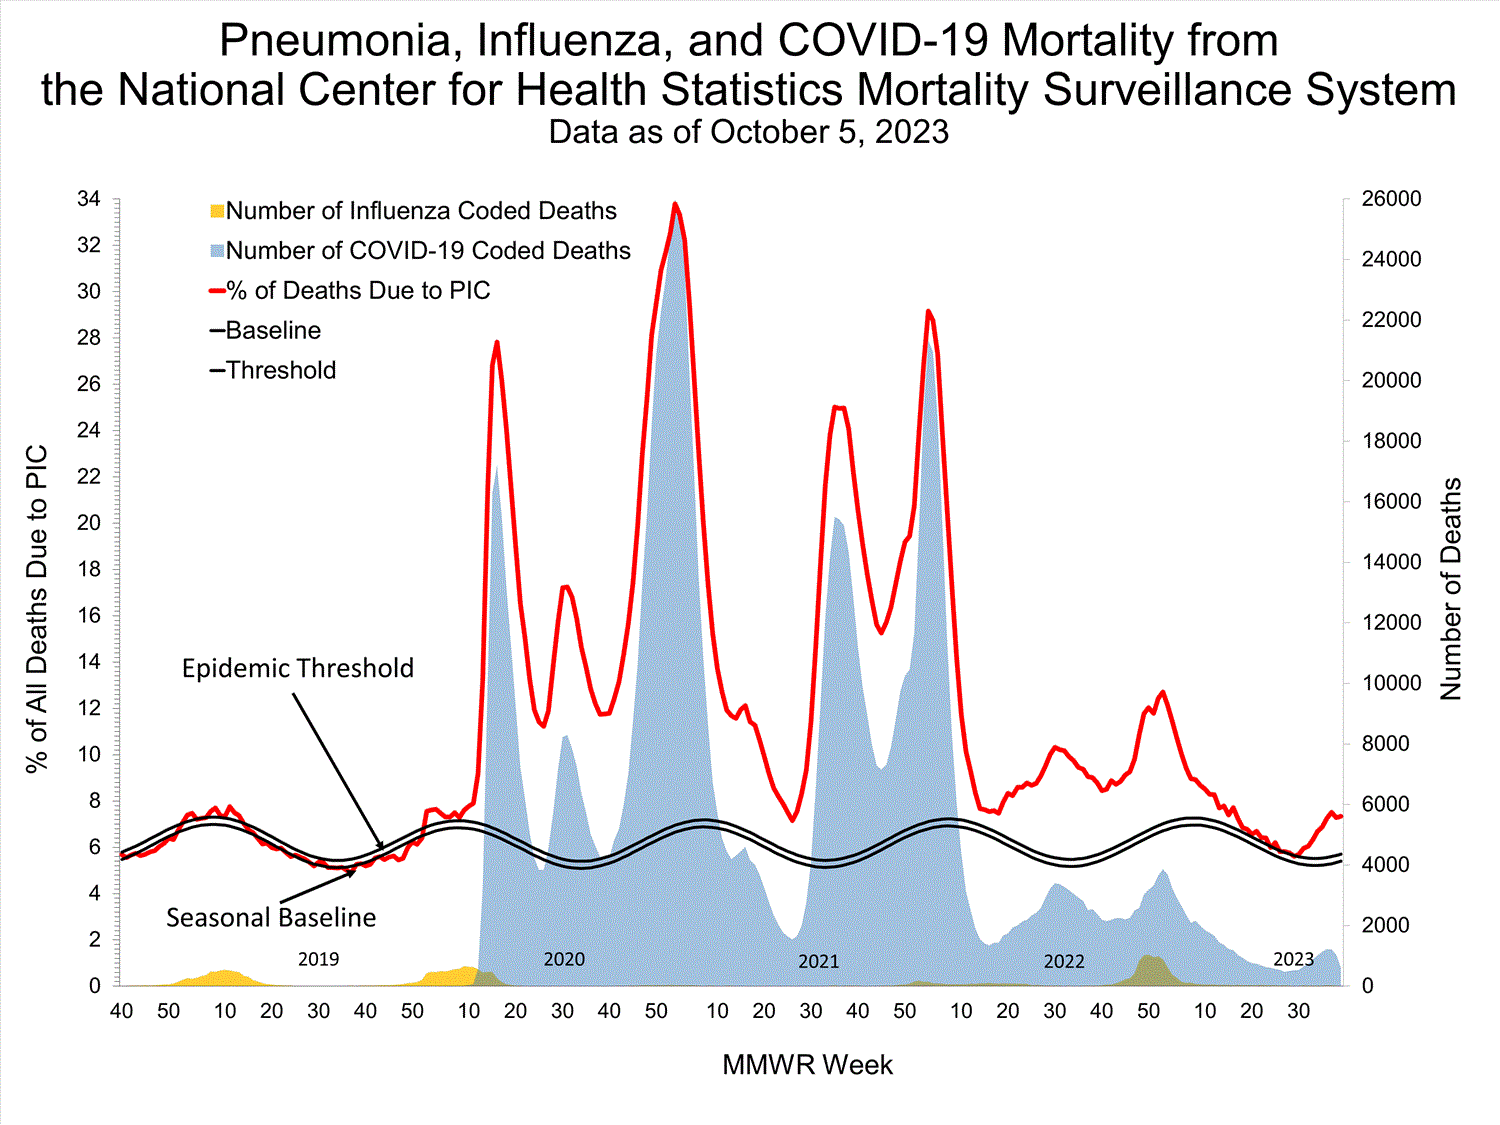
Based on NCHS mortality surveillance data available on September 28, 2023, 7.2% of the deaths that occurred during the week ending September 23, 2023 (week 38), were due to pneumonia, influenza, and/or COVID-19 (PIC). This percentage is above the epidemic threshold of 5.6% for this week. Among the 1,643 PIC deaths reported for this week, 607 had COVID-19 listed as an underlying or contributing cause of death on the death certificate, and 10 listed influenza. The data presented are preliminary and may change as more data are received and processed.

Click on image to launch interactive toolView Chart Data | View Full Screen
Additional pneumonia, influenza and COVID-19 mortality surveillance information for current and past seasons:
Surveillance Methods | FluView Interactive Influenza-Associated Pediatric Mortality


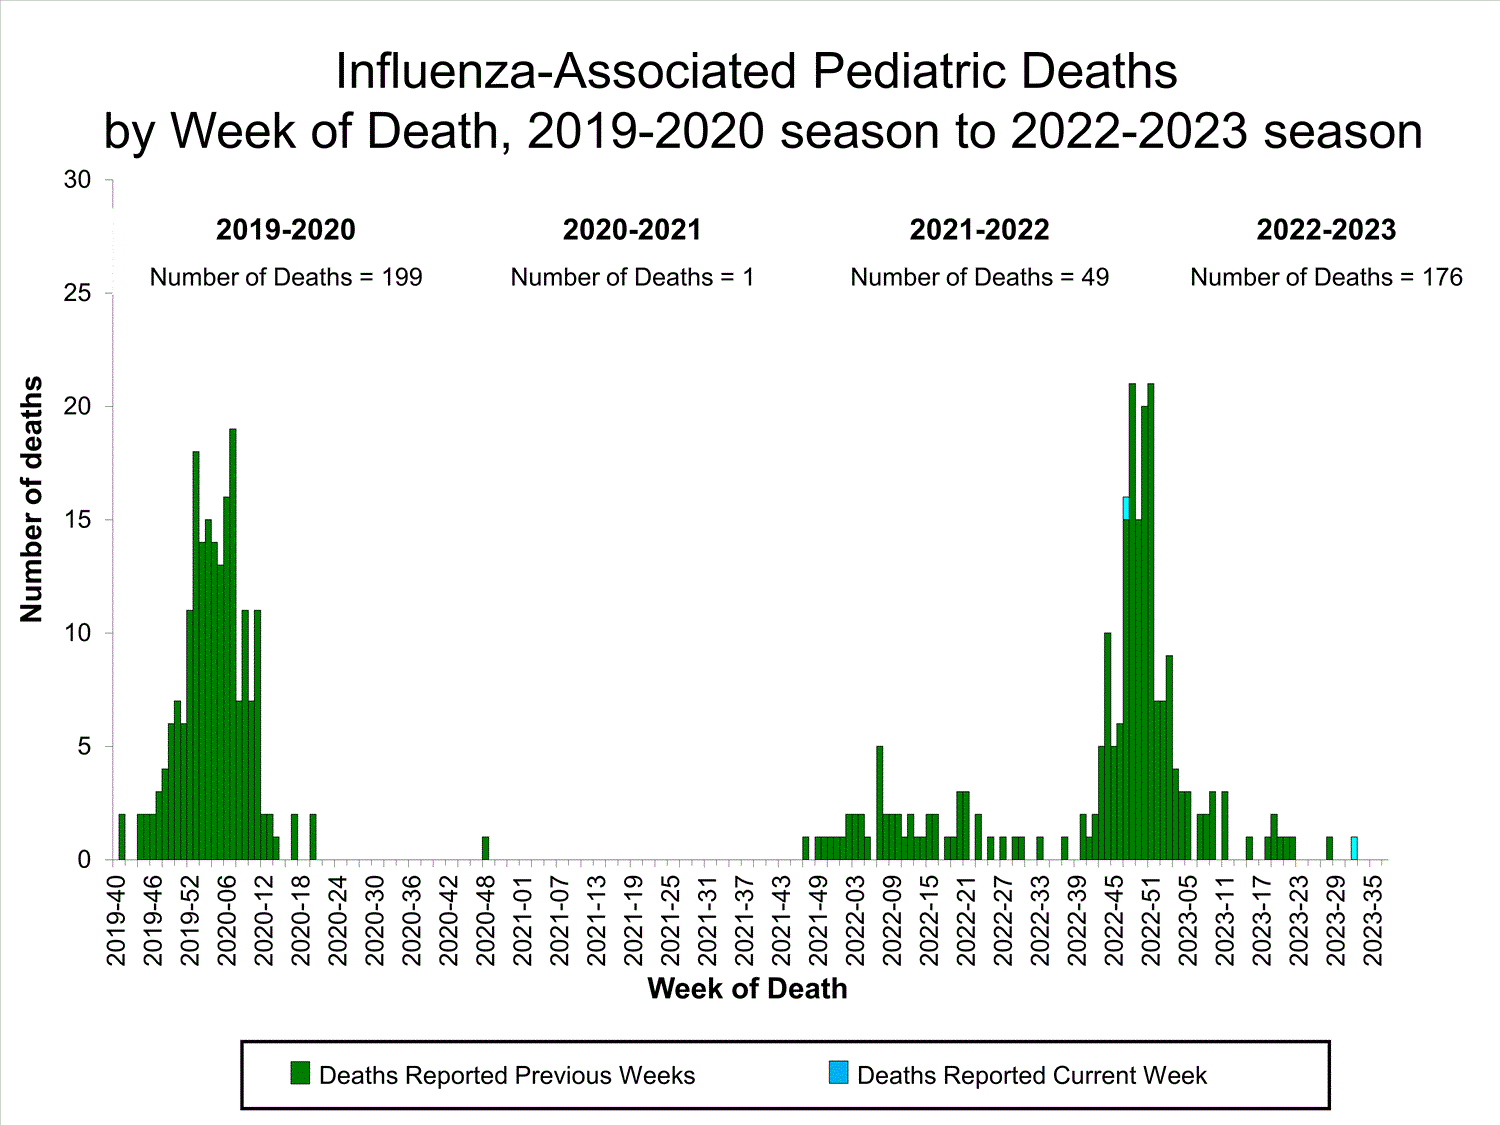
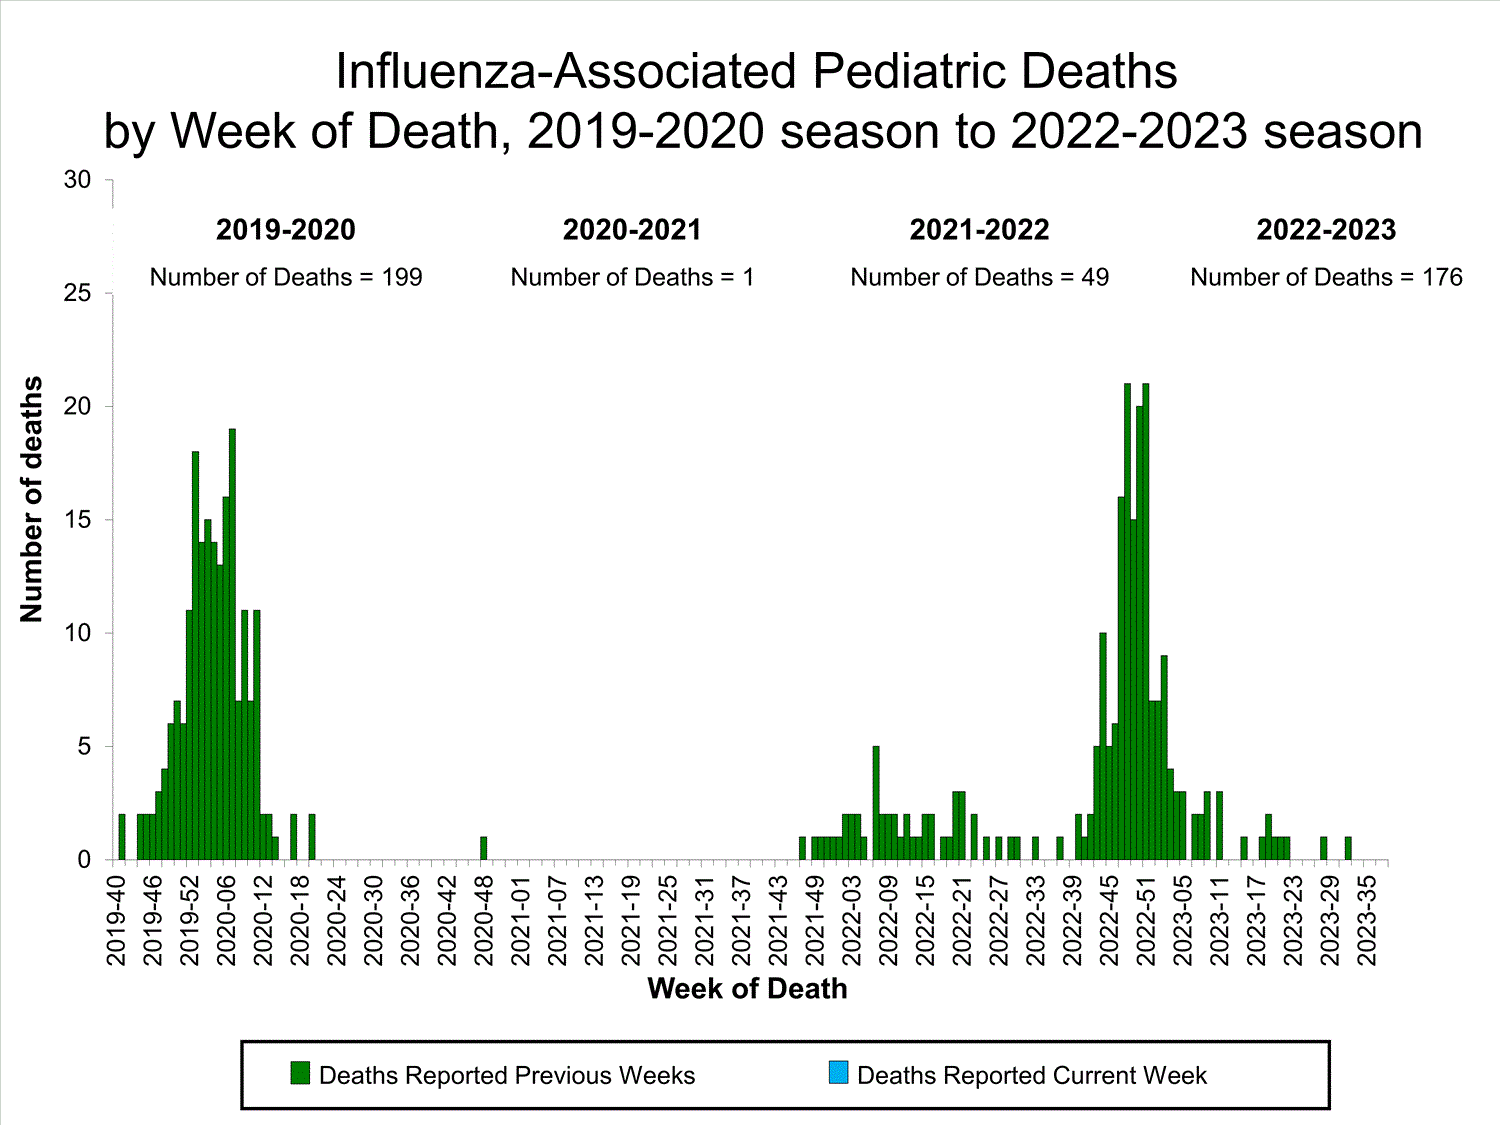
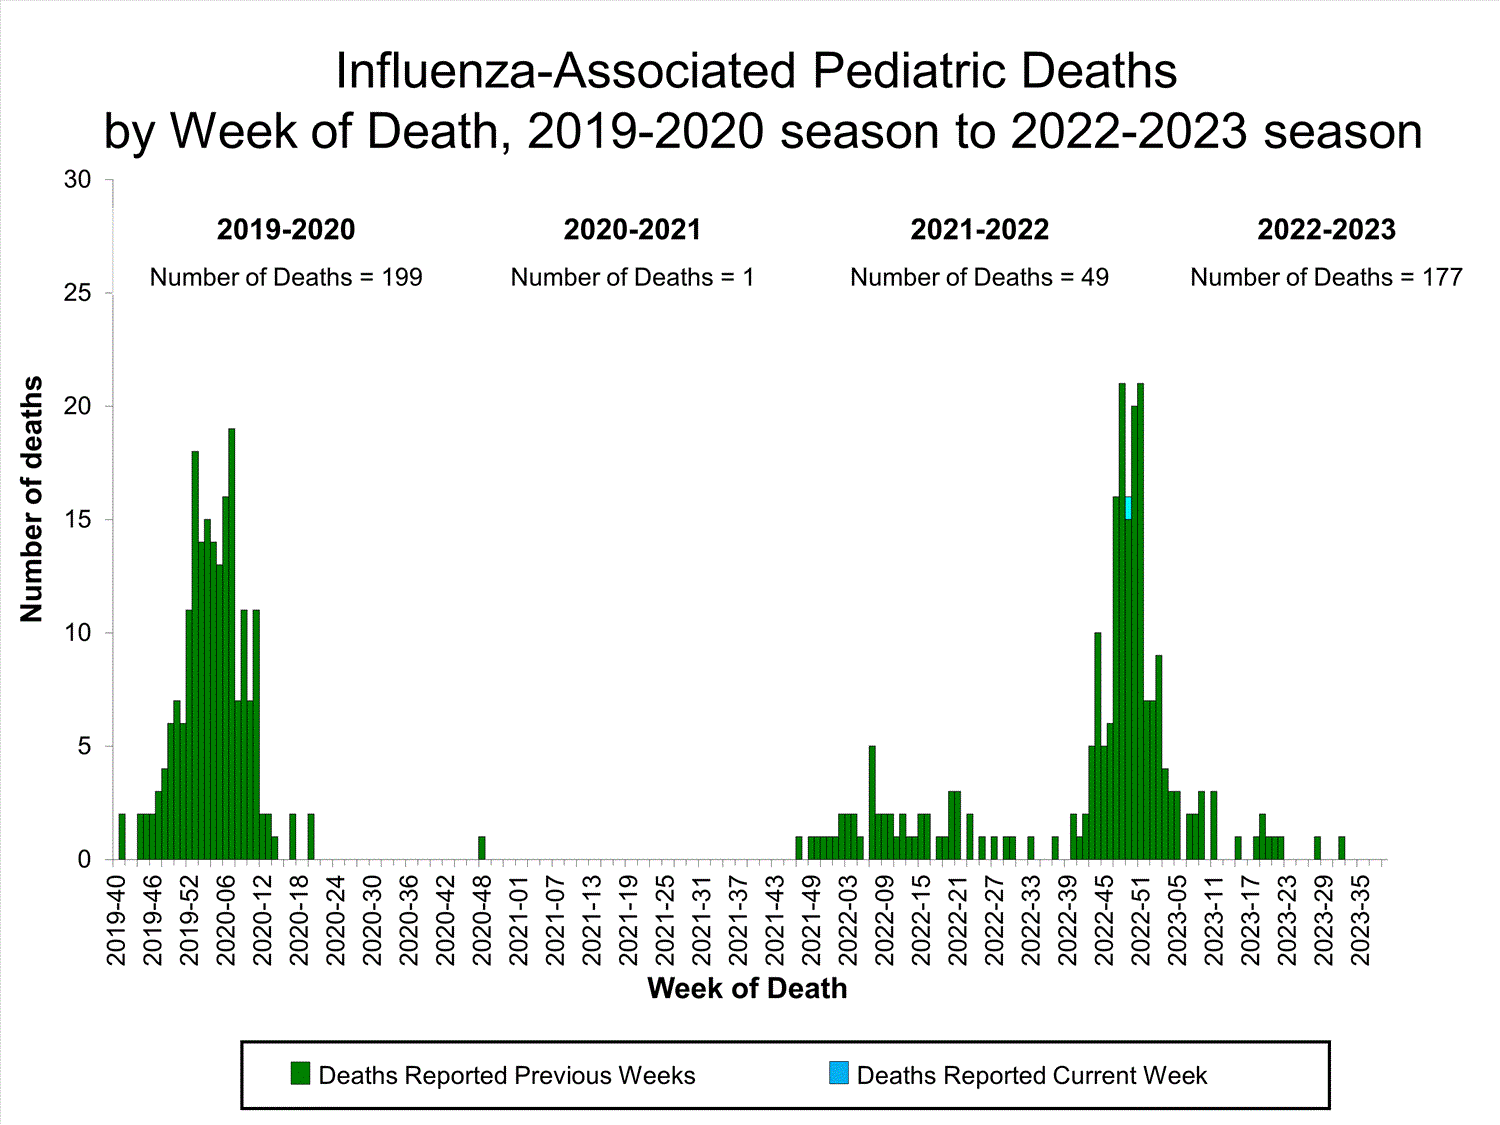
No influenza-associated pediatric deaths were reported to CDC during week 38.

A total of 176 influenza-associated pediatric deaths occurring during the 2022-2023 season have been reported to CDC.

Click on image to launch interactive tool View Full Screen
Additional pediatric mortality surveillance information for current and past seasons:
Surveillance Methods | FluView Interactive

Additional National and International Influenza Surveillance Information


FluView Interactive: FluView includes enhanced web-based interactive applications that can provide dynamic visuals of the influenza data collected and analyzed by CDC. These FluView Interactive applications allow people to create customized, visual interpretations of influenza data, as well as make comparisons across flu seasons, regions, age groups and a variety of other demographics.

National Institute for Occupational Safety and Health: Monthly surveillance data on the prevalence of health-related workplace absenteeism among full-time workers in the United States are available from NIOSH.

U.S. State and local influenza surveillance: Select a jurisdiction below to access the latest local influenza information.

https://www.cdc.gov/flu/weekly/index.htm
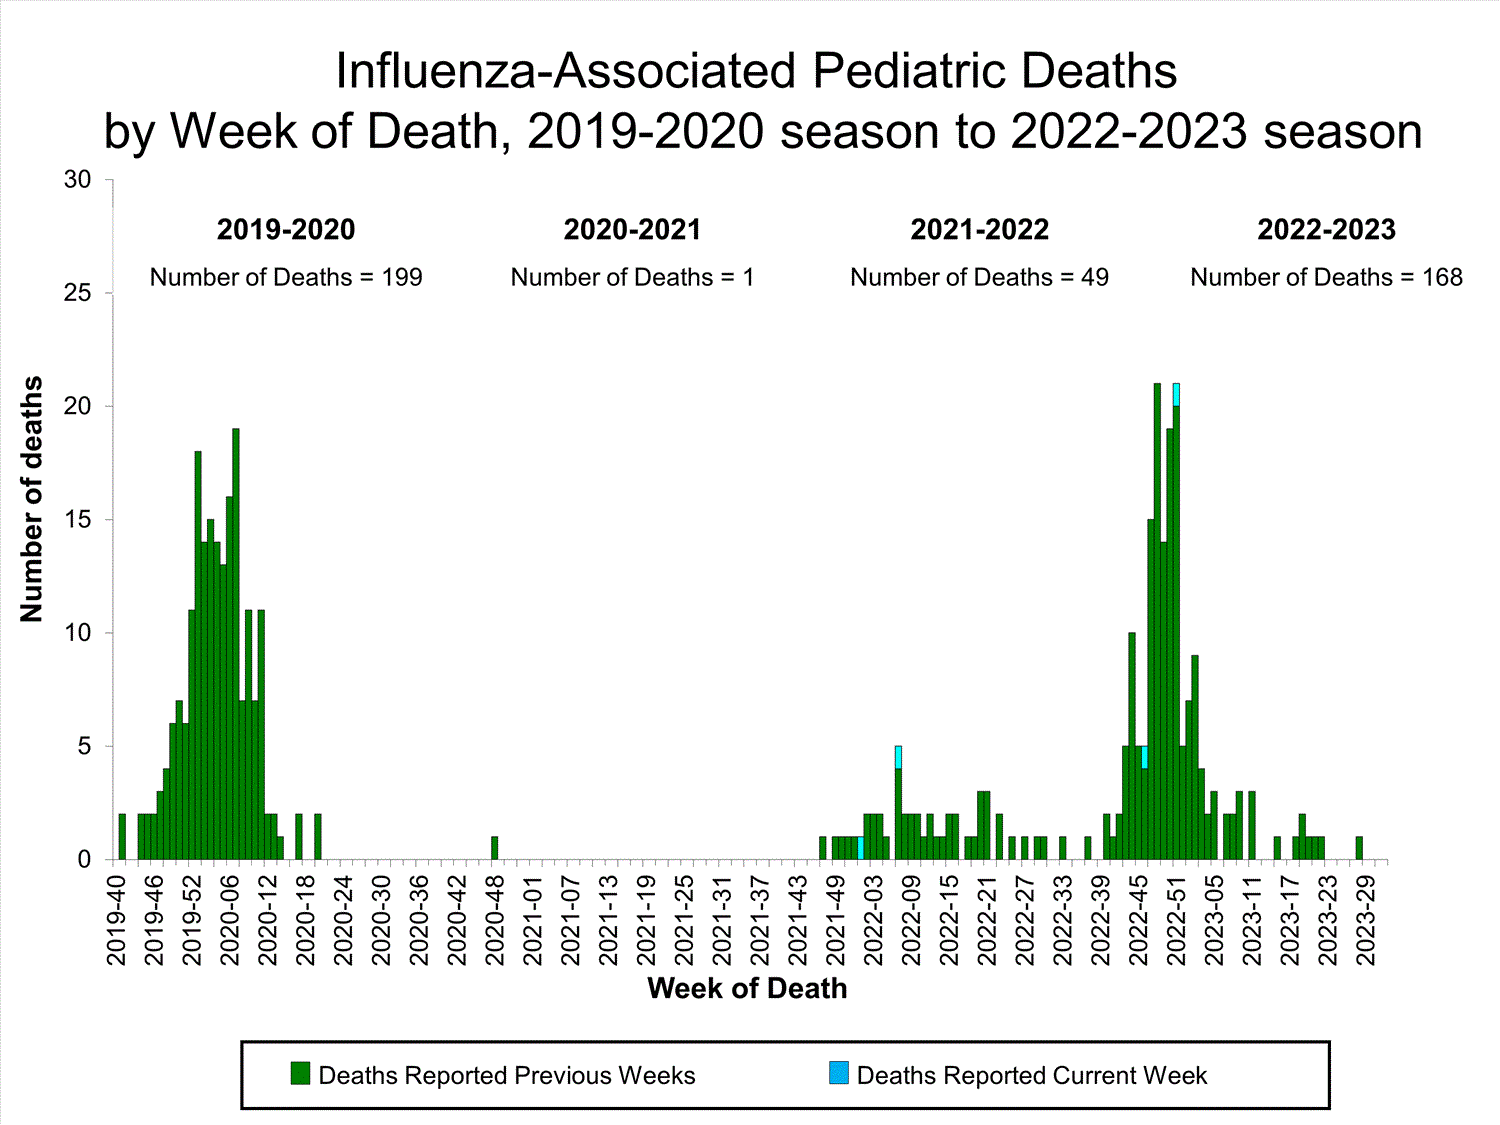
 
Weekly U.S. Influenza Surveillance Report


Print
Updated October 6, 2023
fluview-banner2.jpg


2022-2023 Influenza Season

Week 39 ending September 30, 2023

All data in this report are preliminary and may change as more reports are received.

A description of the CDC influenza surveillance system, including methodology and detailed descriptions of each data component, is available on the surveillance methods page.

Additional information on the current and previous influenza seasons for each surveillance component is available on FluView Interactive. U.S. Virologic Surveillance

Clinical Laboratories


The results of tests performed by clinical laboratories nationwide are summarized below. Data from clinical laboratories (the percentage of specimens tested that are positive for influenza) are used to monitor whether influenza activity is increasing or decreasing.
No. of specimens tested46,4124,205,970
No. of positive specimens (%)444 (1.0%)360,500 (8.6%)
Positive specimens by type
Influenza A284 (64.0%)350,169 (97.1%)
Influenza B160 (36.0%)10,331 (2.9%)
INFLUENZA Virus Isolated

View Chart Data | View Full Screen Public Health Laboratories


The results of tests performed by public health laboratories nationwide are summarized below. Data from public health laboratories are used to monitor the proportion of circulating viruses that belong to each influenza virus type/subtype/lineage. Viruses known to be associated with recent live attenuated influenza vaccine (LAIV) receipt or found upon further testing to be a vaccine virus are not included as they are not circulating influenza viruses.
No. of specimens tested2,404292,869
No. of positive specimens9531,398
Positive specimens by type/subtype
Influenza A80 (84.2%)29,876 (95.2%)
(H1N1)pdm0959 (95.2%)7,723 (30.3%)
H3N23 (4.8%)17,722 (69.6%)
H3N2v02 (<0.1%)
Subtyping not performed184,428
Influenza B15 (15.8%)1,522 (4.8%)
Yamagata lineage0 (0%)0 (0%)
Victoria lineage13 (100%)1,246 (100%)
Lineage not performed2276


INFLUENZA Virus Isolated
View Chart Data | View Full Screen
Additional virologic surveillance information for current and past seasons:
Surveillance Methods | FluView Interactive: National, Regional, and State Data or Age Data Outpatient Respiratory Illness Surveillance


The U.S. Outpatient Influenza-like Illness Surveillance Network (ILINet) monitors outpatient visits for respiratory illness referred to as influenza-like illness [ILI (fever plus cough or sore throat)], not laboratory-confirmed influenza, and may capture respiratory illness visits due to infection with any pathogen that can present with similar symptoms, including influenza, SARS-CoV-2, and RSV. Therefore, it is important to evaluate syndromic surveillance data, including that from ILINet, in the context of other sources of surveillance data to obtain a complete and accurate picture of influenza, SARS-CoV-2, and other respiratory virus activity. Other respiratory virus surveillance data can be found on CDC’s COVID Data Tracker, NCIRD Surveillance Systems website and National Respiratory and Enteric Virus Surveillance System (NREVSS) website. Outpatient Respiratory Illness Visits


Nationwide during week 39, 2.1% of patient visits reported through ILINet were due to respiratory illness that included fever plus a cough or sore throat, also referred to as ILI. Multiple respiratory viruses are co-circulating, and the relative contribution of influenza virus infection to ILI varies by location.

national levels of ILI and ARI

* Effective October 3, 2021 (week 40), the ILI definition (fever plus cough or sore throat) no longer includes “without a known cause other than influenza.”

View Chart Data (current season only) | View Full Screen Outpatient Respiratory Illness Visits by Age Group


More than 70% of ILINet participants provide both the number of patient visits for respiratory illness and the total number of patient visits for the week broken out by age group. Data from this subset of providers are used to calculate the percentages of patient visits for respiratory illness by age group.

During week 39, the percentage of visits for respiratory illness reported in ILINet was 7.1% among those 0-4 years, 3.3% among those 5-24 years, 1.6% among those 25-49 years, 1.2% among those 50-64 years, and 0.8% among those 65 years and older.

national levels of ILI and ARI by age group

View Chart Data | View Full Screen Outpatient Respiratory Illness Activity Map


Data collected in ILINet are used to produce a measure of ILI activity* by state/jurisdiction and Core Based Statistical Areas (CBSA).
Week 39
(Week ending
Sept. 30, 2023)
Week 38
(Week ending
Sept. 23, 2023)
Week 39
(Week ending
Sept. 30, 2023)
Week 38
(Week ending
Sept. 23, 2023)
Very High0021
High331411
Moderate202527
Low697886
Minimal4443550551
Insufficient Data00260253


*Data collected in ILINet may disproportionally represent certain populations within a jurisdiction or CBSA, and therefore, may not accurately depict the full picture of influenza activity for the entire jurisdiction or CBSA. Differences in the data presented here by CDC and independently by some health departments likely represent differing levels of data completeness with data presented by the health department likely being the more complete.
Additional information about medically attended visits for ILI for current and past seasons:
Surveillance Methods | FluView Interactive: National, Regional, and State Data or ILI Activity Map Hospitalization Surveillance

FluSurv-NET


The Influenza Hospitalization Surveillance Network (FluSurv-NET) conducts population-based surveillance for laboratory-confirmed influenza-related hospitalizations in select counties in 13 states and represents approximately 9% of the U.S. population. FluSurv-NET hospitalization data are preliminary. Patients admitted for laboratory-confirmed influenza-related hospitalization after April 30, 2023, will not be included in FluSurv-NET for the 2022-2023 season. Data on patients admitted through April 30, 2023, will continue to be updated on FluView Interactive as additional information is received.
Additional FluSurv-NET hospitalization surveillance information for current and past seasons and additional age groups:
Surveillance Methods |FluView Interactive: Rates by Age, Sex, and Race/Ethnicity or Data on Patient Characteristics | RESP-NET Interactive National Healthcare Safety Network (NHSN) Hospitalization Surveillance


Hospitals report to NHSN the number of patients admitted with laboratory-confirmed influenza. During week 39, 1,040 patients with laboratory-confirmed influenza were admitted to a hospital.

national levels of influenza hospitalizations
View Chart Data | View Full Screen
Additional NHSN Hospitalization Surveillance information:
Surveillance Methods | Additional Data Mortality Surveillance

National Center for Health Statistics (NCHS) Mortality Surveillance


Based on NCHS mortality surveillance data available on October 5, 2023, 7.3% of the deaths that occurred during the week ending September 30, 2023 (week 39), were due to pneumonia, influenza, and/or COVID-19 (PIC). This percentage is above the epidemic threshold of 5.7% for this week. Among the 1,683 PIC deaths reported for this week, 615 had COVID-19 listed as an underlying or contributing cause of death on the death certificate, and 11 listed influenza. The data presented are preliminary and may change as more data are received and processed.

Click on image to launch interactive toolView Chart Data | View Full Screen
Additional pneumonia, influenza and COVID-19 mortality surveillance information for current and past seasons:
Surveillance Methods | FluView Interactive Influenza-Associated Pediatric Mortality


One influenza-associated pediatric death occurring during the 2022-2023 season was reported to CDC during week 39. The death was associated with an influenza A(H3) virus and occurred during week 49 (the week ending December 10, 2022).

A total of 177 influenza-associated pediatric deaths occurring during the 2022-2023 season have been reported to CDC.

Click on image to launch interactive tool View Full Screen
Additional pediatric mortality surveillance information for current and past seasons:
Surveillance Methods | FluView Interactive

Additional National and International Influenza Surveillance Information


FluView Interactive: FluView includes enhanced web-based interactive applications that can provide dynamic visuals of the influenza data collected and analyzed by CDC. These FluView Interactive applications allow people to create customized, visual interpretations of influenza data, as well as make comparisons across flu seasons, regions, age groups and a variety of other demographics.

National Institute for Occupational Safety and Health: Monthly surveillance data on the prevalence of health-related workplace absenteeism among full-time workers in the United States are available from NIOSH.

U.S. State and local influenza surveillance: Select a jurisdiction below to access the latest local influenza information.

https://www.cdc.gov/flu/weekly/index.htm
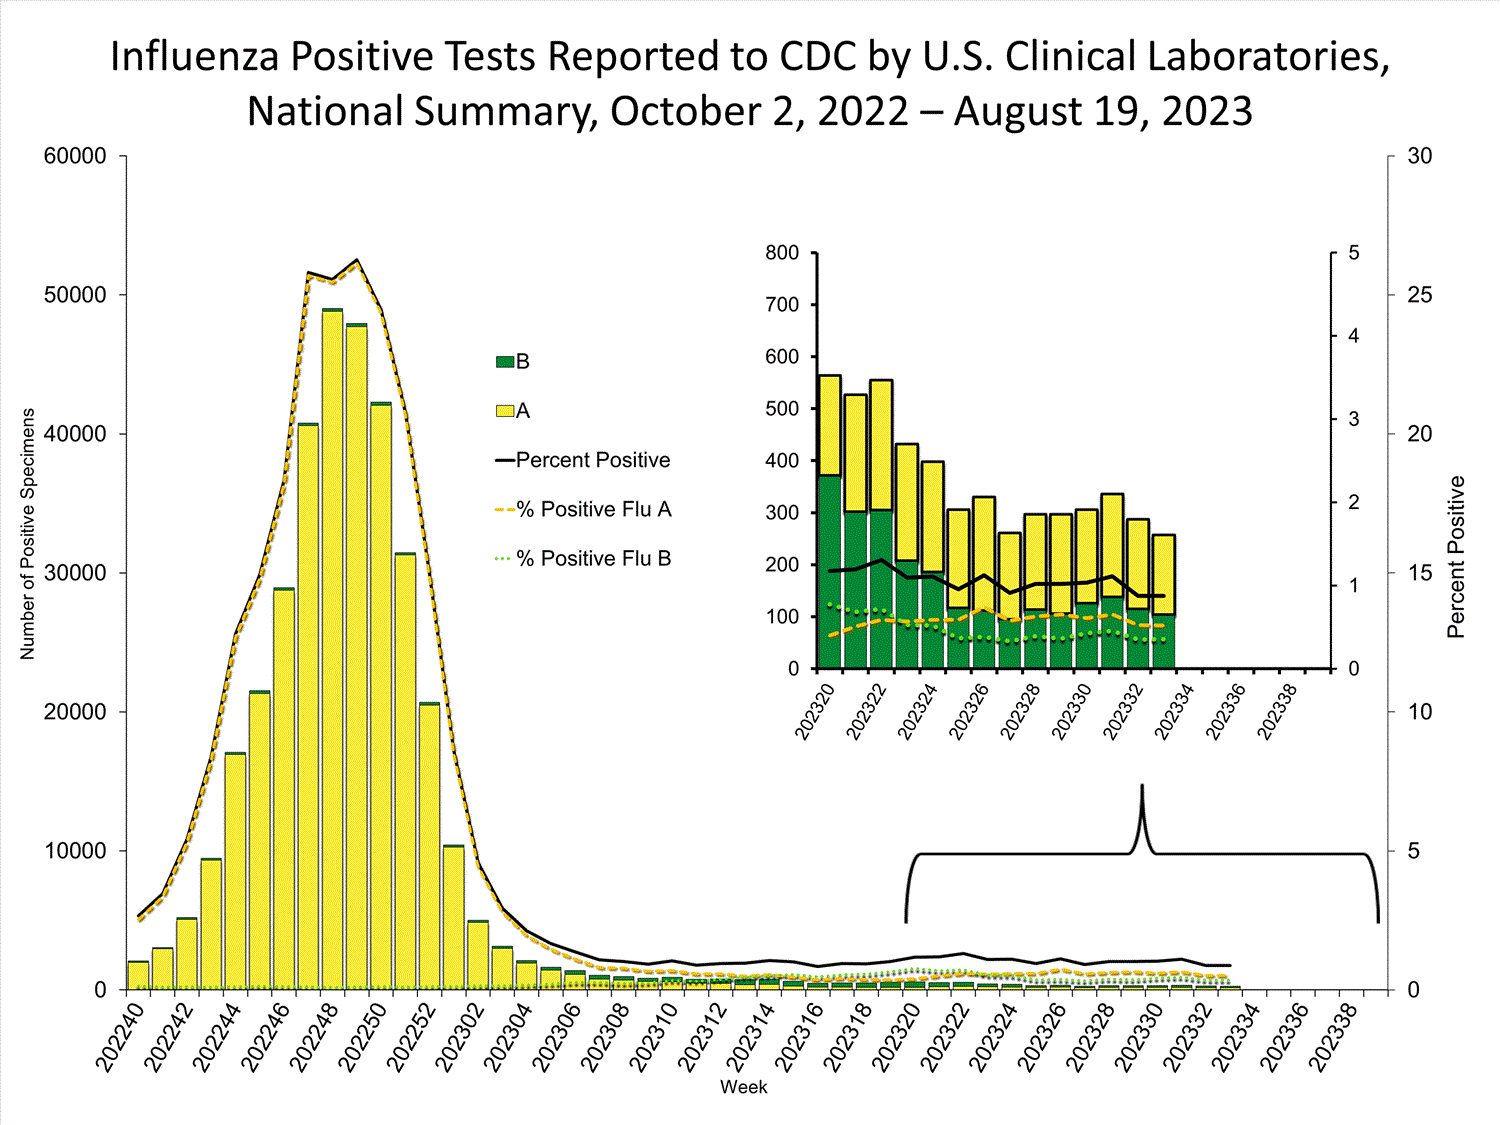
 
Back
Top