• FluTrackers.com Inc. does not provide medical advice. Information on this web site is collected from various internet resources, and the FluTrackers board of directors makes no warranty to the safety, efficacy, correctness or completeness of the information posted on this site by any author or poster. The information collated here is for instructional and/or discussion purposes only and is NOT intended to diagnose or treat any disease, illness, or other medical condition. Every individual reader or poster should seek advice from their personal physician/healthcare practitioner before considering or using any interventions that are discussed on this website. By continuing to access this website you agree to consult your personal physican before using any interventions posted on this website, and you agree to hold harmless FluTrackers.com Inc., the board of directors, the members, and all authors and posters for any effects from use of any medication, supplement, vitamin or other substance, device, intervention, etc. mentioned in posts on this website, or other internet venues referenced in posts on this website.
  • We are not asking for any donations. Do not donate to any entity who says they are raising funds for us.

US FluView - Weekly Surveillance Flu report 2021/2022 season - for trend analysis

sharon sanders

Editor-in-Chief & President
Previous thread FluView thread here. Sorry for the spotty thread, but there was very little flu reported for 2020/2021 season.


Weekly U.S. Influenza Surveillance Report


fluview-banner2.jpg


Note: CDC is tracking the COVID-19 pandemic in a weekly publication called COVID Data Tracker Weekly Review.

2020-2021 Influenza Season for Week 39, ending October 2, 2021

All data are preliminary and may change as more reports are received.

A description of the CDC influenza surveillance system, including methodology and detailed descriptions of each data component is available on the surveillance methods page.

Additional information on the current and previous influenza seasons for each surveillance component are available on FluView Interactive.
U.S. Virologic Surveillance:

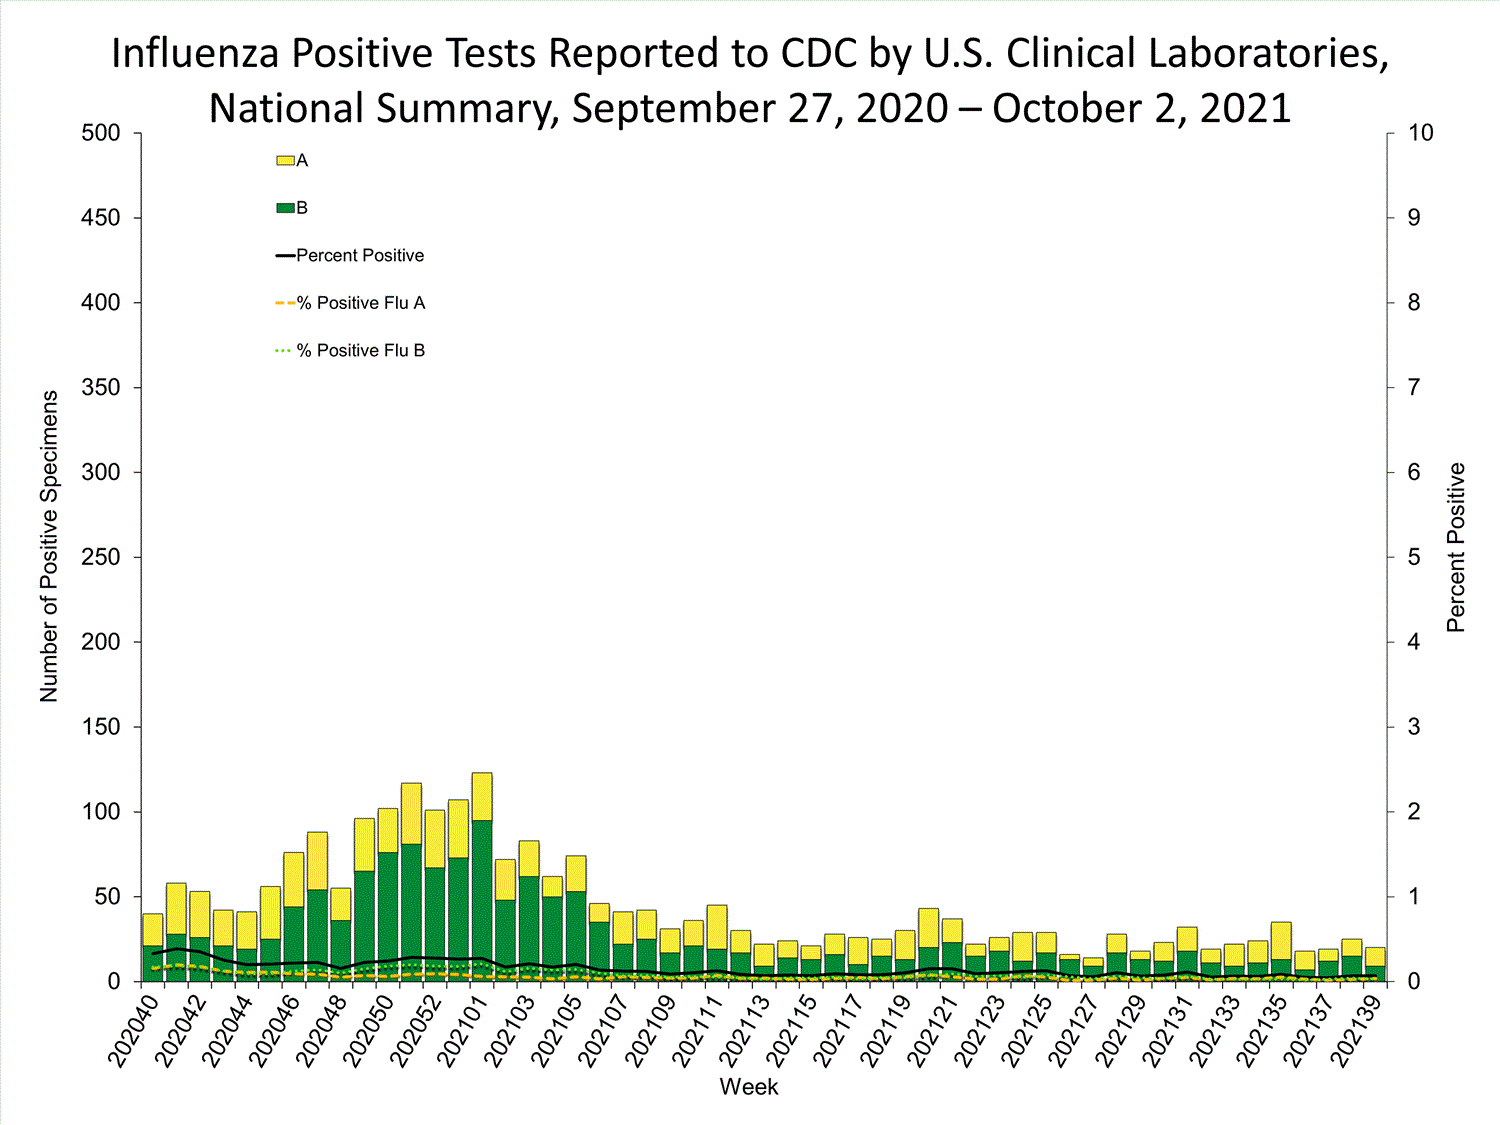
Clinical Laboratories


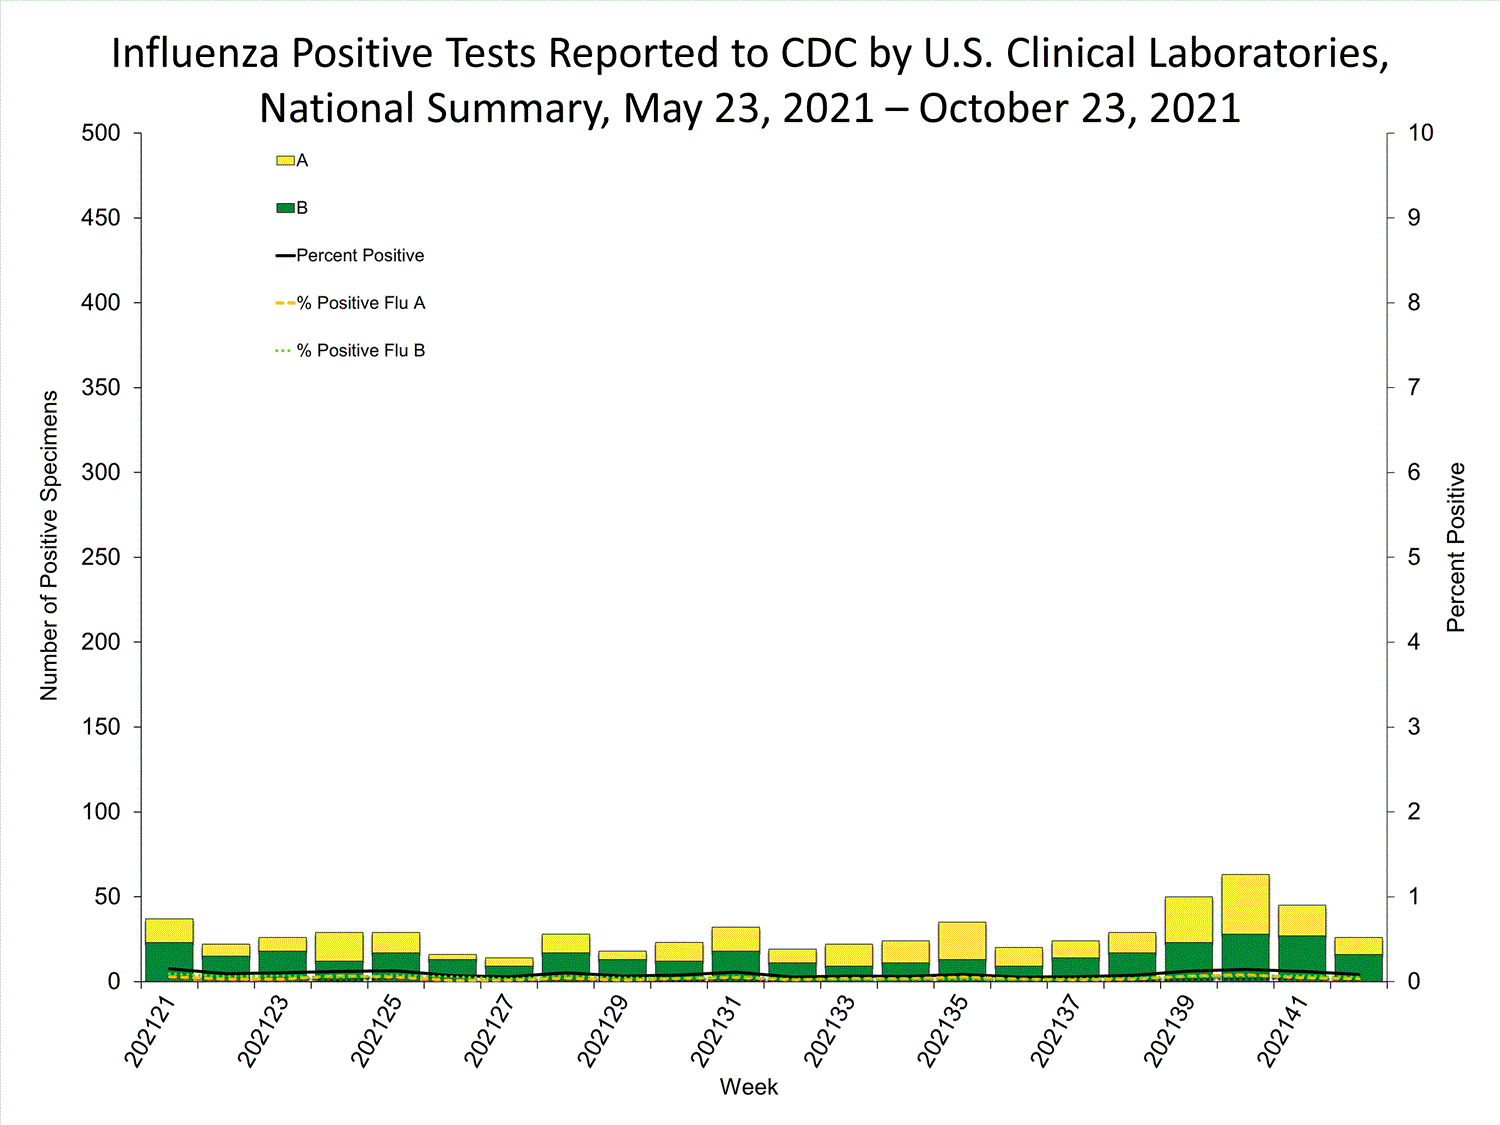
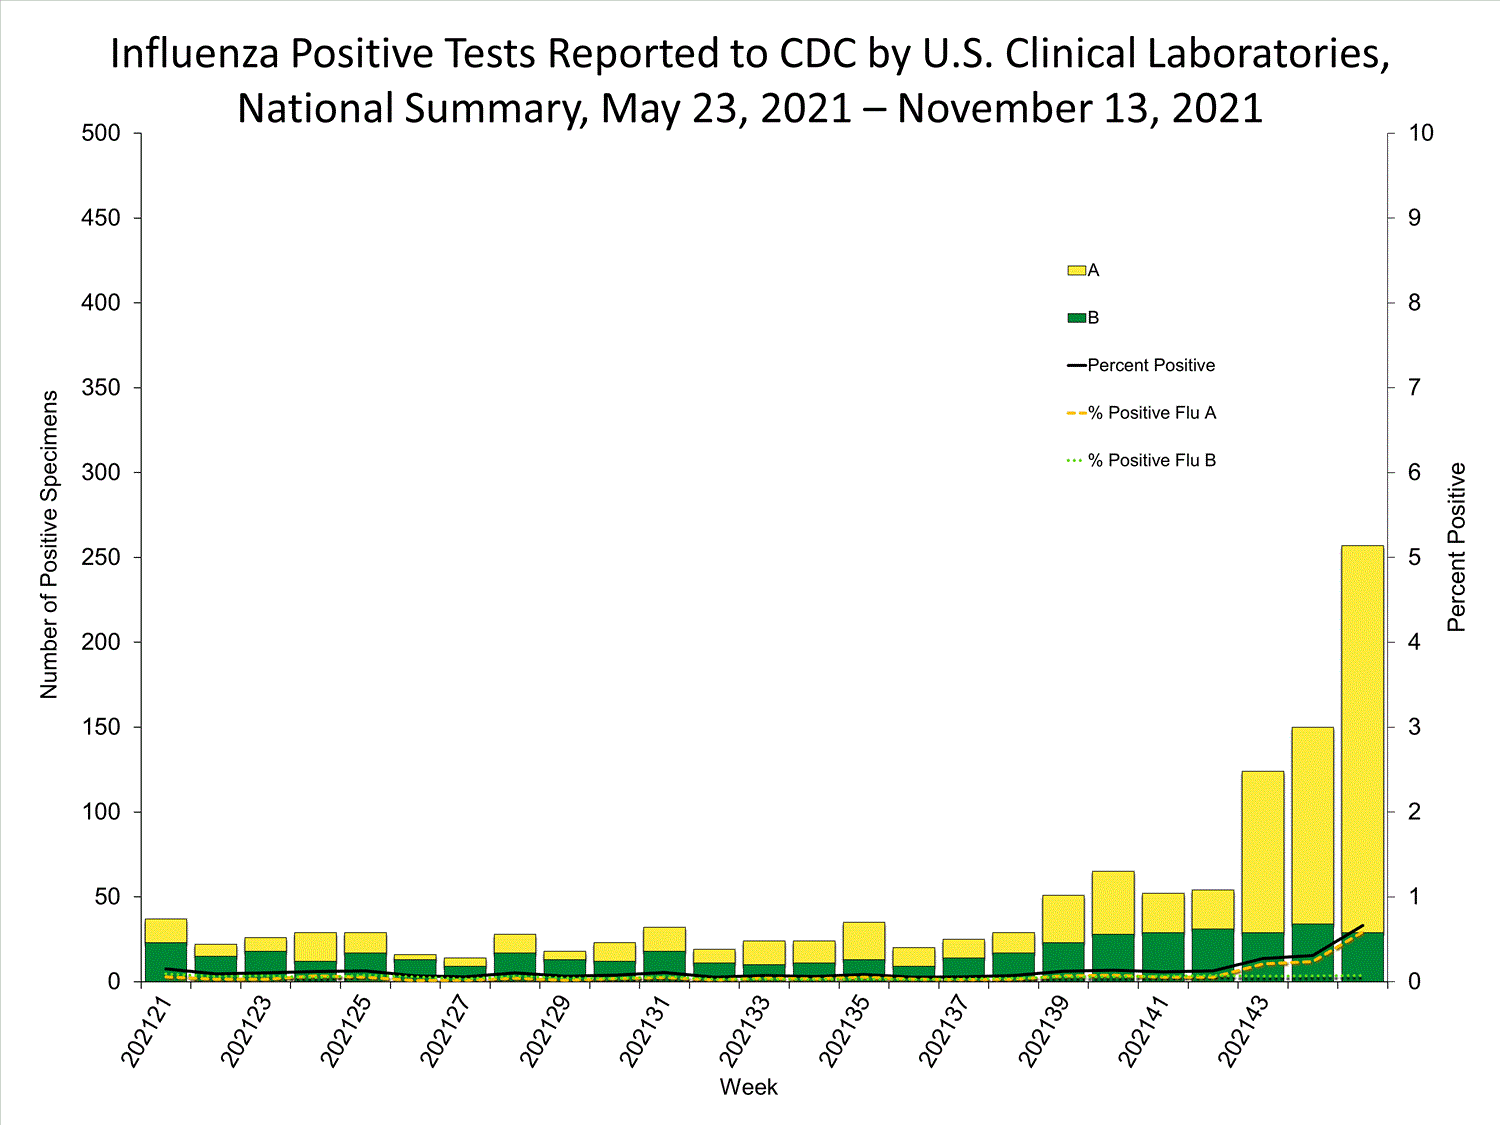
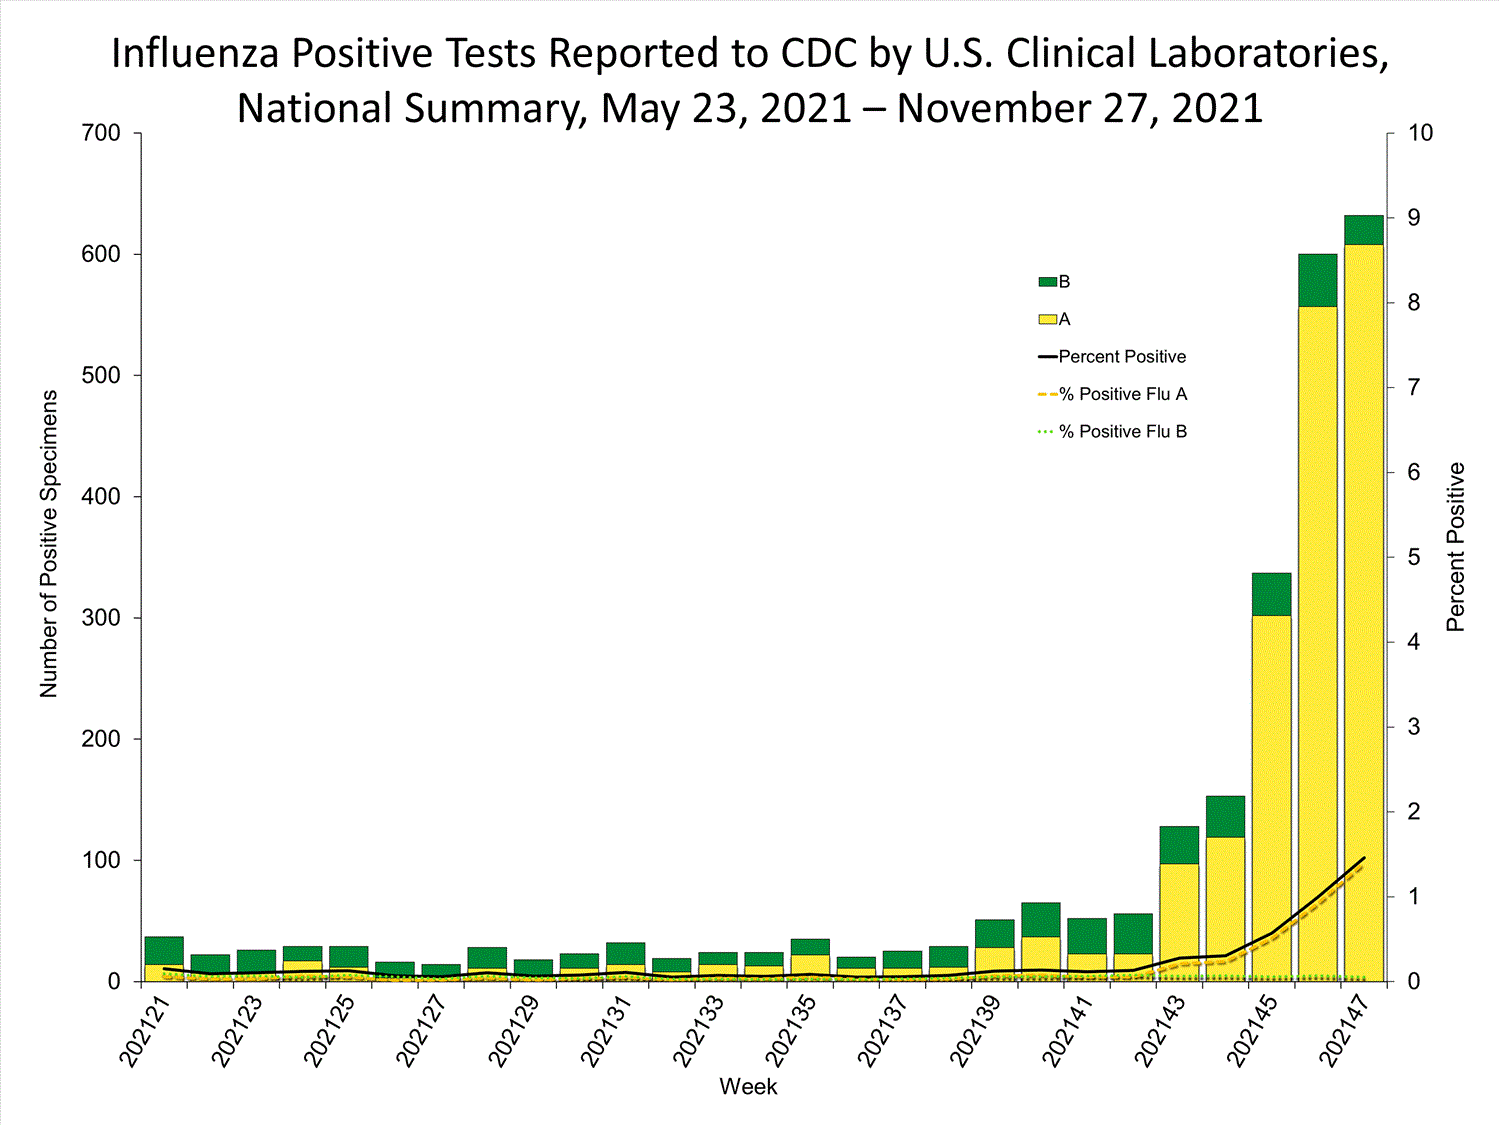
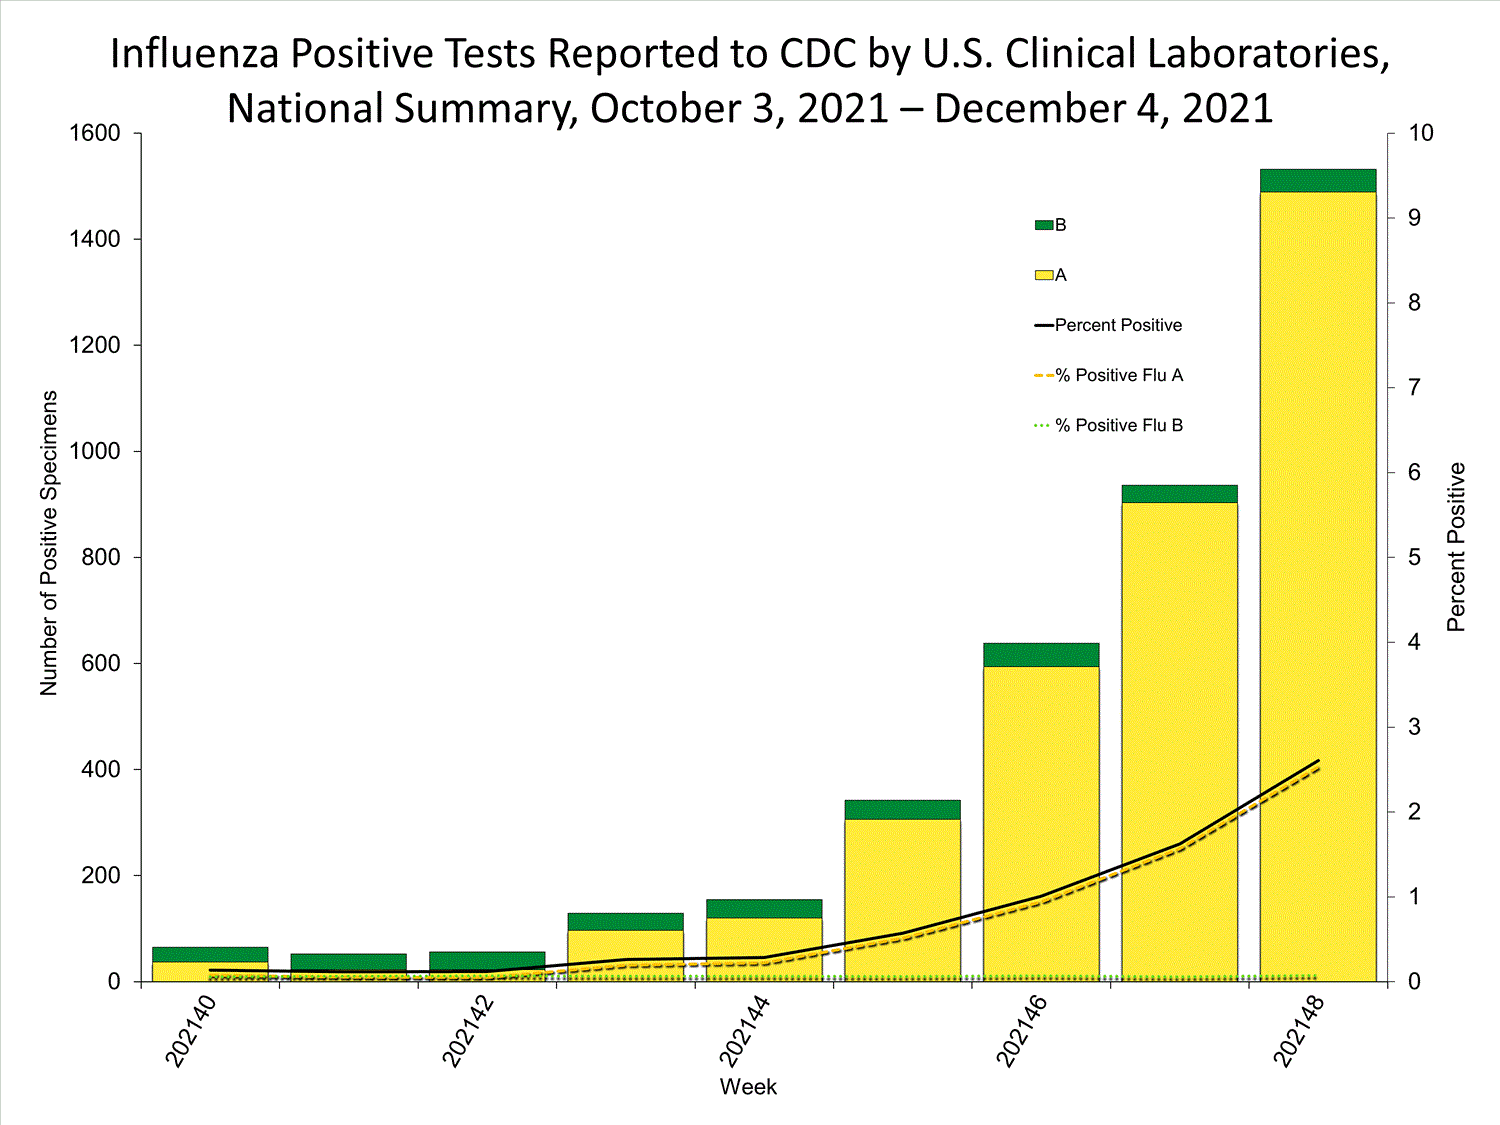
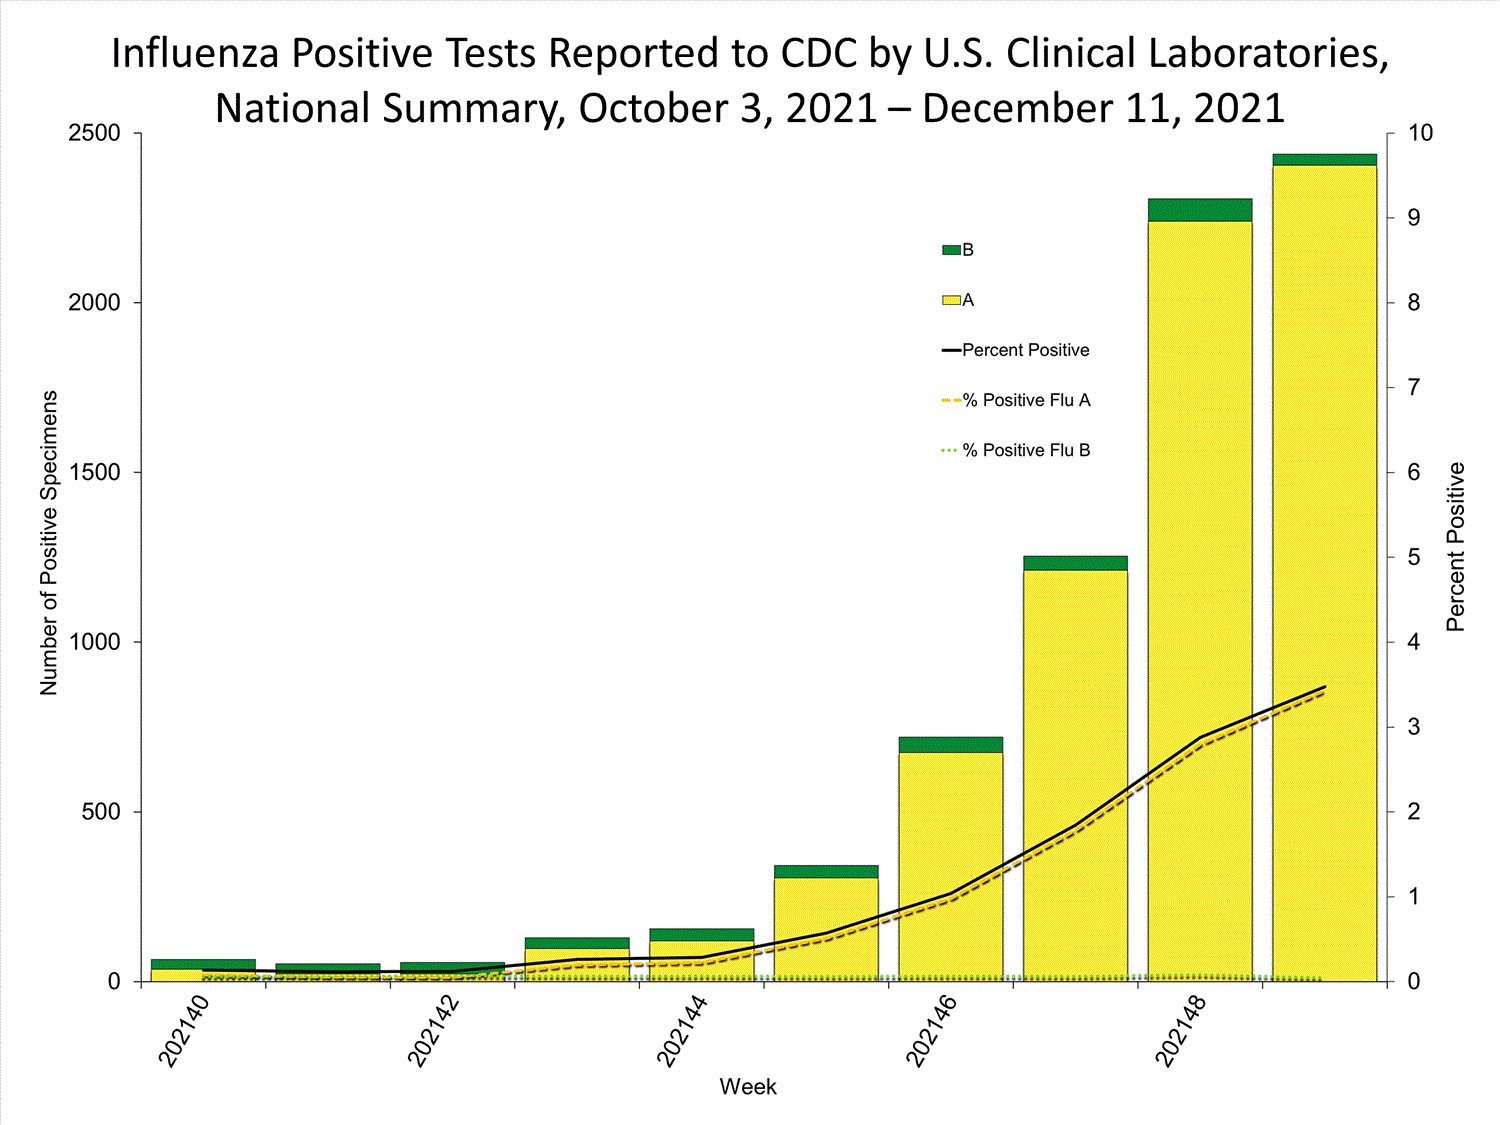
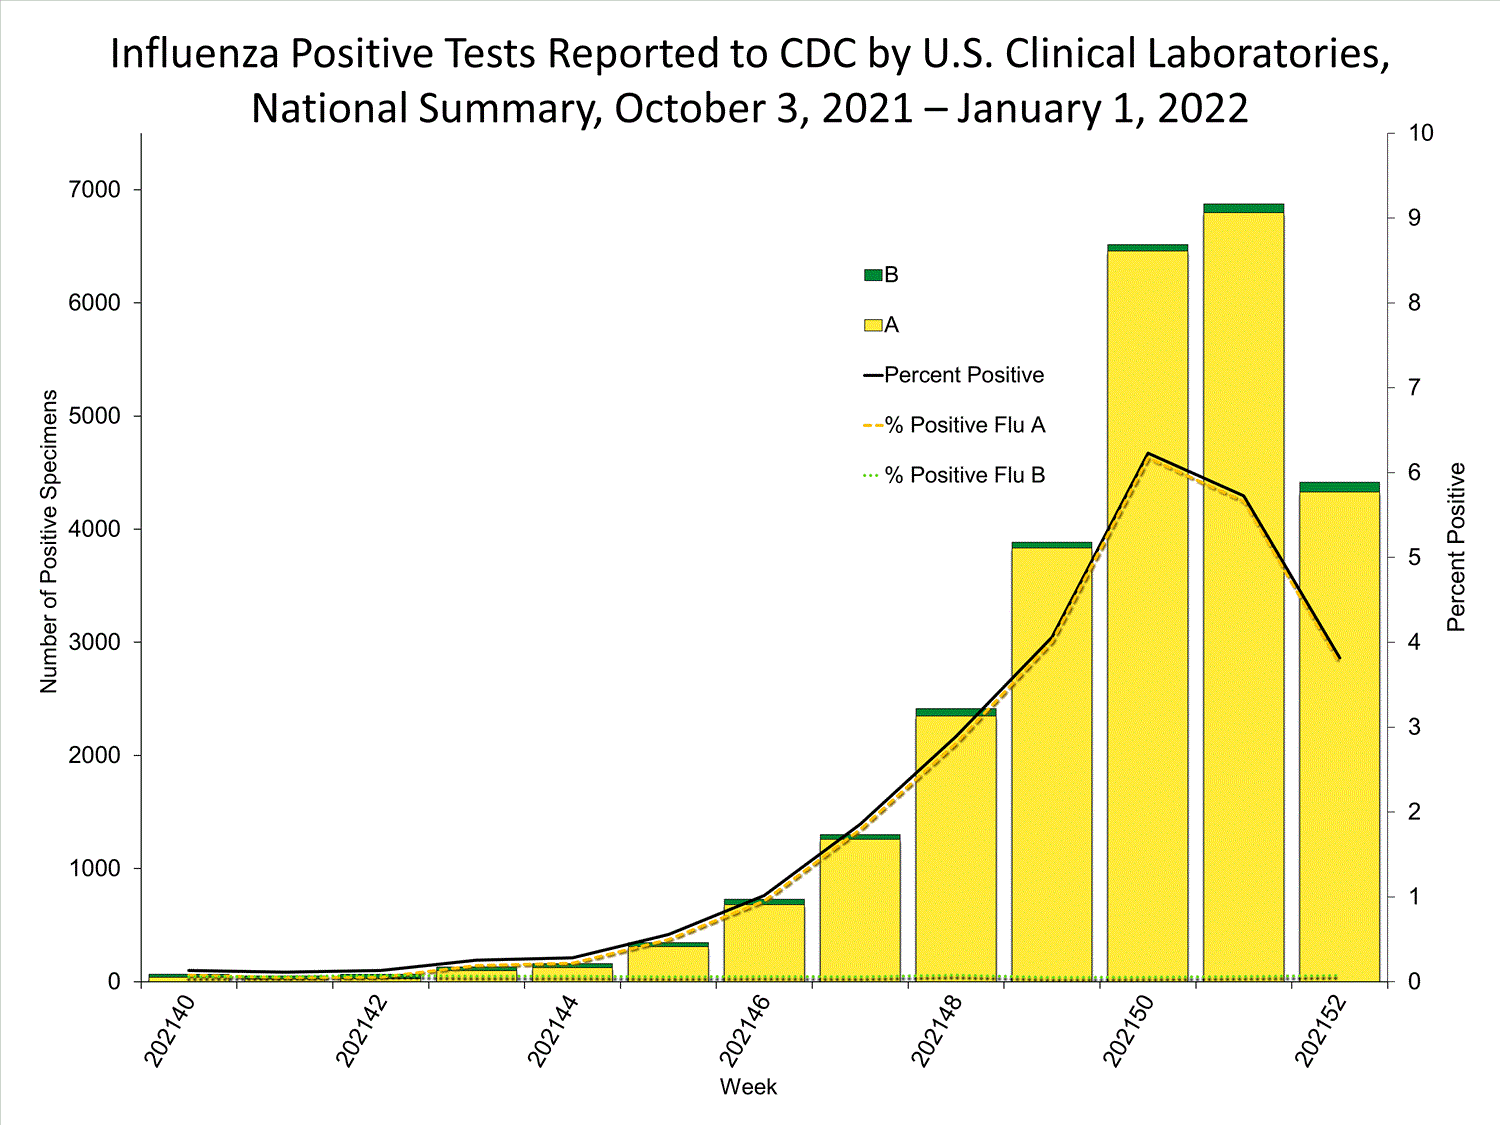
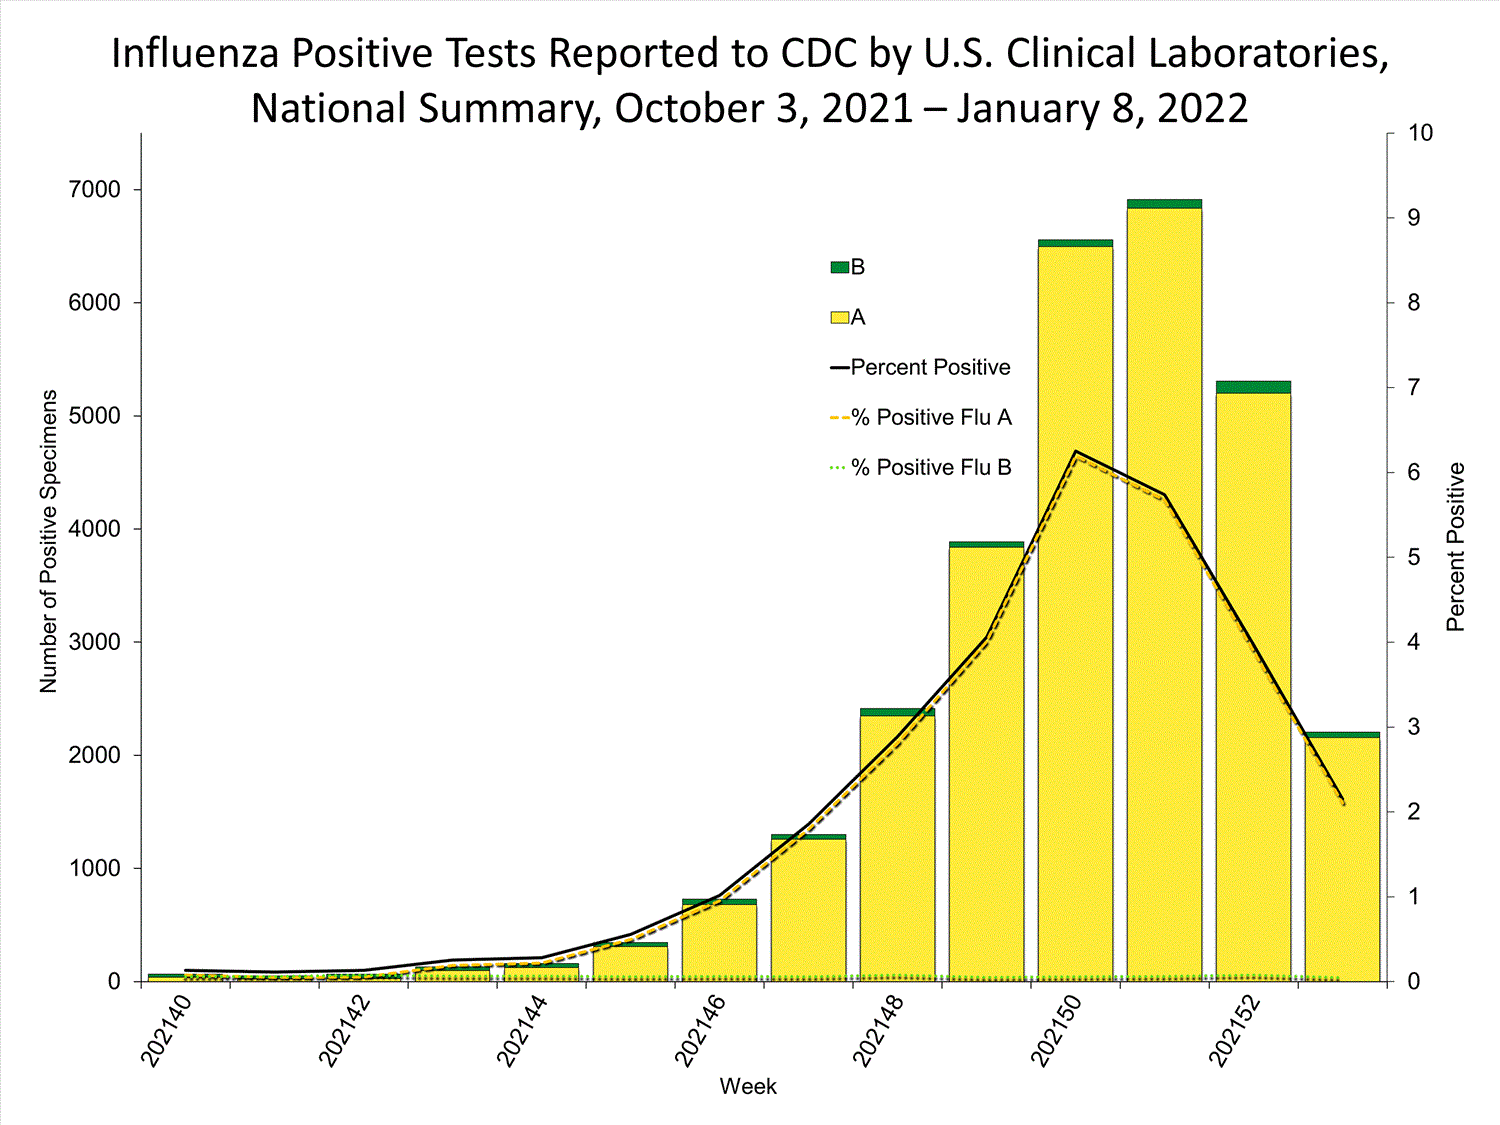
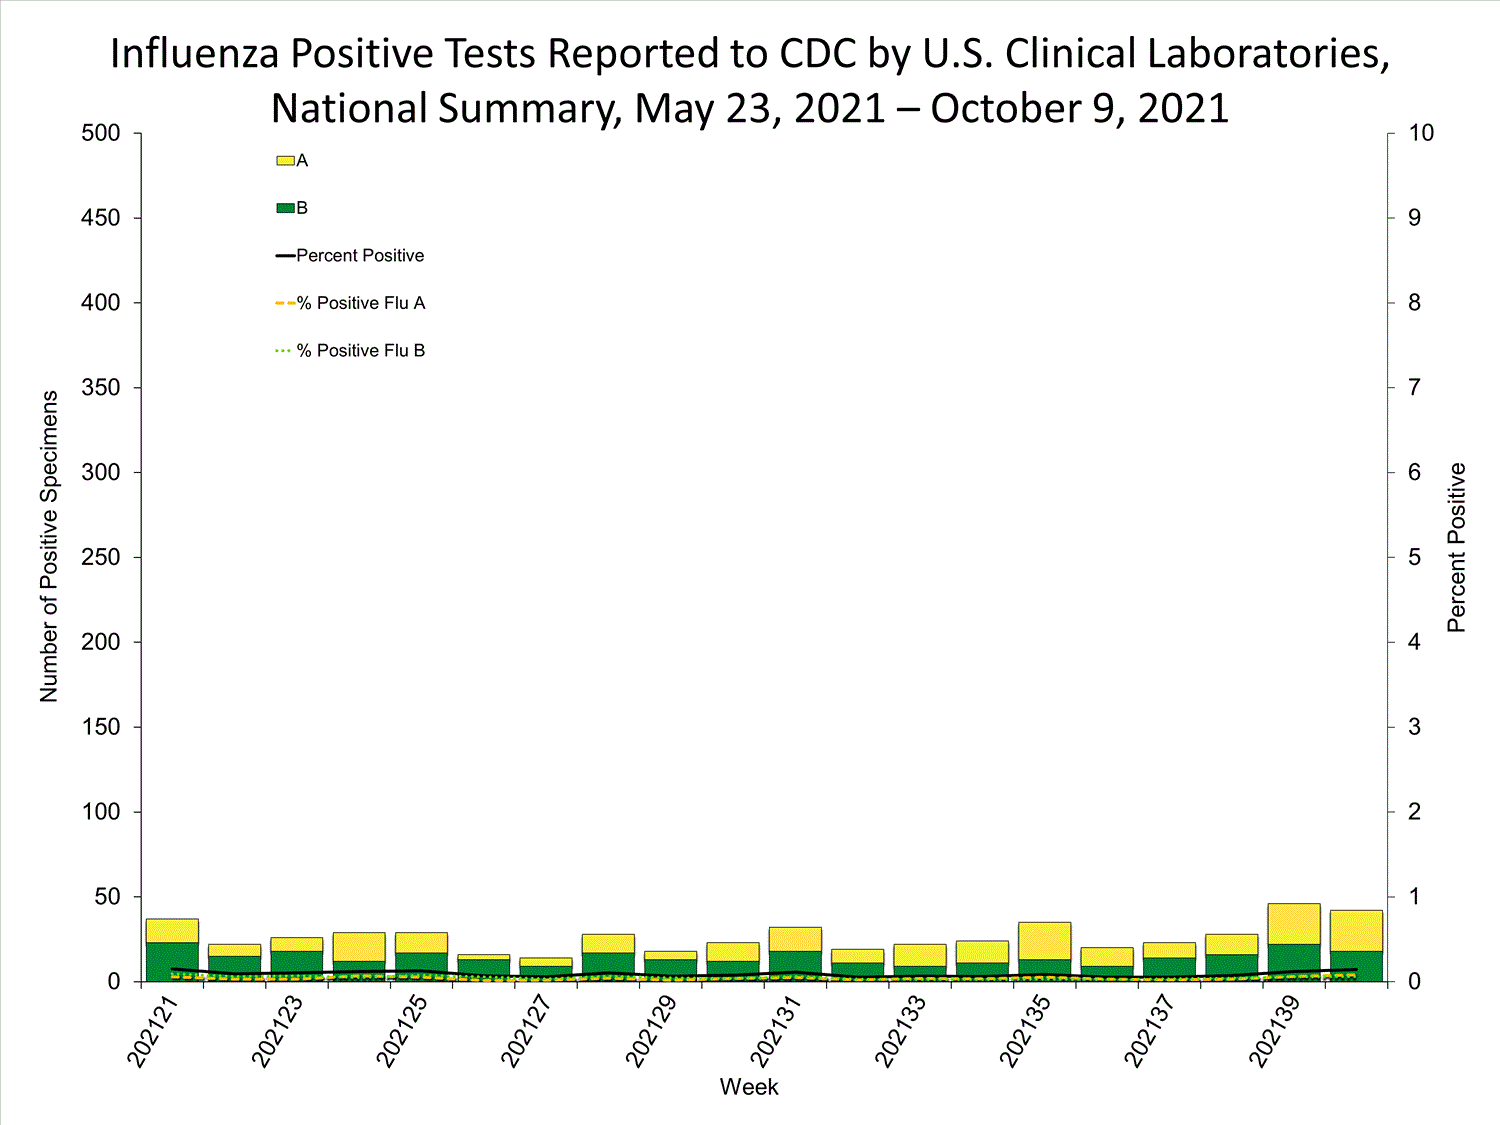
Data from clinical laboratories (the percentage of specimens tested that are positive for influenza) are used to monitor whether influenza activity is increasing or decreasing.


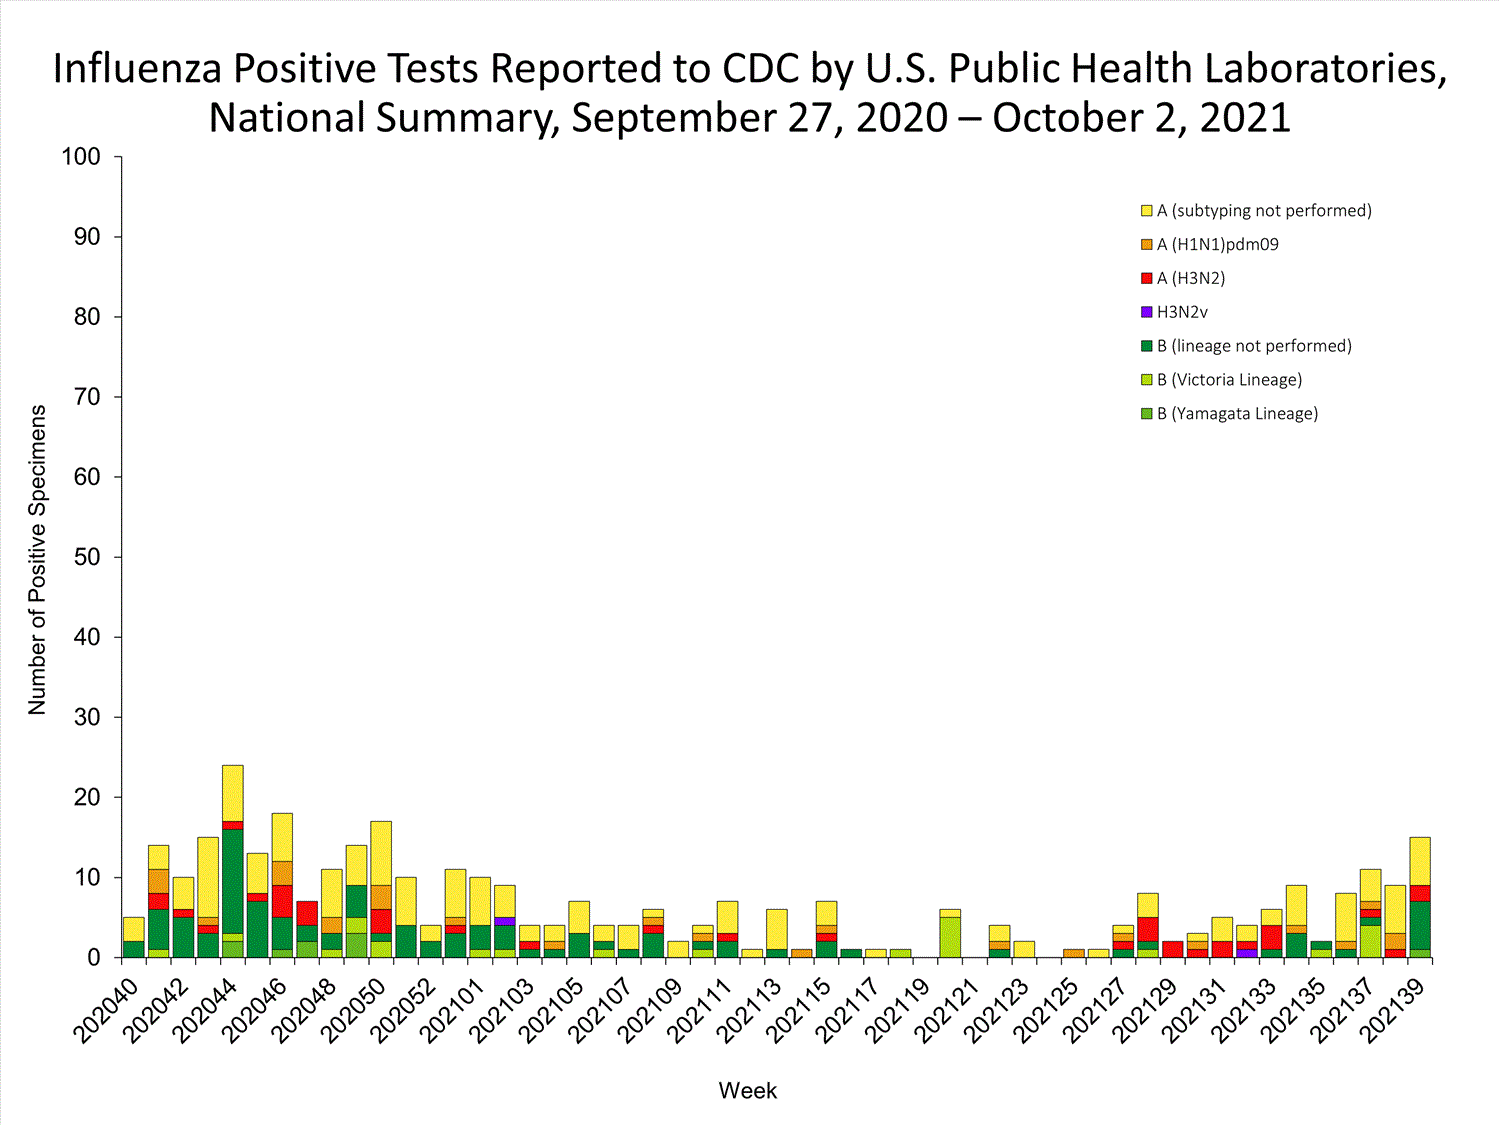
View Chart Data | View Full ScreenPublic Health Laboratories


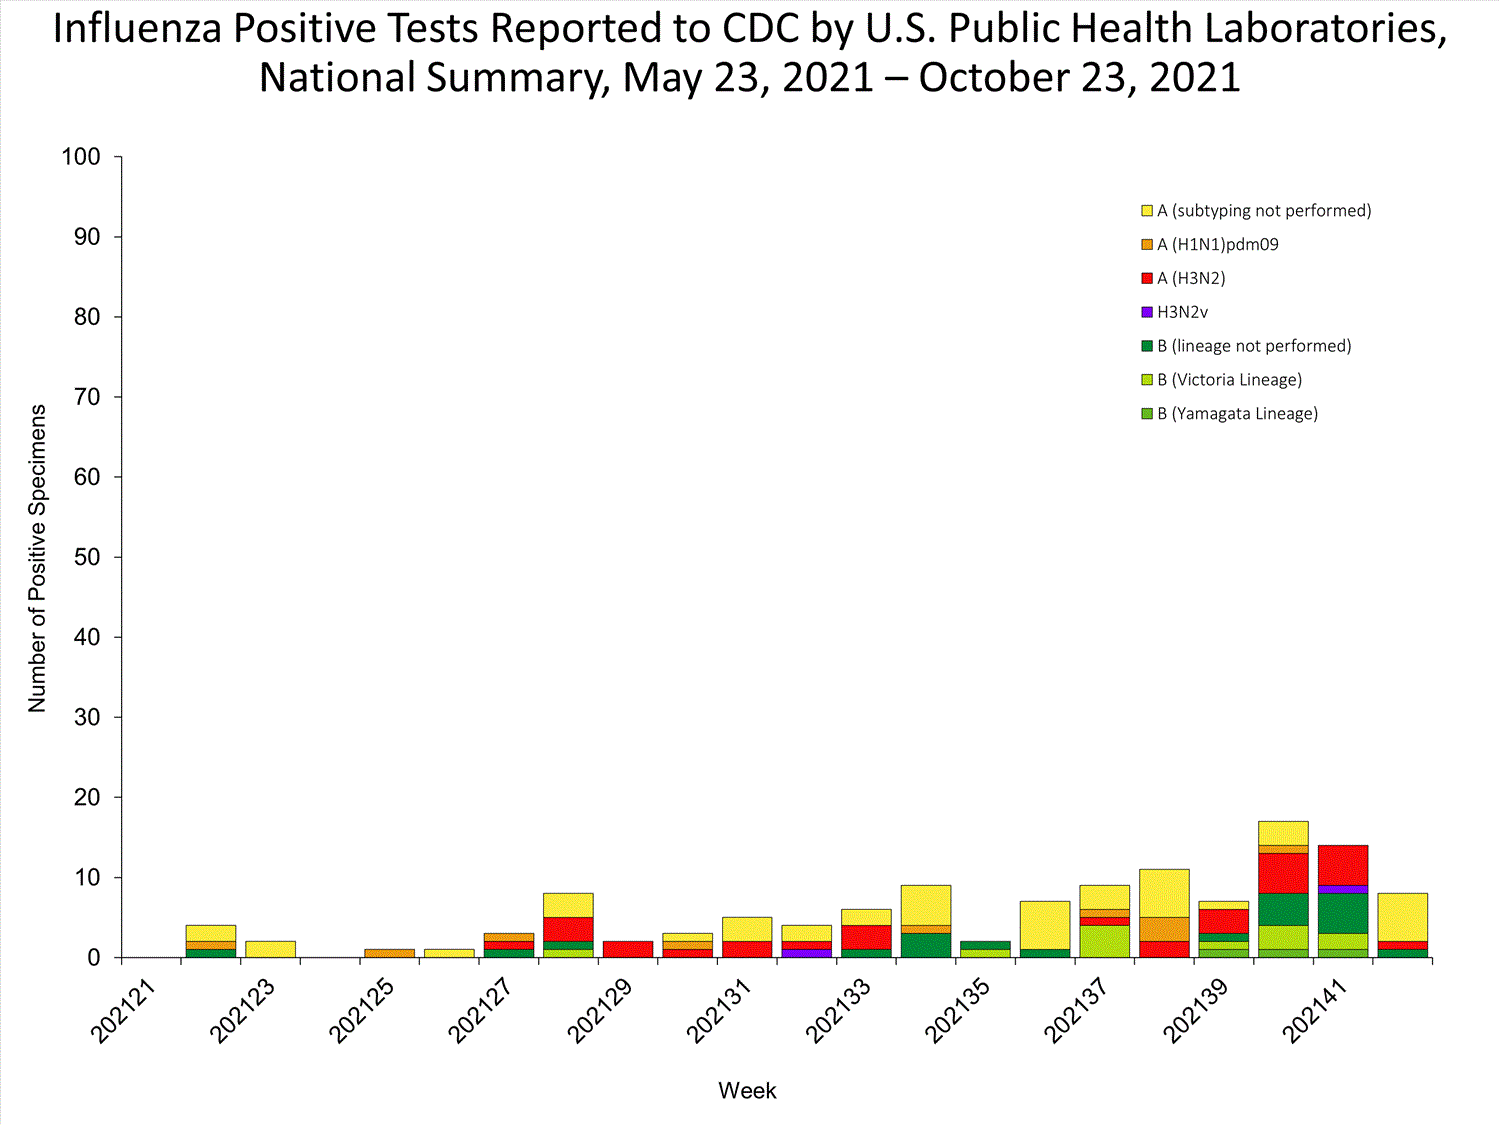
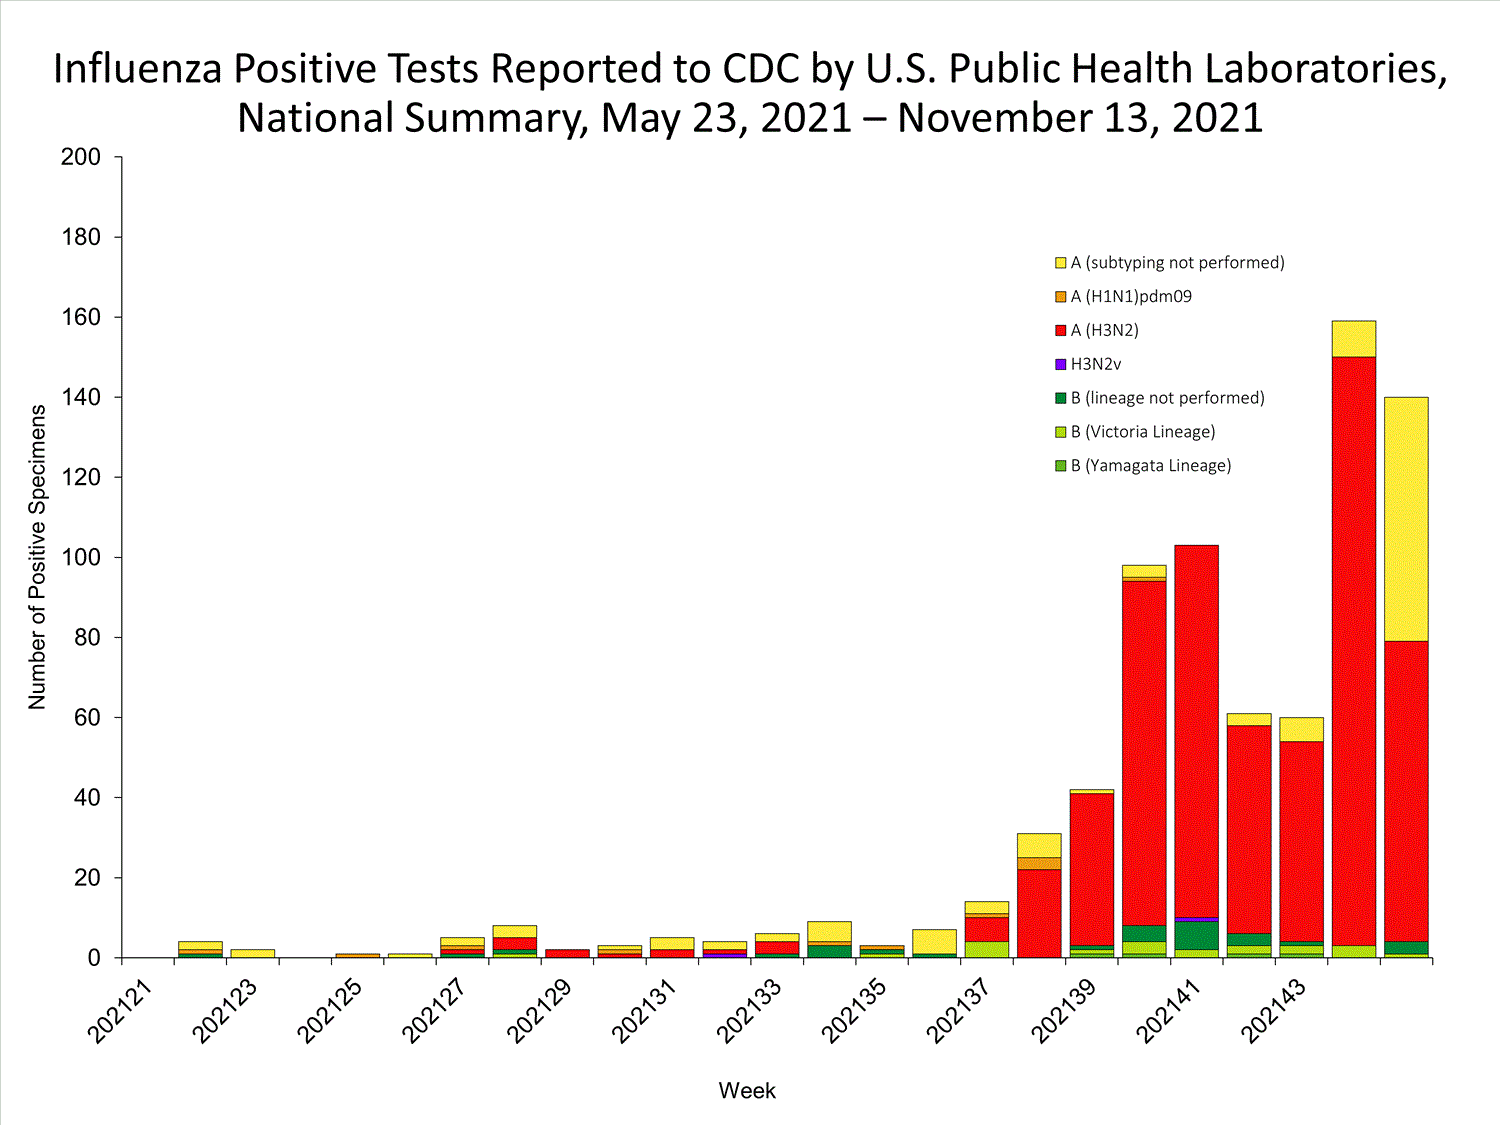
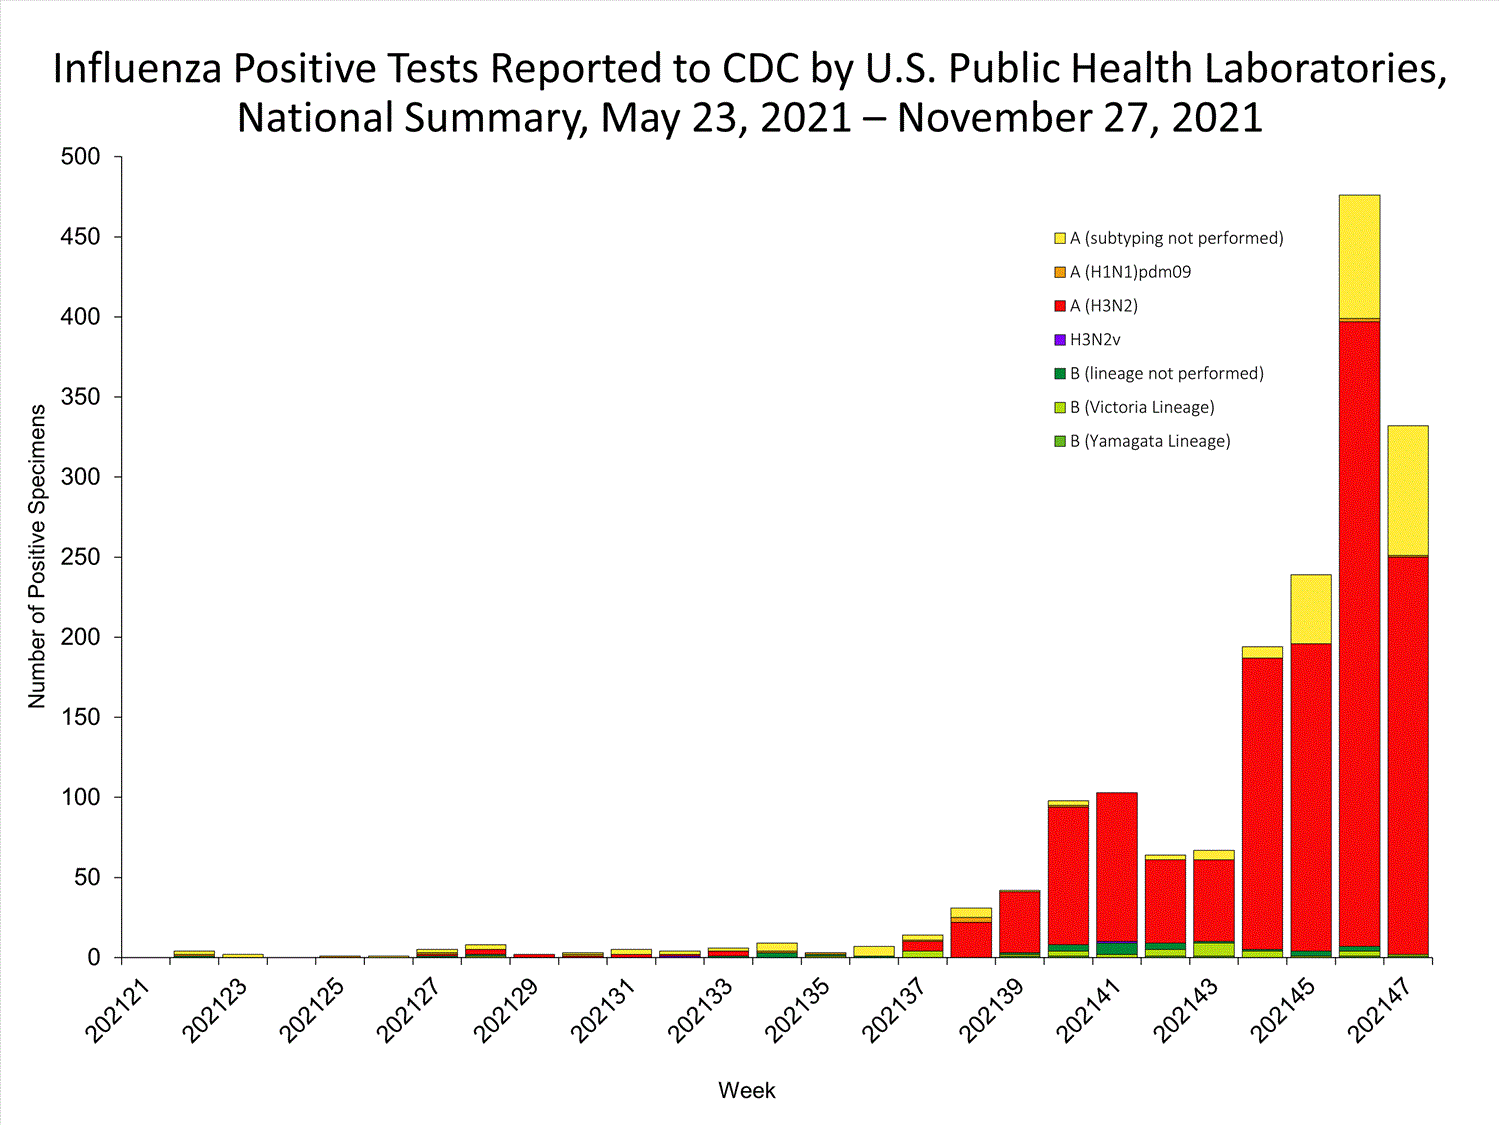
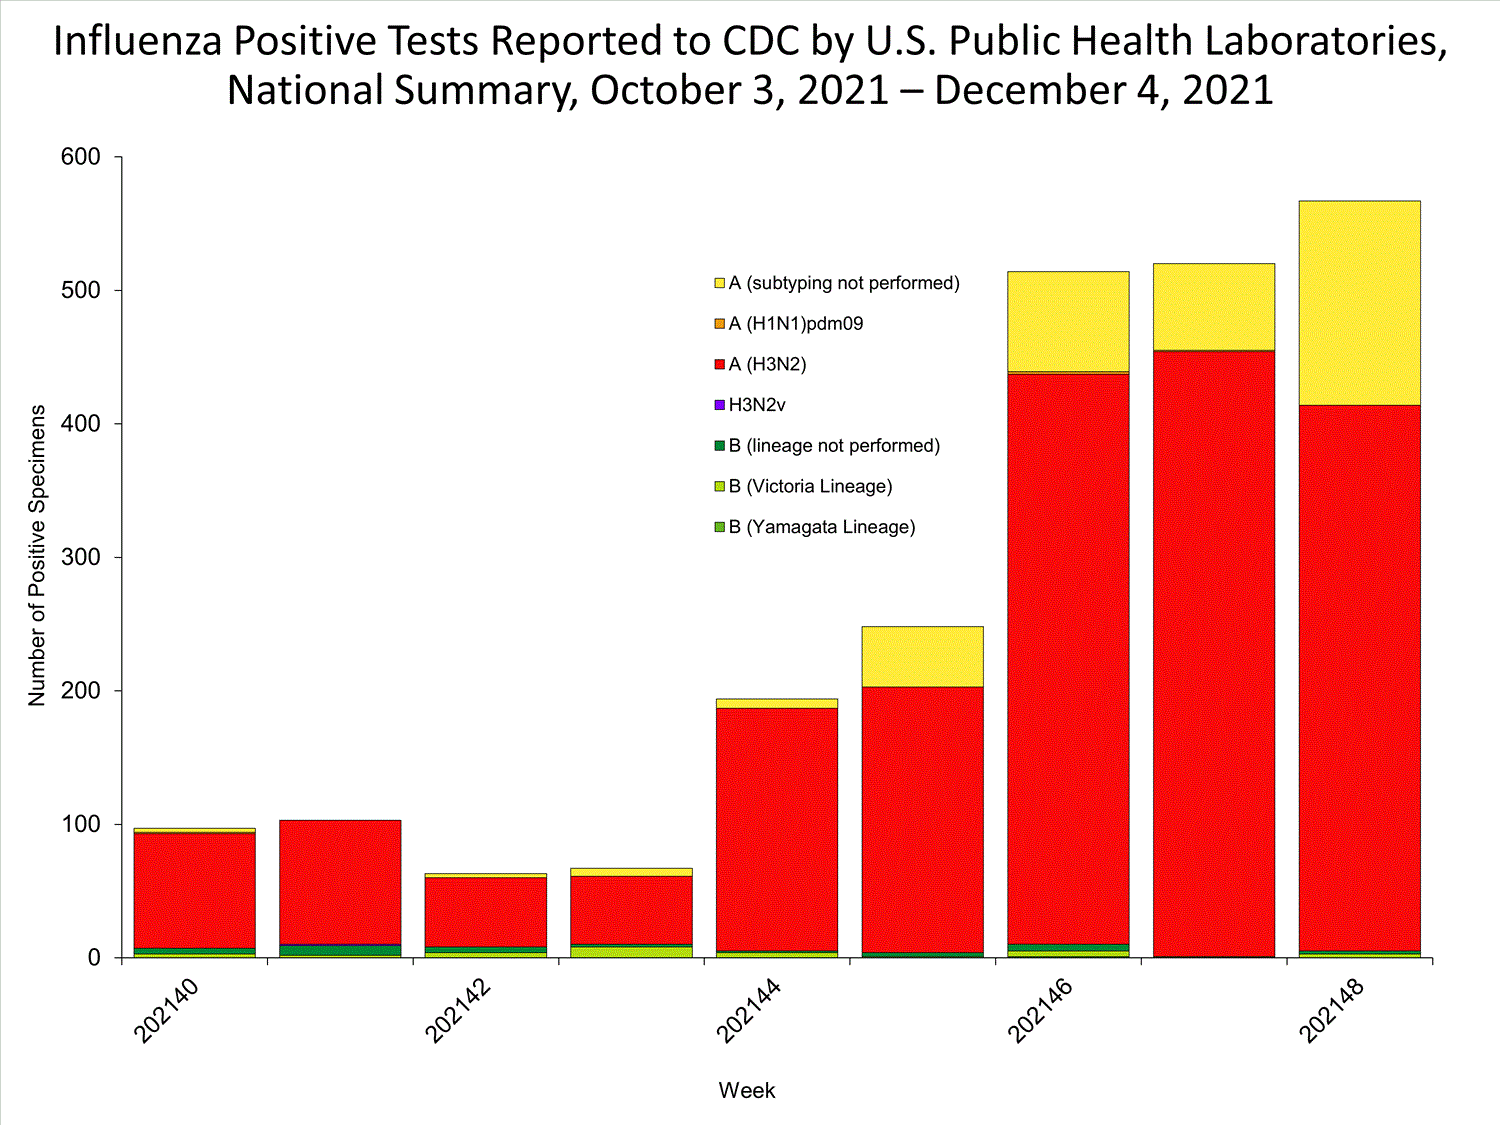
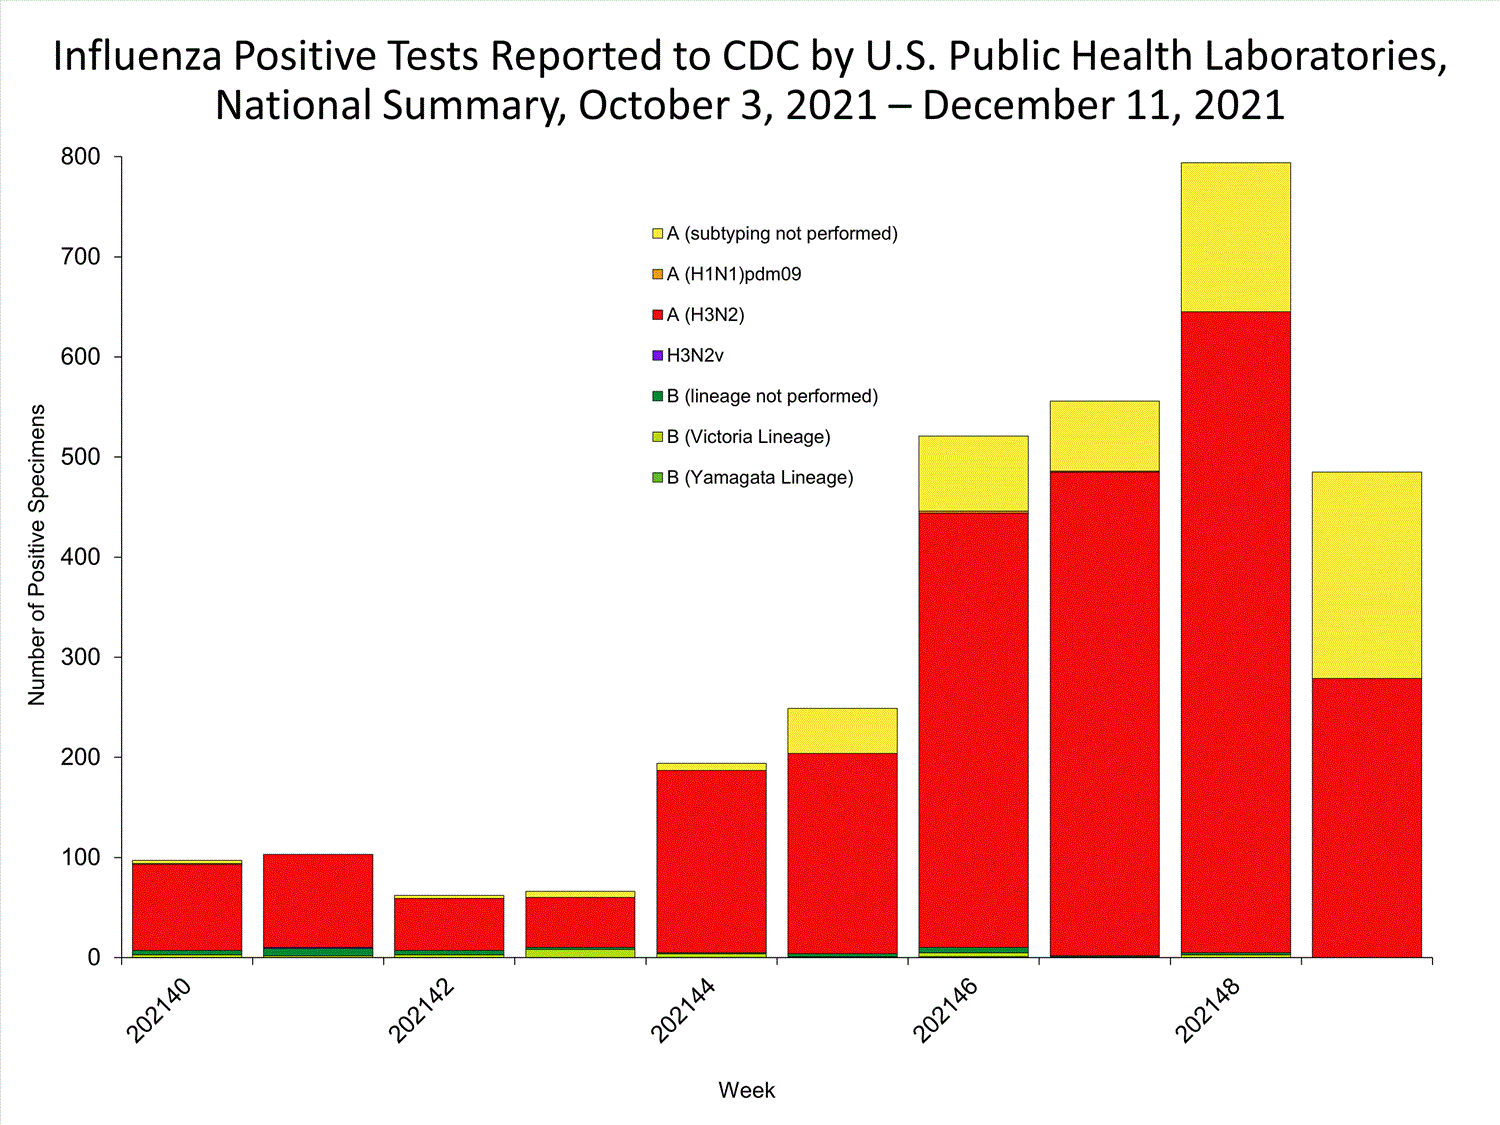
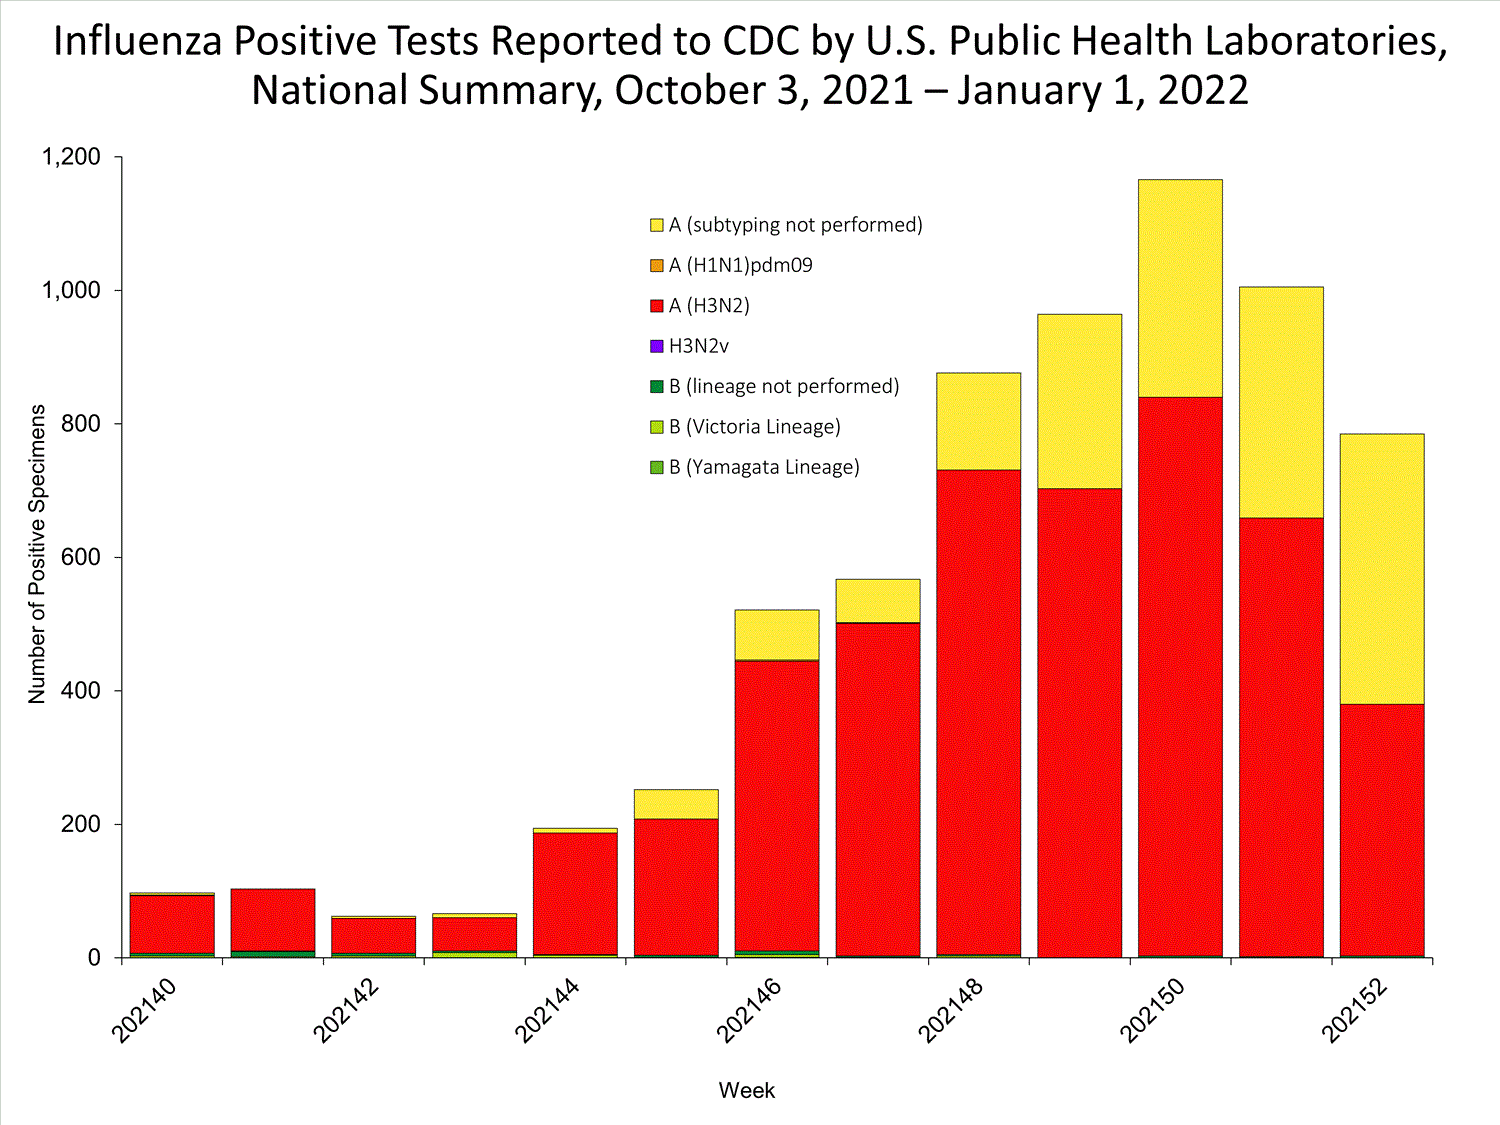
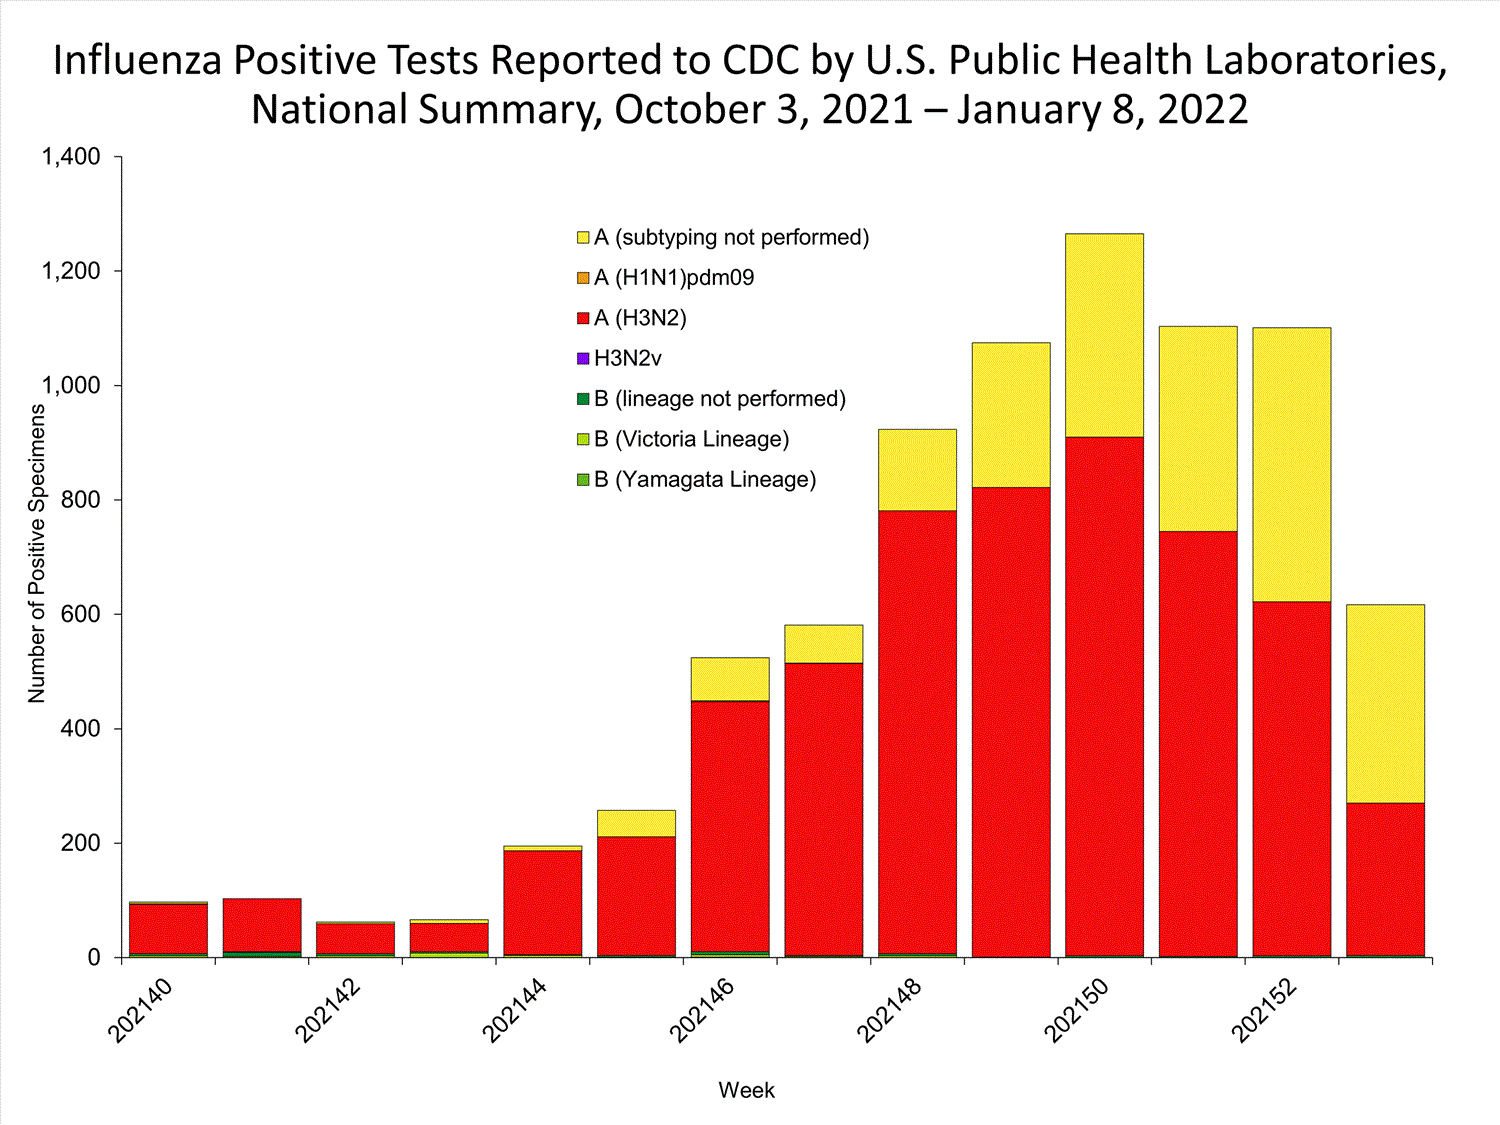
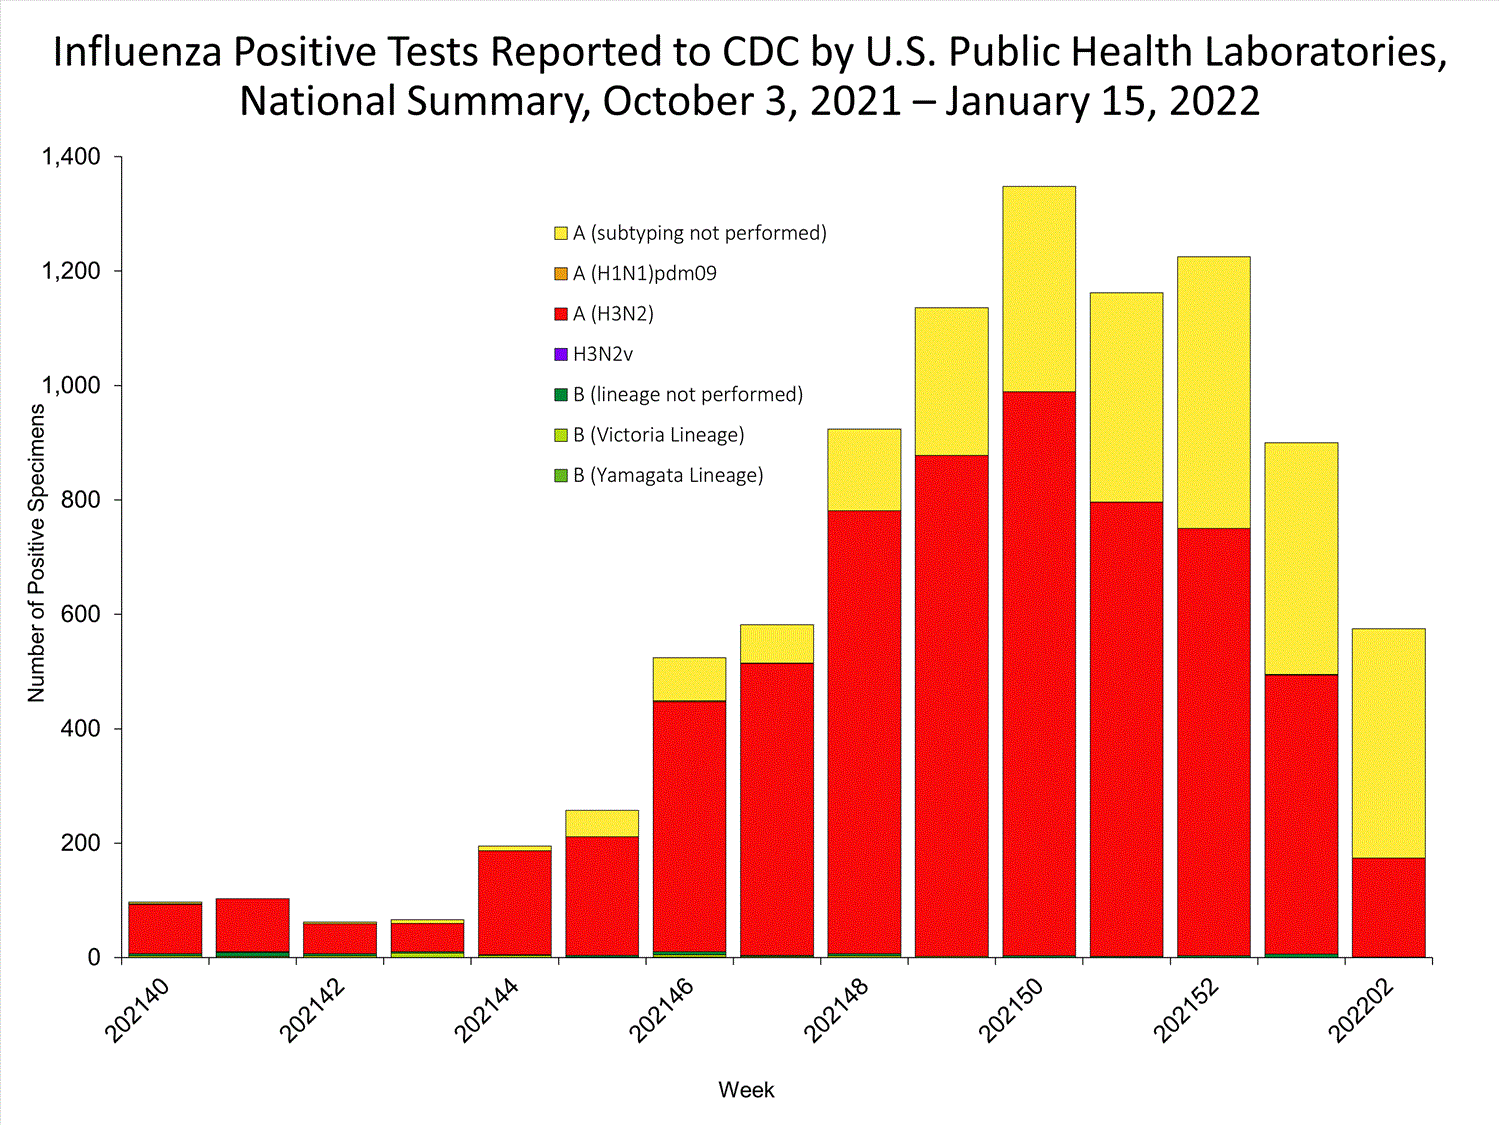
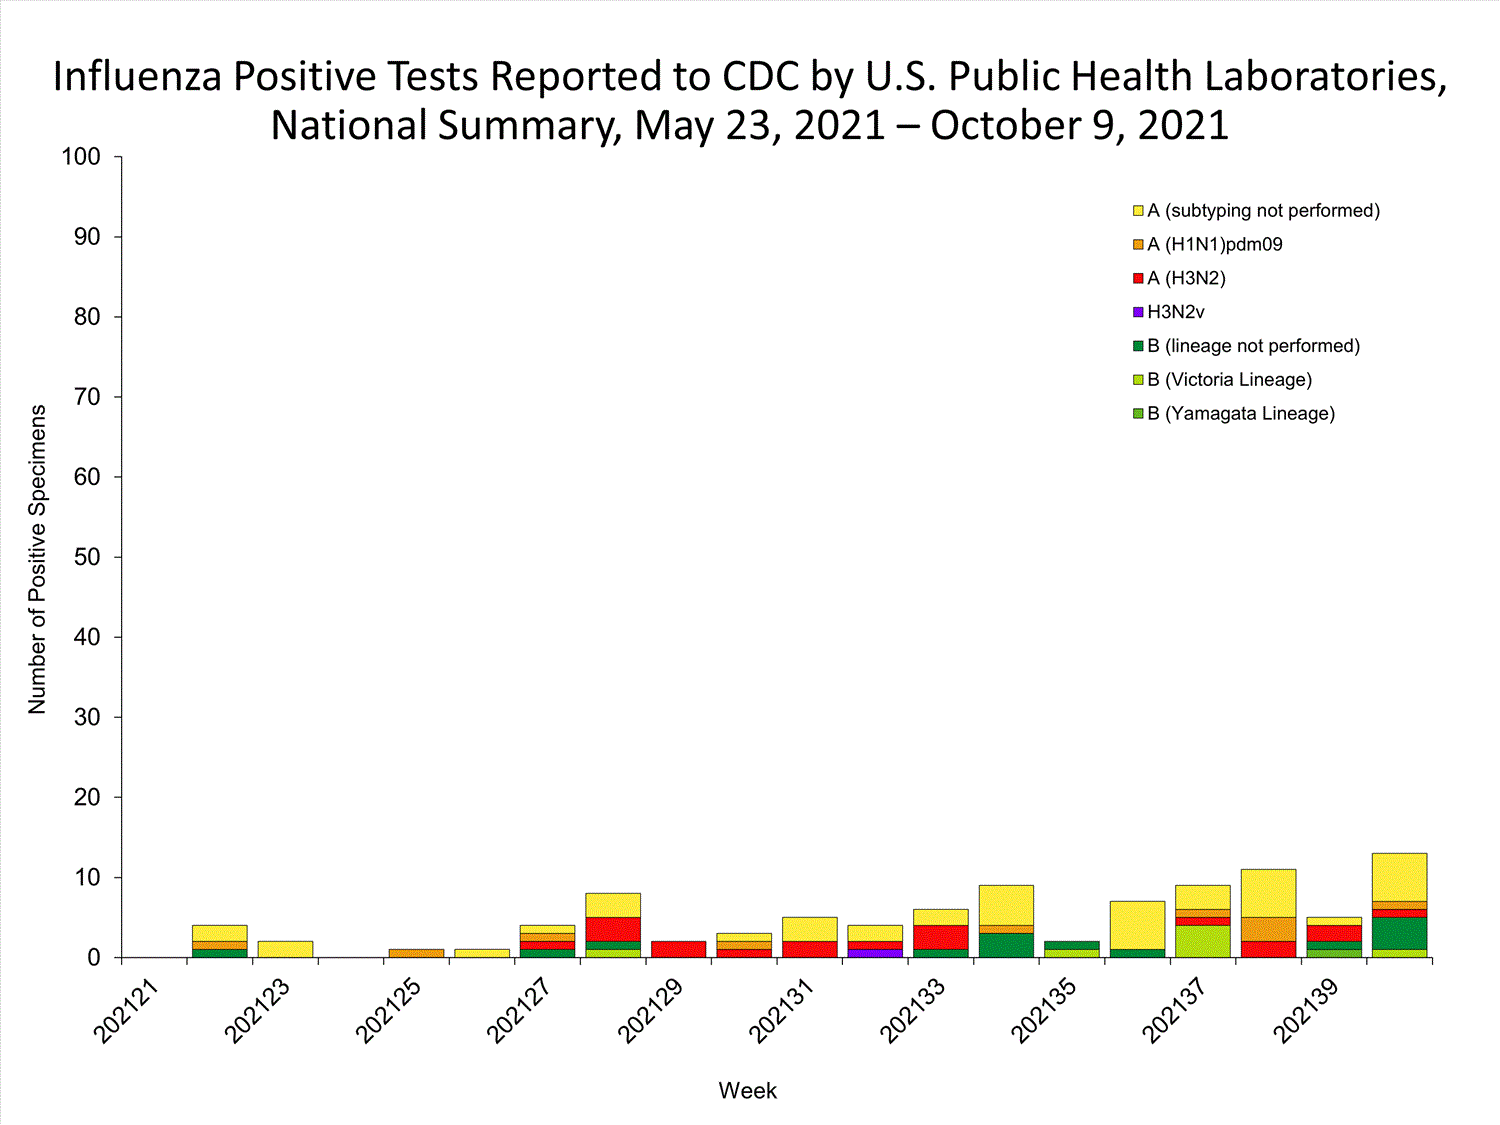
Data from public health laboratories are used to monitor the proportion of circulating viruses that belong to each influenza subtype/lineage.


View Chart Data | View Full Screen


Additional information about medically attended visits for ILI for current and past seasons:
Surveillance Methods | FluView Interactive: National, Regional, and State Data or ILI Activity Map
Outpatient Illness Surveillance


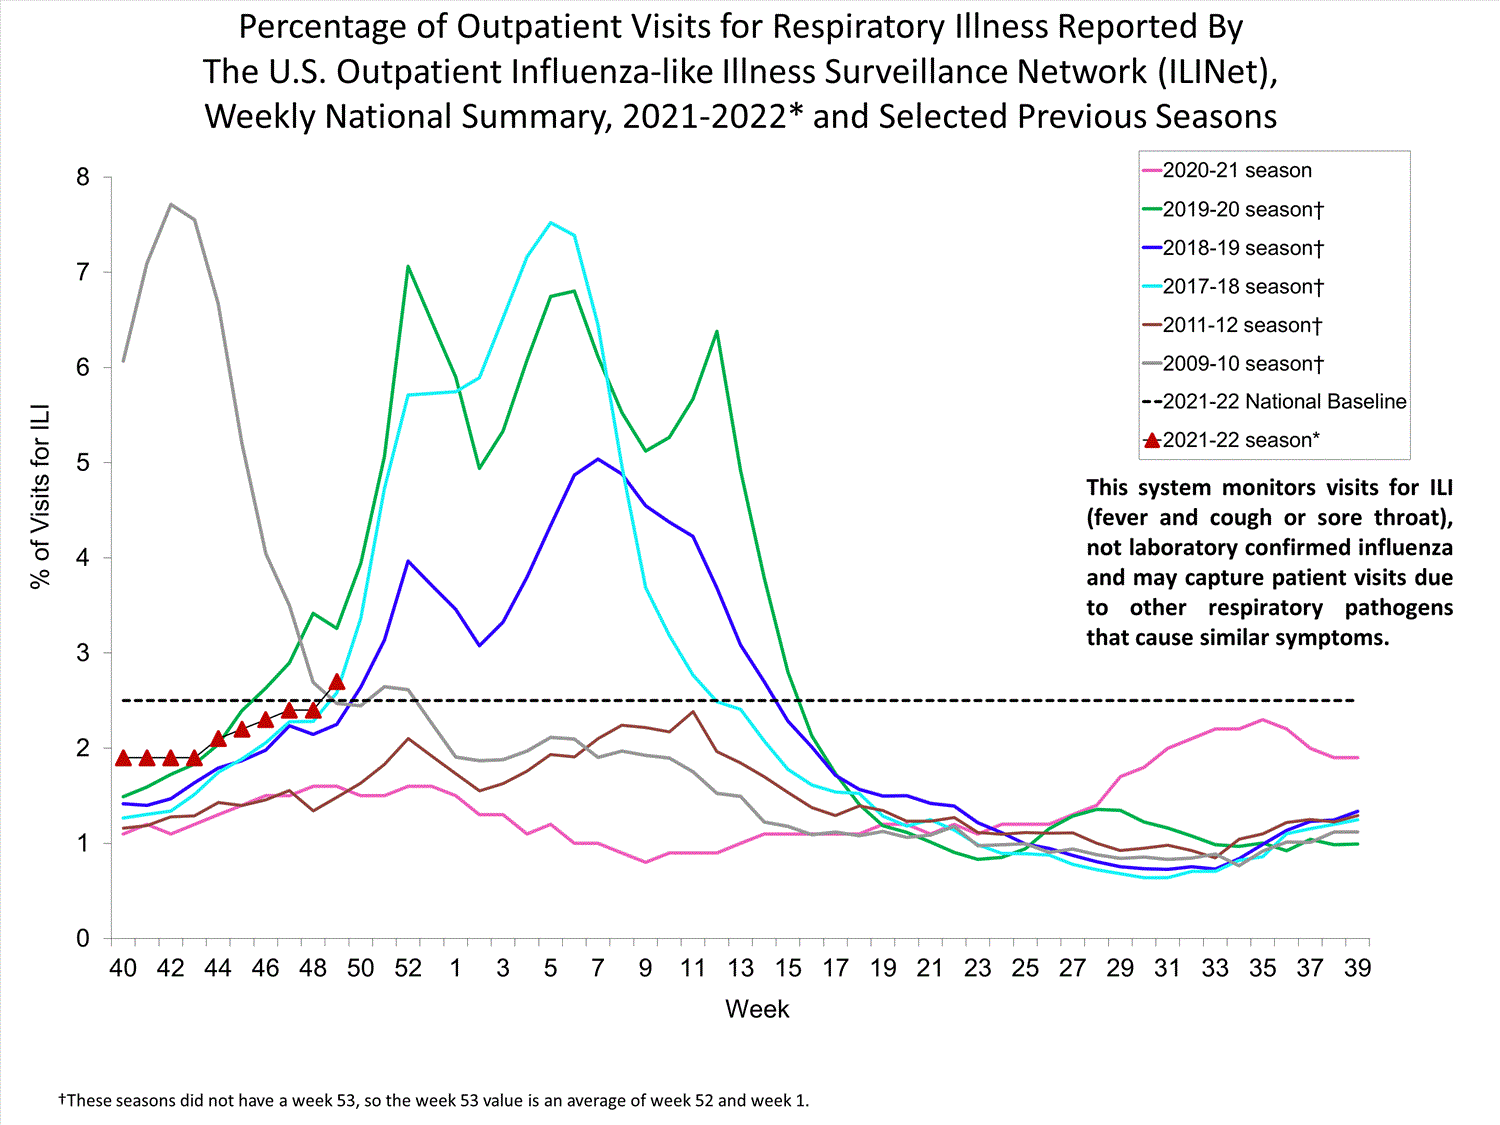
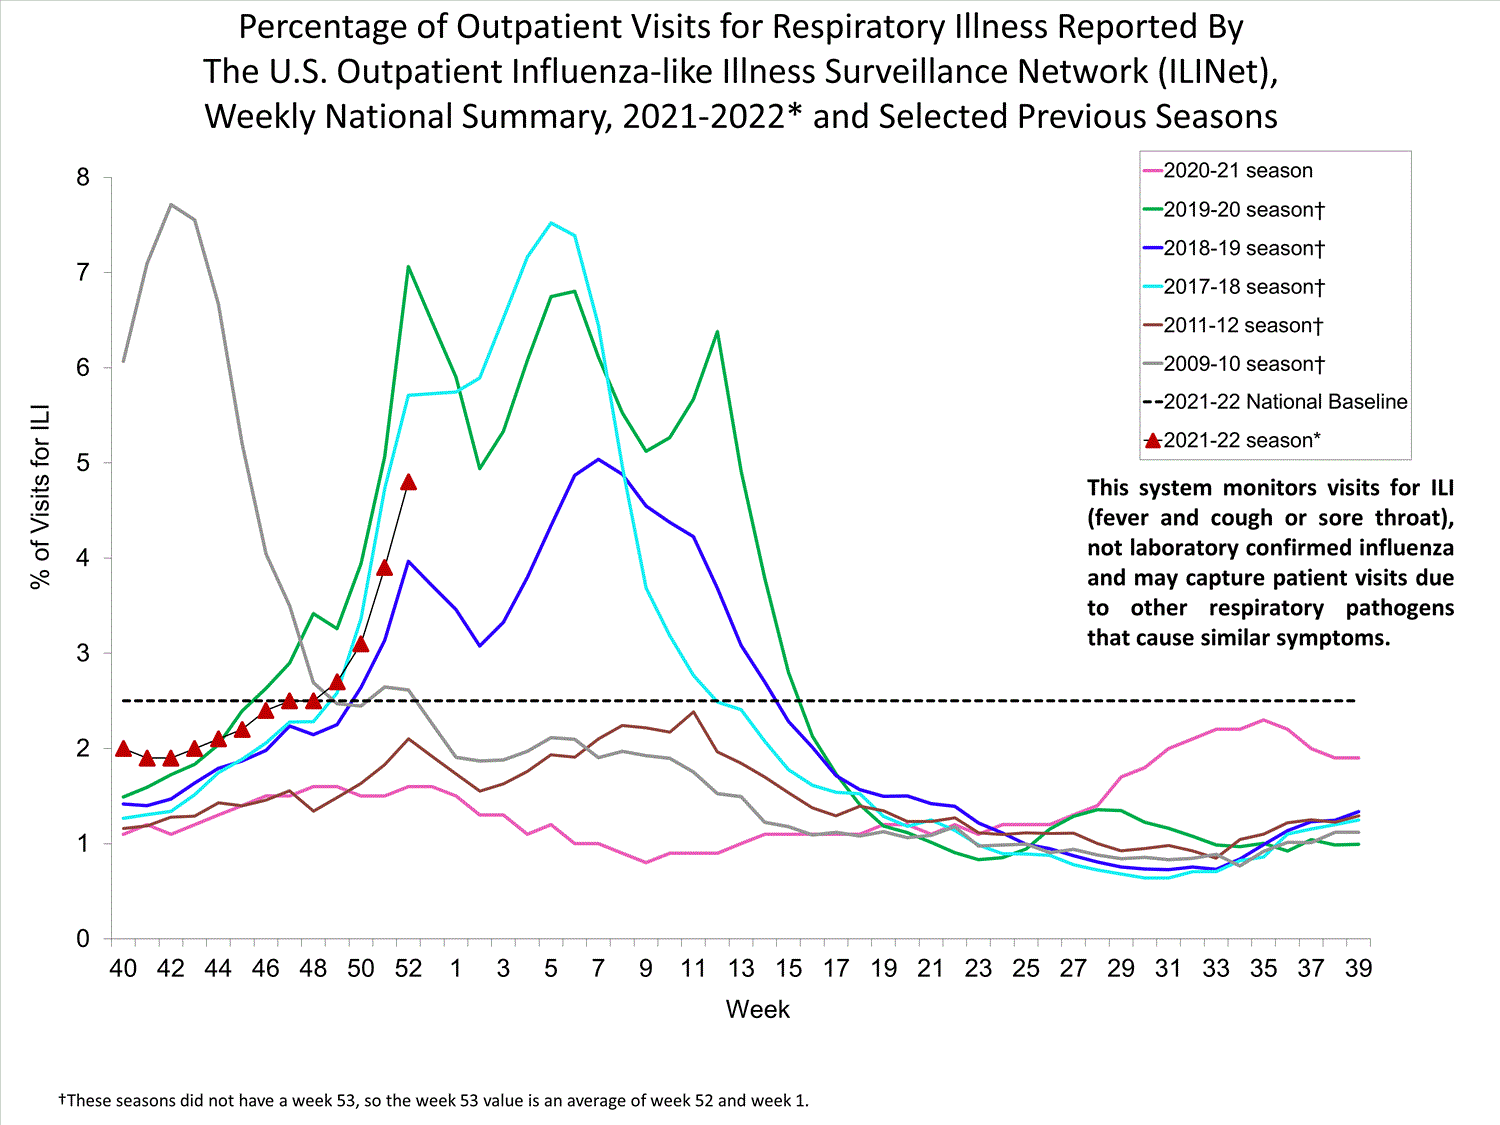
Please note, the U.S. Outpatient Influenza-like Illness Surveillance Network (ILINet) monitors outpatient visits for influenza-like illness (ILI), not laboratory-confirmed influenza, and will capture visits due to other respiratory pathogens, such as SARS-CoV-2, that present with similar symptoms. In addition, health care-seeking behaviors have changed dramatically during the COVID-19 pandemic. Many people are accessing the health care system in alternative settings, which may or may not be captured as a part of ILINet. Therefore, ILI data, including ILI activity levels, should be interpreted with caution. It is particularly important at this time to evaluate syndromic surveillance data, including that from ILINet, in the context of other sources of surveillance data to obtain a complete and accurate picture of influenza, COVID-19, and other respiratory virus activity. CDC is tracking the COVID-19 pandemic in a weekly publication called COVID Data Tracker Weekly Review. Information about other respiratory virus activity can be found on CDC’s National Respiratory and Enteric Virus Surveillance System (NREVSS) website.
ILINet


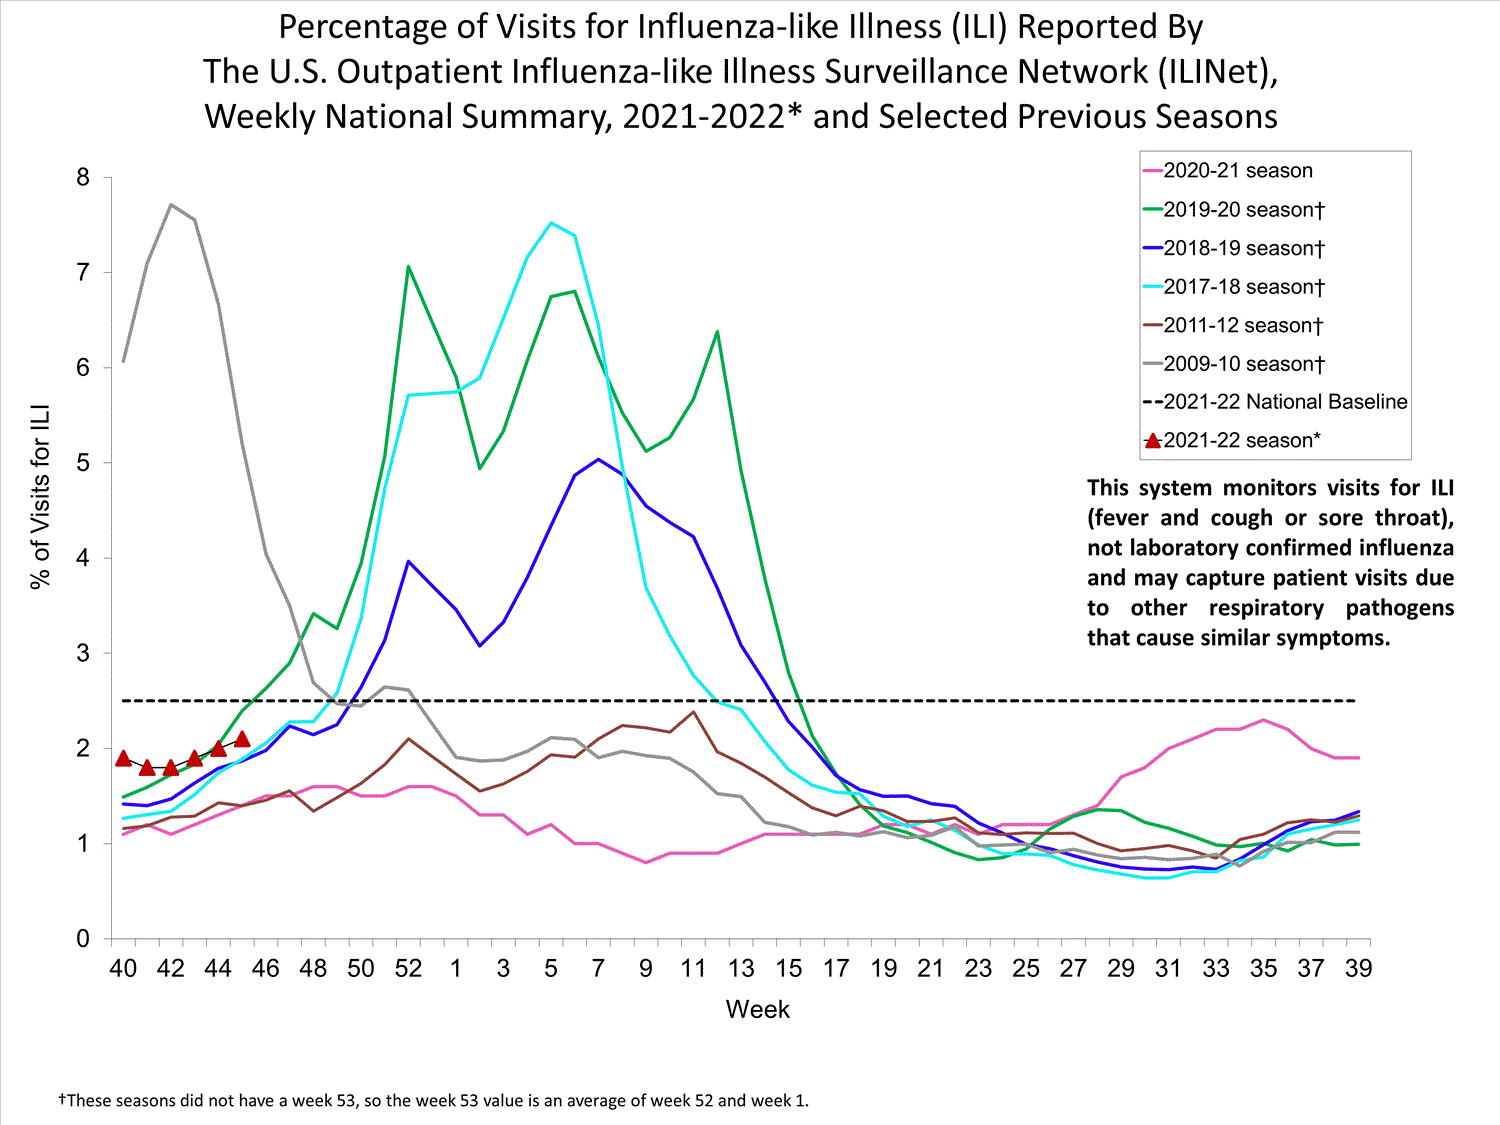
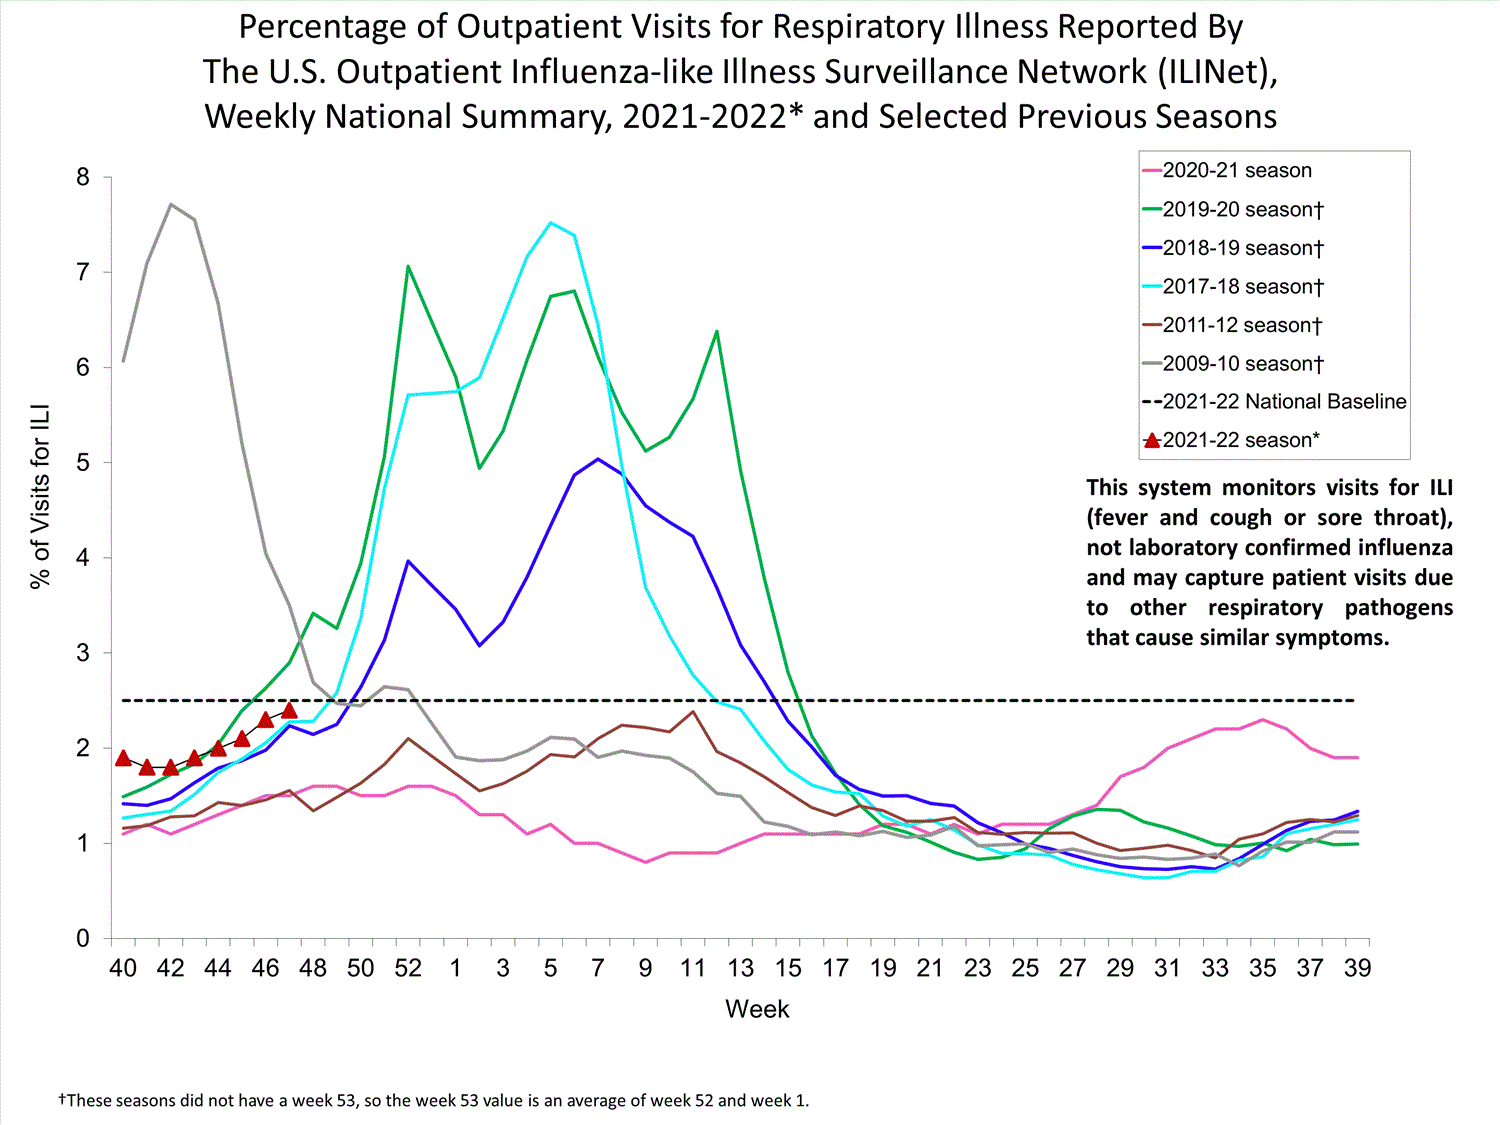
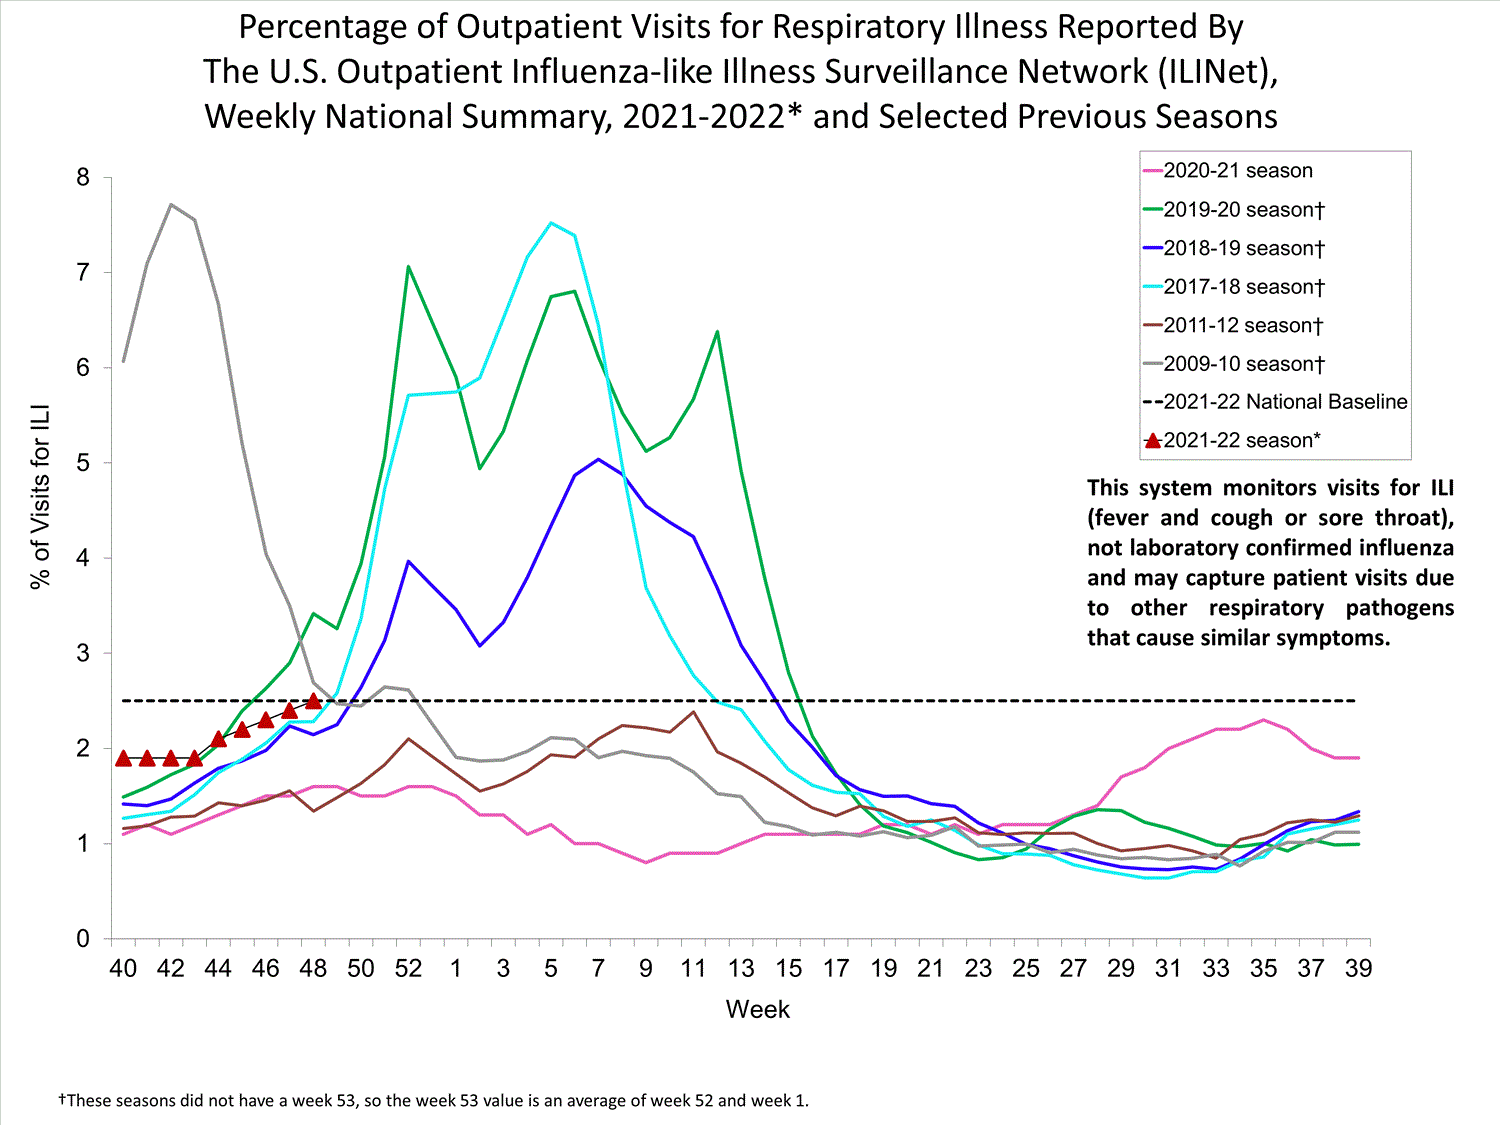
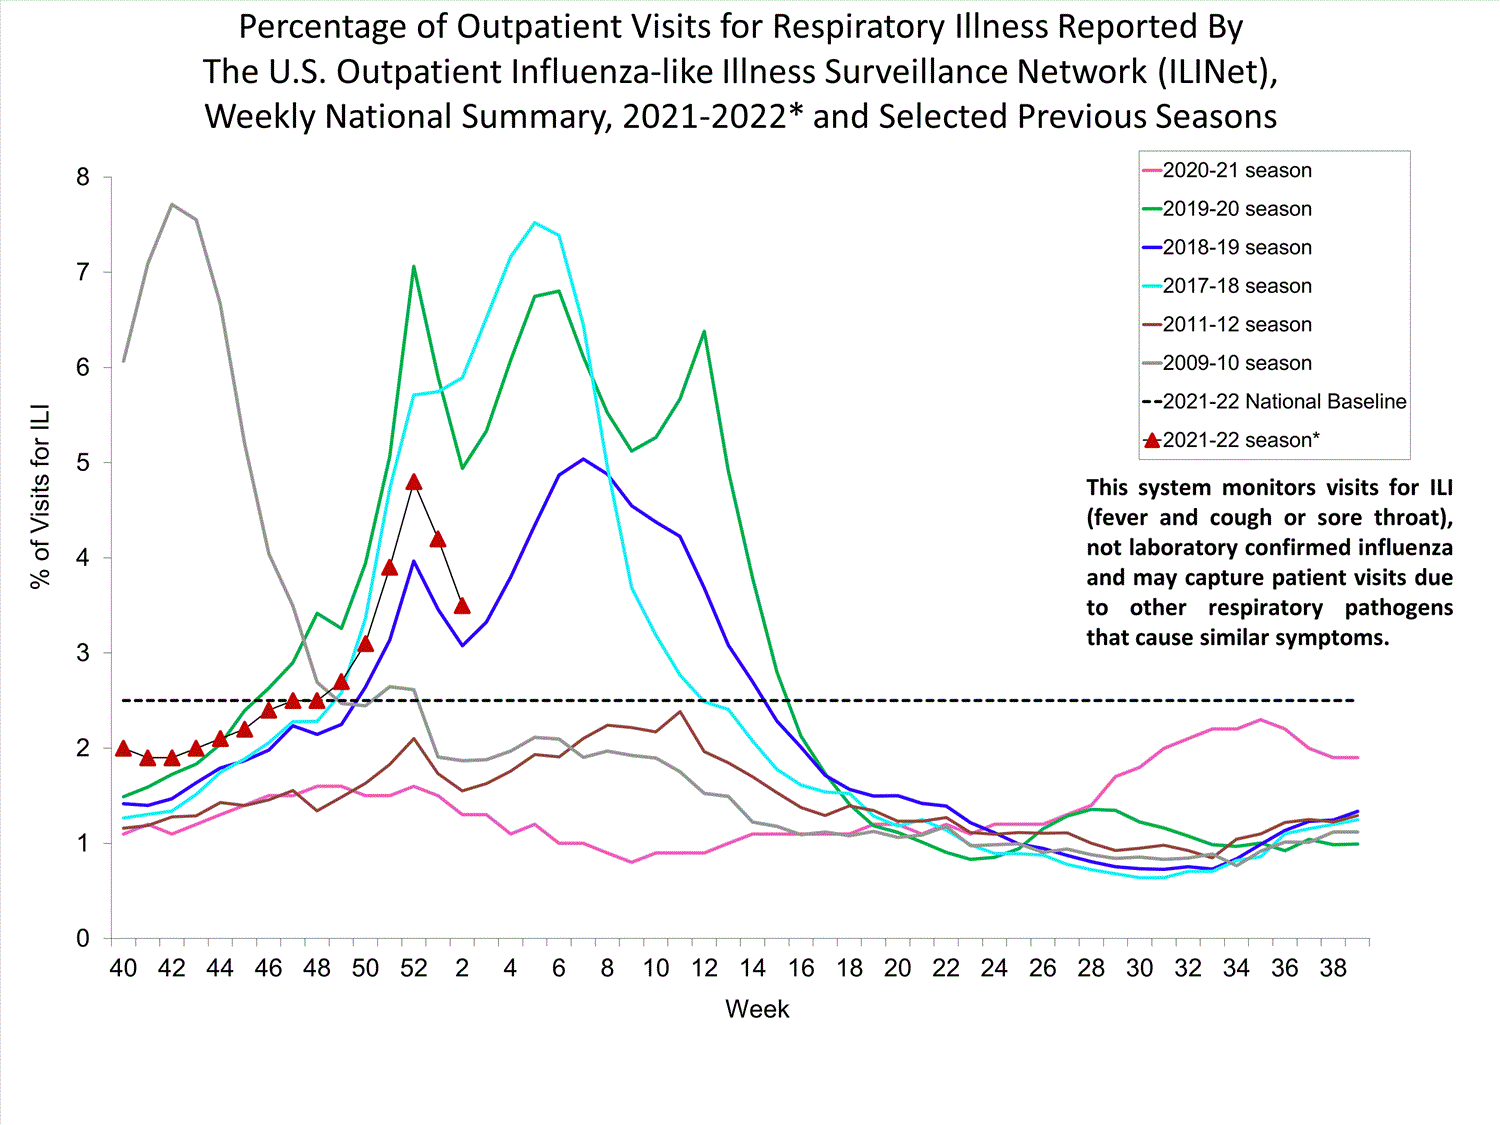
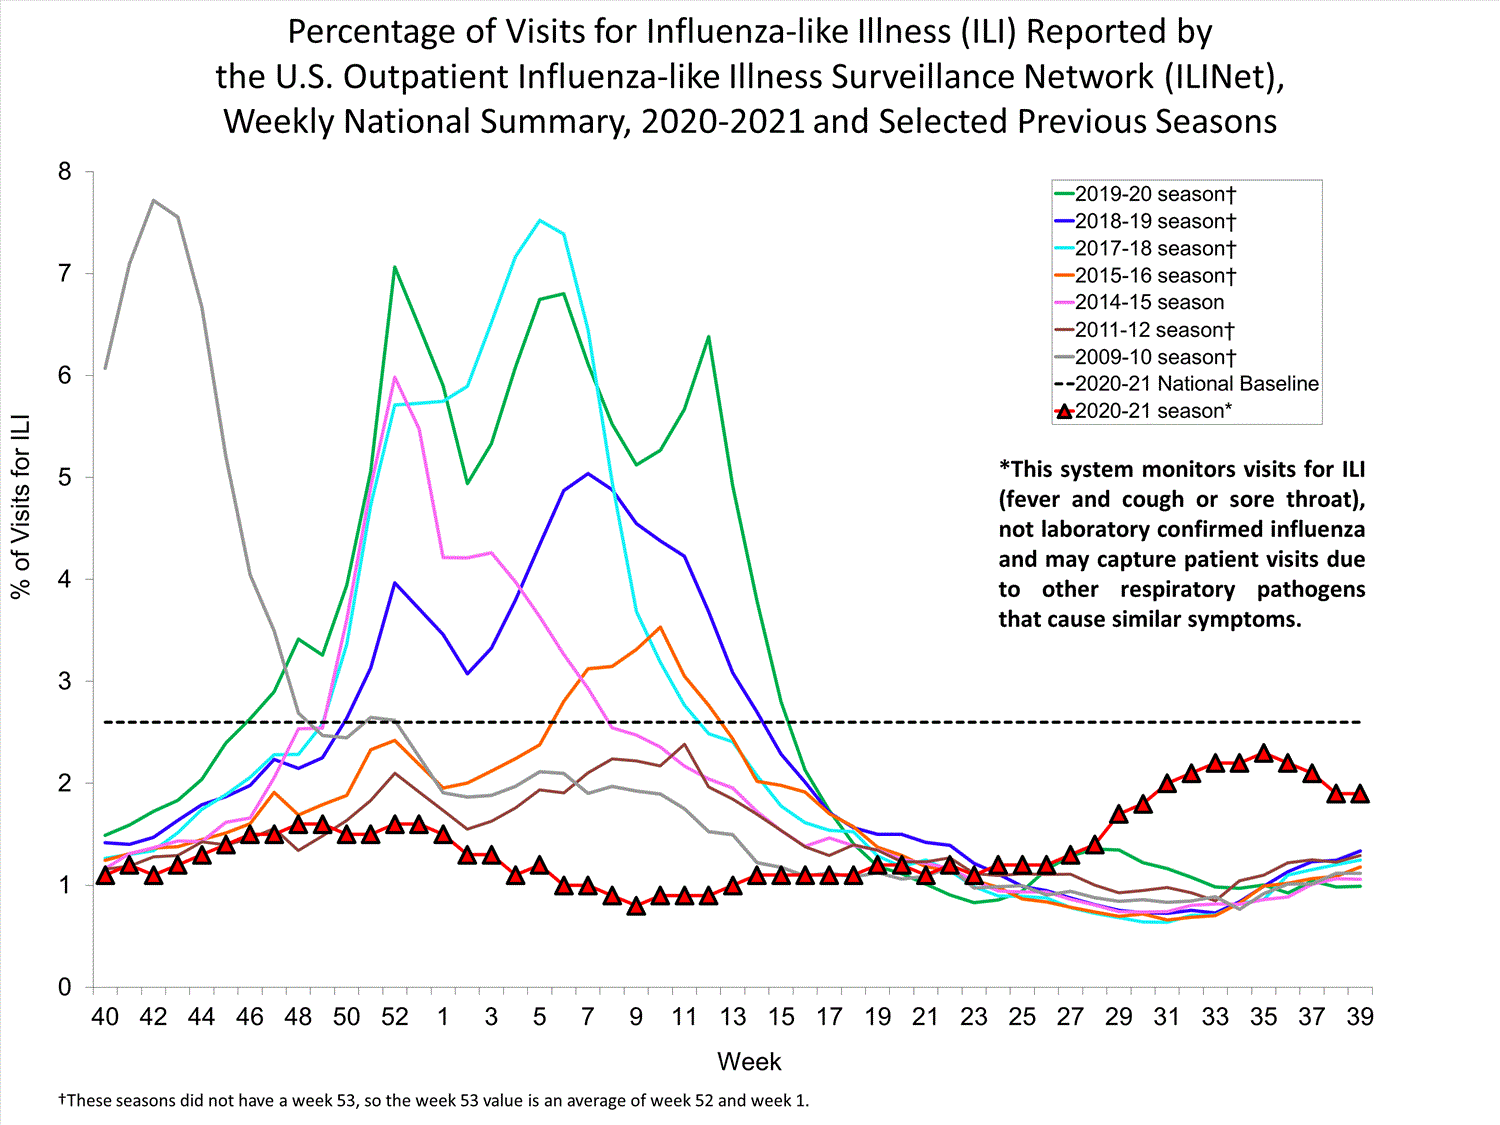
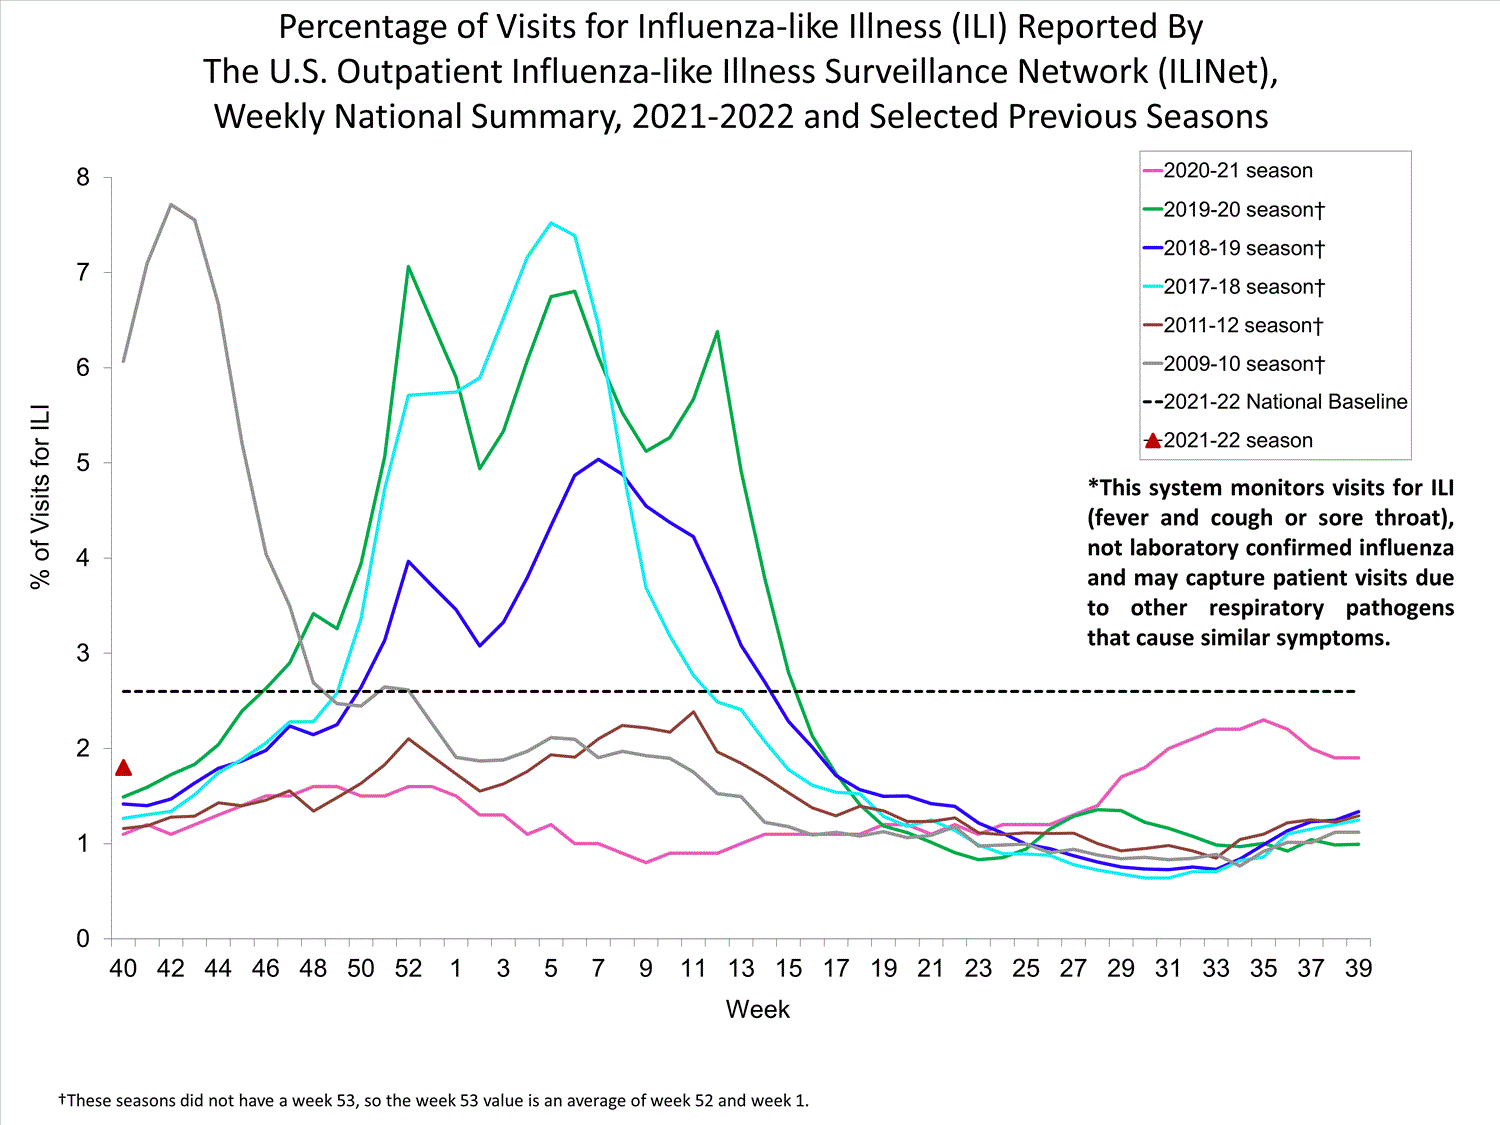
Nationwide during week 39, 1.9% of patient visits reported through ILINet were due to ILI. The percentage of patient visits for ILI remains below the baseline of 2.6% nationally. All ten regions are below their region-specific baselines.

Influenza virus circulation remains low; therefore, increases in ILI activity are likely due to increased circulation of other respiratory viruses.


View Chart Data (current season only) | View Full ScreenILI Visits by Age Group


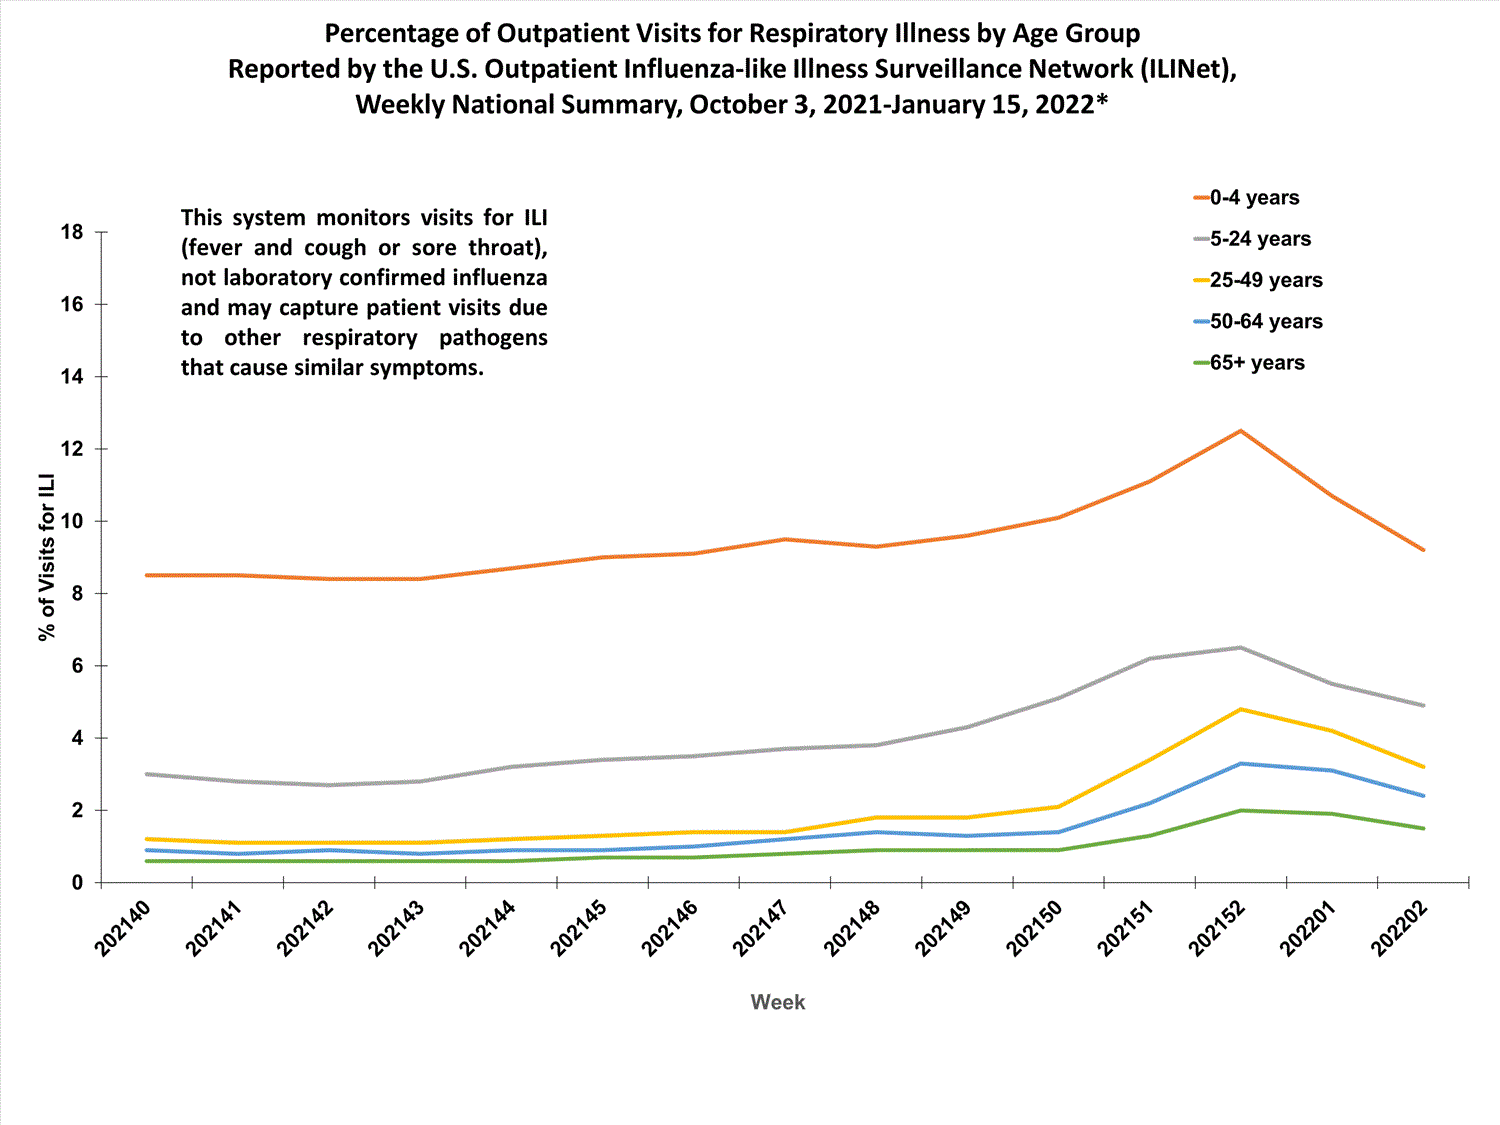
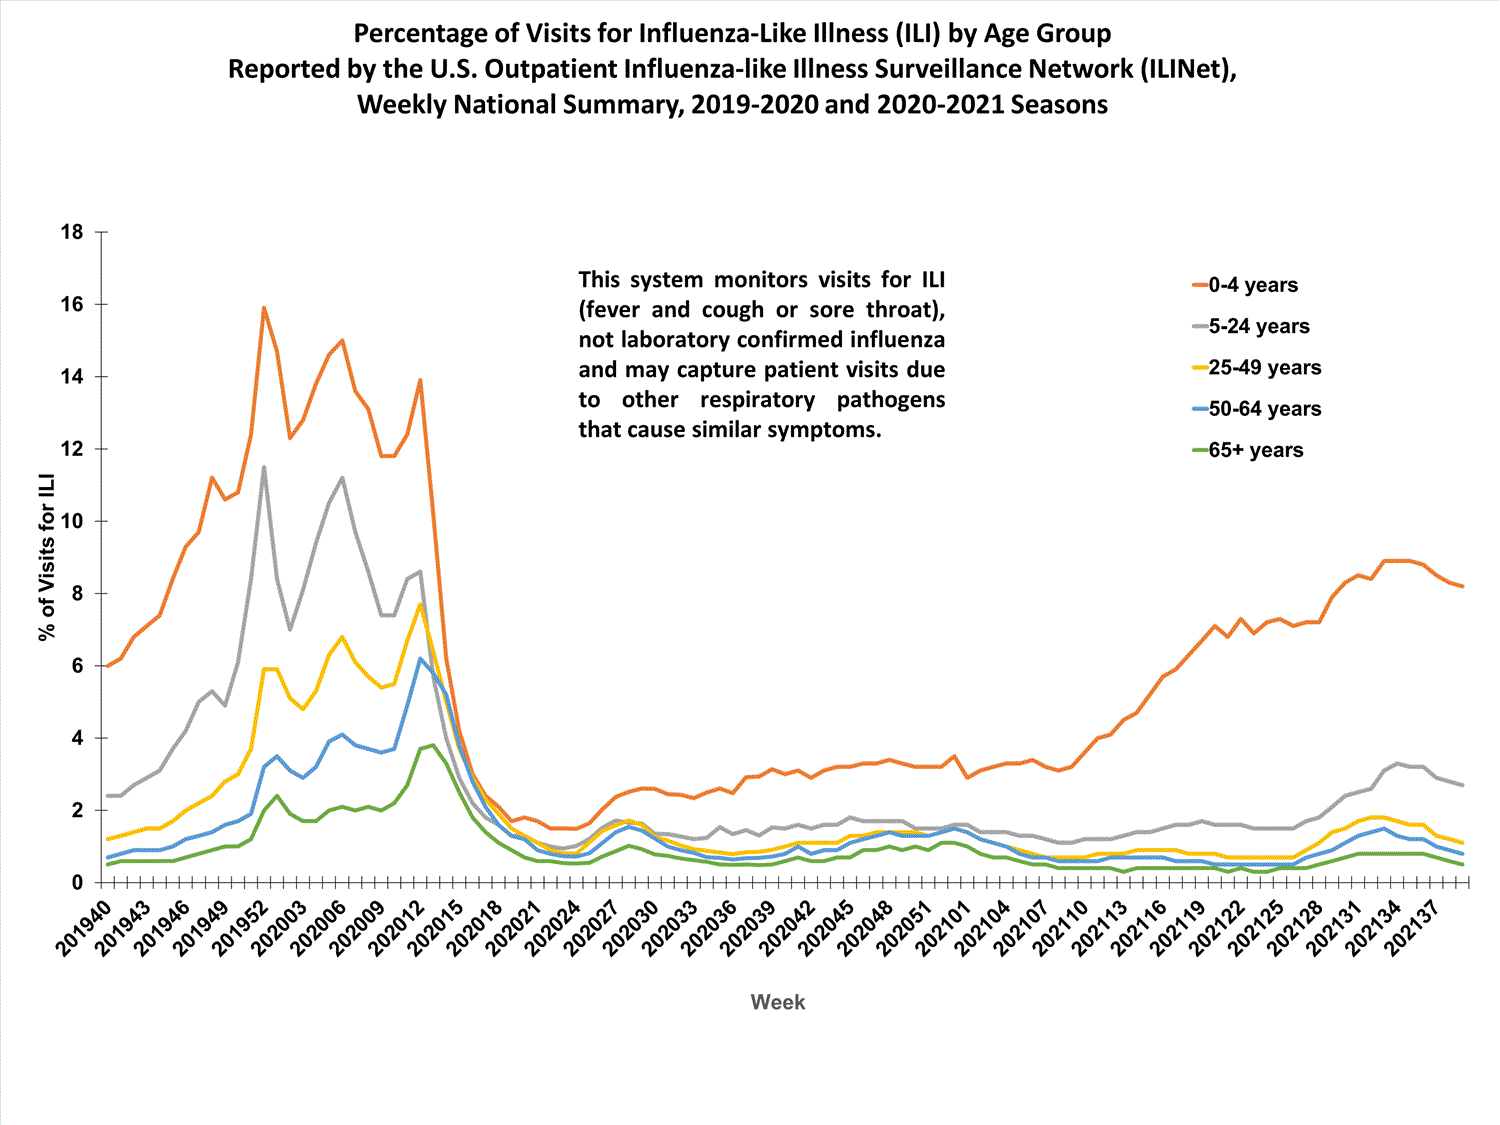
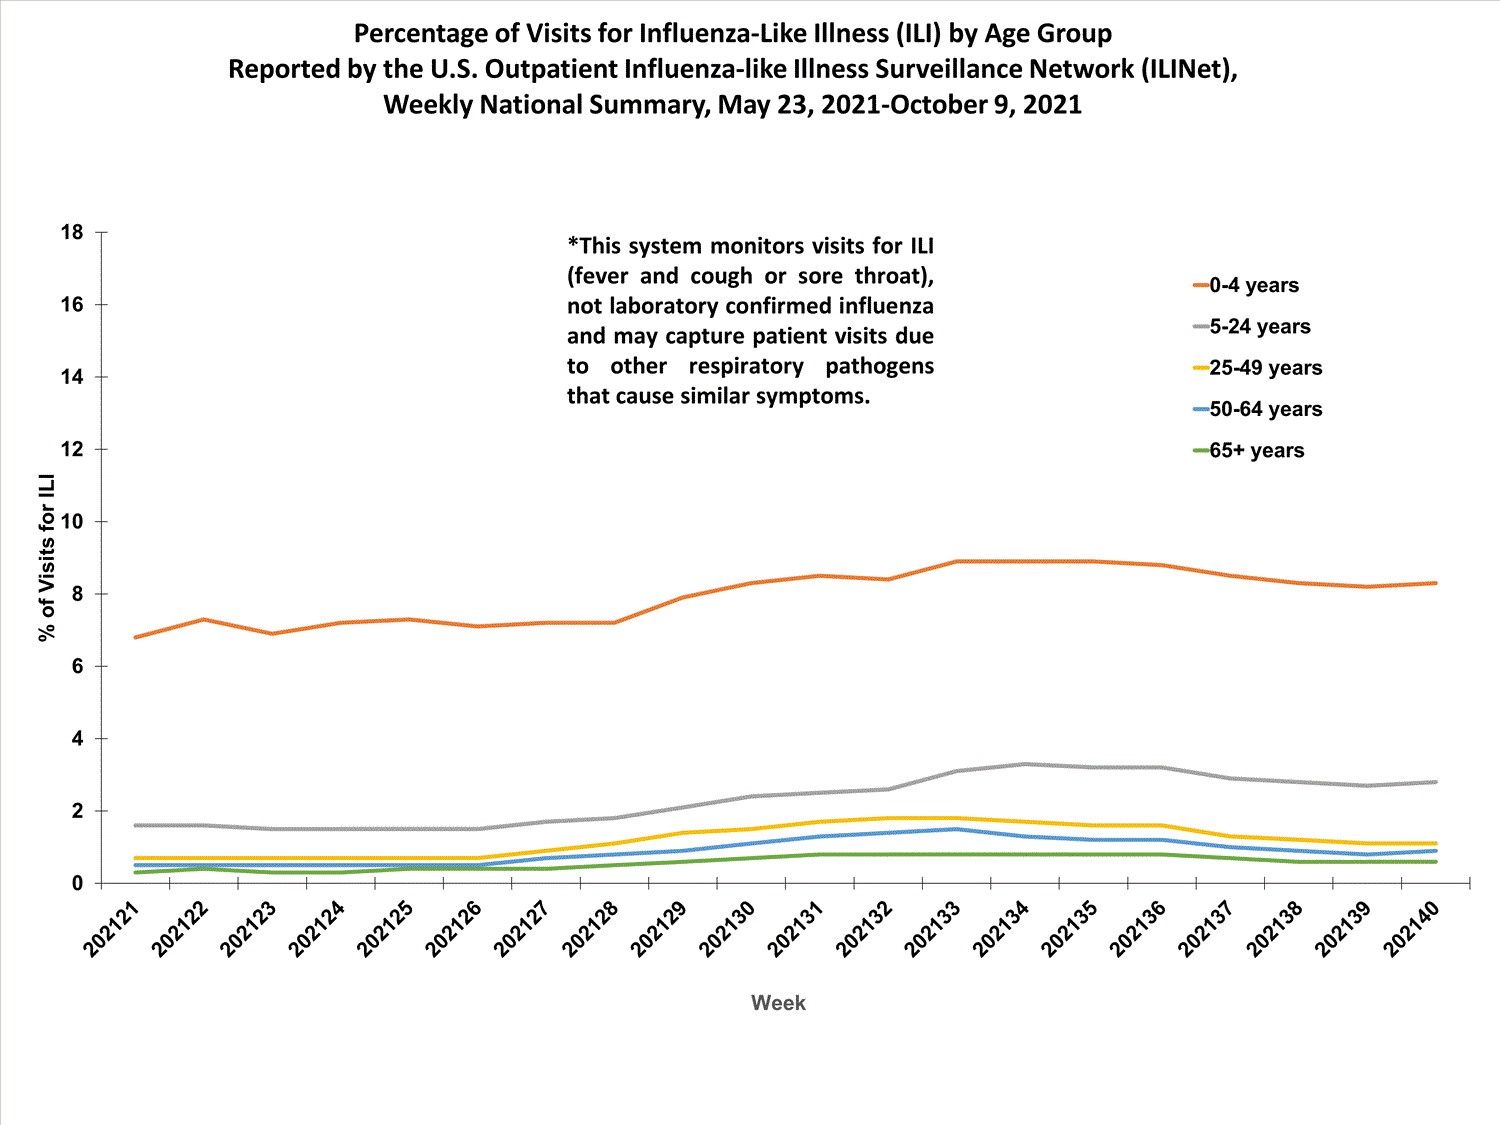
About 65% of ILINet participants provide both the number of patient visits for ILI and the total number of patient visits for the week broken out by age group. Data from this subset of providers are used to calculate the percentages of patient visits for ILI by age group.

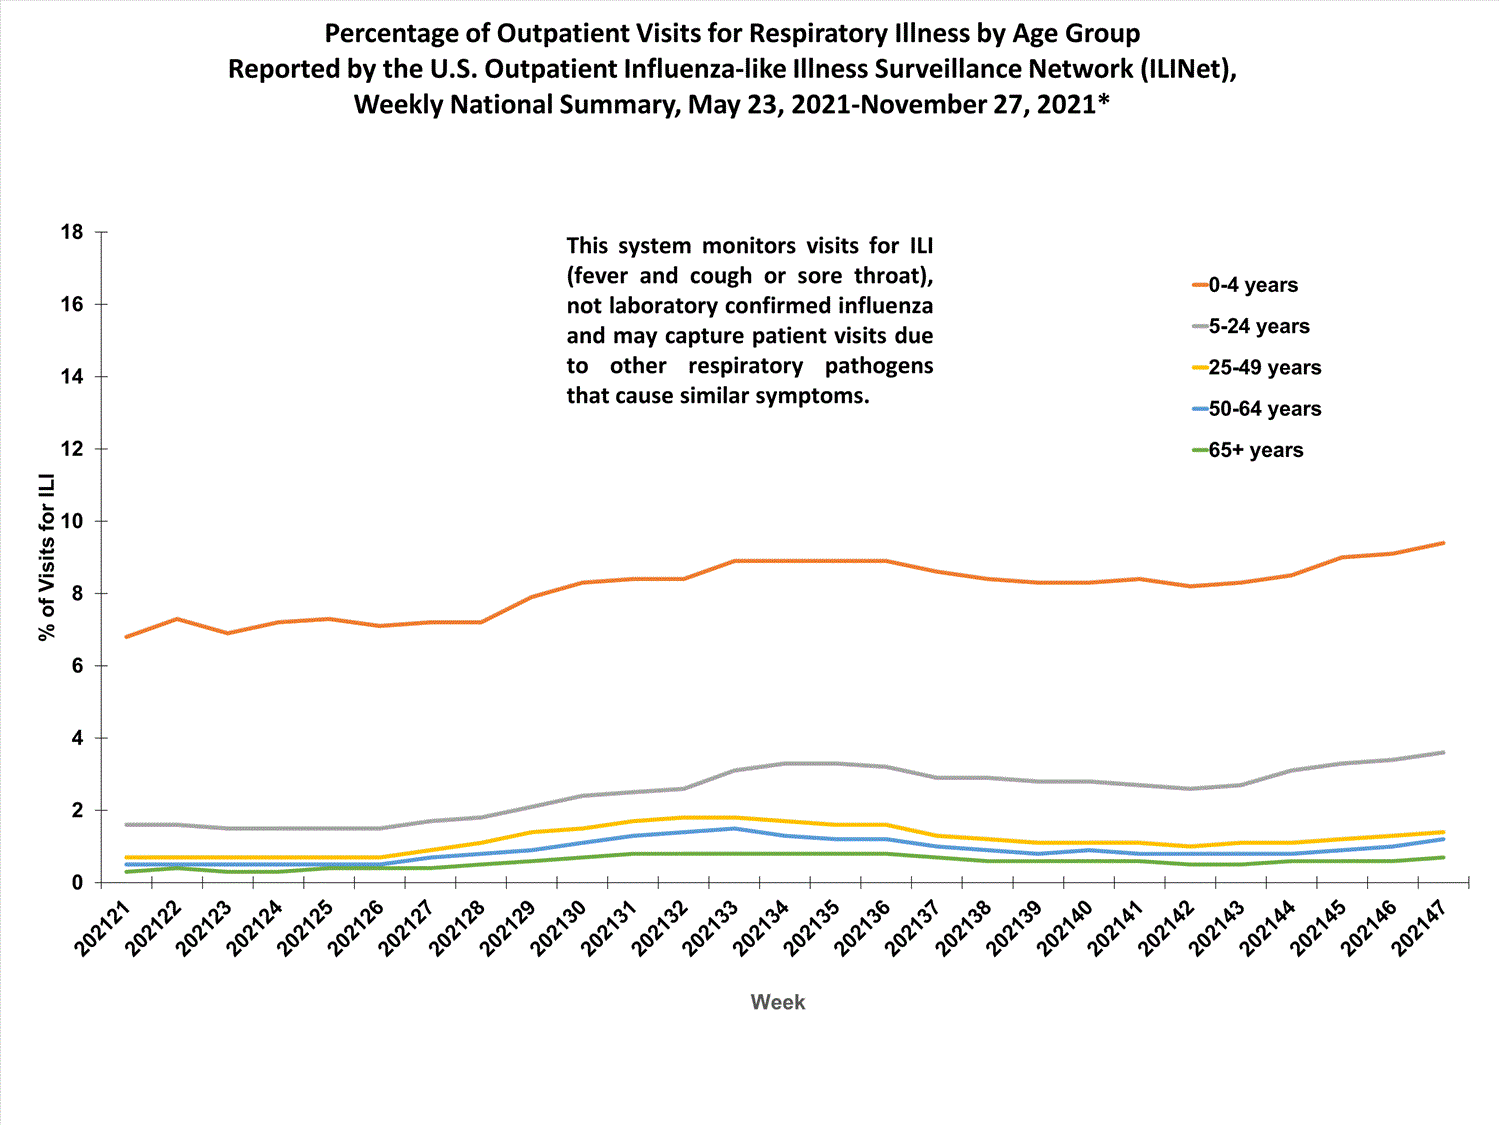
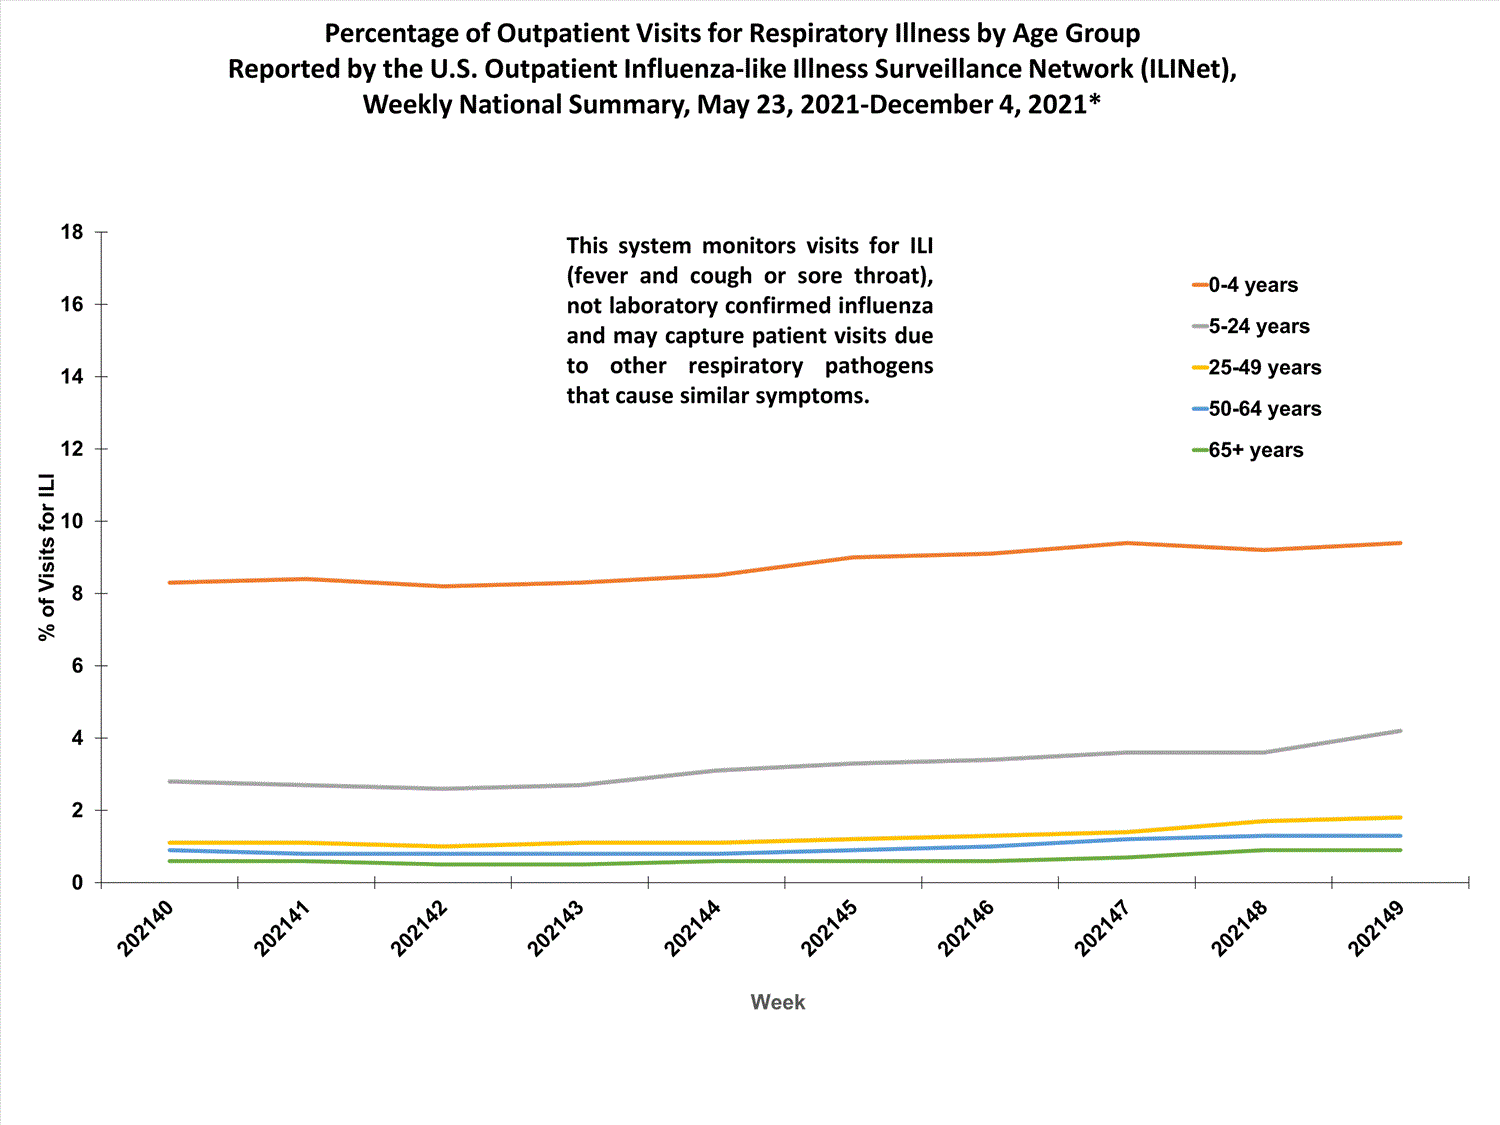
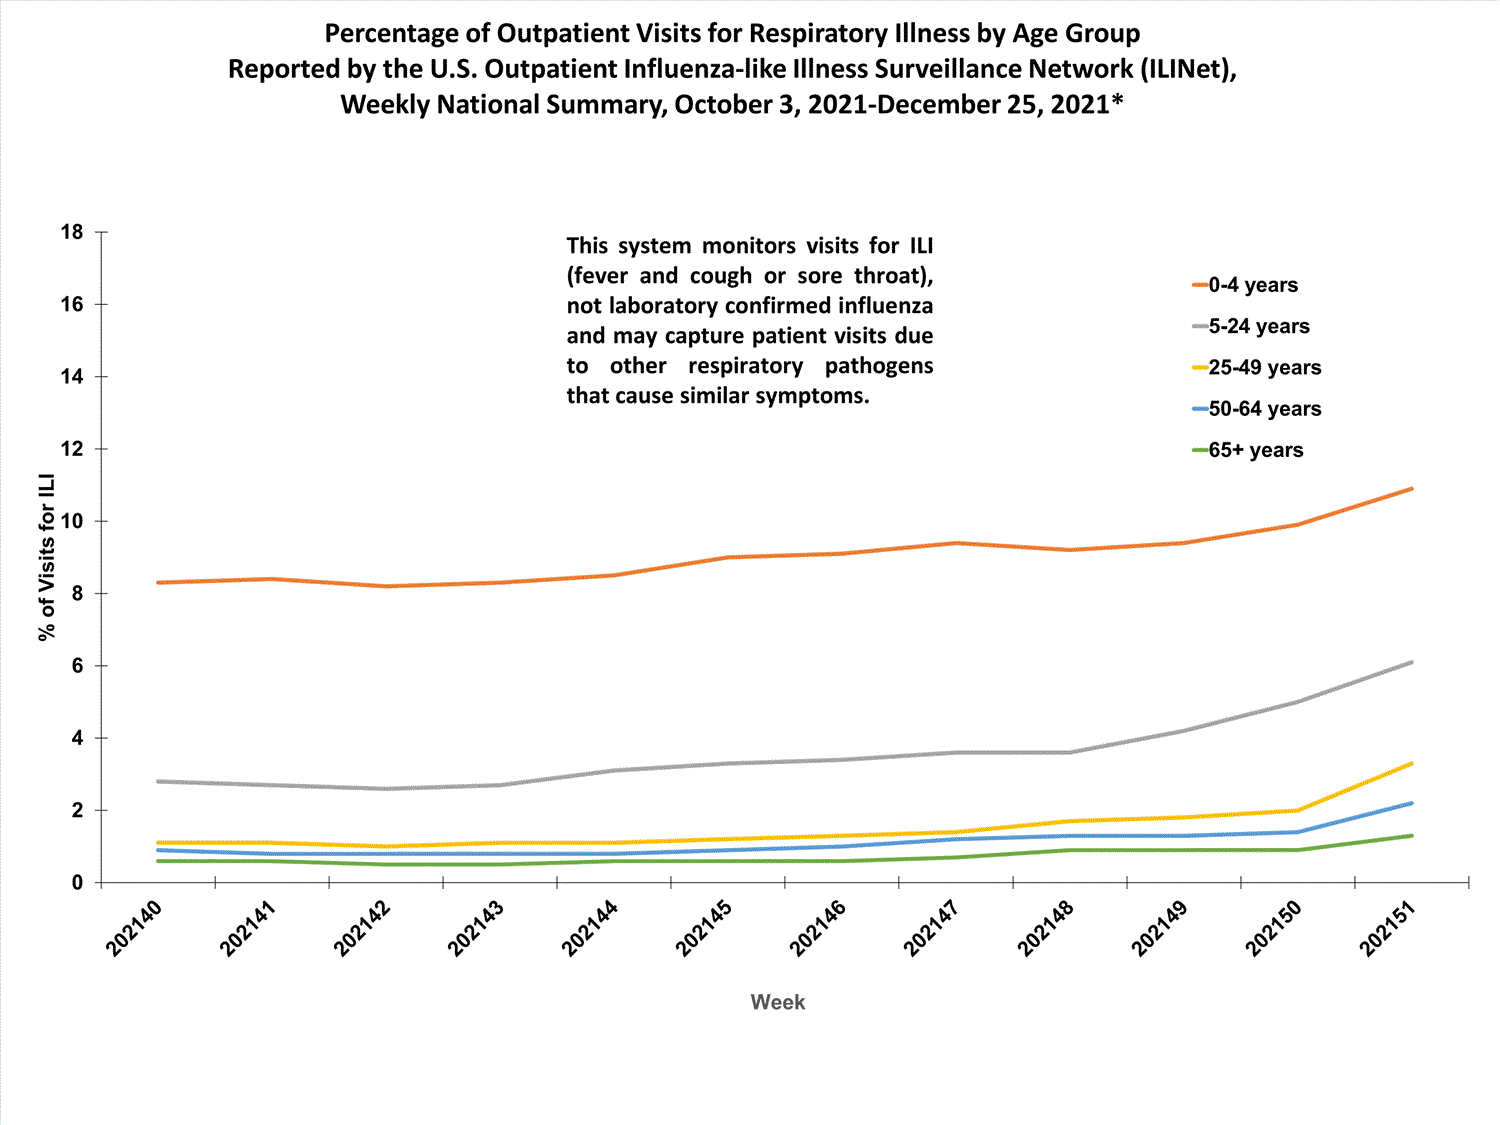
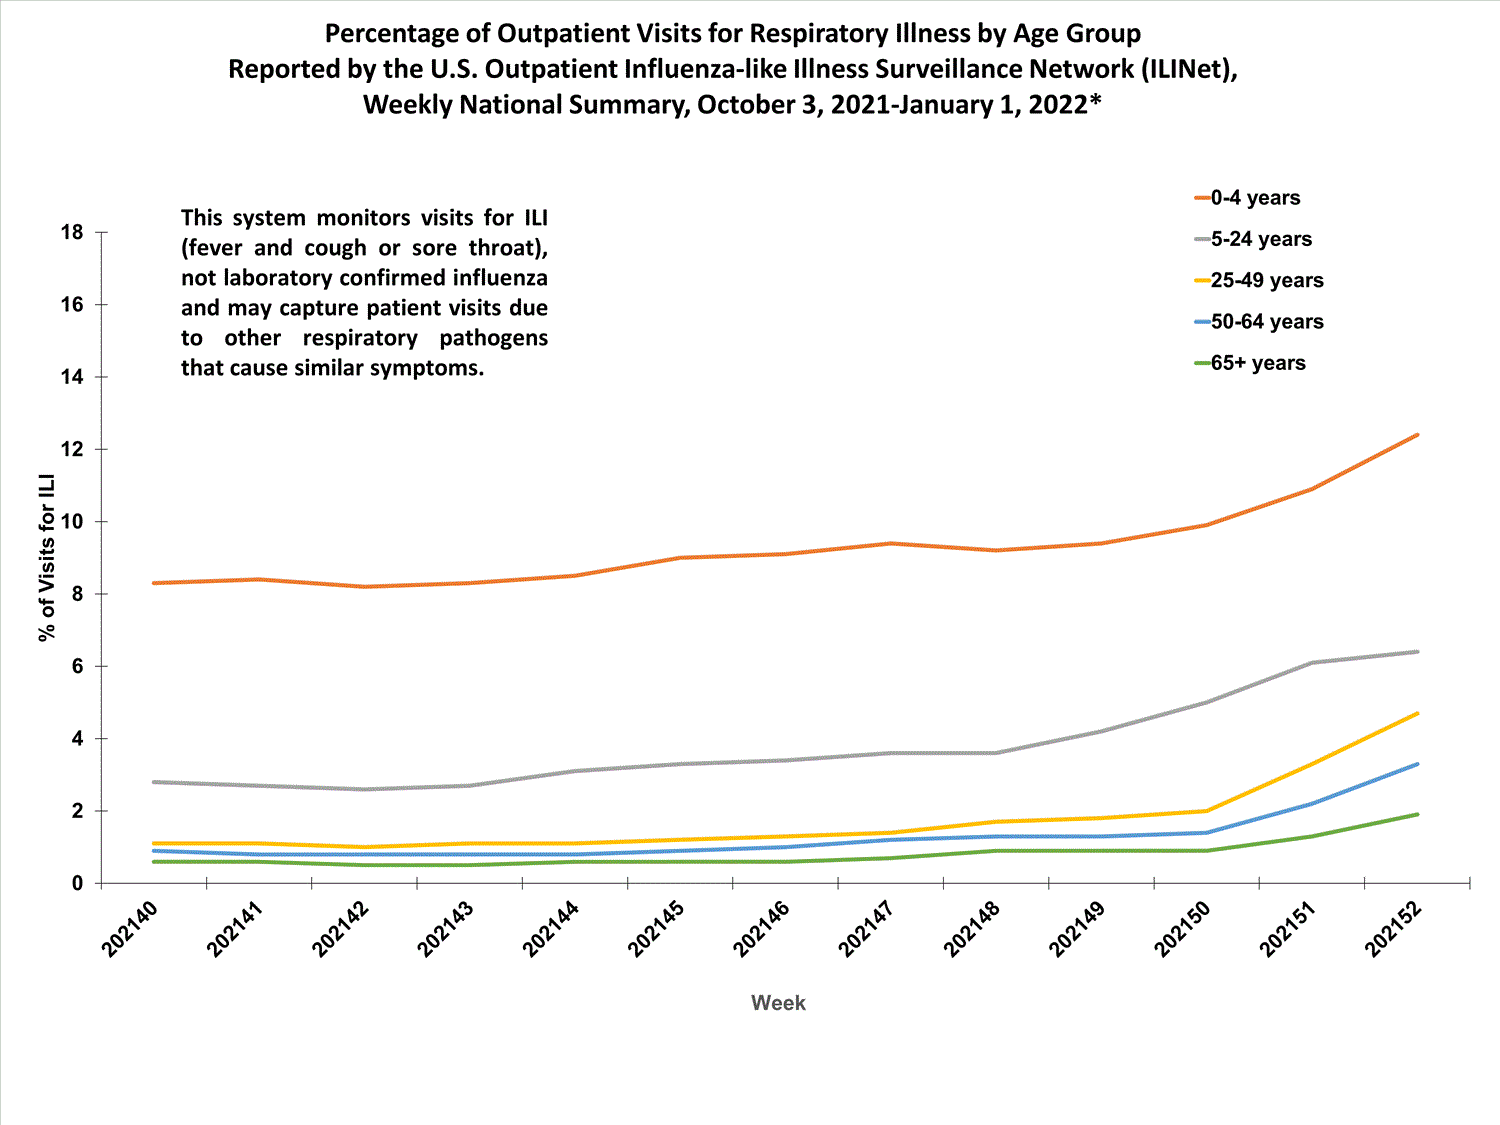
The percentages of visits for ILI reported in ILINet are decreasing among all age groups (0-4 years, 5-24 years, 25-49 years, 50-64 years, and 65+ years).


View Chart Data | View Full ScreenILI Activity Map


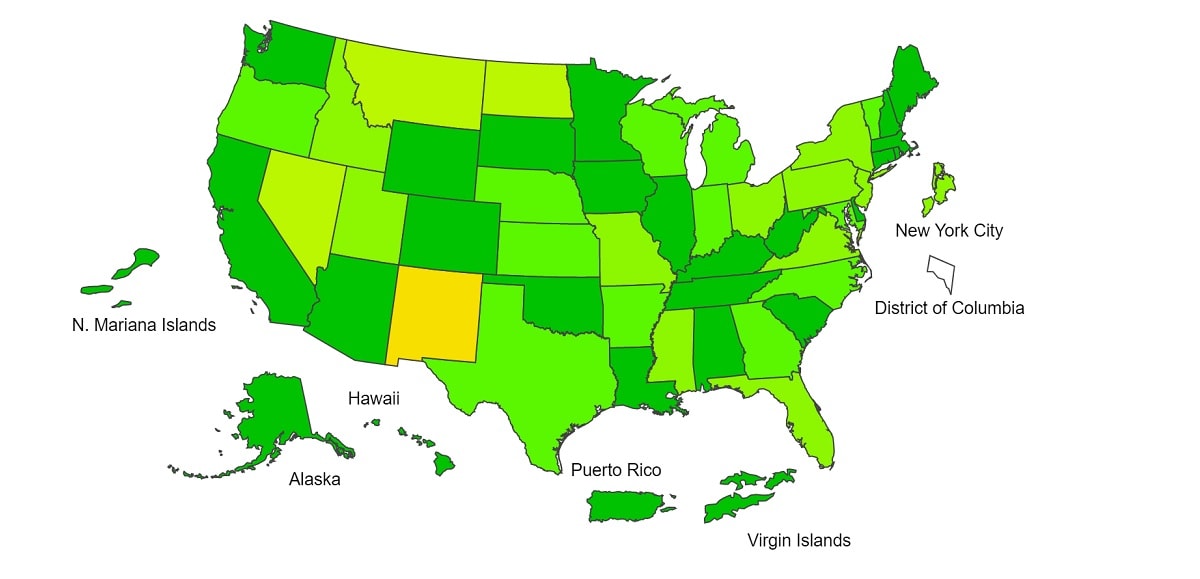
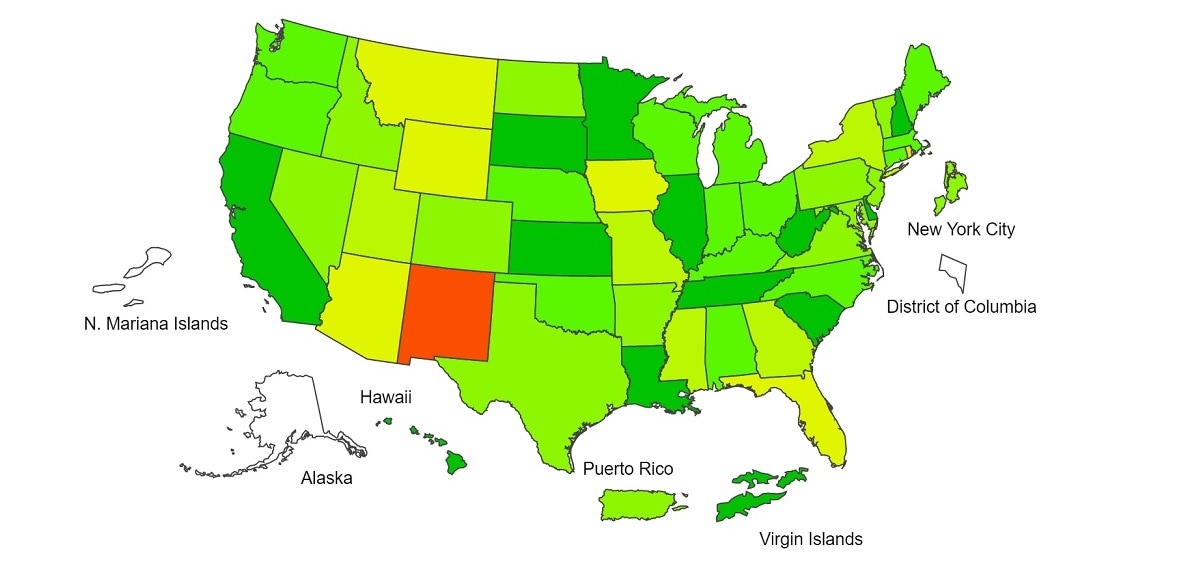
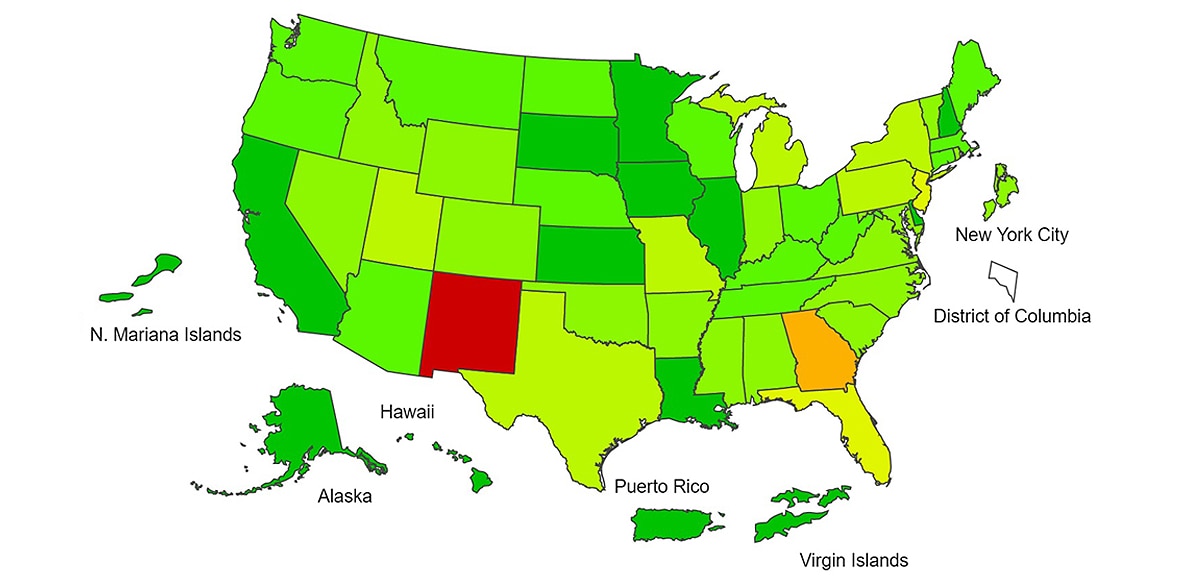
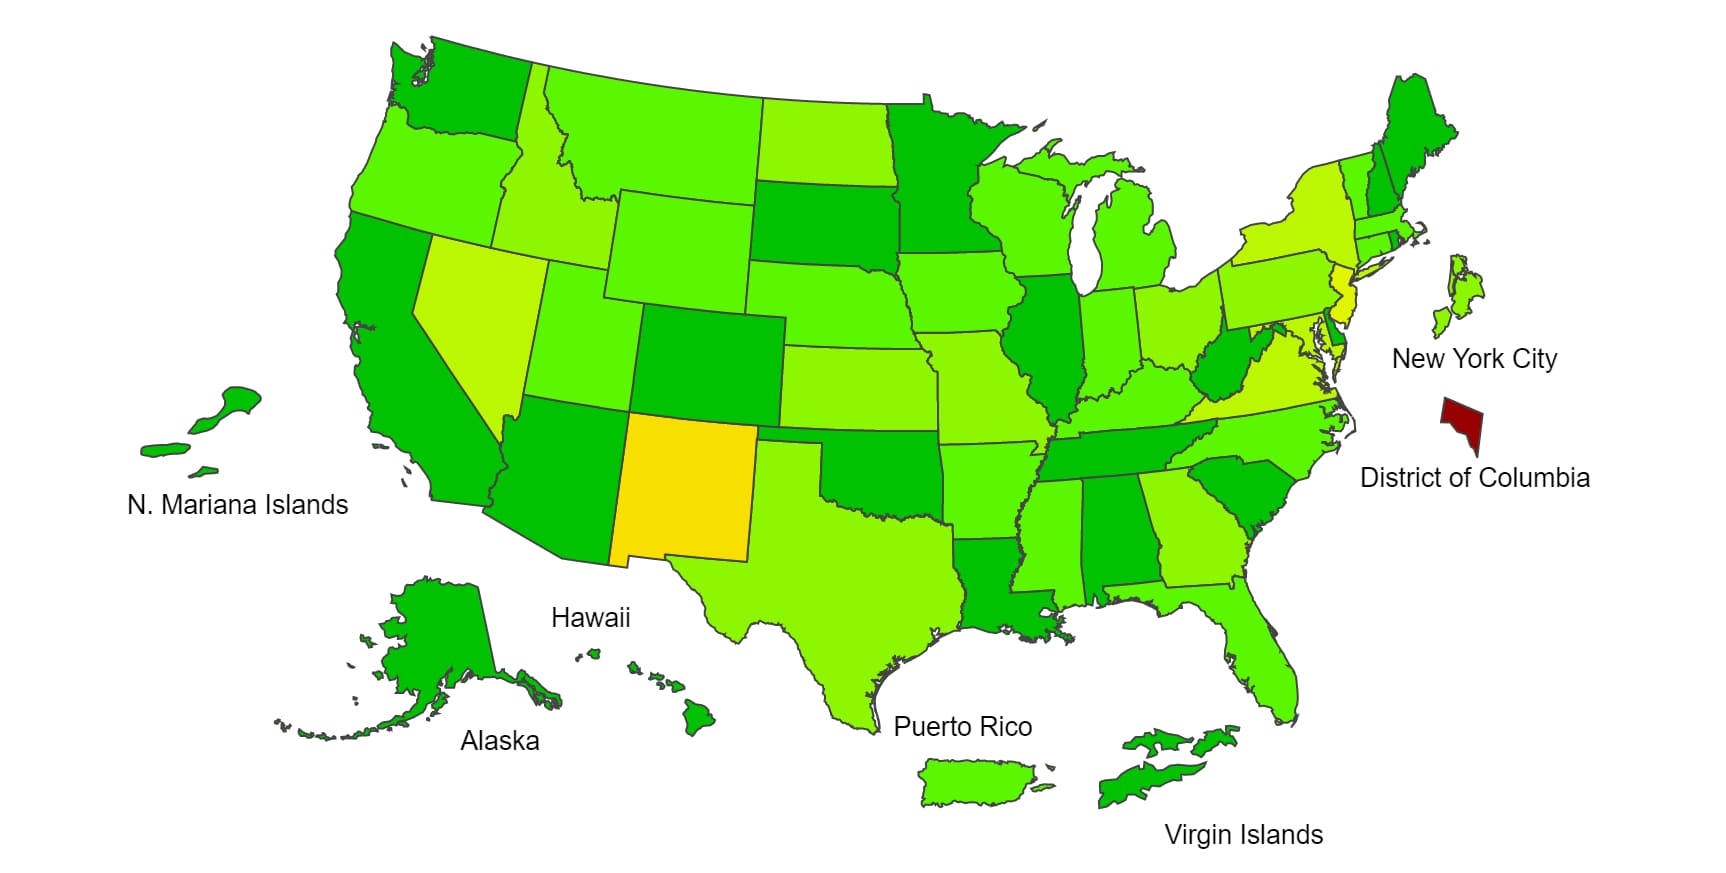
Data collected in ILINet are used to produce a measure of ILI activity* by state/jurisdiction and Core Based Statistical Areas (CBSA).
Week 39
(Week ending
Oct. 2, 2021)
Week 38
(Week ending
Sep. 25, 2021)
Week 39
(Week ending
Oct. 2, 2021)
Week 38
(Week ending
Sep. 25, 2021)
Very High0000
High0177
Moderate101632
Low10107471
Minimal4244474495
Insufficient Data20358324


*Data collected in ILINet may disproportionally represent certain populations within a jurisdiction or CBSA, and therefore, may not accurately depict the full picture of influenza activity for the entire jurisdiction or CBSA. Differences in the data presented here by CDC and independently by some health departments likely represent differing levels of data completeness with data presented by the health department likely being the more complete.
Additional information about medically attended visits for ILI for current and past seasons:
Surveillance Methods | FluView Interactive: National, Regional, and State Data or ILI Activity Map
Influenza-Associated Hospitalizations:


The Influenza Hospitalization Surveillance Network (FluSurv-NET) conducts population-based surveillance for laboratory-confirmed influenza-related hospitalizations in select counties in 14 states and represents approximately 9% of the U.S. population. As in previous seasons, patients admitted for laboratory-confirmed influenza-related hospitalization after April 30, 2021, will not be included in FluSurv-NET. Data on patients admitted through April 30, 2021, will continue to be updated as additional information is received.
Additional hospitalization surveillance information for current and past seasons and additional age groups:
Surveillance Methods | FluView Interactive: Rates by Age or Patient Characteristics
National Center for Health Statistics (NCHS) Mortality Surveillance


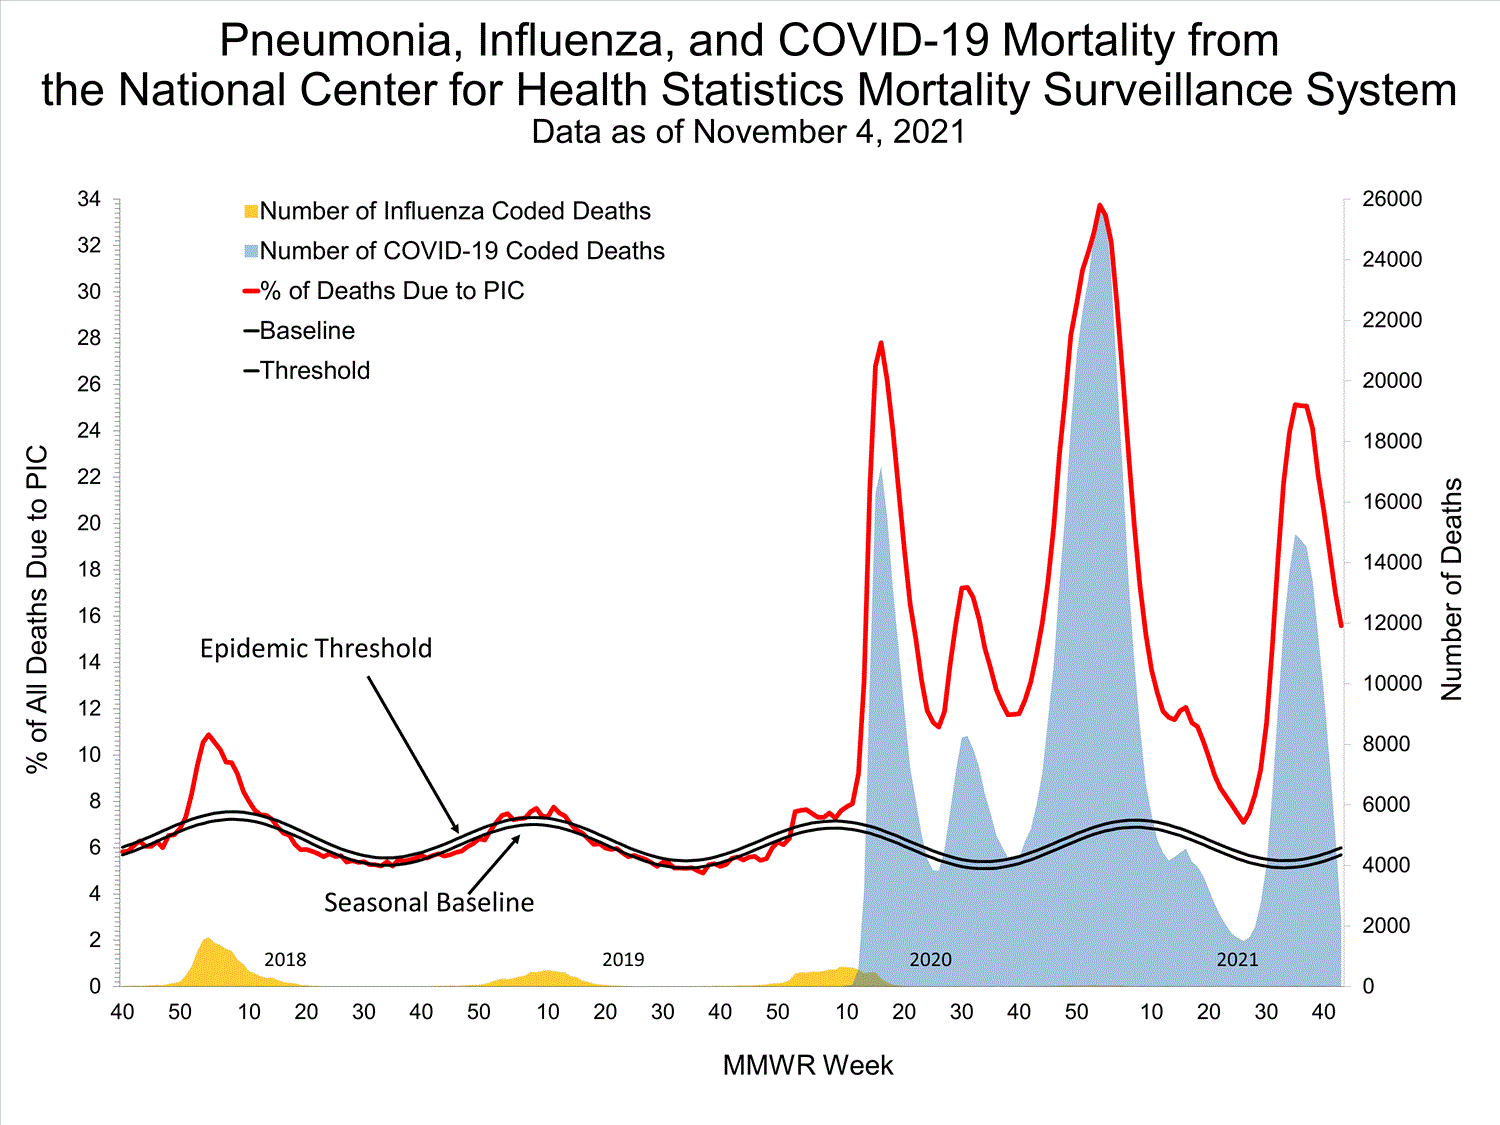
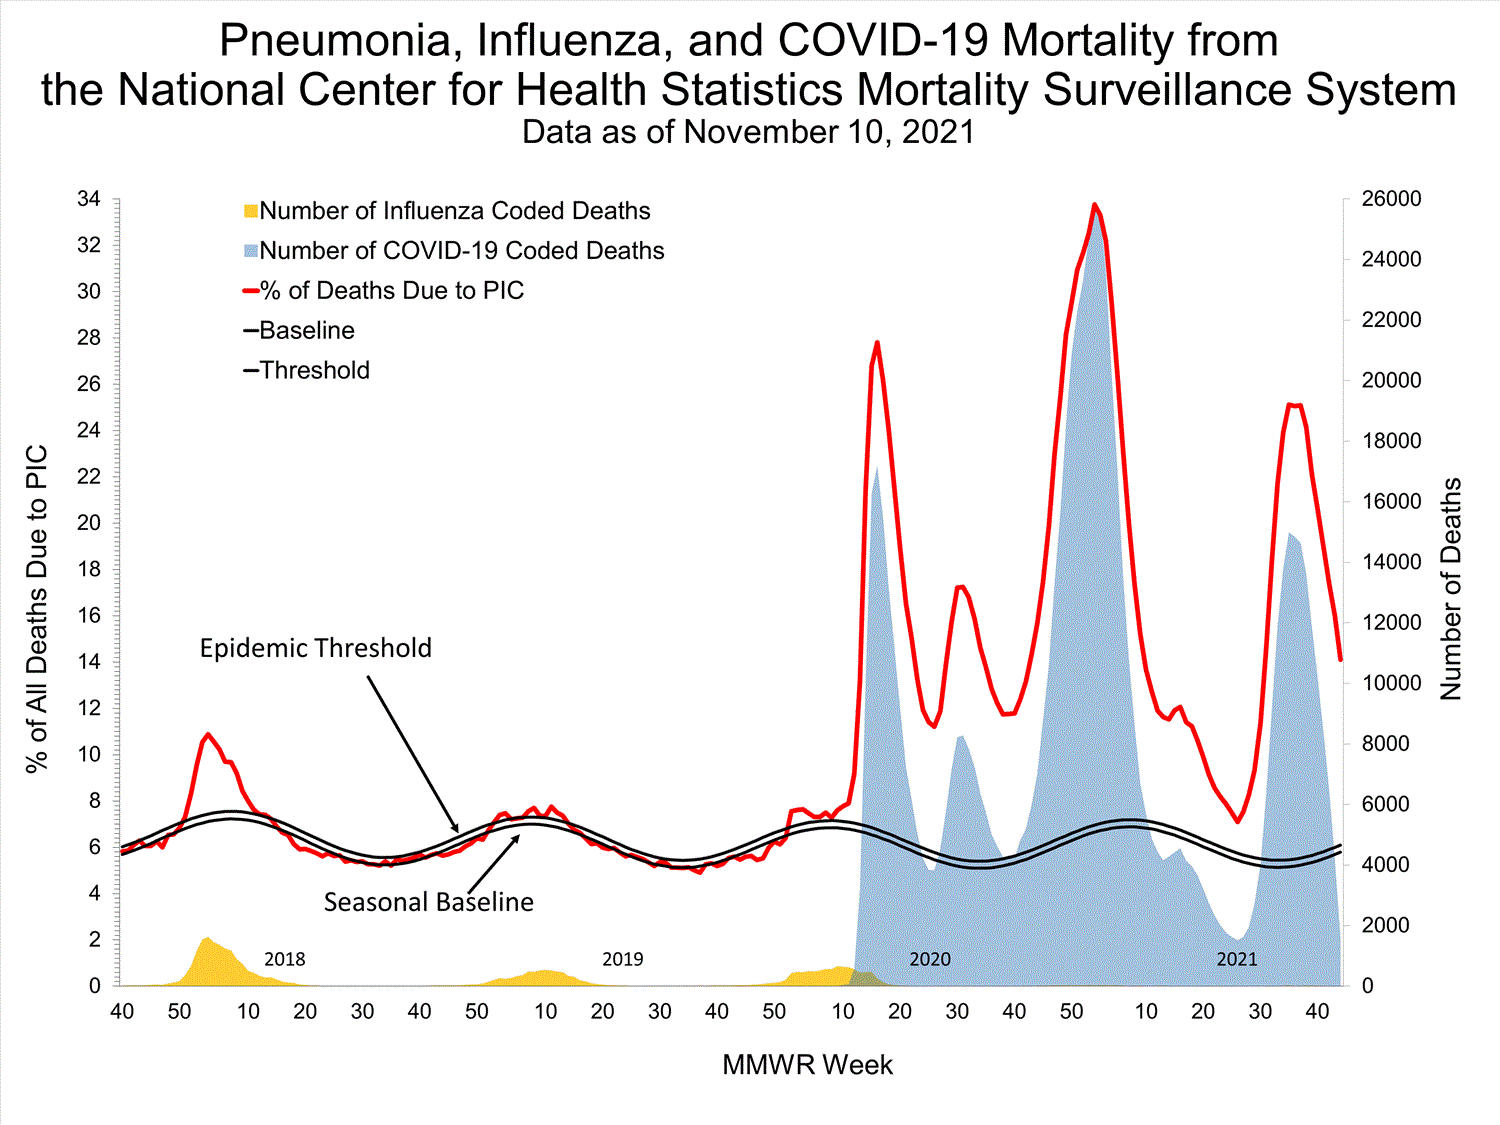
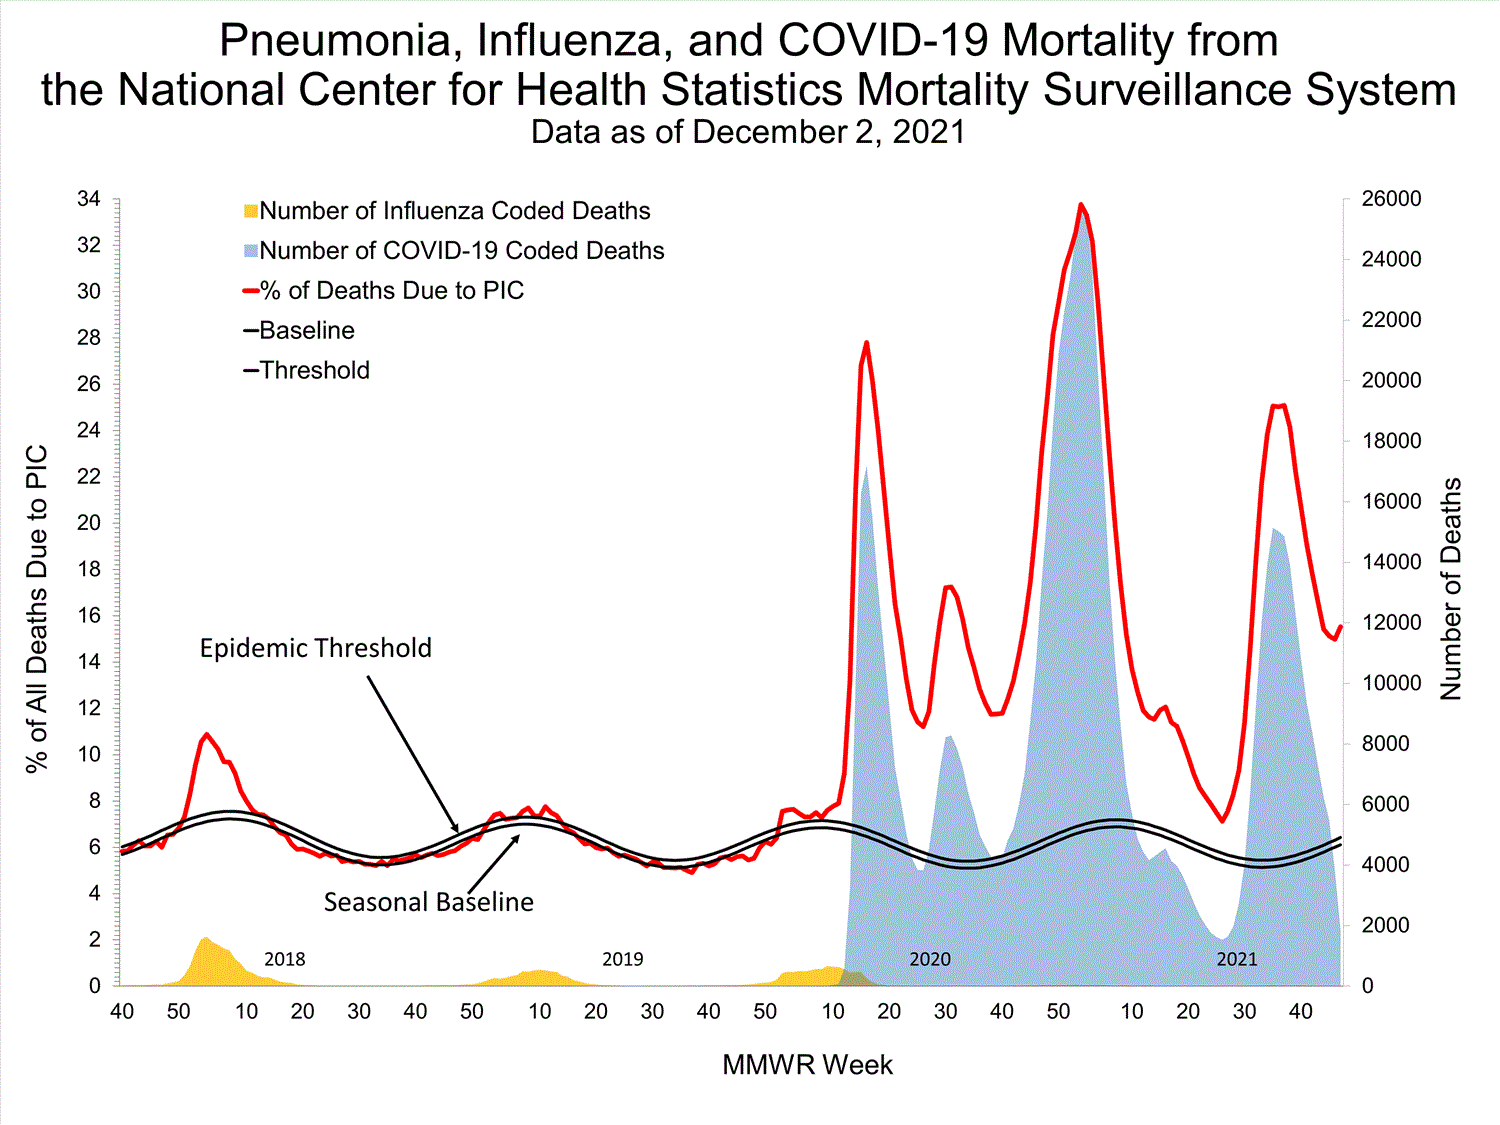
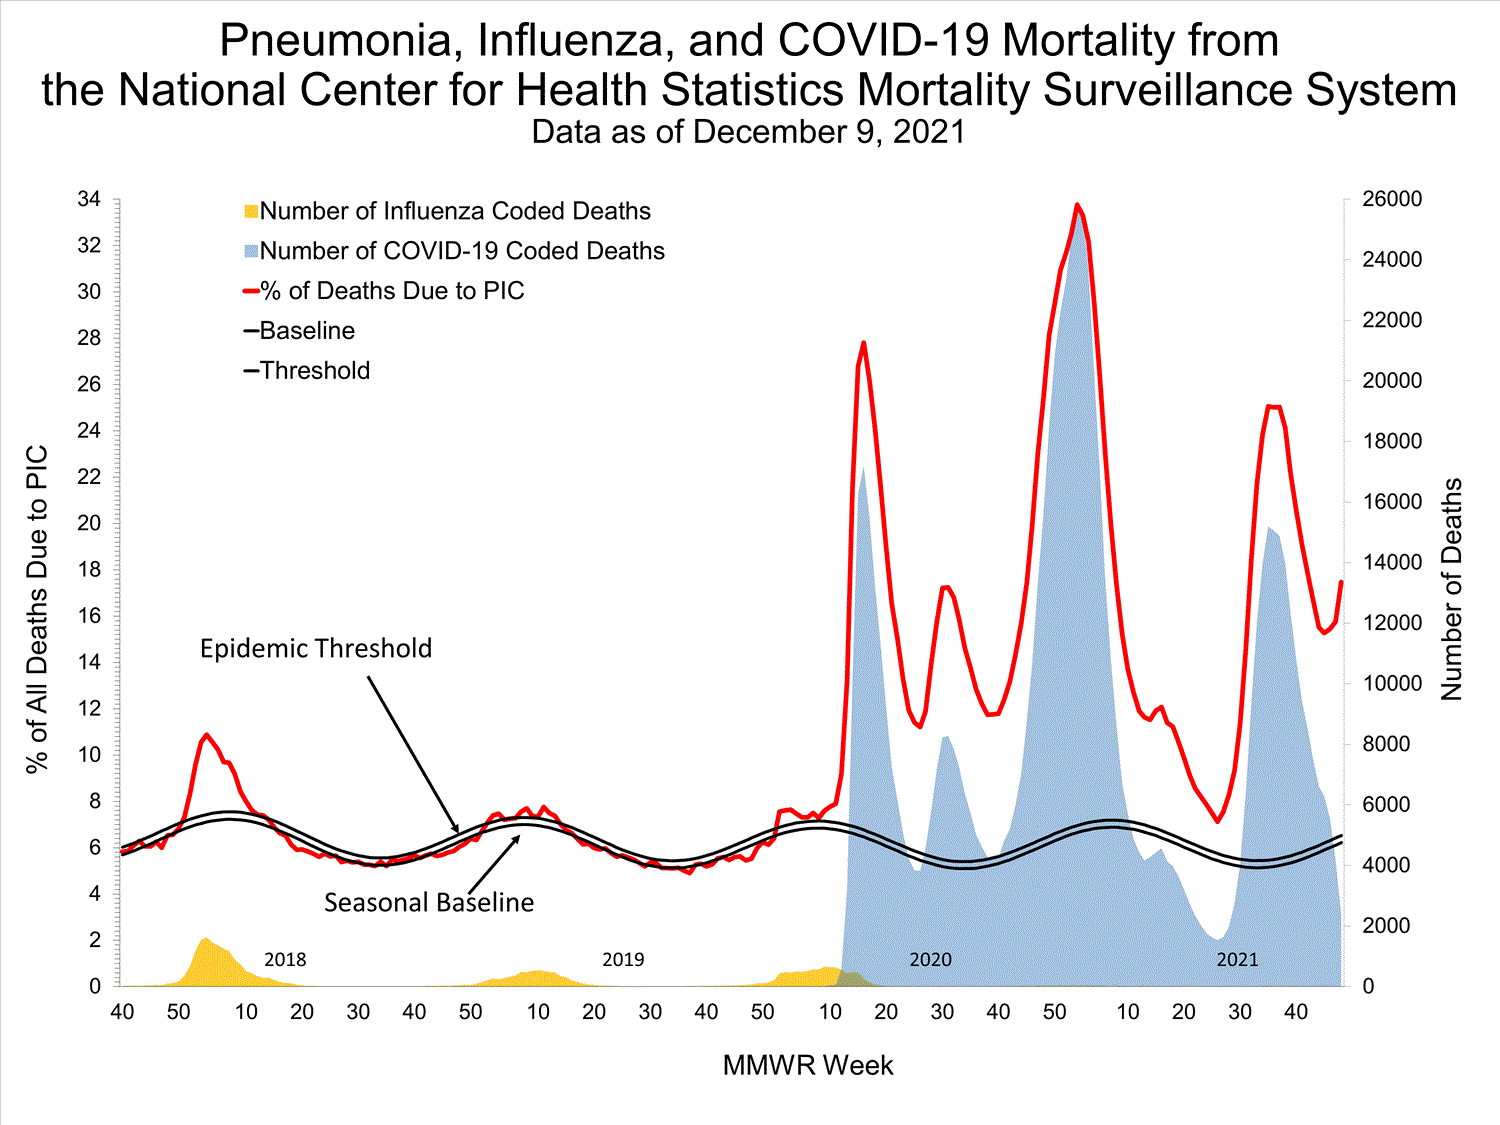
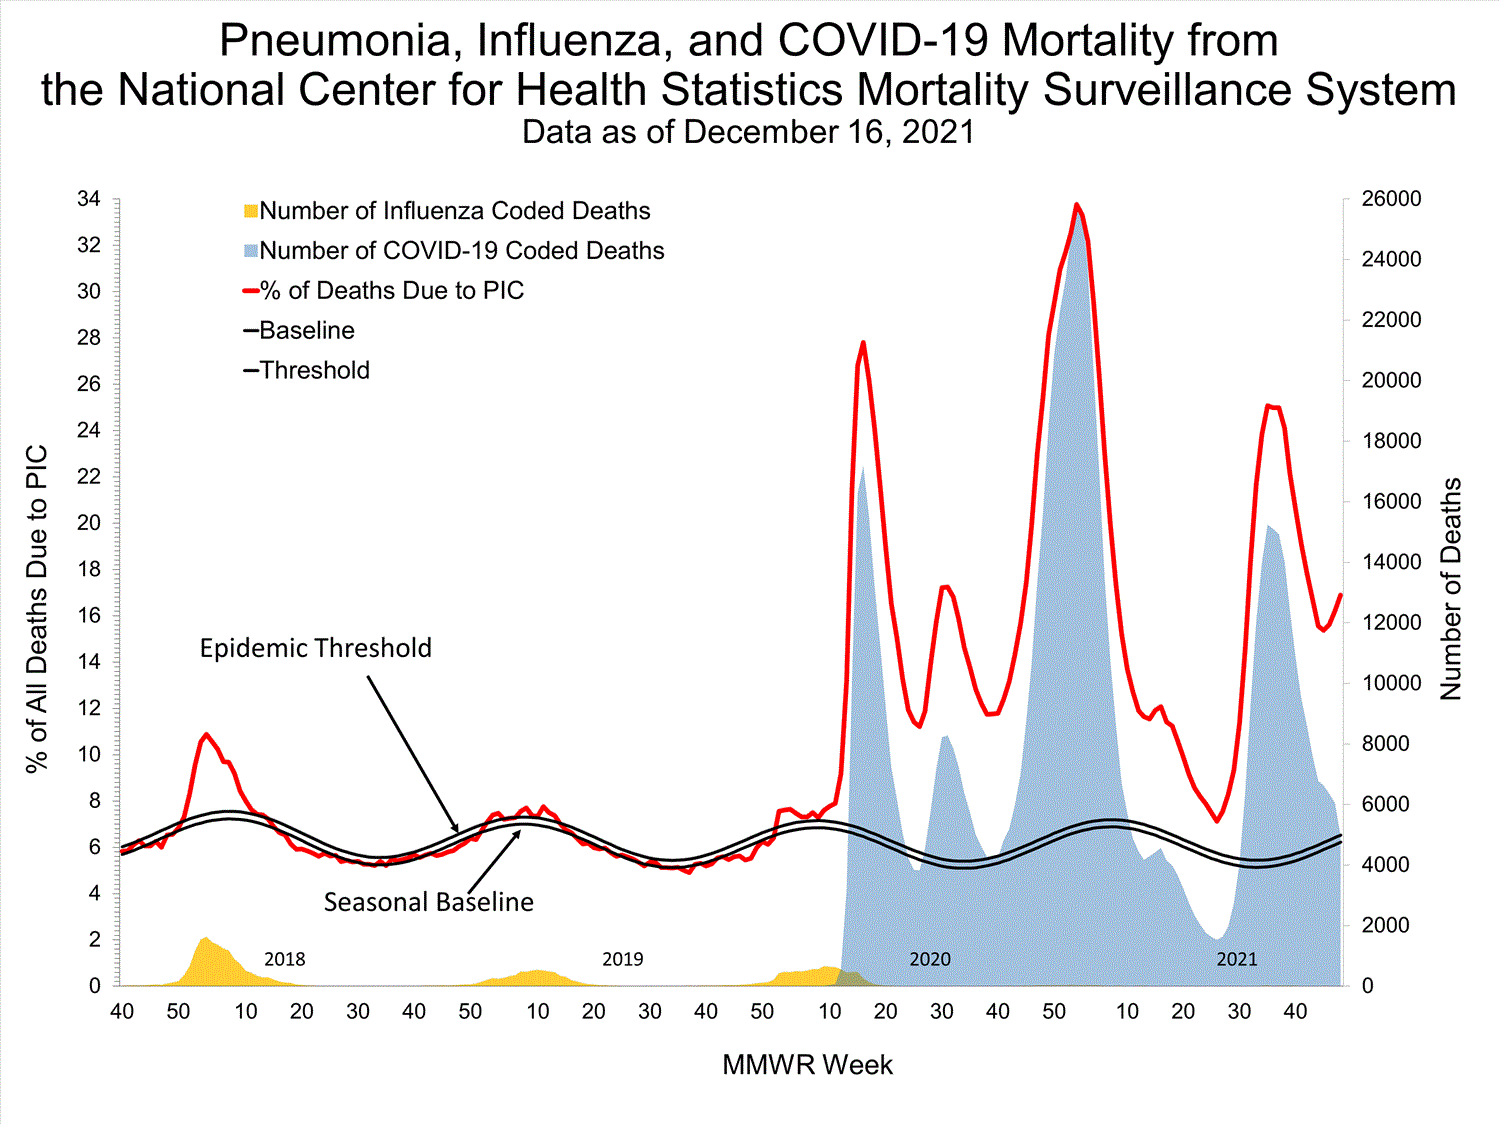
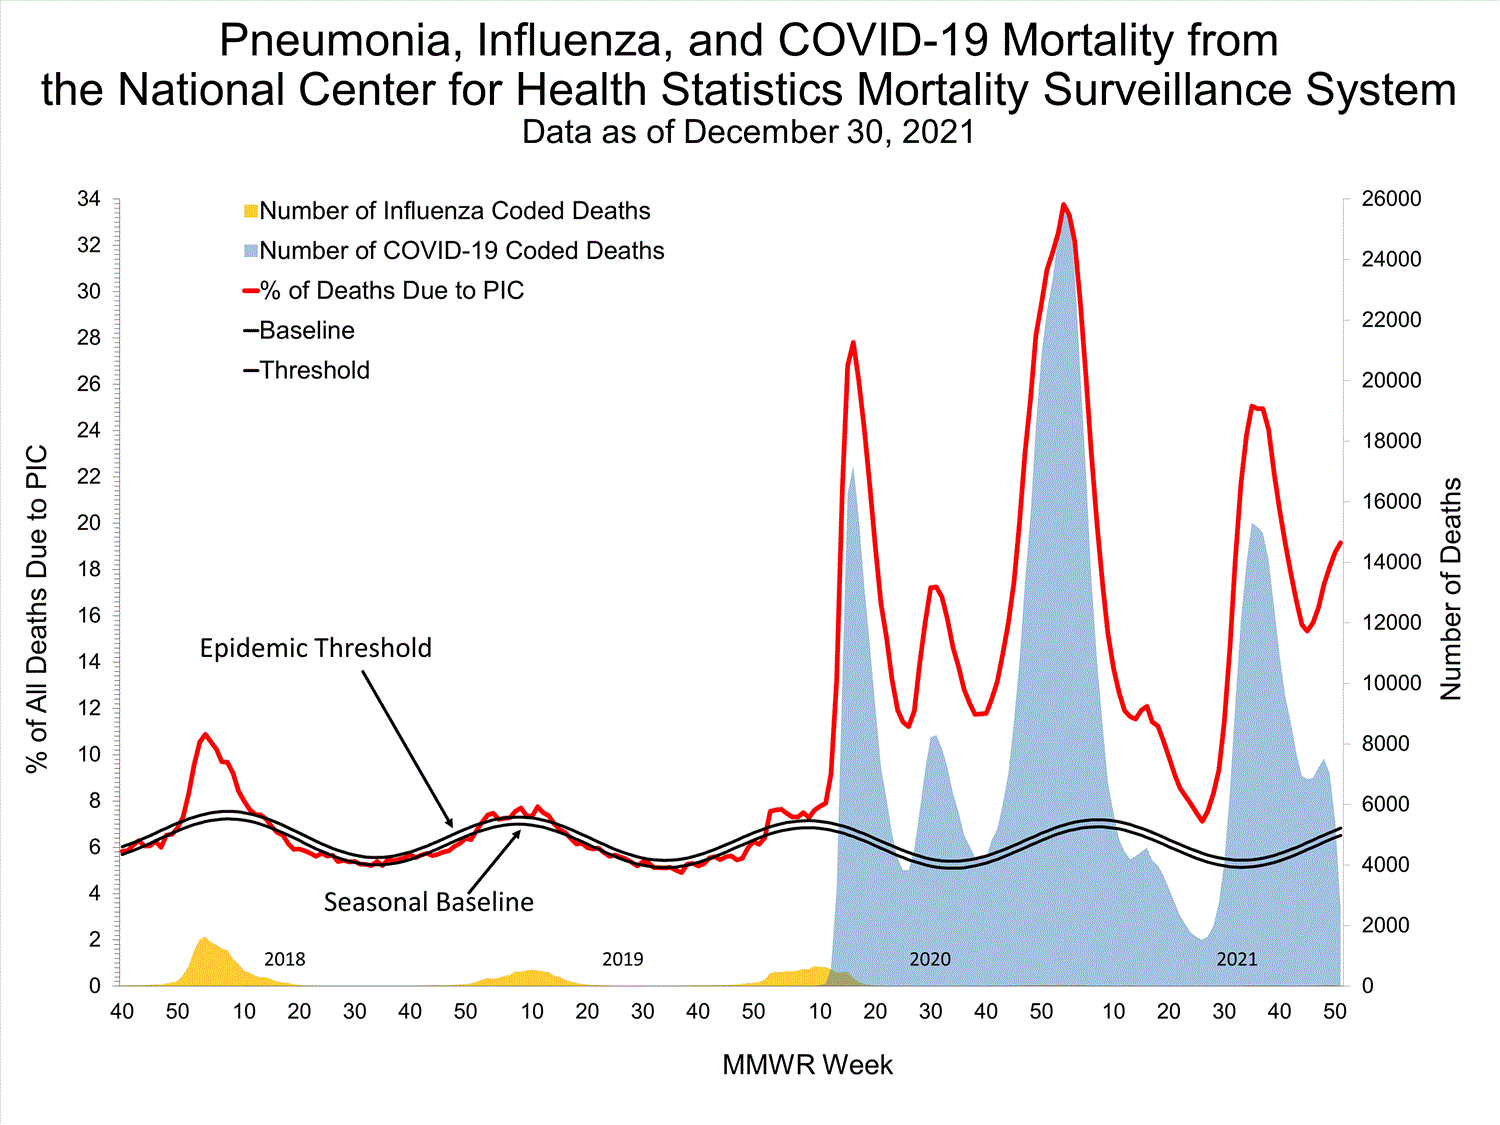
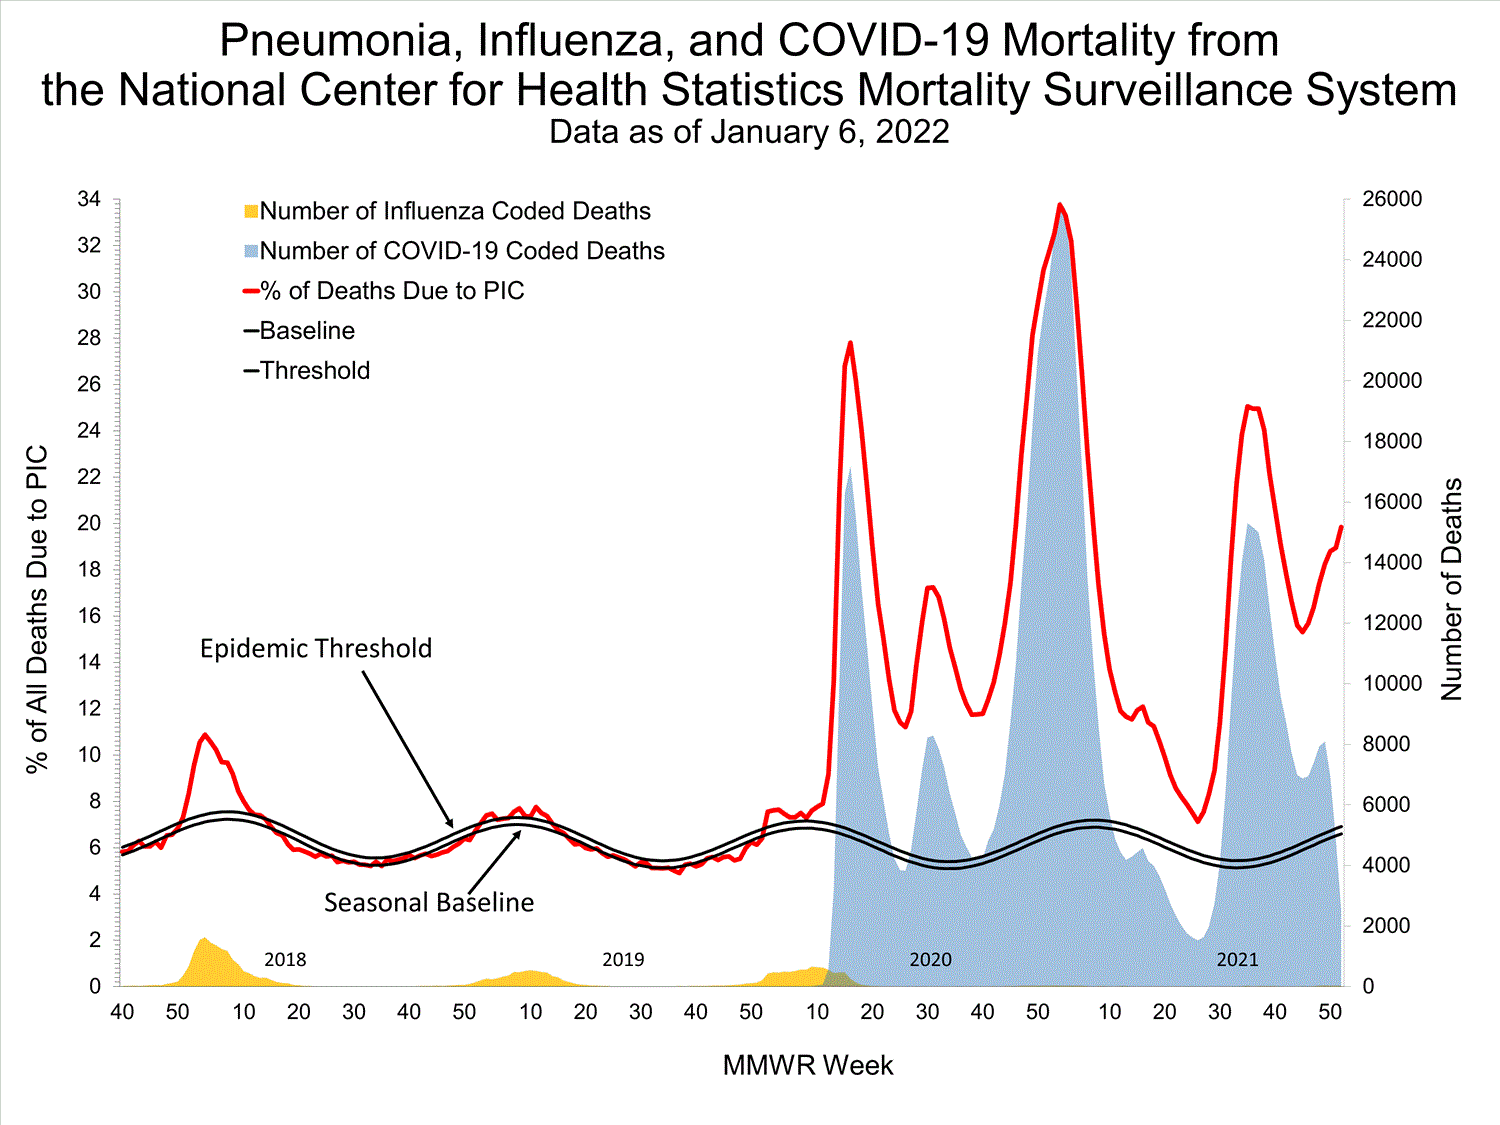
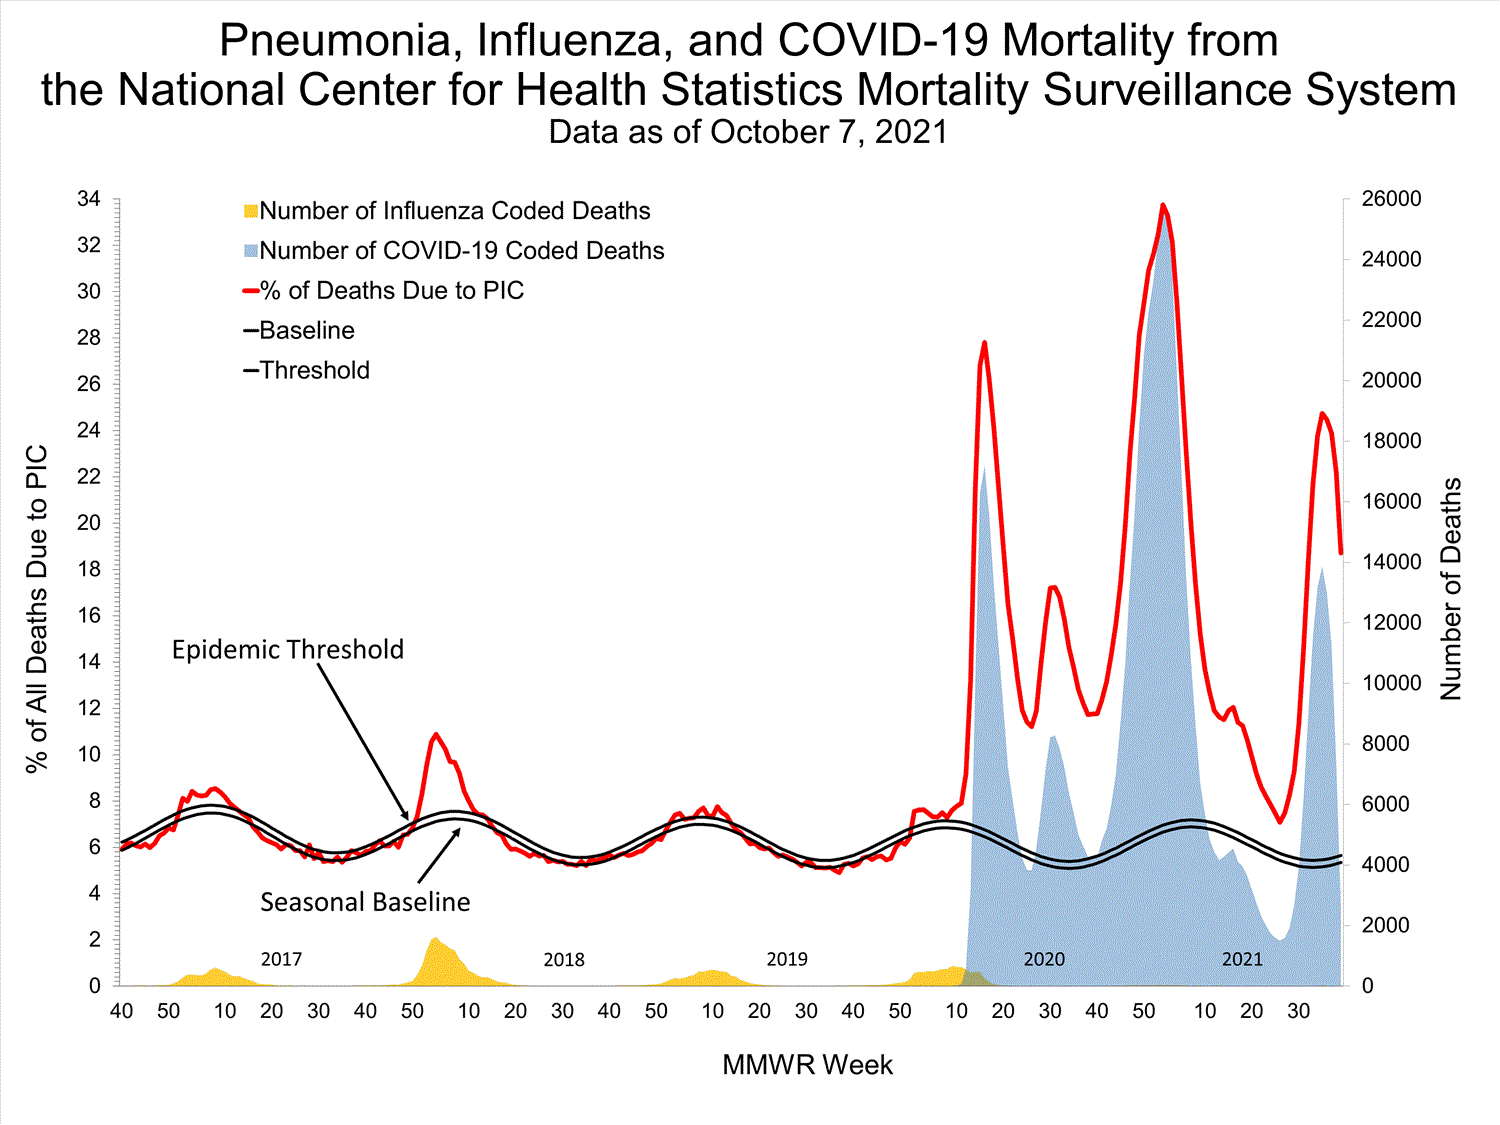
Based on NCHS mortality surveillance data available on October 7, 2021, 18.7% of the deaths that occurred during the week ending October 2, 2021 (week 39), were due to pneumonia, influenza, and/or COVID-19 (PIC). This percentage is above the epidemic threshold of 5.7% for this week. Among the 3,296 PIC deaths reported for this week, 2,607 had COVID-19 listed as an underlying or contributing cause of death on the death certificate, and four listed influenza, indicating that current PIC mortality is due primarily to COVID-19 and not influenza. The data presented are preliminary and may change as more data are received and processed.


View Chart Dataexcel icon | View Full Screen
Additional pneumonia and influenza mortality surveillance information for current and past seasons:
Surveillance Methods | FluView Interactive
Influenza-Associated Pediatric Mortality


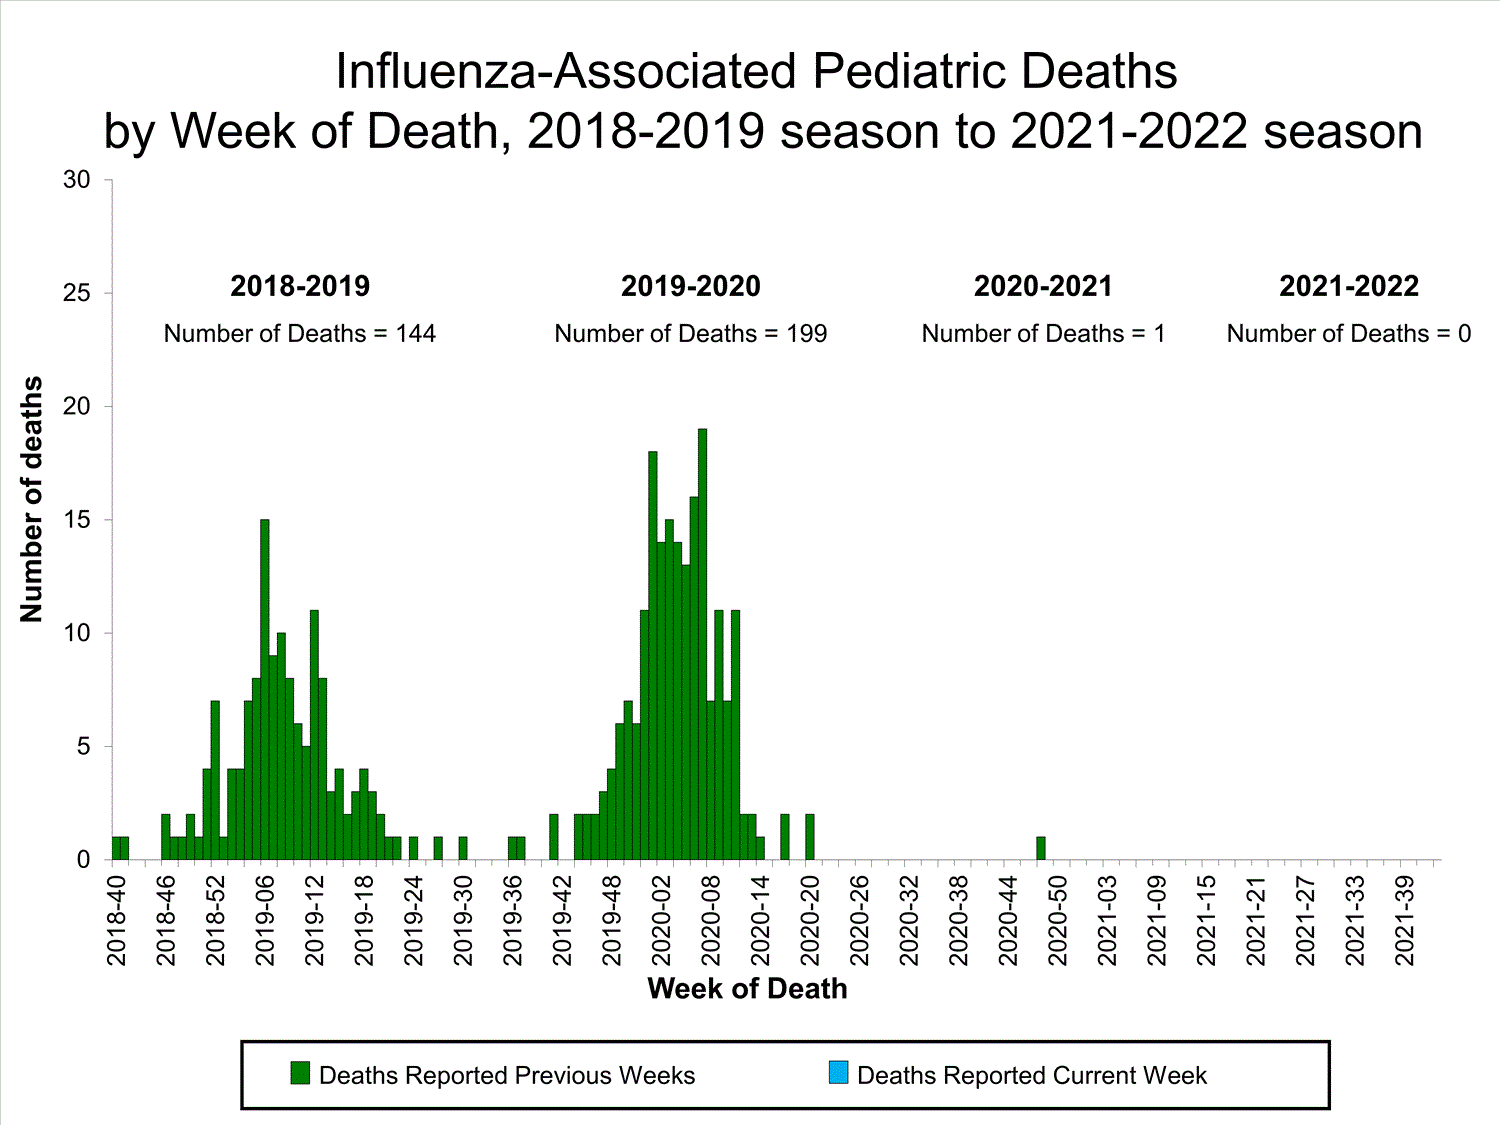
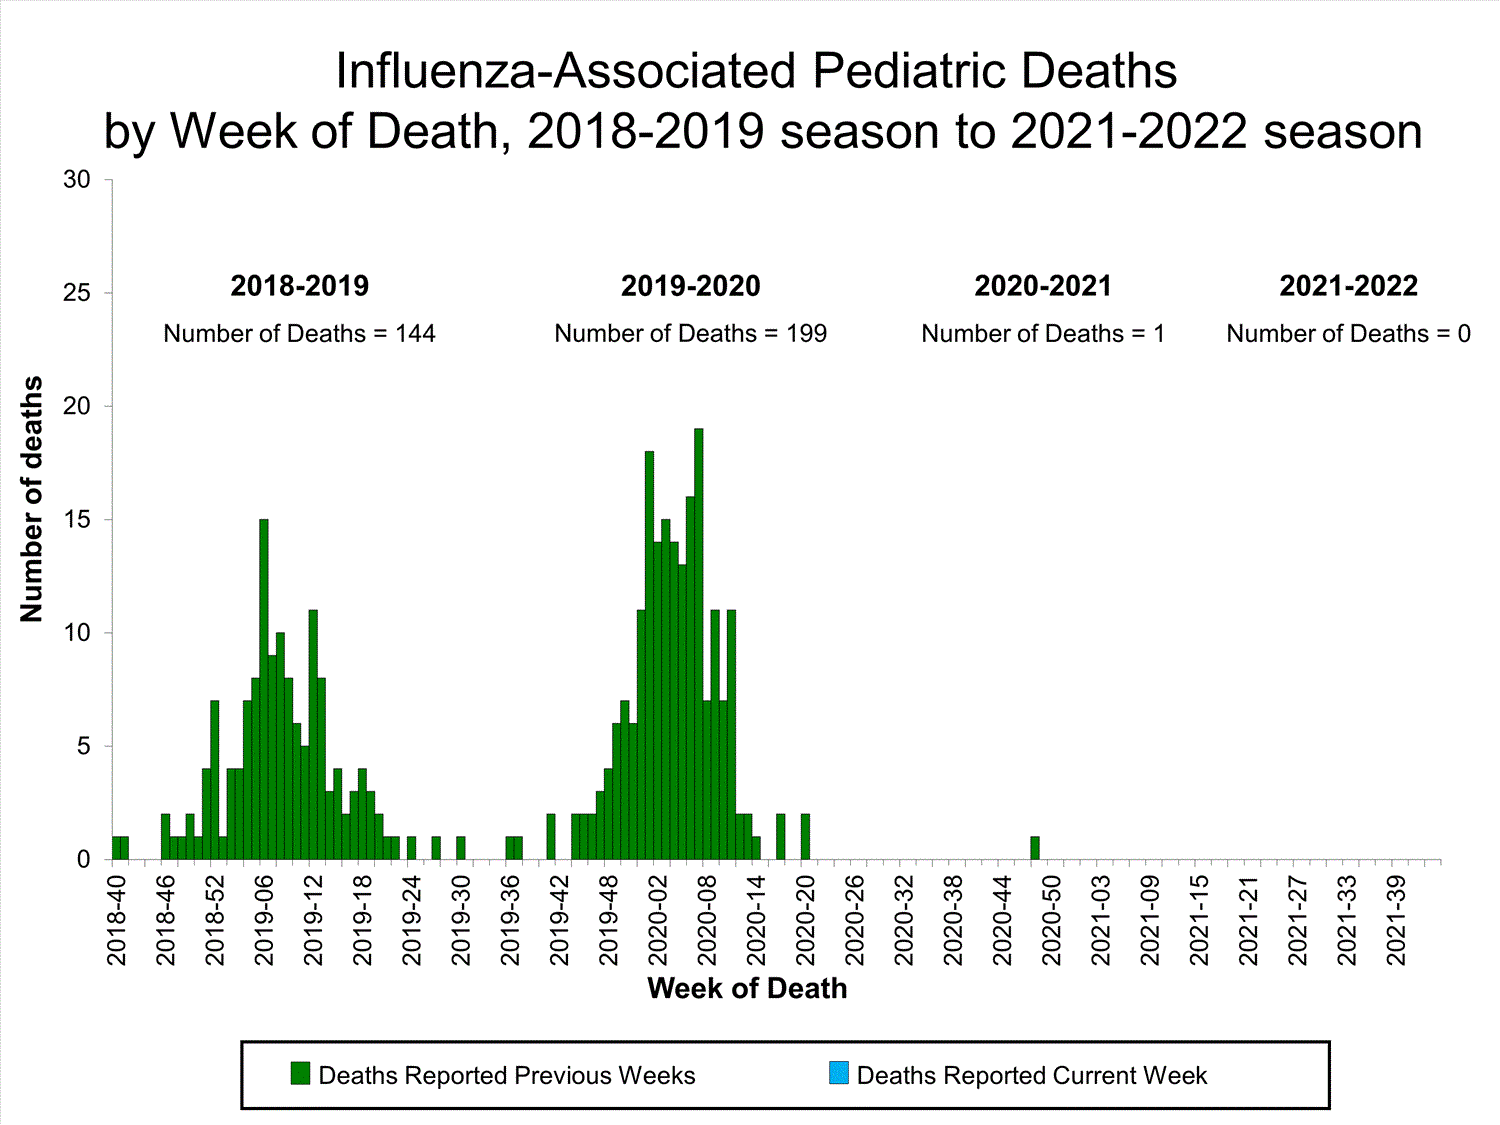
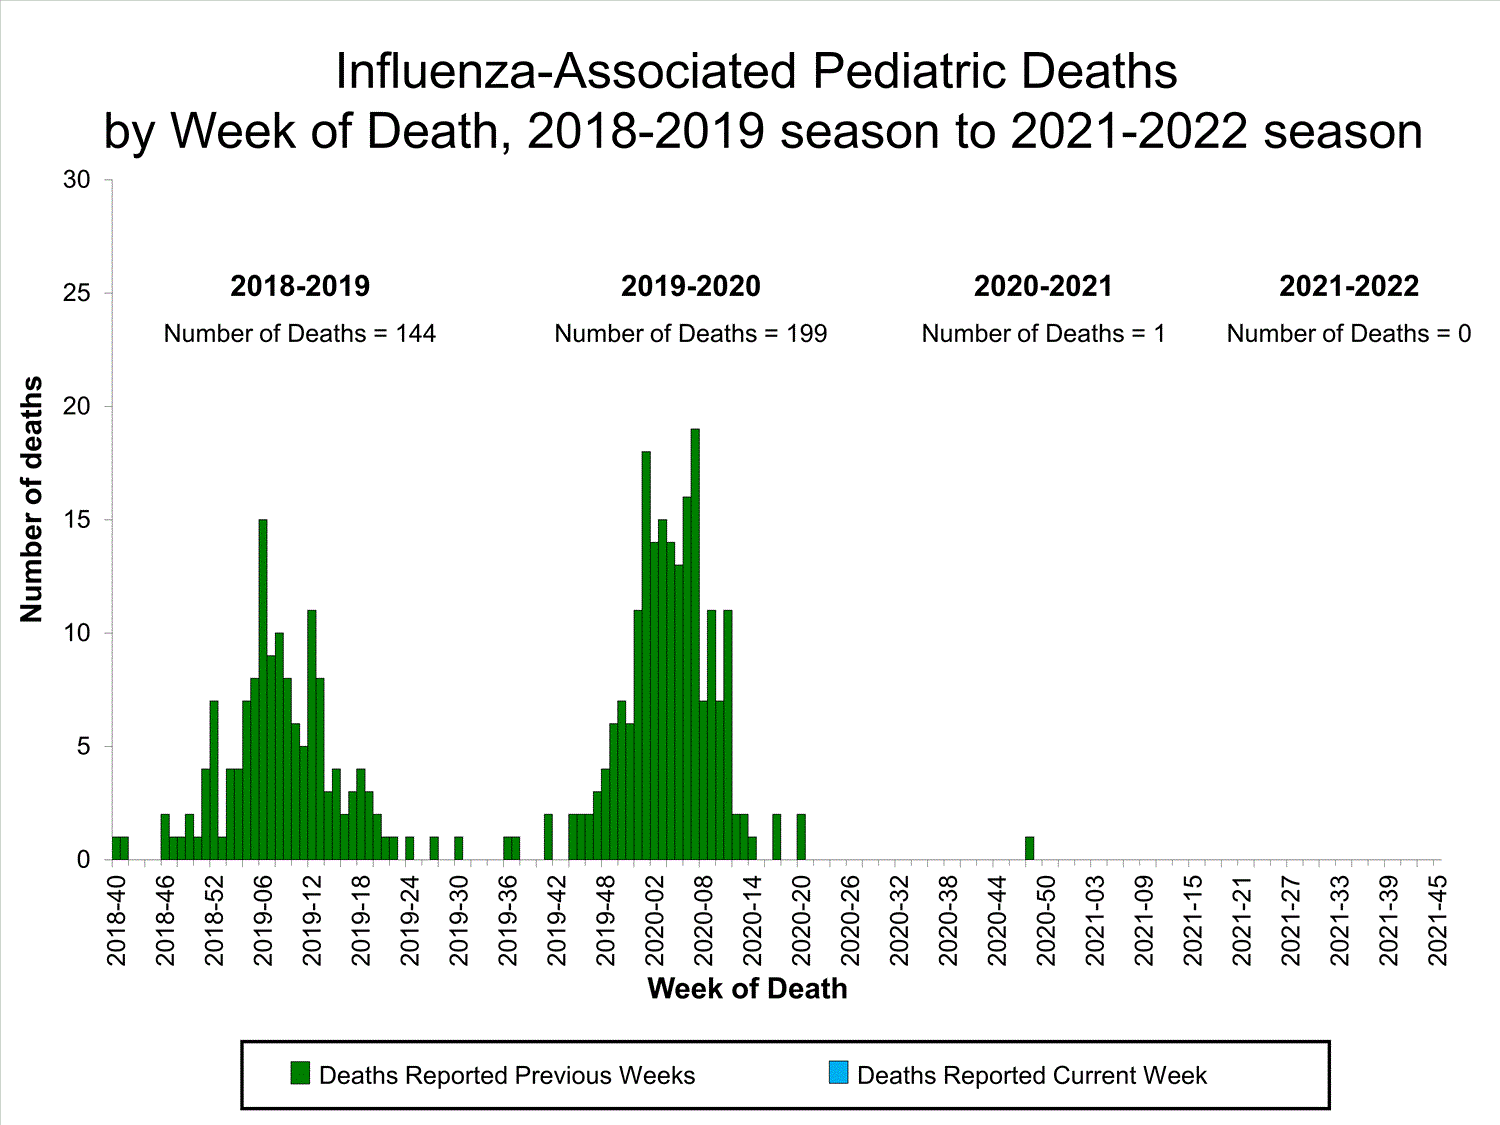
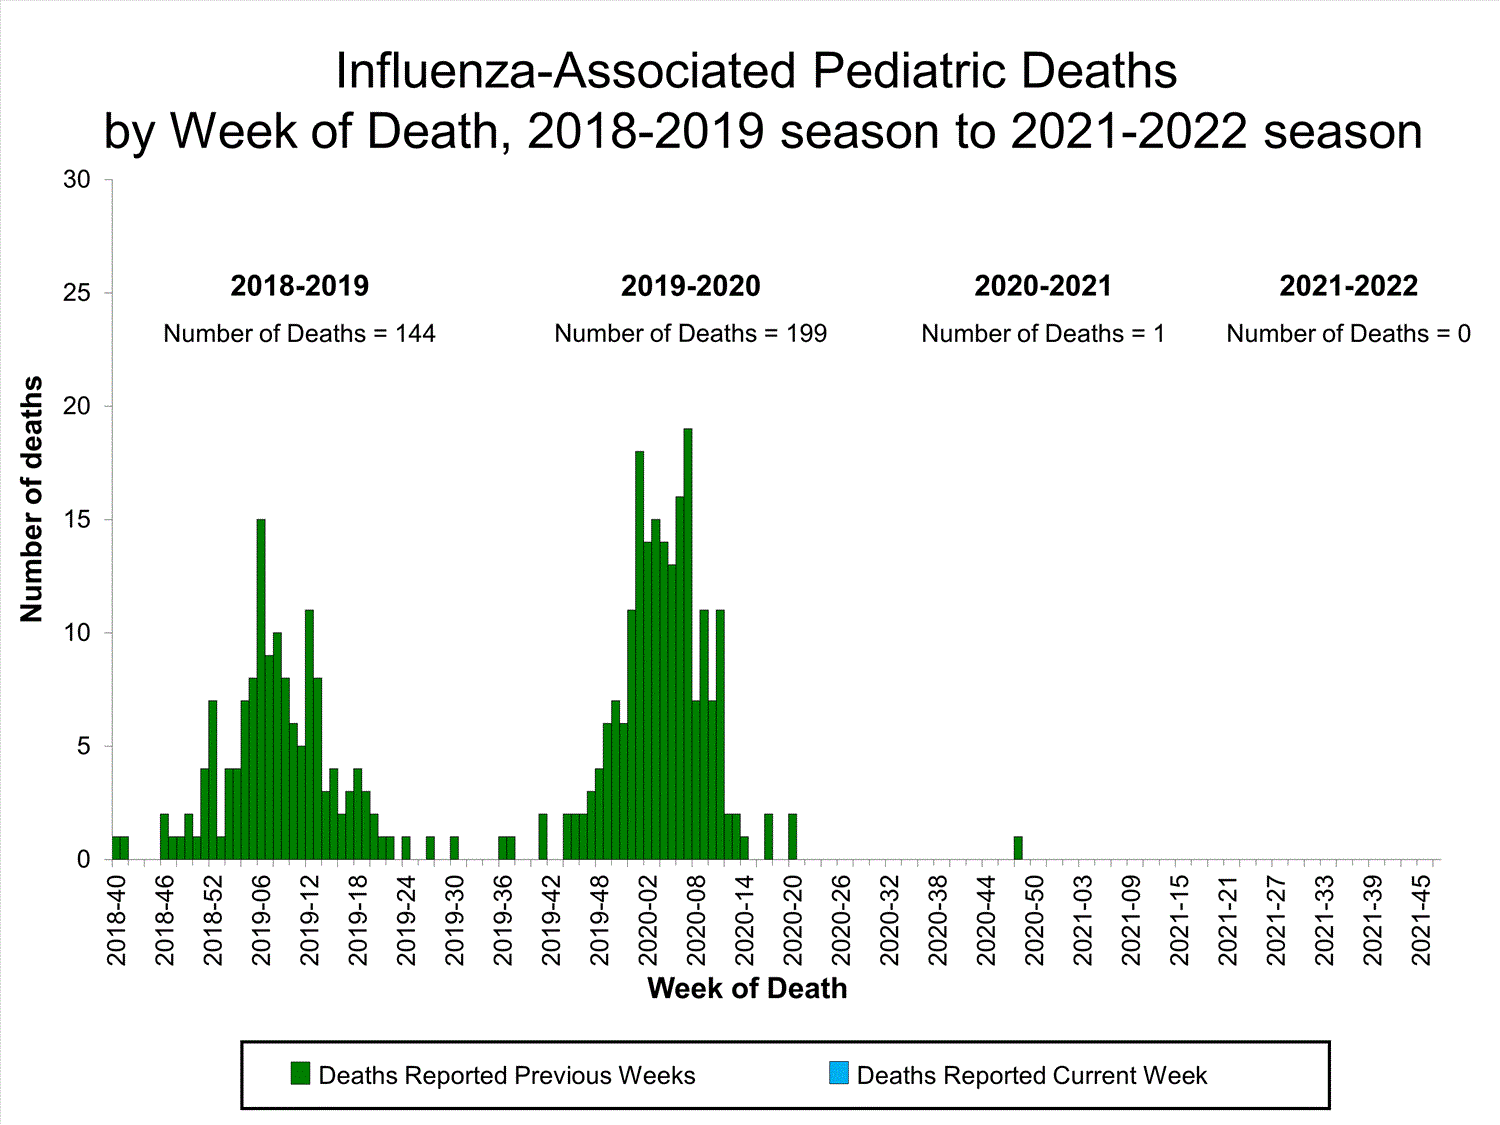
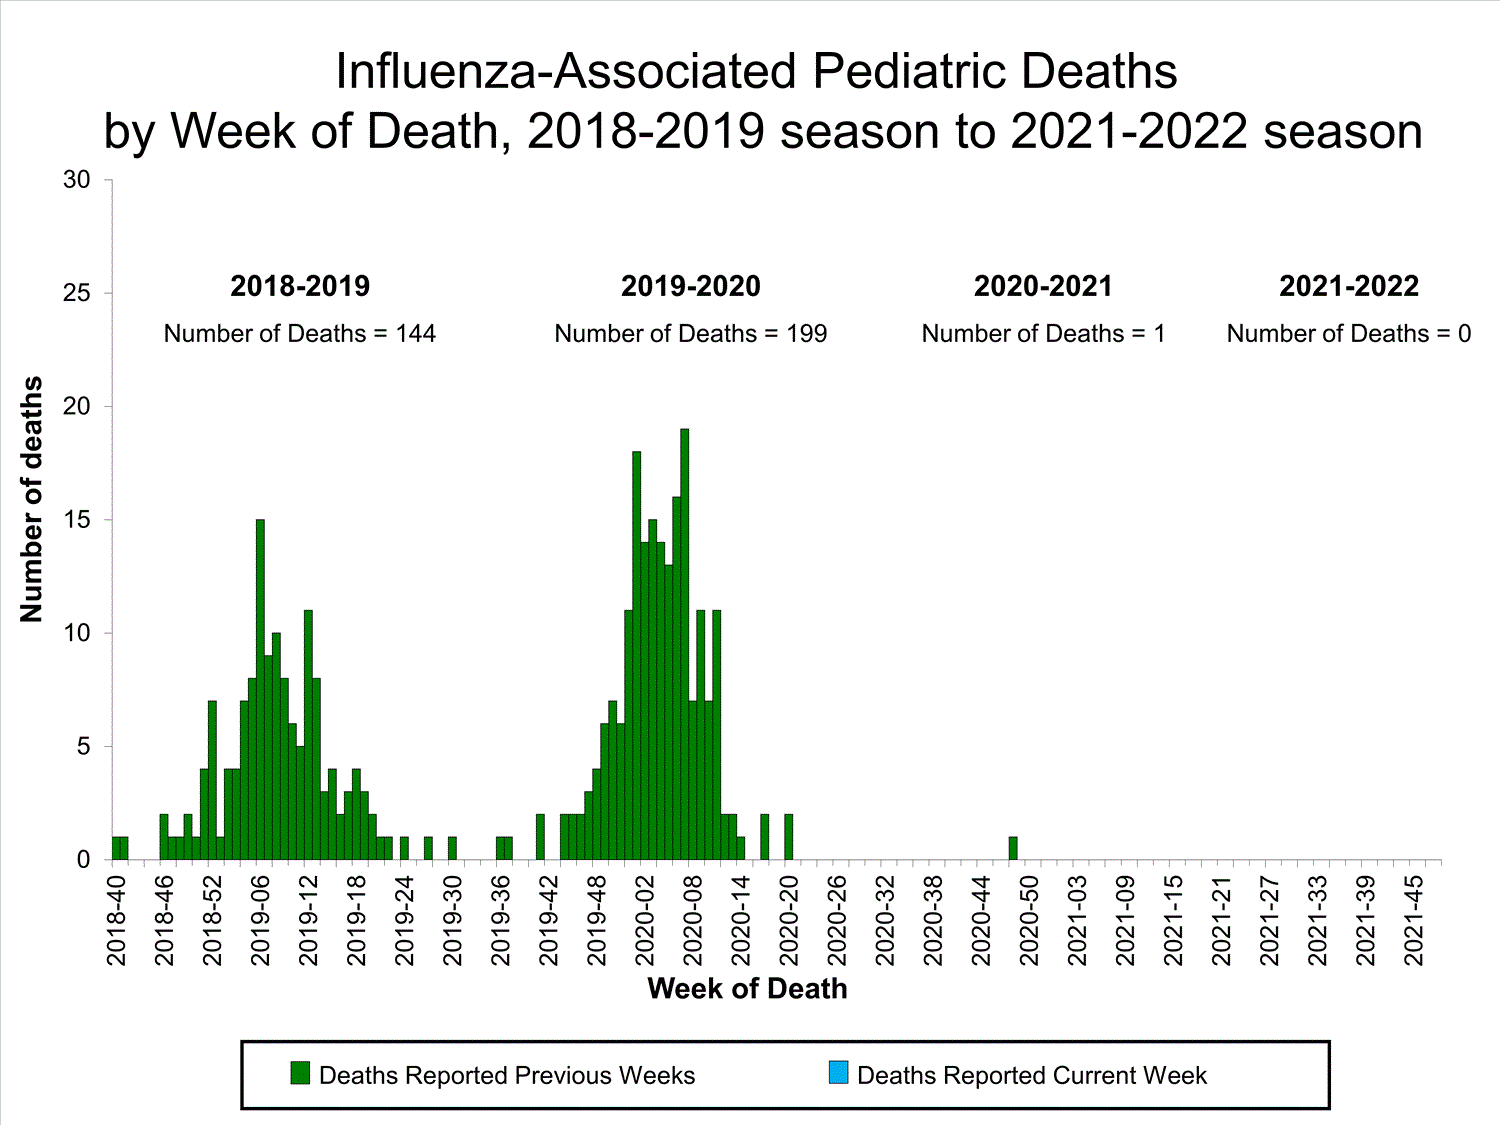
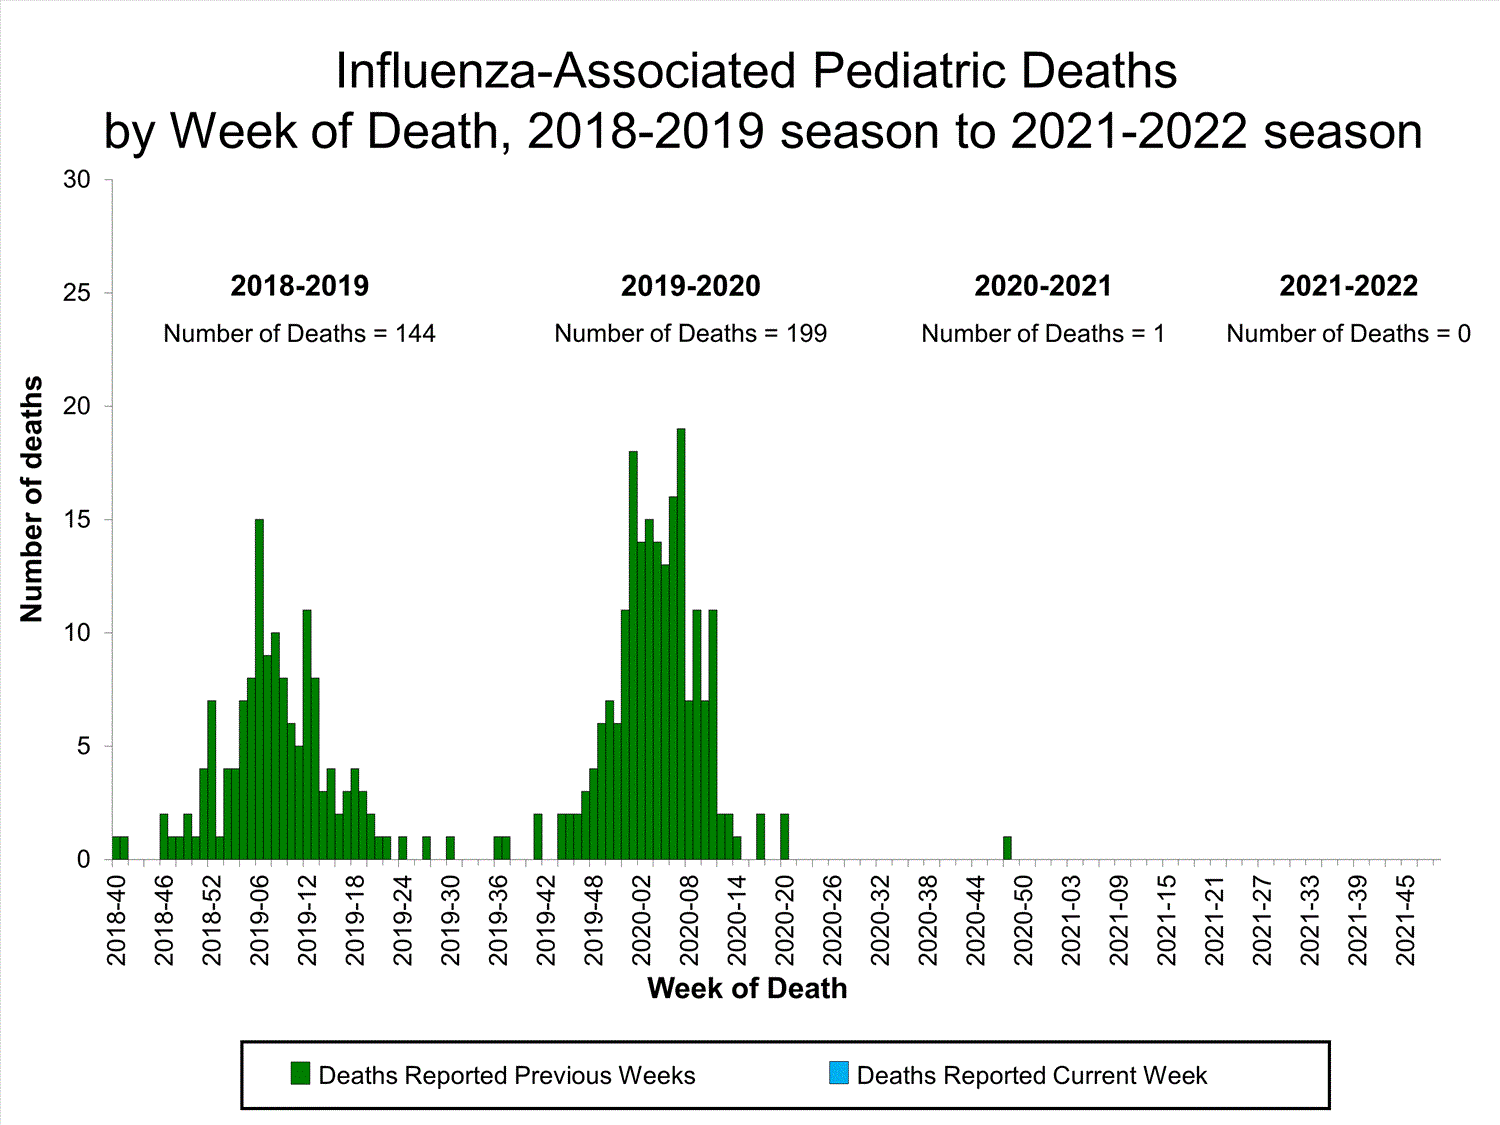
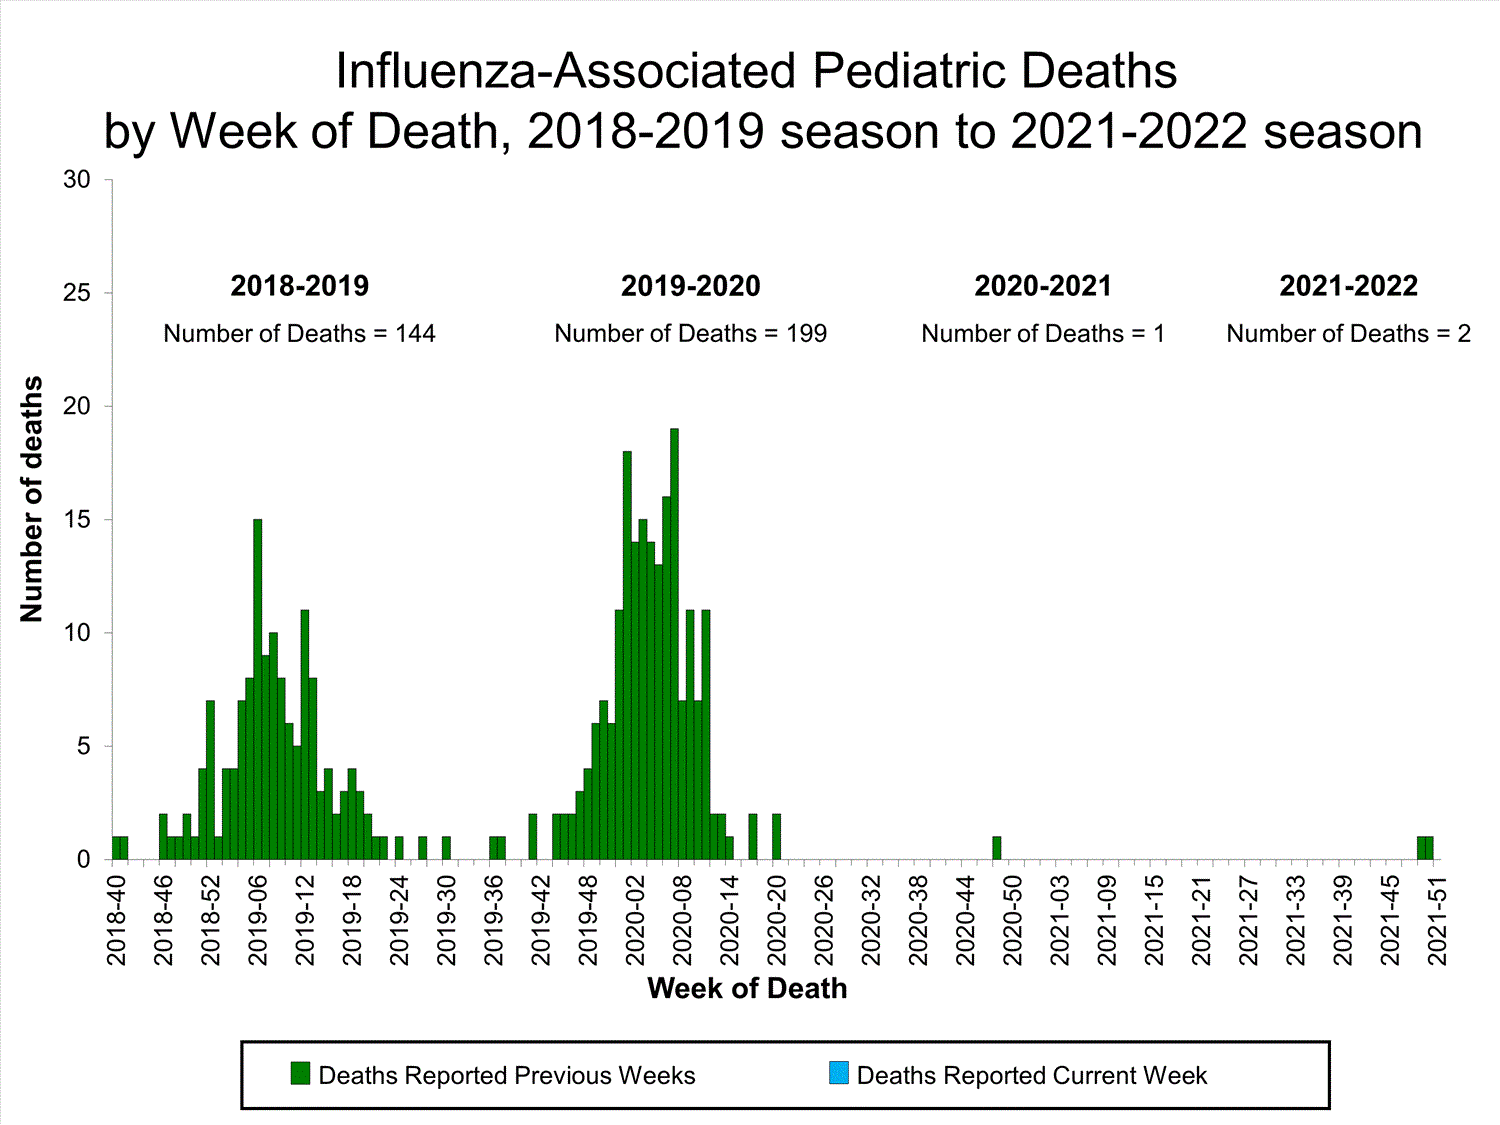
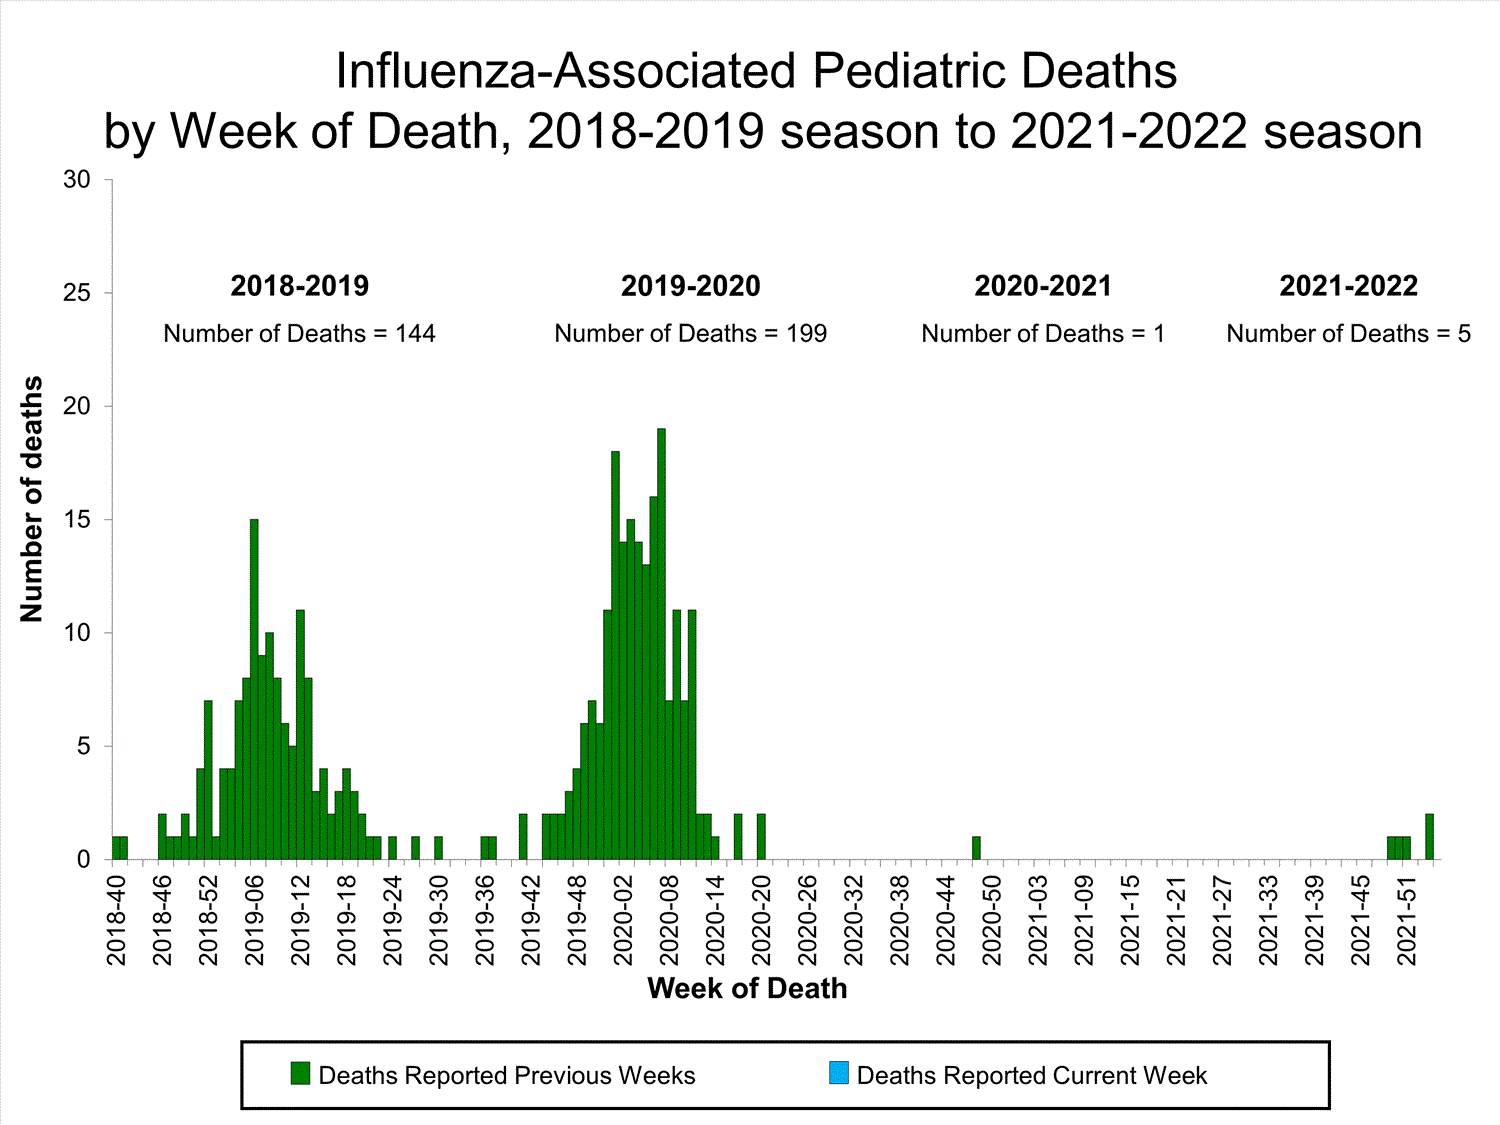
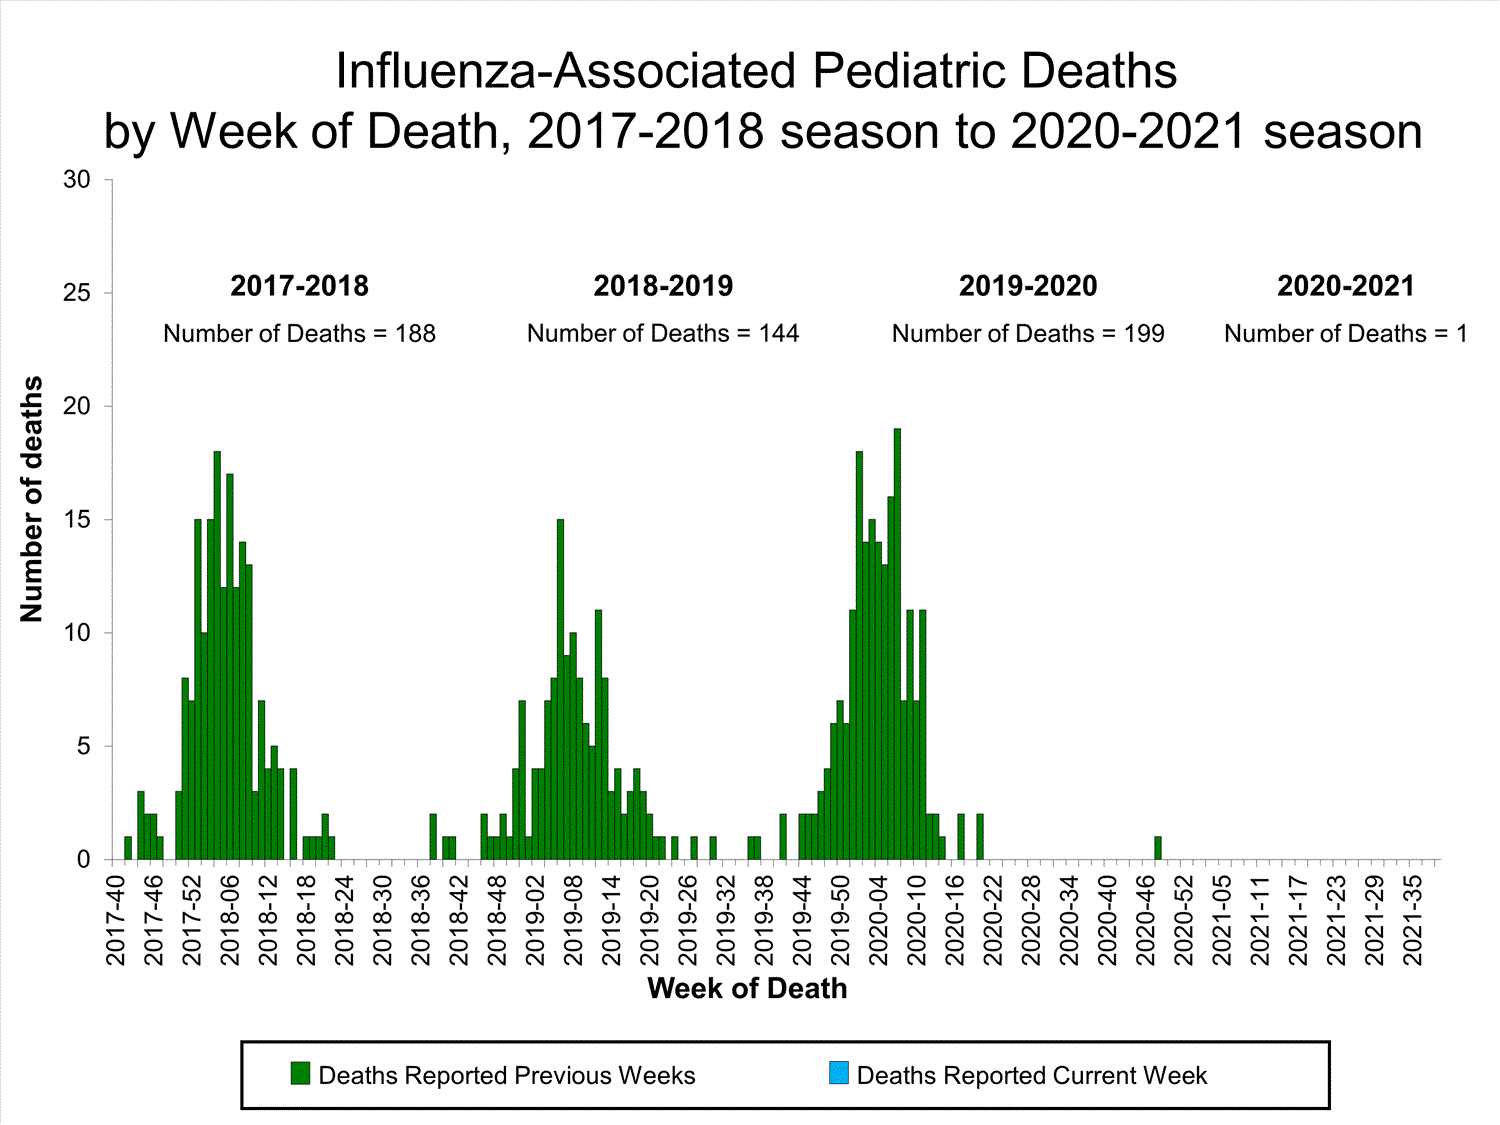
No influenza-associated pediatric deaths were reported to CDC during week 39.

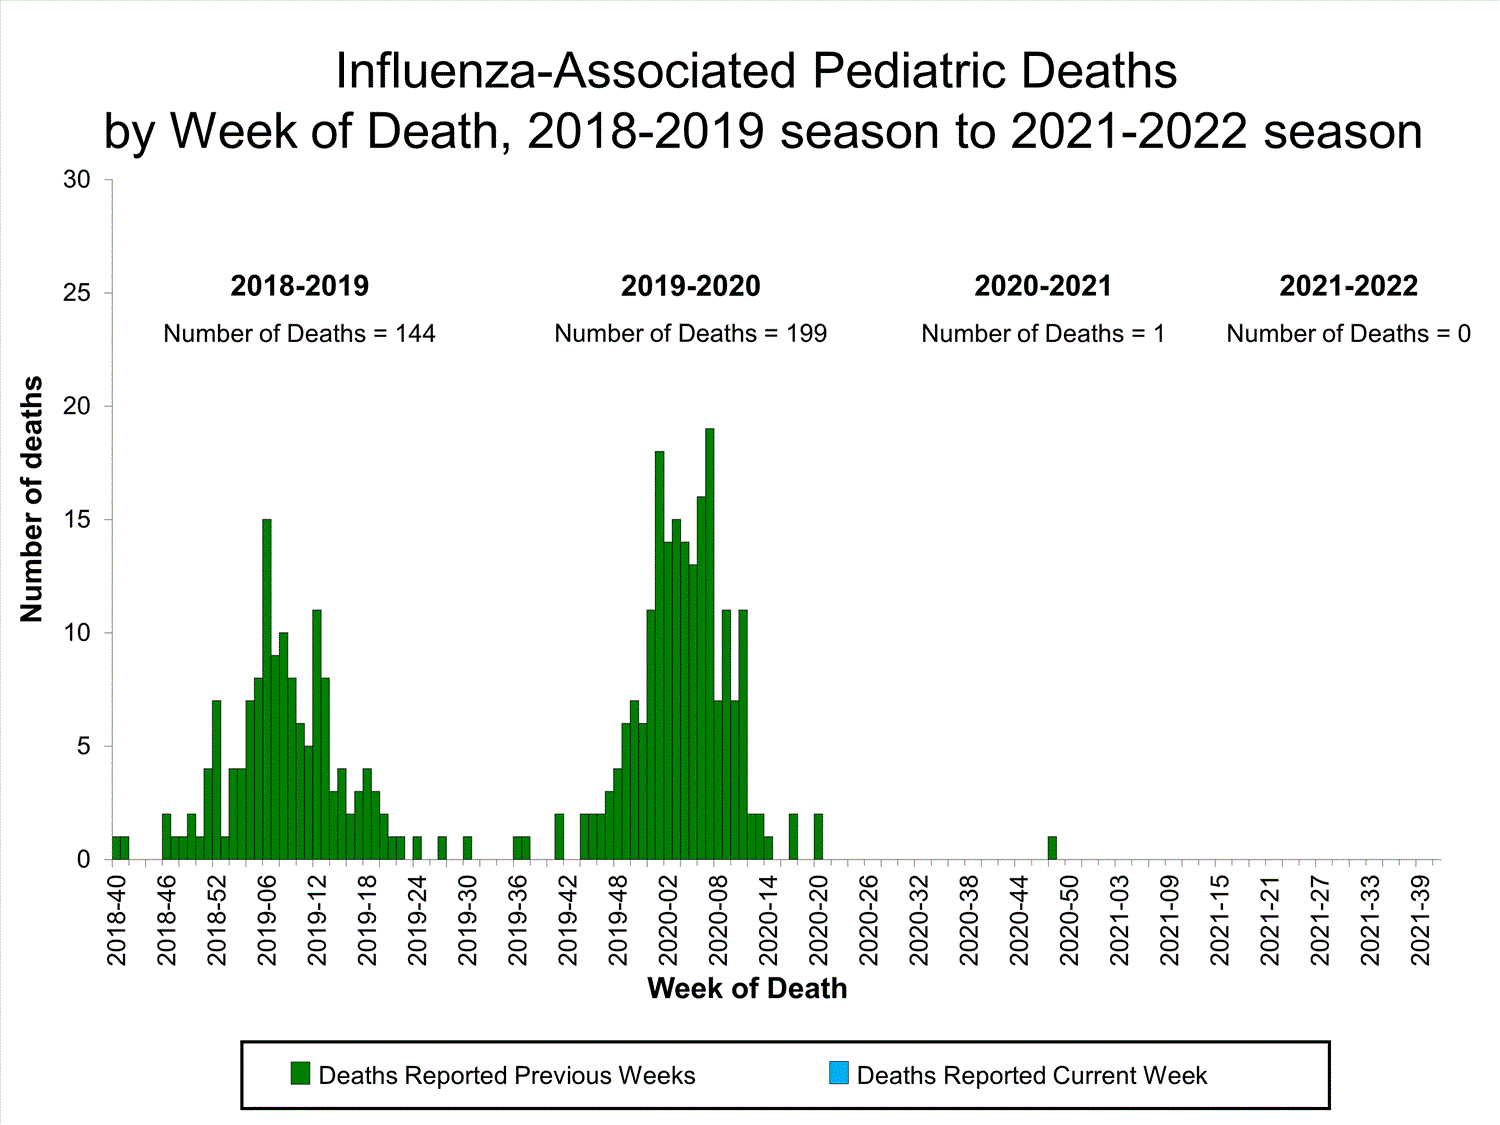
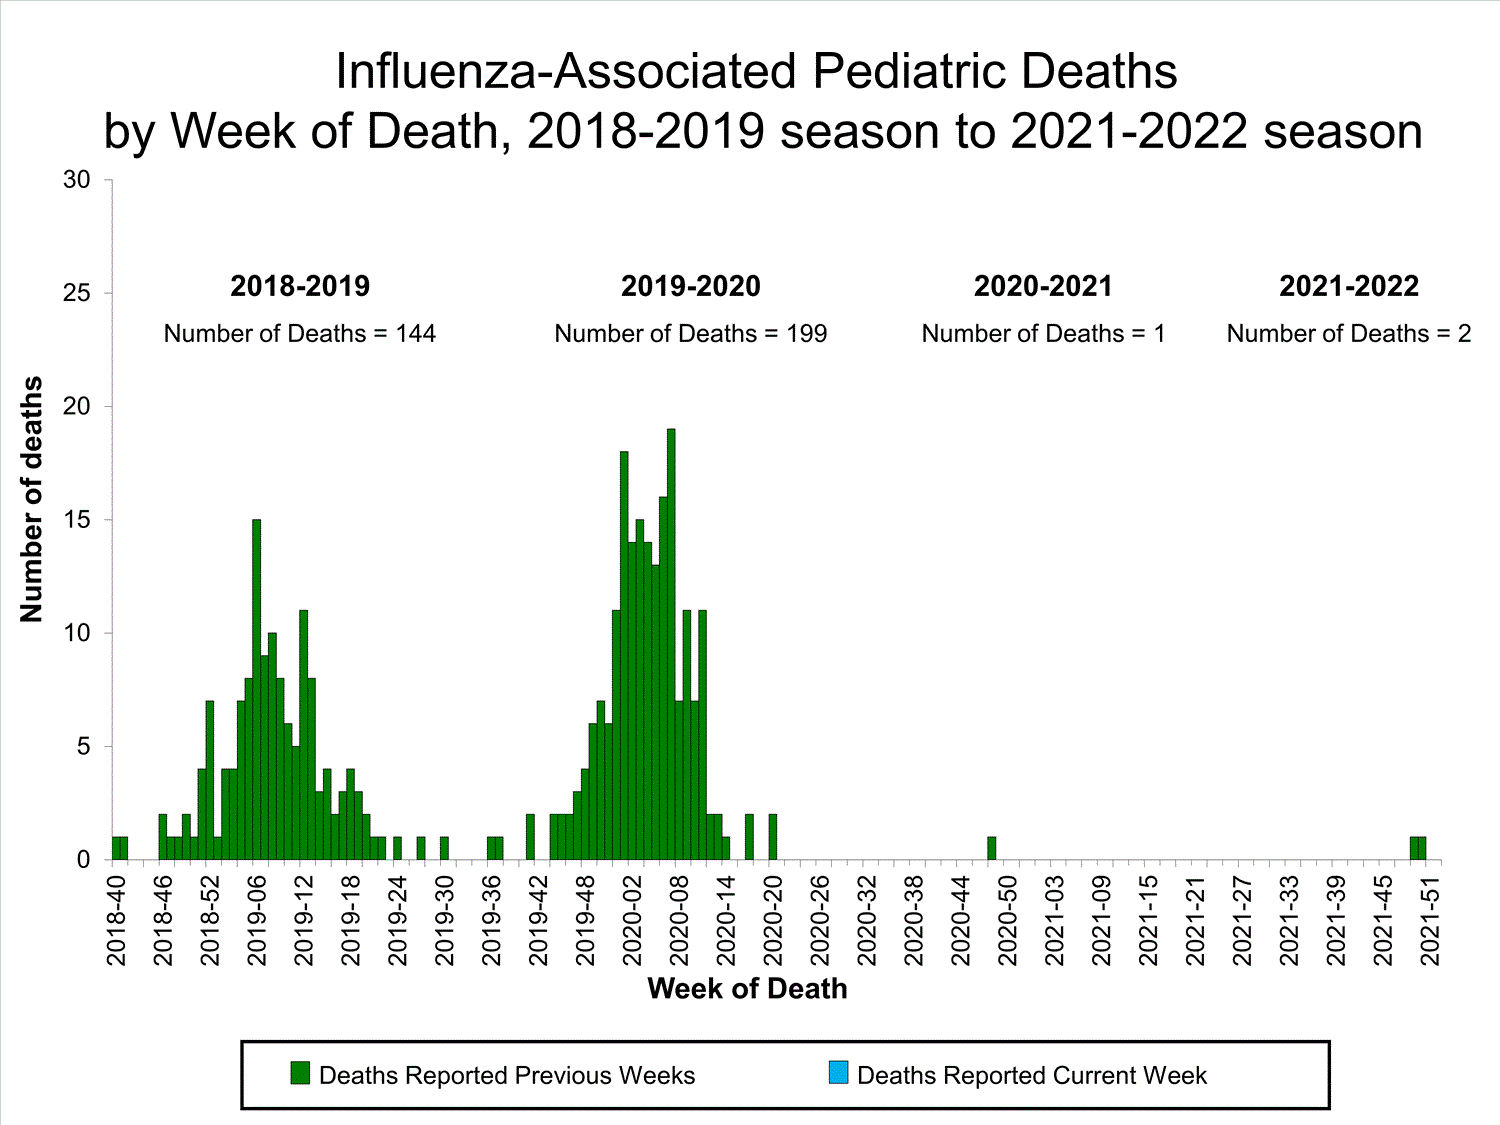
One influenza-associated pediatric death occurring during the 2020-2021 season has been reported to CDC.

View Full Screen
Additional pediatric mortality surveillance information for current and past seasons:
Surveillance Methods | FluView Interactive


Additional National and International Influenza Surveillance Information


FluView Interactive: FluView includes enhanced web-based interactive applications that can provide dynamic visuals of the influenza data collected and analyzed by CDC. These FluView Interactive applications allow people to create customized, visual interpretations of influenza data, as well as make comparisons across flu seasons, regions, age groups and a variety of other demographics.

National Institute for Occupational Safety and Health: Monthly surveillance data on the prevalence of health-related workplace absenteeism among full-time workers in the United States are available from NIOSH.

U.S. State and local influenza surveillance: Select a jurisdiction below to access the latest local influenza information. World Health Organization:
Additional influenza surveillance information from participating WHO member nations is available through
FluNetexternal icon and the Global Epidemiology Reports.external icon

WHO Collaborating Centers for Influenza:
Australiaexternal icon, Chinaexternal icon, Japanexternal icon, the United Kingdomexternal icon, and the United States (CDC in Atlanta, Georgia)

Europe:
The most up-to-date influenza information from Europe is available from WHO/Europe and the European Centre for Disease Prevention and Controlexternal icon.

Public Health Agency of Canada:
The most up-to-date influenza information from Canada is available in Canada’s weekly FluWatch reportexternal icon.

Public Health England:
The most up-to-date influenza information from the United Kingdom is available from Public Health Englandexternal icon.

Any links provided to non-Federal organizations are provided solely as a service to our users. These links do not constitute an endorsement of these organizations or their programs by CDC or the Federal Government, and none should be inferred. CDC is not responsible for the content of the individual organization web pages found at these links.

A description of the CDC influenza surveillance system, including methodology and detailed descriptions of each data component is available on the surveillance methods page.

Page last reviewed: October 8, 2021, 11:00 AM

https://www.cdc.gov/flu/weekly/index.htm
 
Weekly U.S. Influenza Surveillance Report

fluview-banner2.jpg


Note: CDC is tracking the COVID-19 pandemic in a weekly publication called COVID Data Tracker Weekly Review.

Key Updates for Week 40, ending October 9, 2021

Seasonal influenza activity in the United States remains low.
Viruses


Clinical Lab0.1%


positive for influenza

Public Health Lab
Few specimens have tested positive.

Virus Characterization
Influenza virus characterization information will be reported later this season.
Illness

Outpatient Illness: ILINet1.9%


of visits to a health care provider for ILI
(below baseline)


Outpatient Illness: ILINet Activity Map


This week, 1 jurisdiction experienced high or very high activity and 1 jurisdiction experienced moderate activity.

Long Term Care Facilities0.1%


Of facilities reported
≥ 1 influenza-positive tests
among residents

Severe Disease


FluSurv-NET
Hospitalization rates will be updated starting later this season.

HHS Protect Hospitalizations276


patients admitted to hospitals with flu

NCHS Mortality18.0%


of deaths attributed to pneumonia, influenza, or COVID-19 (above threshold)

Pediatric Deaths0


deaths occurring this season

All data are preliminary and may change as more reports are received.

A description of the CDC influenza surveillance system, including methodology and detailed descriptions of each data component is available on the surveillance methods page.

Additional information on the current and previous influenza seasons for each surveillance component are available on FluView Interactive.

Key Points
  • An annual flu vaccine is the best way to protect against flu and its potentially serious complications.
  • CDC recommends everyone 6 months or older get a flu vaccine by the end of October.
  • There also are flu antiviral drugs that can be used to treat flu illness.
U.S. Virologic Surveillance:

Clinical Laboratories


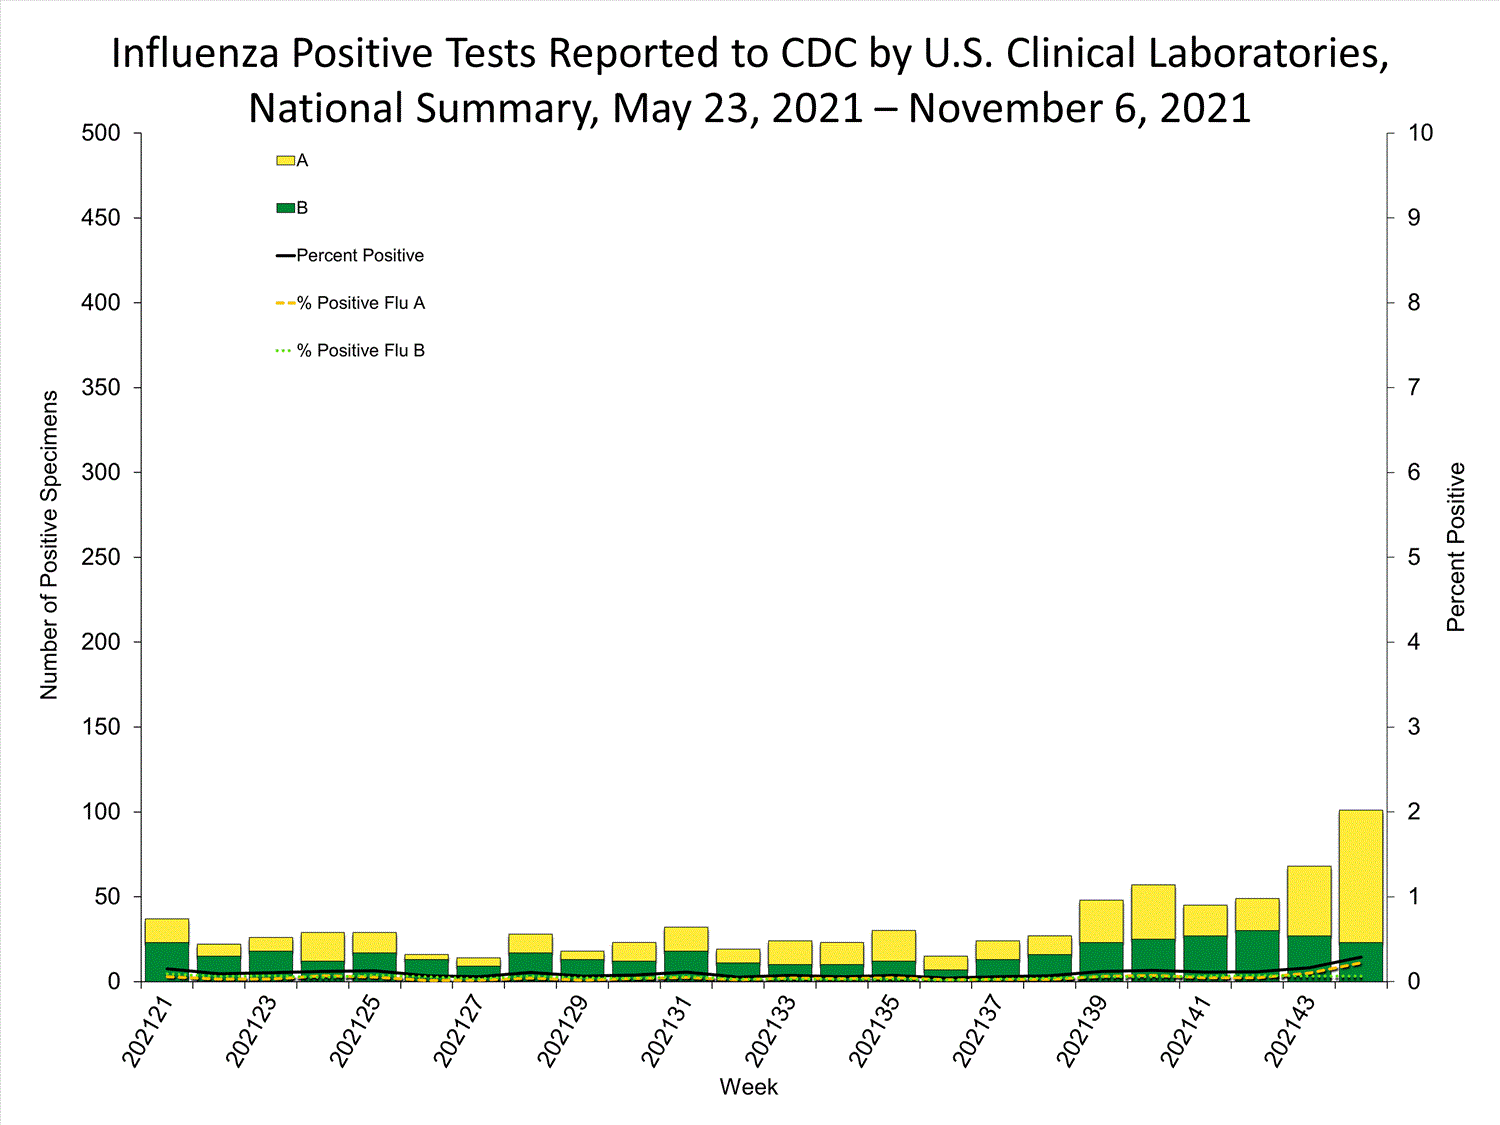
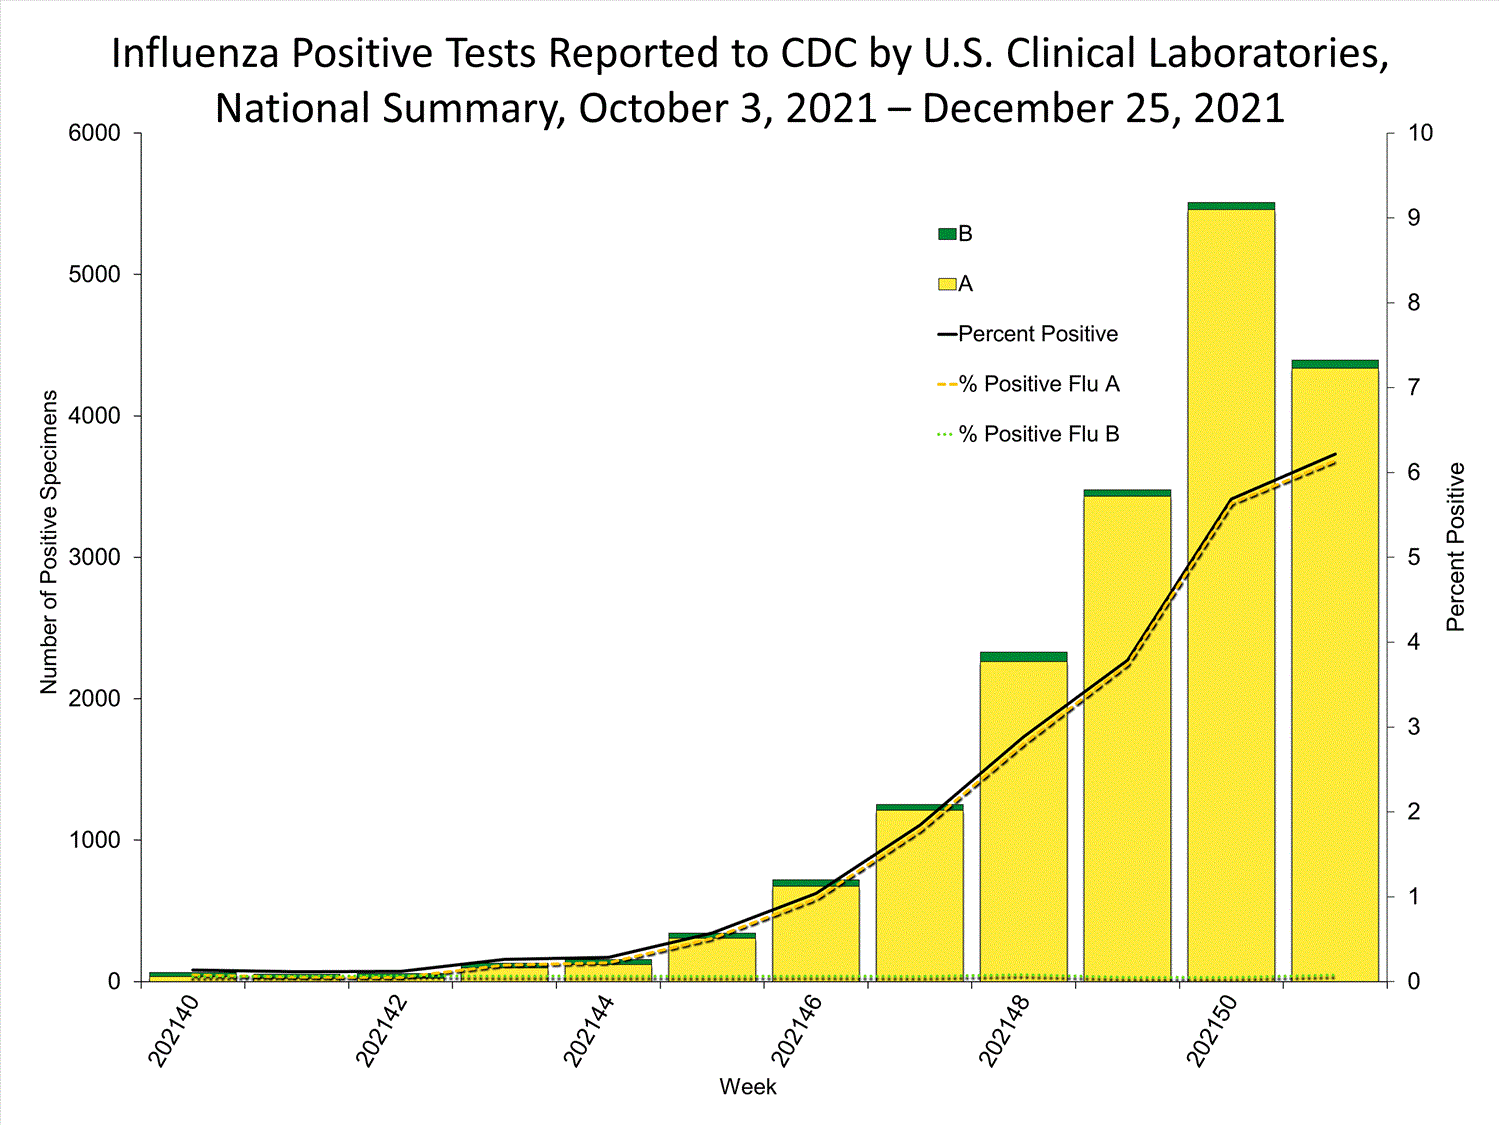
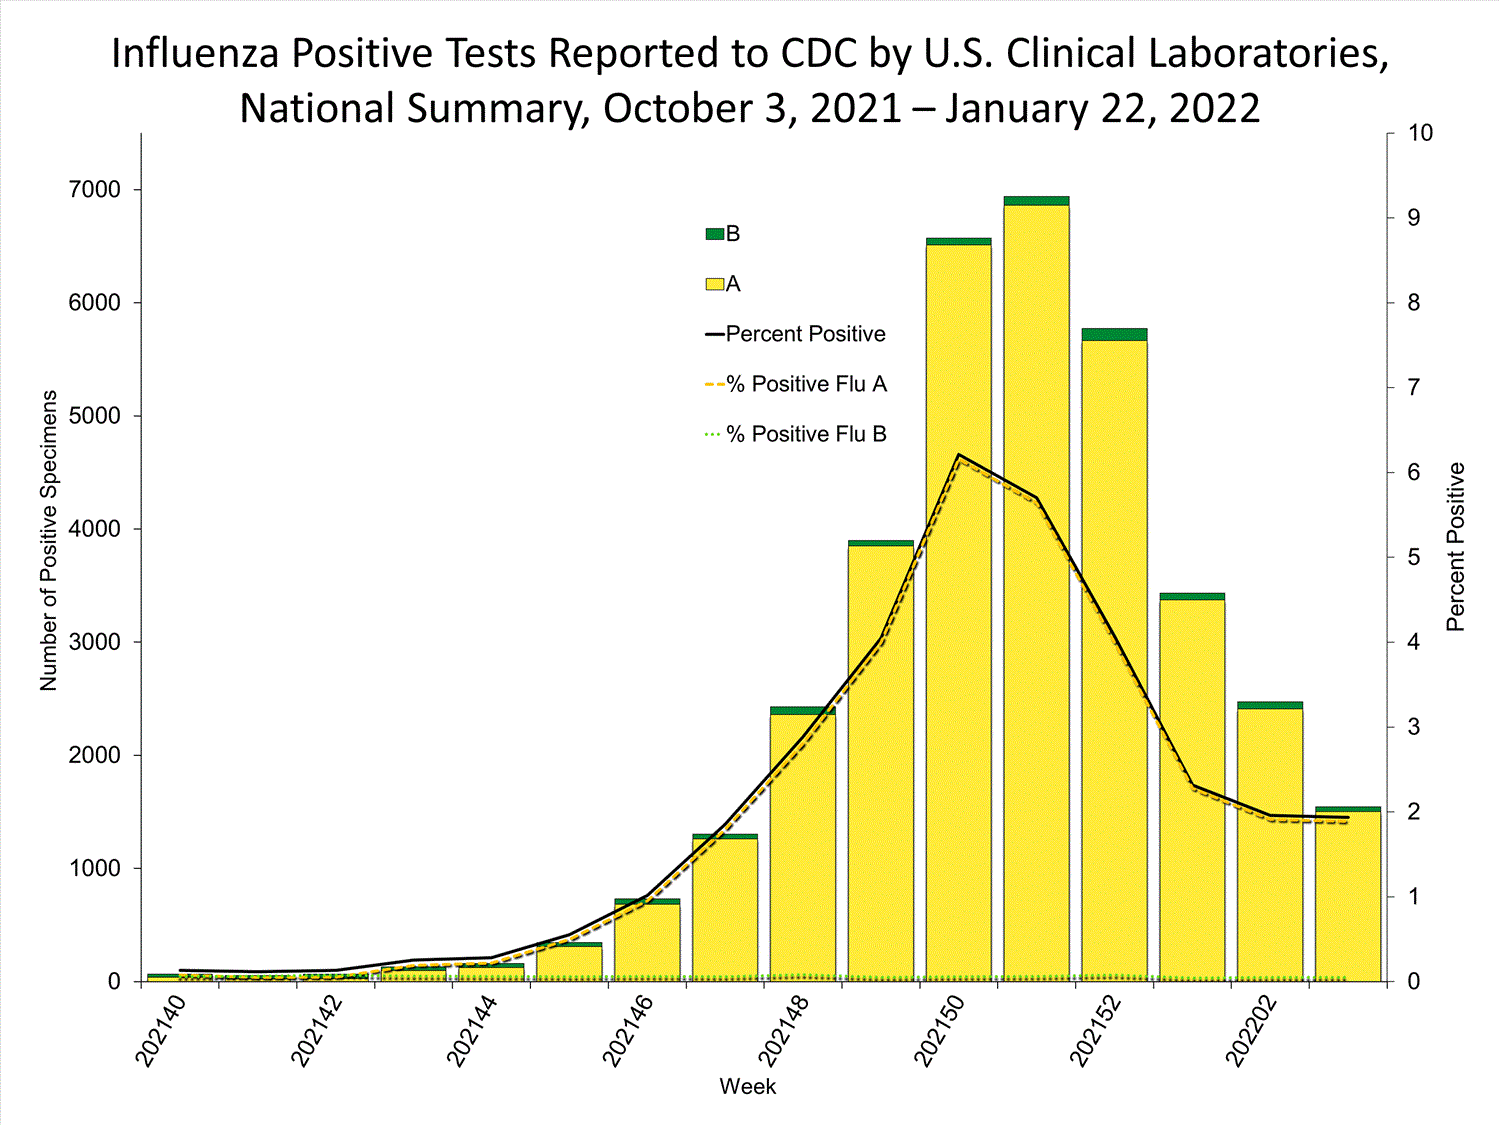
The results of tests performed by clinical laboratories nationwide are summarized below. Data from clinical laboratories (the percentage of specimens tested that are positive for influenza) are used to monitor whether influenza activity is increasing or decreasing.

No. of specimens tested41,53928,951
No. of positive specimens (%)48 (0.1%)42 (0.1%)
Positive specimens by type
Influenza A24 (50.0%)24 (57.1%)
Influenza B24 (50.0%)18 (42.9%)


View Chart Data | View Full ScreenPublic Health Laboratories


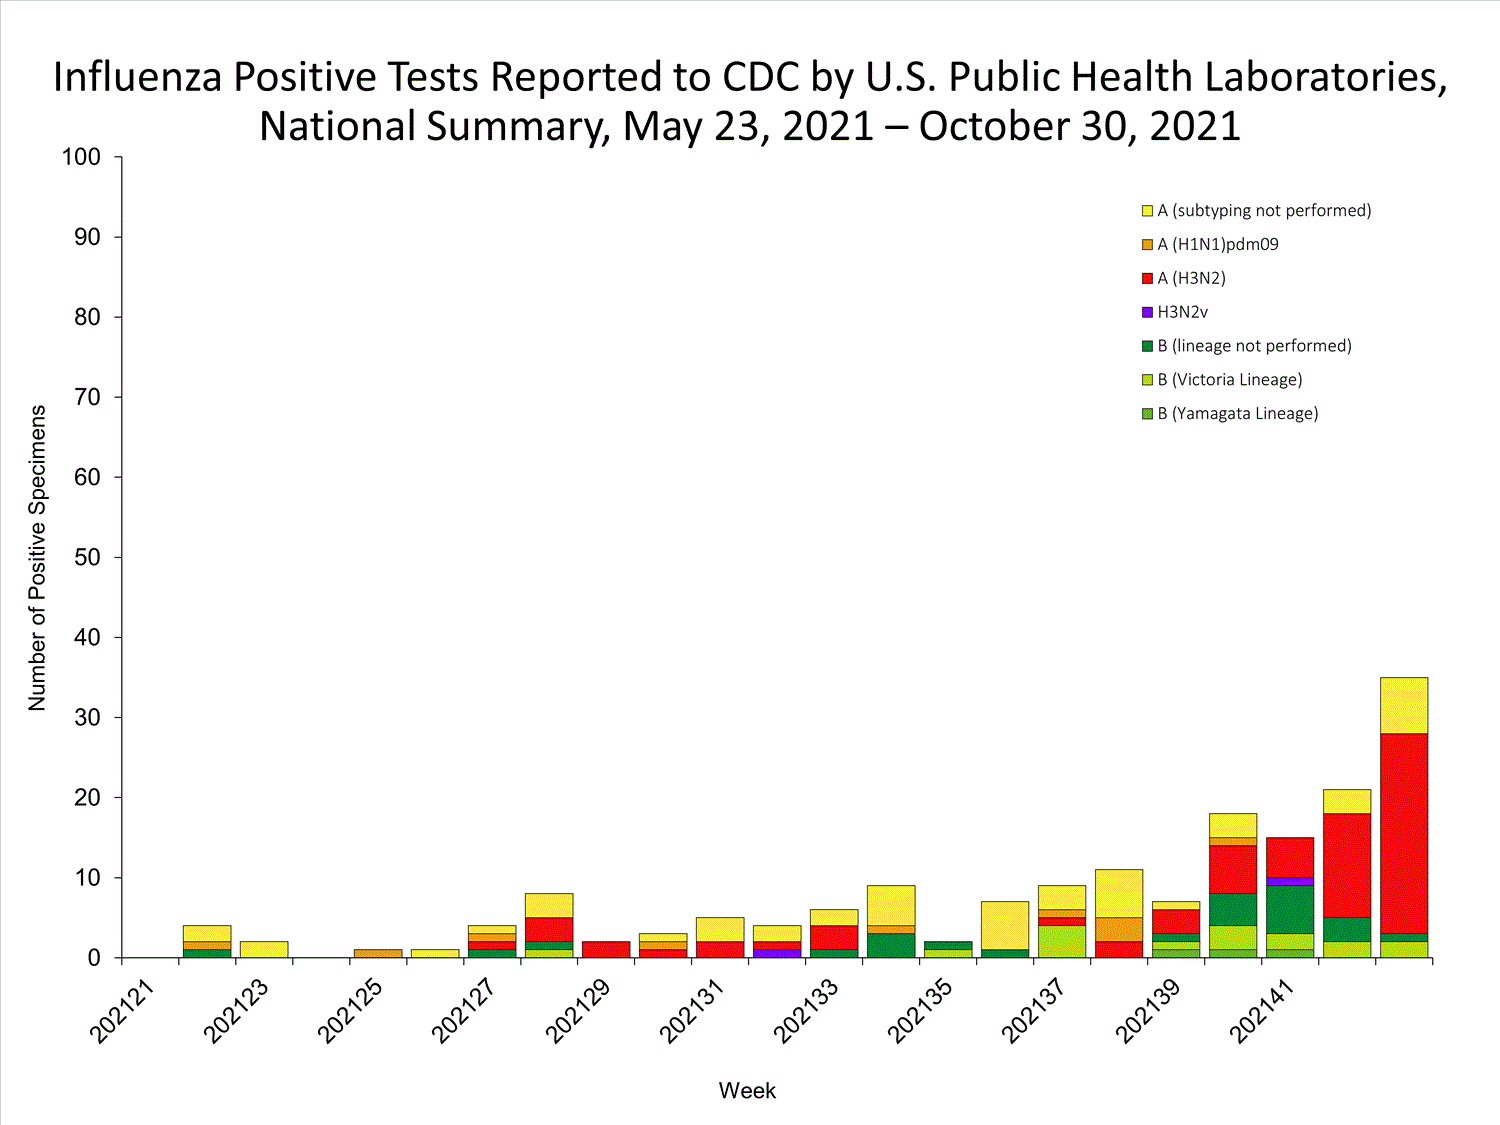
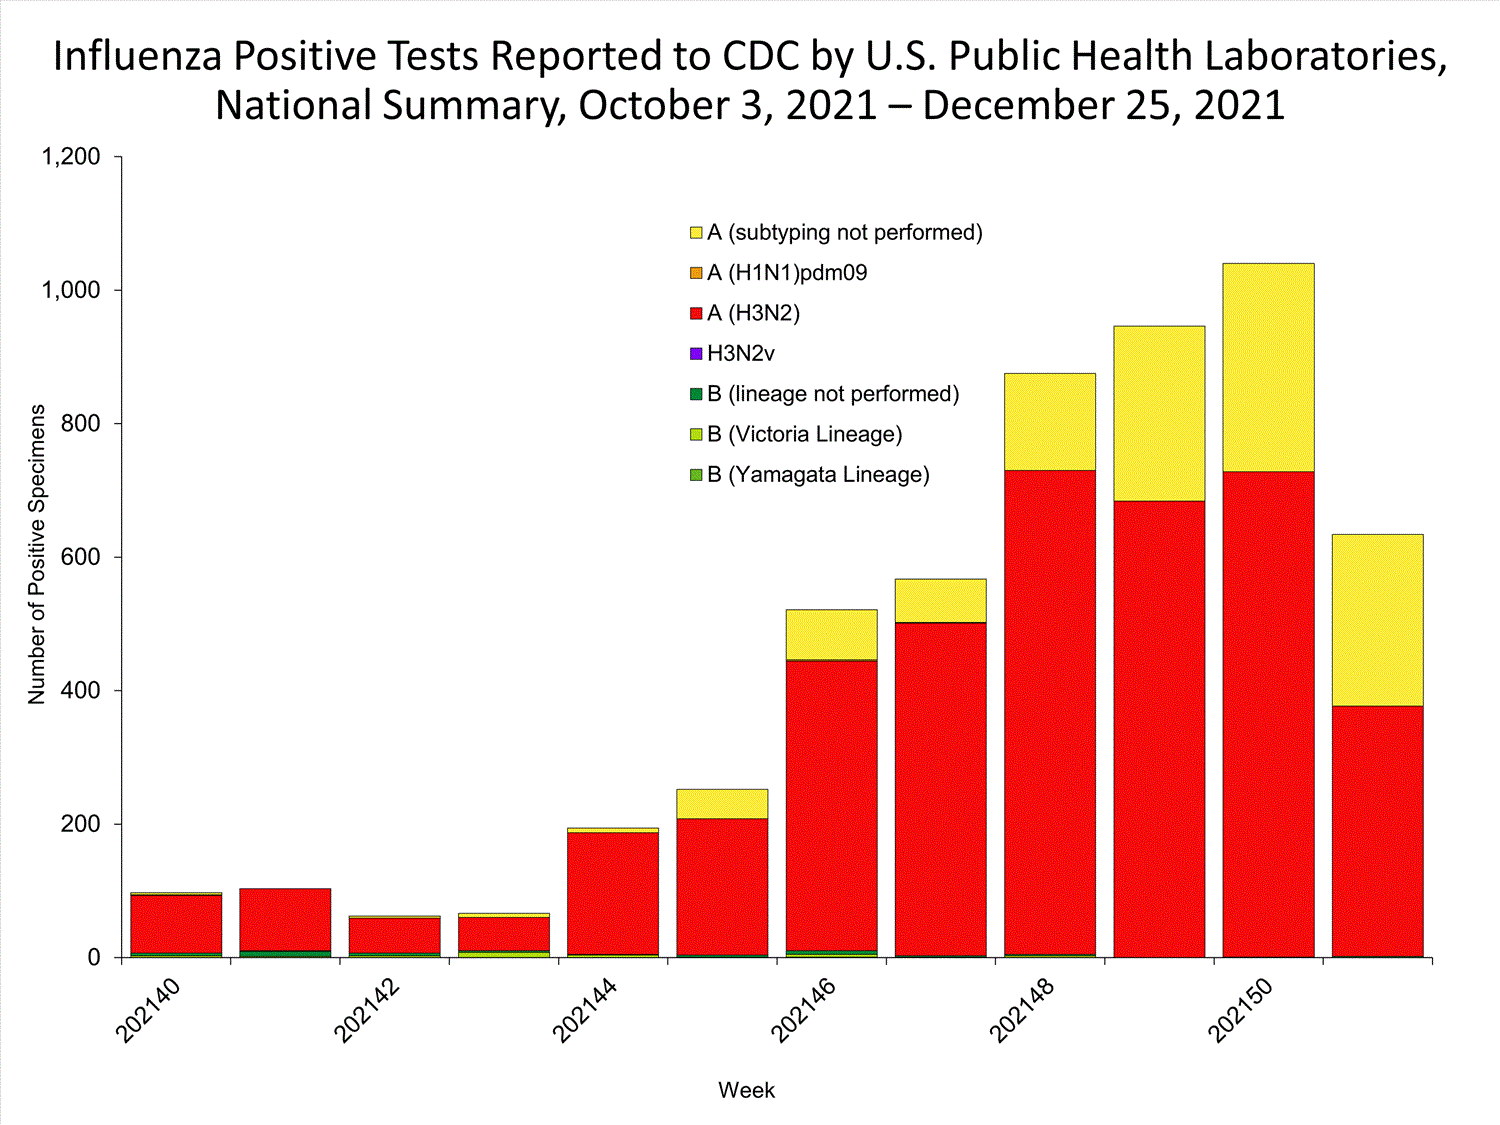
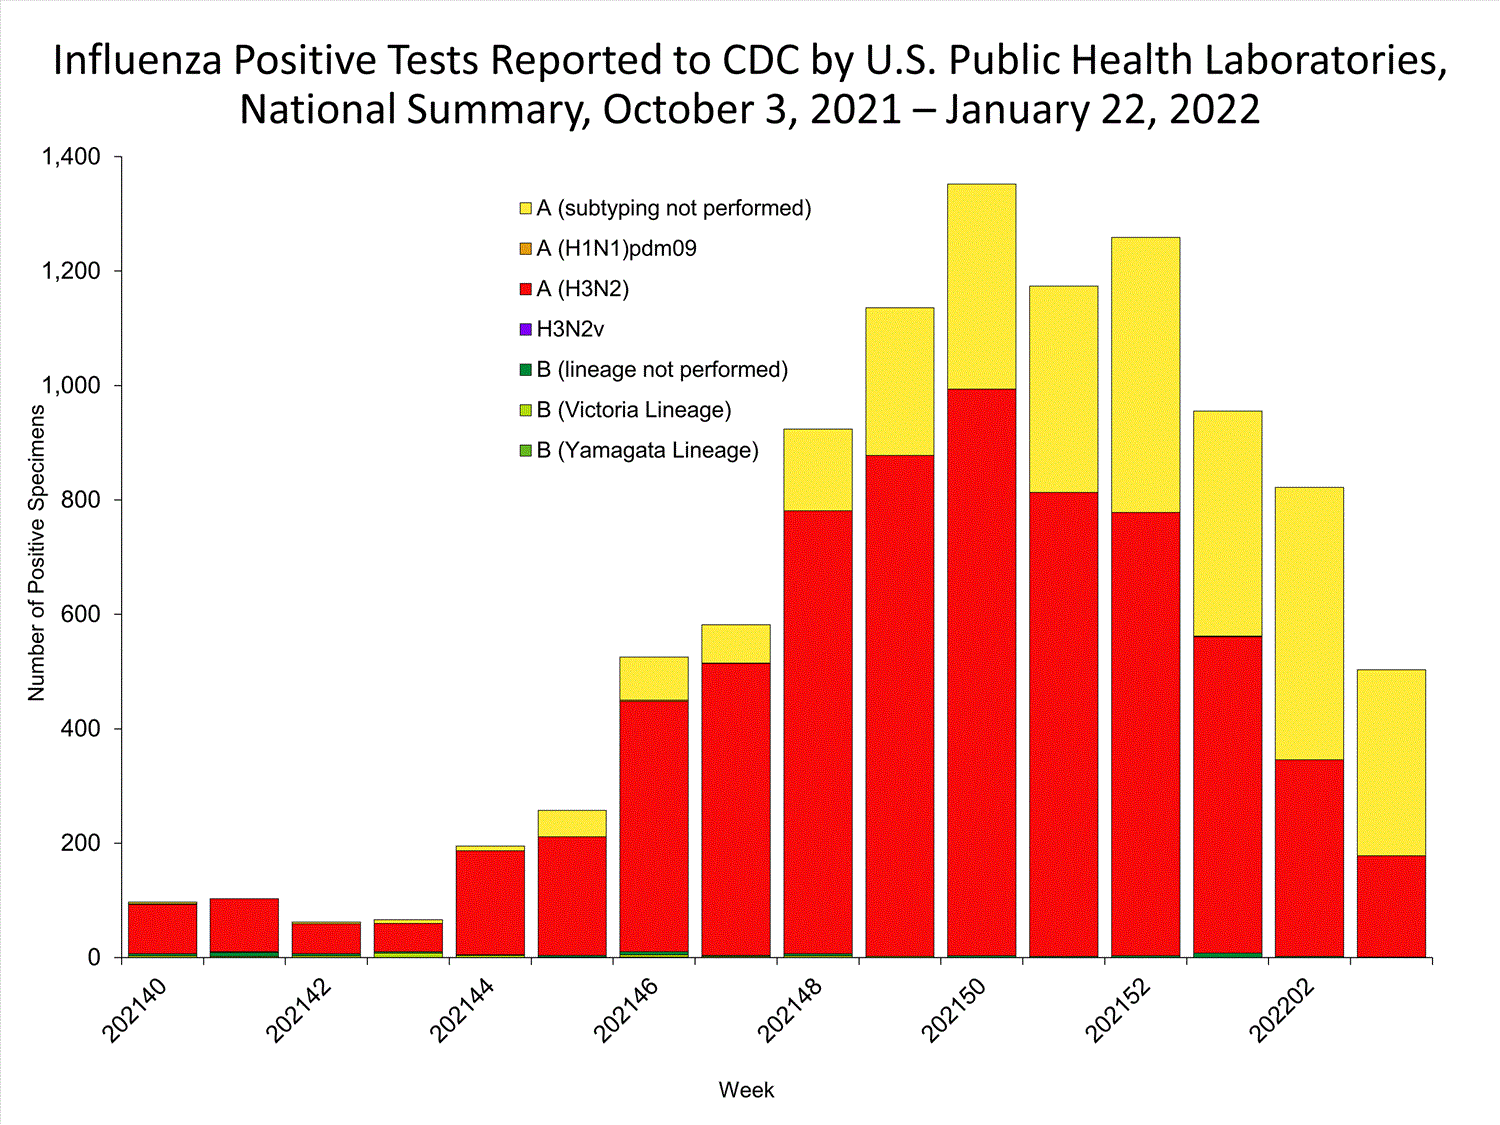
The results of tests performed by public health laboratories nationwide are summarized below. Data from public health laboratories are used to monitor the proportion of circulating viruses that belong to each influenza subtype/lineage.
No. of specimens tested17,40014,615
No. of positive specimens513
Positive specimens by type/subtype
Influenza A3 (60.0%)8 (61.5%)
(H1N1)pdm0901 (50.0%)
H3N22 (100%)1 (50.0%)
Subtyping not performed16
Influenza B2 (40.0%)5 (38.5%)
Yamagata lineage1 (100%)0
Victoria lineage01 (100%)
Lineage not performed14


View Chart Data | View Full Screen
Additional virologic surveillance information for current and past seasons:
Surveillance Methods | FluView Interactive: National, Regional, and State Data or Age Data
Influenza Virus Characterization


CDC performs genetic and antigenic characterization of U.S. viruses submitted from state and local health laboratories using Right Size Roadmap submission guidance. These data are used to compare how similar the currently circulating influenza viruses are to the reference viruses representing viruses contained in the current influenza vaccines and to monitor evolutionary changes that continually occur in influenza viruses circulating in humans. CDC also tests susceptibility of influenza viruses to antiviral medications including the neuraminidase inhibitors (oseltamivir, zanamivir, and peramivir) and the PA endonuclease inhibitor baloxavir.

Virus characterization data will be updated later this season when a sufficient number of specimens have been tested.
Outpatient Illness Surveillance


The U.S. Outpatient Influenza-like Illness Surveillance Network (ILINet) monitors outpatient visits for influenza-like illness [(ILI) fever plus cough or sore throat], not laboratory-confirmed influenza, and will capture visits due to other respiratory pathogens, such as SARS-CoV-2, that present with similar symptoms. Due to the COVID-19 pandemic, health care-seeking behaviors have changed and people may be accessing the health care system in alternative settings not captured as a part of ILINet or at a different point in their illness than they might have before the pandemic. Therefore, it is important to evaluate syndromic surveillance data, including that from ILINet, in the context of other sources of surveillance data to obtain a complete and accurate picture of influenza, COVID-19, and other respiratory virus activity. CDC is tracking the COVID-19 pandemic in a weekly publication called COVID Data Tracker Weekly Review. Information about other respiratory virus activity can be found on CDC’s National Respiratory and Enteric Virus Surveillance System (NREVSS) website.

Effective October 3, 2021, the ILI definition (fever plus cough or sore throat) no longer includes “without a known cause other than influenza.” This change was made to improve the consistency with which the definition is applied across reporting sites
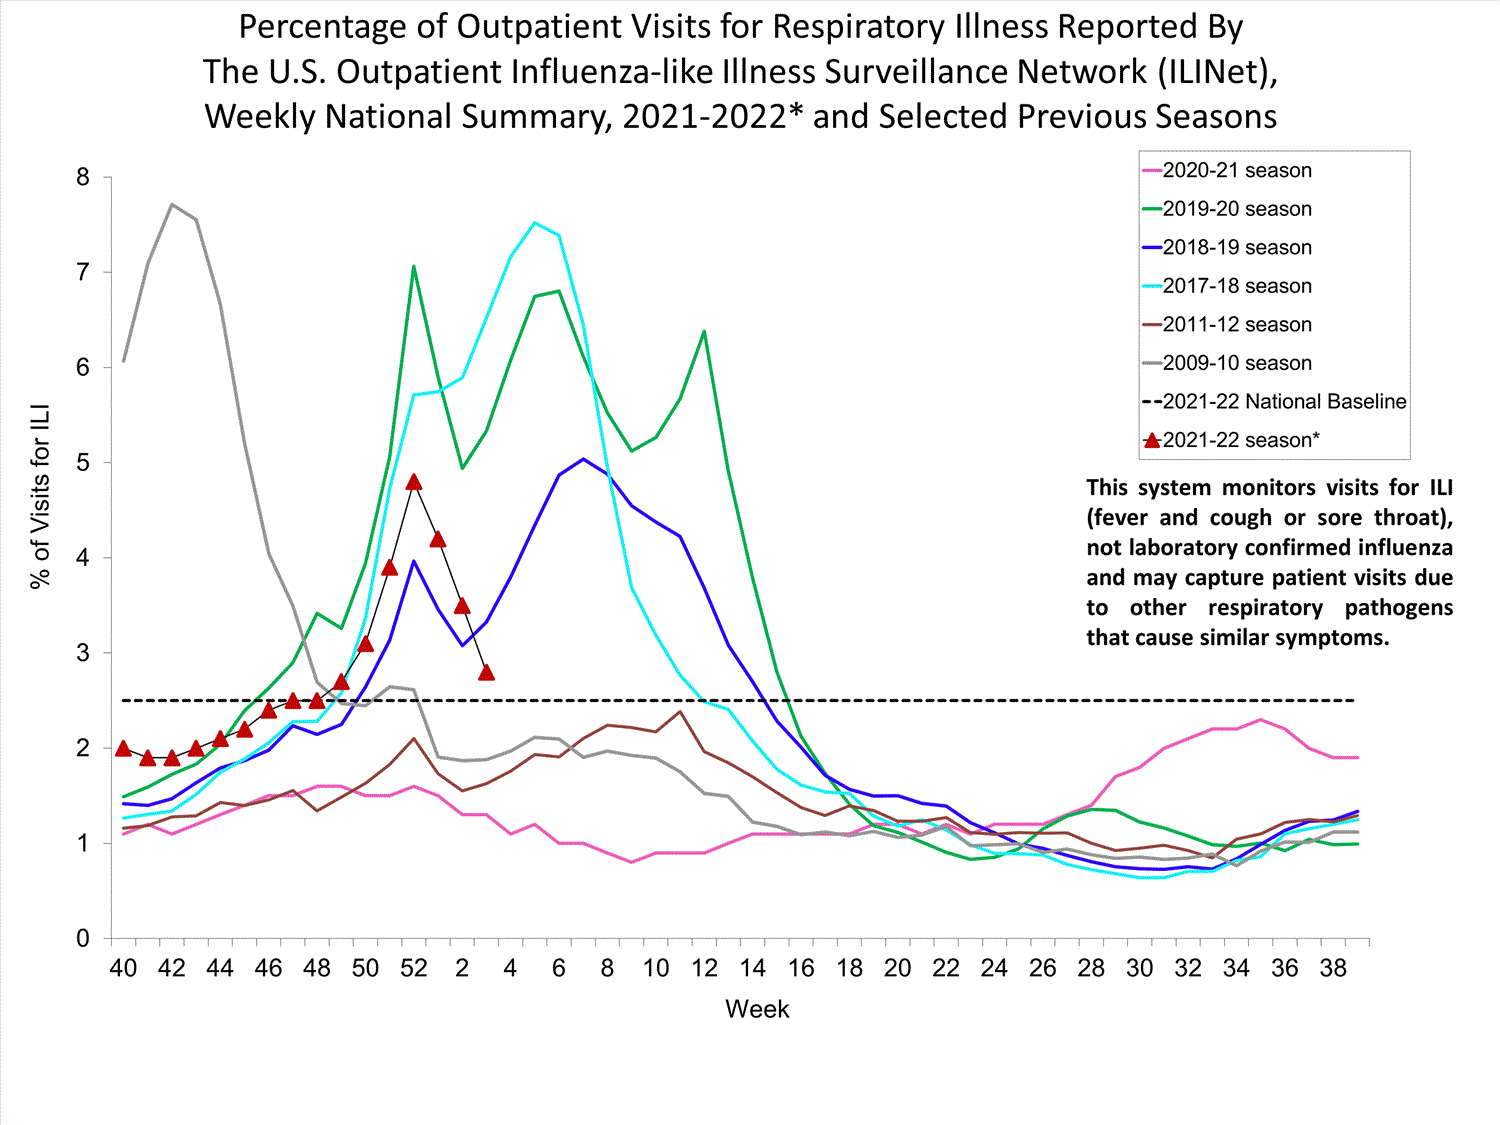
ILINet


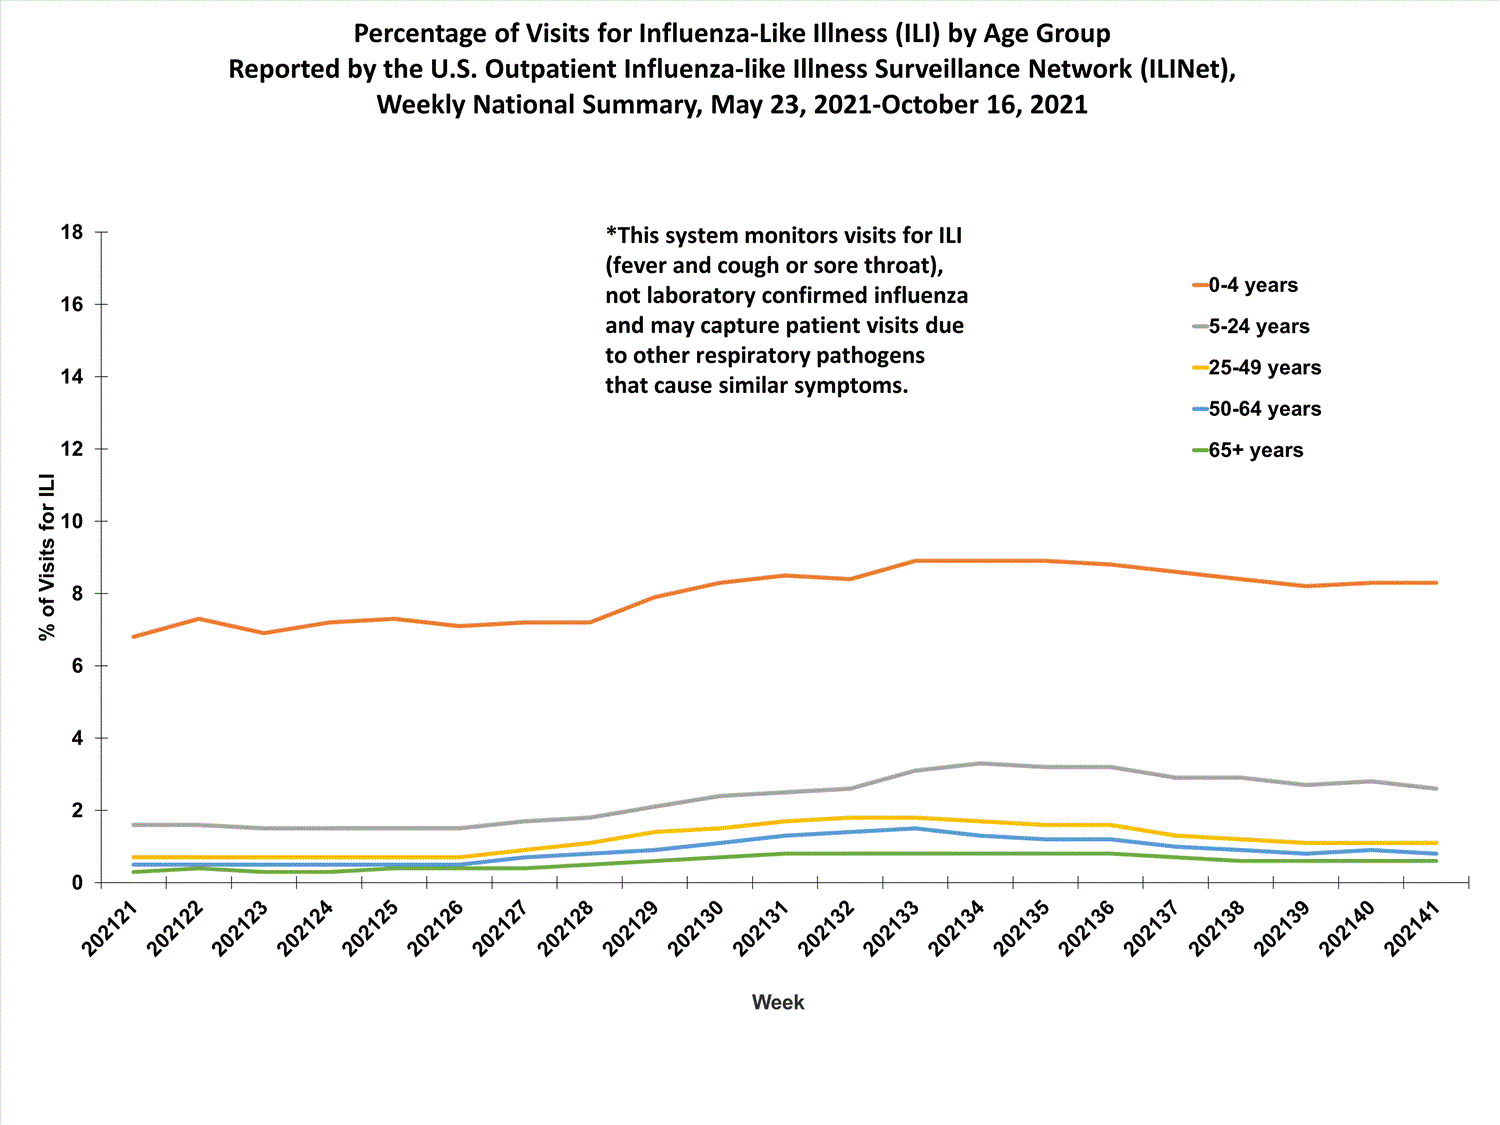
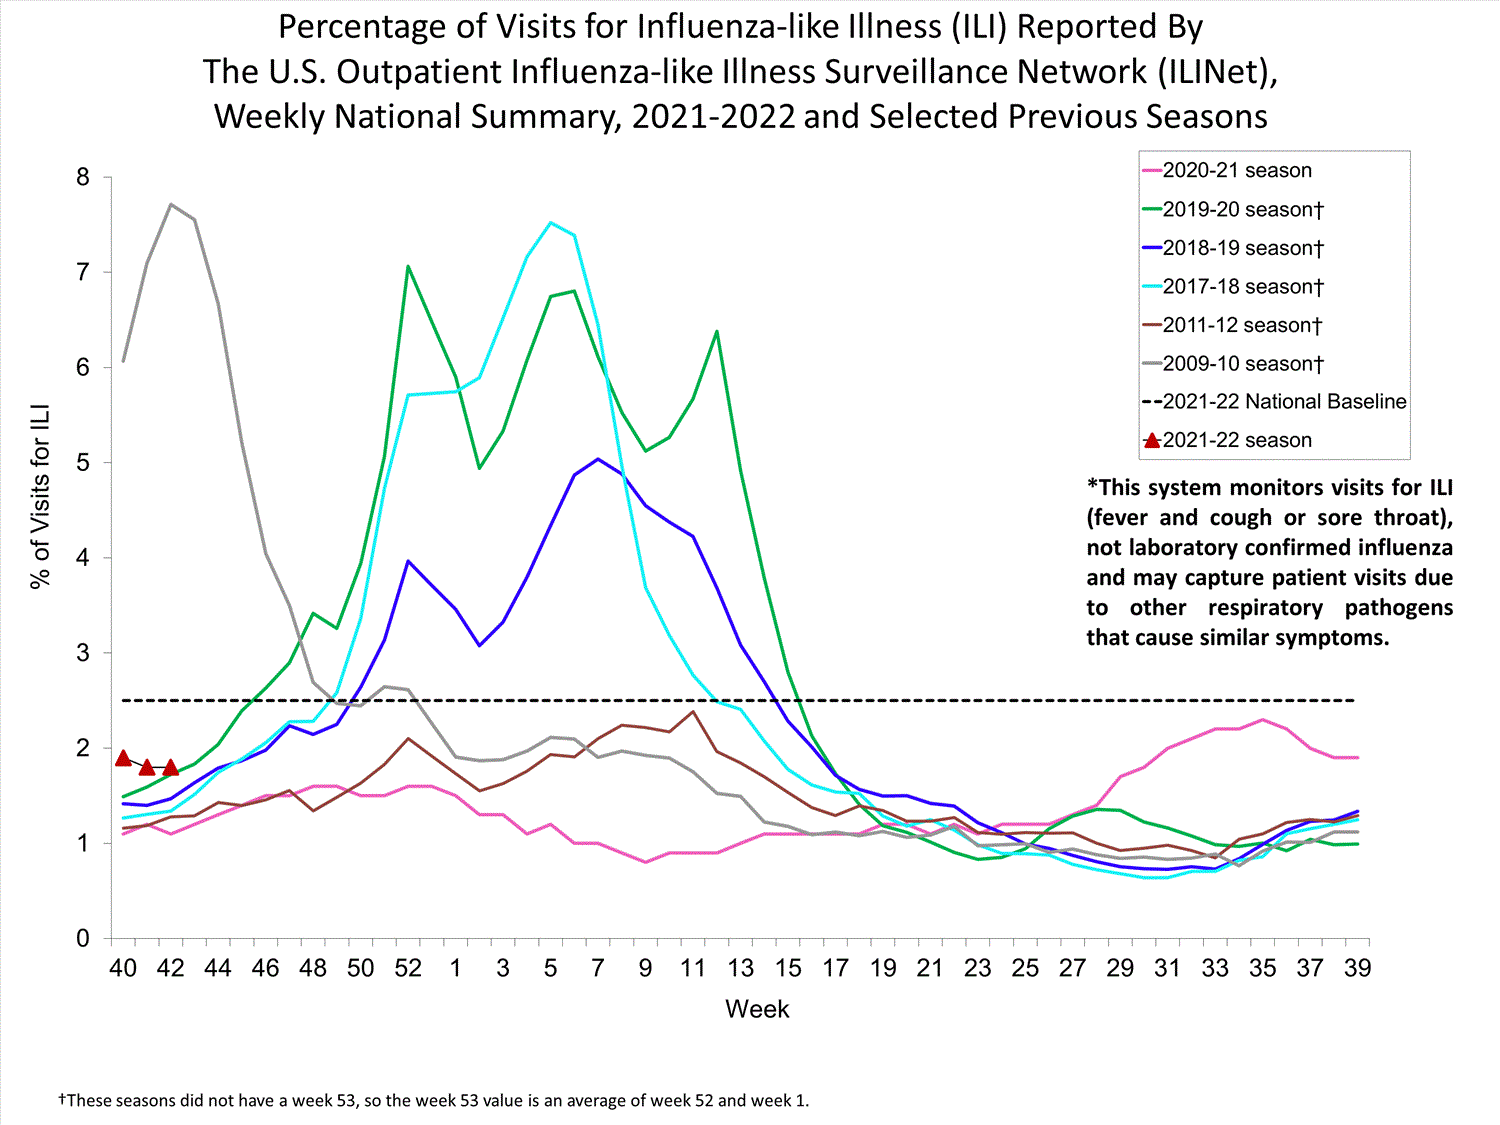
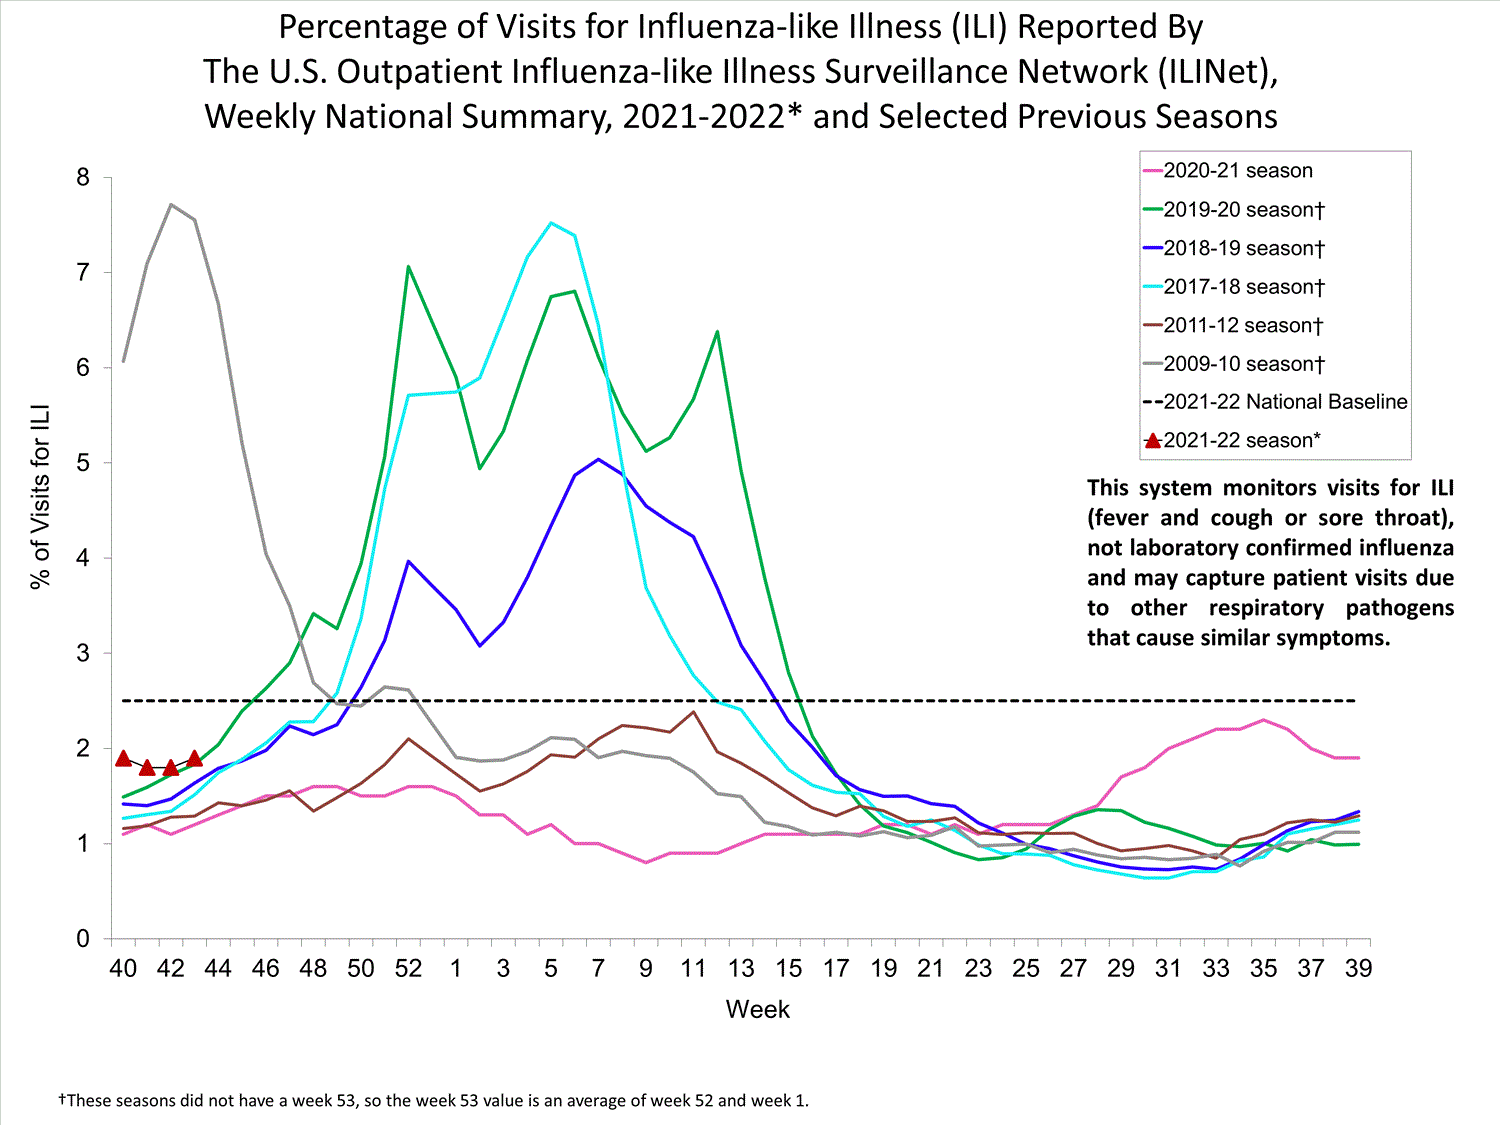
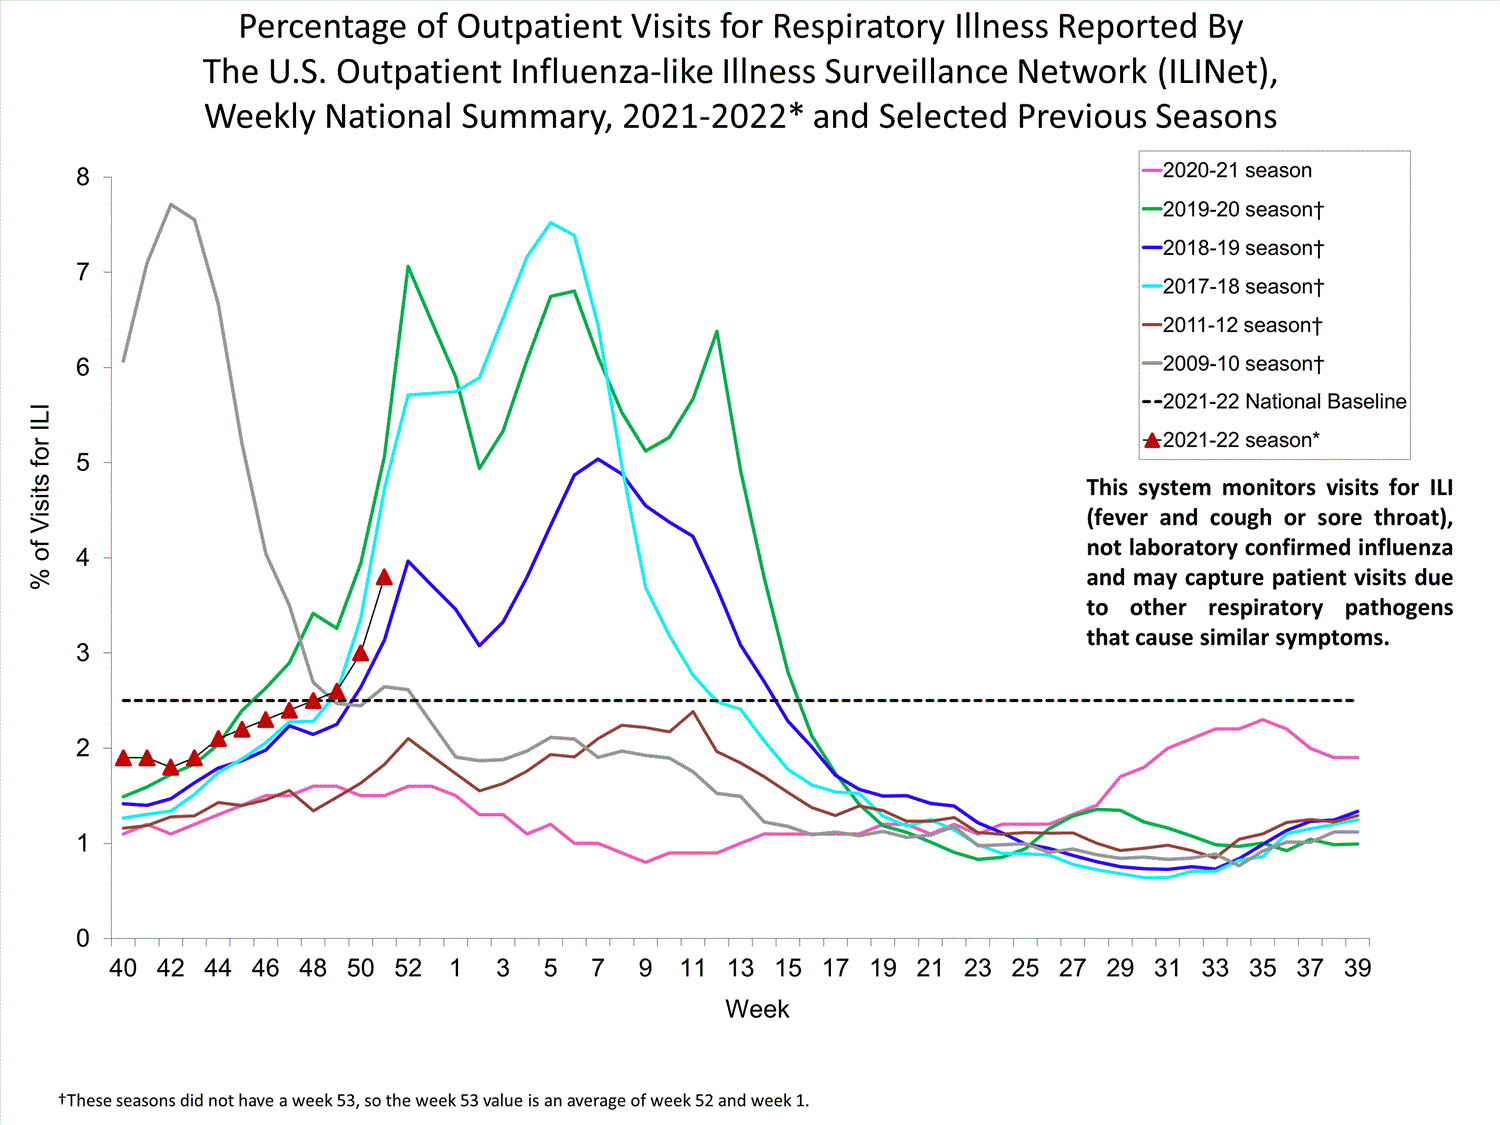
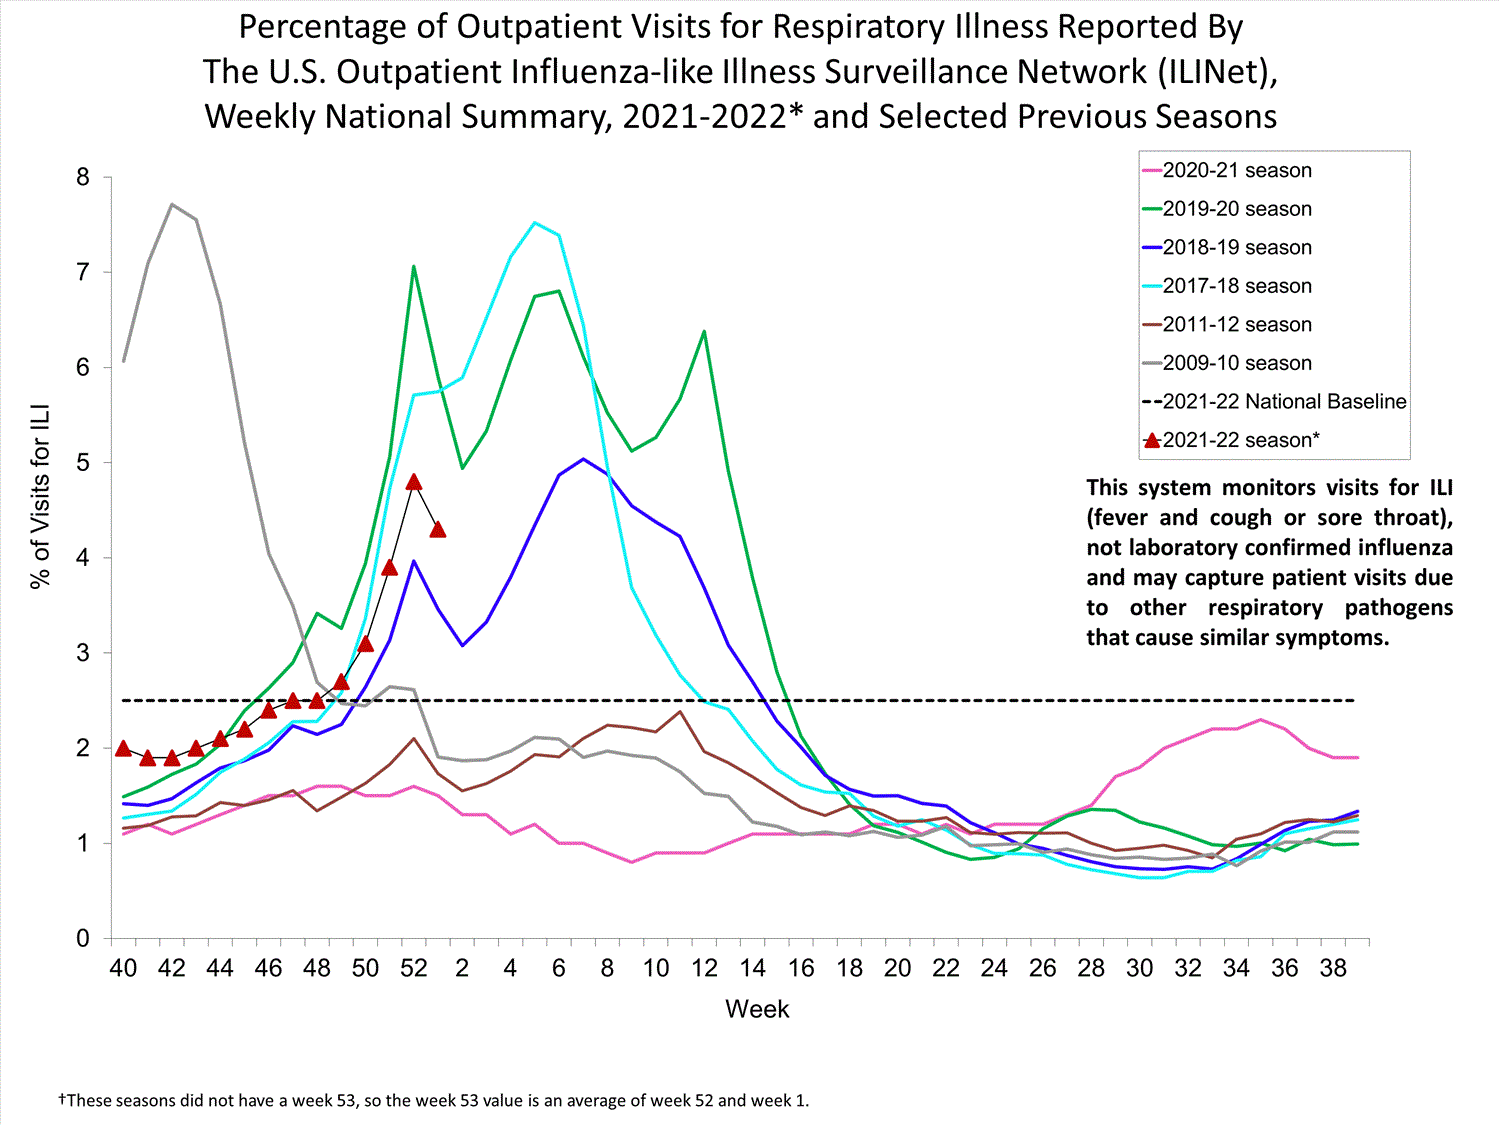
Nationwide during week 40, 1.9% of patient visits reported through the U.S. Outpatient Influenza-like Illness Surveillance Network (ILINet) were due to influenza-like illness (ILI). This percentage is below the national baseline of 2.5%. Three regions (Region 2, Region 3, and Region 7) are at their region-specific baseline while the remaining regions are below their baselines. Overall, influenza virus circulation remains low; therefore, increases in ILI activity are likely due to increased circulation of other respiratory viruses.


View Chart Data (current season only) | View Full ScreenILI Visits by Age Group


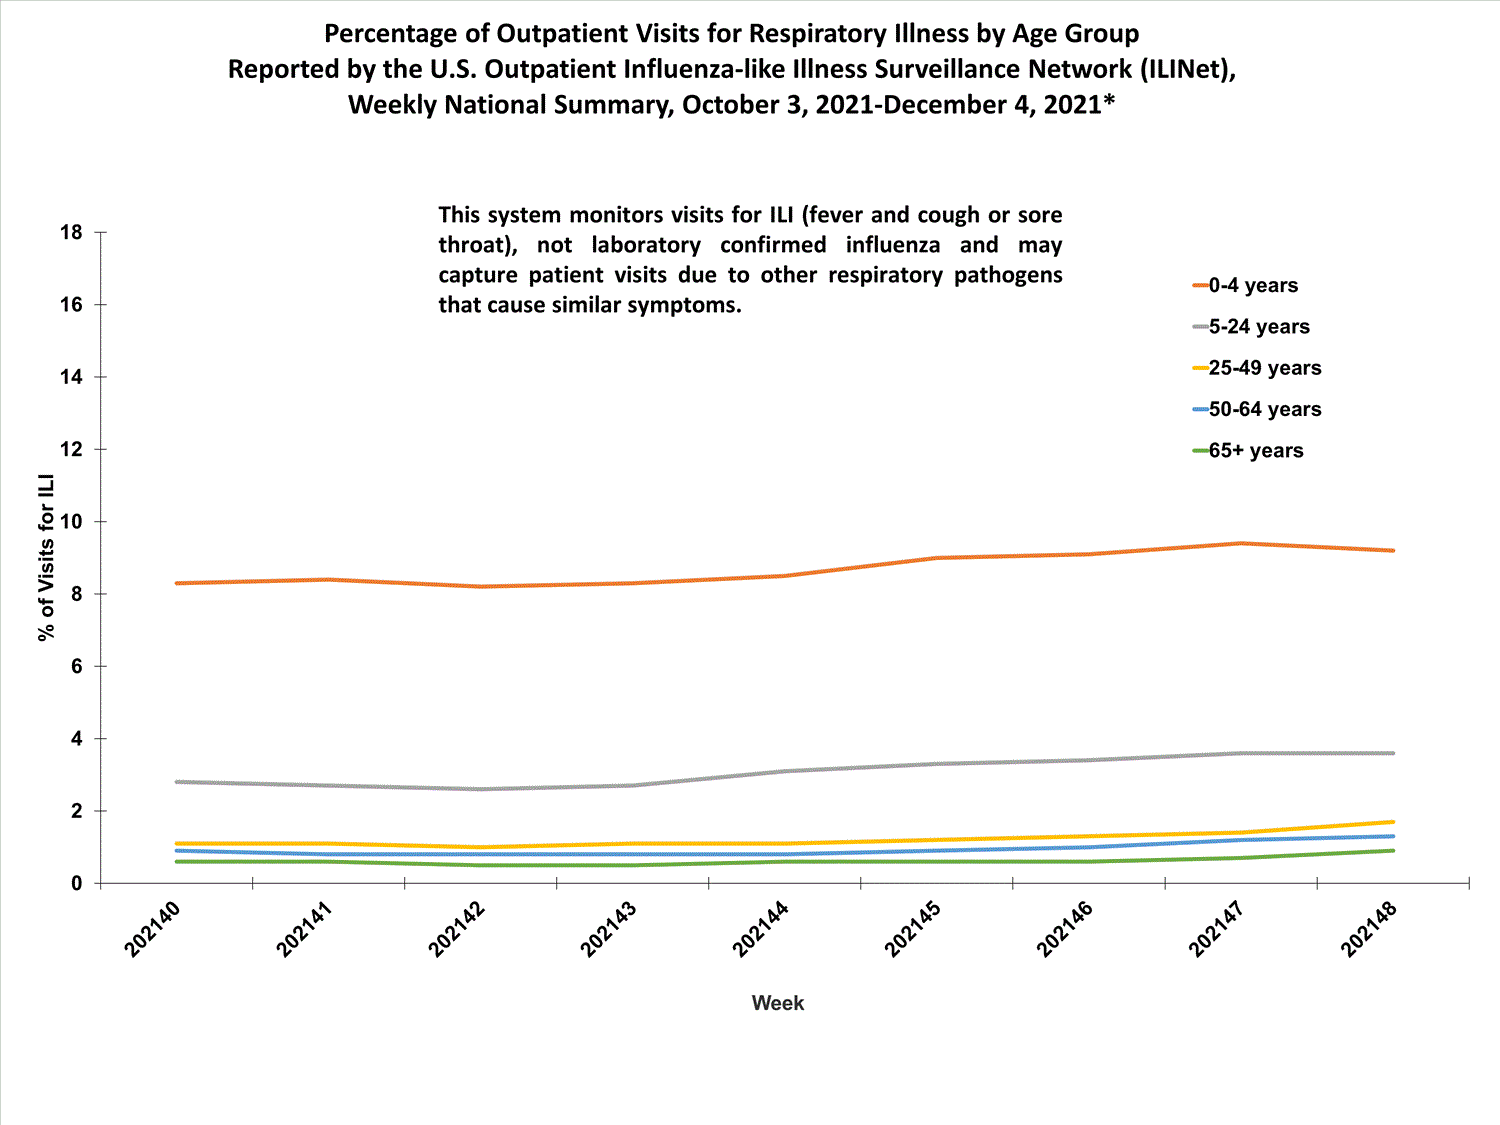
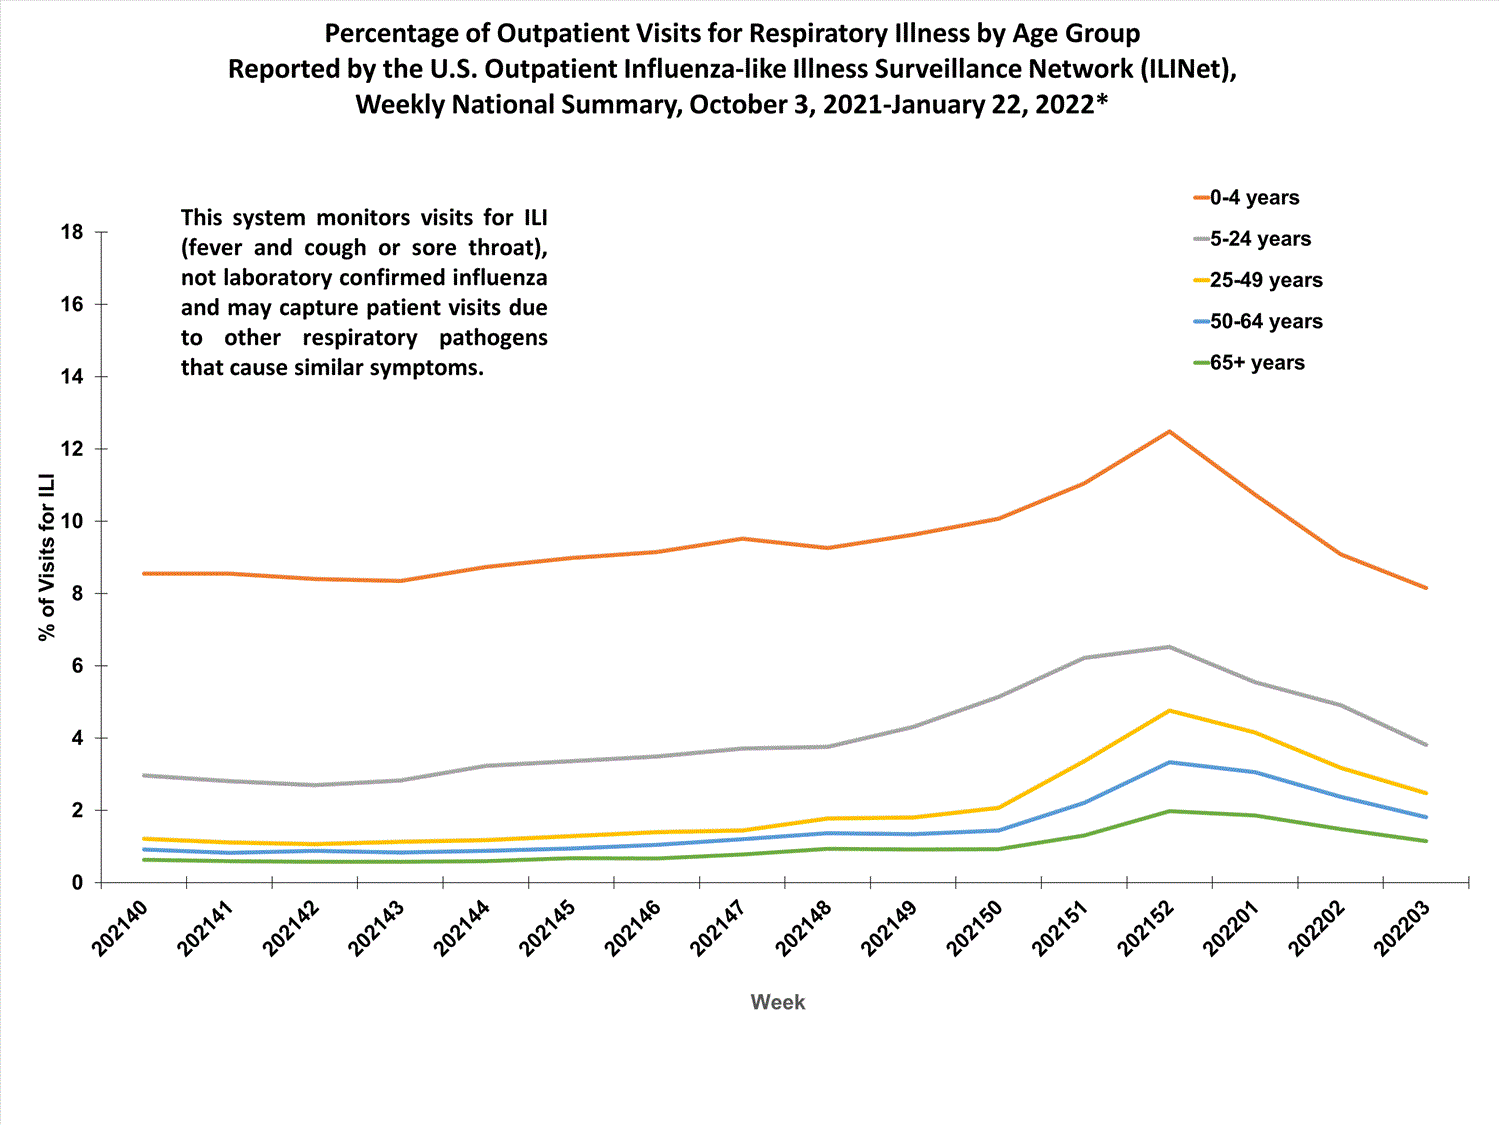
More than 70% of ILINet participants provide both the number of patient visits for ILI and the total number of patient visits for the week broken out by age group. Data from this subset of providers are used to calculate the percentages of patient visits for ILI by age group.

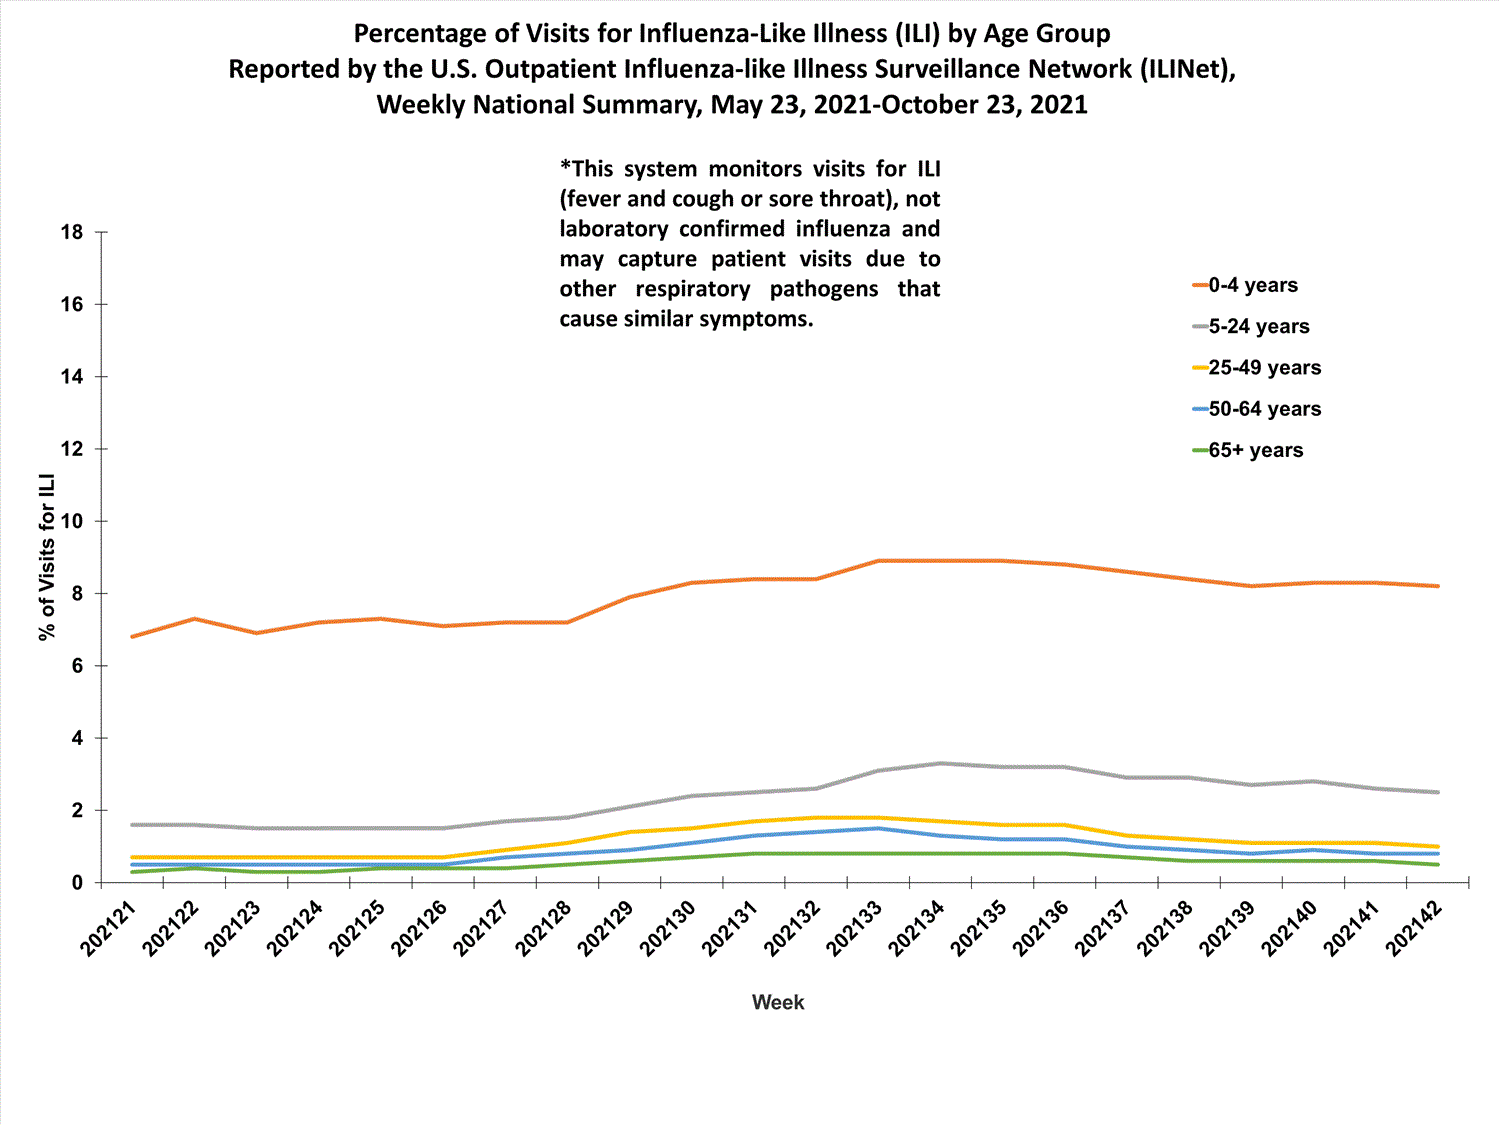
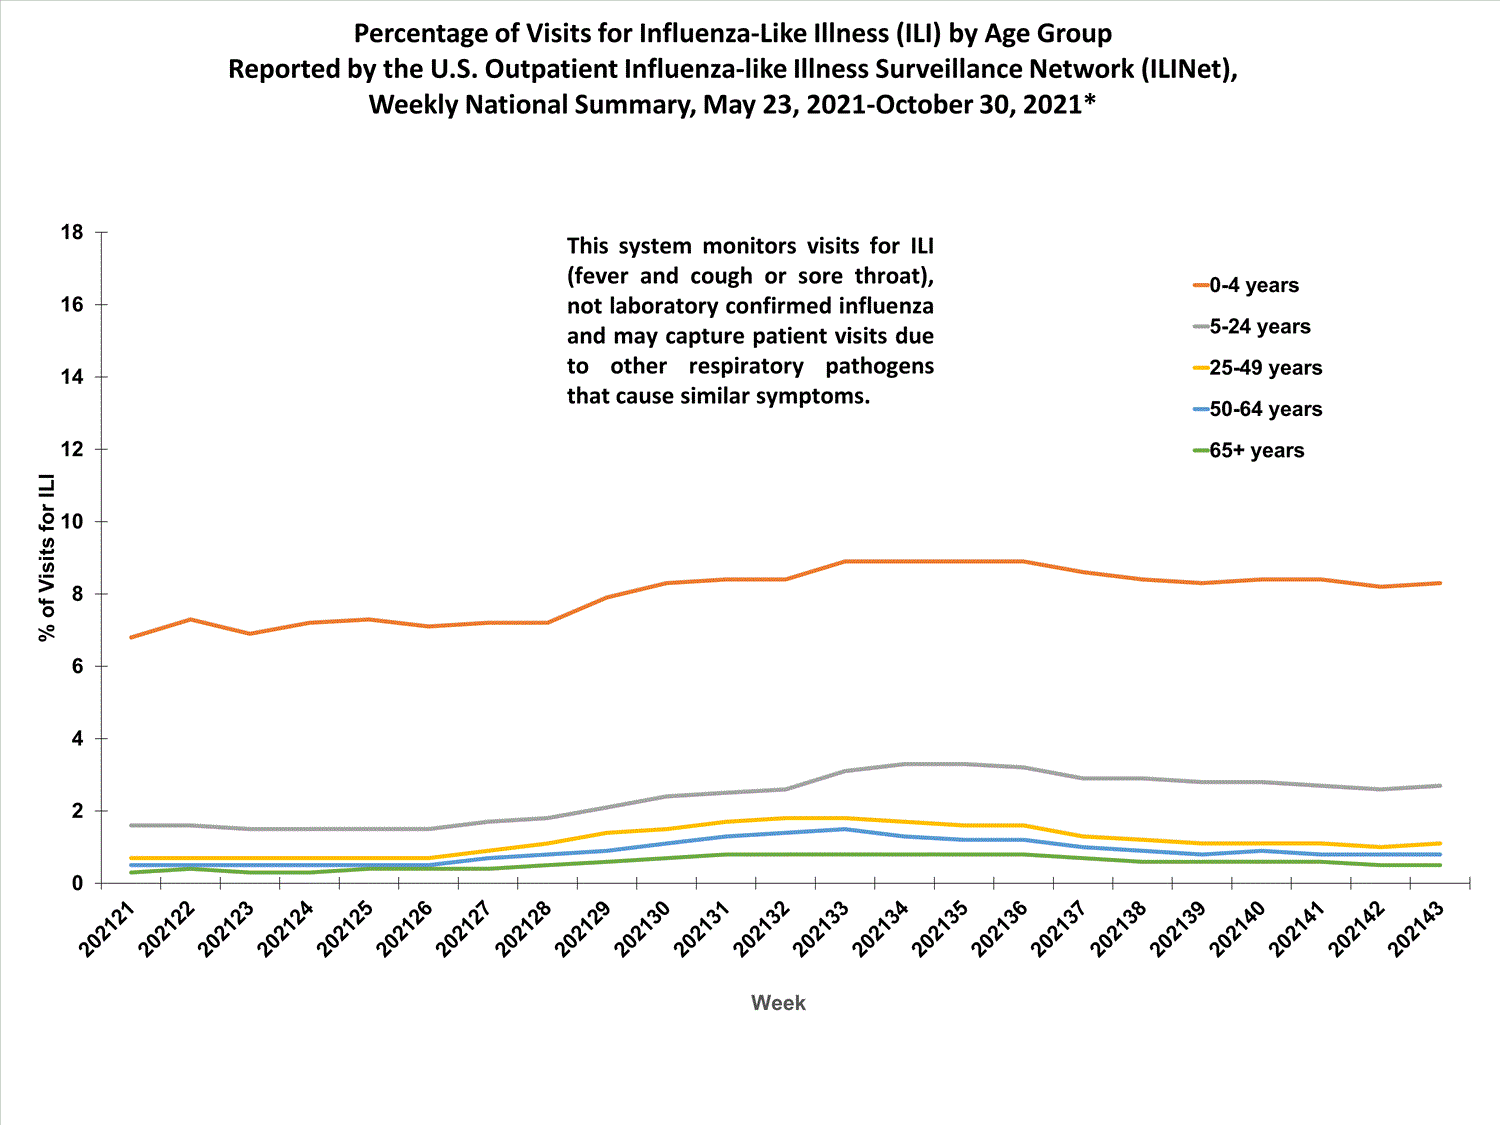
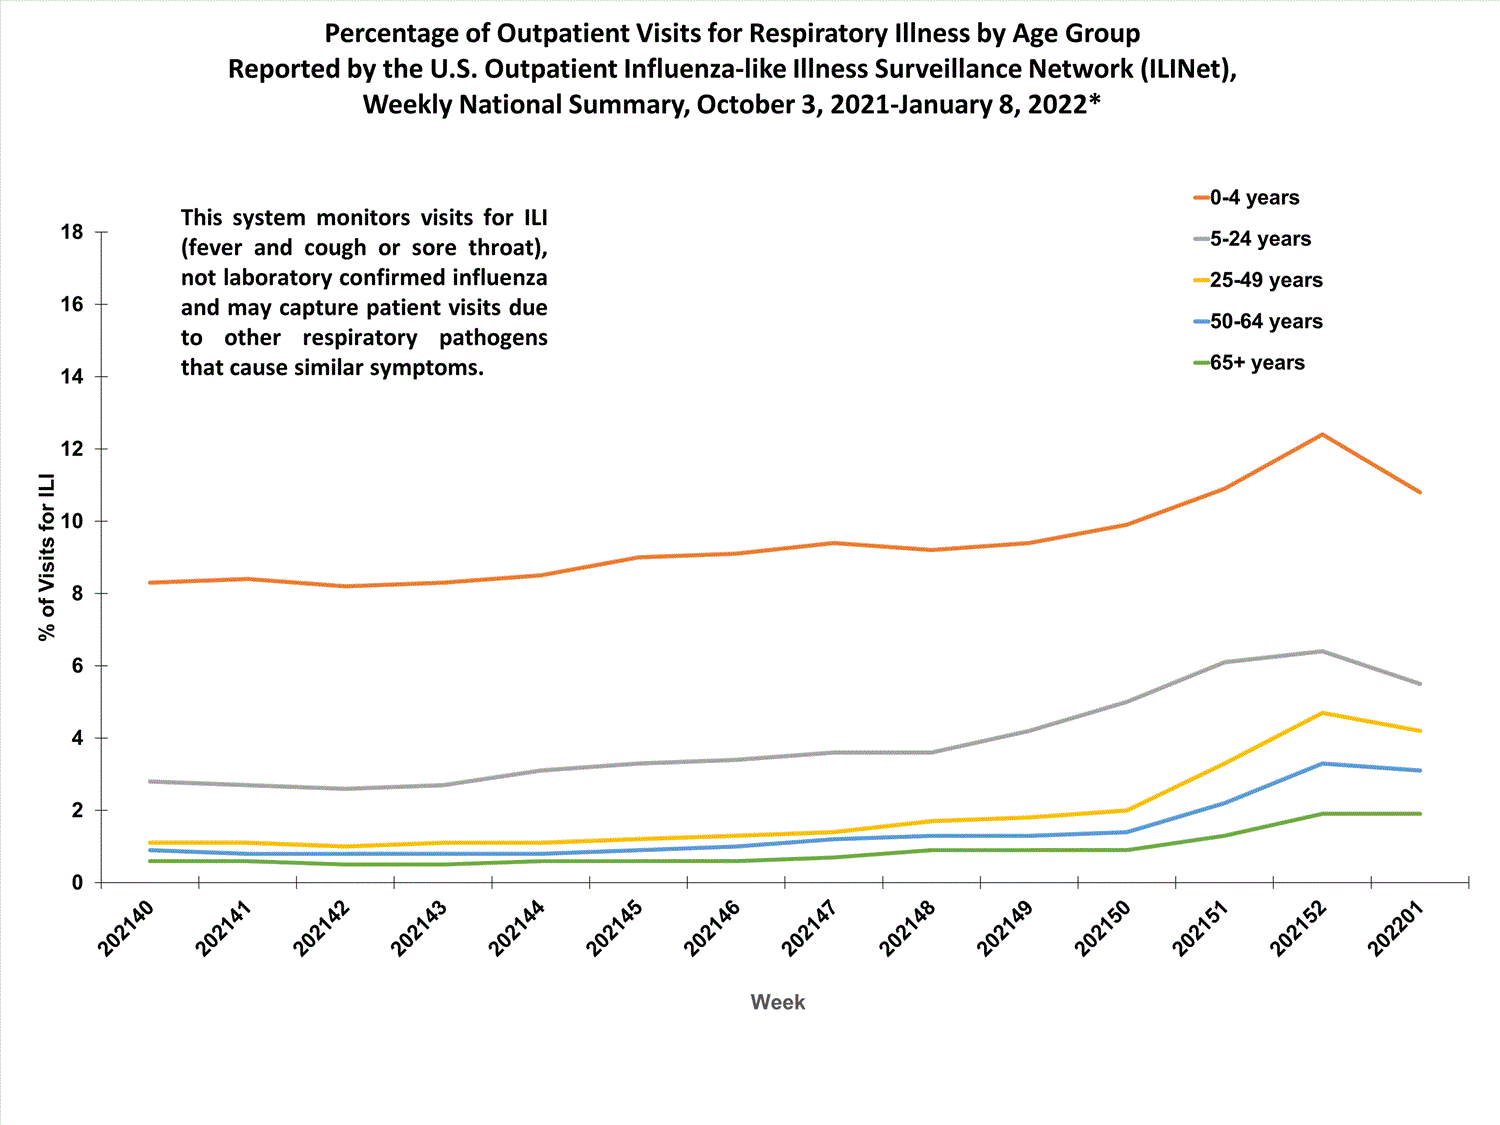
The percentages of visits for ILI reported in ILINet in week 40 remained stable compared to week 39 for all age groups (0–4 years, 5–24 years, 25–49 years, 50–64 years, and 65+ years) and is showing a decreasing trend over at least the past four weeks for all age groups.


View Chart Data | View Full ScreenILI Activity Map


Data collected in ILINet are used to produce a measure of ILI activity* by state/jurisdiction and Core Based Statistical Areas (CBSA).
Week 40
(Week ending
Oct. 9, 2021)
Week 39
(Week ending
Oct. 2, 2021)
Week 40
(Week ending
Oct. 9, 2021)
Week 39
(Week ending
Oct. 2, 2021)
Very High1010
High0037
Moderate112218
Low599177
Minimal4843503485
Insufficient Data02309342


*Data collected in ILINet may disproportionally represent certain populations within a jurisdiction or CBSA, and therefore, may not accurately depict the full picture of influenza activity for the entire jurisdiction or CBSA. Differences in the data presented here by CDC and independently by some health departments likely represent differing levels of data completeness with data presented by the health department likely being the more complete.
Additional information about medically attended visits for ILI for current and past seasons:
Surveillance Methods | FluView Interactive: National, Regional, and State Data or ILI Activity Map
Long-term Care Facility (LTCF) Surveillance


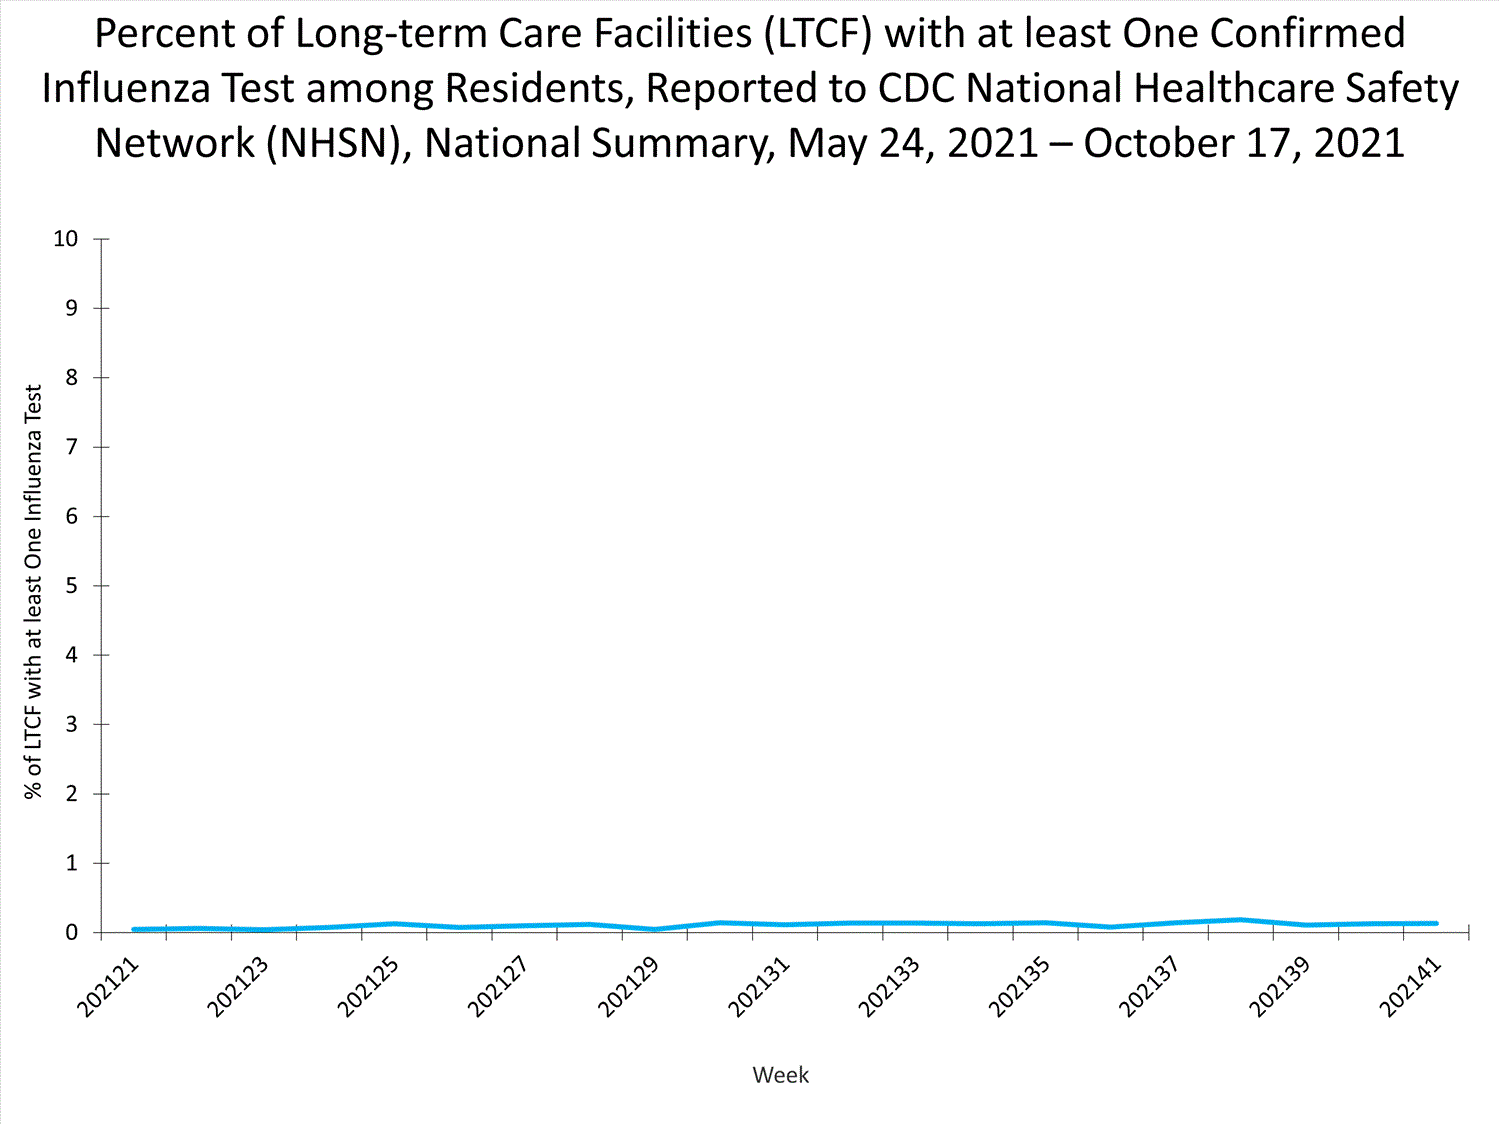
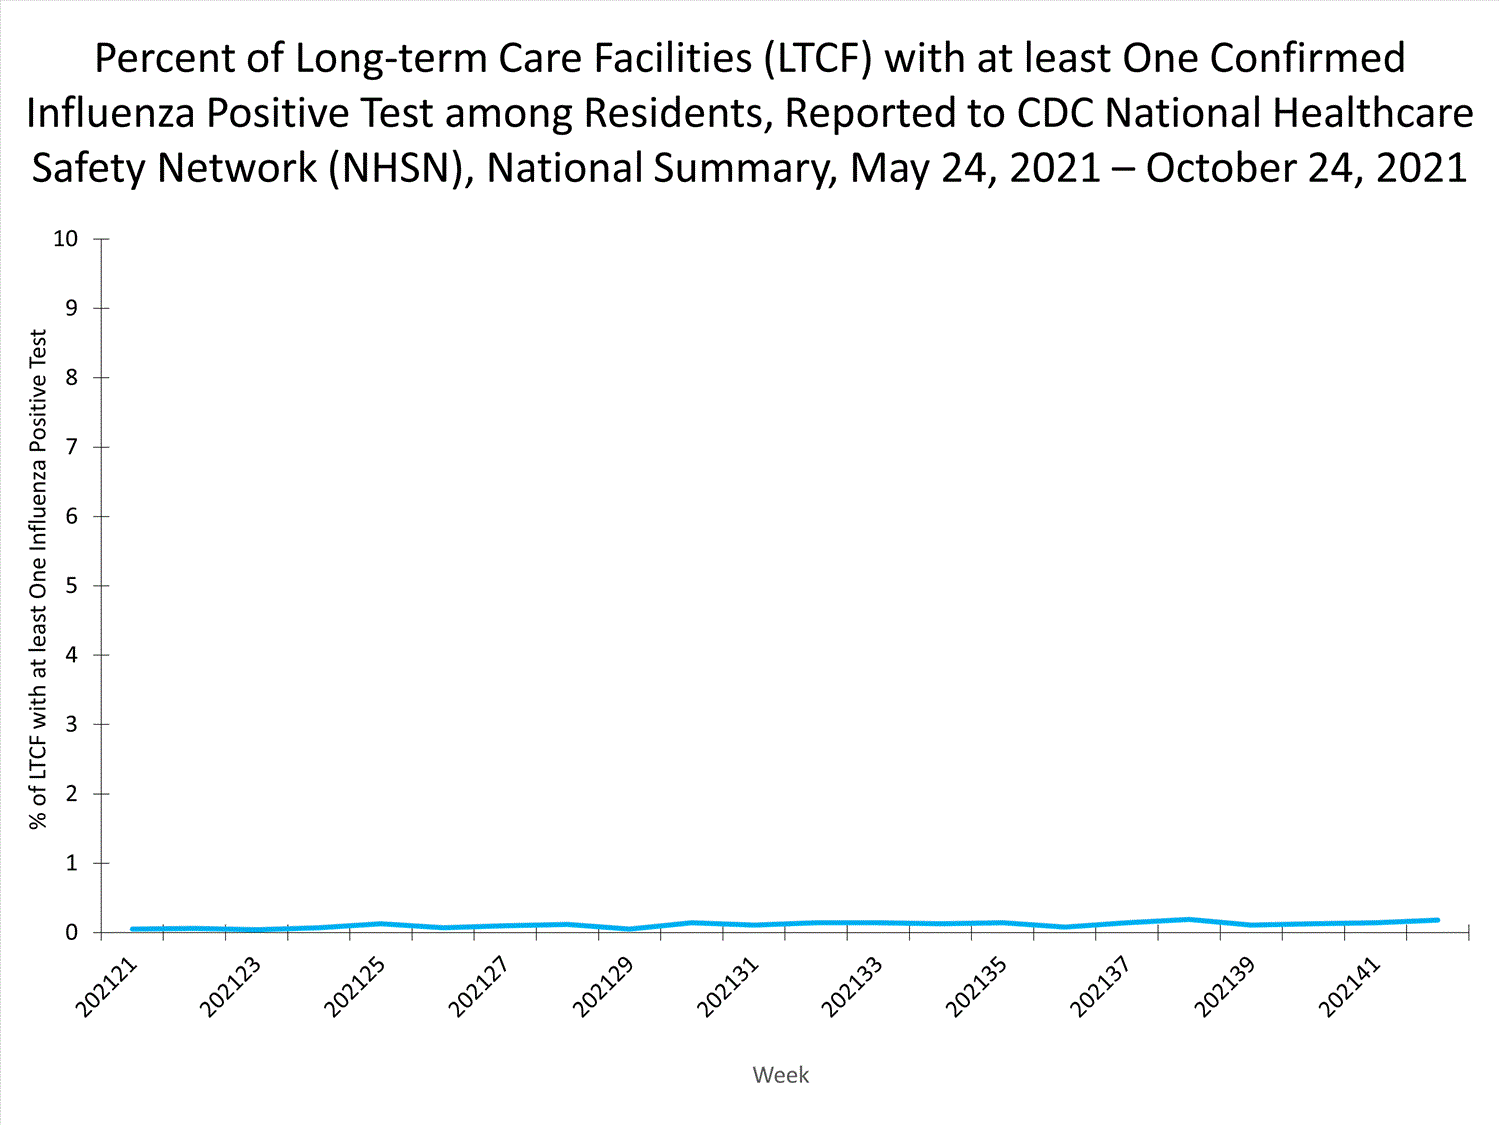
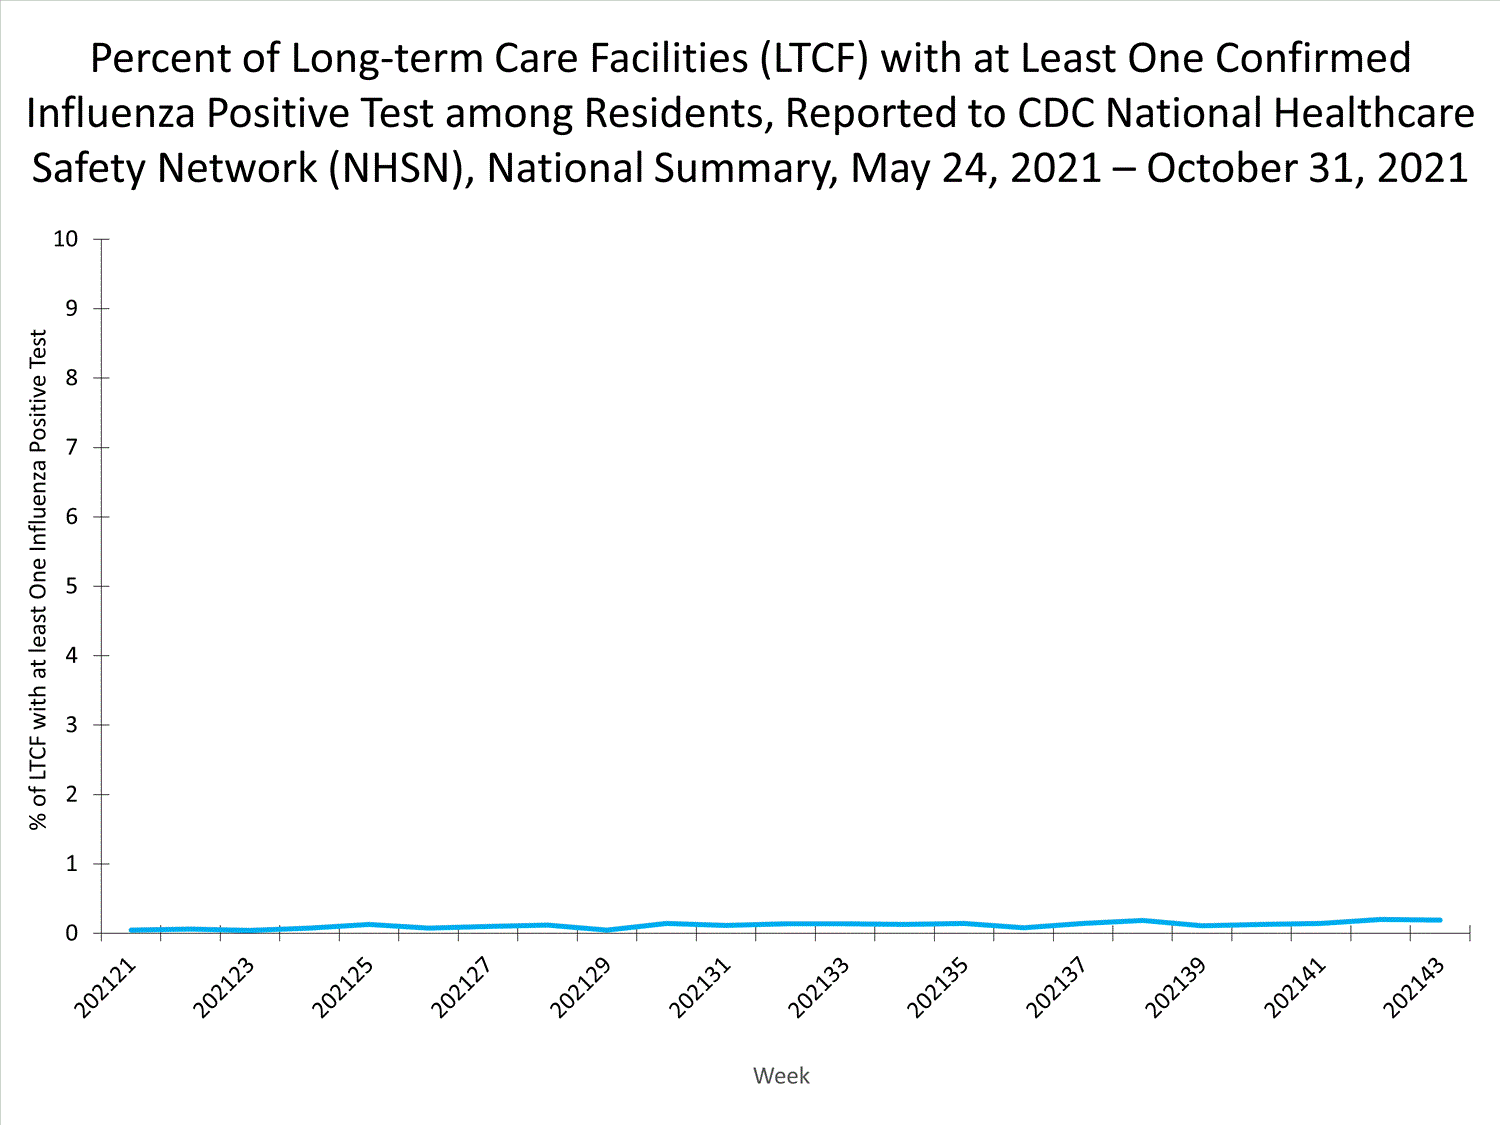
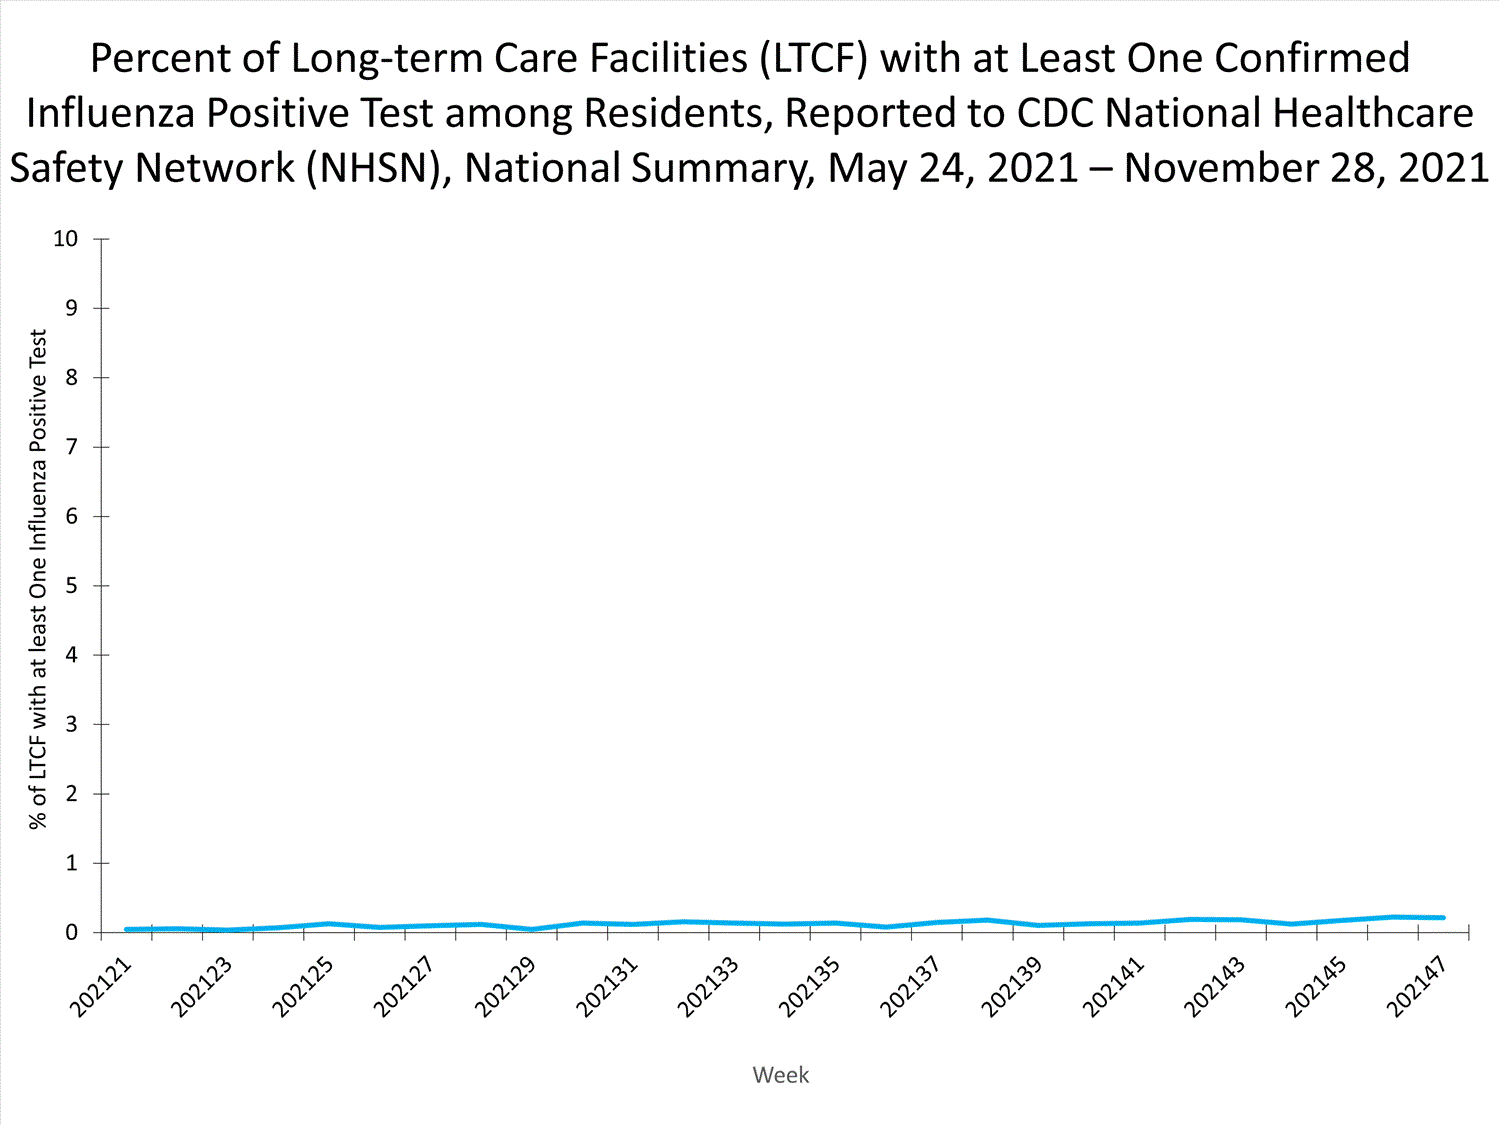
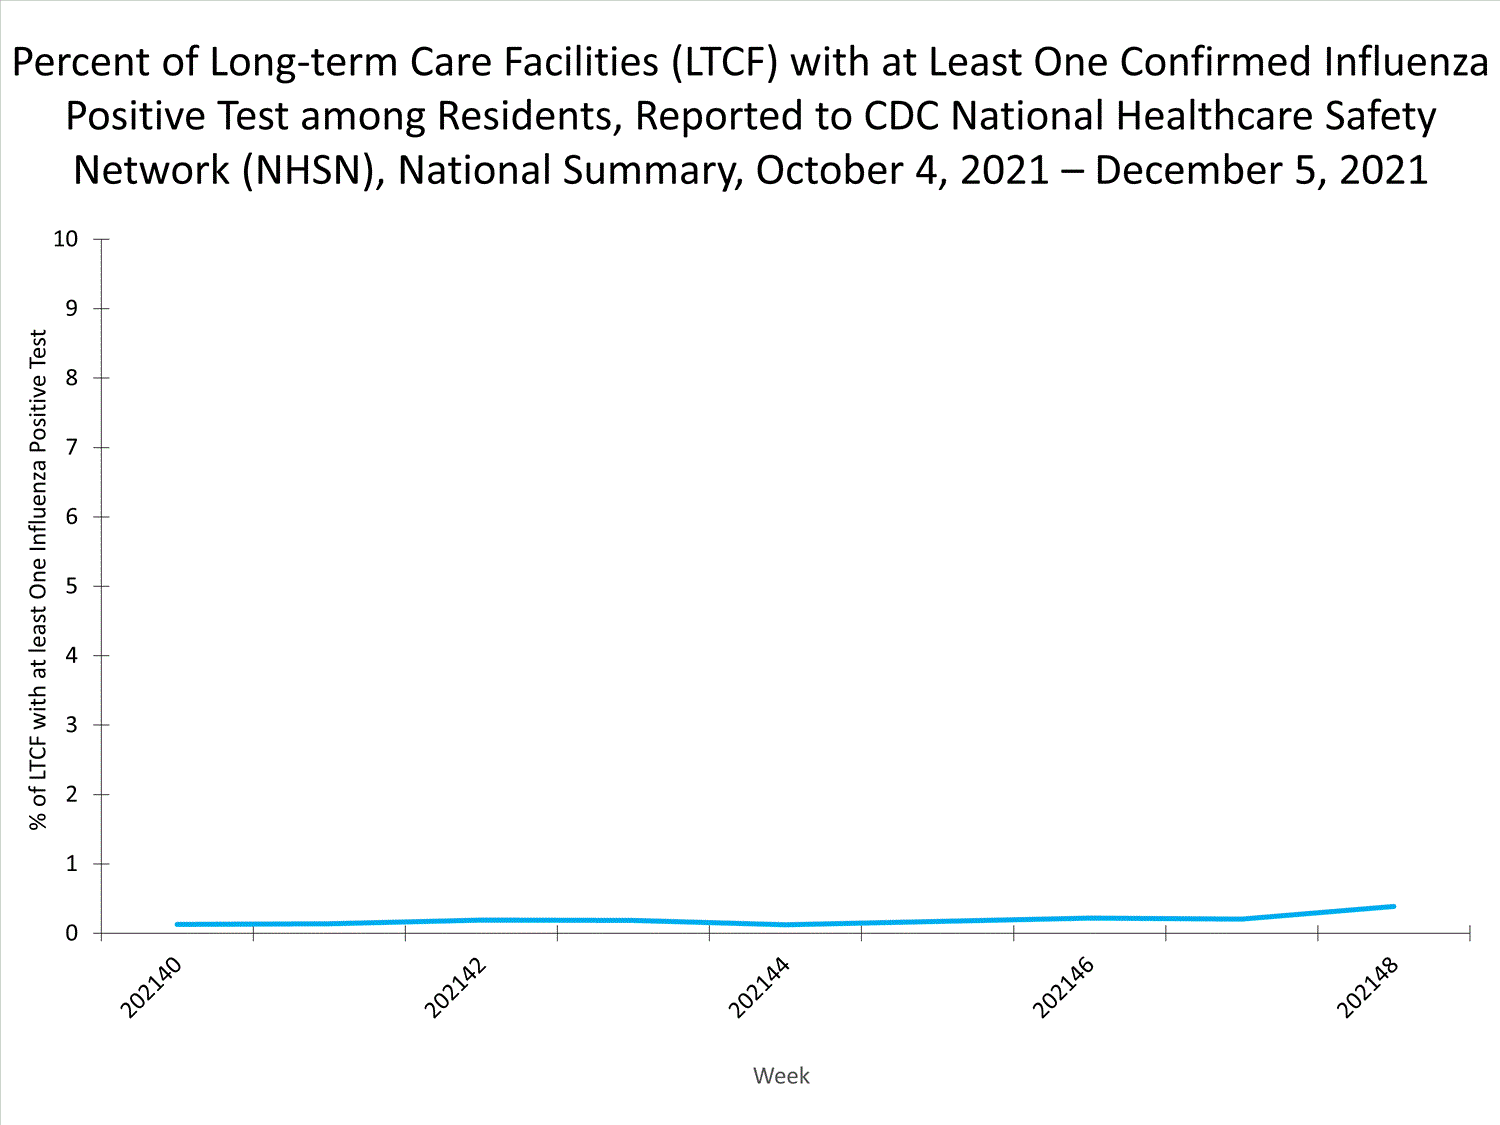
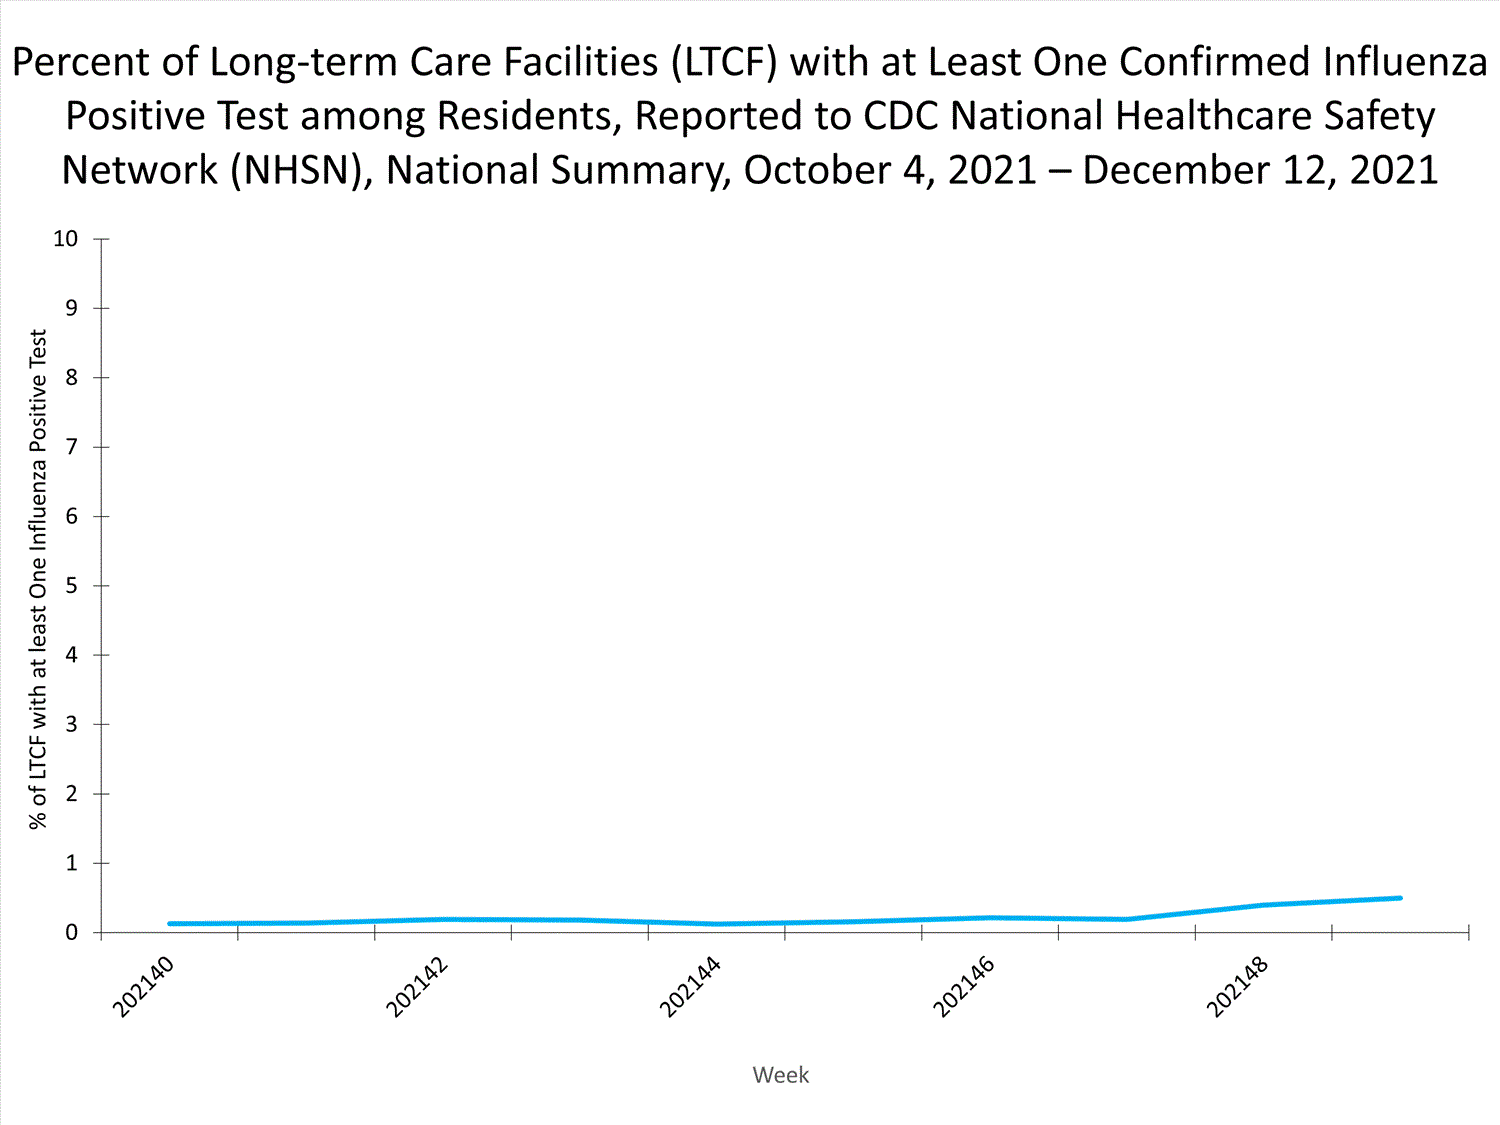
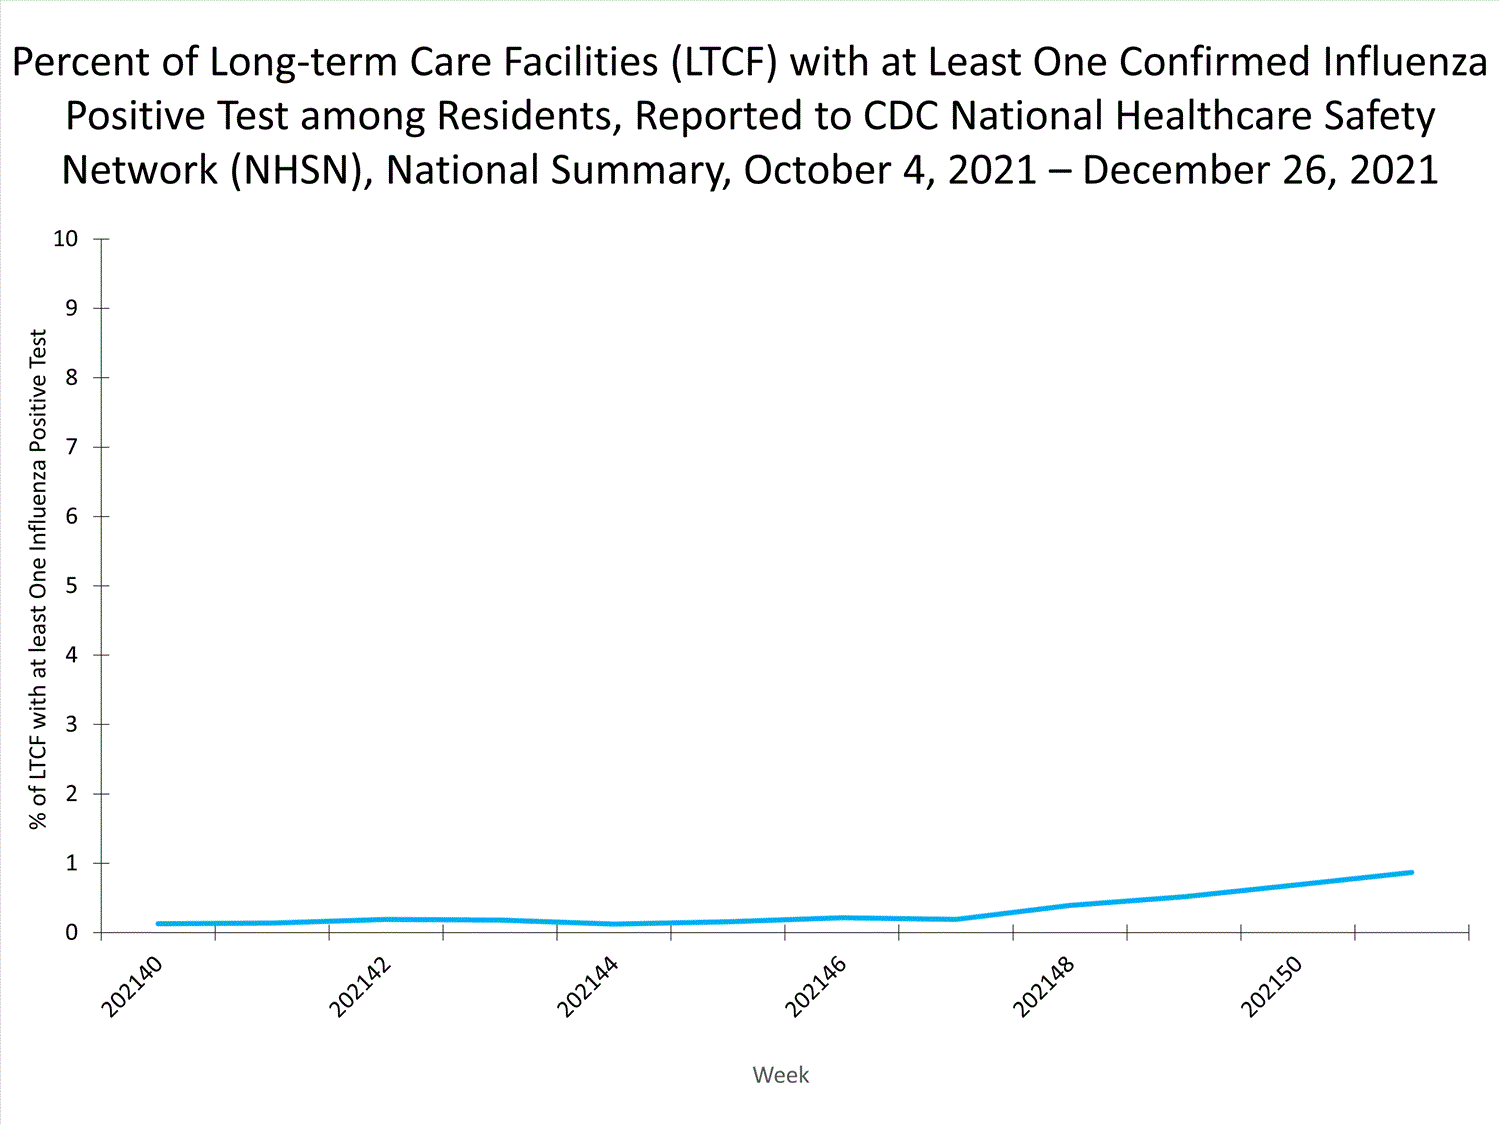
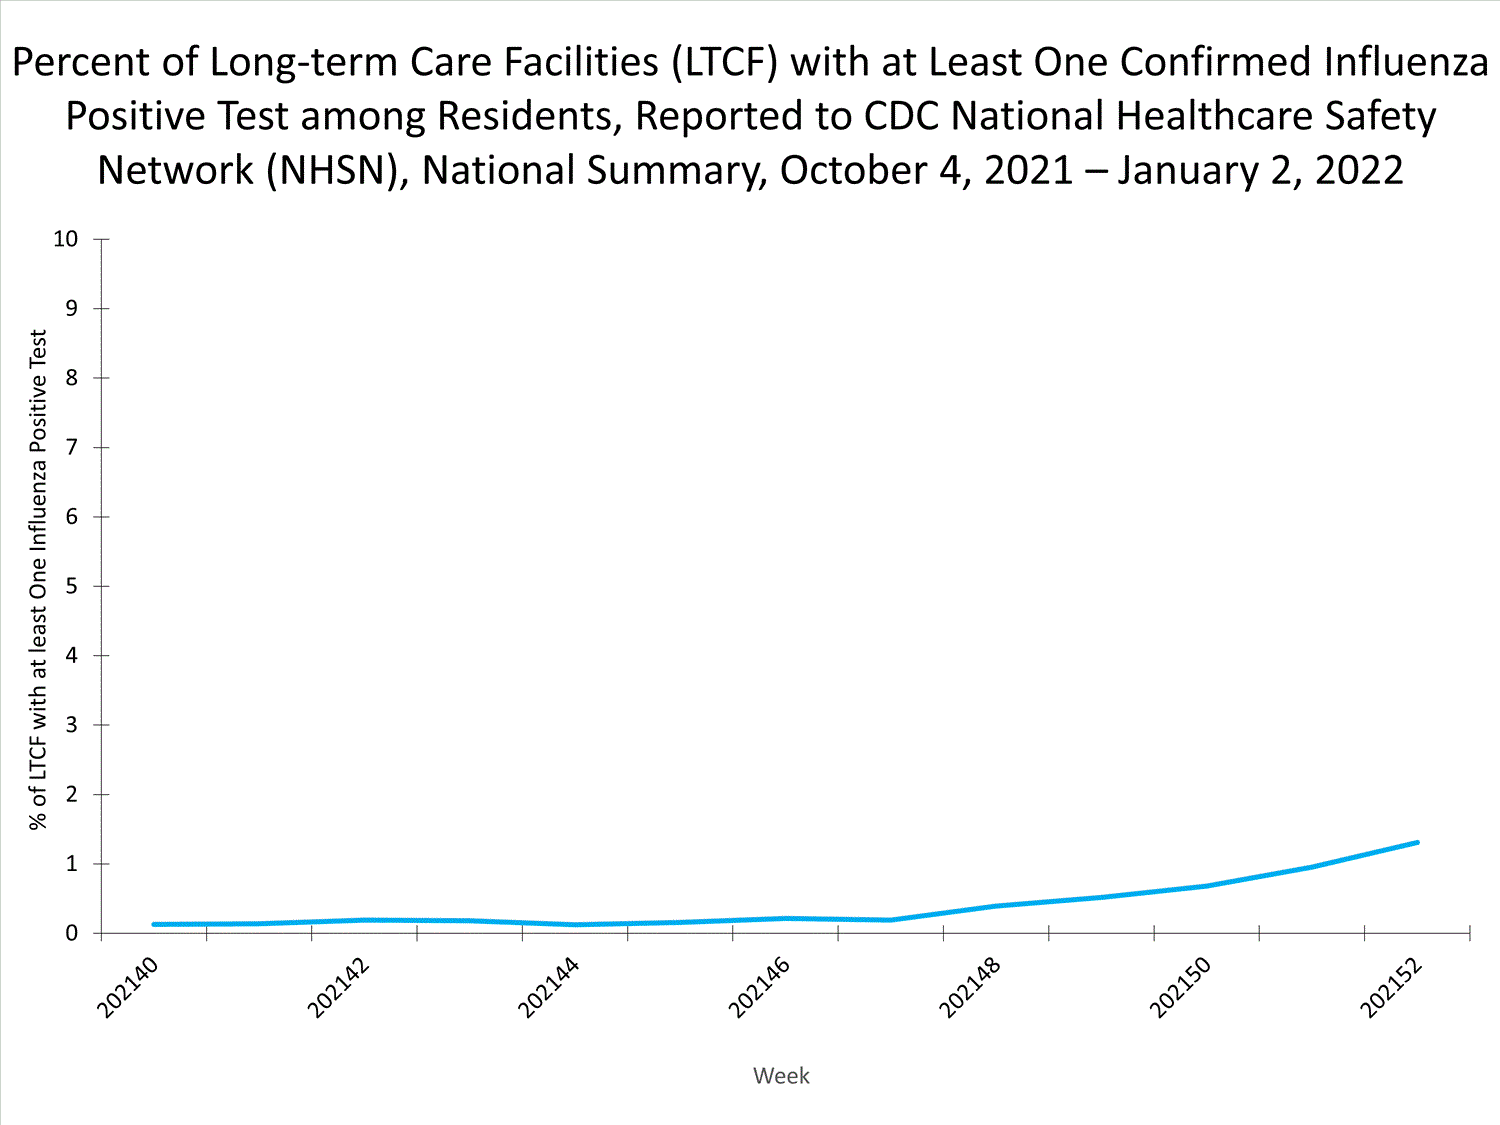
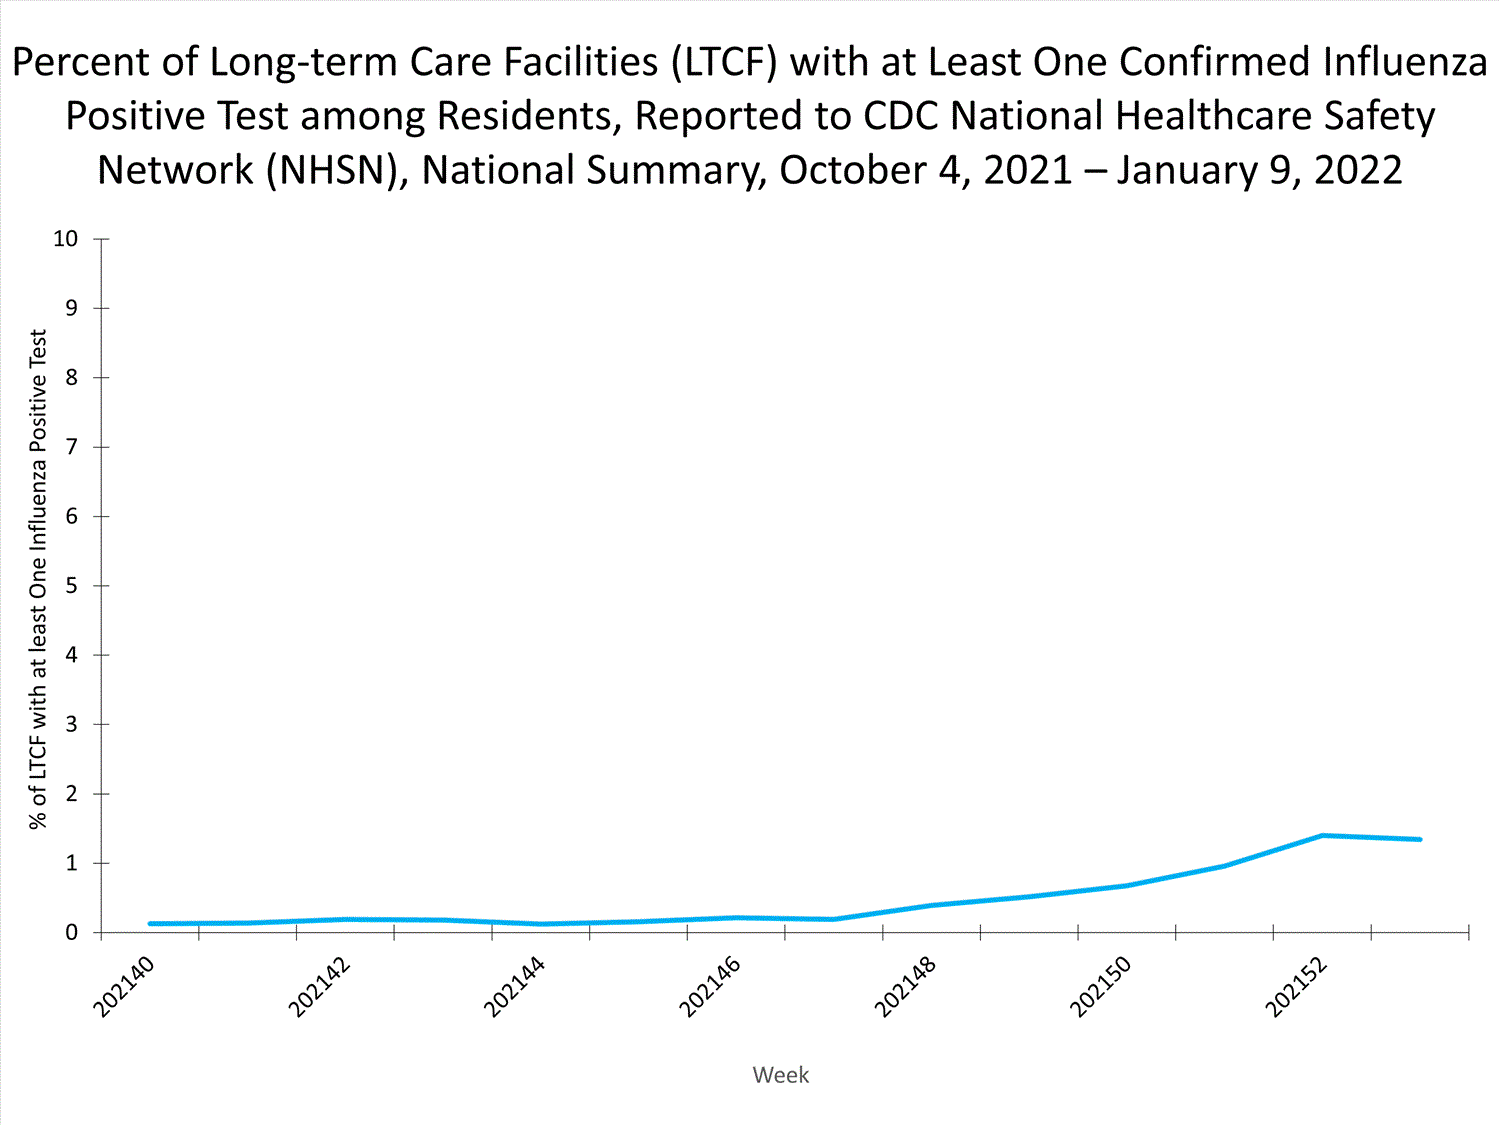
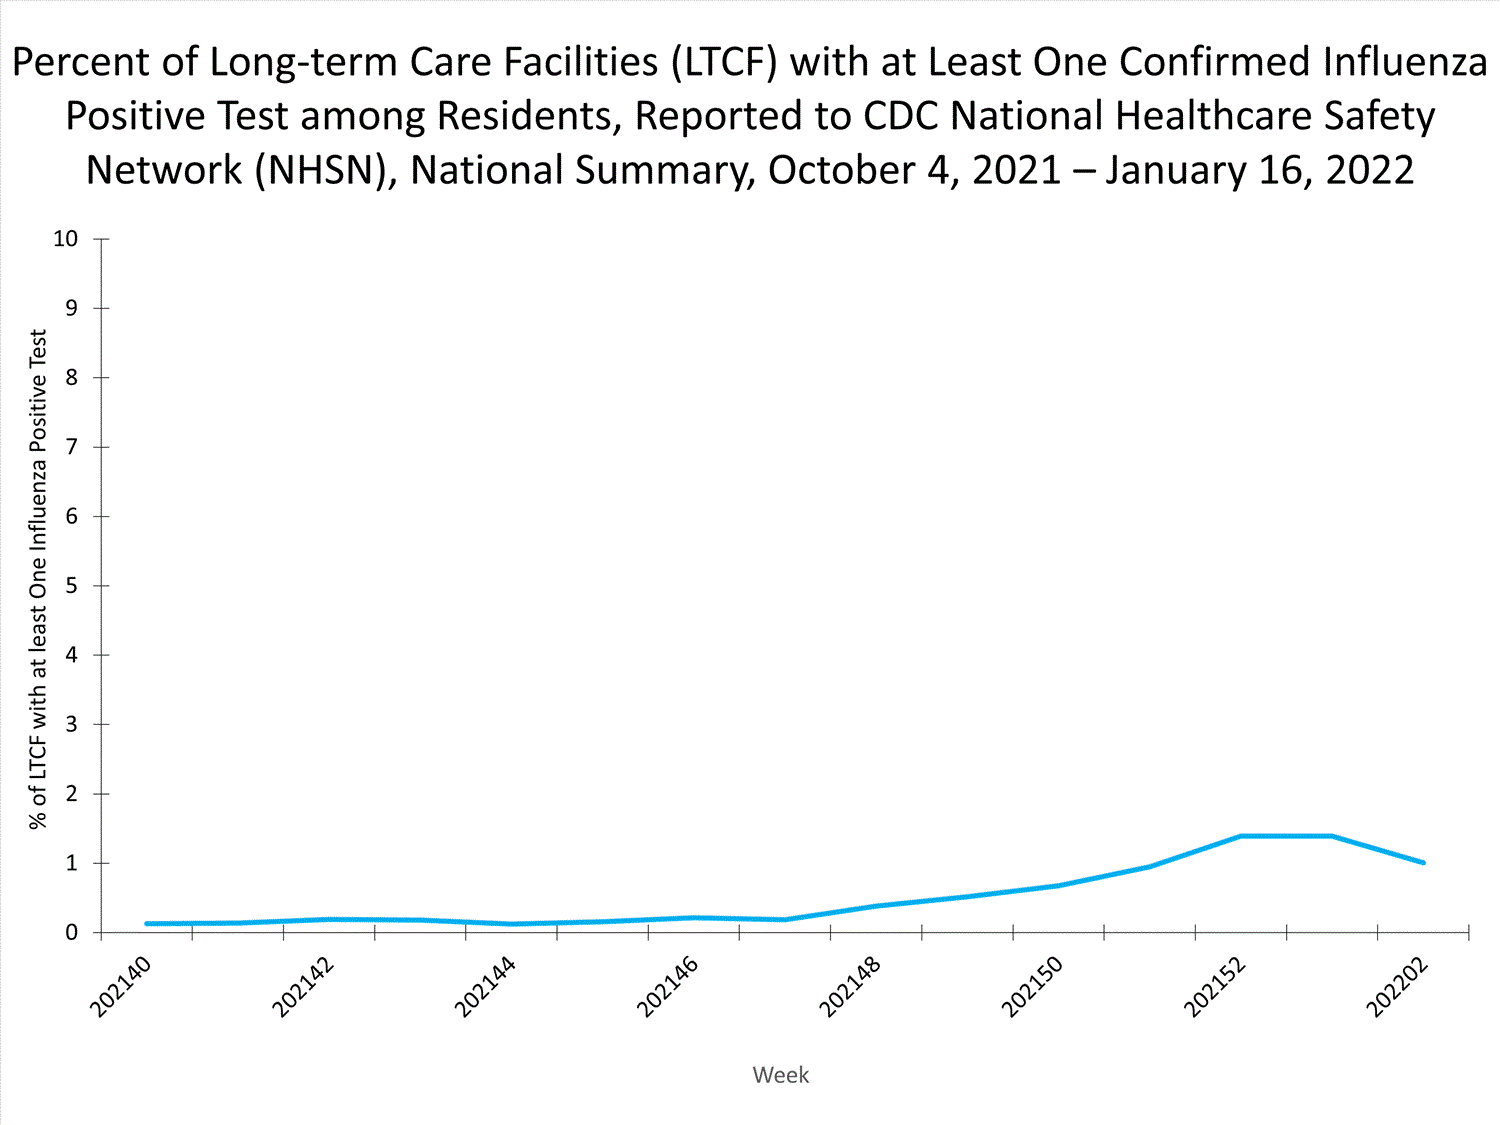
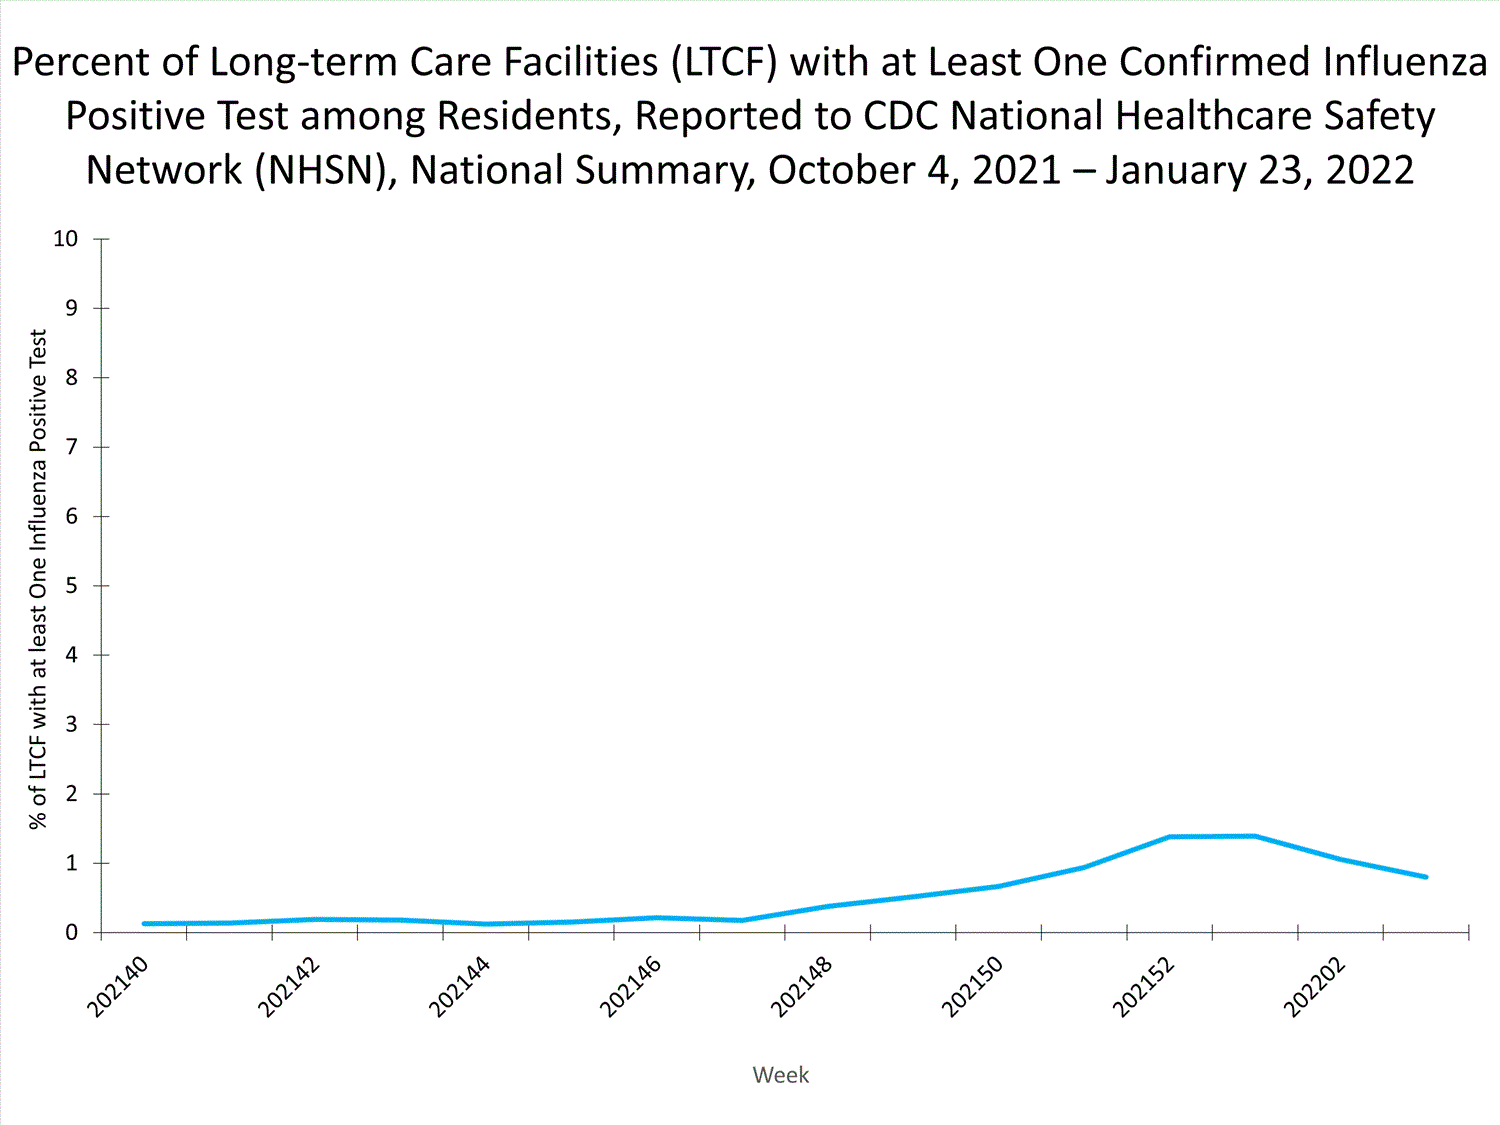
LTCFs (e.g., nursing homes/skilled nursing, long-term care for the developmentally disabled, and assisted living facilities) from all 50 states and U.S. territories report data on influenza infections among residents the NHSN Long-term Care Facility Component. During week 40, 18 (0.13%) of 14,297 reporting LTCFs reported at least one laboratory-confirmed influenza test among their residents.


View Chart Dataexcel icon | View Full Screen
Additional information about long-term care facility surveillance:
Surveillance Methods | Additional Dataexternal icon
Hospitalization Surveillance

FluSurv-NET


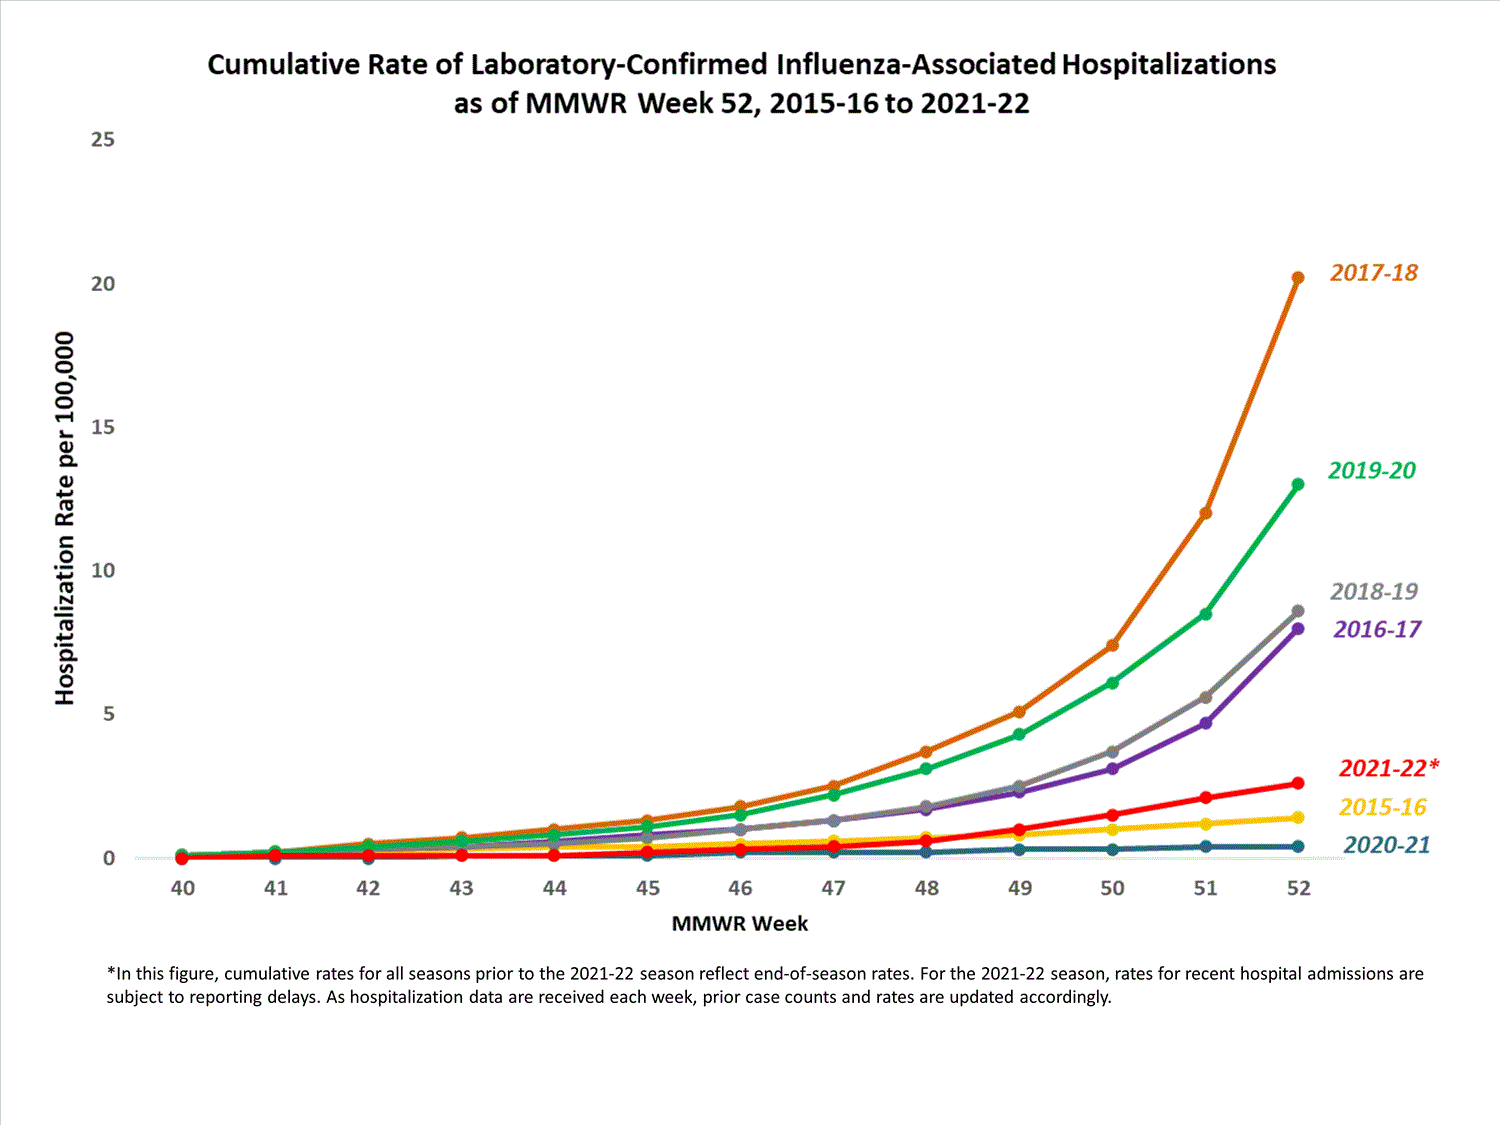
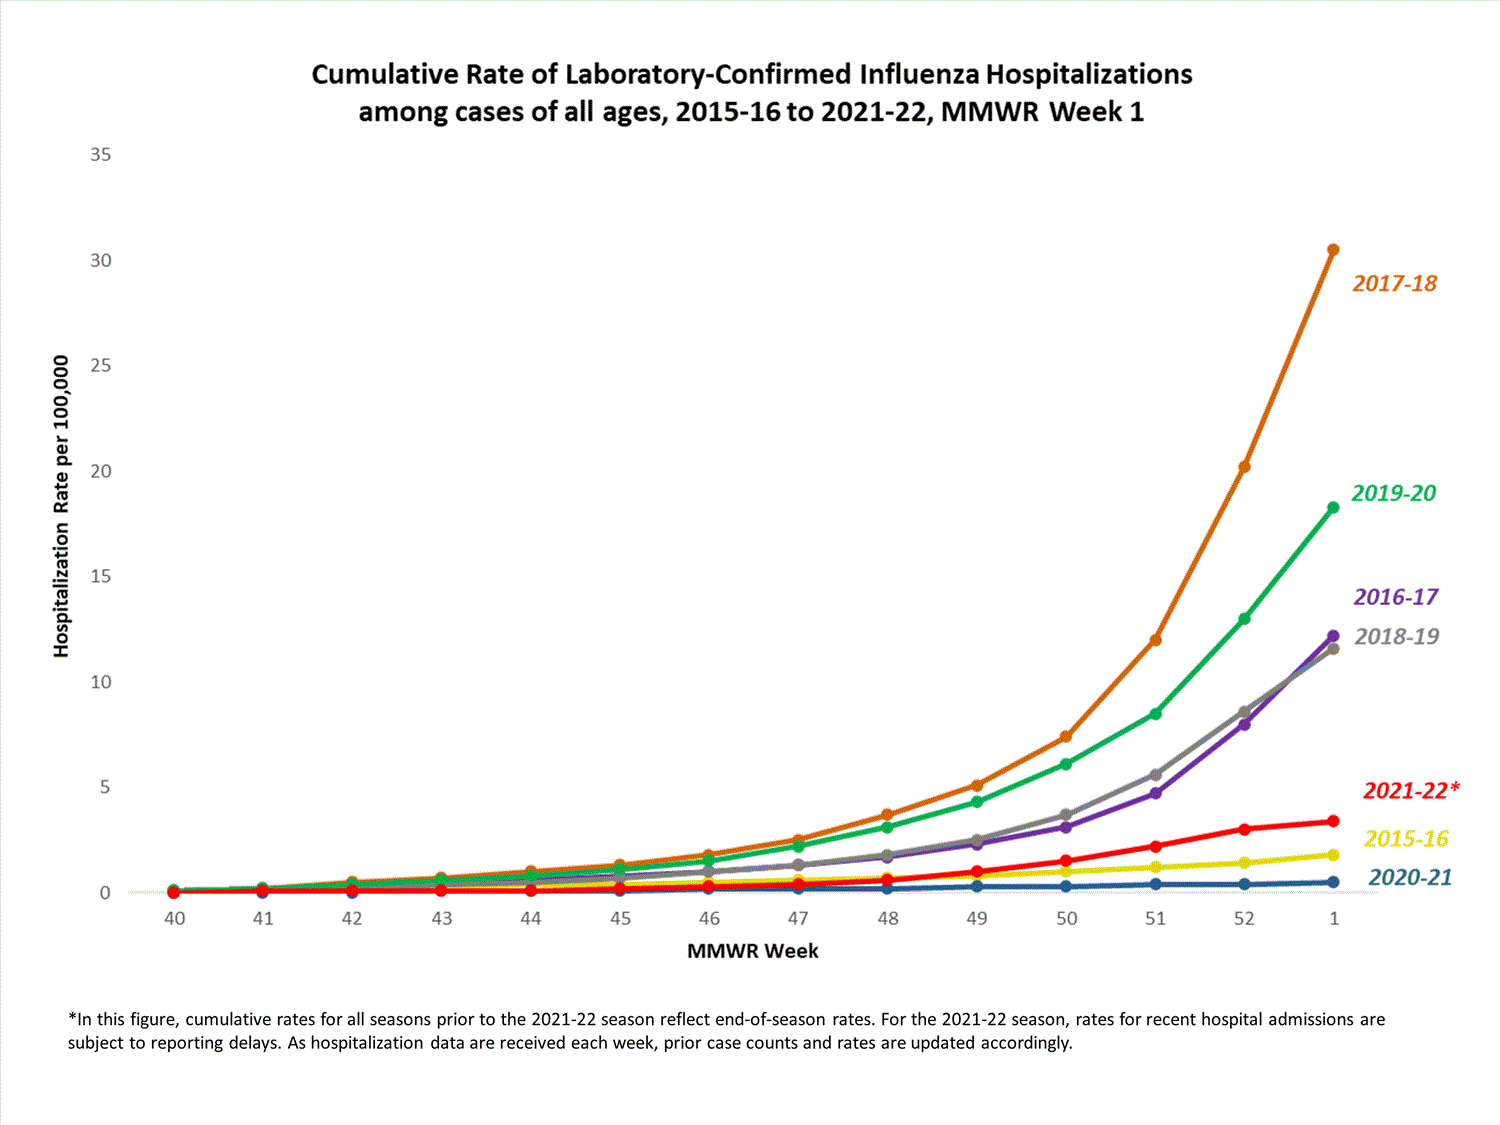
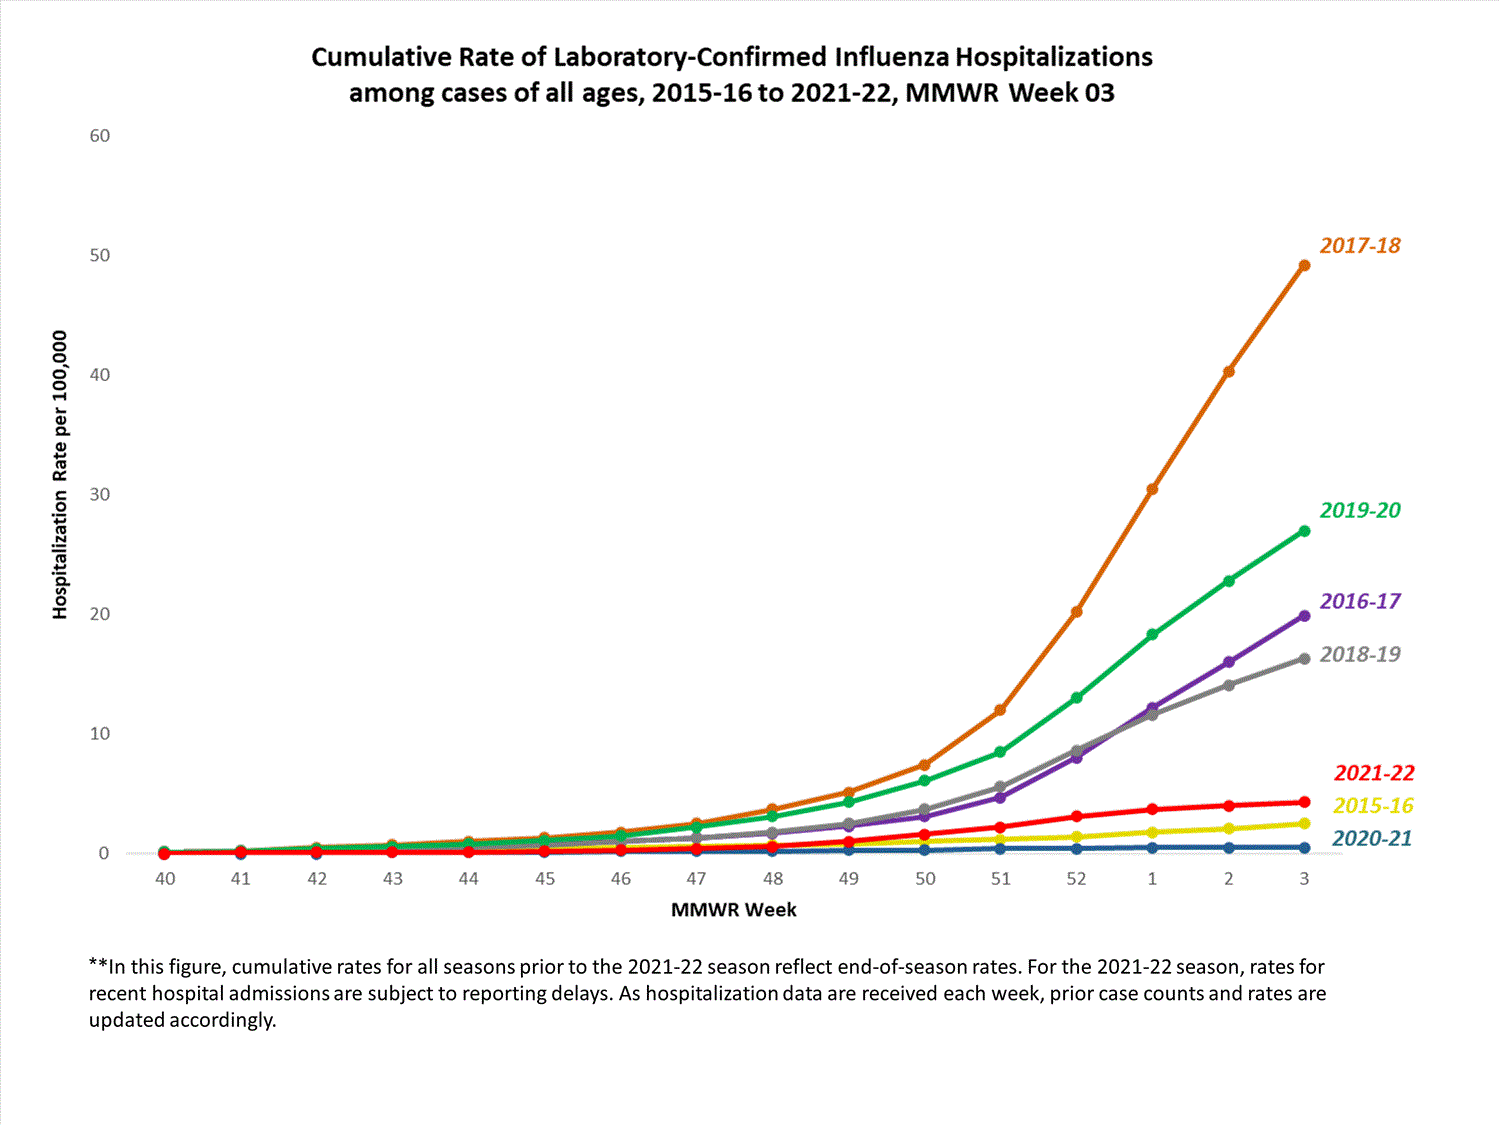
The Influenza Hospitalization Surveillance Network (FluSurv-NET) conducts population-based The Influenza Hospitalization Surveillance Network (FluSurv-NET) conducts population-based surveillance for laboratory-confirmed influenza-related hospitalizations in select counties in 14 states and represents approximately 9% of the U.S. population. FluSurv-NET estimated hospitalization rates will be updated weekly starting later this season.
Additional FluSurv-NET hospitalization surveillance information for current and past seasons and additional age groups:
Surveillance Methods | FluView Interactive
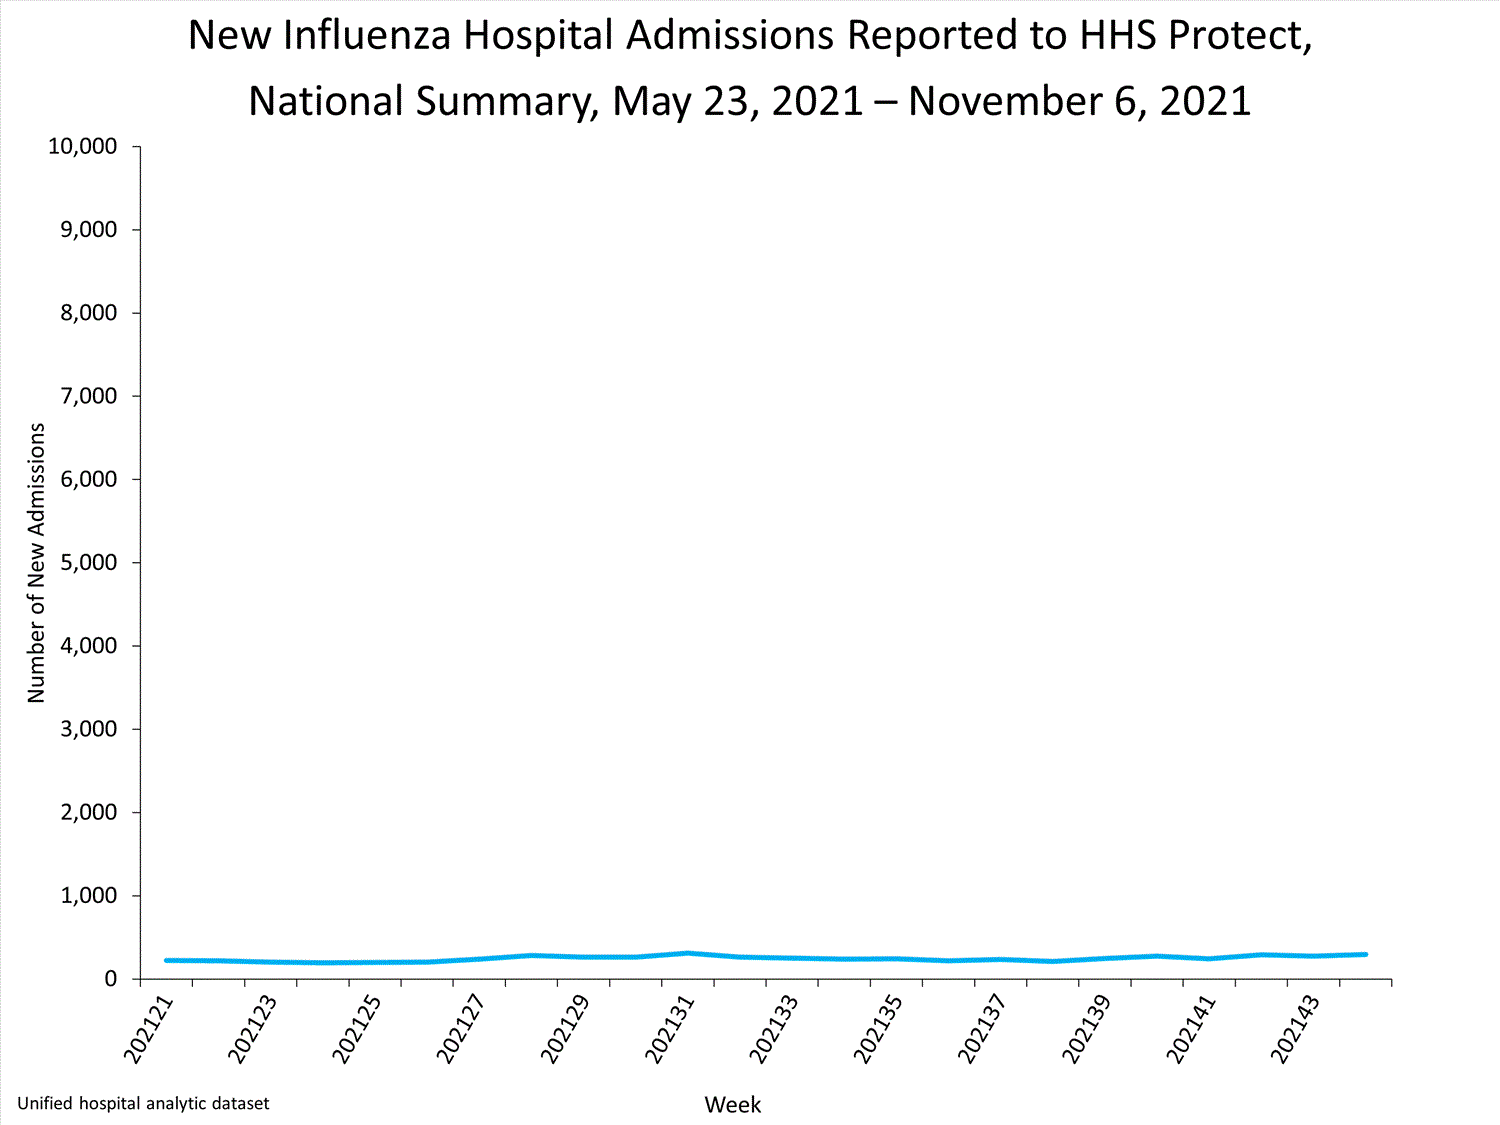
HHS-Protect Hospitalization Surveillance


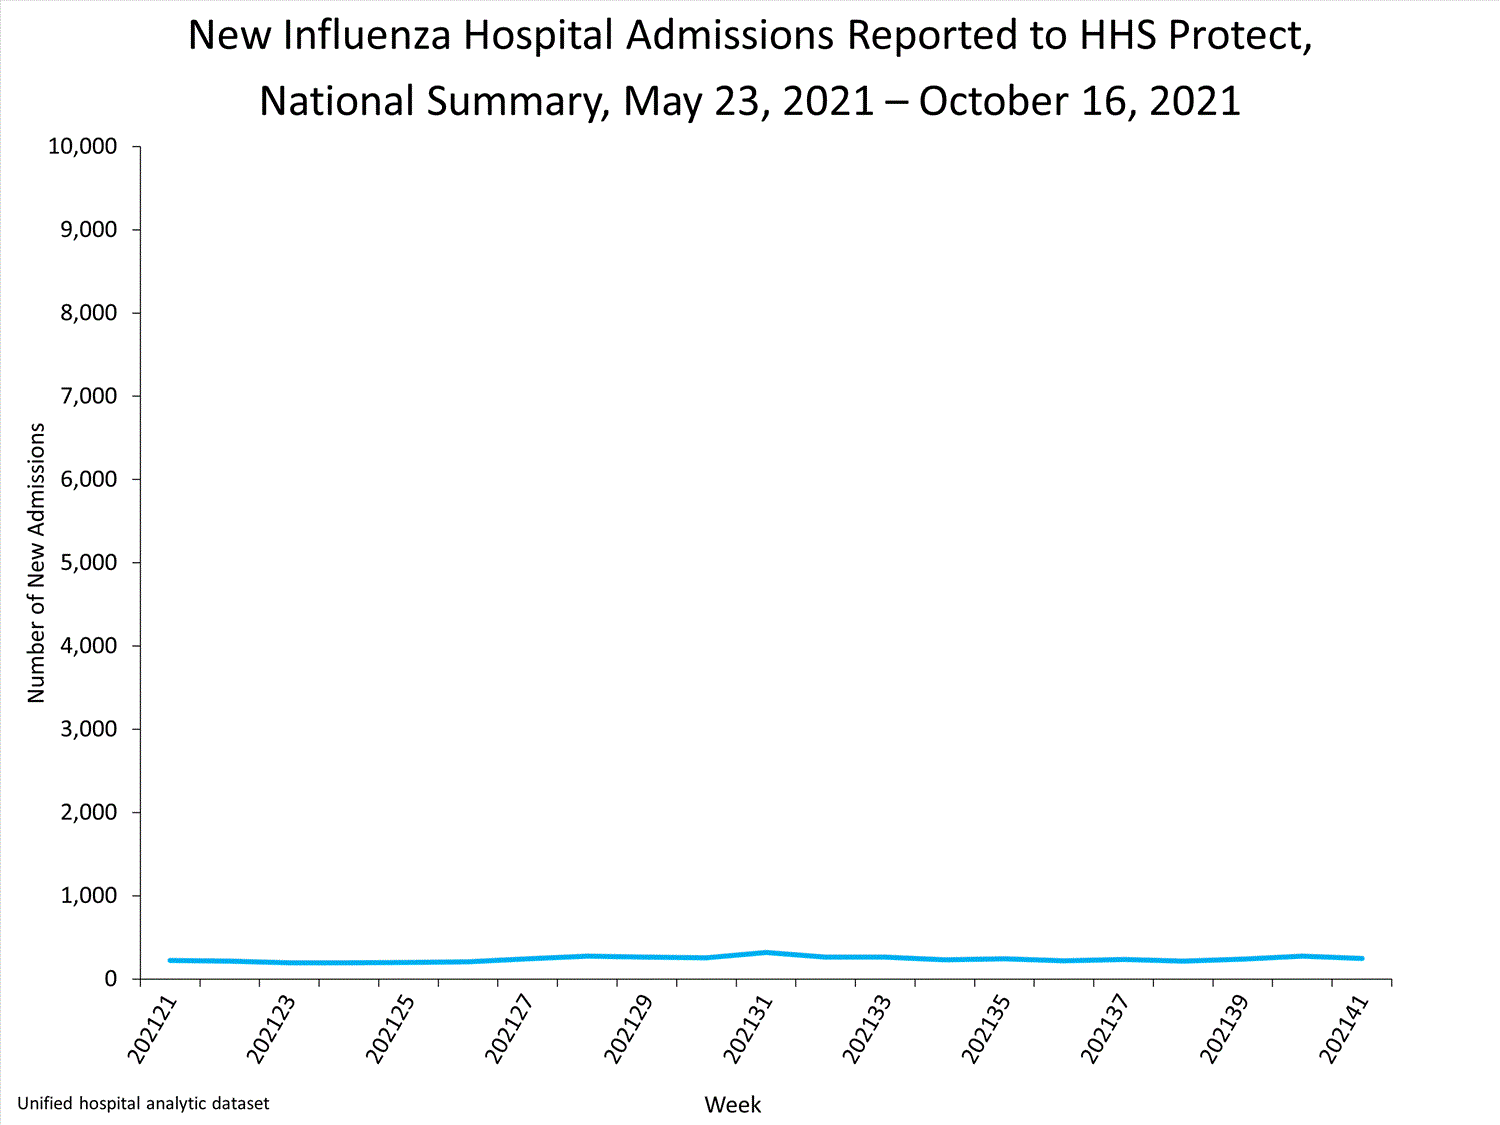
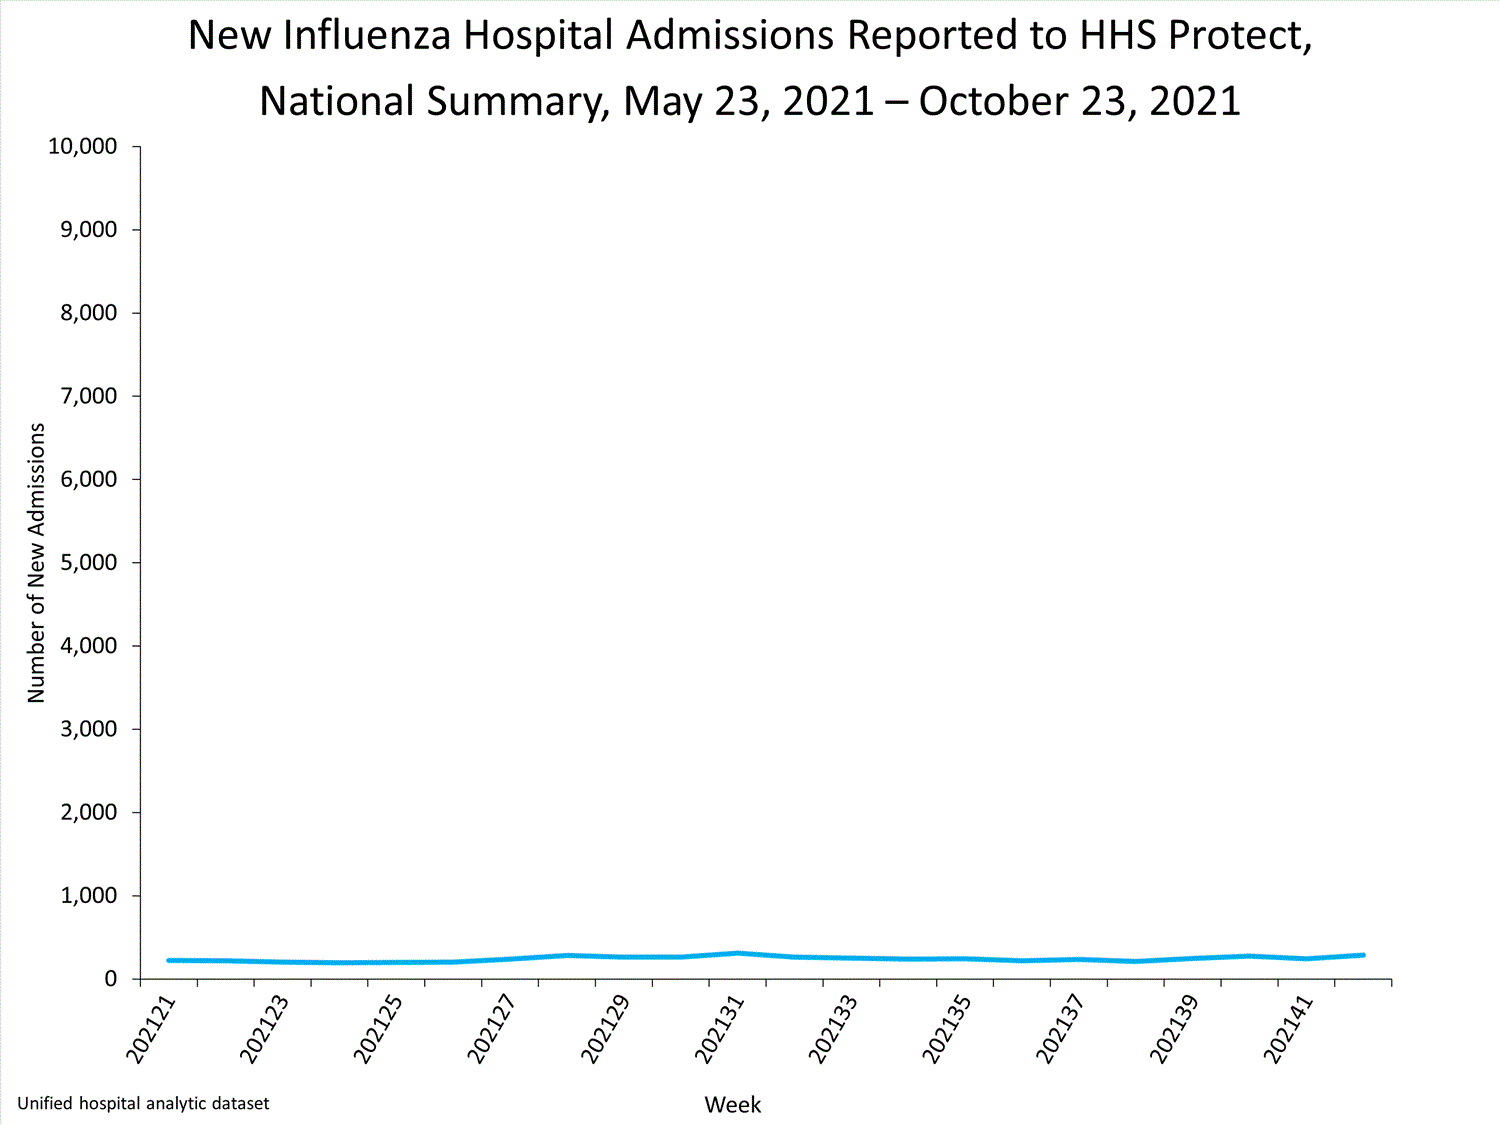
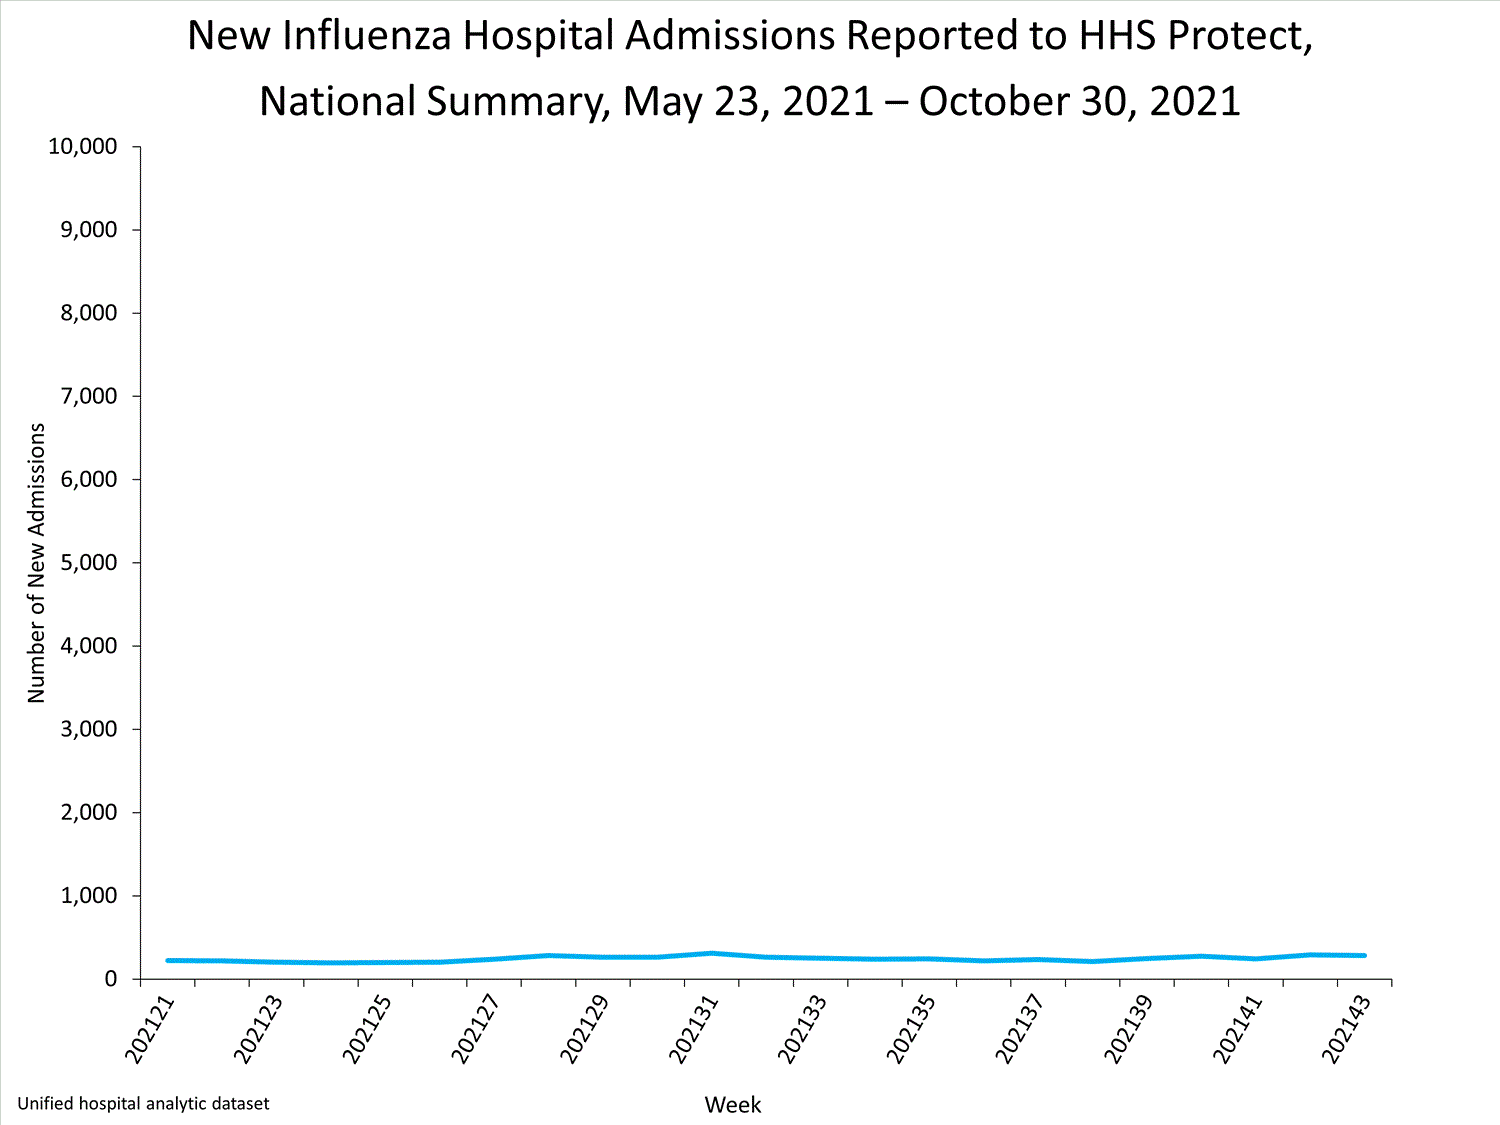
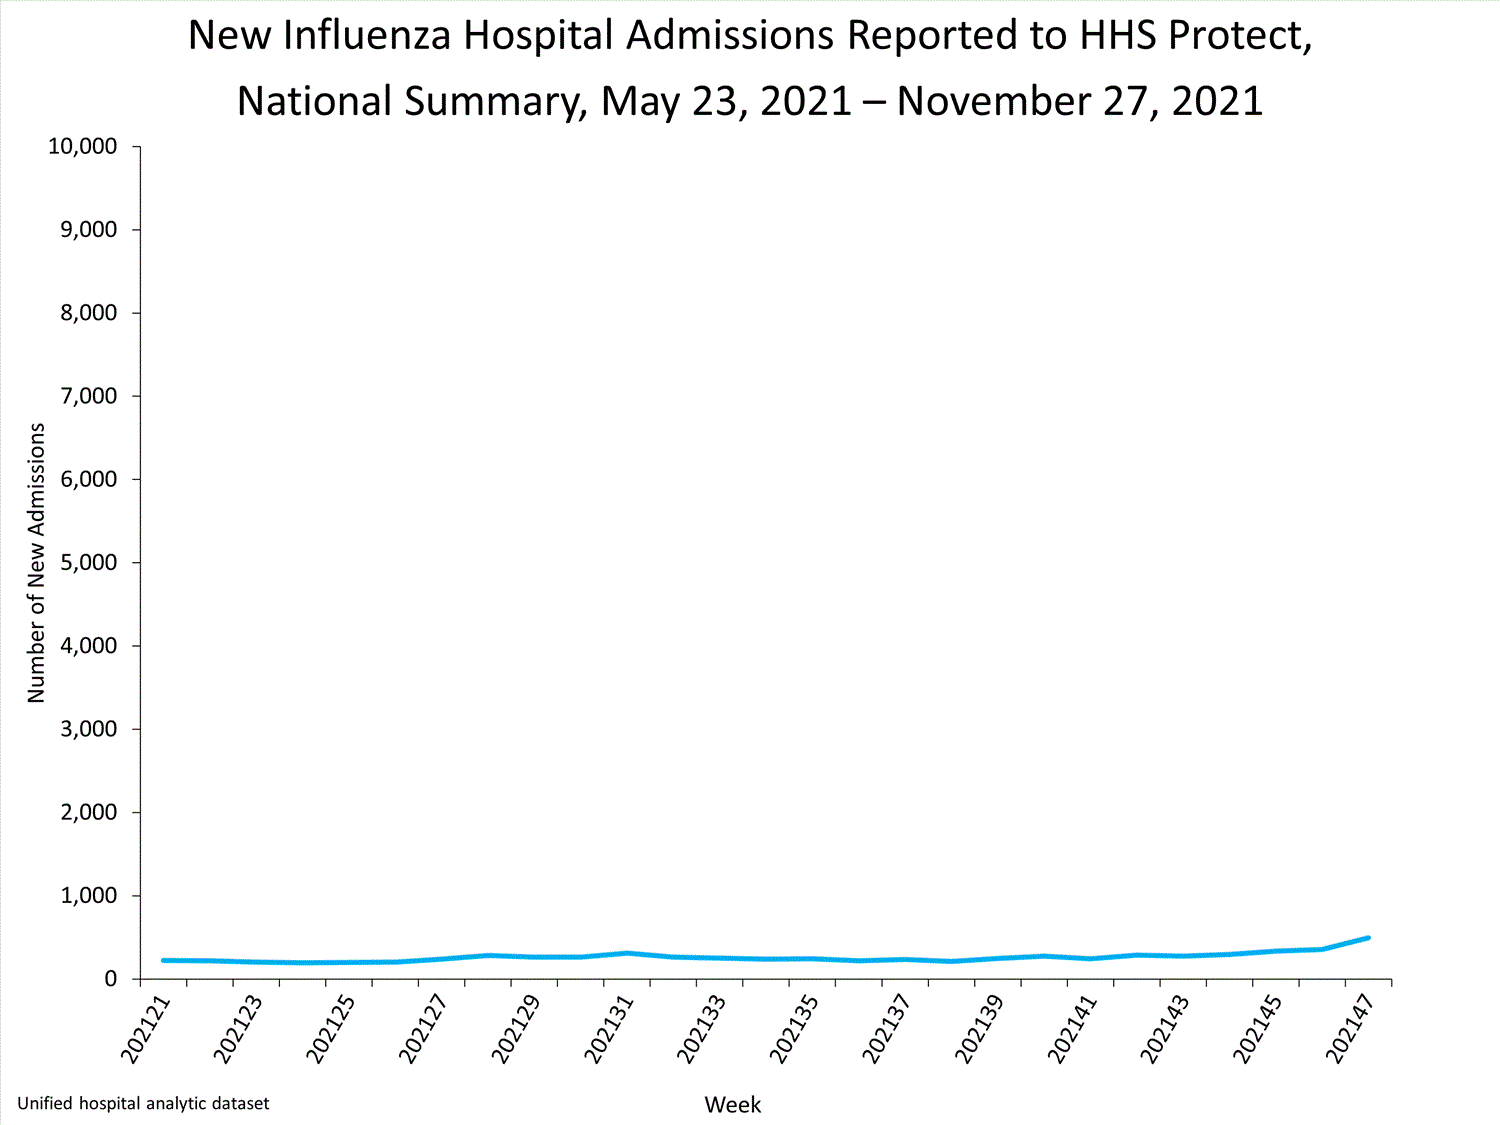
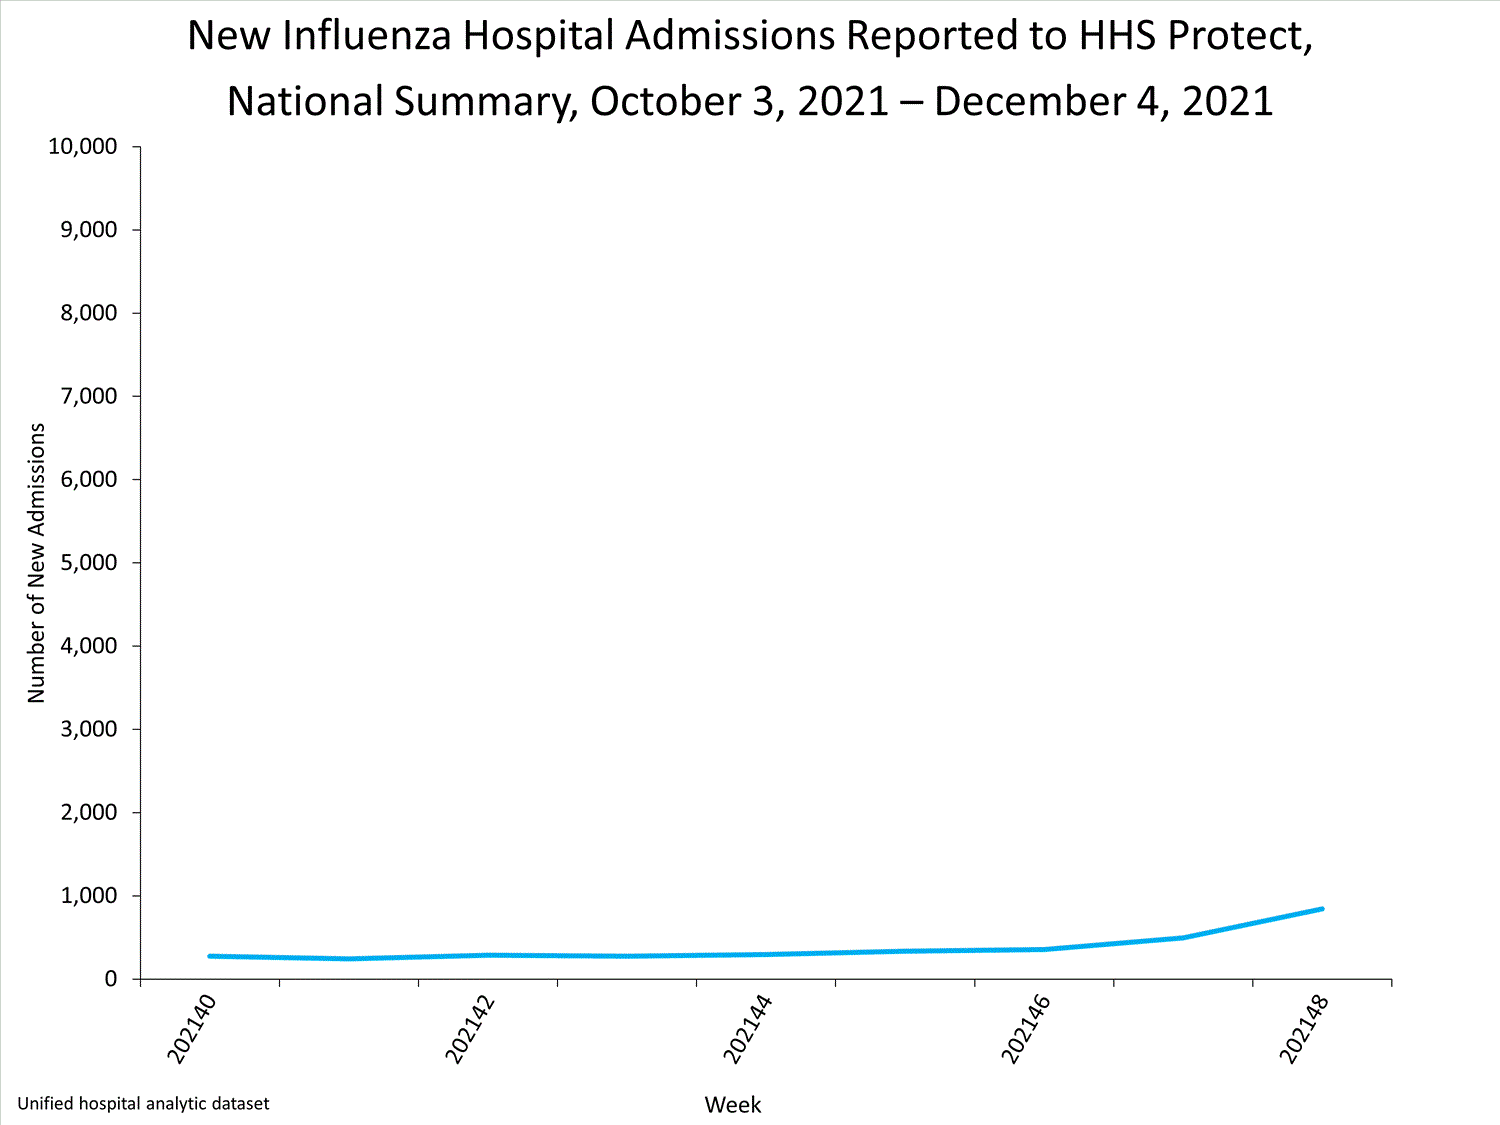
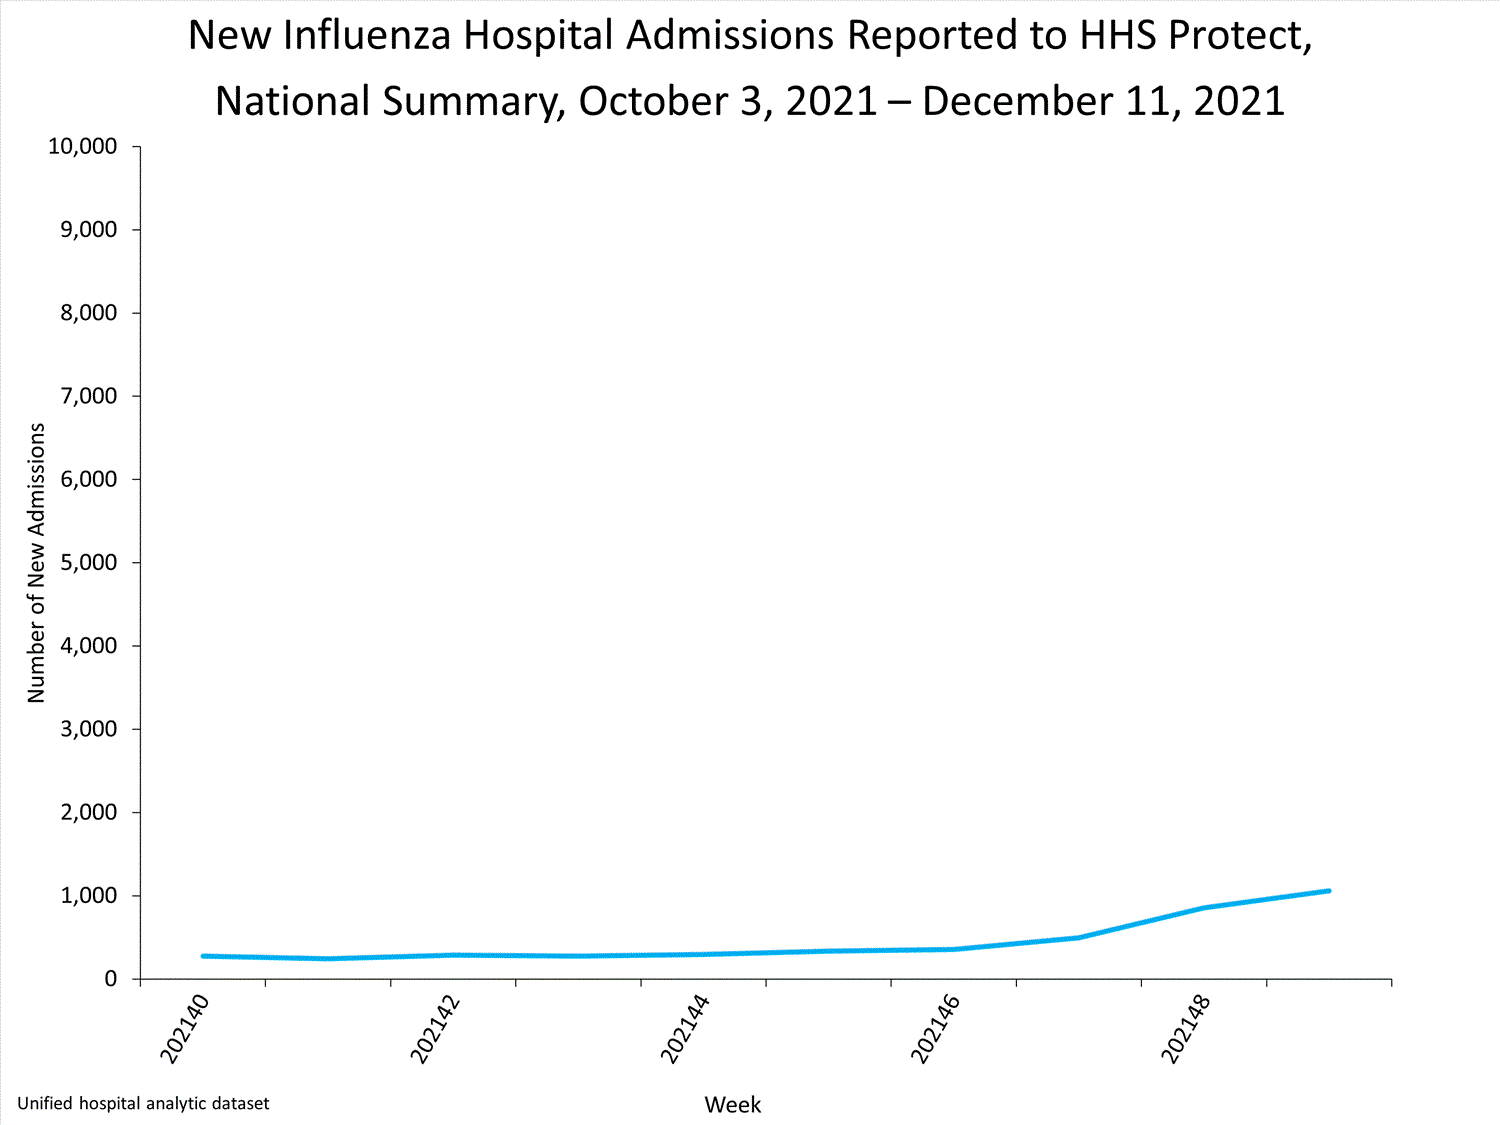
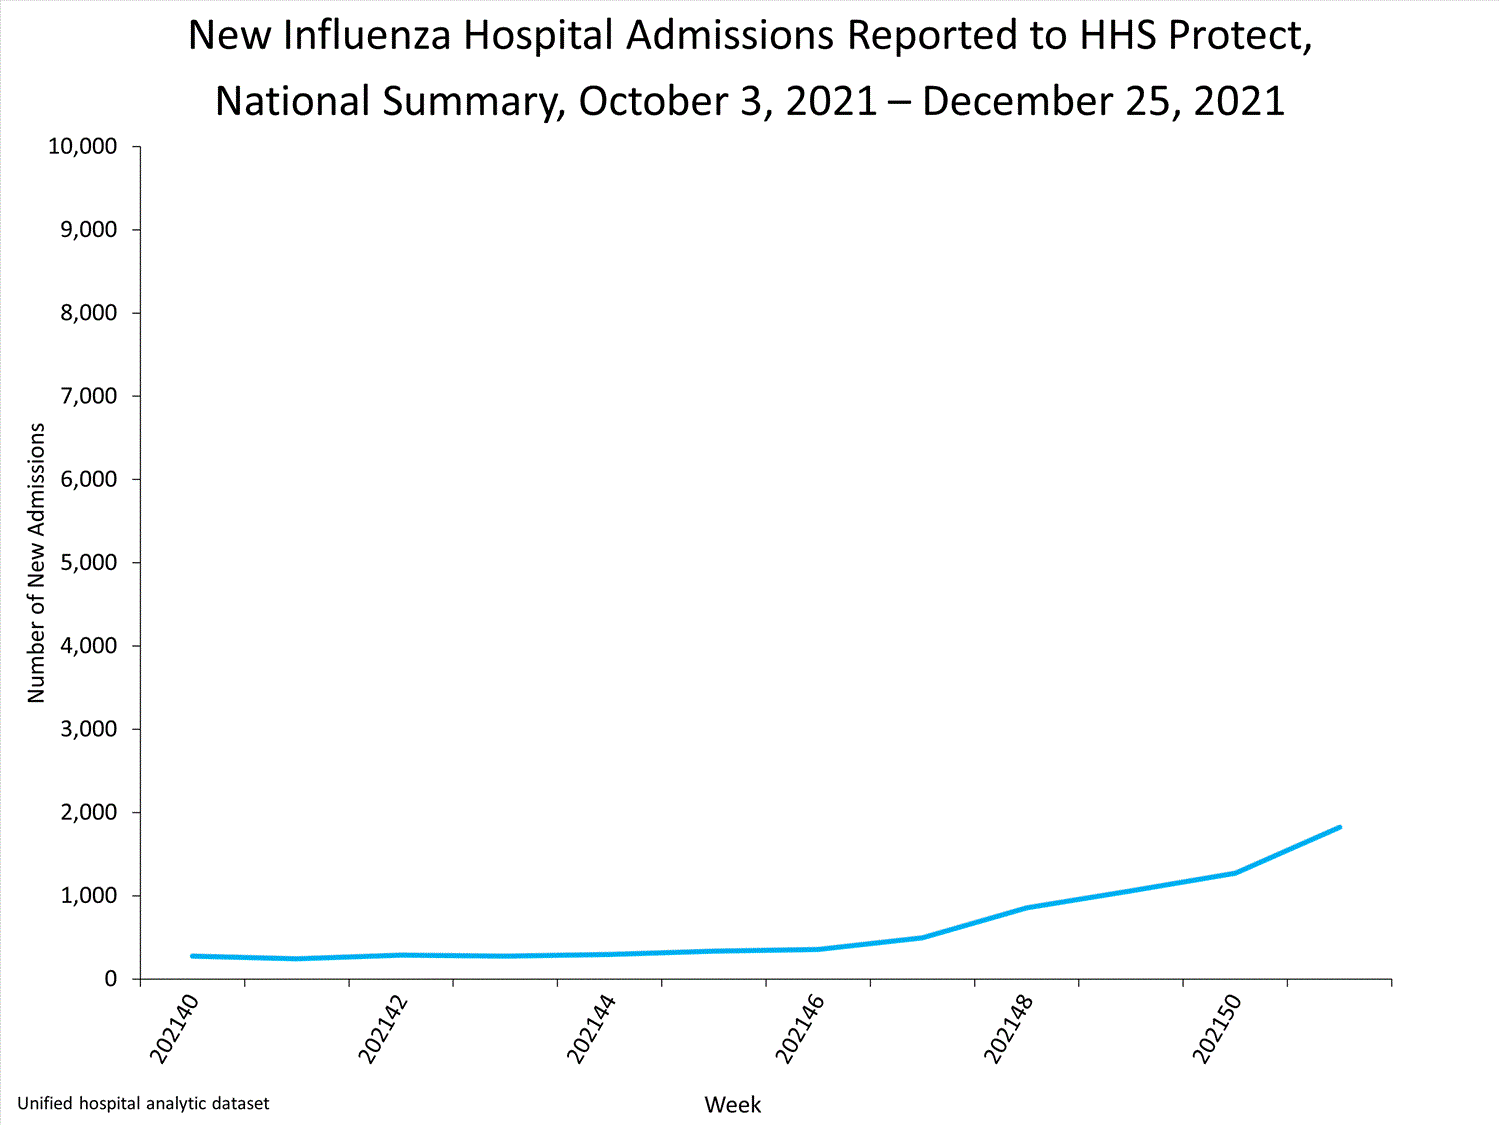
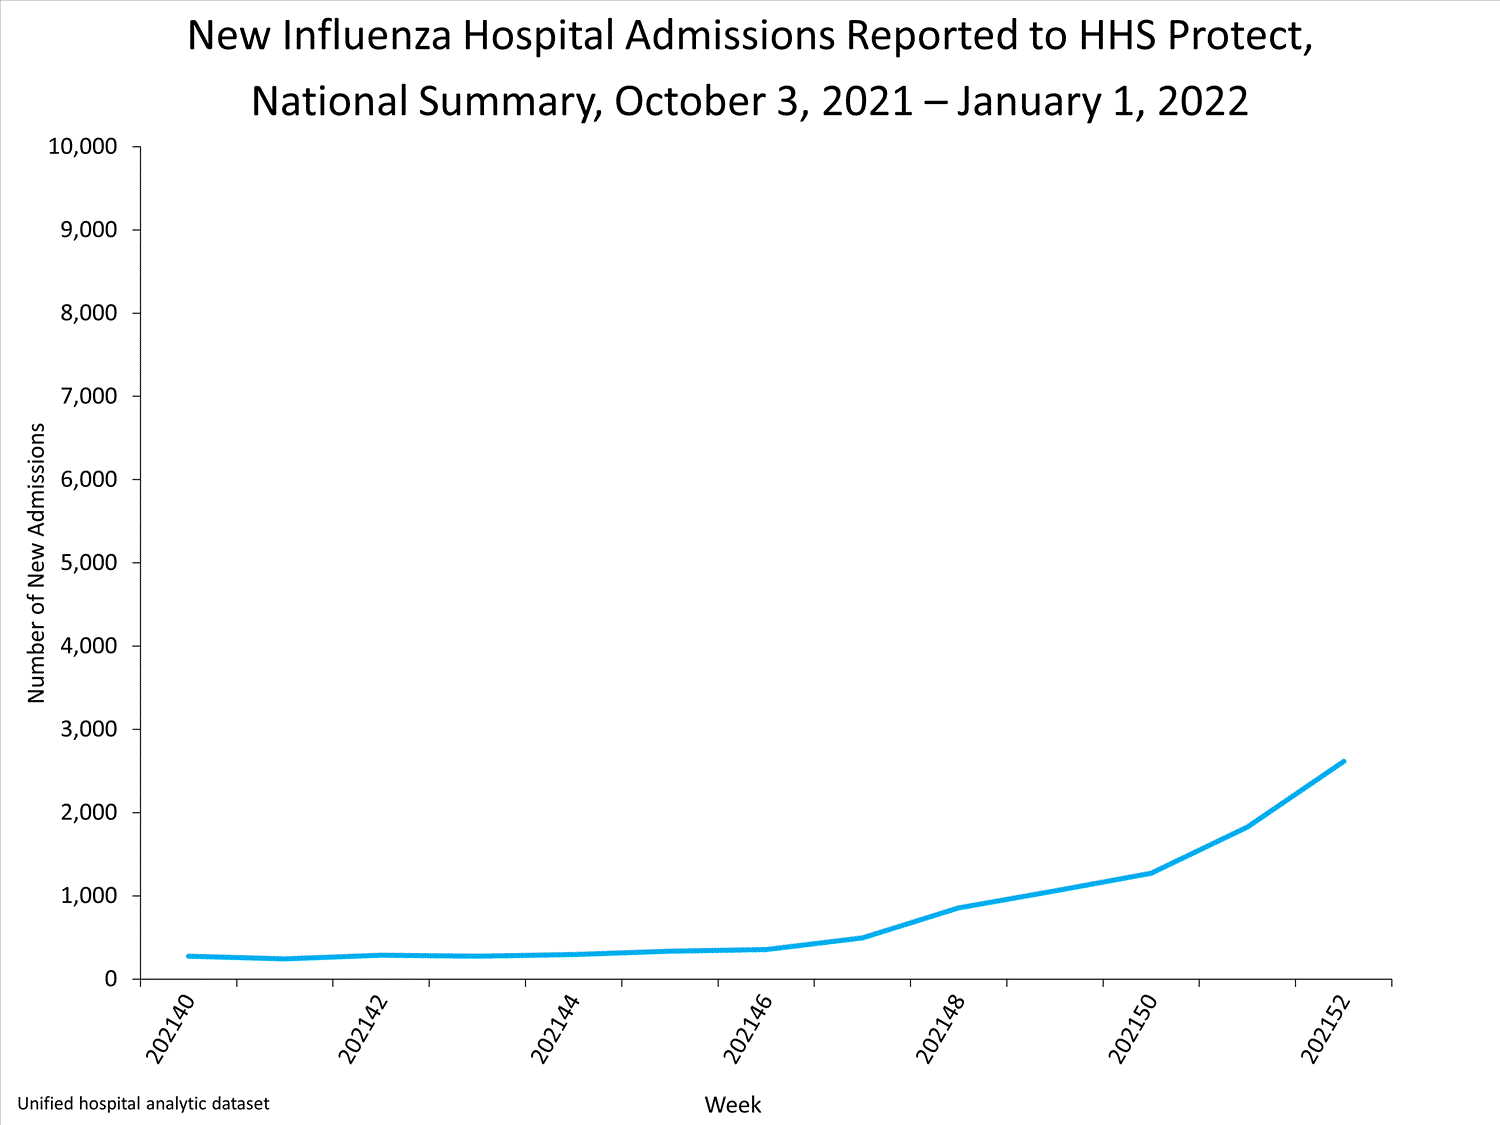
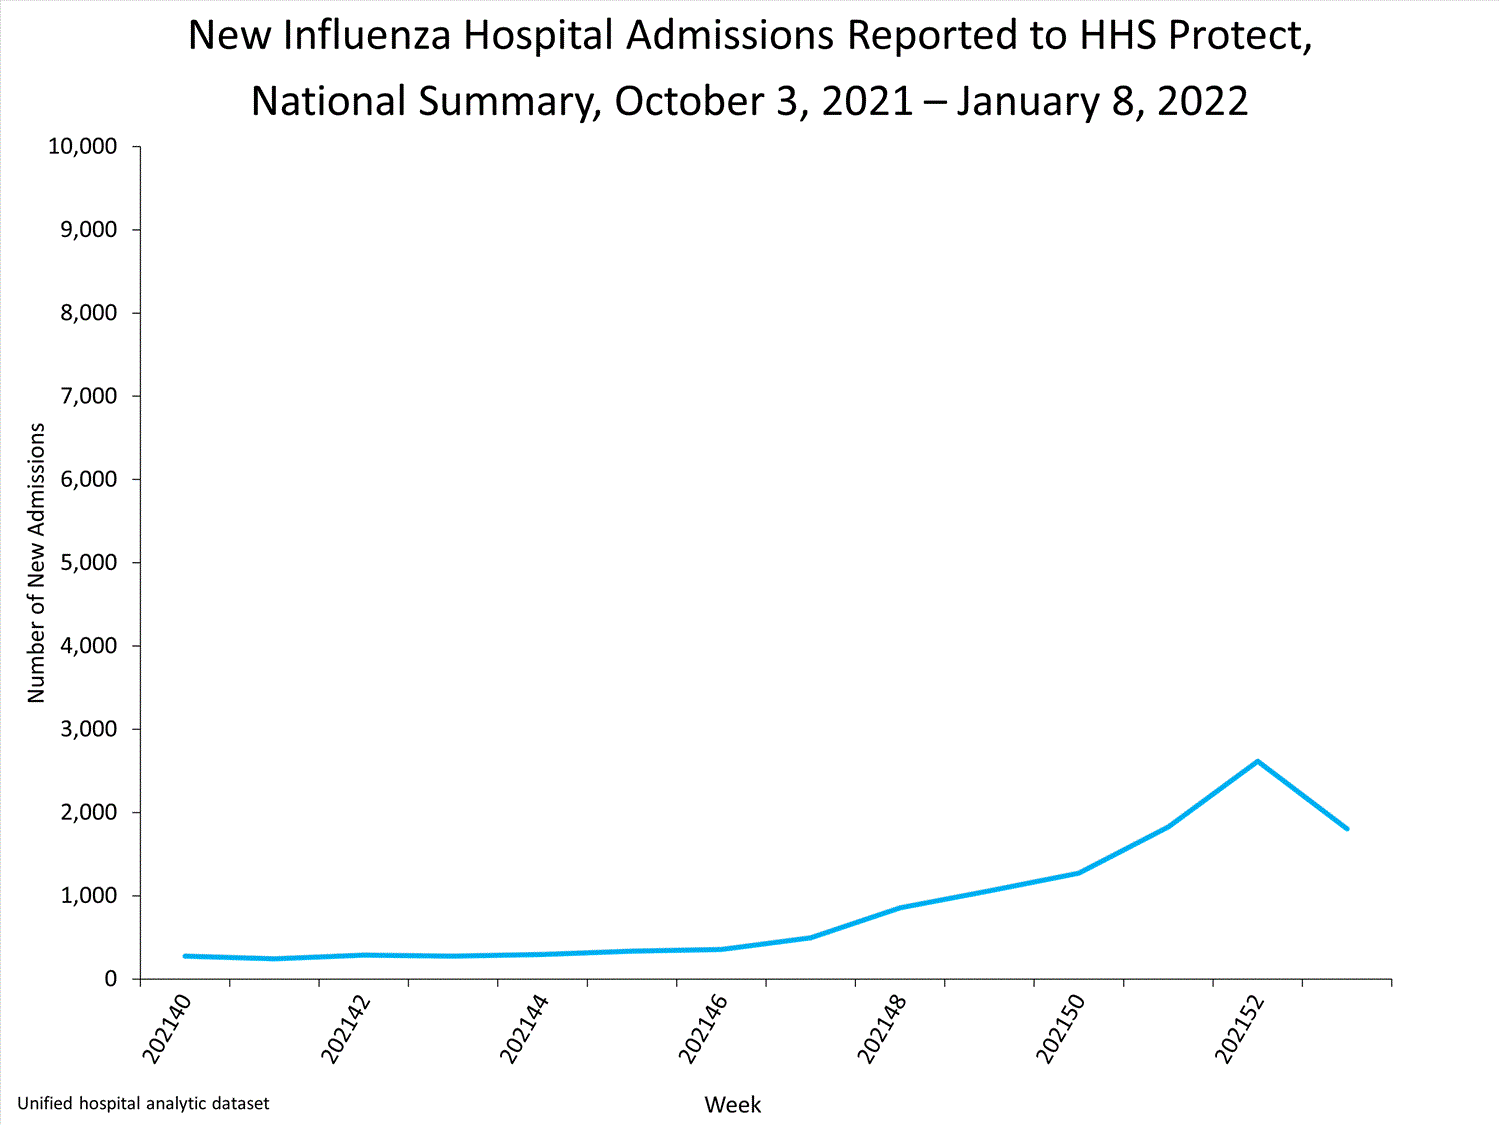
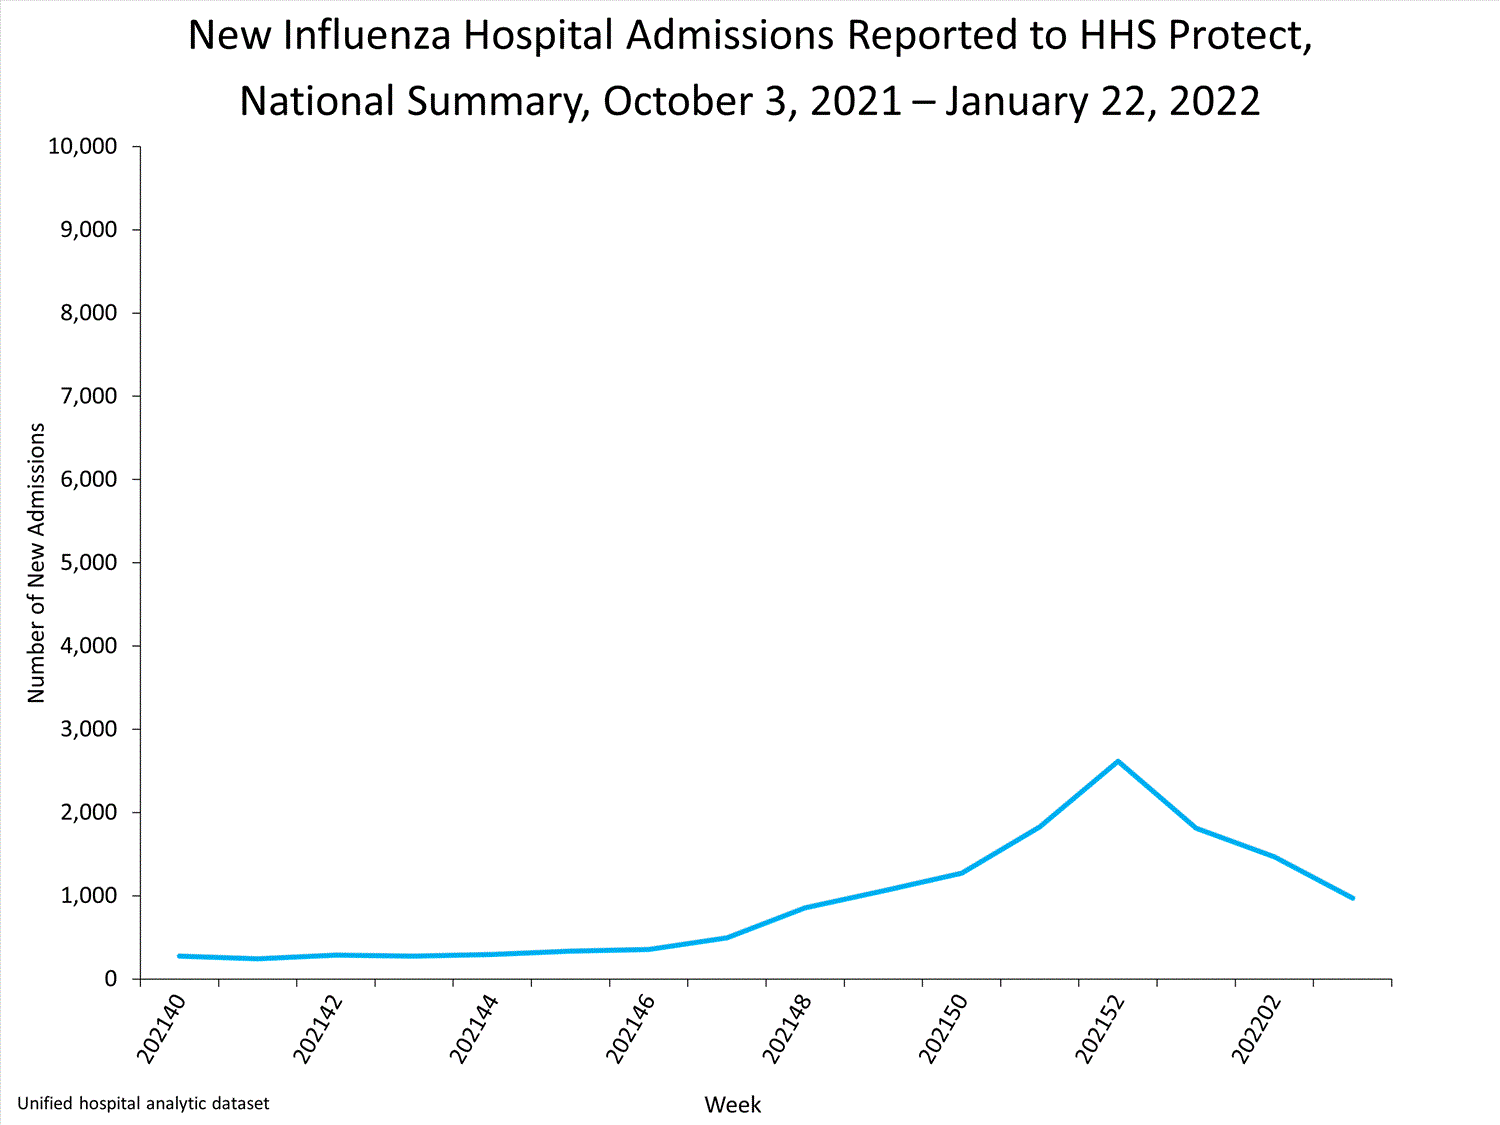
Hospitals report to HHS-Protect the number of patients admitted with laboratory-confirmed influenza. During week 40, 276 patients with laboratory-confirmed influenza were admitted to the hospital.


View Chart Dataexcel icon | View Full Screen
Additional HHS Protect hospitalization surveillance information:
Surveillance Methods | Additional Dataexternal icon
Mortality Surveillance

National Center for Health Statistics (NCHS) Mortality Surveillance


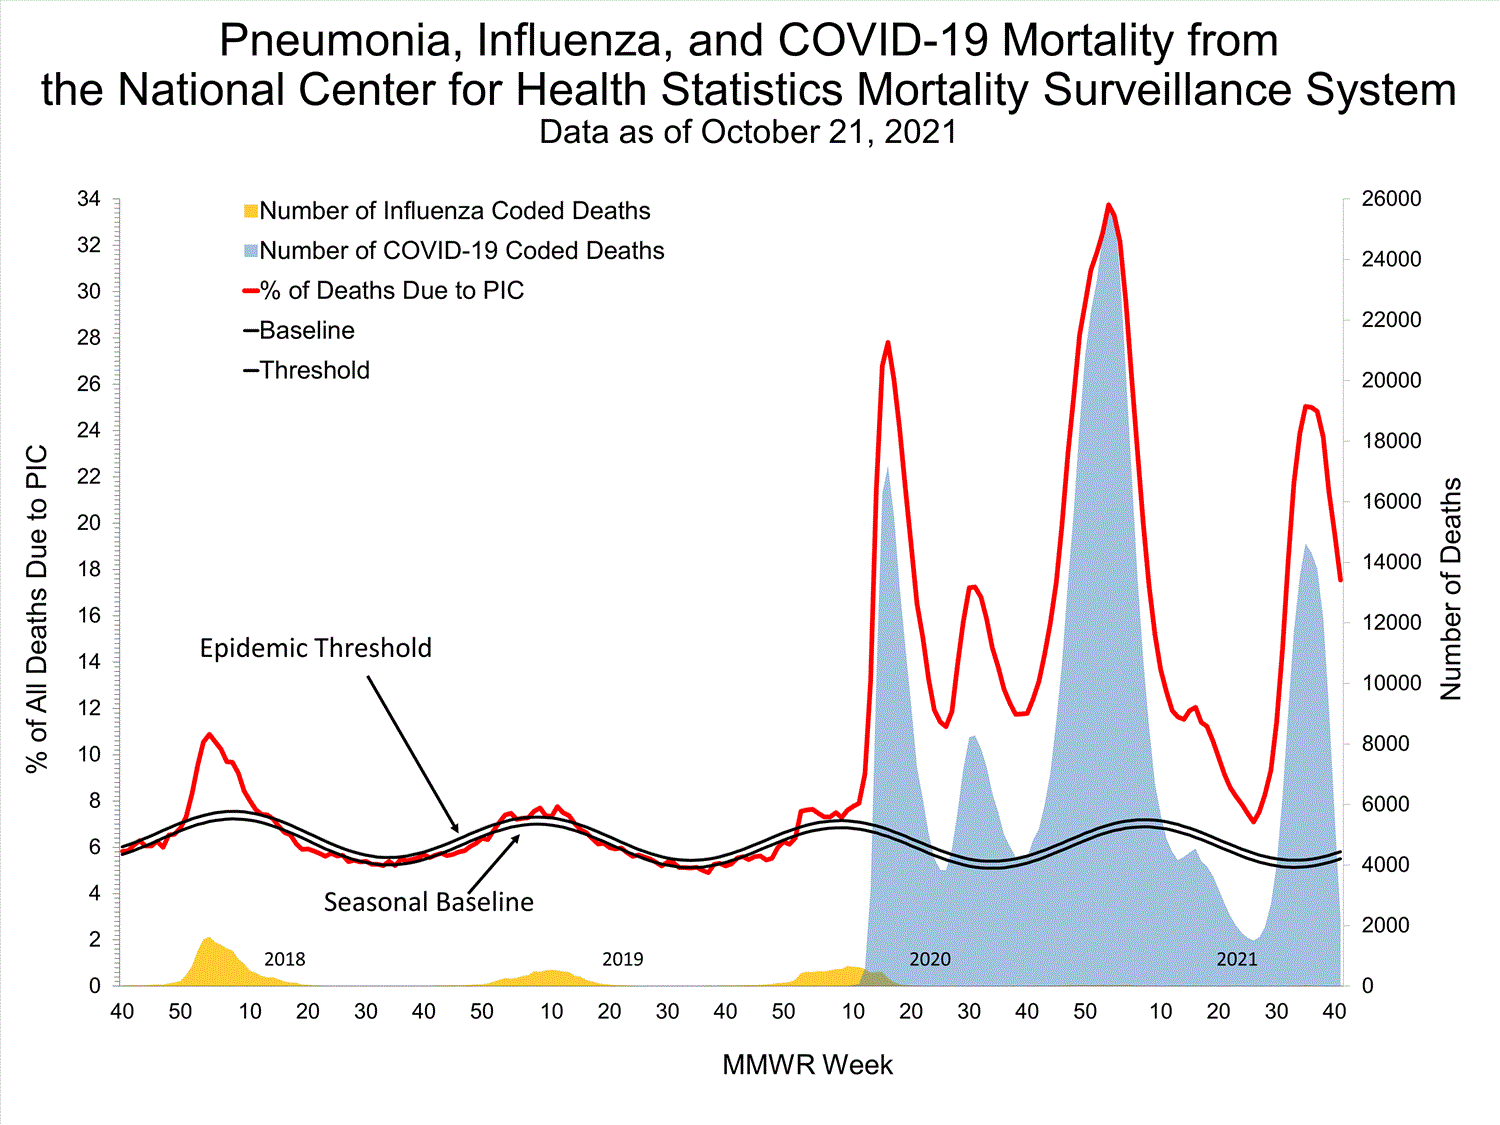
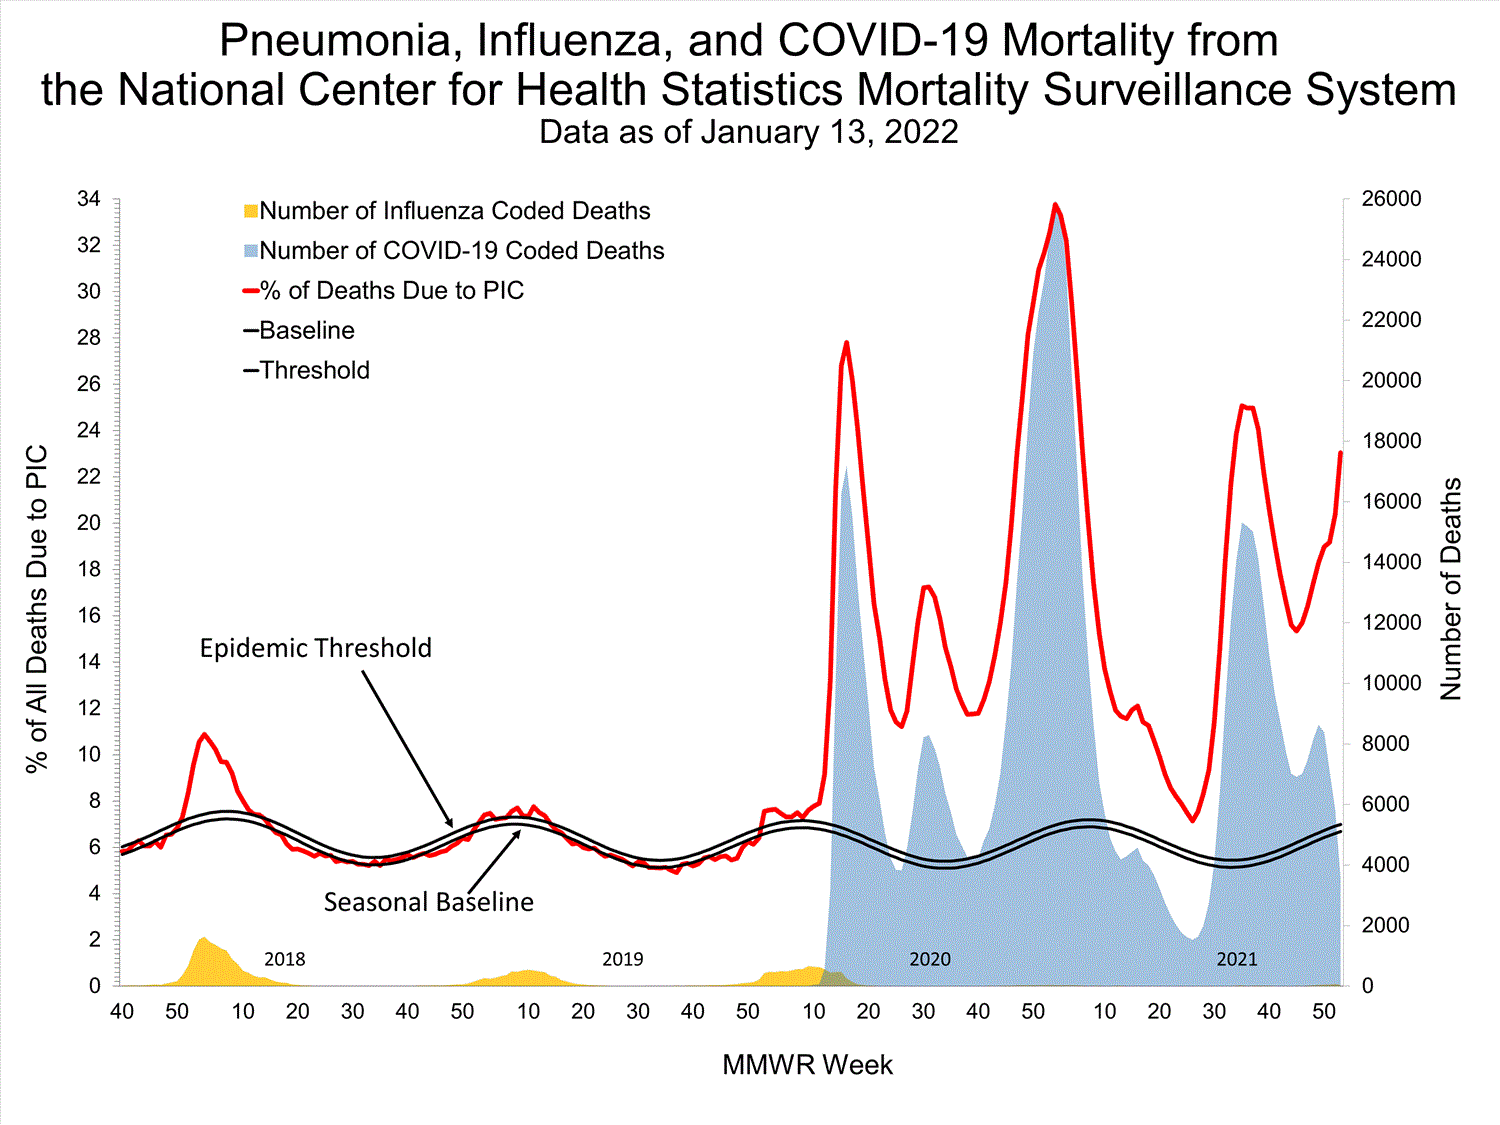
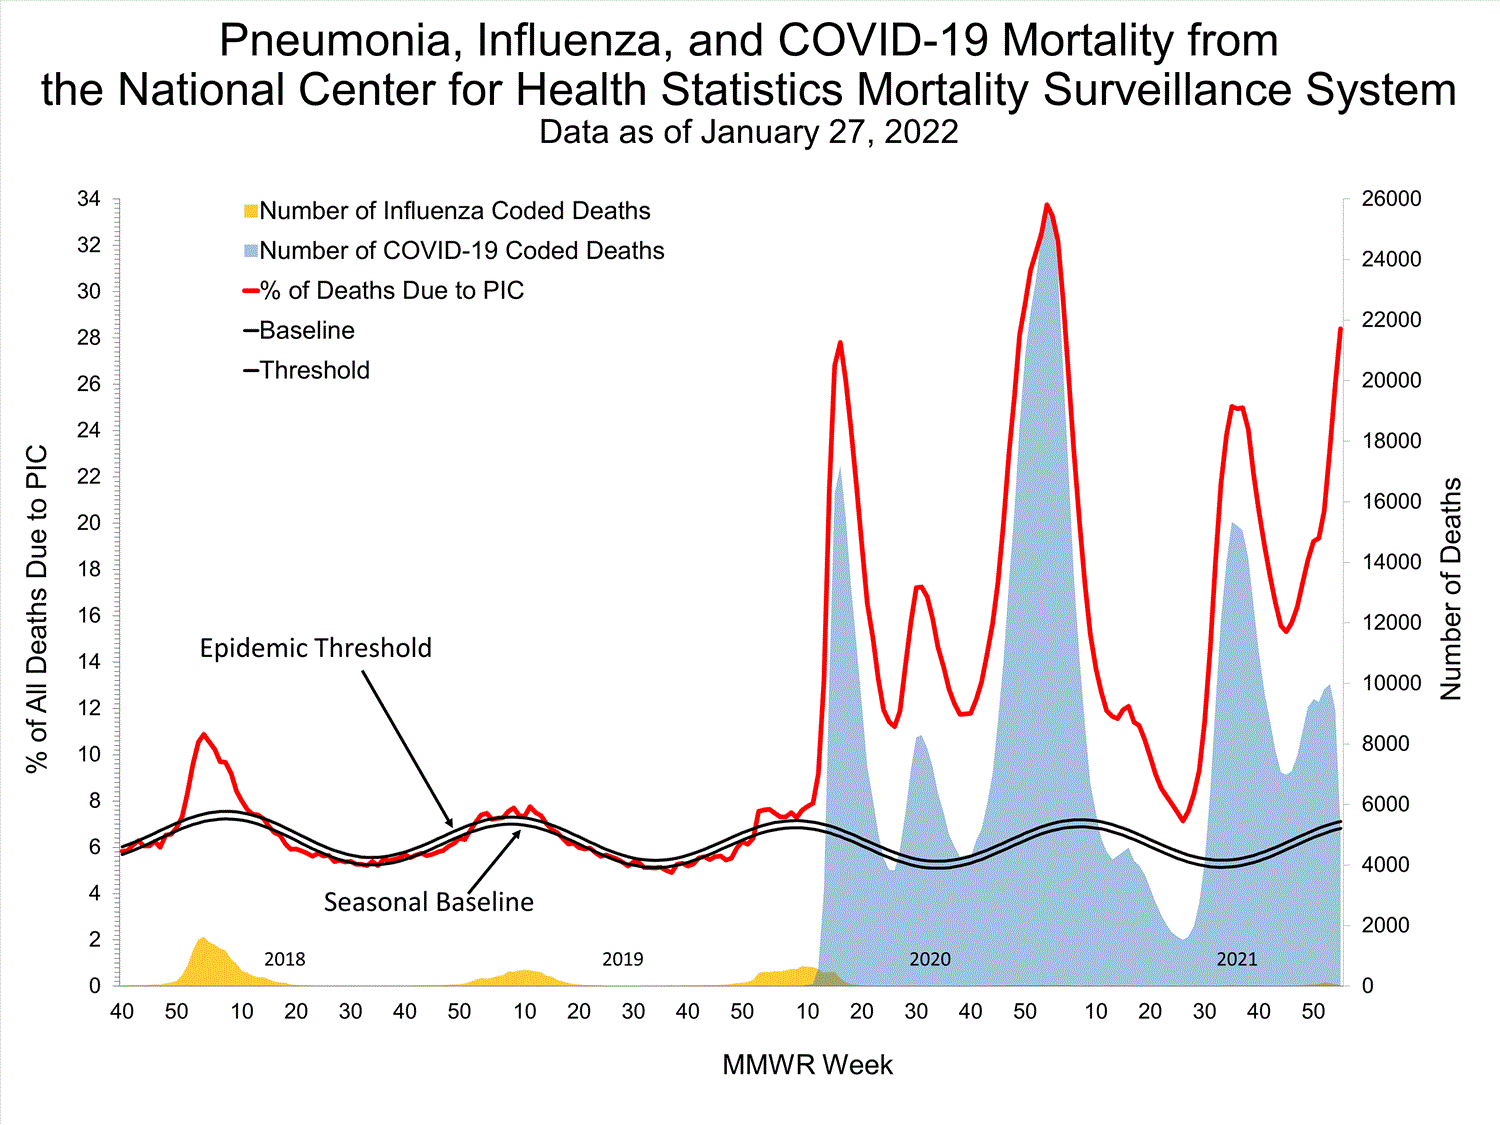
Based on NCHS mortality surveillance data available on October 14, 2021, 18.0% of the deaths that occurred during the week ending October 9, 2021 (week 40), were due to pneumonia, influenza, and/or COVID-19 (PIC). This percentage is above the epidemic threshold of 5.7% for this week. Among the 3,102 PIC deaths reported for this week, 2,430 had COVID-19 listed as an underlying or contributing cause of death on the death certificate, and two listed influenza, indicating that current PIC mortality is due primarily to COVID-19 and not influenza. The data presented are preliminary and may change as more data are received and processed.


View Chart Dataexcel icon | View Full Screen
Additional pneumonia, influenza and COVID-19 mortality surveillance information for current and past seasons:
Surveillance Methods | FluView Interactive
Influenza-Associated Pediatric Mortality


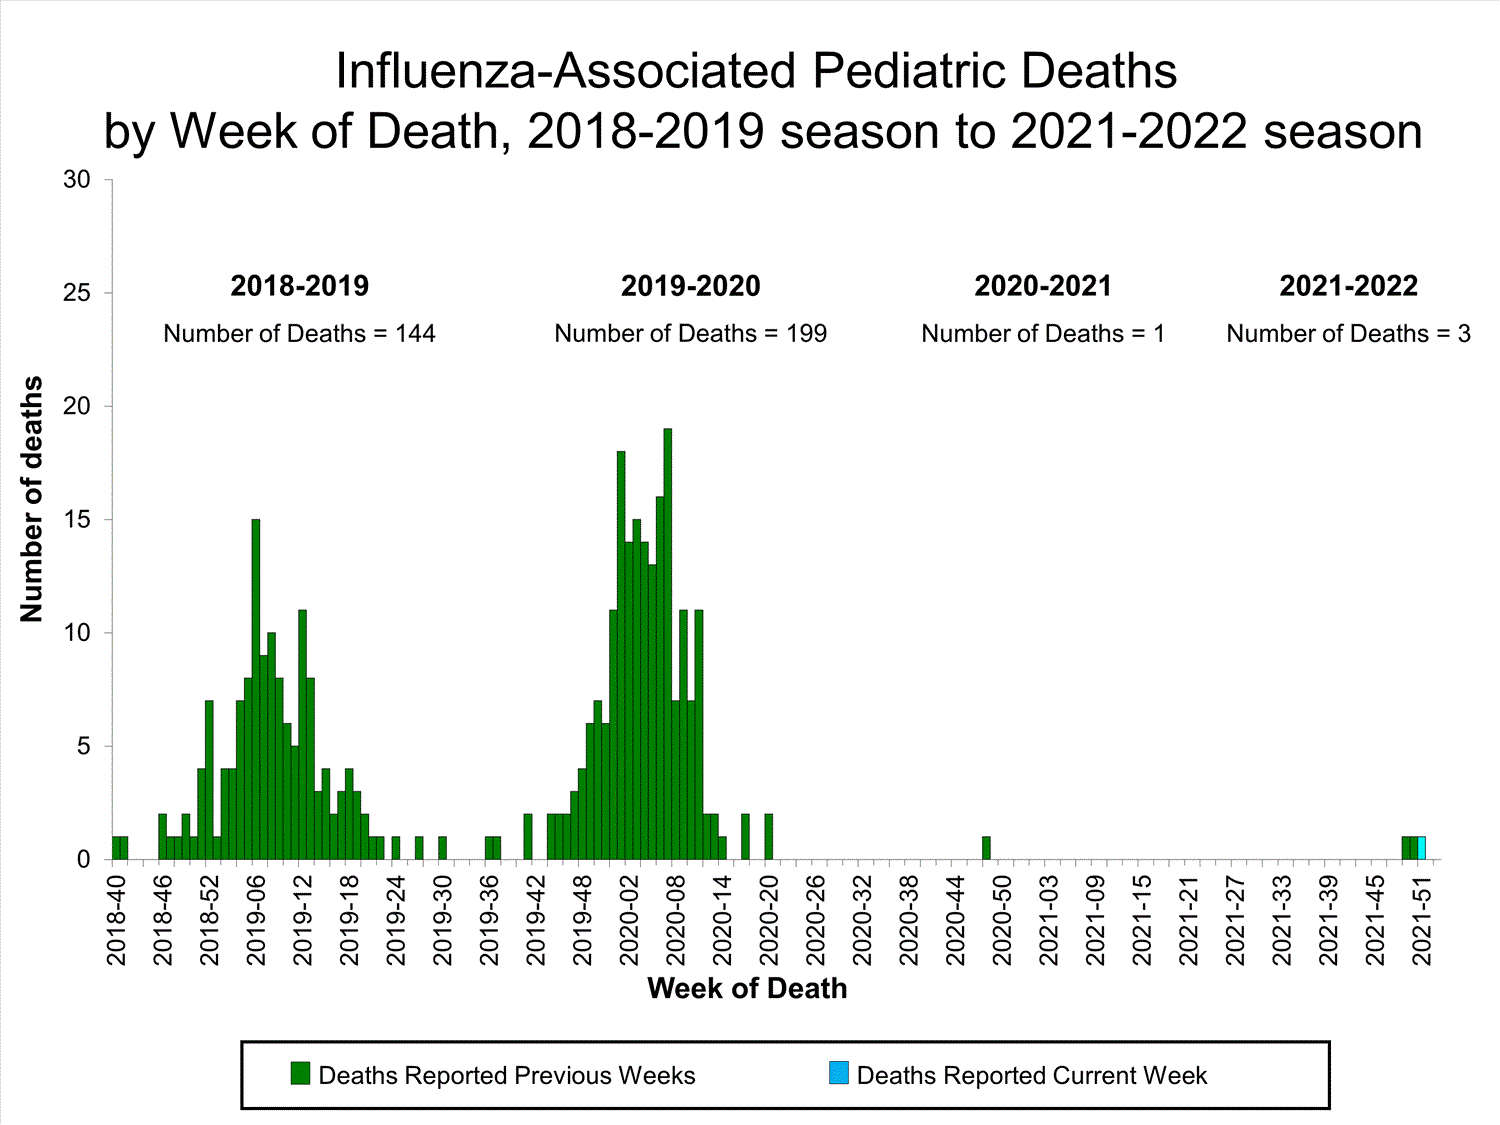
No influenza-associated pediatric deaths occurring during the 2021-2022 season have been reported to CDC.


View Full Screen
Additional pediatric mortality surveillance information for current and past seasons:
Surveillance Methods | FluView Interactive


Additional National and International Influenza Surveillance Information


FluView Interactive: FluView includes enhanced web-based interactive applications that can provide dynamic visuals of the influenza data collected and analyzed by CDC. These FluView Interactive applications allow people to create customized, visual interpretations of influenza data, as well as make comparisons across flu seasons, regions, age groups and a variety of other demographics.

National Institute for Occupational Safety and Health: Monthly surveillance data on the prevalence of health-related workplace absenteeism among full-time workers in the United States are available from NIOSH.

U.S. State and local influenza surveillance: Select a jurisdiction below to access the latest local influenza information. World Health Organization:
Additional influenza surveillance information from participating WHO member nations is available through
FluNetexternal icon and the Global Epidemiology Reports.external icon

WHO Collaborating Centers for Influenza:
Australiaexternal icon, Chinaexternal icon, Japanexternal icon, the United Kingdomexternal icon, and the United States (CDC in Atlanta, Georgia)

Europe:
The most up-to-date influenza information from Europe is available from WHO/Europe and the European Centre for Disease Prevention and Controlexternal icon.

Public Health Agency of Canada:
The most up-to-date influenza information from Canada is available in Canada’s weekly FluWatch reportexternal icon.

Public Health England:
The most up-to-date influenza information from the United Kingdom is available from Public Health Englandexternal icon.

Any links provided to non-Federal organizations are provided solely as a service to our users. These links do not constitute an endorsement of these organizations or their programs by CDC or the Federal Government, and none should be inferred. CDC is not responsible for the content of the individual organization web pages found at these links.

A description of the CDC influenza surveillance system, including methodology and detailed descriptions of each data component is available on the surveillance methods page.

Page last reviewed: October 15, 2021, 11:00 AM

https://www.cdc.gov/flu/weekly/index.htm
 
Weekly U.S. Influenza Surveillance Report

fluview-banner2.jpg


Note: CDC is tracking the COVID-19 pandemic in a weekly publication called COVID Data Tracker Weekly Review.

Key Updates for Week 41, ending October 16, 2021

Seasonal influenza activity in the United States remains low.
Viruses


Clinical Lab0.1%


positive for influenza

Public Health Lab
Few specimens have tested positive.

Virus Characterization
Influenza virus characterization information will be reported later this season.
Illness

Outpatient Illness: ILINet1.8%


of visits to a health care provider for ILI
(below baseline)


Outpatient Illness: ILINet Activity Map


This week, 2 jurisdictions experienced moderate activity and no jurisdictions experienced high or very high activity.

Long-term Care Facilities0.1%


of facilities reported
≥ 1 influenza-positive tests
among residents

Severe Disease


FluSurv-NET
Hospitalization rates will be updated starting later this season.

HHS Protect Hospitalizations248


patients admitted to hospitals with flu

NCHS Mortality17.5%


of deaths attributed to pneumonia, influenza, or COVID-19 (above threshold)

Pediatric Deaths0


influenza-associated deaths occurring this
season


All data are preliminary and may change as more reports are received.

A description of the CDC influenza surveillance system, including methodology and detailed descriptions of each data component is available on the surveillance methods page.

Additional information on the current and previous influenza seasons for each surveillance component are available on FluView Interactive.

Key Points
  • An annual flu vaccine is the best way to protect against flu and its potentially serious complications.
  • CDC recommends everyone 6 months or older get a flu vaccine by the end of October.
  • There also are flu antiviral drugs that can be used to treat flu illness.
U.S. Virologic Surveillance

Clinical Laboratories


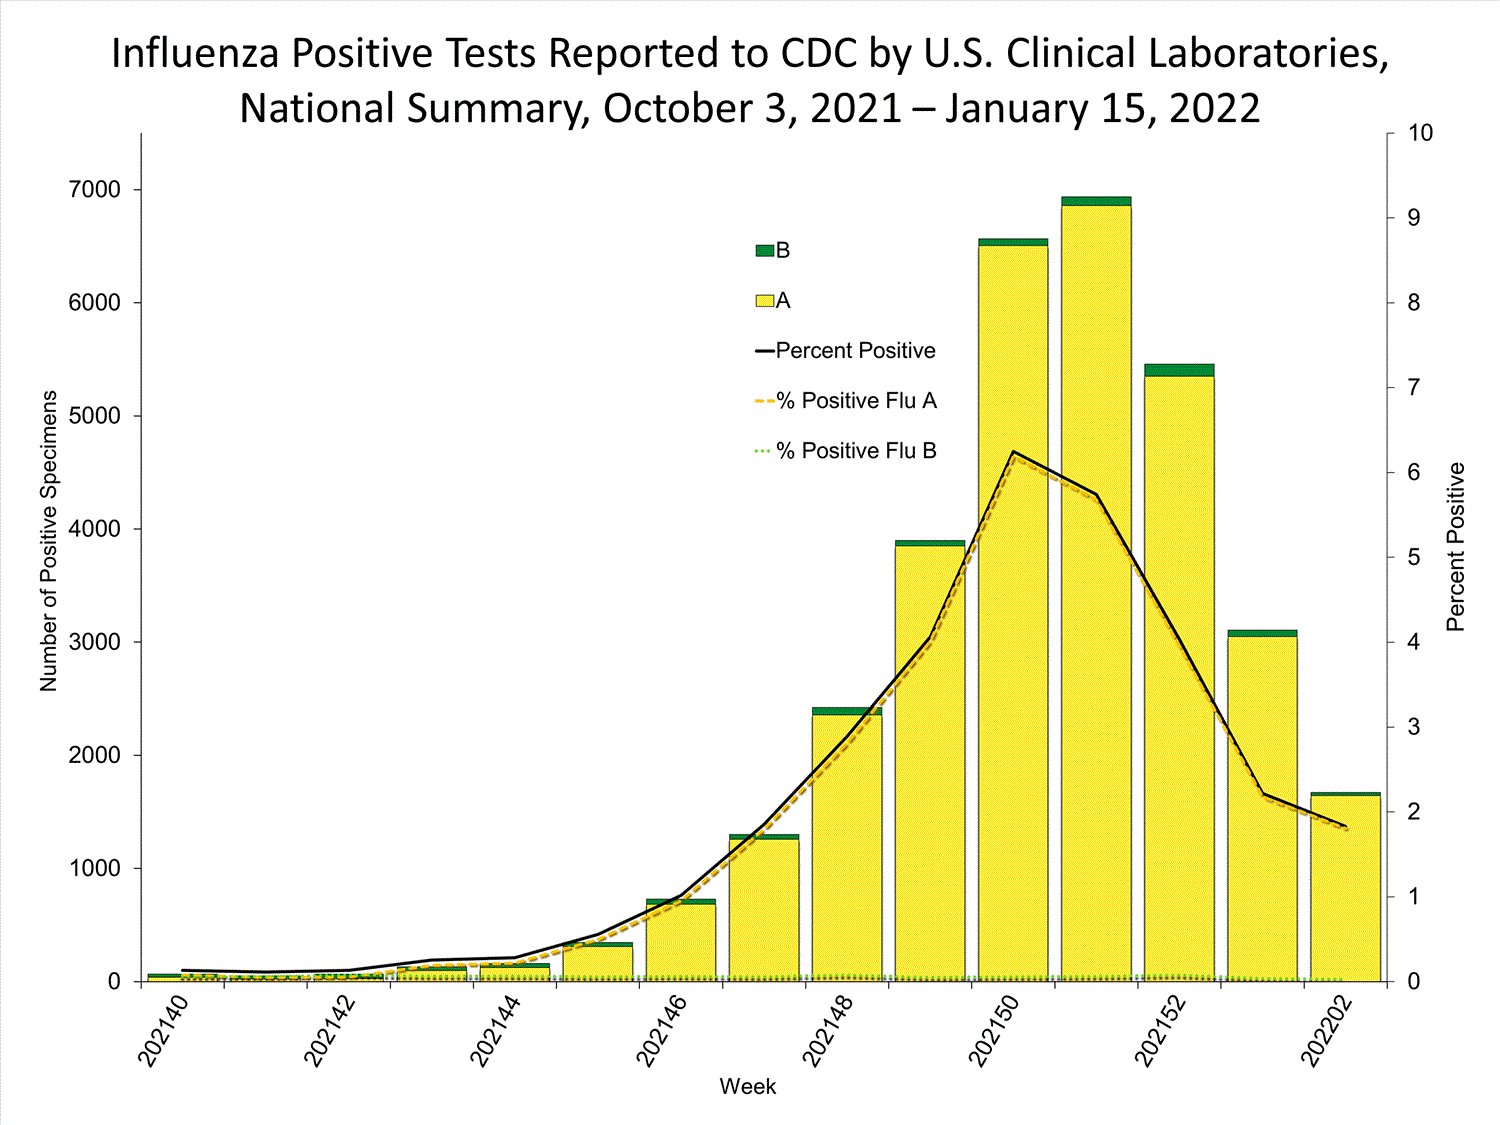
The results of tests performed by clinical laboratories nationwide are summarized below. Data from clinical laboratories (the percentage of specimens tested that are positive for influenza) are used to monitor whether influenza activity is increasing or decreasing.

No. of specimens tested28,62969,314
No. of positive specimens (%)36 (0.1%)97 (0.1%)
Positive specimens by type
Influenza A17 (47.2%)51 (52.6%)
Influenza B19 (52.8%)46 (47.4%)


View Chart Data | View Full ScreenPublic Health Laboratories


The results of tests performed by public health laboratories nationwide are summarized below. Data from public health laboratories are used to monitor the proportion of circulating viruses that belong to each influenza subtype/lineage.
No. of specimens tested15,20930,809
No. of positive specimens1024
Positive specimens by type/subtype
Influenza A5 (50.0%)13 (54.2%)
(H1N1)pdm0901 (11.1%)
H3N24 (100%)8 (88.9%)
Subtyping not performed14
Influenza B5 (40.0%)11 (45.8%)
Yamagata lineage01 (33.3%)
Victoria lineage1 (100%)2 (66.7%)
Lineage not performed48


View Chart Data | View Full Screen
Additional virologic surveillance information for current and past seasons:
Surveillance Methods | FluView Interactive: National, Regional, and State Data or Age Data
Novel Influenza A Virus


Two human infections with novel influenza A viruses were reported. One infection with an influenza A(H1N1) variant (A(H1N1)v) virus was reported by North Dakota that occurred during the 2020-21 influenza season and one infection with an influenza (A(H3N2)v) virus was reported by Ohio that occurred during the 2021-22 influenza season. Both patients are <18 years of age, were not hospitalized, and have recovered or are recovering from their illness. One of the patients had close contact with swine prior to illness onset. The other patient had no known swine contact or attendance at agricultural exhibits where swine were present; it is possible that limited human-to-human transmission occurred. No ongoing human-to-human transmission has been identified associated with either patient.

When an influenza virus that normally circulates in swine (but not people) is detected in a person, it is called a “variant influenza virus”. Most human infections with variant influenza viruses occur following close proximity to swine, but human-to-human transmission can occur. It is important to note that in most cases, variant influenza viruses have not shown the ability to spread easily and sustainably from person to person.

During the 2021-22 influenza season, one human infection with novel influenza A virus has been reported in the United States: H3N2v (OH). During the 2020-21 influenza season, 11 human infections with a novel influenza A virus were reported in the United States, including two H3N2v (IA, WI), three H1N2v (IA, OH (2)), and six H1N1v (IA, NC, ND, WI (3)) virus infections.

Early identification and investigation of human infections with novel influenza A viruses are critical so that the risk of infection can be more fully understood and appropriate public health measures can be taken. Additional information on influenza in swine, variant influenza virus infection in humans, and strategies to interact safely with swine can be found at www.cdc.gov/flu/swineflu/index.htm. Additional information regarding human infections with novel influenza A viruses can be found at http://gis.cdc.gov/grasp/fluview/Novel_Influenza.html.
Influenza Virus Characterization


CDC performs genetic and antigenic characterization of U.S. viruses submitted from state and local health laboratories using Right Size Roadmap submission guidance. These data are used to compare how similar the currently circulating influenza viruses are to the reference viruses representing viruses contained in the current influenza vaccines and to monitor evolutionary changes that continually occur in influenza viruses circulating in humans. CDC also tests susceptibility of influenza viruses to antiviral medications including the neuraminidase inhibitors (oseltamivir, zanamivir, and peramivir) and the PA endonuclease inhibitor baloxavir.

Virus characterization data will be updated later this season when a sufficient number of specimens have been tested.
Outpatient Illness Surveillance


The U.S. Outpatient Influenza-like Illness Surveillance Network (ILINet) monitors outpatient visits for influenza-like illness [(ILI) fever plus cough or sore throat], not laboratory-confirmed influenza, and will capture visits due to other respiratory pathogens, such as SARS-CoV-2, that present with similar symptoms. Due to the COVID-19 pandemic, health care-seeking behaviors have changed and people may be accessing the health care system in alternative settings not captured as a part of ILINet or at a different point in their illness than they might have before the pandemic. Therefore, it is important to evaluate syndromic surveillance data, including that from ILINet, in the context of other sources of surveillance data to obtain a complete and accurate picture of influenza, COVID-19, and other respiratory virus activity. CDC is tracking the COVID-19 pandemic in a weekly publication called COVID Data Tracker Weekly Review. Information about other respiratory virus activity can be found on CDC’s National Respiratory and Enteric Virus Surveillance System (NREVSS) website.

Effective October 3, 2021, the ILI definition (fever plus cough or sore throat) no longer includes “without a known cause other than influenza.” This change was made to improve the consistency with which the definition is applied across reporting sites
ILINet


Nationwide during week 41, 1.8% of patient visits reported through ILINet were due to ILI. This percentage is below the national baseline of 2.5%. One region (Region 7) is at their region-specific baseline while the remaining regions are below their baselines. Overall, influenza virus circulation remains low; therefore, increases in ILI activity are likely due to increased circulation of other respiratory viruses.


* Effective October 3, 2021 (week 40), the ILI definition (fever plus cough or sore throat) no longer includes “without a known cause other than influenza.”


View Chart Data (current season only) | View Full ScreenILI Visits by Age Group


More than 70% of ILINet participants provide both the number of patient visits for ILI and the total number of patient visits for the week broken out by age group. Data from this subset of providers are used to calculate the percentages of patient visits for ILI by age group.

The percentages of visits for ILI reported in ILINet in week 41 decreased or remained stable compared to week 40 for all age groups (0–4 years, 5–24 years, 25–49 years, 50–64 years, and 65+ years) and is showing a decreasing or stabilizing trend over at least the past four weeks for all age groups.


* Effective October 3, 2021 (week 40), the ILI definition (fever plus cough or sore throat) no longer includes “without a known cause other than influenza.”

View Chart Data | View Full Screen
ILI Activity Map


Data collected in ILINet are used to produce a measure of ILI activity* by state/jurisdiction and Core Based Statistical Areas (CBSA).
Week 41
(Week ending
Oct. 16, 2021)
Week 40
(Week ending
Oct. 9, 2021)
Week 41
(Week ending
Oct. 16, 2021)
Week 40
(Week ending
Oct. 9, 2021)
Very High0001
High0043
Moderate221823
Low657790
Minimal4748538525
Insufficient Data00292287


*Data collected in ILINet may disproportionally represent certain populations within a jurisdiction or CBSA, and therefore, may not accurately depict the full picture of influenza activity for the entire jurisdiction or CBSA. Differences in the data presented here by CDC and independently by some health departments likely represent differing levels of data completeness with data presented by the health department likely being the more complete.
Additional information about medically attended visits for ILI for current and past seasons:
Surveillance Methods | FluView Interactive: National, Regional, and State Data or ILI Activity Map
Long-term Care Facility (LTCF) Surveillance


LTCFs (e.g., nursing homes/skilled nursing, long-term care for the developmentally disabled, and assisted living facilities) from all 50 states and U.S. territories report data on influenza infections among residents the NHSN Long-term Care Facility Component. During week 41, 19 (0.1%) of 14,271 reporting LTCFs reported at least one influenza positive test among their residents.


View Chart Dataexcel icon | View Full Screen
Additional information about long-term care facility surveillance:
Surveillance Methods | Additional Dataexternal icon
Hospitalization Surveillance

FluSurv-NET


The Influenza Hospitalization Surveillance Network (FluSurv-NET) conducts population-based The Influenza Hospitalization Surveillance Network (FluSurv-NET) conducts population-based surveillance for laboratory-confirmed influenza-related hospitalizations in select counties in 14 states and represents approximately 9% of the U.S. population. FluSurv-NET estimated hospitalization rates will be updated weekly starting later this season.
Additional FluSurv-NET hospitalization surveillance information for current and past seasons and additional age groups:
Surveillance Methods | FluView Interactive
HHS-Protect Hospitalization Surveillance


Hospitals report to HHS-Protect the number of patients admitted with laboratory-confirmed influenza. During week 41, 248 patients with laboratory-confirmed influenza were admitted to the hospital.


View Chart Dataexcel icon | View Full Screen
Additional HHS Protect hospitalization surveillance information:
Surveillance Methods | Additional Dataexternal icon
Mortality Surveillance

National Center for Health Statistics (NCHS) Mortality Surveillance


Based on NCHS mortality surveillance data available on October 21, 2021, 17.5% of the deaths that occurred during the week ending October 16, 2021 (week 41), were due to pneumonia, influenza, and/or COVID-19 (PIC). This percentage is above the epidemic threshold of 5.8% for this week. Among the 2,885 PIC deaths reported for this week, 2,208 had COVID-19 listed as an underlying or contributing cause of death on the death certificate, and none listed influenza, indicating that current PIC mortality is due primarily to COVID-19 and not influenza. The data presented are preliminary and may change as more data are received and processed.


View Chart Dataexcel icon | View Full Screen
Additional pneumonia, influenza and COVID-19 mortality surveillance information for current and past seasons:
Surveillance Methods | FluView Interactive
Influenza-Associated Pediatric Mortality


No influenza-associated pediatric deaths occurring during the 2021-2022 season have been reported to CDC.


View Full Screen
Additional pediatric mortality surveillance information for current and past seasons:
Surveillance Methods | FluView Interactive


Additional National and International Influenza Surveillance Information


FluView Interactive: FluView includes enhanced web-based interactive applications that can provide dynamic visuals of the influenza data collected and analyzed by CDC. These FluView Interactive applications allow people to create customized, visual interpretations of influenza data, as well as make comparisons across flu seasons, regions, age groups and a variety of other demographics.

National Institute for Occupational Safety and Health: Monthly surveillance data on the prevalence of health-related workplace absenteeism among full-time workers in the United States are available from NIOSH.

U.S. State and local influenza surveillance: Select a jurisdiction below to access the latest local influenza information. World Health Organization:
Additional influenza surveillance information from participating WHO member nations is available through
FluNetexternal icon and the Global Epidemiology Reports.external icon

WHO Collaborating Centers for Influenza:
Australiaexternal icon, Chinaexternal icon, Japanexternal icon, the United Kingdomexternal icon, and the United States (CDC in Atlanta, Georgia)

Europe:
The most up-to-date influenza information from Europe is available from WHO/Europe and the European Centre for Disease Prevention and Controlexternal icon.

Public Health Agency of Canada:
The most up-to-date influenza information from Canada is available in Canada’s weekly FluWatch reportexternal icon.

Public Health England:
The most up-to-date influenza information from the United Kingdom is available from Public Health Englandexternal icon.

Any links provided to non-Federal organizations are provided solely as a service to our users. These links do not constitute an endorsement of these organizations or their programs by CDC or the Federal Government, and none should be inferred. CDC is not responsible for the content of the individual organization web pages found at these links.

A description of the CDC influenza surveillance system, including methodology and detailed descriptions of each data component is available on the surveillance methods page.

Page last reviewed: October 22, 2021, 11:00 AM

https://www.cdc.gov/flu/weekly/index.htm
 
Weekly U.S. Influenza Surveillance Report

fluview-banner2.jpg

Note: CDC is tracking the COVID-19 pandemic in a weekly publication called COVID Data Tracker Weekly Review.

Key Updates for Week 42, ending October 23, 2021

Seasonal influenza activity in the United States remains low.
Viruses


Clinical Lab0.1%


positive for influenza
this week


Public Health Lab
Few specimens have tested positive.

Virus Characterization
Influenza virus characterization information will be reported later this season.
Illness

Outpatient Illness: ILINet1.8%


of visits to a health care provider for ILI this week
(below baseline)


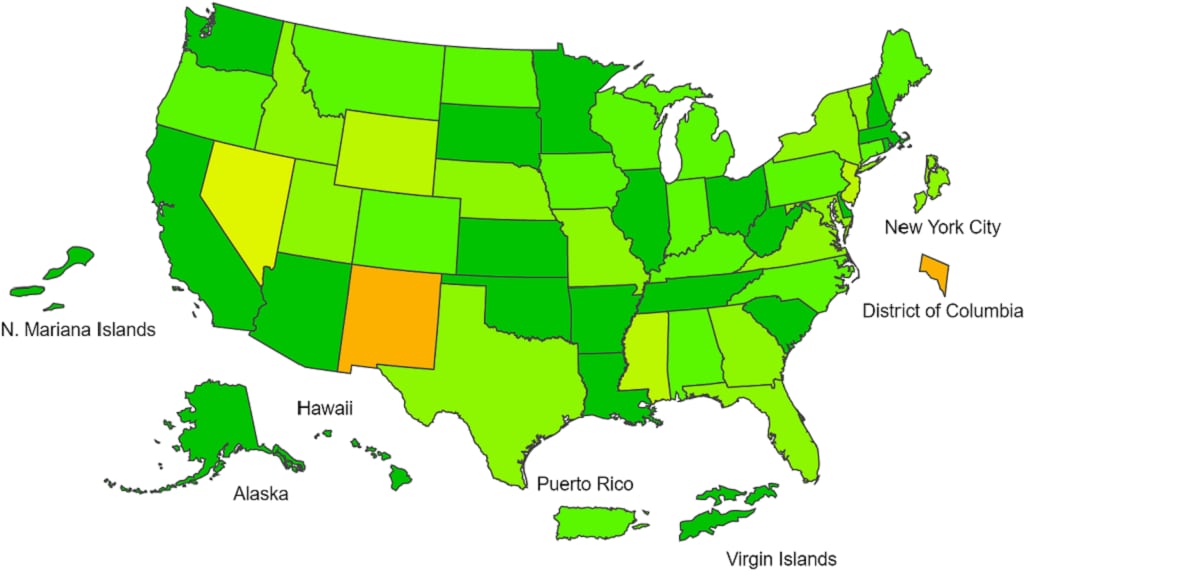
Outpatient Illness: ILINet Activity Map


This week, 1 jurisdiction experienced moderate activity and no jurisdictions experienced high or very high activity.

Long-term Care Facilities0.2%


of facilities reported
≥ 1 influenza-positive tests
among residents this week

Severe Disease


FluSurv-NET
Hospitalization rates will be updated starting later this season.

HHS Protect Hospitalizations288


patients admitted to hospitals with flu
this week


NCHS Mortality16.5%


of deaths attributed to pneumonia, influenza, or COVID-19 this week (above threshold)

Pediatric Deaths0


influenza-associated deaths occurring
this season


All data are preliminary and may change as more reports are received.

A description of the CDC influenza surveillance system, including methodology and detailed descriptions of each data component is available on the surveillance methods page.

Additional information on the current and previous influenza seasons for each surveillance component are available on FluView Interactive.

Key Points
  • An annual flu vaccine is the best way to protect against flu and its potentially serious complications.
  • CDC recommends everyone 6 months and older get a flu vaccine.
  • There also are flu antiviral drugs that can be used to treat flu illness.
U.S. Virologic Surveillance

Clinical Laboratories


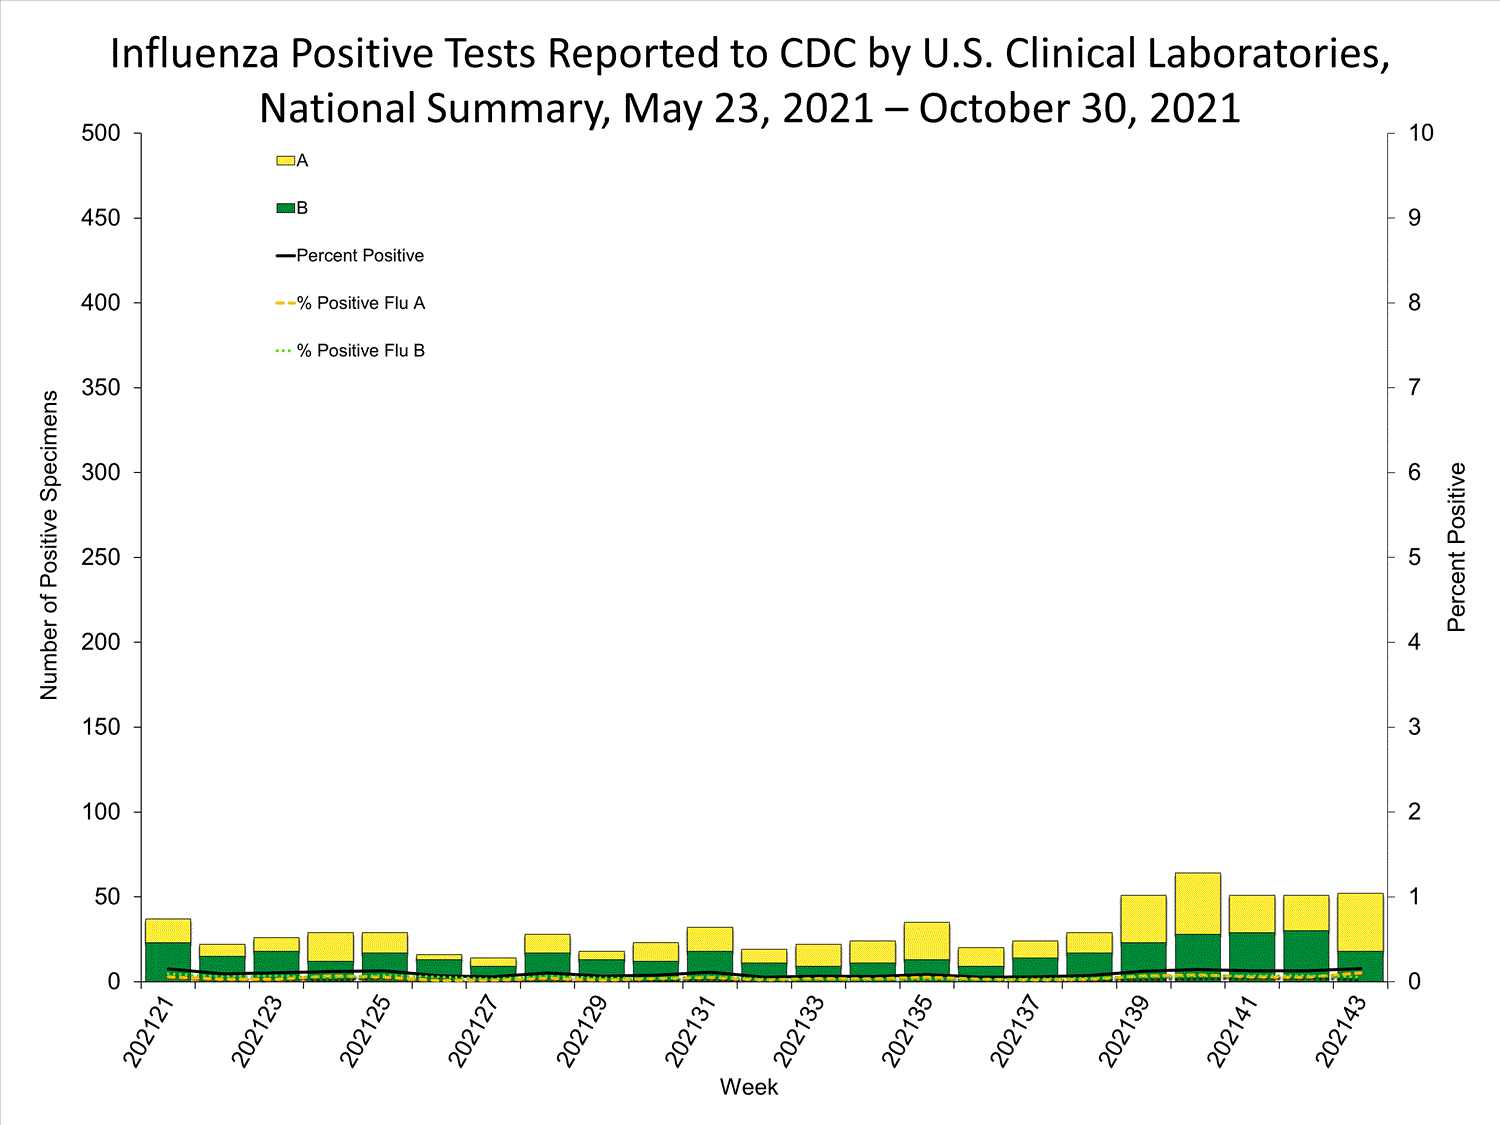
The results of tests performed by clinical laboratories nationwide are summarized below. Data from clinical laboratories (the percentage of specimens tested that are positive for influenza) are used to monitor whether influenza activity is increasing or decreasing.

No. of specimens tested30,338111,986
No. of positive specimens (%)26 (0.1%)134 (0.1%)
Positive specimens by type
Influenza A10 (38.5%)63 (47.0%)
Influenza B16 (61.5%)71 (53.0%)


View Chart Data | View Full ScreenPublic Health Laboratories


The results of tests performed by public health laboratories nationwide are summarized below. Data from public health laboratories are used to monitor the proportion of circulating viruses that belong to each influenza subtype/lineage.
No. of specimens tested20,25351,864
No. of positive specimens839
Positive specimens by type/subtype
Influenza A7 (87.5%)22 (56.4%)
(H1N1)pdm0901 (7.7%)
H3N21 (100%)11 (84.6%)
H3N2v01 (7.7%)
Subtyping not performed69
Influenza B1 (12.5%)17 (43.6%)
Yamagata lineage02 (28.6 %)
Victoria lineage05 (71.4%)
Lineage not performed110


View Chart Data | View Full Screen
Additional virologic surveillance information for current and past seasons:
Surveillance Methods | FluView Interactive: National, Regional, and State Data or Age Data
Influenza Virus Characterization


CDC performs genetic and antigenic characterization of U.S. viruses submitted from state and local health laboratories using Right Size Roadmap submission guidance. These data are used to compare how similar the currently circulating influenza viruses are to the reference viruses representing viruses contained in the current influenza vaccines and to monitor evolutionary changes that continually occur in influenza viruses circulating in humans. CDC also tests susceptibility of influenza viruses to antiviral medications including the neuraminidase inhibitors (oseltamivir, zanamivir, and peramivir) and the PA endonuclease inhibitor baloxavir.

Virus characterization data will be updated later this season when a sufficient number of specimens have been tested.
Outpatient Illness Surveillance


The U.S. Outpatient Influenza-like Illness Surveillance Network (ILINet) monitors outpatient visits for influenza-like illness [(ILI) fever plus cough or sore throat], not laboratory-confirmed influenza, and will capture visits due to other respiratory pathogens, such as SARS-CoV-2, that present with similar symptoms. Due to the COVID-19 pandemic, health care-seeking behaviors have changed and people may be accessing the health care system in alternative settings not captured as a part of ILINet or at a different point in their illness than they might have before the pandemic. Therefore, it is important to evaluate syndromic surveillance data, including that from ILINet, in the context of other sources of surveillance data to obtain a complete and accurate picture of influenza, COVID-19, and other respiratory virus activity. CDC is tracking the COVID-19 pandemic in a weekly publication called COVID Data Tracker Weekly Review. Information about other respiratory virus activity can be found on CDC’s National Respiratory and Enteric Virus Surveillance System (NREVSS) website.

Effective October 3, 2021, the ILI definition (fever plus cough or sore throat) no longer includes “without a known cause other than influenza.” This change was made to improve the consistency with which the definition is applied across reporting sites
ILINet


Nationwide during week 42, 1.8% of patient visits reported through ILINet were due to ILI. This percentage is below the national baseline of 2.5%. All regions are below their baselines. Overall, influenza virus circulation remains low; therefore, any increase in ILI activity is likely due to increased circulation of other respiratory viruses.


* Effective October 3, 2021 (week 40), the ILI definition (fever plus cough or sore throat) no longer includes “without a known cause other than influenza.”


View Chart Data (current season only) | View Full ScreenILI Visits by Age Group


More than 70% of ILINet participants provide both the number of patient visits for ILI and the total number of patient visits for the week broken out by age group. Data from this subset of providers are used to calculate the percentages of patient visits for ILI by age group.

The percentages of visits for ILI reported in ILINet in week 42 remained stable compared to week 41 for all age groups and is showing a decreasing or stable trend during at least the past four weeks for all age groups (0–4 years, 5–24 years, 25–49 years, 50–64 years, and 65+ years).


* Effective October 3, 2021 (week 40), the ILI definition (fever plus cough or sore throat) no longer includes “without a known cause other than influenza.”

View Chart Data | View Full Screen
ILI Activity Map


Data collected in ILINet are used to produce a measure of ILI activity* by state/jurisdiction and Core Based Statistical Areas (CBSA).
Week 42
(Week ending
Oct. 23, 2021)
Week 41
(Week ending
Oct. 16, 2021)
Week 42
(Week ending
Oct. 23, 2021)
Week 41
(Week ending
Oct. 16, 2021)
Very High0000
High0054
Moderate121517
Low366979
Minimal5047534553
Insufficient Data10306276


*Data collected in ILINet may disproportionally represent certain populations within a jurisdiction or CBSA, and therefore, may not accurately depict the full picture of influenza activity for the entire jurisdiction or CBSA. Differences in the data presented here by CDC and independently by some health departments likely represent differing levels of data completeness with data presented by the health department likely being the more complete.
Additional information about medically attended visits for ILI for current and past seasons:
Surveillance Methods | FluView Interactive: National, Regional, and State Data or ILI Activity Map
Long-term Care Facility (LTCF) Surveillance


LTCFs (e.g., nursing homes/skilled nursing, long-term care for the developmentally disabled, and assisted living facilities) from all 50 states and U.S. territories report data on influenza infections among residents the NHSN Long-term Care Facility Component. During week 42, 26 (0.2%) of 14,302 reporting LTCFs reported at least one influenza positive test among their residents.


View Chart Dataexcel icon | View Full Screen
Additional information about long-term care facility surveillance:
Surveillance Methods | Additional Dataexternal icon
Hospitalization Surveillance

FluSurv-NET


The Influenza Hospitalization Surveillance Network (FluSurv-NET) conducts population-based The Influenza Hospitalization Surveillance Network (FluSurv-NET) conducts population-based surveillance for laboratory-confirmed influenza-related hospitalizations in select counties in 14 states and represents approximately 9% of the U.S. population. FluSurv-NET estimated hospitalization rates will be updated weekly starting later this season.
Additional FluSurv-NET hospitalization surveillance information for current and past seasons and additional age groups:
Surveillance Methods | FluView Interactive
HHS-Protect Hospitalization Surveillance


Hospitals report to HHS-Protect the number of patients admitted with laboratory-confirmed influenza. During week 42, 288 patients with laboratory-confirmed influenza were admitted to the hospital.


View Chart Dataexcel icon | View Full Screen
Additional HHS Protect hospitalization surveillance information:
Surveillance Methods | Additional Dataexternal icon
Mortality Surveillance

National Center for Health Statistics (NCHS) Mortality Surveillance


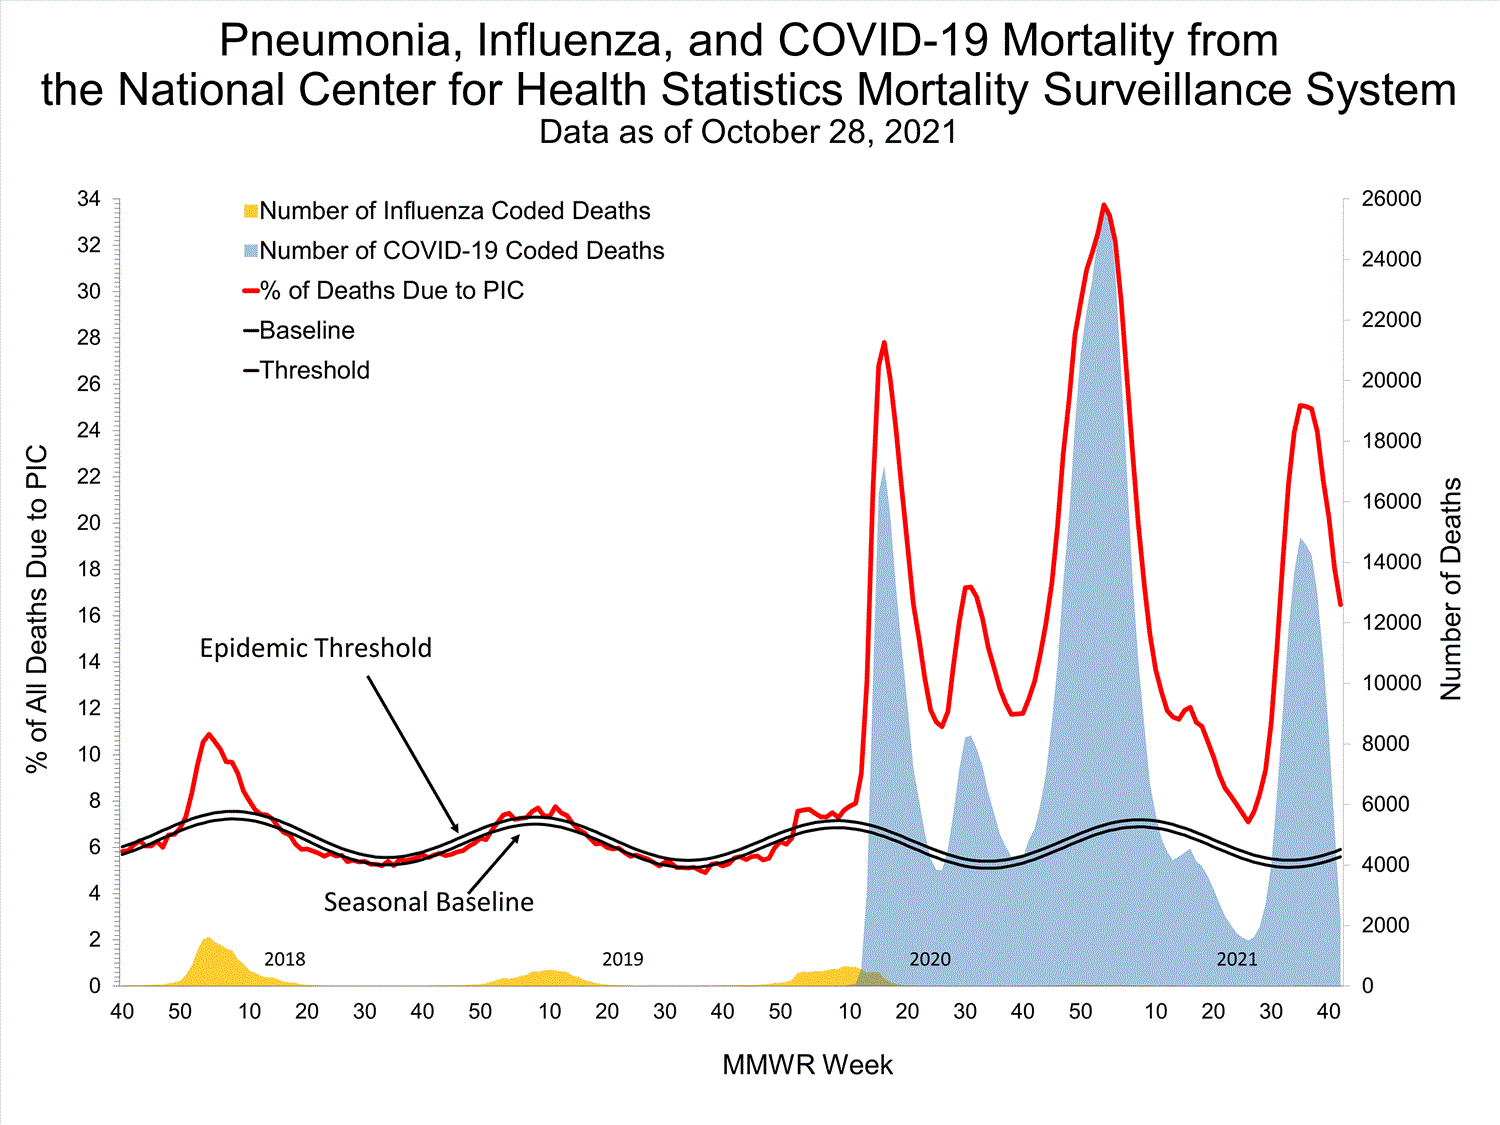
Based on NCHS mortality surveillance data available on October 28, 2021, 16.5% of the deaths that occurred during the week ending October 23, 2021 (week 42), were due to pneumonia, influenza, and/or COVID-19 (PIC). This percentage is above the epidemic threshold of 5.9% for this week. Among the 2,994 PIC deaths reported for this week, 2,188 had COVID-19 listed as an underlying or contributing cause of death on the death certificate, and four listed influenza, indicating that current PIC mortality is due primarily to COVID-19 and not influenza. The data presented are preliminary and may change as more data are received and processed.


View Chart Dataexcel icon | View Full Screen
Additional pneumonia, influenza and COVID-19 mortality surveillance information for current and past seasons:
Surveillance Methods | FluView Interactive
Influenza-Associated Pediatric Mortality


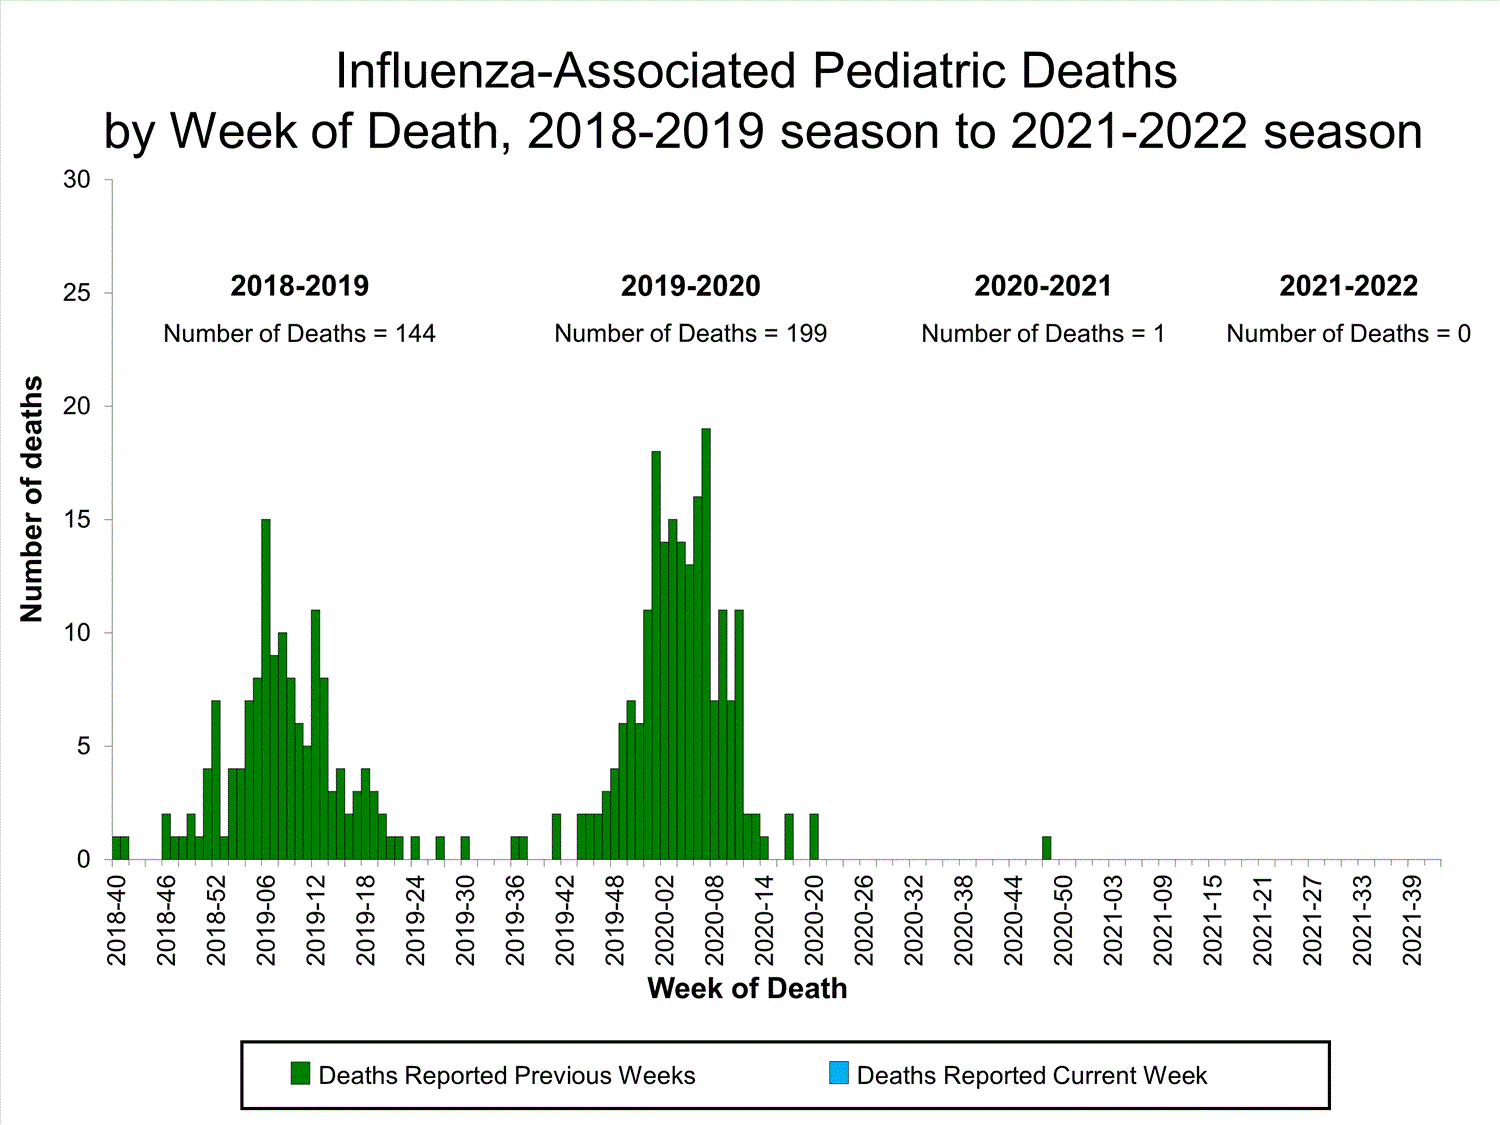
No influenza-associated pediatric deaths occurring during the 2021-2022 season have been reported to CDC.


View Full Screen
Additional pediatric mortality surveillance information for current and past seasons:
Surveillance Methods | FluView Interactive


Additional National and International Influenza Surveillance Information


FluView Interactive: FluView includes enhanced web-based interactive applications that can provide dynamic visuals of the influenza data collected and analyzed by CDC. These FluView Interactive applications allow people to create customized, visual interpretations of influenza data, as well as make comparisons across flu seasons, regions, age groups and a variety of other demographics.

National Institute for Occupational Safety and Health: Monthly surveillance data on the prevalence of health-related workplace absenteeism among full-time workers in the United States are available from NIOSH.

U.S. State and local influenza surveillance: Select a jurisdiction below to access the latest local influenza information. World Health Organization:
Additional influenza surveillance information from participating WHO member nations is available through
FluNetexternal icon and the Global Epidemiology Reports.external icon

WHO Collaborating Centers for Influenza:
Australiaexternal icon, Chinaexternal icon, Japanexternal icon, the United Kingdomexternal icon, and the United States (CDC in Atlanta, Georgia)

Europe:
The most up-to-date influenza information from Europe is available from WHO/Europe and the European Centre for Disease Prevention and Controlexternal icon.

Public Health Agency of Canada:
The most up-to-date influenza information from Canada is available in Canada’s weekly FluWatch reportexternal icon.

Public Health England:
The most up-to-date influenza information from the United Kingdom is available from Public Health Englandexternal icon.

Any links provided to non-Federal organizations are provided solely as a service to our users. These links do not constitute an endorsement of these organizations or their programs by CDC or the Federal Government, and none should be inferred. CDC is not responsible for the content of the individual organization web pages found at these links.

A description of the CDC influenza surveillance system, including methodology and detailed descriptions of each data component is available on the surveillance methods page.

Page last reviewed: October 29, 2021, 11:00 AM


https://www.cdc.gov/flu/weekly/index.htm
 
Weekly U.S. Influenza Surveillance Report

fluview-banner2.jpg

Note: CDC is tracking the COVID-19 pandemic in a weekly publication called COVID Data Tracker Weekly Review.

Key Updates for Week 43, ending October 30, 2021

Seasonal influenza activity in the United States remains low, but the number of influenza virus detections reported by public health laboratories has increased in recent weeks.
Viruses


Clinical Lab0.2%


positive for influenza
this week


Public Health Lab
A small but increasing
number of specimens have
tested positive.


Virus Characterization
Influenza virus characterization information will be reported later this season.
Illness

Outpatient Illness: ILINet1.9%


of visits to a health care provider for ILI this week
(below baseline)


Outpatient Illness: ILINet Activity Map


This week, 2 jurisdictions experienced moderate activity and no jurisdictions experienced high or very high activity.

Long-term Care Facilities0.2%


of facilities reported
≥ 1 influenza-positive test
among residents this week

Severe Disease


FluSurv-NET
Hospitalization rates will be updated starting later this season.

HHS Protect Hospitalizations282


patients admitted to hospitals with influenza
this week


NCHS Mortality15.6%


of deaths attributed to pneumonia, influenza, or COVID-19 this week (above threshold)

Pediatric Deaths0


influenza-associated deaths occurring
this season


All data are preliminary and may change as more reports are received.

A description of the CDC influenza surveillance system, including methodology and detailed descriptions of each data component is available on the surveillance methods page.

Additional information on the current and previous influenza seasons for each surveillance component are available on FluView Interactive.

Key Points
  • While influenza activity is low nationally, the number of influenza viruses detected by public health labs has increased in recent weeks.
  • An annual flu vaccine is the best way to protect against flu and its potentially serious complications. CDC recommends everyone 6 months and older get a flu vaccine.
  • There also are flu antiviral drugs that can be used to treat flu illness.
U.S. Virologic Surveillance

Clinical Laboratories


The results of tests performed by clinical laboratories nationwide are summarized below. Data from clinical laboratories (the percentage of specimens tested that are positive for influenza) are used to monitor whether influenza activity is increasing or decreasing.

No. of specimens tested32,943156,261
No. of positive specimens (%)52 (0.2%)218 (0.1%)
Positive specimens by type
Influenza A34 (65.4%)113 (51.8%)
Influenza B18 (34.6%)105 (48.2%)


View Chart Data | View Full ScreenPublic Health Laboratories


The results of tests performed by public health laboratories nationwide are summarized below. Data from public health laboratories are used to monitor the proportion of circulating viruses that belong to each influenza subtype/lineage.
No. of specimens tested21,72076,169
No. of positive specimens3589
Positive specimens by type/subtype
Influenza A32 (91.4%)64 (71.9%)
(H1N1)pdm0901 (2.0%)
H3N225 (100%)49 (96.1%)
H3N2v01 (2.0%)
Subtyping not performed713
Influenza B3 (8.6%)25 (28.1%)
Yamagata lineage02 (18.2 %)
Victoria lineage2 (100%)9 (81.8%)
Lineage not performed114


View Chart Data | View Full Screen
Additional virologic surveillance information for current and past seasons:
Surveillance Methods | FluView Interactive: National, Regional, and State Data or Age Data
Novel Influenza A Virus


Three human infections with novel influenza A viruses that occurred during the 2020-21 influenza season were reported. One human infection with novel influenza A(H1N2) variant (A(H1N2)v) was reported by Indiana and two human infections with influenza A(H1N1)v were reported by Iowa. All three patients were adults ≥ 18 years of age, were not hospitalized, and have recovered from their illness. All three patients had attended an agricultural event where swine were present and/or visited a farm where swine were present. No ongoing human-to-human transmission was identified associated with any of these patients.

During the 2020-21 influenza season, 14 human infections with a novel influenza A viruses were reported in the United States, including two H3N2v (IA, WI), four H1N2v (IA, IN, OH (2)), and eight H1N1v (IA (3), NC, ND, WI (3)) virus infections. During the 2021-22 influenza season, one human infection with a novel influenza A virus has been reported in the United States: H3N2v (OH).

When an influenza virus that normally circulates in swine (but not people) is detected in a person, it is called a “variant influenza virus”. Most human infections with variant influenza viruses occur following close proximity to swine, but human-to-human transmission can occur. It is important to note that in most cases, variant influenza viruses have not shown the ability to spread easily and sustainably from person to person. Early identification and investigation of human infections with novel influenza A viruses are critical so that the risk of infection can be more fully understood and appropriate public health measures can be taken. Additional information on influenza in swine, variant influenza virus infection in humans, and strategies to interact safely with swine can be found at www.cdc.gov/flu/swineflu/index.htm. Additional information regarding human infections with novel influenza A viruses can be found at http://gis.cdc.gov/grasp/fluview/Novel_Influenza.html.
Influenza Virus Characterization


CDC performs genetic and antigenic characterization of U.S. viruses submitted from state and local health laboratories using Right Size Roadmap submission guidance. These data are used to compare how similar the currently circulating influenza viruses are to the reference viruses representing viruses contained in the current influenza vaccines and to monitor evolutionary changes that continually occur in influenza viruses circulating in humans. CDC also tests susceptibility of influenza viruses to antiviral medications including the neuraminidase inhibitors (oseltamivir, zanamivir, and peramivir) and the PA endonuclease inhibitor baloxavir.

Virus characterization data will be updated later this season when a sufficient number of specimens have been tested.
Outpatient Illness Surveillance


The U.S. Outpatient Influenza-like Illness Surveillance Network (ILINet) monitors outpatient visits for influenza-like illness [(ILI) fever plus cough or sore throat], not laboratory-confirmed influenza, and will capture visits due to other respiratory pathogens, such as SARS-CoV-2, that present with similar symptoms. Due to the COVID-19 pandemic, health care-seeking behaviors have changed and people may be accessing the health care system in alternative settings not captured as a part of ILINet or at a different point in their illness than they might have before the pandemic. Therefore, it is important to evaluate syndromic surveillance data, including that from ILINet, in the context of other sources of surveillance data to obtain a complete and accurate picture of influenza, COVID-19, and other respiratory virus activity. CDC is tracking the COVID-19 pandemic in a weekly publication called COVID Data Tracker Weekly Review. Information about other respiratory virus activity can be found on CDC’s National Respiratory and Enteric Virus Surveillance System (NREVSS) website.
ILINet


Nationwide during week 43, 1.9% of patient visits reported through ILINet were due to ILI. This percentage is below the national baseline of 2.5%. All regions are below their baselines. Overall, influenza virus circulation remains low; therefore, any increase in ILI activity is likely due to increased circulation of other respiratory viruses.


* Effective October 3, 2021 (week 40), the ILI definition (fever plus cough or sore throat) no longer includes “without a known cause other than influenza.”


View Chart Data (current season only) | View Full ScreenILI Visits by Age Group


More than 70% of ILINet participants provide both the number of patient visits for ILI and the total number of patient visits for the week broken out by age group. Data from this subset of providers are used to calculate the percentages of patient visits for ILI by age group.

The percentages of visits for ILI reported in ILINet in week 43 remained stable compared to week 42 for all age groups and is showing a stable trend during at least the past four weeks for all age groups (0–4 years, 5–24 years, 25–49 years, 50–64 years, and 65+ years).


* Effective October 3, 2021 (week 40), the ILI definition (fever plus cough or sore throat) no longer includes “without a known cause other than influenza.”

View Chart Data | View Full Screen
ILI Activity Map


Data collected in ILINet are used to produce a measure of ILI activity* by state/jurisdiction and Core Based Statistical Areas (CBSA).
Week 43
(Week ending
Oct. 30, 2021)
Week 42
(Week ending
Oct. 23, 2021)
Week 43
(Week ending
Oct. 30, 2021)
Week 42
(Week ending
Oct. 23, 2021)
Very High0000
High0075
Moderate211815
Low437870
Minimal4951541547
Insufficient Data00285292


*Data collected in ILINet may disproportionally represent certain populations within a jurisdiction or CBSA, and therefore, may not accurately depict the full picture of influenza activity for the entire jurisdiction or CBSA. Differences in the data presented here by CDC and independently by some health departments likely represent differing levels of data completeness with data presented by the health department likely being the more complete.
Additional information about medically attended visits for ILI for current and past seasons:
Surveillance Methods | FluView Interactive: National, Regional, and State Data or ILI Activity Map
Long-term Care Facility (LTCF) Surveillance


LTCFs (e.g., nursing homes/skilled nursing, long-term care for the developmentally disabled, and assisted living facilities) from all 50 states and U.S. territories report data on influenza infections among residents through the National Healthcare Safety Network (NHSN) Long-term Care Facility Component. During week 43, 27 (0.2%) of 14,216 reporting LTCFs reported at least one influenza positive test among their residents.


View Chart Dataexcel icon | View Full Screen
Additional information about long-term care facility surveillance:
Surveillance Methods | Additional Dataexternal icon
Hospitalization Surveillance

FluSurv-NET


The Influenza Hospitalization Surveillance Network (FluSurv-NET) conducts population-based The Influenza Hospitalization Surveillance Network (FluSurv-NET) conducts population-based surveillance for laboratory-confirmed influenza-related hospitalizations in select counties in 14 states and represents approximately 9% of the U.S. population. FluSurv-NET estimated hospitalization rates will be updated weekly starting later this season.
Additional FluSurv-NET hospitalization surveillance information for current and past seasons and additional age groups:
Surveillance Methods | FluView Interactive
HHS-Protect Hospitalization Surveillance


Hospitals report to HHS-Protect the number of patients admitted with laboratory-confirmed influenza. During week 43, 282 patients with laboratory-confirmed influenza were admitted to the hospital.


View Chart Dataexcel icon | View Full Screen
Additional HHS Protect hospitalization surveillance information:
Surveillance Methods | Additional Dataexternal icon
Mortality Surveillance

National Center for Health Statistics (NCHS) Mortality Surveillance


Based on NCHS mortality surveillance data available on November 4, 2021, 15.6% of the deaths that occurred during the week ending October 30, 2021 (week 43), were due to pneumonia, influenza, and/or COVID-19 (PIC). This percentage is above the epidemic threshold of 6.0% for this week. Among the 3,086 PIC deaths reported for this week, 2,224 had COVID-19 listed as an underlying or contributing cause of death on the death certificate, and one listed influenza, indicating that current PIC mortality is due primarily to COVID-19 and not influenza. The data presented are preliminary and may change as more data are received and processed.


View Chart Dataexcel icon | View Full Screen
Additional pneumonia, influenza and COVID-19 mortality surveillance information for current and past seasons:
Surveillance Methods | FluView Interactive
Influenza-Associated Pediatric Mortality


No influenza-associated pediatric deaths occurring during the 2021-2022 season have been reported to CDC.


View Full Screen
Additional pediatric mortality surveillance information for current and past seasons:
Surveillance Methods | FluView Interactive


Additional National and International Influenza Surveillance Information


FluView Interactive: FluView includes enhanced web-based interactive applications that can provide dynamic visuals of the influenza data collected and analyzed by CDC. These FluView Interactive applications allow people to create customized, visual interpretations of influenza data, as well as make comparisons across flu seasons, regions, age groups and a variety of other demographics.

National Institute for Occupational Safety and Health: Monthly surveillance data on the prevalence of health-related workplace absenteeism among full-time workers in the United States are available from NIOSH.

U.S. State and local influenza surveillance: Select a jurisdiction below to access the latest local influenza information. World Health Organization:
Additional influenza surveillance information from participating WHO member nations is available through
FluNetexternal icon and the Global Epidemiology Reports.external icon

WHO Collaborating Centers for Influenza:
Australiaexternal icon, Chinaexternal icon, Japanexternal icon, the United Kingdomexternal icon, and the United States (CDC in Atlanta, Georgia)

Europe:
The most up-to-date influenza information from Europe is available from WHO/Europe and the European Centre for Disease Prevention and Controlexternal icon.

Public Health Agency of Canada:
The most up-to-date influenza information from Canada is available in Canada’s weekly FluWatch reportexternal icon.

Public Health England:
The most up-to-date influenza information from the United Kingdom is available from Public Health Englandexternal icon.

Any links provided to non-Federal organizations are provided solely as a service to our users. These links do not constitute an endorsement of these organizations or their programs by CDC or the Federal Government, and none should be inferred. CDC is not responsible for the content of the individual organization web pages found at these links.

A description of the CDC influenza surveillance system, including methodology and detailed descriptions of each data component is available on the surveillance methods page.

Page last reviewed: November 5, 2021, 11:00 AM
Content source: Centers for Disease Control and Prevention, National Center for Immunization and Respiratory Diseases (NCIRD)


https://www.cdc.gov/flu/weekly/index.htm
 
Weekly U.S. Influenza Surveillance Report

fluview-banner2.jpg

Note: CDC is tracking the COVID-19 pandemic in a weekly publication called COVID Data Tracker Weekly Review.

Key Updates for Week 44, ending November 6, 2021

Seasonal influenza activity in the United States remains low, but the number of influenza virus detections reported by public health laboratories has increased in recent weeks.
Viruses


Clinical Lab0.3%


positive for influenza
this week


Public Health Lab
A small but increasing
number of specimens have
tested positive.


Virus Characterization
Influenza virus characterization information will be reported later this season.
Illness

Outpatient Illness: ILINet2.1%


of visits to a health care provider for ILI this week
(below baseline)


Outpatient Illness: ILINet Activity Map


This week, 1 jurisdiction experienced moderate activity and 1 jurisdiction experienced high or very high activity.

Long-term Care Facilities0.1%


of facilities reported
≥ 1 influenza-positive test
among residents this week

Severe Disease


FluSurv-NET
Hospitalization rates will be updated starting later this season.

HHS Protect Hospitalizations295


patients admitted to hospitals with influenza
this week


NCHS Mortality14.1%


of deaths attributed to pneumonia, influenza, or COVID-19 this week (above threshold)

Pediatric Deaths0


influenza-associated deaths occurring
this season


All data are preliminary and may change as more reports are received.

A description of the CDC influenza surveillance system, including methodology and detailed descriptions of each data component is available on the surveillance methods page.

Additional information on the current and previous influenza seasons for each surveillance component are available on FluView Interactive.

Key Points
  • While influenza activity is low nationally, the number of influenza viruses detected by public health labs has increased in recent weeks.
  • The majority of viruses detected are A(H3N2). More than 90% are among children and young adults aged 5-24 years.
  • An annual flu vaccine is the best way to protect against flu and its potentially serious complications. CDC recommends everyone 6 months and older get a flu vaccine.
  • As of October 29, 2021, 158.7M doses of flu vaccine have been distributed in the US.
  • Flu vaccines are available at many different locations including pharmacies and health departments.
  • Visit www.vaccines.gov to find a flu vaccine near you. There also are flu antiviral drugs that can be used to treat flu illness.
U.S. Virologic Surveillance

Clinical Laboratories


The results of tests performed by clinical laboratories nationwide are summarized below. Data from clinical laboratories (the percentage of specimens tested that are positive for influenza) are used to monitor whether influenza activity is increasing or decreasing.

No. of specimens tested34,828201,409
No. of positive specimens (%)101 (0.3%)320 (0.2%)
Positive specimens by type
Influenza A78 (77.2%)188 (58.8%)
Influenza B23 (22.8%)132 (41.3%)


View Chart Data | View Full ScreenPublic Health Laboratories


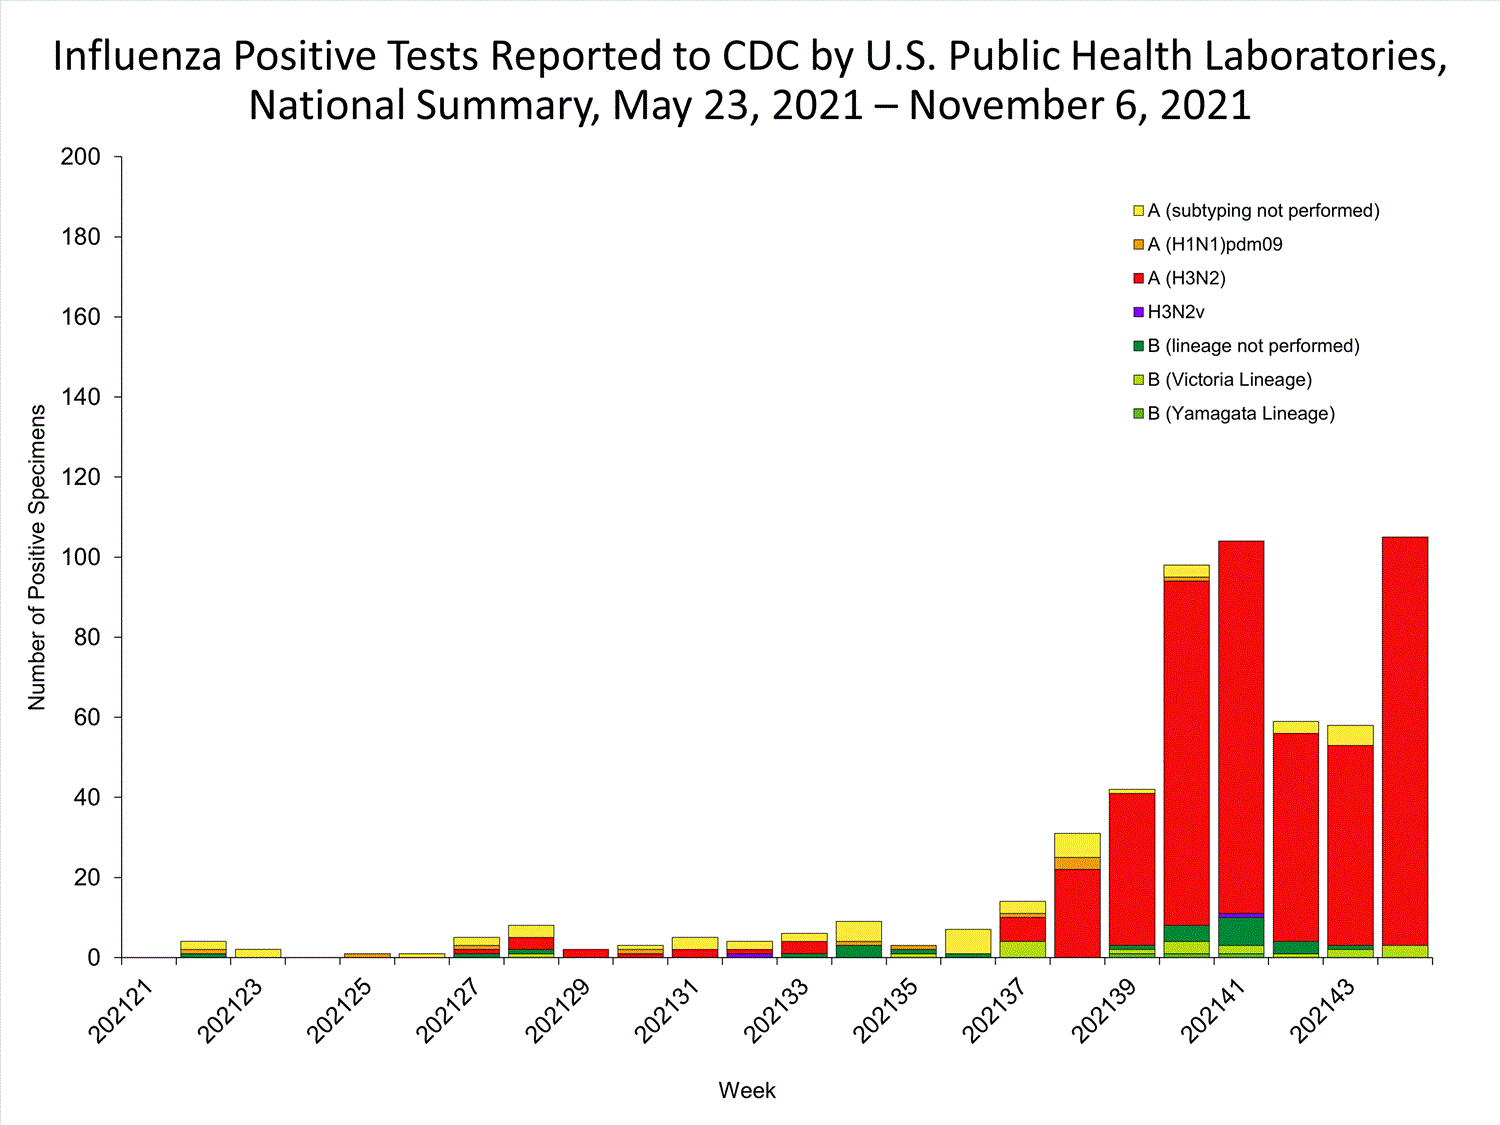
The results of tests performed by public health laboratories nationwide are summarized below. Data from public health laboratories are used to monitor the proportion of circulating viruses that belong to each influenza subtype/lineage.
No. of specimens tested21,450107,933
No. of positive specimens110429
Positive specimens by type/subtype
Influenza A107 (97.3%)401 (93.5%)
(H1N1)pdm0901 (0.3%)
H3N2102 (100%)383 (99.5%)
H3N2v01 (0.3%)
Subtyping not performed516
Influenza B3 (2.7%)28 (6.5%)
Yamagata lineage02 (15.4 %)
Victoria lineage3 (100%)11 (84.6%)
Lineage not performed015


Overall influenza activity is still low; however, an increasing number of an influenza A(H3N2) viruses have been reported by public health laboratories in the most recent weeks. During the most recent three weeks, influenza A(H3N2) viruses have been reported by public health laboratories in seven of the 10 HHS regions (Regions 1, 3, 4, 5, 7, 8, and 9). Among 102 A(H3N2) viruses reported for week 44, 68 (66.7%) were reported by Michigan. The majority of influenza positives reported from Michigan can be linked to a single outbreak among young adults. Additionally, during week 44, a large backfill of data from previous weeks was received from Region 3. For regional and state level data about circulating influenza viruses, please visit FluView Interactive.


View Chart Data | View Full Screen
Additional virologic surveillance information for current and past seasons:
Surveillance Methods | FluView Interactive: National, Regional, and State Data or Age Data
Influenza Virus Characterization


CDC performs genetic and antigenic characterization of U.S. viruses submitted from state and local health laboratories using Right Size Roadmap submission guidance. These data are used to compare how similar the currently circulating influenza viruses are to the reference viruses representing viruses contained in the current influenza vaccines and to monitor evolutionary changes that continually occur in influenza viruses circulating in humans. CDC also tests susceptibility of influenza viruses to antiviral medications including the neuraminidase inhibitors (oseltamivir, zanamivir, and peramivir) and the PA endonuclease inhibitor baloxavir.

Virus characterization data will be updated later this season when a sufficient number of specimens have been tested.
Outpatient Illness Surveillance


The U.S. Outpatient Influenza-like Illness Surveillance Network (ILINet) monitors outpatient visits for influenza-like illness [(ILI) fever plus cough or sore throat], not laboratory-confirmed influenza, and will capture visits due to other respiratory pathogens, such as SARS-CoV-2, that present with similar symptoms. Due to the COVID-19 pandemic, health care-seeking behaviors have changed and people may be accessing the health care system in alternative settings not captured as a part of ILINet or at a different point in their illness than they might have before the pandemic. Therefore, it is important to evaluate syndromic surveillance data, including that from ILINet, in the context of other sources of surveillance data to obtain a complete and accurate picture of influenza, COVID-19, and other respiratory virus activity. CDC is tracking the COVID-19 pandemic in a weekly publication called COVID Data Tracker Weekly Review. Information about other respiratory virus activity can be found on CDC’s National Respiratory and Enteric Virus Surveillance System (NREVSS) website.
ILINet


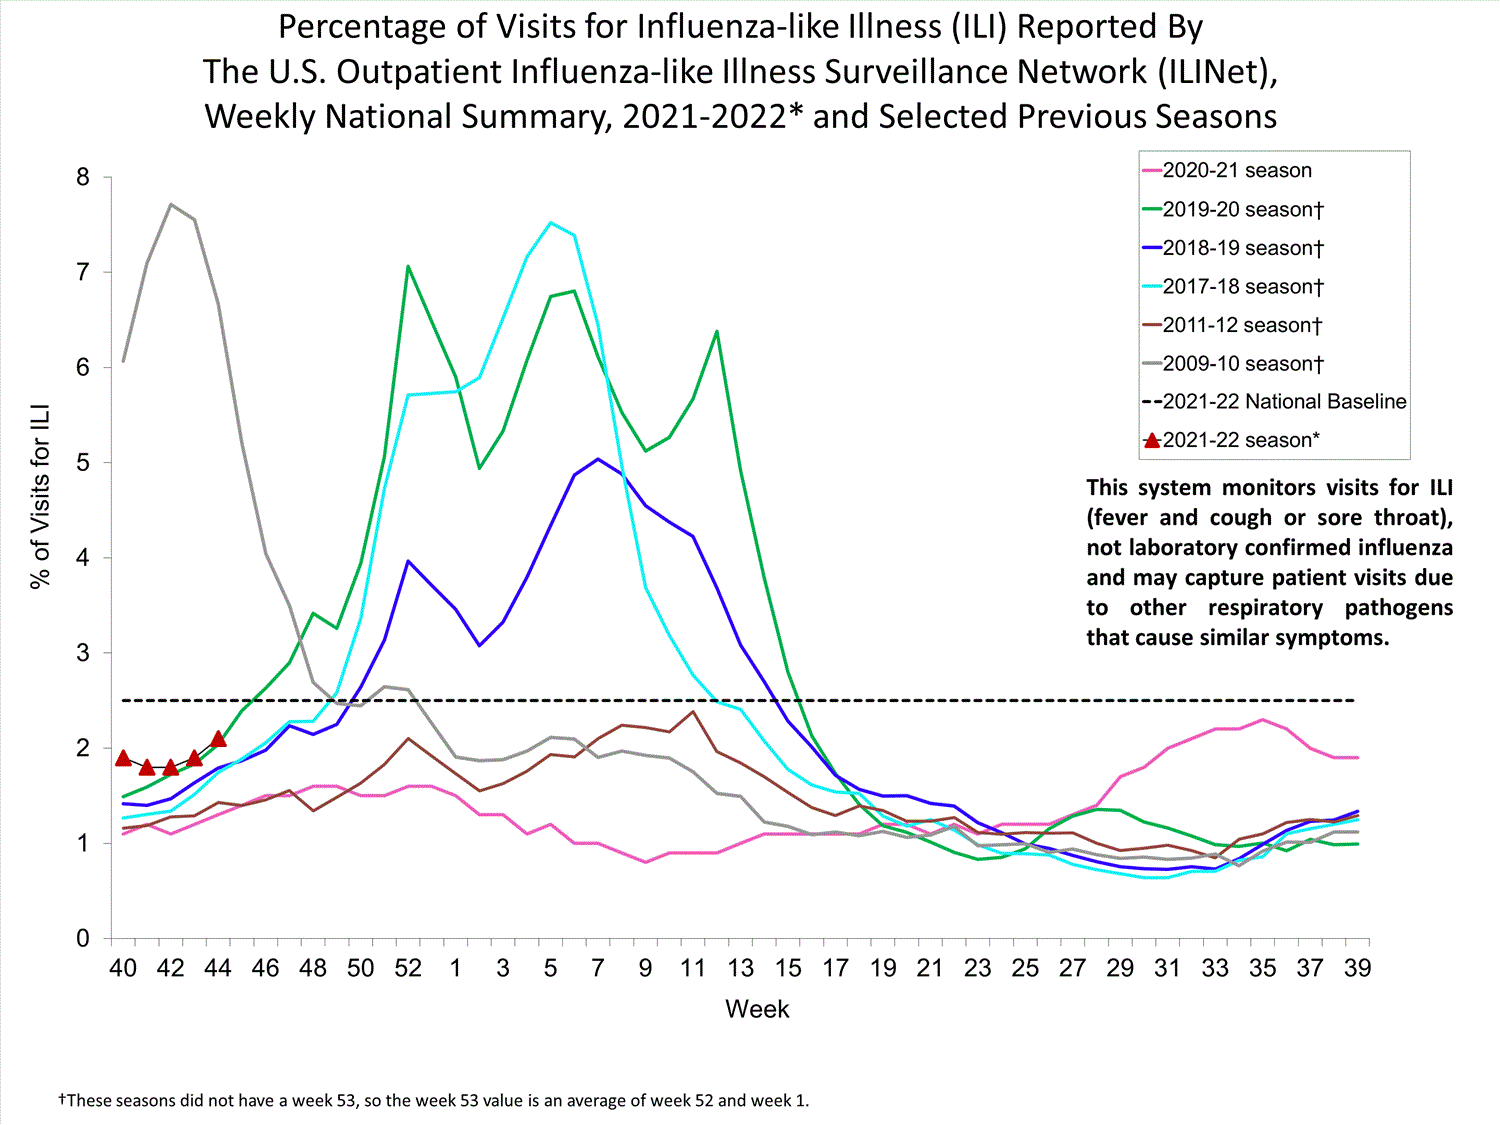
Nationwide during week 44, 2.1% of patient visits reported through ILINet were due to ILI. This percentage is below the national baseline of 2.5%. Region 7 is above their region-specific baseline, and all other regions are below their baselines. Multiple respiratory viruses are co-circulating; therefore, the relative contribution of influenza virus infection to ILI varies by location.


* Effective October 3, 2021 (week 40), the ILI definition (fever plus cough or sore throat) no longer includes “without a known cause other than influenza.”


View Chart Data (current season only) | View Full ScreenILI Visits by Age Group


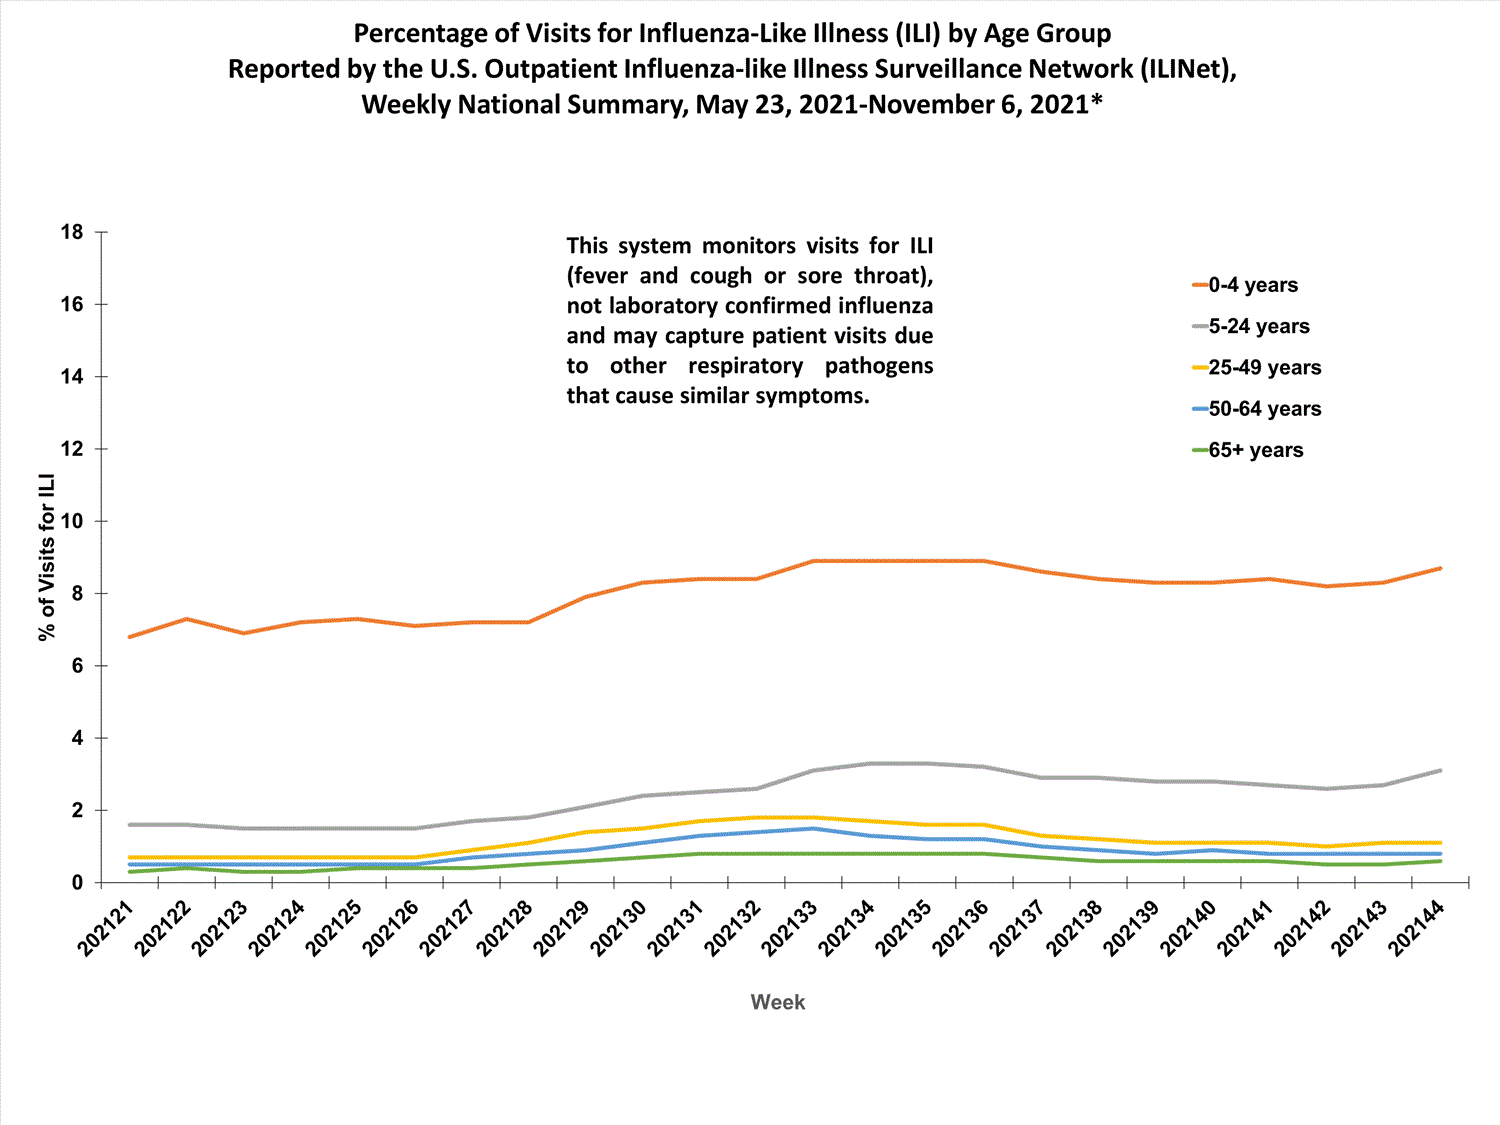
More than 70% of ILINet participants provide both the number of patient visits for ILI and the total number of patient visits for the week broken out by age group. Data from this subset of providers are used to calculate the percentages of patient visits for ILI by age group.

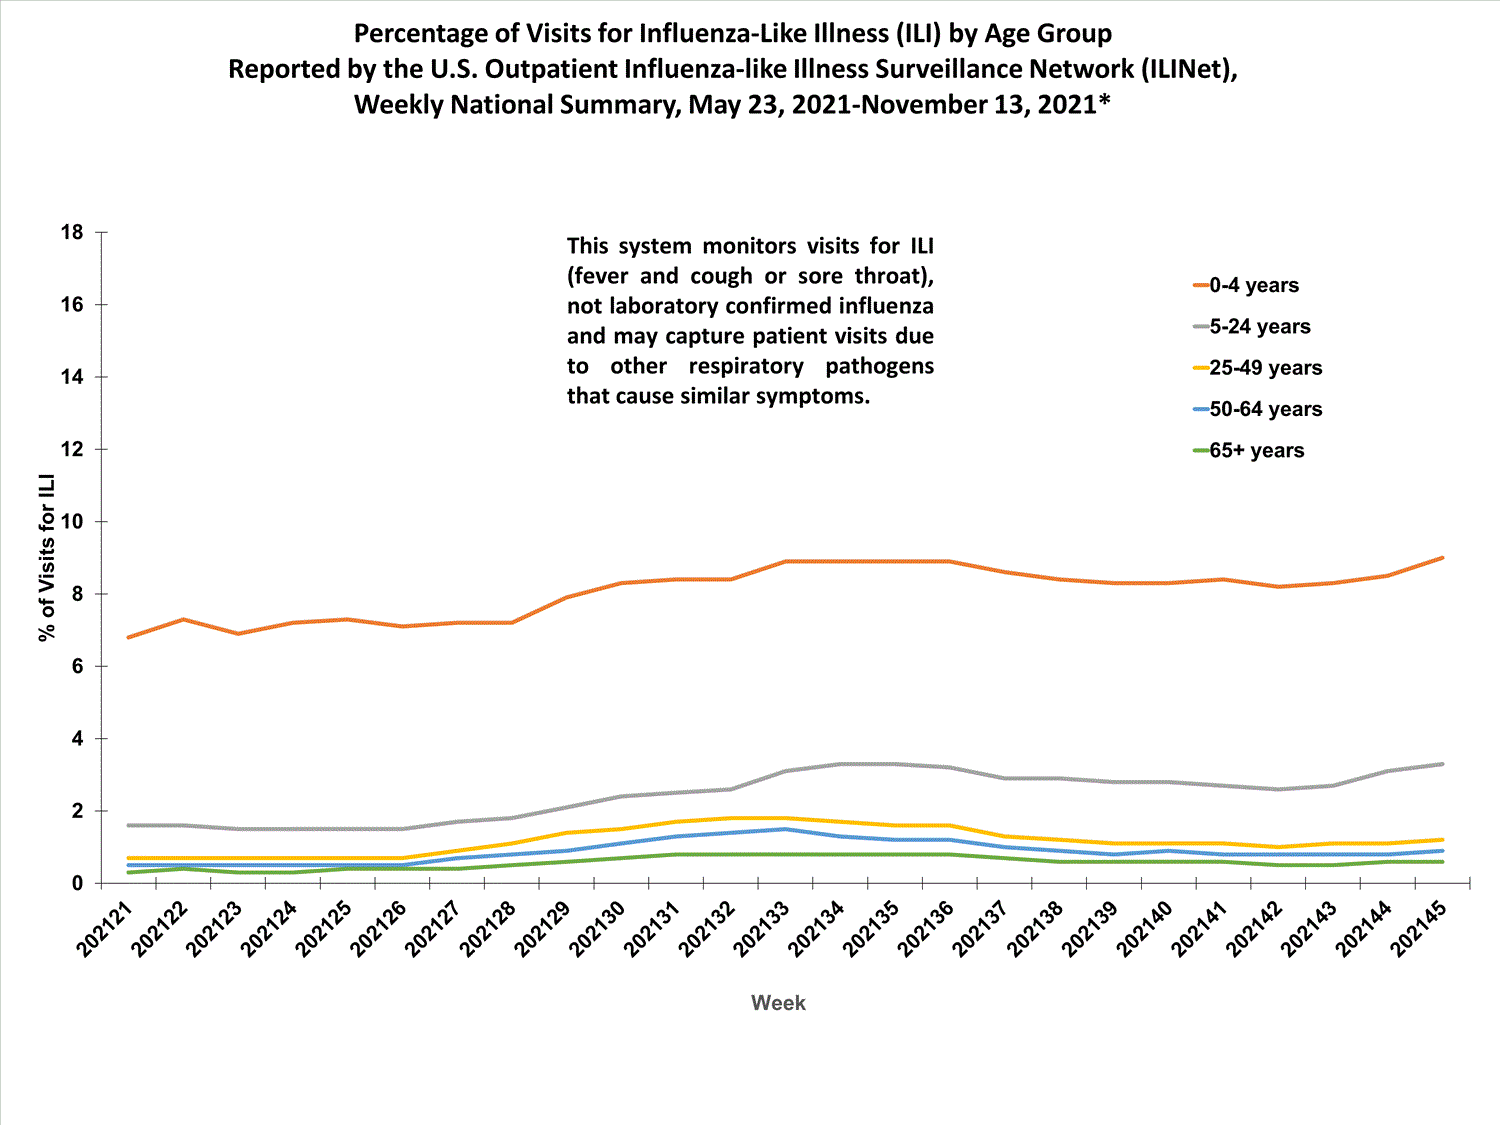
The percentages of visits for ILI reported in ILINet in week 44 increased for two age groups (0–4 years, 5–24 years) and remained stable for three age groups (25–49 years, 50–64 years, and 65+ years) compared to week 43. All age groups are showing a small increase or stable trend over the past four weeks.


* Effective October 3, 2021 (week 40), the ILI definition (fever plus cough or sore throat) no longer includes “without a known cause other than influenza.”

View Chart Data | View Full Screen
ILI Activity Map


Data collected in ILINet are used to produce a measure of ILI activity* by state/jurisdiction and Core Based Statistical Areas (CBSA).
Week 44
(Week ending
Nov. 6, 2021)
Week 43
(Week ending
Oct. 30, 2021)
Week 44
(Week ending
Nov. 6, 2021)
Week 43
(Week ending
Oct. 30, 2021)
Very High0020
High1099
Moderate132818
Low1028179
Minimal4050517552
Insufficient Data30292271


*Data collected in ILINet may disproportionally represent certain populations within a jurisdiction or CBSA, and therefore, may not accurately depict the full picture of influenza activity for the entire jurisdiction or CBSA. Differences in the data presented here by CDC and independently by some health departments likely represent differing levels of data completeness with data presented by the health department likely being the more complete.
Additional information about medically attended visits for ILI for current and past seasons:
Surveillance Methods | FluView Interactive: National, Regional, and State Data or ILI Activity Map
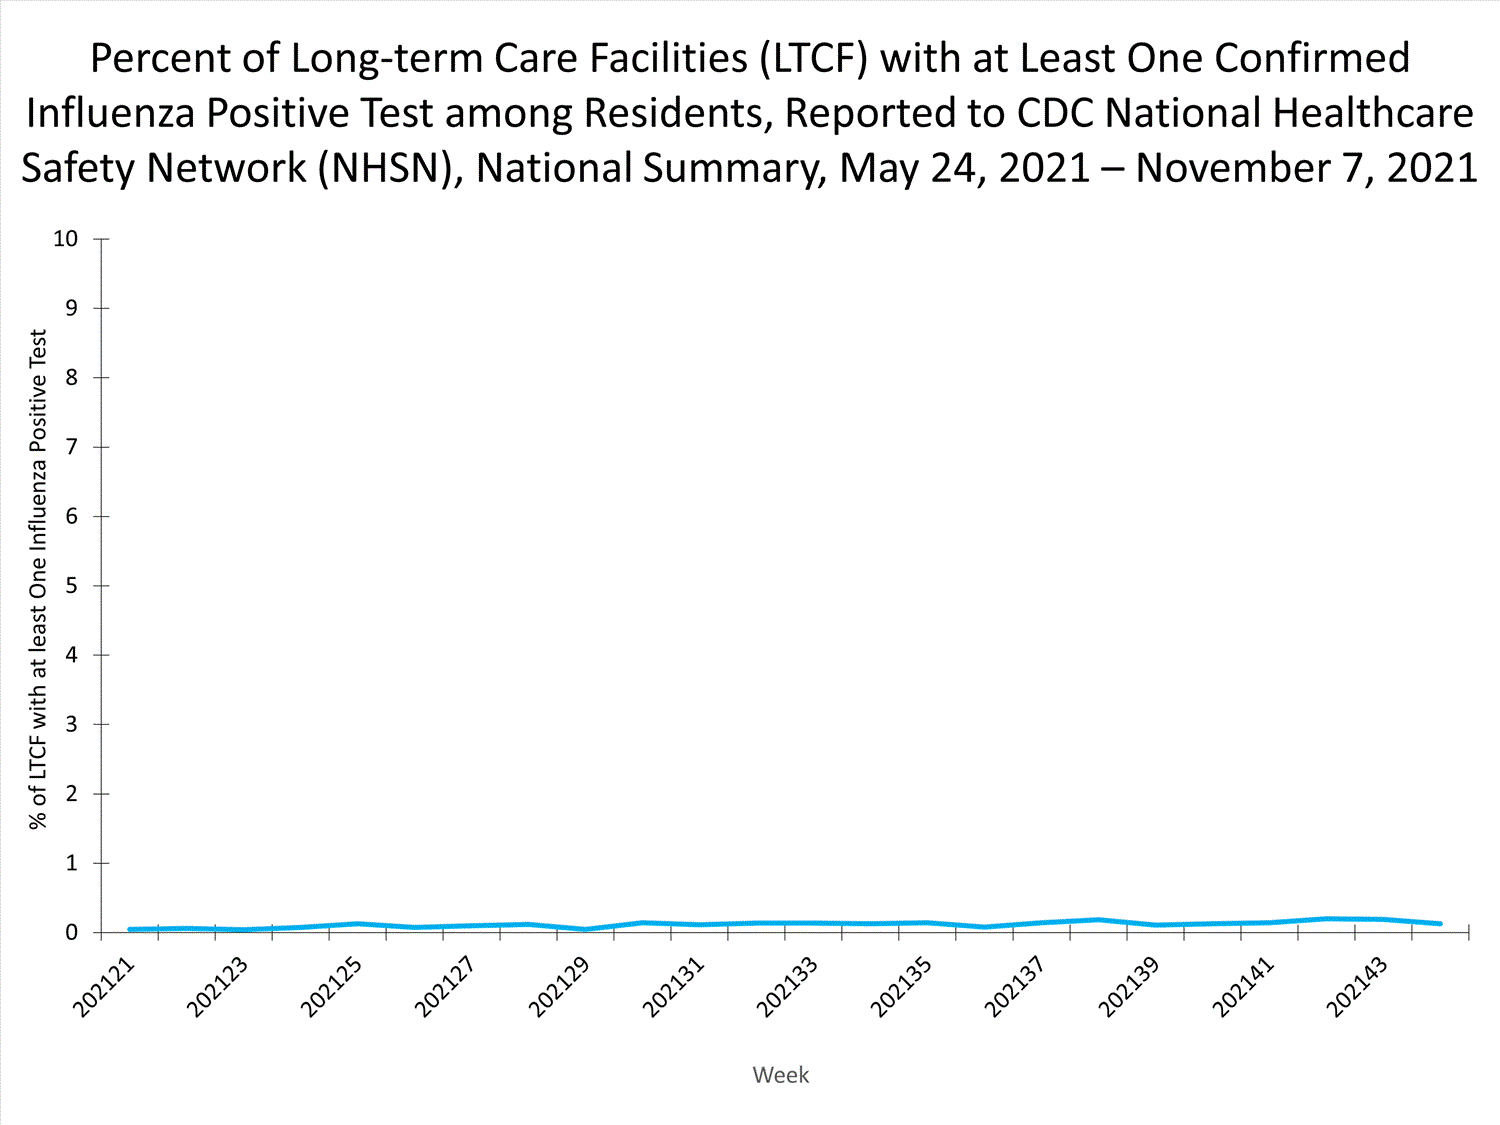
Long-term Care Facility (LTCF) Surveillance


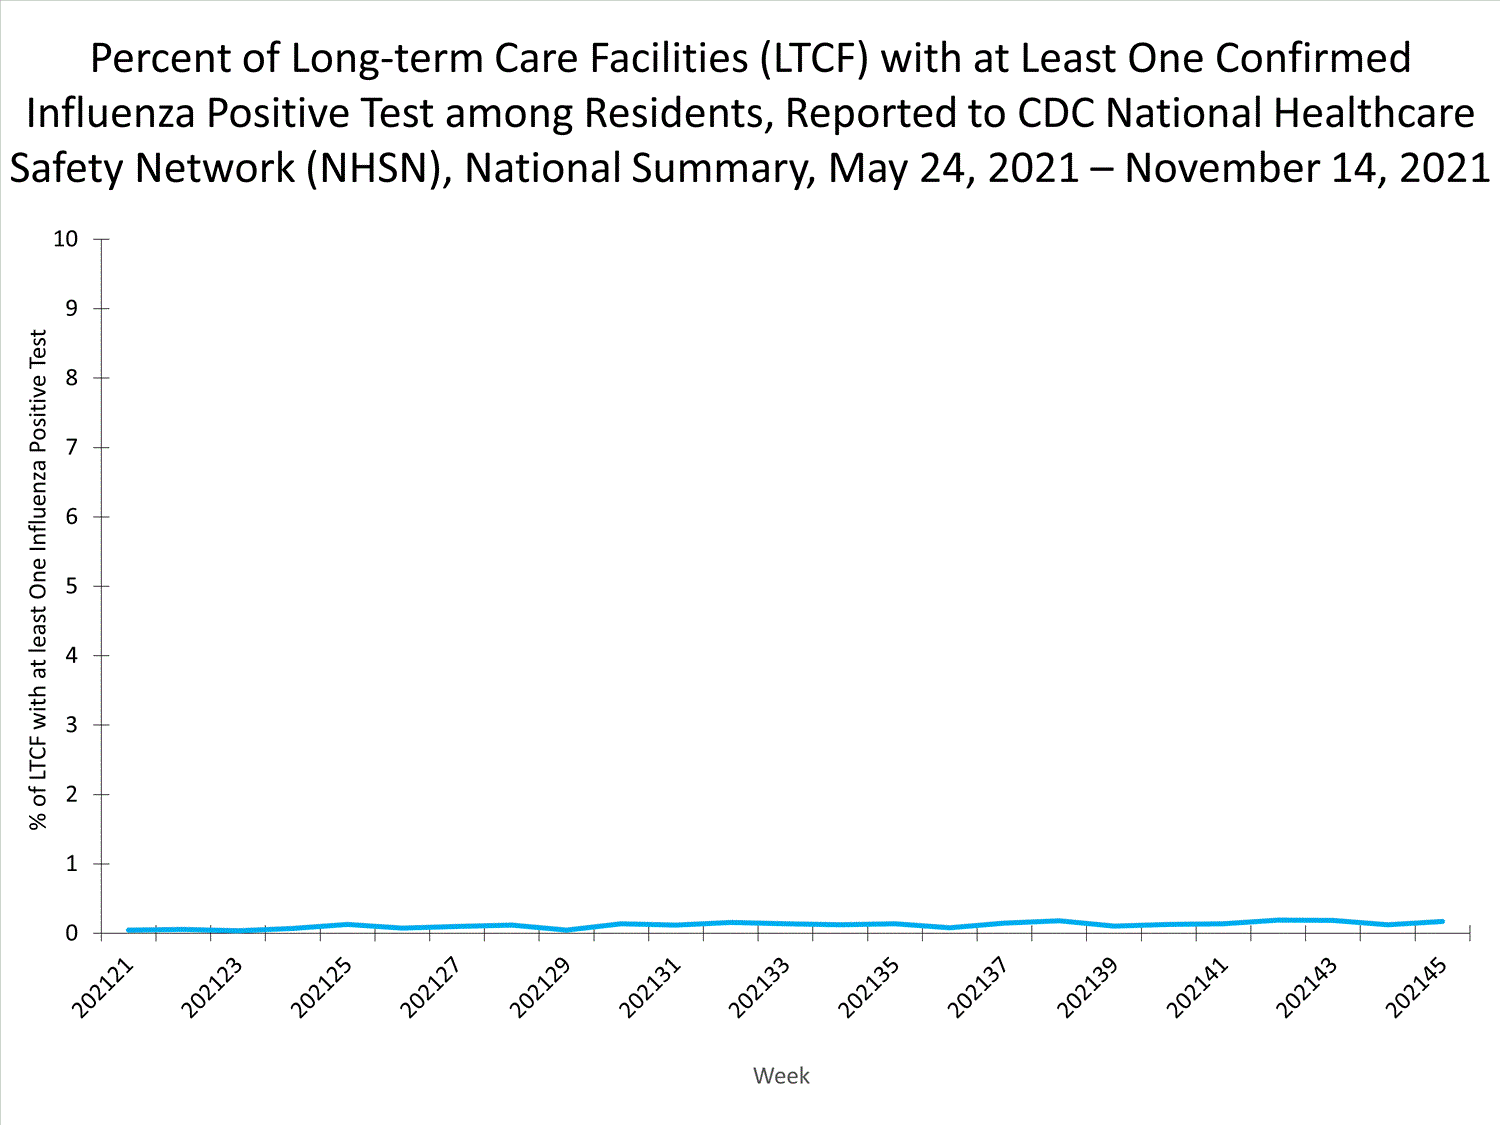
LTCFs (e.g., nursing homes/skilled nursing, long-term care for the developmentally disabled, and assisted living facilities) from all 50 states and U.S. territories report data on influenza infections among residents through the National Healthcare Safety Network (NHSN) Long-term Care Facility Component. During week 44, 18 (0.1%) of 14,228 reporting LTCFs reported at least one influenza positive test among their residents.


View Chart Dataexcel icon | View Full Screen
Additional information about long-term care facility surveillance:
Surveillance Methods | Additional Dataexternal icon
Hospitalization Surveillance

FluSurv-NET


The Influenza Hospitalization Surveillance Network (FluSurv-NET) conducts population-based surveillance for laboratory-confirmed influenza-related hospitalizations in select counties in 14 states and represents approximately 9% of the U.S. population. FluSurv-NET estimated hospitalization rates will be updated weekly starting later this season.
Additional FluSurv-NET hospitalization surveillance information for current and past seasons and additional age groups:
Surveillance Methods | FluView Interactive
HHS-Protect Hospitalization Surveillance


Hospitals report to HHS-Protect the number of patients admitted with laboratory-confirmed influenza. During week 44, 295 patients with laboratory-confirmed influenza were admitted to the hospital.


View Chart Dataexcel icon | View Full Screen
Additional HHS Protect hospitalization surveillance information:
Surveillance Methods | Additional Dataexternal icon
Mortality Surveillance

National Center for Health Statistics (NCHS) Mortality Surveillance


Based on NCHS mortality surveillance data available on November 10, 2021, 14.1% of the deaths that occurred during the week ending November 6, 2021 (week 44), were due to pneumonia, influenza, and/or COVID-19 (PIC). This percentage is above the epidemic threshold of 6.1% for this week. Among the 2,230 PIC deaths reported for this week, 1,551 had COVID-19 listed as an underlying or contributing cause of death on the death certificate, and none listed influenza, indicating that current PIC mortality is due primarily to COVID-19 and not influenza. The data presented are preliminary and may change as more data are received and processed.


View Chart Dataexcel icon | View Full Screen
Additional pneumonia, influenza and COVID-19 mortality surveillance information for current and past seasons:
Surveillance Methods | FluView Interactive
Influenza-Associated Pediatric Mortality


No influenza-associated pediatric deaths occurring during the 2021-2022 season have been reported to CDC.


View Full Screen
Additional pediatric mortality surveillance information for current and past seasons:
Surveillance Methods | FluView Interactive


Additional National and International Influenza Surveillance Information


FluView Interactive: FluView includes enhanced web-based interactive applications that can provide dynamic visuals of the influenza data collected and analyzed by CDC. These FluView Interactive applications allow people to create customized, visual interpretations of influenza data, as well as make comparisons across flu seasons, regions, age groups and a variety of other demographics.

National Institute for Occupational Safety and Health: Monthly surveillance data on the prevalence of health-related workplace absenteeism among full-time workers in the United States are available from NIOSH.

U.S. State and local influenza surveillance: Select a jurisdiction below to access the latest local influenza information. World Health Organization:
Additional influenza surveillance information from participating WHO member nations is available through
FluNetexternal icon and the Global Epidemiology Reports.external icon

WHO Collaborating Centers for Influenza:
Australiaexternal icon, Chinaexternal icon, Japanexternal icon, the United Kingdomexternal icon, and the United States (CDC in Atlanta, Georgia)

Europe:
The most up-to-date influenza information from Europe is available from WHO/Europe and the European Centre for Disease Prevention and Controlexternal icon.

Public Health Agency of Canada:
The most up-to-date influenza information from Canada is available in Canada’s weekly FluWatch reportexternal icon.

Public Health England:
The most up-to-date influenza information from the United Kingdom is available from Public Health Englandexternal icon.

Any links provided to non-Federal organizations are provided solely as a service to our users. These links do not constitute an endorsement of these organizations or their programs by CDC or the Federal Government, and none should be inferred. CDC is not responsible for the content of the individual organization web pages found at these links.

A description of the CDC influenza surveillance system, including methodology and detailed descriptions of each data component is available on the surveillance methods page.

Page last reviewed: November 5, 2021, 11:00 AM
Content source: Centers for Disease Control and Prevention, National Center for Immunization and Respiratory Diseases (NCIRD)
 
Weekly U.S. Influenza Surveillance Report

fluview-banner2.jpg

Note: CDC is tracking the COVID-19 pandemic in a weekly publication called COVID Data Tracker Weekly Review.

Key Updates for Week 45, ending November 13, 2021

Seasonal influenza activity in the United States remains low, but the number of influenza virus detections reported by clinical and public health laboratories and the percent of patient visits for influenza-like illness has increased in recent weeks.
Viruses


Clinical Lab0.7%


positive for influenza
this week


Public Health Lab
A small but increasing
number of specimens have
tested positive.


Virus Characterization
Influenza virus characterization information will be reported later this season.
Illness

Outpatient Illness: ILINet2.1%


of visits to a health care provider for ILI this week
(below baseline)


Outpatient Illness: ILINet Activity Map


This week, 1 jurisdiction experienced moderate activity and 1 jurisdiction experienced high or very high activity.

Long-term Care Facilities0.2%


of facilities reported
≥ 1 influenza-positive test
among residents this week

Severe Disease


FluSurv-NET
Hospitalization rates will be updated starting later this season.

HHS Protect Hospitalizations332


patients admitted to hospitals with influenza
this week


NCHS Mortality14.4%


of deaths attributed to pneumonia, influenza, or COVID-19 this week (above threshold)

Pediatric Deaths0


influenza-associated deaths occurring
this season


All data are preliminary and may change as more reports are received.

A description of the CDC influenza surveillance system, including methodology and detailed descriptions of each data component is available on the surveillance methods page.

Additional information on the current and previous influenza seasons for each surveillance component are available on FluView Interactive.

Key Points
  • While influenza activity is low nationally, the number of influenza viruses detected by clinical and public health labs has increased in recent weeks.
  • The majority of viruses detected are A(H3N2). More than 90% are among children and young adults aged 5-24 years.
  • Although the percent of outpatient visits for ILI remains below baseline, the percent of ILI visits have been slowly increasing in recent weeks.
  • An annual flu vaccine is the best way to protect against flu and its potentially serious complications. CDC recommends everyone 6 months and older get a flu vaccine.
  • As of November 5, 2021, 162.5M doses of flu vaccine have been distributed in the US.
  • Flu vaccines are available at many different locations including pharmacies and health departments. Visit www.vaccines.gov to find a flu vaccine near you.
  • There also are flu antiviral drugs that can be used to treat flu illness.
U.S. Virologic Surveillance

Clinical Laboratories


The results of tests performed by clinical laboratories nationwide are summarized below. Data from clinical laboratories (the percentage of specimens tested that are positive for influenza) are used to monitor whether influenza activity is increasing or decreasing.

No. of specimens tested38,685265,492
No. of positive specimens (%)257 (0.7%)702 (0.3%)
Positive specimens by type
Influenza A228 (88.7%)522 (74.4%)
Influenza B29 (11.3%)180 (25.6%)


View Chart Data | View Full ScreenPublic Health Laboratories


The results of tests performed by public health laboratories nationwide are summarized below. Data from public health laboratories are used to monitor the proportion of circulating viruses that belong to each influenza subtype/lineage.

Overall influenza activity is still low; however, an increasing number of influenza positive tests have been reported by clinical and public health laboratories during recent weeks; the majority of which are influenza A(H3N2). During the most recent three weeks, influenza A(H3N2) viruses have been reported by public health laboratories in eight of the 10 HHS regions (Regions 1, 2, 3, 4, 5, 7, 8, and 9). So far during the 2021-22 season 448 (91.1%) of the 492 A(H3N2) viruses with known age were reported among children and young adults aged 5-24 years. For regional and state level data about circulating influenza viruses, please visit FluView Interactive.
No. of specimens tested20,249129,357
No. of positive specimens140621
Positive specimens by type/subtype
Influenza A136 (97.1%)587 (94.5%)
(H1N1)pdm0901 (0.2%)
H3N275 (100%)503 (99.6%)
H3N2v01 (0.2%)
Subtyping not performed6182
Influenza B4 (2.9%)34 (5.5%)
Yamagata lineage03 (18.8%)
Victoria lineage1 (100%)13 (81.3%)
Lineage not performed318


View Chart Data | View Full Screen
Additional virologic surveillance information for current and past seasons:
Surveillance Methods | FluView Interactive: National, Regional, and State Data or Age Data
Influenza Virus Characterization


CDC performs genetic and antigenic characterization of U.S. viruses submitted from state and local health laboratories using Right Size Roadmap submission guidance. These data are used to compare how similar the currently circulating influenza viruses are to the reference viruses representing viruses contained in the current influenza vaccines and to monitor evolutionary changes that continually occur in influenza viruses circulating in humans. CDC also tests susceptibility of influenza viruses to antiviral medications including the neuraminidase inhibitors (oseltamivir, zanamivir, and peramivir) and the PA endonuclease inhibitor baloxavir.

Virus characterization data will be updated later this season when a sufficient number of specimens have been tested.
Outpatient Illness Surveillance


The U.S. Outpatient Influenza-like Illness Surveillance Network (ILINet) monitors outpatient visits for influenza-like illness [(ILI) fever plus cough or sore throat], not laboratory-confirmed influenza, and will capture visits due to other respiratory pathogens, such as SARS-CoV-2, that present with similar symptoms. Due to the COVID-19 pandemic, health care-seeking behaviors have changed and people may be accessing the health care system in alternative settings not captured as a part of ILINet or at a different point in their illness than they might have before the pandemic. Therefore, it is important to evaluate syndromic surveillance data, including that from ILINet, in the context of other sources of surveillance data to obtain a complete and accurate picture of influenza, COVID-19, and other respiratory virus activity. CDC is tracking the COVID-19 pandemic in a weekly publication called COVID Data Tracker Weekly Review. Information about other respiratory virus activity can be found on CDC’s National Respiratory and Enteric Virus Surveillance System (NREVSS) website.
ILINet


Nationwide during week 45, 2.1% of patient visits reported through ILINet were due to ILI. This percentage is below the national baseline of 2.5%. All regions are below their baselines. Multiple respiratory viruses are co-circulating, and the relative contribution of influenza virus infection to ILI can vary by location.


* Effective October 3, 2021 (week 40), the ILI definition (fever plus cough or sore throat) no longer includes “without a known cause other than influenza.”


View Chart Data (current season only) | View Full ScreenILI Visits by Age Group


More than 70% of ILINet participants provide both the number of patient visits for ILI and the total number of patient visits for the week broken out by age group. Data from this subset of providers are used to calculate the percentages of patient visits for ILI by age group.

The percentages of visits for ILI reported in ILINet in week 45 increased for two age groups (0–4 years, 5–24 years) and remained stable for three age groups (25–49 years, 50–64 years, and 65+ years) compared to week 44.


* Effective October 3, 2021 (week 40), the ILI definition (fever plus cough or sore throat) no longer includes “without a known cause other than influenza.”

View Chart Data | View Full Screen
ILI Activity Map


Data collected in ILINet are used to produce a measure of ILI activity* by state/jurisdiction and Core Based Statistical Areas (CBSA).
Week 45
(Week ending
Nov. 13, 2021)
Week 44
(Week ending
Nov. 6, 2021)
Week 45
(Week ending
Nov. 13, 2021)
Week 44
(Week ending
Nov. 6, 2021)
Very High0022
High111511
Moderate113829
Low879280
Minimal4445493533
Insufficient Data11289274


*Data collected in ILINet may disproportionally represent certain populations within a jurisdiction or CBSA, and therefore, may not accurately depict the full picture of influenza activity for the entire jurisdiction or CBSA. Differences in the data presented here by CDC and independently by some health departments likely represent differing levels of data completeness with data presented by the health department likely being the more complete.
Additional information about medically attended visits for ILI for current and past seasons:
Surveillance Methods | FluView Interactive: National, Regional, and State Data or ILI Activity Map
Long-term Care Facility (LTCF) Surveillance


LTCFs (e.g., nursing homes/skilled nursing, long-term care for the developmentally disabled, and assisted living facilities) from all 50 states and U.S. territories report data on influenza infections among residents through the National Healthcare Safety Network (NHSN) Long-term Care Facility Component. During week 45, 24 (0.2%) of 14,223 reporting LTCFs reported at least one influenza positive test among their residents.


View Chart Dataexcel icon | View Full Screen
Additional information about long-term care facility surveillance:
Surveillance Methods | Additional Dataexternal icon
Hospitalization Surveillance

FluSurv-NET


The Influenza Hospitalization Surveillance Network (FluSurv-NET) conducts population-based surveillance for laboratory-confirmed influenza-related hospitalizations in select counties in 14 states and represents approximately 9% of the U.S. population. FluSurv-NET estimated hospitalization rates will be updated weekly starting later this season.
Additional FluSurv-NET hospitalization surveillance information for current and past seasons and additional age groups:
Surveillance Methods | FluView Interactive
HHS-Protect Hospitalization Surveillance


Hospitals report to HHS-Protect the number of patients admitted with laboratory-confirmed influenza. During week 45, 332 patients with laboratory-confirmed influenza were admitted to the hospital.


View Chart Dataexcel icon | View Full Screen
Additional HHS Protect hospitalization surveillance information:
Surveillance Methods | Additional Dataexternal icon
Mortality Surveillance

National Center for Health Statistics (NCHS) Mortality Surveillance


Based on NCHS mortality surveillance data available on November 18, 2021, 14.4% of the deaths that occurred during the week ending November 13, 2021 (week 45), were due to pneumonia, influenza, and/or COVID-19 (PIC). This percentage is above the epidemic threshold of 6.2% for this week. Among the 3,046 PIC deaths reported for this week, 2,175 had COVID-19 listed as an underlying or contributing cause of death on the death certificate, and four listed influenza, indicating that current PIC mortality is due primarily to COVID-19 and not influenza. The data presented are preliminary and may change as more data are received and processed.


View Chart Dataexcel icon | View Full Screen
Additional pneumonia, influenza and COVID-19 mortality surveillance information for current and past seasons:
Surveillance Methods | FluView Interactive
Influenza-Associated Pediatric Mortality


No influenza-associated pediatric deaths occurring during the 2021-2022 season have been reported to CDC.


View Full Screen
Additional pediatric mortality surveillance information for current and past seasons:
Surveillance Methods | FluView Interactive


Additional National and International Influenza Surveillance Information


FluView Interactive: FluView includes enhanced web-based interactive applications that can provide dynamic visuals of the influenza data collected and analyzed by CDC. These FluView Interactive applications allow people to create customized, visual interpretations of influenza data, as well as make comparisons across flu seasons, regions, age groups and a variety of other demographics.

National Institute for Occupational Safety and Health: Monthly surveillance data on the prevalence of health-related workplace absenteeism among full-time workers in the United States are available from NIOSH.

U.S. State and local influenza surveillance: Select a jurisdiction below to access the latest local influenza information. World Health Organization:
Additional influenza surveillance information from participating WHO member nations is available through
FluNetexternal icon and the Global Epidemiology Reports.external icon

WHO Collaborating Centers for Influenza:
Australiaexternal icon, Chinaexternal icon, Japanexternal icon, the United Kingdomexternal icon, and the United States (CDC in Atlanta, Georgia)

Europe:
The most up-to-date influenza information from Europe is available from WHO/Europe and the European Centre for Disease Prevention and Controlexternal icon.

Public Health Agency of Canada:
The most up-to-date influenza information from Canada is available in Canada’s weekly FluWatch reportexternal icon.

Public Health England:
The most up-to-date influenza information from the United Kingdom is available from Public Health Englandexternal icon.

Any links provided to non-Federal organizations are provided solely as a service to our users. These links do not constitute an endorsement of these organizations or their programs by CDC or the Federal Government, and none should be inferred. CDC is not responsible for the content of the individual organization web pages found at these links.

A description of the CDC influenza surveillance system, including methodology and detailed descriptions of each data component is available on the surveillance methods page.

Page last reviewed: November 19, 2021, 11:00 AM

https://www.cdc.gov/flu/weekly/
 
Weekly U.S. Influenza Surveillance Report

fluview-banner2.jpg

Note: CDC is tracking the COVID-19 pandemic in a weekly publication called COVID Data Tracker Weekly Review.

Key Updates for Week 47, ending November 27, 2021

Seasonal influenza activity in the United States remains low, but in recent weeks, the number of influenza virus detections reported by clinical and public health laboratories has increased, and the percent of outpatient visits for respiratory illness has trended upward.
Viruses


Clinical Lab1.5%


positive for influenza
this week


Public Health Lab
A small but increasing
number of specimens have
tested positive. The majority of viruses are influenza A(H3N2).


Virus Characterization
Influenza virus characterization information will be reported later this season.
Illness

Outpatient Respiratory Illness2.4%


of visits to a health care provider for respiratory illness this week
(below baseline)


Outpatient Respiratory Illness: Activity Map
This week, 2 jurisdictions experienced moderate activity and 1 jurisdiction experienced high or very high activity.

Long-term Care Facilities0.2%


of facilities reported
≥ 1 influenza-positive test
among residents this week.

Severe Disease


FluSurv-NET
Hospitalization rates will be updated starting later this season.

HHS Protect Hospitalizations495


patients admitted to hospitals with influenza
this week.


NCHS Mortality15.5%


of deaths attributed to pneumonia, influenza, or COVID-19 this week (above threshold)

Pediatric Deaths0


influenza-associated deaths occurring
this season


All data are preliminary and may change as more reports are received.

A description of the CDC influenza surveillance system, including methodology and detailed descriptions of each data component is available on the surveillance methods page.

Additional information on the current and previous influenza seasons for each surveillance component are available on FluView Interactive.

Key Points
  • Influenza activity remains low nationally, but is slowly increasing.
  • The number of influenza viruses detected by clinical and public health labs has increased in recent weeks. The majority of viruses detected are A(H3N2). Just over 80% have occurred among children and young adults aged 5-24 years.
  • The percentage of outpatient visits due to respiratory illness has trended upwards in recent weeks but remains below baseline.
  • An annual flu vaccine is the best way to protect against flu and its potentially serious complications. CDC recommends everyone 6 months and older get a flu vaccine.
  • As of Nov. 19, 2021, 166.9M doses of flu vaccine have been distributed in the U.S.
  • Flu vaccines are available at many different locations, including pharmacies and health departments. Visit www.vaccines.gov to find a flu vaccine near you.
  • There are also flu antiviral drugs that can be used to treat flu illness.
U.S. Virologic Surveillance


Overall, influenza activity is still low; however, an increasing number of influenza positive tests have been reported by clinical and public health laboratories during recent weeks. The majority are influenza A(H3N2). Influenza A(H3N2) viruses have been reported by public health laboratories in all 10 HHS regions this season. So far during the 2021-22 season, 1,034 (81.2%) of the 1,274 A(H3N2) viruses with known patient age were reported among children and young adults aged 5-24 years. For regional and state level data about circulating influenza viruses, please visit FluView Interactive.
Clinical Laboratories


The results of tests performed by clinical laboratories nationwide are summarized below. Data from clinical laboratories (the percentage of specimens tested that are positive for influenza) are used to monitor whether influenza activity is increasing or decreasing.

No. of specimens tested43,267392,541
No. of positive specimens (%)632 (1.5%)2,023 (0.5%)
Positive specimens by type
Influenza A608 (96.2%)1,766 (87.3%)
Influenza B24 (3.8%)257 (12.7%)


View Chart Data | View Full ScreenPublic Health Laboratories


The results of tests performed by public health laboratories nationwide are summarized below. Data from public health laboratories are used to monitor the proportion of circulating viruses that belong to each influenza subtype/lineage.
No. of specimens tested14,399165,808
No. of positive specimens3321,573
Positive specimens by type/subtype
Influenza A330 (99.4%)1,519 (96.6%)
(H1N1)pdm091 (0.4%)4 (0.3%)
H3N2248 (99.6%)1,294 (99.6%)
H3N2v01 (0.1%)
Subtyping not performed81220
Influenza B2 (0.6%)54 (3.4%)
Yamagata lineage1 (50%)5 (16.1%)
Victoria lineage1 (50%)26 (83.9%)
Lineage not performed023


View Chart Data | View Full Screen
Additional virologic surveillance information for current and past seasons:
Surveillance Methods | FluView Interactive: National, Regional, and State Data or Age Data
Influenza Virus Characterization


CDC performs genetic and antigenic characterization of U.S. viruses submitted from state and local health laboratories using Right Size Roadmap submission guidance. These data are used to compare how similar the currently circulating influenza viruses are to the reference viruses representing viruses contained in the current influenza vaccines and to monitor evolutionary changes that continually occur in influenza viruses circulating in humans. CDC also tests susceptibility of influenza viruses to antiviral medications including the neuraminidase inhibitors (oseltamivir, zanamivir, and peramivir) and the PA endonuclease inhibitor baloxavir.

Virus characterization data will be updated later this season when a sufficient number of specimens have been tested.
Outpatient Respiratory Illness Surveillance


The U.S. Outpatient Influenza-like Illness Surveillance Network (ILINet) monitors outpatient visits for influenza-like illness [ILI (fever plus cough or sore throat)], not laboratory-confirmed influenza, and will therefore capture respiratory illness visits due to infection with any pathogen that can present with similar symptoms such as influenza, SARS-CoV-2, and RSV. Due to the COVID-19 pandemic, health care-seeking behaviors have changed, and people may be accessing the health care system in alternative settings not captured as a part of ILINet or at a different point in their illness than they might have before the pandemic. Therefore, it is important to evaluate syndromic surveillance data, including that from ILINet, in the context of other sources of surveillance data to obtain a complete and accurate picture of influenza, SARS-CoV-2, and other respiratory virus activity. CDC is tracking the COVID-19 pandemic in a weekly publication called COVID Data Tracker Weekly Review. Information about other respiratory virus activity can be found on CDC’s National Respiratory and Enteric Virus Surveillance System (NREVSS) website.
Outpatient Respiratory Illness Visits


Nationwide during week 47, 2.4% of patient visits reported through ILINet were due to respiratory illness that included fever plus a cough or sore throat, also referred to as ILI. This percentage is below the national baseline of 2.5%. Regions 3 and 7 are above their region-specific baselines; all other regions are below their baselines. Multiple respiratory viruses are co-circulating, and the relative contribution of influenza virus infection to ILI can vary by location.


* Effective October 3, 2021 (week 40), the ILI definition (fever plus cough or sore throat) no longer includes “without a known cause other than influenza.”


View Chart Data (current season only) | View Full ScreenOutpatient Respiratory Illness Visits by Age Group


More than 70% of ILINet participants provide both the number of patient visits for respiratory illness and the total number of patient visits for the week broken out by age group. Data from this subset of providers are used to calculate the percentages of patient visits for respiratory illness by age group.

The percentage of visits for respiratory illness reported in ILINet are trending upward for four age groups (0–4 years, 5–24 years, 25-49 years and 50–64 years) and remains stable for those 65+ years.


* Effective October 3, 2021 (week 40), the ILI definition (fever plus cough or sore throat) no longer includes “without a known cause other than influenza.”

View Chart Data | View Full Screen
Outpatient Respiratory Illness Activity Map


Data collected in ILINet are used to produce a measure of ILI activity* by state/jurisdiction and Core Based Statistical Areas (CBSA).
Week 47
(Week ending
Nov. 27, 2021)
Week 46
(Week ending
Nov. 20, 2021)
Week 47
(Week ending
Nov. 27, 2021)
Week 46
(Week ending
Nov. 20, 2021)
Very High0002
High131820
Moderate234242
Low2310141112
Minimal2839437479
Insufficient Data10291274


*Data collected in ILINet may disproportionally represent certain populations within a jurisdiction or CBSA, and therefore, may not accurately depict the full picture of influenza activity for the entire jurisdiction or CBSA. Differences in the data presented here by CDC and independently by some health departments likely represent differing levels of data completeness with data presented by the health department likely being the more complete.
Additional information about medically attended visits for ILI for current and past seasons:
Surveillance Methods | FluView Interactive: National, Regional, and State Data or ILI Activity Map
Long-term Care Facility (LTCF) Surveillance


LTCFs (e.g., nursing homes/skilled nursing, long-term care for the developmentally disabled, and assisted living facilities) from all 50 states and U.S. territories report data on influenza infections among residents through the National Healthcare Safety Network (NHSN) Long-term Care Facility Component. During week 47, 30 (0.2%) of 14,001 reporting LTCFs reported at least one influenza positive test among their residents.


View Chart Dataexcel icon | View Full Screen
Additional information about long-term care facility surveillance:
Surveillance Methods | Additional Dataexternal icon
Hospitalization Surveillance

FluSurv-NET


The Influenza Hospitalization Surveillance Network (FluSurv-NET) conducts population-based surveillance for laboratory-confirmed influenza-related hospitalizations in select counties in 14 states and represents approximately 9% of the U.S. population. FluSurv-NET estimated hospitalization rates will be updated weekly starting later this season.
Additional FluSurv-NET hospitalization surveillance information for current and past seasons and additional age groups:
Surveillance Methods | FluView Interactive
HHS-Protect Hospitalization Surveillance


Hospitals report to HHS-Protect the number of patients admitted with laboratory-confirmed influenza. During week 47, 495 patients with laboratory-confirmed influenza were admitted to the hospital.


View Chart Dataexcel icon | View Full Screen
Additional HHS Protect hospitalization surveillance information:
Surveillance Methods | Additional Dataexternal icon
Mortality Surveillance

National Center for Health Statistics (NCHS) Mortality Surveillance


Based on NCHS mortality surveillance data available on December 2, 2021, 15.5% of the deaths that occurred during the week ending November 27, 2021 (week 47), were due to pneumonia, influenza, and/or COVID-19 (PIC). This percentage is above the epidemic threshold of 6.4% for this week. Among the 2,505 PIC deaths reported for this week, 1,826 had COVID-19 listed as an underlying or contributing cause of death on the death certificate, and four listed influenza, indicating that current PIC mortality is due primarily to COVID-19 and not influenza. The data presented are preliminary and may change as more data are received and processed.


View Chart Dataexcel icon | View Full Screen
Additional pneumonia, influenza and COVID-19 mortality surveillance information for current and past seasons:
Surveillance Methods | FluView Interactive
Influenza-Associated Pediatric Mortality


No influenza-associated pediatric deaths occurring during the 2021-2022 season have been reported to CDC.


View Full Screen
Additional pediatric mortality surveillance information for current and past seasons:
Surveillance Methods | FluView Interactive


Additional National and International Influenza Surveillance Information


FluView Interactive: FluView includes enhanced web-based interactive applications that can provide dynamic visuals of the influenza data collected and analyzed by CDC. These FluView Interactive applications allow people to create customized, visual interpretations of influenza data, as well as make comparisons across flu seasons, regions, age groups and a variety of other demographics.

National Institute for Occupational Safety and Health: Monthly surveillance data on the prevalence of health-related workplace absenteeism among full-time workers in the United States are available from NIOSH.

U.S. State and local influenza surveillance: Select a jurisdiction below to access the latest local influenza information. World Health Organization:
Additional influenza surveillance information from participating WHO member nations is available through
FluNetexternal icon and the Global Epidemiology Reports.external icon

WHO Collaborating Centers for Influenza:
Australiaexternal icon, Chinaexternal icon, Japanexternal icon, the United Kingdomexternal icon, and the United States (CDC in Atlanta, Georgia)

Europe:
The most up-to-date influenza information from Europe is available from WHO/Europe and the European Centre for Disease Prevention and Controlexternal icon.

Public Health Agency of Canada:
The most up-to-date influenza information from Canada is available in Canada’s weekly FluWatch reportexternal icon.

Public Health England:
The most up-to-date influenza information from the United Kingdom is available from Public Health Englandexternal icon.

Any links provided to non-Federal organizations are provided solely as a service to our users. These links do not constitute an endorsement of these organizations or their programs by CDC or the Federal Government, and none should be inferred. CDC is not responsible for the content of the individual organization web pages found at these links.

A description of the CDC influenza surveillance system, including methodology and detailed descriptions of each data component is available on the surveillance methods page.

Page last reviewed: December 3, 2021, 01:00 PM

https://www.cdc.gov/flu/weekly/index.htm
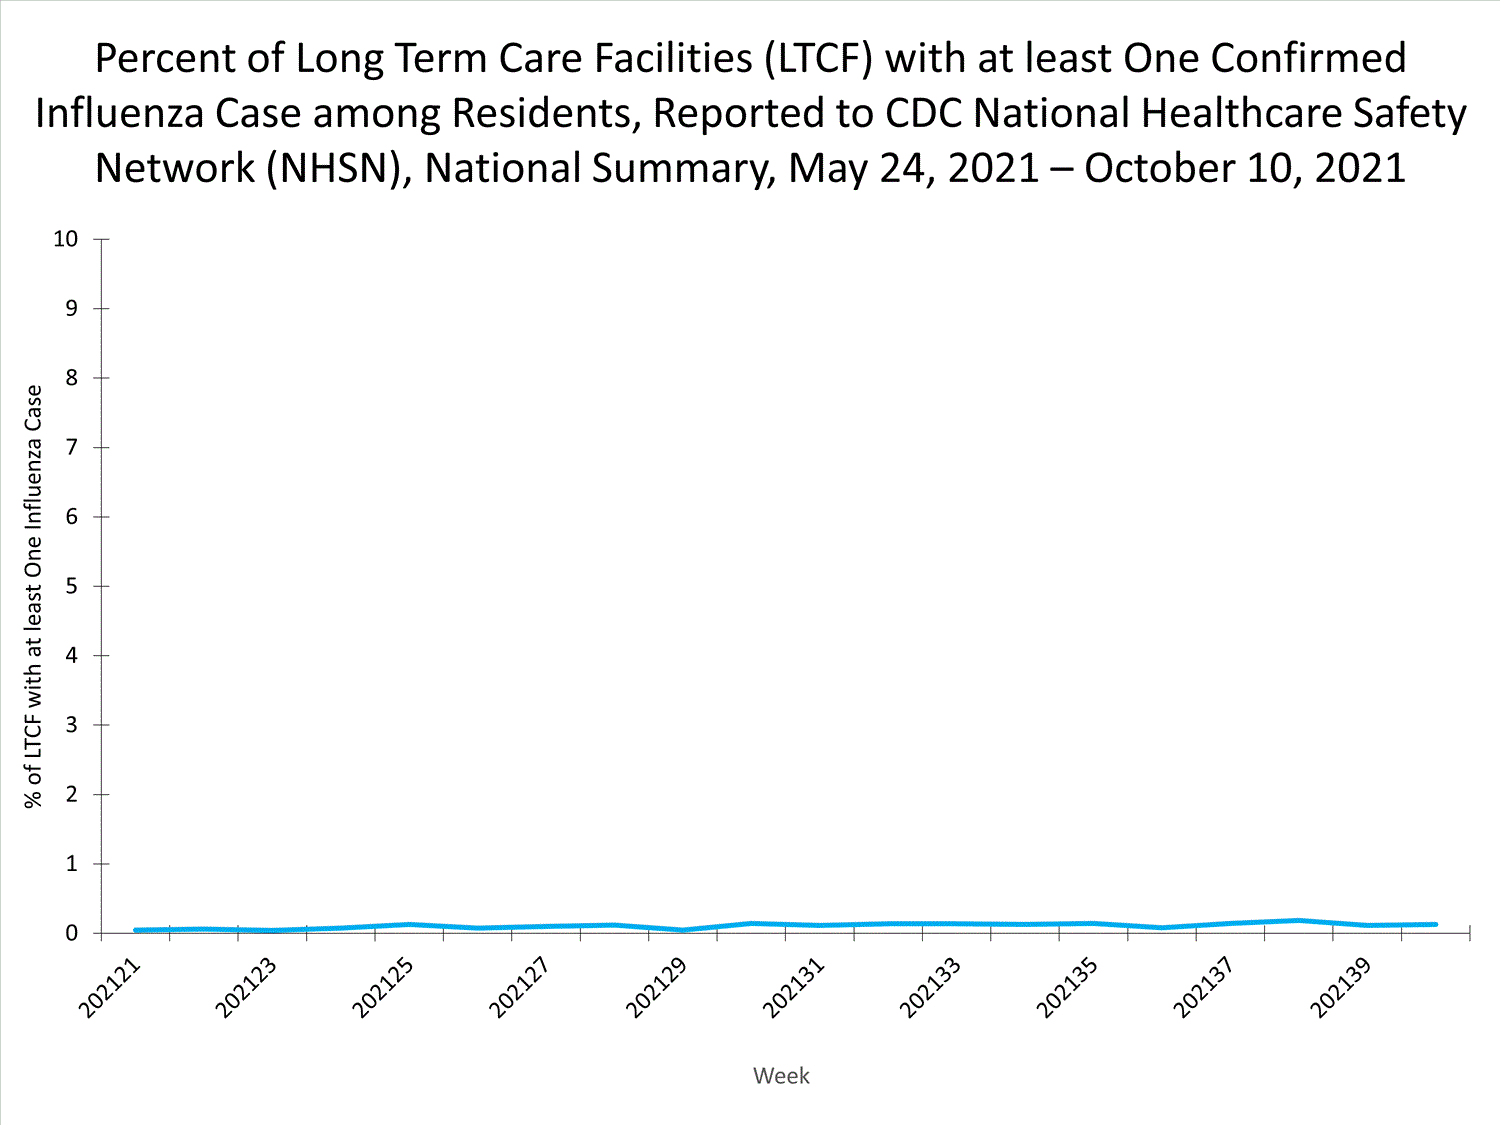
 
Weekly U.S. Influenza Surveillance Report

fluview-banner2.jpg

Note: CDC is tracking the COVID-19 pandemic in a weekly publication called COVID Data Tracker Weekly Review.

Key Updates for Week 48, ending December 4, 2021

Seasonal influenza activity in the United States remains low but continues to increase.
Viruses


Clinical Lab2.6%


positive for influenza
this week


Public Health Lab
A small but increasing
number of specimens have
tested positive. The majority of viruses detected are influenza A(H3N2).


Virus Characterization
Influenza virus characterization information will be reported later this season.
Illness

Outpatient Respiratory Illness2.5%


of visits to a health care provider for respiratory illness this week
(at baseline)


Outpatient Respiratory Illness: Activity Map
This week, 6 jurisdictions experienced moderate activity and 1 jurisdiction experienced high or very high activity.

Long-term Care Facilities0.4%


of facilities reported
≥ 1 influenza-positive test
among residents this week.

Severe Disease


FluSurv-NET
Hospitalization rates will be updated starting later this season.

HHS Protect Hospitalizations841


patients admitted to hospitals with influenza
this week.


NCHS Mortality17.5%


of deaths attributed to pneumonia, influenza, or COVID-19 this week (above threshold)

Pediatric Deaths0


influenza-associated deaths occurring
this season


All data are preliminary and may change as more reports are received.

A description of the CDC influenza surveillance system, including methodology and detailed descriptions of each data component is available on the surveillance methods page.

Additional information on the current and previous influenza seasons for each surveillance component are available on FluView Interactive.

Key Points
  • Influenza activity remains low nationally but continues to increase.
  • The number of influenza viruses detected by clinical and public health labs has increased in recent weeks. The majority of viruses detected are A(H3N2). Most influenza A(H3N2) infections have occurred among children and young adults ages 5-24 years; however, the proportion of infections occurring among adults age 25 years and older has increased in recent weeks.
  • The percentage of outpatient visits due to respiratory illness has trended upwards in recent weeks and is now at the national baseline. While influenza is contributing to levels of respiratory illness, other respiratory viruses are circulating. The relative contribution of influenza to respiratory illness varies by location.
  • Laboratory-confirmed flu activity is increasing but remains relatively low, confirming that other respiratory viruses are contributing to respiratory disease.
  • An annual flu vaccine is the best way to protect against flu and its potentially serious complications. CDC recommends everyone 6 months and older get a flu vaccine.
  • There are early signs that flu vaccination uptake is down this season compared to last.
  • Flu vaccines are available at many different locations, including pharmacies and health departments. With flu activity just getting started, there is still time to benefit from flu vaccination this season. Visit www.vaccines.gov to find a flu vaccine near you.
  • There are also flu antiviral drugs that can be used to treat flu illness.
U.S. Virologic Surveillance


Overall, influenza activity is still low; however, an increasing number of influenza positive tests have been reported by clinical and public health laboratories during recent weeks. Influenza A(H3N2) has been the most frequently detected. The majority of influenza A(H3N2) viruses were detected in persons aged 5-24 years old, but the proportion of influenza A(H3N2) virus detections occurring among adults aged 25 years and older has increased in recent weeks. Influenza A(H3N2) viruses were reported by public health laboratories in all 10 HHS regions this week. For regional and state level data about circulating influenza viruses, please visit FluView Interactive. Viruses known to be associated with recent live attenuated influenza vaccine (LAIV) receipt or found upon further testing to be a vaccine virus are not included as they are not circulating influenza viruses.
Clinical Laboratories


The results of tests performed by clinical laboratories nationwide are summarized below. Data from clinical laboratories (the percentage of specimens tested that are positive for influenza) are used to monitor whether influenza activity is increasing or decreasing.

No. of specimens tested58,767480,224
No. of positive specimens (%)1,532 (2.6%)3,905 (0.8%)
Positive specimens by type
Influenza A1,489 (97.2%)3,592 (92.0%)
Influenza B43 (2.8%)313 (8.0%)


View Chart Data | View Full ScreenPublic Health Laboratories


The results of tests performed by public health laboratories nationwide are summarized below. Data from public health laboratories are used to monitor the proportion of circulating viruses that belong to each influenza subtype/lineage.
No. of specimens tested22,062188,827
No. of positive specimens5672,373
Positive specimens by type/subtype
Influenza A562 (99.1%)2,314 (97.5%)
(H1N1)pdm0904 (0.2%)
H3N2409 (100%)1,952 (99.7%)
H3N2v01 (0.1%)
Subtyping not performed153357
Influenza B5 (0.9%)59 (2.5%)
Yamagata lineage01 (3.3%)
Victoria lineage3 (100%)29 (96.7%)
Lineage not performed229


View Chart Data | View Full Screen
Additional virologic surveillance information for current and past seasons:
Surveillance Methods | FluView Interactive: National, Regional, and State Data or Age Data
Influenza Virus Characterization


CDC performs genetic and antigenic characterization of U.S. viruses submitted from state and local health laboratories using Right Size Roadmap submission guidance. These data are used to compare how similar the currently circulating influenza viruses are to the reference viruses representing viruses contained in the current influenza vaccines and to monitor evolutionary changes that continually occur in influenza viruses circulating in humans. CDC also tests susceptibility of influenza viruses to antiviral medications including the neuraminidase inhibitors (oseltamivir, zanamivir, and peramivir) and the PA endonuclease inhibitor baloxavir.

Virus characterization data will be updated later this season when a sufficient number of specimens have been tested.
Outpatient Respiratory Illness Surveillance


The U.S. Outpatient Influenza-like Illness Surveillance Network (ILINet) monitors outpatient visits for influenza-like illness [ILI (fever plus cough or sore throat)], not laboratory-confirmed influenza, and will therefore capture respiratory illness visits due to infection with any pathogen that can present with similar symptoms such as influenza, SARS-CoV-2, and RSV. Due to the COVID-19 pandemic, health care-seeking behaviors have changed, and people may be accessing the health care system in alternative settings not captured as a part of ILINet or at a different point in their illness than they might have before the pandemic. Therefore, it is important to evaluate syndromic surveillance data, including that from ILINet, in the context of other sources of surveillance data to obtain a complete and accurate picture of influenza, SARS-CoV-2, and other respiratory virus activity. CDC is tracking the COVID-19 pandemic in a weekly publication called COVID Data Tracker Weekly Review. Information about other respiratory virus activity can be found on CDC’s National Respiratory and Enteric Virus Surveillance System (NREVSS) website.
Outpatient Respiratory Illness Visits


Nationwide, during week 48, 2.5% of patient visits reported through ILINet were due to respiratory illness that included fever plus a cough or sore throat, also referred to as ILI. This percentage is at the national baseline. Regions 1, 2, 3 and 7 are above their region-specific baselines; all other regions are below their baselines. Multiple respiratory viruses are co-circulating, and the relative contribution of influenza virus infection to ILI can vary by location.


* Effective October 3, 2021 (week 40), the ILI definition (fever plus cough or sore throat) no longer includes “without a known cause other than influenza.”


View Chart Data (current season only) | View Full ScreenOutpatient Respiratory Illness Visits by Age Group


More than 70% of ILINet participants provide both the number of patient visits for respiratory illness and the total number of patient visits for the week broken out by age group. Data from this subset of providers are used to calculate the percentages of patient visits for respiratory illness by age group.

The percentage of visits for respiratory illness reported in ILINet are trending upward for all age groups (0–4 years, 5–24 years, 25-49 years, 50–64 years, and 65+).


* Effective October 3, 2021 (week 40), the ILI definition (fever plus cough or sore throat) no longer includes “without a known cause other than influenza.”

View Chart Data | View Full Screen
Outpatient Respiratory Illness Activity Map


Data collected in ILINet are used to produce a measure of ILI activity* by state/jurisdiction and Core Based Statistical Areas (CBSA).
Week 48
(Week ending
Dec. 8, 2021)
Week 47
(Week ending
Nov. 27, 2021)
Week 48
(Week ending
Dec. 8, 2021)
Week 47
(Week ending
Nov. 27, 2021)
Very High0020
High111819
Moderate636246
Low1621157148
Minimal3129420453
Insufficient Data11270263


*Data collected in ILINet may disproportionally represent certain populations within a jurisdiction or CBSA, and therefore, may not accurately depict the full picture of influenza activity for the entire jurisdiction or CBSA. Differences in the data presented here by CDC and independently by some health departments likely represent differing levels of data completeness with data presented by the health department likely being the more complete.
Additional information about medically attended visits for ILI for current and past seasons:
Surveillance Methods | FluView Interactive: National, Regional, and State Data or ILI Activity Map
Long-term Care Facility (LTCF) Surveillance


LTCFs (e.g., nursing homes/skilled nursing, long-term care for the developmentally disabled, and assisted living facilities) from all 50 states and U.S. territories report data on influenza infections among residents through the National Healthcare Safety Network (NHSN) Long-term Care Facility Component. During week 48, 55 (0.4%) of 14,237 reporting LTCFs reported at least one influenza positive test among their residents.


View Chart Dataexcel icon | View Full Screen
Additional information about long-term care facility surveillance:
Surveillance Methods | Additional Dataexternal icon
Hospitalization Surveillance

FluSurv-NET


The Influenza Hospitalization Surveillance Network (FluSurv-NET) conducts population-based surveillance for laboratory-confirmed influenza-related hospitalizations in select counties in 14 states and represents approximately 9% of the U.S. population. FluSurv-NET estimated hospitalization rates will be updated weekly starting later this season.
Additional FluSurv-NET hospitalization surveillance information for current and past seasons and additional age groups:
Surveillance Methods | FluView Interactive
HHS-Protect Hospitalization Surveillance


Hospitals report to HHS-Protect the number of patients admitted with laboratory-confirmed influenza. During week 48, 841 patients with laboratory-confirmed influenza were admitted to the hospital.


View Chart Dataexcel icon | View Full Screen
Additional HHS Protect hospitalization surveillance information:
Surveillance Methods | Additional Dataexternal icon
Mortality Surveillance

National Center for Health Statistics (NCHS) Mortality Surveillance


Based on NCHS mortality surveillance data available on December 9, 2021, 17.5% of the deaths that occurred during the week ending December 4, 2021 (week 48), were due to pneumonia, influenza, and/or COVID-19 (PIC). This percentage is above the epidemic threshold of 6.5% for this week. Among the 3,167 PIC deaths reported for this week, 2,374 had COVID-19 listed as an underlying or contributing cause of death on the death certificate, and five listed influenza, indicating that current PIC mortality is due primarily to COVID-19 and not influenza. The data presented are preliminary and may change as more data are received and processed.


View Chart Dataexcel icon | View Full Screen
Additional pneumonia, influenza and COVID-19 mortality surveillance information for current and past seasons:
Surveillance Methods | FluView Interactive
Influenza-Associated Pediatric Mortality


No influenza-associated pediatric deaths occurring during the 2021-2022 season have been reported to CDC.


View Full Screen
Additional pediatric mortality surveillance information for current and past seasons:
Surveillance Methods | FluView Interactive


Additional National and International Influenza Surveillance Information


FluView Interactive: FluView includes enhanced web-based interactive applications that can provide dynamic visuals of the influenza data collected and analyzed by CDC. These FluView Interactive applications allow people to create customized, visual interpretations of influenza data, as well as make comparisons across flu seasons, regions, age groups and a variety of other demographics.

National Institute for Occupational Safety and Health: Monthly surveillance data on the prevalence of health-related workplace absenteeism among full-time workers in the United States are available from NIOSH.

U.S. State and local influenza surveillance: Select a jurisdiction below to access the latest local influenza information. World Health Organization:
Additional influenza surveillance information from participating WHO member nations is available through
FluNetexternal icon and the Global Epidemiology Reports.external icon

WHO Collaborating Centers for Influenza:
Australiaexternal icon, Chinaexternal icon, Japanexternal icon, the United Kingdomexternal icon, and the United States (CDC in Atlanta, Georgia)

Europe:
The most up-to-date influenza information from Europe is available from WHO/Europe and the European Centre for Disease Prevention and Controlexternal icon.

Public Health Agency of Canada:
The most up-to-date influenza information from Canada is available in Canada’s weekly FluWatch reportexternal icon.

Public Health England:
The most up-to-date influenza information from the United Kingdom is available from Public Health Englandexternal icon.

Any links provided to non-Federal organizations are provided solely as a service to our users. These links do not constitute an endorsement of these organizations or their programs by CDC or the Federal Government, and none should be inferred. CDC is not responsible for the content of the individual organization web pages found at these links.

A description of the CDC influenza surveillance system, including methodology and detailed descriptions of each data component is available on the surveillance methods page.

Page last reviewed: December 10, 2021, 11:00 am

https://www.cdc.gov/flu/weekly/index.htm
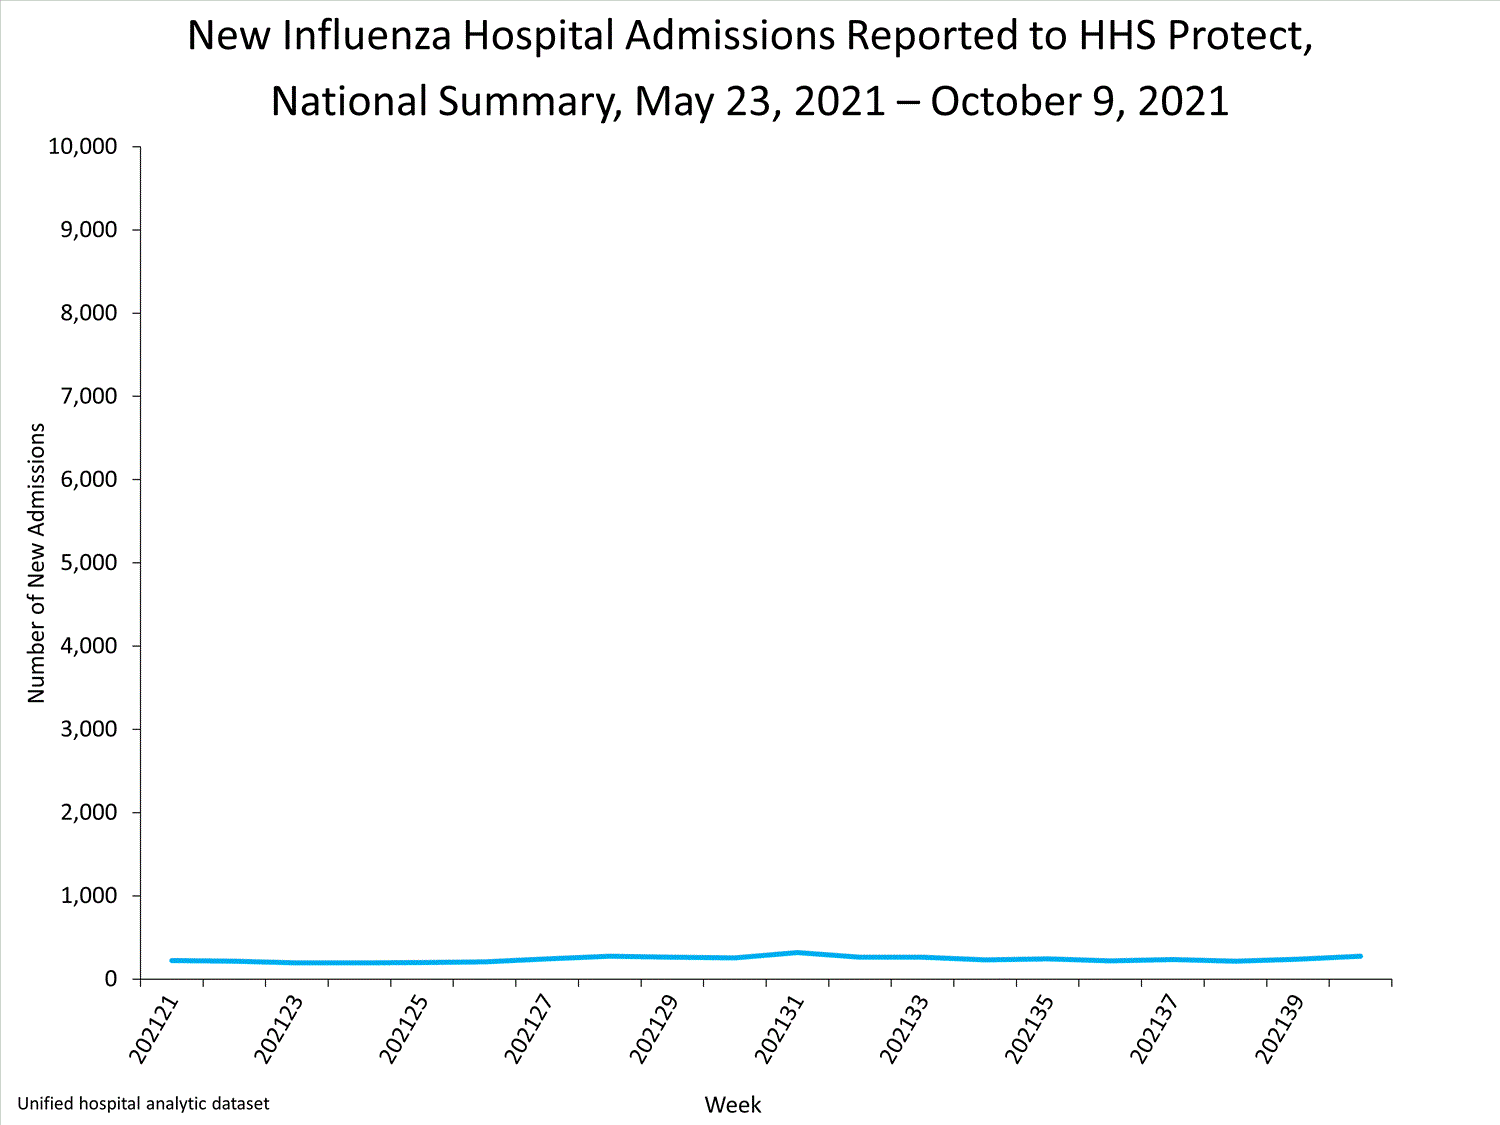
 
Weekly U.S. Influenza Surveillance Report

fluview-banner2.jpg

Note: CDC is tracking the COVID-19 pandemic in a weekly publication called COVID Data Tracker Weekly Review.

Key Updates for Week 49, ending December 11, 2021

Seasonal influenza activity in the United States is increasing, including indicators that track hospitalizations. The amount of activity varies by region.
Viruses


Clinical Lab3.5%


positive for influenza
this week


Public Health Lab
The majority of viruses
detected are influenza A(H3N2).


Virus Characterization
Influenza virus characterization information will be reported later this season.
Illness

Outpatient Respiratory Illness2.7%


of visits to a health care provider are for respiratory illness this week
(above baseline)


Outpatient Respiratory Illness: Activity Map
This week, 10 jurisdictions experienced moderate activity and 2 jurisdiction experienced high or very high activity.

Long-term Care Facilities0.5%


of facilities reported
≥ 1 influenza-positive test
among residents this week.

Severe Disease


FluSurv-NET
Hospitalization rates will be updated starting later this season.

HHS Protect Hospitalizations1,057


patients admitted to hospitals with influenza
this week.


NCHS Mortality17.4%


of deaths attributed to pneumonia, influenza, or COVID-19 this week (above threshold)

Pediatric Deaths0


influenza-associated deaths occurring
this season


All data are preliminary and may change as more reports are received.

A description of the CDC influenza surveillance system, including methodology and detailed descriptions of each data component is available on the surveillance methods page.

Additional information on the current and previous influenza seasons for each surveillance component are available on FluView Interactive.

Key Points
  • Influenza activity is increasing, with the eastern and central parts of the country seeing the largest increases and the western part of the country reporting lower levels of influenza virus circulation at this time.
  • The majority of influenza viruses detected are A(H3N2). Most influenza A(H3N2) infections have occurred among children and young adults ages 5-24 years; however, the proportion of infections occurring among adults age 25 years and older has been increasing.
  • Hospitalizations for influenza are starting to increase.
  • The percentage of outpatient visits due to respiratory illness has trended upwards in recent weeks and is now above the national baseline. Influenza is contributing to levels of respiratory illness, but other respiratory viruses are also circulating. The relative contribution of influenza to respiratory illness varies by location.
  • The flu season is just getting started. It’s not too late to get vaccinated. An annual flu vaccine is the best way to protect against flu and its potentially serious complications. CDC recommends everyone 6 months and older get a flu vaccine.
  • There are early signs that flu vaccination uptake is down this season compared to last.
  • Flu vaccines are available at many different locations, including pharmacies and health departments. With flu activity just getting started, there is still time to benefit from flu vaccination this season. Visit www.vaccines.gov to find a flu vaccine near you.
  • There are also flu antiviral drugs that can be used to treat flu illness
U.S. Virologic Surveillance


An increasing number of influenza positive tests have been reported by clinical and public health laboratories during recent weeks. Influenza A(H3N2) viruses have been the most frequently detected. The majority of influenza A(H3N2) viruses were detected in persons aged 5-24 years old, but the proportion of influenza A(H3N2) virus detections occurring among adults aged 25 years and older has increased in recent weeks. Influenza A(H3N2) viruses were reported by public health laboratories in all 10 HHS regions this week. For regional and state level data about circulating influenza viruses, please visit FluView Interactive. Viruses known to be associated with recent live attenuated influenza vaccine (LAIV) receipt or found upon further testing to be a vaccine virus are not included as they are not circulating influenza viruses.
Clinical Laboratories


The results of tests performed by clinical laboratories nationwide are summarized below. Data from clinical laboratories (the percentage of specimens tested that are positive for influenza) are used to monitor whether influenza activity is increasing or decreasing.

No. of specimens tested70,157588,384
No. of positive specimens (%)2,438 (3.5%)7,516 (1.3%)
Positive specimens by type
Influenza A2,405 (98.6%)7,138 (95.0%)
Influenza B33 (1.4%)378 (5.0%)


View Chart Data | View Full ScreenPublic Health Laboratories


The results of tests performed by public health laboratories nationwide are summarized below. Data from public health laboratories are used to monitor the proportion of circulating viruses that belong to each influenza subtype/lineage.
No. of specimens tested23,849217,285
No. of positive specimens4853,127
Positive specimens by type/subtype
Influenza A485 (100%)3,068 (98.1%)
(H1N1)pdm0904 (0.2%)
H3N2279 (100%)2,499 (99.8%)
H3N2v01 (<0.1%)
Subtyping not performed206564
Influenza B0 (0%)59 (1.9%)
Yamagata lineage01 (3.3%)
Victoria lineage029 (96.7%)
Lineage not performed029


View Chart Data | View Full Screen
Additional virologic surveillance information for current and past seasons:
Surveillance Methods | FluView Interactive: National, Regional, and State Data or Age Data
Influenza Virus Characterization


CDC performs genetic and antigenic characterization of U.S. viruses submitted from state and local health laboratories using Right Size Roadmap submission guidance. These data are used to compare how similar the currently circulating influenza viruses are to the reference viruses representing viruses contained in the current influenza vaccines and to monitor evolutionary changes that continually occur in influenza viruses circulating in humans. CDC also tests susceptibility of influenza viruses to antiviral medications including the neuraminidase inhibitors (oseltamivir, zanamivir, and peramivir) and the PA endonuclease inhibitor baloxavir.

Virus characterization data will be updated later this season when a sufficient number of specimens have been tested.
Outpatient Respiratory Illness Surveillance


The U.S. Outpatient Influenza-like Illness Surveillance Network (ILINet) monitors outpatient visits for influenza-like illness [ILI (fever plus cough or sore throat)], not laboratory-confirmed influenza, and will therefore capture respiratory illness visits due to infection with any pathogen that can present with similar symptoms such as influenza, SARS-CoV-2, and RSV. Due to the COVID-19 pandemic, health care-seeking behaviors have changed, and people may be accessing the health care system in alternative settings not captured as a part of ILINet or at a different point in their illness than they might have before the pandemic. Therefore, it is important to evaluate syndromic surveillance data, including that from ILINet, in the context of other sources of surveillance data to obtain a complete and accurate picture of influenza, SARS-CoV-2, and other respiratory virus activity. CDC is tracking the COVID-19 pandemic in a weekly publication called COVID Data Tracker Weekly Review. Information about other respiratory virus activity can be found on CDC’s National Respiratory and Enteric Virus Surveillance System (NREVSS) website.
Outpatient Respiratory Illness Visits


Nationwide, during week 49, 2.7% of patient visits reported through ILINet were due to respiratory illness that included fever plus a cough or sore throat, also referred to as ILI. This percentage is above the national baseline. Regions 1, 2, 3, 4, and 7 are above their region-specific baselines; all other regions are below their baselines. Multiple respiratory viruses are co-circulating, and the relative contribution of influenza virus infection to ILI can vary by location.


* Effective October 3, 2021 (week 40), the ILI definition (fever plus cough or sore throat) no longer includes “without a known cause other than influenza.”


View Chart Data (current season only) | View Full ScreenOutpatient Respiratory Illness Visits by Age Group


More than 70% of ILINet participants provide both the number of patient visits for respiratory illness and the total number of patient visits for the week broken out by age group. Data from this subset of providers are used to calculate the percentages of patient visits for respiratory illness by age group.

The percentage of visits for respiratory illness reported in ILINet are trending upward for all age groups (0–4 years, 5–24 years, 25-49 years, 50–64 years, and 65+).


* Effective October 3, 2021 (week 40), the ILI definition (fever plus cough or sore throat) no longer includes “without a known cause other than influenza.”

View Chart Data | View Full Screen
Outpatient Respiratory Illness Activity Map


Data collected in ILINet are used to produce a measure of ILI activity* by state/jurisdiction and Core Based Statistical Areas (CBSA).
Week 49
(Week ending
Dec. 11, 2021)
Week 48
(Week ending
Dec. 4, 2021)
Week 49
(Week ending
Dec. 11, 2021)
Week 48
(Week ending
Dec. 4, 2021)
Very High0021
High212420
Moderate1066363
Low1916162156
Minimal2331408436
Insufficient Data11270253


*Data collected in ILINet may disproportionally represent certain populations within a jurisdiction or CBSA, and therefore, may not accurately depict the full picture of influenza activity for the entire jurisdiction or CBSA. Differences in the data presented here by CDC and independently by some health departments likely represent differing levels of data completeness with data presented by the health department likely being the more complete.
Additional information about medically attended visits for ILI for current and past seasons:
Surveillance Methods | FluView Interactive: National, Regional, and State Data or ILI Activity Map
Long-term Care Facility (LTCF) Surveillance


LTCFs (e.g., nursing homes/skilled nursing, long-term care for the developmentally disabled, and assisted living facilities) from all 50 states and U.S. territories report data on influenza infections among residents through the National Healthcare Safety Network (NHSN) Long-term Care Facility Component. During week 49, 71 (0.5%) of 14,268 reporting LTCFs reported at least one influenza positive test among their residents.


View Chart Dataexcel icon | View Full Screen
Additional information about long-term care facility surveillance:
Surveillance Methods | Additional Dataexternal icon
Hospitalization Surveillance

FluSurv-NET


The Influenza Hospitalization Surveillance Network (FluSurv-NET) conducts population-based surveillance for laboratory-confirmed influenza-related hospitalizations in select counties in the Emerging Infections Program (EIP) states and Influenza Hospitalization Surveillance Project (IHSP) states.

A total of 242 laboratory-confirmed influenza-associated hospitalizations were reported by FluSurv-NET sites between October 1, 2021, and December 11, 2021. This is more than the total number of hospitalizations reported during the 2020-2021 season, and similar to the number of hospitalizations seen at this point during the 2015-16 season. Hospitalization rates will be presented once case counts increase to a level that produces stable rates.
Additional FluSurv-NET hospitalization surveillance information for current and past seasons and additional age groups:
Surveillance Methods | FluView Interactive
HHS-Protect Hospitalization Surveillance


Hospitals report to HHS-Protect the number of patients admitted with laboratory-confirmed influenza. During week 49, 1,057 patients with laboratory-confirmed influenza were admitted to the hospital.


View Chart Dataexcel icon | View Full Screen
Additional HHS Protect hospitalization surveillance information:
Surveillance Methods | Additional Dataexternal icon
Mortality Surveillance

National Center for Health Statistics (NCHS) Mortality Surveillance


Based on NCHS mortality surveillance data available on December 16, 2021, 17.4% of the deaths that occurred during the week ending December 11, 2021 (week 49), were due to pneumonia, influenza, and/or COVID-19 (PIC). This percentage is above the epidemic threshold of 6.6% for this week. Among the 3,330 PIC deaths reported for this week, 2,569 had COVID-19 listed as an underlying or contributing cause of death on the death certificate, and eight listed influenza, indicating that current PIC mortality is due primarily to COVID-19 and not influenza. The data presented are preliminary and may change as more data are received and processed.


View Chart Dataexcel icon | View Full Screen
Additional pneumonia, influenza and COVID-19 mortality surveillance information for current and past seasons:
Surveillance Methods | FluView Interactive
Influenza-Associated Pediatric Mortality


As of week 49, no influenza-associated pediatric deaths occurring during the 2021-2022 season have been reported to CDC.


View Full Screen
Additional pediatric mortality surveillance information for current and past seasons:
Surveillance Methods | FluView Interactive


Additional National and International Influenza Surveillance Information


FluView Interactive: FluView includes enhanced web-based interactive applications that can provide dynamic visuals of the influenza data collected and analyzed by CDC. These FluView Interactive applications allow people to create customized, visual interpretations of influenza data, as well as make comparisons across flu seasons, regions, age groups and a variety of other demographics.

National Institute for Occupational Safety and Health: Monthly surveillance data on the prevalence of health-related workplace absenteeism among full-time workers in the United States are available from NIOSH.

U.S. State and local influenza surveillance: Select a jurisdiction below to access the latest local influenza information. World Health Organization:
Additional influenza surveillance information from participating WHO member nations is available through
FluNetexternal icon and the Global Epidemiology Reports.external icon

WHO Collaborating Centers for Influenza:
Australiaexternal icon, Chinaexternal icon, Japanexternal icon, the United Kingdomexternal icon, and the United States (CDC in Atlanta, Georgia)

Europe:
The most up-to-date influenza information from Europe is available from WHO/Europe and the European Centre for Disease Prevention and Controlexternal icon.

Public Health Agency of Canada:
The most up-to-date influenza information from Canada is available in Canada’s weekly FluWatch reportexternal icon.

Public Health England:
The most up-to-date influenza information from the United Kingdom is available from Public Health Englandexternal icon.

Any links provided to non-Federal organizations are provided solely as a service to our users. These links do not constitute an endorsement of these organizations or their programs by CDC or the Federal Government, and none should be inferred. CDC is not responsible for the content of the individual organization web pages found at these links.

A description of the CDC influenza surveillance system, including methodology and detailed descriptions of each data component is available on the surveillance methods page.

Page last reviewed: December 17, 2021, 11:00 AM


https://www.cdc.gov/flu/weekly/index.htm
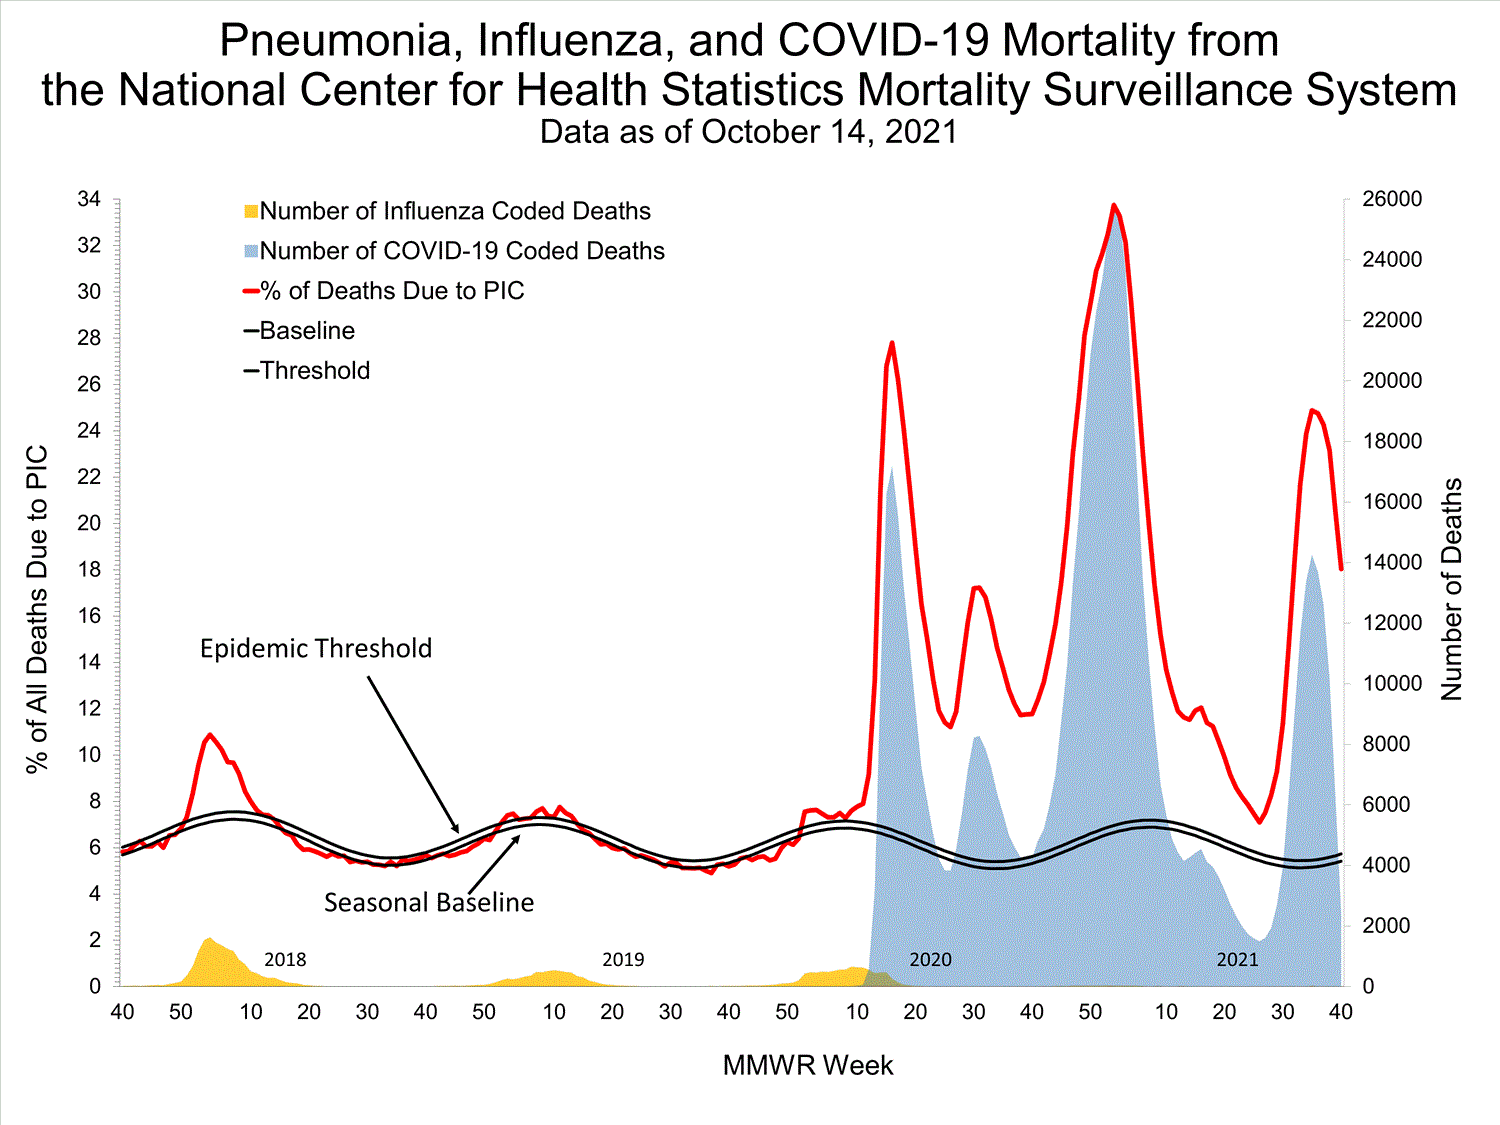
 
Weekly U.S. Influenza Surveillance Report

fluview-banner2.jpg

Note: CDC is tracking the COVID-19 pandemic in a weekly publication called COVID Data Tracker Weekly Review.

Key Updates for Week 51, ending December 25, 2021

Seasonal influenza activity in the United States is increasing, including indicators that track hospitalizations. The amount of activity varies by region.
Viruses


Clinical Lab6.2%


positive for influenza
this week


Public Health Lab
The majority of viruses
detected are influenza A(H3N2).


Virus Characterization
Genetic characterization data are now being reported.
Illness

Outpatient Respiratory Illness3.8%


of visits to a health care provider are for respiratory illness this week
(above baseline)


Outpatient Respiratory Illness: Activity Map
This week, 12 jurisdictions experienced moderate activity and 19 jurisdictions experienced high or very high activity.

Long-term Care Facilities0.9%


of facilities reported
≥ 1 influenza-positive test
among residents this week.

Severe Disease


FluSurv-NET1.8 per 100,000


cumulative hospitalization rate

HHS Protect Hospitalizations1,825


patients admitted to hospitals with influenza
this week.


NCHS Mortality19.2%


of deaths attributed to pneumonia, influenza, or COVID-19 this week (above threshold)

Pediatric Deaths0


influenza-associated deaths reported this week

All data are preliminary and may change as more reports are received.

A description of the CDC influenza surveillance system, including methodology and detailed descriptions of each data component is available on the surveillance methods page.

Additional information on the current and previous influenza seasons for each surveillance component are available on FluView Interactive.

Key Points
  • Influenza activity is increasing, with the eastern and central parts of the country seeing the majority of viruses reported and the western part of the country reporting lower levels of influenza virus circulation.
  • The majority of influenza viruses detected are A(H3N2). Most influenza A(H3N2) infections have occurred among children and young adults ages 5-24 years; however, the proportion of infections occurring among adults age 25 years and older has been increasing.
  • While there are little data to date, most of the H3N2 viruses so far are genetically closely related to the vaccine virus, but there are some antigenic differences that have developed as H3N2 viruses have continued to evolve.
  • The percentage of outpatient visits due to respiratory illness is trending upwards and is above the national baseline. Influenza is contributing to levels of respiratory illness, but other respiratory viruses are also circulating. The relative contribution of influenza varies by location.
  • Hospitalizations for influenza are starting to increase.
  • The flu season is just getting started. There’s still time to get vaccinated. An annual flu vaccine is the best way to protect against flu and its potentially serious complications. CDC recommends everyone 6 months and older get a flu vaccine.
  • There are early signs that flu vaccination uptake is down this season compared to last.
  • Flu vaccines are available at many different locations, including pharmacies and health departments. With flu activity just getting started, there is still time to benefit from flu vaccination this season. Visit www.vaccines.gov to find a flu vaccine near you.
  • There are also flu antiviral drugs that can be used to treat flu illness.
U.S. Virologic Surveillance


The week 51 virologic data may have been impacted by delays in reporting due to the holiday therefore, percent positivity and testing numbers should be interpreted with caution. An increasing number of influenza positive tests have been reported by clinical and public health laboratories during recent weeks. Influenza A(H3N2) viruses have been the most frequently detected. Persons aged 5-24 years old account for the largest proportion of influenza A(H3N2) viruses detected, but the proportion of influenza A(H3N2) virus detections occurring among other age groups has increased in recent weeks. Influenza A(H3N2) viruses were reported by public health laboratories in all HHS regions except for Region 10 this week. For regional and state level data about circulating influenza viruses, please visit FluView Interactive. Viruses known to be associated with recent live attenuated influenza vaccine (LAIV) receipt or found upon further testing to be a vaccine virus are not included as they are not circulating influenza viruses.
Clinical Laboratories


The results of tests performed by clinical laboratories nationwide are summarized below. Data from clinical laboratories (the percentage of specimens tested that are positive for influenza) are used to monitor whether influenza activity is increasing or decreasing.

No. of specimens tested70,660778,091
No. of positive specimens (%)4,393 (6.2%)18,479 (2.4%)
Positive specimens by type
Influenza A4,337 (98.7%)17,985 (97.3%)
Influenza B57 (1.3%)494 (2.7%)


View Chart Data | View Full ScreenPublic Health Laboratories


The results of tests performed by public health laboratories nationwide are summarized below. Data from public health laboratories are used to monitor the proportion of circulating viruses that belong to each influenza subtype/lineage.
No. of specimens tested29,486282,321
No. of positive specimens6345,357
Positive specimens by type/subtype
Influenza A632 (99.7%)5,294 (98.8%)
(H1N1)pdm0904 (<0.1%)
H3N2375 (100%)4,110 (99.9%)
H3N2v01 (<0.1%)
Subtyping not performed2571,179
Influenza B2 (0.3%)63 (1.2%)
Yamagata lineage01 (3.3%)
Victoria lineage029 (96.7%)
Lineage not performed233


View Chart Data | View Full Screen
Additional virologic surveillance information for current and past seasons:
Surveillance Methods | FluView Interactive: National, Regional, and State Data or Age Data
Influenza Virus Characterization


CDC performs genetic and antigenic characterization of U.S. viruses submitted from state and local public health laboratories using Right Size Roadmap submission guidance. These data are used to compare how similar the currently circulating influenza viruses are to the reference viruses representing viruses contained in the current influenza vaccines. The data are also used to monitor evolutionary changes that continually occur in influenza viruses circulating in humans. CDC also tests susceptibility of circulating influenza viruses to antiviral medications including the neuraminidase inhibitors (oseltamivir, zanamivir, and peramivir) and the PA endonuclease inhibitor baloxavir.

CDC genetically characterized 208 influenza viruses collected since October 3, 2021. While there are little data to date, most of the H3N2 viruses so far are genetically closely related to the vaccine virus, but there are some antigenic differences that have developed as H3N2 viruses have continued to evolve. Virus antigenic and antiviral susceptibility data will be reported later this season when a sufficient number of specimens have been tested.

CDC genetically characterized 108 influenza viruses collected October 3, 2021 to present:
A/H13
6B.1A3 (100%) 5a.12 (67%)
5a.21 (33%)
A/H3184
3C.2a1b189 (100%) 1a0
1b1 (1%)
2a0
2a.10
2a.2183 (99%)
3C.3a 03a0
B/Victoria16
V1A16 (100%) V1A0
V1A.10
V1A.39 (56%)
V1A.3a0
V1A.3a.10
V1A.3a.27 (44%)
B/Yamagata0
Y30
CDC assesses susceptibility of influenza viruses to the antiviral medications including the neuraminidase inhibitors (oseltamivir, zanamivir, and peramivir) and the PA endonuclease inhibitor baloxavir using next generation sequence analysis supplemented by laboratory assays. Information about antiviral susceptibility test methods can be found at U.S. Influenza Surveillance: Purpose and Methods | CDC.

Viruses collected in the United States since October 3, 2021, were tested for antiviral susceptibility as follows:
Neuraminidase
Inhibitors
OseltamivirViruses
Tested
2103191160
Reduced
Inhibition
(0.0%)(0.0%)(0.0%)(0.0%)(0.0%)
Highly
Reduced
Inhibition
(0.0%)(0.0%)(0.0%)(0.0%)(0.0%)
PeramivirViruses
Tested
2103191160
Reduced
Inhibition
(0.0%)(0.0%)(0.0%)(0.0%)(0.0%)
Highly
Reduced
Inhibition
(0.0%)(0.0%)(0.0%)(0.0%)(0.0%)
ZanamivirViruses
Tested
2103191160
Reduced
Inhibition
(0.0%)(0.0%)(0.0%)(0.0%)(0.0%)
Highly
Reduced
Inhibition
(0.0%)(0.0%)(0.0%)(0.0%)(0.0%)
PA Cap-Dependent Endonuclease InhibitorBaloxavirViruses
Tested
1933174160
Reduced
Susceptibility
(0.0%)(0.0%)(0.0%)(0.0%)(0.0%)
High levels of resistance to the adamantanes (amantadine and rimantadine) persist among influenza A(H1N1)pdm09 and influenza A(H3N2) viruses (the adamantanes are not effective against influenza B viruses). Therefore, use of these antivirals for treatment and prevention of influenza A virus infection is not recommended and data from adamantane resistance testing are not presented.
Outpatient Respiratory Illness Surveillance


The U.S. Outpatient Influenza-like Illness Surveillance Network (ILINet) monitors outpatient visits for influenza-like illness [ILI (fever plus cough or sore throat)], not laboratory-confirmed influenza, and will therefore capture respiratory illness visits due to infection with any pathogen that can present with similar symptoms such as influenza, SARS-CoV-2, and RSV. Due to the COVID-19 pandemic, health care-seeking behaviors have changed, and people may be accessing the health care system in alternative settings not captured as a part of ILINet or at a different point in their illness than they might have before the pandemic. Therefore, it is important to evaluate syndromic surveillance data, including that from ILINet, in the context of other sources of surveillance data to obtain a complete and accurate picture of influenza, SARS-CoV-2, and other respiratory virus activity. CDC is tracking the COVID-19 pandemic in a weekly publication called COVID Data Tracker Weekly Review. Information about other respiratory virus activity can be found on CDC’s National Respiratory and Enteric Virus Surveillance System (NREVSS) website.
Outpatient Respiratory Illness Visits


Nationwide, during week 51, 3.8% of patient visits reported through ILINet were due to respiratory illness that included fever plus a cough or sore throat, also referred to as ILI. This percentage is above the national baseline. Nine of the 10 HHS regions are above their region-specific baselines; only Region 6 is below their baseline. Multiple respiratory viruses are co-circulating, and the relative contribution of influenza virus infection to ILI varies by location.


* Effective October 3, 2021 (week 40), the ILI definition (fever plus cough or sore throat) no longer includes “without a known cause other than influenza.”


View Chart Data (current season only) | View Full ScreenOutpatient Respiratory Illness Visits by Age Group


More than 70% of ILINet participants provide both the number of patient visits for respiratory illness and the total number of patient visits for the week broken out by age group. Data from this subset of providers are used to calculate the percentages of patient visits for respiratory illness by age group.

The percentage of visits for respiratory illness reported in ILINet increased for all age groups (0–4 years, 5–24 years, 25-49 years, 50–64 years, and 65+).


* Effective October 3, 2021 (week 40), the ILI definition (fever plus cough or sore throat) no longer includes “without a known cause other than influenza.”

View Chart Data | View Full Screen
Outpatient Respiratory Illness Activity Map


Data collected in ILINet are used to produce a measure of ILI activity* by state/jurisdiction and Core Based Statistical Areas (CBSA).
Week 51
(Week ending
Dec. 25, 2021)
Week 50
(Week ending
Dec. 18, 2021)
Week 51
(Week ending
Dec. 25, 2021)
Week 50
(Week ending
Dec. 18, 2021)
Very High3073
High1688349
Moderate121410479
Low1313167163
Minimal920280365
Insufficient Data20288270


*Data collected in ILINet may disproportionally represent certain populations within a jurisdiction or CBSA, and therefore, may not accurately depict the full picture of influenza activity for the entire jurisdiction or CBSA. Differences in the data presented here by CDC and independently by some health departments likely represent differing levels of data completeness with data presented by the health department likely being the more complete.
Additional information about medically attended visits for ILI for current and past seasons:
Surveillance Methods | FluView Interactive: National, Regional, and State Data or ILI Activity Map
Long-term Care Facility (LTCF) Surveillance


LTCFs (e.g., nursing homes/skilled nursing, long-term care for the developmentally disabled, and assisted living facilities) from all 50 states and U.S. territories report data on influenza infections among residents through the National Healthcare Safety Network (NHSN) Long-term Care Facility Component. During week 51, 122 (0.9%) of 14,084 reporting LTCFs reported at least one influenza positive test among their residents.


View Chart Dataexcel icon | View Full Screen
Additional information about long-term care facility surveillance:
Surveillance Methods | Additional Dataexternal icon
Hospitalization Surveillance

FluSurv-NET


The Influenza Hospitalization Surveillance Network (FluSurv-NET) conducts population-based surveillance for laboratory-confirmed influenza-related hospitalizations in select counties in 14 states and represents approximately 9% of the U.S. population.

A total of 535 laboratory-confirmed influenza-associated hospitalizations were reported by FluSurv-NET sites between October 1, 2021, and December 25, 2021, with a cumulative hospitalization rate of 1.8 per 100,000 population, which is more than double the overall cumulative hospitalization rate reported during the 2020-2021 season.

FluSurv-NET hospitalization data are preliminary. Case counts and rates for recent hospital admissions are subject to reporting delays; these delays are likely to be more pronounced around holidays. As data are received each week, prior case counts and rates are updated accordingly.
Additional FluSurv-NET hospitalization surveillance information for current and past seasons and additional age groups:
Surveillance Methods | FluView Interactive
HHS-Protect Hospitalization Surveillance


Hospitals report to HHS-Protect the number of patients admitted with laboratory-confirmed influenza. During week 51, 1,825 patients with laboratory-confirmed influenza were admitted to the hospital.


View Chart Dataexcel icon | View Full Screen
Additional HHS Protect hospitalization surveillance information:
Surveillance Methods | Additional Dataexternal icon
Mortality Surveillance

National Center for Health Statistics (NCHS) Mortality Surveillance


Based on NCHS mortality surveillance data available on December 30, 2021, 19.2% of the deaths that occurred during the week ending December 25, 2021 (week 51), were due to pneumonia, influenza, and/or COVID-19 (PIC). This percentage is above the epidemic threshold of 6.8% for this week. Among the 3,381 PIC deaths reported for this week, 2,582 had COVID-19 listed as an underlying or contributing cause of death on the death certificate, and 12 listed influenza, indicating that current PIC mortality is due primarily to COVID-19 and not influenza. The data presented are preliminary and may change as more data are received and processed.


View Chart Dataexcel icon | View Full Screen
Additional pneumonia, influenza and COVID-19 mortality surveillance information for current and past seasons:
Surveillance Methods | FluView Interactive
Influenza-Associated Pediatric Mortality


No influenza-associated pediatric deaths were reported to CDC during week 51.

A total of two influenza-associated pediatric deaths occurring during the 2021-2022 season have been reported to CDC.


View Full Screen
Additional pediatric mortality surveillance information for current and past seasons:
Surveillance Methods | FluView Interactive


Additional National and International Influenza Surveillance Information


FluView Interactive: FluView includes enhanced web-based interactive applications that can provide dynamic visuals of the influenza data collected and analyzed by CDC. These FluView Interactive applications allow people to create customized, visual interpretations of influenza data, as well as make comparisons across flu seasons, regions, age groups and a variety of other demographics.

National Institute for Occupational Safety and Health: Monthly surveillance data on the prevalence of health-related workplace absenteeism among full-time workers in the United States are available from NIOSH.

U.S. State and local influenza surveillance: Select a jurisdiction below to access the latest local influenza information. World Health Organization:
Additional influenza surveillance information from participating WHO member nations is available through
FluNetexternal icon and the Global Epidemiology Reports.external icon

WHO Collaborating Centers for Influenza:
Australiaexternal icon, Chinaexternal icon, Japanexternal icon, the United Kingdomexternal icon, and the United States (CDC in Atlanta, Georgia)

Europe:
The most up-to-date influenza information from Europe is available from WHO/Europe and the European Centre for Disease Prevention and Controlexternal icon.

Public Health Agency of Canada:
The most up-to-date influenza information from Canada is available in Canada’s weekly FluWatch reportexternal icon.

Public Health England:
The most up-to-date influenza information from the United Kingdom is available from Public Health Englandexternal icon.

Any links provided to non-Federal organizations are provided solely as a service to our users. These links do not constitute an endorsement of these organizations or their programs by CDC or the Federal Government, and none should be inferred. CDC is not responsible for the content of the individual organization web pages found at these links.

A description of the CDC influenza surveillance system, including methodology and detailed descriptions of each data component is available on the surveillance methods page.

Page last reviewed: December 27, 2021, 11:00 AM

https://www.cdc.gov/flu/weekly/index.htm
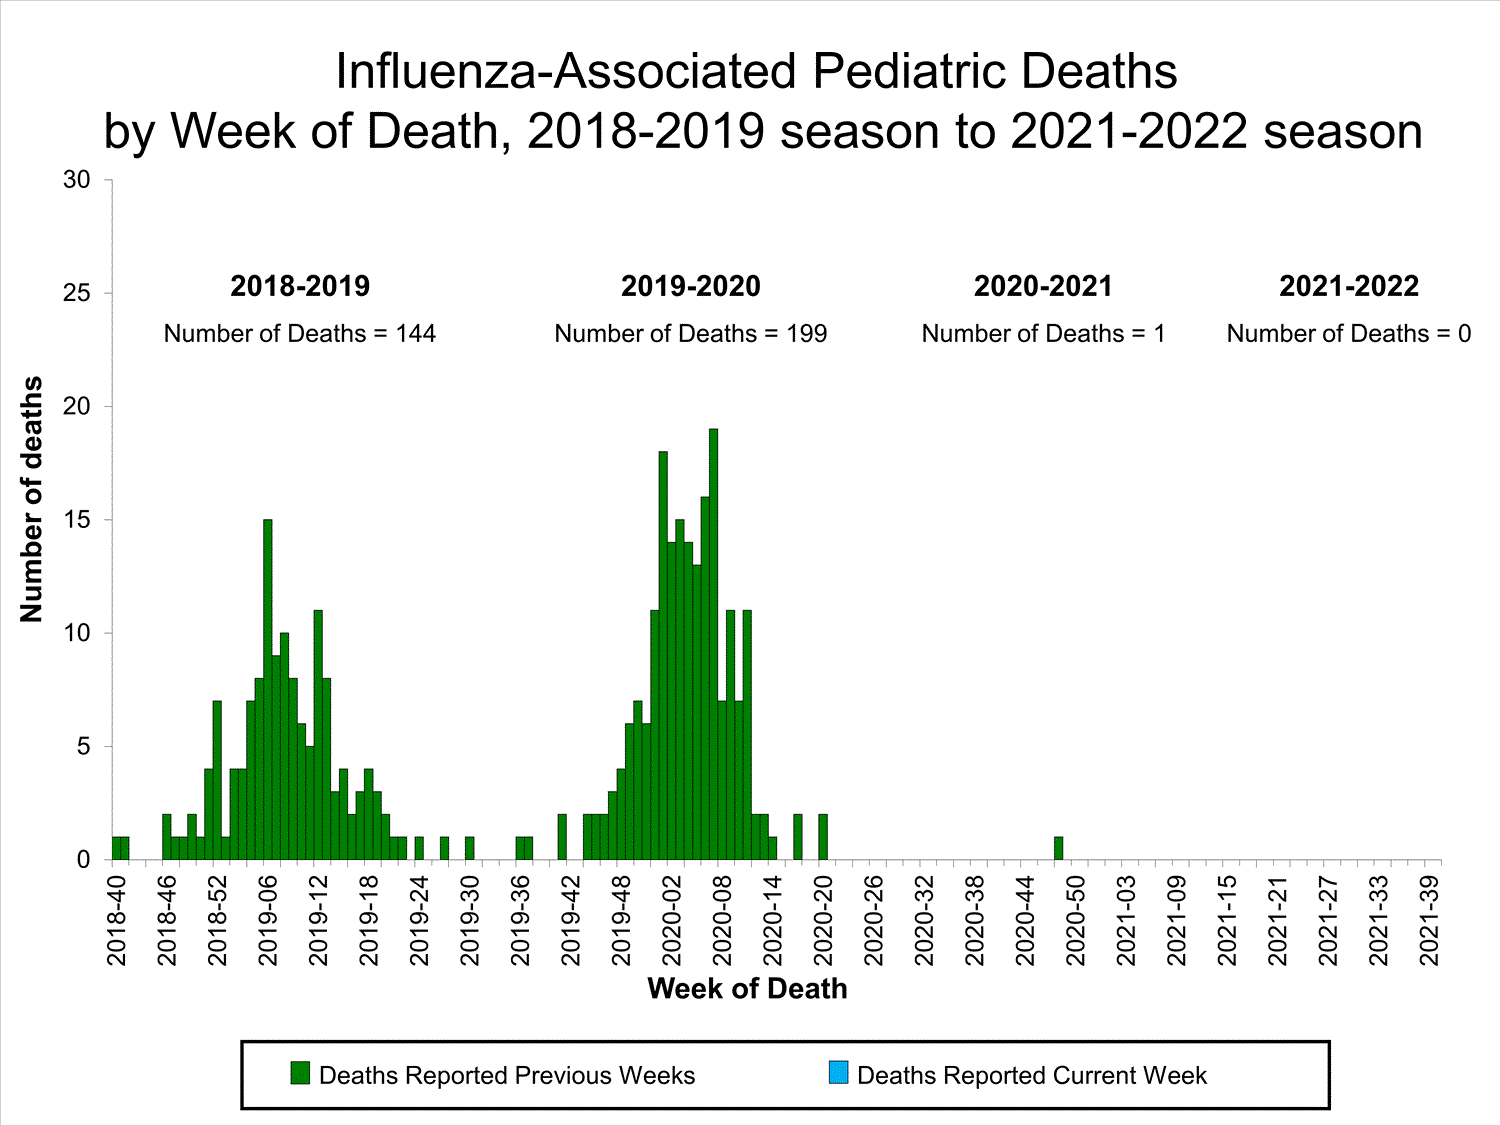
 
Weekly U.S. Influenza Surveillance Report

fluview-banner2.jpg

Note: CDC is tracking the COVID-19 pandemic in a weekly publication called COVID Data Tracker Weekly Review.

Key Updates for Week 52, ending January 1, 2022

Seasonal influenza activity in the United States is increasing, including indicators that track hospitalizations. The amount of activity varies by region.
Viruses


Clinical Lab3.8%


positive for influenza
this week


Public Health Lab
The majority of viruses
detected are influenza A(H3N2).


Virus Characterization
Genetic characterization data are now being reported.
Illness

Outpatient Respiratory Illness4.8%


of visits to a health care provider are for respiratory illness this week
(above baseline)


Outpatient Respiratory Illness: Activity Map
This week, 10 jurisdictions experienced moderate activity and 31 jurisdictions experienced high or very high activity.

Long-term Care Facilities1.3%


of facilities reported
≥ 1 influenza-positive test
among residents this week.

Severe Disease


FluSurv-NET2.6 per 100,000


cumulative hospitalization rate

HHS Protect Hospitalizations2,615


patients admitted to hospitals with influenza
this week.


NCHS Mortality19.9%


of deaths attributed to pneumonia, influenza, or COVID-19 this week (above threshold)

Pediatric Deaths0


influenza-associated deaths reported this week

All data are preliminary and may change as more reports are received.

A description of the CDC influenza surveillance system, including methodology and detailed descriptions of each data component is available on the surveillance methods page.

Additional information on the current and previous influenza seasons for each surveillance component are available on FluView Interactive.

Key Points
  • Influenza activity is increasing, with the eastern and central parts of the country seeing the majority of viruses reported and the western part of the country reporting lower levels of influenza virus circulation.
  • The majority of influenza viruses detected are A(H3N2). Earlier in the season, most influenza A(H3N2) infections occurred among children and young adults ages 5-24 years; however, in recent weeks, the proportion of infections occurring among other age groups, especially adults age 25 years and older, has been increasing.
  • Most of the H3N2 viruses so far are genetically closely related to the vaccine virus, but there are some antigenic differences that have developed as H3N2 viruses have continued to evolve.
  • The percentage of outpatient visits due to respiratory illness continues to increase and is above the national baseline. Influenza is contributing to levels of respiratory illness, but other respiratory viruses are also circulating. The relative contribution of influenza varies by location.
  • Hospitalizations for influenza continue to increase. The cumulative hospitalization rate in the FluSurv-NET system is higher than the rate for the entire 2020-2021 season, but lower than the rate seen at this time during the four seasons preceding the COVID-19 pandemic.
  • The flu season is just getting started. There’s still time to get vaccinated. An annual flu vaccine is the best way to protect against flu and its potentially serious complications. CDC recommends everyone 6 months and older get a flu vaccine.
  • There are early signs that flu vaccination uptake is down this season compared to last.
  • Flu vaccines are available at many different locations, including pharmacies and health departments. With flu activity just getting started, there is still time to benefit from flu vaccination this season. Visit www.vaccines.gov to find a flu vaccine near you.
  • There are also flu antiviral drugs that can be used to treat flu illness.
U.S. Virologic Surveillance


Reporting delays due to the holiday may have impacted week 52 virologic data; therefore, testing numbers and percent positivity should be interpreted with caution. As additional data are received, we expect to see an increase in the number of positive influenza tests, but we may not see a corresponding increase in percent positivity. While the number of influenza virus infections may be increasing, the number of respiratory illnesses due to other viruses such as SARS-CoV-2 is increasing more rapidly, resulting in the proportion of respiratory illness due to influenza, or percent positivity, to decrease.

Influenza A(H3N2) viruses have been the most frequently detected. Persons aged 5-24 years old account for the largest proportion of influenza A(H3N2) viruses detected, but the proportion of influenza A(H3N2) virus detections occurring among other age groups has increased in recent weeks. For regional and state level data about circulating influenza viruses, please visit FluView Interactive. Viruses known to be associated with recent live attenuated influenza vaccine (LAIV) receipt or found upon further testing to be a vaccine virus are not included as they are not circulating influenza viruses.
Clinical Laboratories


The results of tests performed by clinical laboratories nationwide are summarized below. Data from clinical laboratories (the percentage of specimens tested that are positive for influenza) are used to monitor whether influenza activity is increasing or decreasing.

No. of specimens tested115,580974,946
No. of positive specimens (%)4,413 (3.8%)26,946 (2.8%)
Positive specimens by type
Influenza A4,329 (98.1%)26,328 (97.7%)
Influenza B84 (1.9%)618 (2.3%)

* Reporting delays due to the holiday may have impacted week 52 virologic data; therefore, testing numbers and percent positivity should be interpreted with caution. As additional data are received, we expect to see an increase in the number of positive influenza tests, but we may not see a corresponding increase in percent positivity. While the number of influenza virus infections may be increasing, the number of respiratory illnesses due to other viruses such as SARS-CoV-2 is increasing more rapidly, resulting in the proportion of respiratory illness due to influenza, or percent positivity, to decrease.
View Chart Data | View Full Screen Public Health Laboratories


The results of tests performed by public health laboratories nationwide are summarized below. Data from public health laboratories are used to monitor the proportion of circulating viruses that belong to each influenza subtype/lineage.
No. of specimens tested36,233320,638
No. of positive specimens7856,658
Positive specimens by type/subtype
Influenza A782 (99.6%)6,590 (99.0%)
(H1N1)pdm0904 (0.1%)
H3N2377 (100%)4,899 (99.9%)
H3N2v01 (<0.1%)
Subtyping not performed4051,686
Influenza B3 (0.4%)68 (1.0%)
Yamagata lineage01 (3.3%)
Victoria lineage029 (96.7%)
Lineage not performed338

*Reporting delays due to the holiday may have impacted week 52 virologic data; therefore, testing numbers should be interpreted with caution. As additional data are received, we expect to see an increase in the number of positive influenza tests.View Chart Data | View Full Screen
Additional virologic surveillance information for current and past seasons:
Surveillance Methods | FluView Interactive: National, Regional, and State Data or Age Data
Influenza Virus Characterization


CDC performs genetic and antigenic characterization of U.S. viruses submitted from state and local public health laboratories using Right Size Roadmap submission guidance. These data are used to compare how similar the currently circulating influenza viruses are to the reference viruses representing viruses contained in the current influenza vaccines. The data are also used to monitor evolutionary changes that continually occur in influenza viruses circulating in humans. CDC also tests susceptibility of circulating influenza viruses to antiviral medications including the neuraminidase inhibitors (oseltamivir, zanamivir, and peramivir) and the PA endonuclease inhibitor baloxavir.

CDC genetically characterized 272 influenza viruses collected since October 3, 2021. While there are little data to date, most of the H3N2 viruses so far are genetically closely related to the vaccine virus, but there are some antigenic differences that have developed as H3N2 viruses have continued to evolve. Virus antigenic data will be reported later this season when a sufficient number of specimens have been tested.

CDC genetically characterized 108 influenza viruses collected October 3, 2021 to present:
A/H13
6B.1A3 (100%) 5a.12 (67%)
5a.21 (33%)
A/H3252
3C.2a1b252 (100%) 1a0
1b1 (1%)
2a0
2a.10
2a.2251 (99%)
3C.3a 03a0
B/Victoria17
V1A17 (100%) V1A0
V1A.10
V1A.310 (59%)
V1A.3a0
V1A.3a.10
V1A.3a.27 (41%)
B/Yamagata0
Y30
CDC assesses susceptibility of influenza viruses to the antiviral medications including the neuraminidase inhibitors (oseltamivir, zanamivir, and peramivir) and the PA endonuclease inhibitor baloxavir using next generation sequence analysis supplemented by laboratory assays. Information about antiviral susceptibility test methods can be found at U.S. Influenza Surveillance: Purpose and Methods | CDC.

Viruses collected in the United States since October 3, 2021, were tested for antiviral susceptibility as follows:
Neuraminidase
Inhibitors
OseltamivirViruses
Tested
2693250160
Reduced
Inhibition
(0.0%)(0.0%)(0.0%)(0.0%)(0.0%)
Highly
Reduced
Inhibition
(0.0%)(0.0%)(0.0%)(0.0%)(0.0%)
PeramivirViruses
Tested
2693250160
Reduced
Inhibition
(0.0%)(0.0%)(0.0%)(0.0%)(0.0%)
Highly
Reduced
Inhibition
(0.0%)(0.0%)(0.0%)(0.0%)(0.0%)
ZanamivirViruses
Tested
2693250160
Reduced
Inhibition
(0.0%)(0.0%)(0.0%)(0.0%)(0.0%)
Highly
Reduced
Inhibition
(0.0%)(0.0%)(0.0%)(0.0%)(0.0%)
PA Cap-Dependent Endonuclease InhibitorBaloxavirViruses
Tested
2593240160
Reduced
Susceptibility
(0.0%)(0.0%)(0.0%)(0.0%)(0.0%)
High levels of resistance to the adamantanes (amantadine and rimantadine) persist among influenza A(H1N1)pdm09 and influenza A(H3N2) viruses (the adamantanes are not effective against influenza B viruses). Therefore, use of these antivirals for treatment and prevention of influenza A virus infection is not recommended and data from adamantane resistance testing are not presented.
Outpatient Respiratory Illness Surveillance


The U.S. Outpatient Influenza-like Illness Surveillance Network (ILINet) monitors outpatient visits for influenza-like illness [ILI (fever plus cough or sore throat)], not laboratory-confirmed influenza, and will therefore capture respiratory illness visits due to infection with any pathogen that can present with similar symptoms such as influenza, SARS-CoV-2, and RSV. Due to the COVID-19 pandemic, health care-seeking behaviors have changed, and people may be accessing the health care system in alternative settings not captured as a part of ILINet or at a different point in their illness than they might have before the pandemic. Therefore, it is important to evaluate syndromic surveillance data, including that from ILINet, in the context of other sources of surveillance data to obtain a complete and accurate picture of influenza, SARS-CoV-2, and other respiratory virus activity. CDC is tracking the COVID-19 pandemic in a weekly publication called COVID Data Tracker Weekly Review. Information about other respiratory virus activity can be found on CDC’s National Respiratory and Enteric Virus Surveillance System (NREVSS) website.
Outpatient Respiratory Illness Visits


Nationwide, during week 52, 4.8% of patient visits reported through ILINet were due to respiratory illness that included fever plus a cough or sore throat, also referred to as ILI. This percentage is above the national baseline. All 10 HHS regions are above their region-specific baselines. Multiple respiratory viruses are co-circulating, and the relative contribution of influenza virus infection to ILI varies by location.


* Effective October 3, 2021 (week 40), the ILI definition (fever plus cough or sore throat) no longer includes “without a known cause other than influenza.”


View Chart Data (current season only) | View Full ScreenOutpatient Respiratory Illness Visits by Age Group


More than 70% of ILINet participants provide both the number of patient visits for respiratory illness and the total number of patient visits for the week broken out by age group. Data from this subset of providers are used to calculate the percentages of patient visits for respiratory illness by age group.

The percentage of visits for respiratory illness reported in ILINet increased for all age groups (0–4 years, 5–24 years, 25-49 years, 50–64 years, and 65+).


* Effective October 3, 2021 (week 40), the ILI definition (fever plus cough or sore throat) no longer includes “without a known cause other than influenza.”

View Chart Data | View Full Screen
Outpatient Respiratory Illness Activity Map


Data collected in ILINet are used to produce a measure of ILI activity* by state/jurisdiction and Core Based Statistical Areas (CBSA).
Week 52
(Week ending
Jan. 1, 2022)
Week 51
(Week ending
Dec. 25, 2021)
Week 52
(Week ending
Jan. 1, 2022)
Week 51
(Week ending
Dec. 25, 2021)
Very High93327
High221713481
Moderate1014107110
Low49143163
Minimal911223295
Insufficient Data11290273


*Data collected in ILINet may disproportionally represent certain populations within a jurisdiction or CBSA, and therefore, may not accurately depict the full picture of influenza activity for the entire jurisdiction or CBSA. Differences in the data presented here by CDC and independently by some health departments likely represent differing levels of data completeness with data presented by the health department likely being the more complete.
Additional information about medically attended visits for ILI for current and past seasons:
Surveillance Methods | FluView Interactive: National, Regional, and State Data or ILI Activity Map
Long-term Care Facility (LTCF) Surveillance


LTCFs (e.g., nursing homes/skilled nursing, long-term care for the developmentally disabled, and assisted living facilities) from all 50 states and U.S. territories report data on influenza infections among residents through the National Healthcare Safety Network (NHSN) Long-term Care Facility Component. During week 52, 185 (1.3%) of 14,141 reporting LTCFs reported at least one influenza positive test among their residents.


View Chart Dataexcel icon | View Full Screen
Additional information about long-term care facility surveillance:
Surveillance Methods | Additional Dataexternal icon
Hospitalization Surveillance

FluSurv-NET


The Influenza Hospitalization Surveillance Network (FluSurv-NET) conducts population-based surveillance for laboratory-confirmed influenza-related hospitalizations in select counties in 14 states and represents approximately 9% of the U.S. population. FluSurv-NET hospitalization data are preliminary. Case counts and rates for recent hospital admissions are subject to reporting delays; these delays are likely to be more pronounced around holidays. As hospitalization data are received each week, prior case counts and rates are updated accordingly. As such, end-of-season rates for any given week may vary substantially from in-season reported rates.

A total of 761 laboratory-confirmed influenza-associated hospitalizations were reported by FluSurv-NET sites between October 1, 2021, and January 1, 2022. The overall cumulative hospitalization rate was 2.6 per 100,000 population. This cumulative hospitalization rate is higher than the cumulative in-season hospitalization rate observed in week 52 during the 2020-2021 season (0.3 per 100,000), but lower than the in-season rates observed in week 52 during the 4 seasons preceding the COVID-19 pandemic (ranged from 4.9 to 13.8 per 100,000 during the 2016-17 through 2019-20 seasons). The highest rate of hospitalization was among adults aged ≥65 (7.2 per 100,000 population), followed by children aged 0-4 (3.2 per 100,000 population) and adults aged 50-64 (2.2 per 100,000 population). Among 761 hospitalizations, 715 (94.0%) were associated with influenza A virus, 42 (5.5%) with influenza B virus, 2 (0.3%) with influenza A virus and influenza B virus co-infection, and 2 (0.3%) with influenza virus for which the type was not determined. Among 166 hospitalizations with influenza A subtype information, 166 (100%) were A(H3N2).


View Full Screen


Additional FluSurv-NET hospitalization surveillance information for current and past seasons and additional age groups:
Surveillance Methods | FluView Interactive
HHS-Protect Hospitalization Surveillance


Hospitals report to HHS-Protect the number of patients admitted with laboratory-confirmed influenza. During week 52, 2,615 patients with laboratory-confirmed influenza were admitted to the hospital.


View Chart Dataexcel icon | View Full Screen
Additional HHS Protect hospitalization surveillance information:
Surveillance Methods | Additional Dataexternal icon
Mortality Surveillance

National Center for Health Statistics (NCHS) Mortality Surveillance


Based on NCHS mortality surveillance data available on January 6, 2022, 19.9% of the deaths that occurred during the week ending January 1, 2022 (week 52), were due to pneumonia, influenza, and/or COVID-19 (PIC). This percentage is above the epidemic threshold of 6.9% for this week. Among the 3,252 PIC deaths reported for this week, 2,519 had COVID-19 listed as an underlying or contributing cause of death on the death certificate, and 31 listed influenza, indicating that current PIC mortality is due primarily to COVID-19 and not influenza. The data presented are preliminary and may change as more data are received and processed.


View Chart Dataexcel icon | View Full Screen
Additional pneumonia, influenza and COVID-19 mortality surveillance information for current and past seasons:
Surveillance Methods | FluView Interactive
Influenza-Associated Pediatric Mortality


No influenza-associated pediatric deaths were reported to CDC during week 52.

A total of two influenza-associated pediatric deaths occurring during the 2021-2022 season have been reported to CDC.


View Full Screen
Additional pediatric mortality surveillance information for current and past seasons:
Surveillance Methods | FluView Interactive


Additional National and International Influenza Surveillance Information


FluView Interactive: FluView includes enhanced web-based interactive applications that can provide dynamic visuals of the influenza data collected and analyzed by CDC. These FluView Interactive applications allow people to create customized, visual interpretations of influenza data, as well as make comparisons across flu seasons, regions, age groups and a variety of other demographics.

National Institute for Occupational Safety and Health: Monthly surveillance data on the prevalence of health-related workplace absenteeism among full-time workers in the United States are available from NIOSH.

U.S. State and local influenza surveillance: Select a jurisdiction below to access the latest local influenza information. World Health Organization:
Additional influenza surveillance information from participating WHO member nations is available through
FluNetexternal icon and the Global Epidemiology Reports.external icon

WHO Collaborating Centers for Influenza:
Australiaexternal icon, Chinaexternal icon, Japanexternal icon, the United Kingdomexternal icon, and the United States (CDC in Atlanta, Georgia)

Europe:
The most up-to-date influenza information from Europe is available from WHO/Europe and the European Centre for Disease Prevention and Controlexternal icon.

Public Health Agency of Canada:
The most up-to-date influenza information from Canada is available in Canada’s weekly FluWatch reportexternal icon.

Public Health England:
The most up-to-date influenza information from the United Kingdom is available from Public Health Englandexternal icon.

Any links provided to non-Federal organizations are provided solely as a service to our users. These links do not constitute an endorsement of these organizations or their programs by CDC or the Federal Government, and none should be inferred. CDC is not responsible for the content of the individual organization web pages found at these links.

A description of the CDC influenza surveillance system, including methodology and detailed descriptions of each data component is available on the surveillance methods page.

Page last reviewed: January 7, 2022, 11:00 AM

https://www.cdc.gov/flu/weekly/index.htm
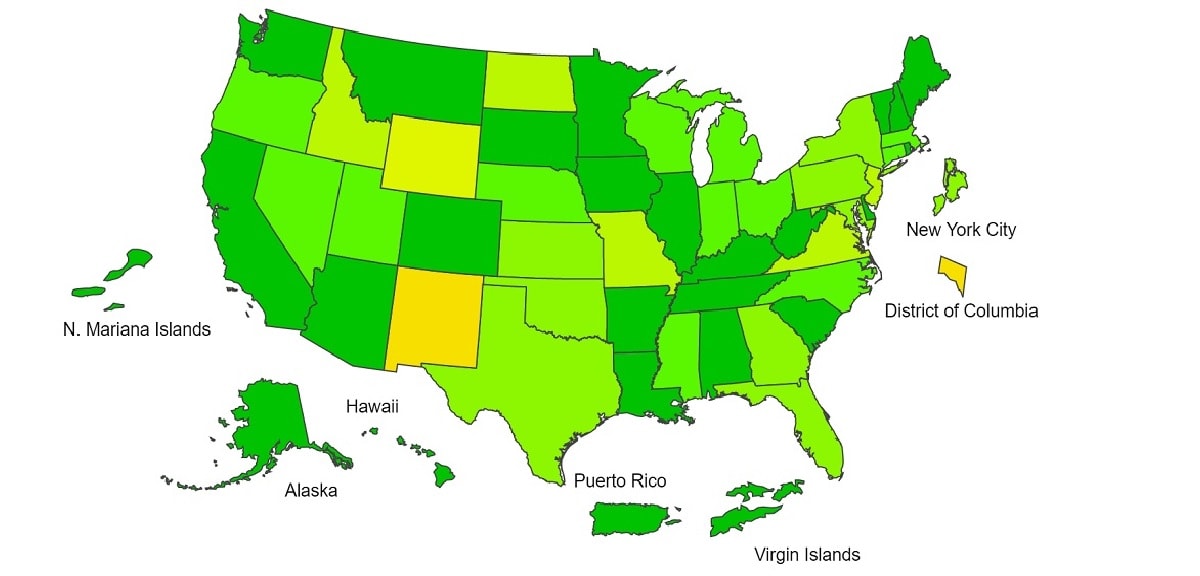
 
Weekly U.S. Influenza Surveillance Report

fluview-banner2.jpg

Note: CDC is tracking the COVID-19 pandemic in a weekly publication called COVID Data Tracker Weekly Review.

Key Updates for Week 1, ending January 8, 2022

Seasonal influenza activity in the United States declined slightly this week but remains elevated and is expected to continue for several weeks. The amount of activity varies by region.
Viruses


Clinical Lab2.2%


positive for influenza
this week


Public Health Lab
The majority of viruses
detected are influenza A(H3N2).


Virus Characterization
Genetic characterization and antiviral susceptibility are summarized in this report.
Illness

Outpatient Respiratory Illness4.3%


of visits to a health care provider are for respiratory illness this week
(above baseline)


Outpatient Respiratory Illness: Activity Map
This week, 14 jurisdictions experienced moderate activity and 21 jurisdictions experienced high or very high activity.

Long-term Care Facilities1.3%


of facilities reported
≥ 1 influenza-positive test
among residents this week.

Severe Disease


FluSurv-NET3.4 per 100,000


cumulative hospitalization rate

HHS Protect Hospitalizations1,804


patients admitted to hospitals with influenza
this week.


NCHS Mortality23.1%


of deaths attributed to pneumonia, influenza, or COVID-19 this week (above threshold)

Pediatric Deaths1


influenza-associated deaths reported this week for a total of 3 so far this season

All data are preliminary and may change as more reports are received.

A description of the CDC influenza surveillance system, including methodology and detailed descriptions of each data component is available on the surveillance methods page.

Additional information on the current and previous influenza seasons for each surveillance component are available on FluView Interactive.

Key Points
  • Influenza activity declined slightly this week but remains elevated. While influenza is difficult to predict, influenza activity is expected to continue for several more weeks.
  • The majority of influenza viruses detected are A(H3N2). Most of the H3N2 viruses so far are genetically closely related to the vaccine virus, but there are some antigenic differences that have developed as H3N2 viruses have continued to evolve.
  • The percentage of outpatient visits due to respiratory illness decreased nationally but remains above baseline. Influenza is contributing to levels of respiratory illness, but other respiratory viruses are also circulating. The relative contribution of influenza varies by location.
  • The number of hospital admissions reported to HHS Protect declined slightly this week.
  • The cumulative hospitalization rate in the FluSurv-NET system is higher than the rate for the entire 2020-2021 season, but lower than the rate seen at this time during the four seasons preceding the COVID-19 pandemic.
  • It’s not too late to get vaccinated. An annual flu vaccine is the best way to protect against flu and its potentially serious complications. CDC recommends everyone 6 months and older get a flu vaccine.
  • There are early signs that flu vaccination coverage so far is lower this season compared to last.
  • Flu vaccines are available at many different locations, including pharmacies and health departments. Visit www.vaccines.gov to find a flu vaccine near you.
  • There are also flu antiviral drugs that can be used to treat flu illness.
U.S. Virologic Surveillance


Influenza A(H3N2) viruses have been the most frequently detected influenza viruses this season. Earlier in the season most influenza viruses were detected among persons aged 5-24 years; however, during the most recent 2 weeks, persons aged 25-64 years accounted for the largest number of A(H3N2) viruses reported. For regional and state level data about circulating influenza viruses, please visit FluView Interactive. Viruses known to be associated with recent live attenuated influenza vaccine (LAIV) receipt or found upon further testing to be a vaccine virus are not included as they are not circulating influenza viruses.
Clinical Laboratories


The results of tests performed by clinical laboratories nationwide are summarized below. Data from clinical laboratories (the percentage of specimens tested that are positive for influenza) are used to monitor whether influenza activity is increasing or decreasing.

No. of specimens tested102,4121,095,989
No. of positive specimens (%)2,203 (2.2%)30,124 (2.7%)
Positive specimens by type
Influenza A2,156 (97.9%)29,434 (97.7%)
Influenza B47 (2.1%)690 (2.3%)


View Chart Data | View Full Screen Public Health Laboratories


The results of tests performed by public health laboratories nationwide are summarized below. Data from public health laboratories are used to monitor the proportion of circulating viruses that belong to each influenza subtype/lineage.
No. of specimens tested54,888385,093
No. of positive specimens6177,969
Positive specimens by type/subtype
Influenza A613 (99.4%)7,893 (99.0%)
(H1N1)pdm0904 (0.1%)
H3N2266 (100%)5,747 (99.9%)
H3N2v01 (<0.1%)
Subtyping not performed3472,141
Influenza B4 (0.6%)76 (1.0%)
Yamagata lineage01 (3.1%)
Victoria lineage031 (96.9%)
Lineage not performed444


View Chart Data | View Full Screen
Additional virologic surveillance information for current and past seasons:
Surveillance Methods | FluView Interactive: National, Regional, and State Data or Age Data
Influenza Virus Characterization


CDC performs genetic and antigenic characterization of U.S. viruses submitted from state and local public health laboratories using the Right Size Roadmap submission guidance. These data are used to compare how similar the currently circulating influenza viruses are to the reference viruses representing viruses contained in the current influenza vaccines. The data are also used to monitor evolutionary changes that continually occur in influenza viruses circulating in humans. CDC also tests susceptibility of circulating influenza viruses to antiviral medications including the neuraminidase inhibitors (oseltamivir, zanamivir, and peramivir) and the PA endonuclease inhibitor baloxavir.

CDC genetically characterized 347 influenza viruses collected since October 3, 2021. While there are little data to date, most of the H3N2 viruses so far are genetically closely related to the vaccine virus, but there are some antigenic differences that have developed as H3N2 viruses have continued to evolve. Virus antigenic data will be reported later this season when a sufficient number of specimens have been tested.
A/H13
6B.1A3 (100%) 5a.12 (67%)
5a.21 (33%)
A/H3324
3C.2a1b324 (100%) 1a0
1b1 (0.3%)
2a0
2a.10
2a.2323 (99.7%)
3C.3a 03a0
B/Victoria20
V1A20 (100%) V1A0
V1A.10
V1A.311 (55%)
V1A.3a0
V1A.3a.10
V1A.3a.29 (45%)
B/Yamagata0
Y30
CDC assesses susceptibility of influenza viruses to the antiviral medications including the neuraminidase inhibitors (oseltamivir, zanamivir, and peramivir) and the PA endonuclease inhibitor baloxavir using next generation sequence analysis supplemented by laboratory assays. Information about antiviral susceptibility test methods can be found at U.S. Influenza Surveillance: Purpose and Methods | CDC.

Viruses collected in the United States since October 3, 2021, were tested for antiviral susceptibility as follows:
Neuraminidase
Inhibitors
OseltamivirViruses
Tested
3493326200
Reduced
Inhibition
(0.0%)(0.0%)(0.0%)(0.0%)(0.0%)
Highly
Reduced
Inhibition
(0.0%)(0.0%)(0.0%)(0.0%)(0.0%)
PeramivirViruses
Tested
3493326200
Reduced
Inhibition
(0.0%)(0.0%)(0.0%)(0.0%)(0.0%)
Highly
Reduced
Inhibition
(0.0%)(0.0%)(0.0%)(0.0%)(0.0%)
ZanamivirViruses
Tested
3493326200
Reduced
Inhibition
(0.0%)(0.0%)(0.0%)(0.0%)(0.0%)
Highly
Reduced
Inhibition
(0.0%)(0.0%)(0.0%)(0.0%)(0.0%)
PA Cap-Dependent Endonuclease InhibitorBaloxavirViruses
Tested
3443321200
Reduced
Susceptibility
(0.0%)(0.0%)(0.0%)(0.0%)(0.0%)
High levels of resistance to the adamantanes (amantadine and rimantadine) persist among influenza A(H1N1)pdm09 and influenza A(H3N2) viruses (the adamantanes are not effective against influenza B viruses). Therefore, use of these antivirals for treatment and prevention of influenza A virus infection is not recommended and data from adamantane resistance testing are not presented.
Outpatient Respiratory Illness Surveillance


The U.S. Outpatient Influenza-like Illness Surveillance Network (ILINet) monitors outpatient visits for influenza-like illness [ILI (fever plus cough or sore throat)], not laboratory-confirmed influenza, and will therefore capture respiratory illness visits due to infection with any pathogen that can present with similar symptoms, including influenza, SARS-CoV-2, and RSV. Due to the COVID-19 pandemic, health care-seeking behaviors have changed, and people may be accessing the health care system in alternative settings not captured as a part of ILINet or at a different point in their illness than they might have before the pandemic. Therefore, it is important to evaluate syndromic surveillance data, including that from ILINet, in the context of other sources of surveillance data to obtain a complete and accurate picture of influenza, SARS-CoV-2, and other respiratory virus activity. CDC is tracking the COVID-19 pandemic in a weekly publication called COVID Data Tracker Weekly Review. Information about other respiratory virus activity can be found on CDC’s National Respiratory and Enteric Virus Surveillance System (NREVSS) website.
Outpatient Respiratory Illness Visits


Nationwide, during week 1, 4.3% of patient visits reported through ILINet were due to respiratory illness that included fever plus a cough or sore throat, also referred to as ILI. This percentage is above the national baseline. All 10 HHS regions are above their region-specific baselines. Multiple respiratory viruses are co-circulating, and the relative contribution of influenza virus infection to ILI varies by location.


* Effective October 3, 2021 (week 40), the ILI definition (fever plus cough or sore throat) no longer includes “without a known cause other than influenza.”


View Chart Data (current season only) | View Full ScreenOutpatient Respiratory Illness Visits by Age Group


More than 70% of ILINet participants provide both the number of patient visits for respiratory illness and the total number of patient visits for the week broken out by age group. Data from this subset of providers are used to calculate the percentages of patient visits for respiratory illness by age group.

The percentage of visits for respiratory illness reported in ILINet decreased for four age groups (0–4 years, 5–24 years, 25-49 years, and 50–64 years) and remained stable for one age group (65+ years).


* Effective October 3, 2021 (week 40), the ILI definition (fever plus cough or sore throat) no longer includes “without a known cause other than influenza.”

View Chart Data | View Full Screen
Outpatient Respiratory Illness Activity Map


Data collected in ILINet are used to produce a measure of ILI activity* by state/jurisdiction and Core Based Statistical Areas (CBSA).
Week 1
(Week ending
Jan. 8, 2022)
Week 52
(Week ending
Jan. 1, 2022)
Week 1
(Week ending
Jan. 8, 2022)
Week 52
(Week ending
Jan. 1, 2022)
Very High392233
High1820116137
Moderate141192107
Low56157145
Minimal138263232
Insufficient Data21279275


*Data collected in ILINet may disproportionally represent certain populations within a jurisdiction or CBSA, and therefore, may not accurately depict the full picture of influenza activity for the entire jurisdiction or CBSA. Differences in the data presented here by CDC and independently by some health departments likely represent differing levels of data completeness with data presented by the health department likely being the more complete.
Additional information about medically attended visits for ILI for current and past seasons:
Surveillance Methods | FluView Interactive: National, Regional, and State Data or ILI Activity Map
Long-term Care Facility (LTCF) Surveillance


LTCFs (e.g., nursing homes/skilled nursing, long-term care for the developmentally disabled, and assisted living facilities) from all 50 states and U.S. territories report data on influenza infections among residents through the National Healthcare Safety Network (NHSN) Long-term Care Facility Component. During week 1, 191 (1.3%) of 14,208 reporting LTCFs reported at least one influenza positive test among their residents.


View Chart Dataexcel icon | View Full Screen
Additional information about long-term care facility surveillance:
Surveillance Methods | Additional Dataexternal icon
Hospitalization Surveillance

FluSurv-NET


The Influenza Hospitalization Surveillance Network (FluSurv-NET) conducts population-based surveillance for laboratory-confirmed influenza-related hospitalizations in select counties in 14 states and represents approximately 9% of the U.S. population. FluSurv-NET hospitalization data are preliminary. Case counts and rates for recent hospital admissions are subject to reporting delays; these delays are likely to be more pronounced around holidays. As hospitalization data are received each week, prior case counts and rates are updated accordingly. As such, end-of-season rates for any given week may vary substantially from in-season reported rates.

A total of 1,005 laboratory-confirmed influenza-associated hospitalizations were reported by FluSurv-NET sites between October 1, 2021, and January 8, 2022. The overall hospitalization rate was 3.4 per 100,000 population. This cumulative hospitalization rate is higher than the cumulative in-season hospitalization rate observed for week 1 during the 2020-2021 season (0.4 per 100,000), but lower than the in-season rates observed for week 1 during the 4 seasons preceding the COVID-19 pandemic (these ranged from 7.1 to 22.7 per 100,000 during the 2016-2017 through 2019-2020 seasons). The highest hospitalization rate was among adults aged ≥65 (9.6 per 100,000 population), followed by children aged 0-4 (4.8 per 100,000 population) and adults aged 50-64 (2.9 per 100,000 population). Among 1,005 hospitalizations, 947 (94.2%) were associated with influenza A virus, 50 (5.0%) with influenza B virus, 2 (0.2%) with influenza A virus and influenza B virus co-infection, and 6 (0.6%) with influenza virus for which the type was not determined. Among 227 hospitalizations with influenza A subtype information, 224 (98.7%) were A(H3N2) and 3 (1.3%) were A(H1N1)pdm09.


View Full Screen
Additional FluSurv-NET hospitalization surveillance information for current and past seasons and additional age groups:
Surveillance Methods | FluView Interactive
HHS-Protect Hospitalization Surveillance


Hospitals report to HHS-Protect the number of patients admitted with laboratory-confirmed influenza. During week 1, 1,804 patients with laboratory-confirmed influenza were admitted to the hospital.


View Chart Dataexcel icon | View Full Screen
Additional HHS Protect hospitalization surveillance information:
Surveillance Methods | Additional Dataexternal icon
Mortality Surveillance

National Center for Health Statistics (NCHS) Mortality Surveillance


Based on NCHS mortality surveillance data available on January 13, 2022, 23.1% of the deaths that occurred during the week ending January 8, 2022 (week 1), were due to pneumonia, influenza, and/or COVID-19 (PIC). This percentage is above the epidemic threshold of 7.0% for this week. Among the 4,417 PIC deaths reported for this week, 3,567 had COVID-19 listed as an underlying or contributing cause of death on the death certificate, and 42 listed influenza, indicating that current PIC mortality is due primarily to COVID-19 and not influenza. The data presented are preliminary and may change as more data are received and processed.


View Chart Dataexcel icon | View Full Screen
Additional pneumonia, influenza and COVID-19 mortality surveillance information for current and past seasons:
Surveillance Methods | FluView Interactive
Influenza-Associated Pediatric Mortality


One influenza-associated pediatric death occurring during the 2021-2022 season was reported to CDC during week 1. This death was associated with an influenza A virus for which no subtyping was performed and occurred during week 51 (the week ending December 25, 2021).

A total of three influenza-associated pediatric deaths occurring during the 2021-2022 season have been reported to CDC.


View Full Screen
Additional pediatric mortality surveillance information for current and past seasons:
Surveillance Methods | FluView Interactive


Additional National and International Influenza Surveillance Information


FluView Interactive: FluView includes enhanced web-based interactive applications that can provide dynamic visuals of the influenza data collected and analyzed by CDC. These FluView Interactive applications allow people to create customized, visual interpretations of influenza data, as well as make comparisons across flu seasons, regions, age groups and a variety of other demographics.

National Institute for Occupational Safety and Health: Monthly surveillance data on the prevalence of health-related workplace absenteeism among full-time workers in the United States are available from NIOSH.

U.S. State and local influenza surveillance: Select a jurisdiction below to access the latest local influenza information. World Health Organization:
Additional influenza surveillance information from participating WHO member nations is available through
FluNetexternal icon and the Global Epidemiology Reports.external icon

WHO Collaborating Centers for Influenza:
Australiaexternal icon, Chinaexternal icon, Japanexternal icon, the United Kingdomexternal icon, and the United States (CDC in Atlanta, Georgia)

Europe:
The most up-to-date influenza information from Europe is available from WHO/Europe and the European Centre for Disease Prevention and Controlexternal icon.

Public Health Agency of Canada:
The most up-to-date influenza information from Canada is available in Canada’s weekly FluWatch reportexternal icon.

Public Health England:
The most up-to-date influenza information from the United Kingdom is available from Public Health Englandexternal icon.

Any links provided to non-Federal organizations are provided solely as a service to our users. These links do not constitute an endorsement of these organizations or their programs by CDC or the Federal Government, and none should be inferred. CDC is not responsible for the content of the individual organization web pages found at these links.

A description of the CDC influenza surveillance system, including methodology and detailed descriptions of each data component is available on the surveillance methods page.

Page last reviewed: January 14, 2022, 11:00 AM


https://www.cdc.gov/flu/weekly/index.htm
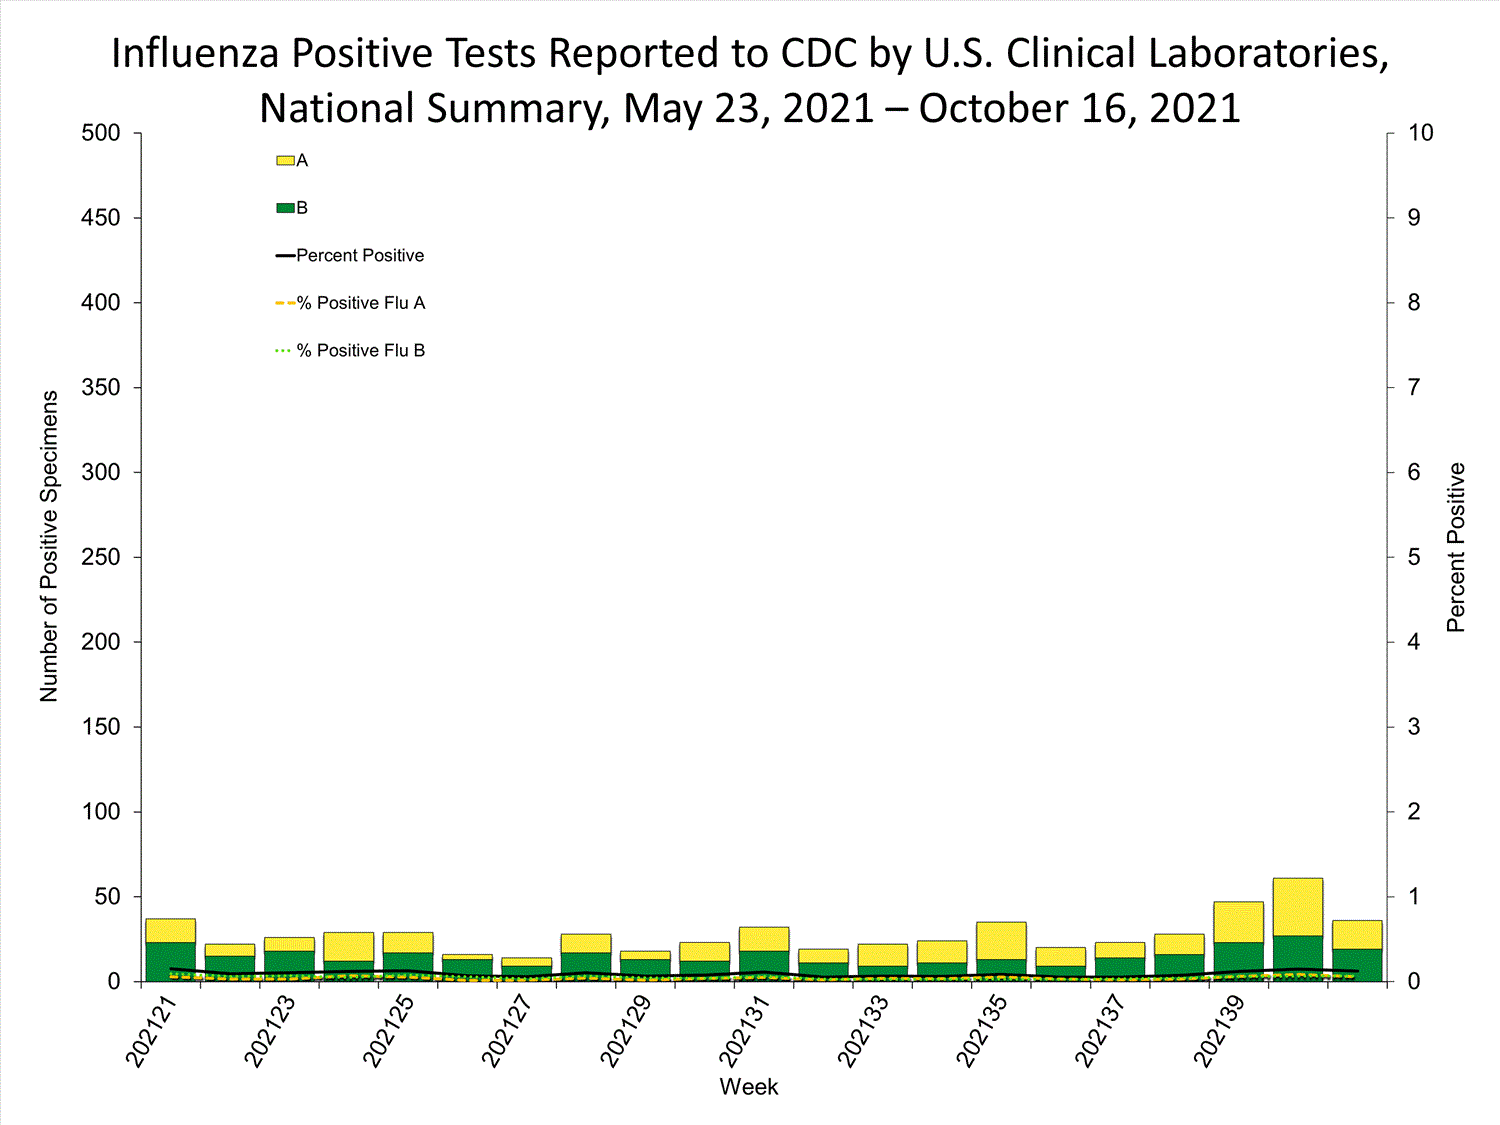
 
Weekly U.S. Influenza Surveillance Report


Updated January 21, 2022
fluview-banner2.jpg

Note: CDC is tracking the COVID-19 pandemic in a weekly publication called COVID Data Tracker Weekly Review.

Key Updates for Week 2, ending January 15, 2022

Seasonal influenza activity in the United States declined slightly again this week but remains elevated and is expected to continue for several weeks. The amount of activity varies by region.
Viruses


Clinical Lab1.8%


positive for influenza
this week


Public Health Lab
The majority of viruses
detected are influenza A(H3N2).


Virus Characterization
Genetic characterization and antiviral susceptibility are summarized in this report.
Illness

Outpatient Respiratory Illness3.5%


of visits to a health care provider are for respiratory illness this week
(above baseline)


Outpatient Respiratory Illness: Activity Map
This week, 14 jurisdictions experienced moderate activity and 14 jurisdictions experienced high or very high activity.

Long-term Care Facilities1.0%


of facilities reported
≥ 1 influenza-positive test
among residents this week.

Severe Disease


FluSurv-NET3.9 per 100,000


cumulative hospitalization rate

HHS Protect Hospitalizations1,483


patients admitted to hospitals with influenza
this week.


NCHS Mortality25.5%


of deaths attributed to pneumonia, influenza, or COVID-19 this week (above threshold)

Pediatric Deaths2


influenza-associated deaths reported this week for a total of 5 so far this season

All data are preliminary and may change as more reports are received.

A description of the CDC influenza surveillance system, including methodology and detailed descriptions of each data component is available on the surveillance methods page.

Additional information on the current and previous influenza seasons for each surveillance component are available on FluView Interactive.

Key Points
  • Influenza activity remains elevated but declined slightly again this week. While influenza activity is difficult to predict, it is expected to continue for several more weeks.
  • The majority of influenza viruses detected are A(H3N2). Most of the H3N2 viruses identified so far this season are genetically closely related to the vaccine virus, but there are some antigenic differences that have developed as H3N2 viruses have continued to evolve.
  • The percentage of outpatient visits due to respiratory illness decreased nationally again this week but remains above baseline. Influenza is contributing to levels of respiratory illness, but other respiratory viruses are also circulating. The relative contribution of influenza varies by location.
  • The number of hospital admissions reported to HHS Protect declined slightly again this week.
  • The cumulative hospitalization rate in the FluSurv-NET system is higher than the rate for the entire 2020-2021 season, but lower than the rate seen at this time during the four seasons preceding the COVID-19 pandemic.
  • Two pediatric deaths were reported this week for a total of five so far this season.
  • There’s still time to get vaccinated. An annual flu vaccine is the best way to protect against flu and its potentially serious complications. CDC recommends everyone 6 months and older get a flu vaccine.
  • There are early signs that flu vaccination coverage so far is lower this season compared to last.
  • Flu vaccines are available at many different locations, including pharmacies and health departments. Visit www.vaccines.gov to find a flu vaccine near you.
  • There are also flu antiviral drugs that can be used to treat flu illness.
U.S. Virologic Surveillance


Influenza A(H3N2) viruses have been the most frequently detected influenza viruses this season. For regional and state level data and age group distribution, please visit FluView Interactive. Viruses known to be associated with recent live attenuated influenza vaccine (LAIV) receipt or found upon further testing to be a vaccine virus are not included as they are not circulating influenza viruses.
Clinical Laboratories


The results of tests performed by clinical laboratories nationwide are summarized below. Data from clinical laboratories (the percentage of specimens tested that are positive for influenza) are used to monitor whether influenza activity is increasing or decreasing.

No. of specimens tested91,2061,227,896
No. of positive specimens (%)1,670 (1.8%)32,903 (2.7%)
Positive specimens by type
Influenza A1,646 (98.6%)32,180 (97.8%)
Influenza B24 (1.4%)723 (2.2%)


View Chart Data | View Full Screen Public Health Laboratories


The results of tests performed by public health laboratories nationwide are summarized below. Data from public health laboratories are used to monitor the proportion of circulating viruses that belong to each influenza subtype/lineage.
No. of specimens tested54,157446,783
No. of positive specimens5759,156
Positive specimens by type/subtype
Influenza A574 (99.8%)9,076 (99.1%)
(H1N1)pdm0905 (0.1%)
H3N2173 (100%)6,455 (99.9%)
H3N2v01 (<0.1%)
Subtyping not performed4012,615
Influenza B1 (0.2%)80 (0.9%)
Yamagata lineage01 (3.0%)
Victoria lineage032 (97.0%)
Lineage not performed147


View Chart Data | View Full Screen
Additional virologic surveillance information for current and past seasons:
Surveillance Methods | FluView Interactive: National, Regional, and State Data or Age Data
Influenza Virus Characterization


CDC performs genetic and antigenic characterization of U.S. viruses submitted from state and local public health laboratories using the Right Size Roadmap submission guidance. These data are used to compare how similar the currently circulating influenza viruses are to the reference viruses representing viruses contained in the current influenza vaccines. The data are also used to monitor evolutionary changes that continually occur in influenza viruses circulating in humans. CDC also tests susceptibility of circulating influenza viruses to antiviral medications including the neuraminidase inhibitors (oseltamivir, zanamivir, and peramivir) and the PA endonuclease inhibitor baloxavir.

CDC has genetically characterized 373 influenza viruses collected since October 3, 2021. H3N2 viruses so far are genetically closely related to the vaccine virus, but there are some antigenic differences that have developed as H3N2 viruses have continued to evolve. Virus antigenic data will be reported later this season when a sufficient number of specimens have been tested.
A/H13
6B.1A3 (100%) 5a.12 (66.7%)
5a.21 (33.3%)
A/H3350
3C.2a1b350 (100%) 1a0
1b1 (0.3%)
2a0
2a.10
2a.2349 (99.7%)
3C.3a 03a0
B/Victoria20
V1A20 (100%) V1A0
V1A.10
V1A.311 (55%)
V1A.3a0
V1A.3a.10
V1A.3a.29 (45%)
B/Yamagata0
Y30
CDC assesses susceptibility of influenza viruses to the antiviral medications including the neuraminidase inhibitors (oseltamivir, zanamivir, and peramivir) and the PA endonuclease inhibitor baloxavir using next generation sequence analysis supplemented by laboratory assays. Information about antiviral susceptibility test methods can be found at U.S. Influenza Surveillance: Purpose and Methods | CDC.

Viruses collected in the United States since October 3, 2021, were tested for antiviral susceptibility as follows:
Neuraminidase
Inhibitors
OseltamivirViruses
Tested
3763353200
Reduced
Inhibition
(0.0%)(0.0%)(0.0%)(0.0%)(0.0%)
Highly
Reduced
Inhibition
(0.0%)(0.0%)(0.0%)(0.0%)(0.0%)
PeramivirViruses
Tested
3763353200
Reduced
Inhibition
(0.0%)(0.0%)(0.0%)(0.0%)(0.0%)
Highly
Reduced
Inhibition
(0.0%)(0.0%)(0.0%)(0.0%)(0.0%)
ZanamivirViruses
Tested
3763353200
Reduced
Inhibition
(0.0%)(0.0%)(0.0%)(0.0%)(0.0%)
Highly
Reduced
Inhibition
(0.0%)(0.0%)(0.0%)(0.0%)(0.0%)
PA Cap-Dependent Endonuclease InhibitorBaloxavirViruses
Tested
3703347200
Reduced
Susceptibility
(0.0%)(0.0%)(0.0%)(0.0%)(0.0%)
High levels of resistance to the adamantanes (amantadine and rimantadine) persist among influenza A(H1N1)pdm09 and influenza A(H3N2) viruses (the adamantanes are not effective against influenza B viruses). Therefore, use of these antivirals for treatment and prevention of influenza A virus infection is not recommended and data from adamantane resistance testing are not presented.
Outpatient Respiratory Illness Surveillance


The U.S. Outpatient Influenza-like Illness Surveillance Network (ILINet) monitors outpatient visits for influenza-like illness [ILI (fever plus cough or sore throat)], not laboratory-confirmed influenza, and will therefore capture respiratory illness visits due to infection with any pathogen that can present with similar symptoms, including influenza, SARS-CoV-2, and RSV. Due to the COVID-19 pandemic, health care-seeking behaviors have changed, and people may be accessing the health care system in alternative settings not captured as a part of ILINet or at a different point in their illness than they might have before the pandemic. Therefore, it is important to evaluate syndromic surveillance data, including that from ILINet, in the context of other sources of surveillance data to obtain a complete and accurate picture of influenza, SARS-CoV-2, and other respiratory virus activity. CDC is tracking the COVID-19 pandemic in a weekly publication called COVID Data Tracker Weekly Review. Information about other respiratory virus activity can be found on CDC’s National Respiratory and Enteric Virus Surveillance System (NREVSS) website.
Outpatient Respiratory Illness Visits


Nationwide, during week 2, 3.5% of patient visits reported through ILINet were due to respiratory illness that included fever plus a cough or sore throat, also referred to as ILI. This percentage is above the national baseline. Nine of the 10 HHS regions are above their region-specific baselines; only Region 1 is below its baseline. Multiple respiratory viruses are co-circulating, and the relative contribution of influenza virus infection to ILI varies by location.


* Effective October 3, 2021 (week 40), the ILI definition (fever plus cough or sore throat) no longer includes “without a known cause other than influenza.”


View Chart Data (current season only) | View Full ScreenOutpatient Respiratory Illness Visits by Age Group


More than 70% of ILINet participants provide both the number of patient visits for respiratory illness and the total number of patient visits for the week broken out by age group. Data from this subset of providers are used to calculate the percentages of patient visits for respiratory illness by age group.

The percentage of visits for respiratory illness reported in ILINet are trending downward for all age groups (0–4 years, 5–24 years, 25-49 years, 50–64 years, and 65+ years).


* Effective October 3, 2021 (week 40), the ILI definition (fever plus cough or sore throat) no longer includes “without a known cause other than influenza.”

View Chart Data | View Full Screen
Outpatient Respiratory Illness Activity Map


Data collected in ILINet are used to produce a measure of ILI activity* by state/jurisdiction and Core Based Statistical Areas (CBSA).
Week 2
(Week ending
Jan. 15, 2022)
Week 1
(Week ending
Jan. 8, 2022)
Week 2
(Week ending
Jan. 15, 2022)
Week 1
(Week ending
Jan. 8, 2022)
Very High151321
High131580124
Moderate142010498
Low135161159
Minimal129298265
Insufficient Data21273262


*Data collected in ILINet may disproportionally represent certain populations within a jurisdiction or CBSA, and therefore, may not accurately depict the full picture of influenza activity for the entire jurisdiction or CBSA. Differences in the data presented here by CDC and independently by some health departments likely represent differing levels of data completeness with data presented by the health department likely being the more complete.
Additional information about medically attended visits for ILI for current and past seasons:
Surveillance Methods | FluView Interactive: National, Regional, and State Data or ILI Activity Map
Long-term Care Facility (LTCF) Surveillance


LTCFs (e.g., nursing homes/skilled nursing, long-term care for the developmentally disabled, and assisted living facilities) from all 50 states and U.S. territories report data on influenza virus infections among residents through the National Healthcare Safety Network (NHSN) Long-term Care Facility Component. During week 2, 143 (1.0%) of 14,186 reporting LTCFs reported at least one influenza positive test among their residents.


View Chart Dataexcel icon | View Full Screen
Additional information about long-term care facility surveillance:
Surveillance Methods | Additional Dataexternal icon
Hospitalization Surveillance

FluSurv-NET


The Influenza Hospitalization Surveillance Network (FluSurv-NET) conducts population-based surveillance for laboratory-confirmed influenza-related hospitalizations in select counties in 14 states and represents approximately 9% of the U.S. population. FluSurv-NET hospitalization data are preliminary. As data are received each week, prior case counts and rates are updated accordingly.

A total of 1,143 laboratory-confirmed influenza-associated hospitalizations were reported by FluSurv-NET sites between October 1, 2021, and January 15, 2022. The overall hospitalization rate is 3.9 per 100,000 population. This cumulative hospitalization rate is higher than the cumulative in-season hospitalization rate observed for week 2 during the 2020-2021 season (0.5 per 100,000), but lower than the in-season rates observed for week 2 during the 4 seasons preceding the COVID-19 pandemic (these ranged from 10.2 to 31.5 per 100,000 during the 2016-17 through 2019-20 seasons).

When examining rates by age, the highest rate of hospitalization per 100,000 population was among adults aged ≥65 years (10.8); within this group, rates were highest among adults aged ≥85 years (22.9). Among persons aged <65 years, hospitalization rates per 100,000 population were highest among children aged 0-4 years (5.5) followed by adults aged 50-64 years (3.4). When examining rates by race and ethnicity, the highest rate of hospitalization per 100,000 population was among non-Hispanic American Indian or Alaska Native persons (5.4) followed by non-Hispanic Black persons (4.7).

Among 1,143 hospitalizations, 1,076 (94.1%) were associated with influenza A virus, 57 (5.0%) with influenza B virus, 3 (0.3%) with influenza A virus and influenza B virus co-infection, and 7 (0.6%) with influenza virus for which the type was not determined. Among 266 hospitalizations with influenza A subtype information, 263 (98.9%) were A(H3N2) and 3 (1.1%) were A(H1N1)pdm09. Among the 1,143 hospitalizations, 1.8% of patients hospitalized with influenza also tested positive for SARS-CoV-2.


View Full Screen
Additional FluSurv-NET hospitalization surveillance information for current and past seasons and additional age groups:
Surveillance Methods | FluView Interactive
HHS-Protect Hospitalization Surveillance


Hospitals report to HHS-Protect the number of patients admitted with laboratory-confirmed influenza. During week 2, 1,483 patients with laboratory-confirmed influenza were admitted to the hospital.


View Chart Dataexcel icon | View Full Screen
Additional HHS Protect hospitalization surveillance information:
Surveillance Methods | Additional Dataexternal icon
Mortality Surveillance

National Center for Health Statistics (NCHS) Mortality Surveillance


Based on NCHS mortality surveillance data available on January 20, 2022, 25.5% of the deaths that occurred during the week ending January 15, 2022 (week 2), were due to pneumonia, influenza, and/or COVID-19 (PIC). This percentage is above the epidemic threshold of 7.1% for this week. Among the 4,326 PIC deaths reported for this week, 3,681 had COVID-19 listed as an underlying or contributing cause of death on the death certificate, and 22 listed influenza, indicating that current PIC mortality is due primarily to COVID-19 and not influenza. The data presented are preliminary and may change as more data are received and processed.


View Chart Dataexcel icon | View Full Screen
Additional pneumonia, influenza and COVID-19 mortality surveillance information for current and past seasons:
Surveillance Methods | FluView Interactive
Influenza-Associated Pediatric Mortality


Two influenza-associated pediatric deaths occurring during the 2021-2022 season were reported to CDC during week 2. One death was associated with an influenza A(H3) virus and one death was associated with an influenza A virus for which no subtyping was performed. Both deaths occurred during week 2 (the week ending January 15, 2022).

A total of five influenza-associated pediatric deaths occurring during the 2021-2022 season have been reported to CDC.


View Full Screen
Additional pediatric mortality surveillance information for current and past seasons:
Surveillance Methods | FluView Interactive


Additional National and International Influenza Surveillance Information


FluView Interactive: FluView includes enhanced web-based interactive applications that can provide dynamic visuals of the influenza data collected and analyzed by CDC. These FluView Interactive applications allow people to create customized, visual interpretations of influenza data, as well as make comparisons across flu seasons, regions, age groups and a variety of other demographics.

National Institute for Occupational Safety and Health: Monthly surveillance data on the prevalence of health-related workplace absenteeism among full-time workers in the United States are available from NIOSH.

U.S. State and local influenza surveillance: Select a jurisdiction below to access the latest local influenza information. World Health Organization:
Additional influenza surveillance information from participating WHO member nations is available through
FluNetexternal icon and the Global Epidemiology Reports.external icon

WHO Collaborating Centers for Influenza:
Australiaexternal icon, Chinaexternal icon, Japanexternal icon, the United Kingdomexternal icon, and the United States (CDC in Atlanta, Georgia)

Europe:
The most up-to-date influenza information from Europe is available from WHO/Europe and the European Centre for Disease Prevention and Controlexternal icon.

Public Health Agency of Canada:
The most up-to-date influenza information from Canada is available in Canada’s weekly FluWatch reportexternal icon.

Public Health England:
The most up-to-date influenza information from the United Kingdom is available from Public Health Englandexternal icon.

Any links provided to non-Federal organizations are provided solely as a service to our users. These links do not constitute an endorsement of these organizations or their programs by CDC or the Federal Government, and none should be inferred. CDC is not responsible for the content of the individual organization web pages found at these links.

A description of the CDC influenza surveillance system, including methodology and detailed descriptions of each data component is available on the surveillance methods page.

Page last reviewed: January 21, 2022, 11:00 AM

https://www.cdc.gov/flu/weekly/index.htm
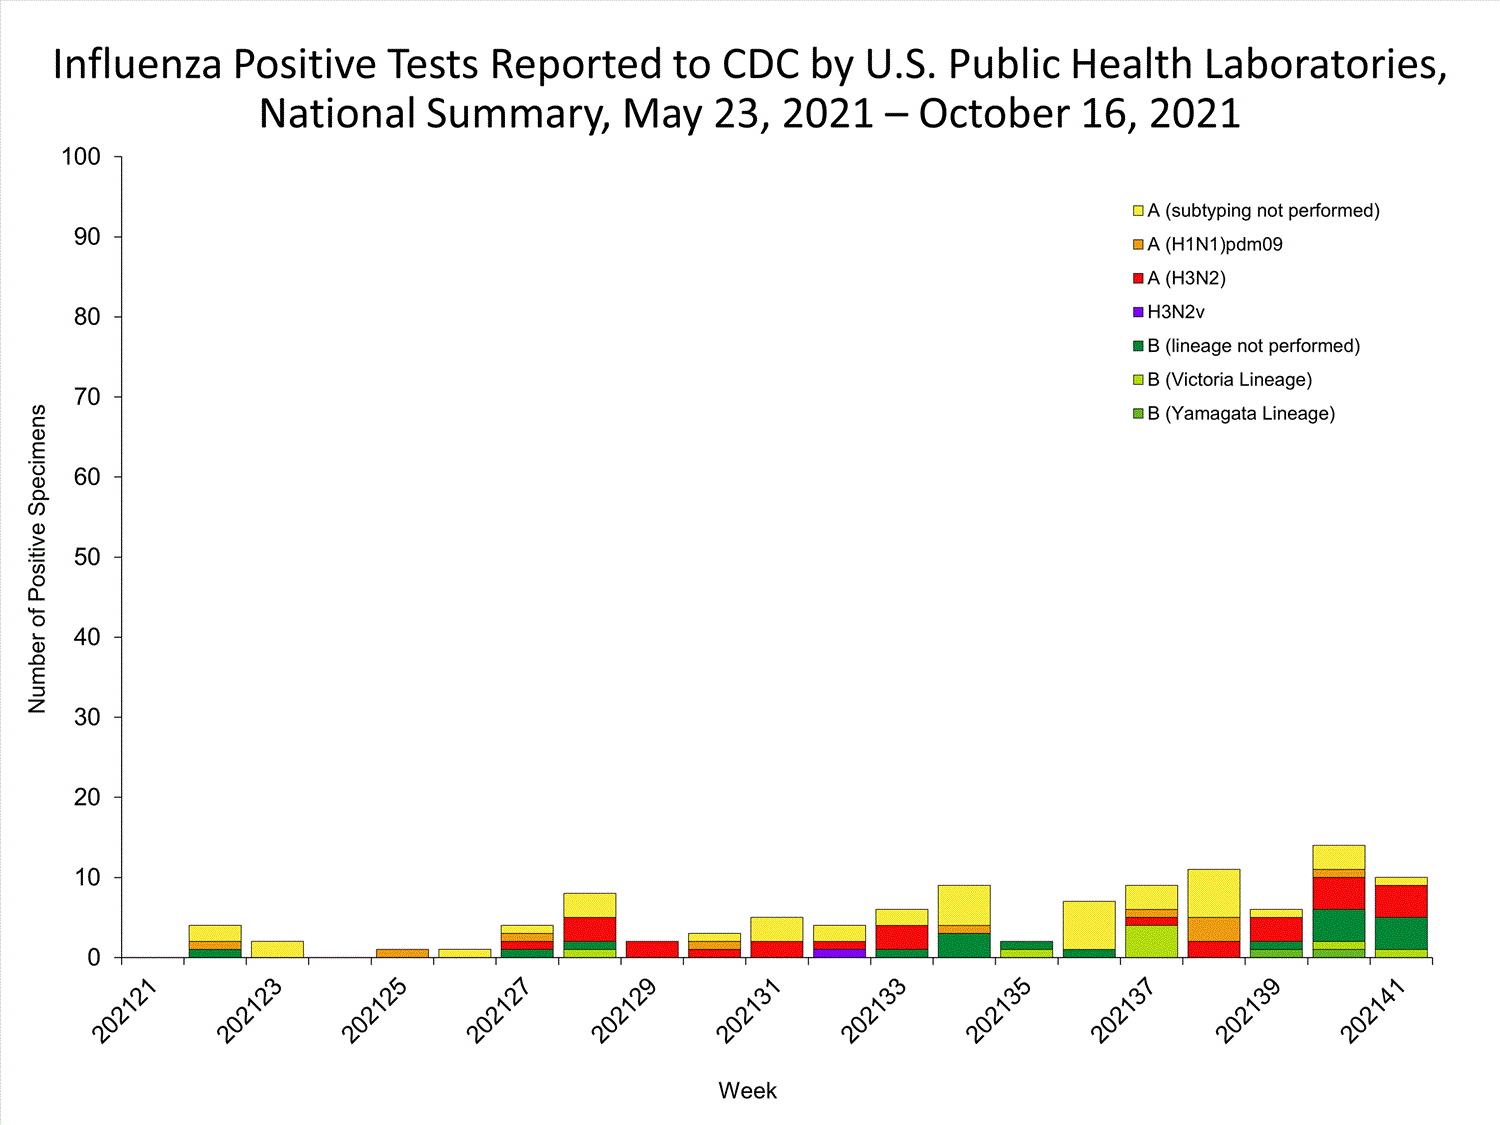
 
Weekly U.S. Influenza Surveillance Report


Updated January 28, 2022
fluview-banner2.jpg

Note: CDC is tracking the COVID-19 pandemic in a weekly publication called COVID Data Tracker Weekly Review.

Key Updates for Week 3, ending January 22, 2022

The percent of specimens testing positive for influenza remains stable, indicating that influenza virus circulation has remained at similar levels during the past two weeks, even while overall levels of respiratory illness have declined.
Viruses


Clinical Lab1.9%


positive for influenza
this week


Public Health Lab
The majority of viruses
detected are influenza A(H3N2).


Virus Characterization
Genetic characterization and antiviral susceptibility are summarized in this report.
Illness

Outpatient Respiratory Illness2.8%


of visits to a health care provider are for respiratory illness this week
(above baseline)


Outpatient Respiratory Illness: Activity Map
This week, 6 jurisdictions experienced moderate activity and 12 jurisdictions experienced high or very high activity.

Long-term Care Facilities0.8%


of facilities reported
≥ 1 influenza-positive test
among residents this week.

Severe Disease


FluSurv-NET4.3 per 100,000


cumulative hospitalization rate

HHS Protect Hospitalizations971


patients admitted to hospitals with influenza
this week.


NCHS Mortality28.4%


of deaths attributed to pneumonia, influenza, or COVID-19 this week (above threshold)

Pediatric Deaths0


influenza-associated deaths reported this week for a total of 5 so far this season

All data are preliminary and may change as more reports are received.

A description of the CDC influenza surveillance system, including methodology and detailed descriptions of each data component is available on the surveillance methods page.

Additional information on the current and previous influenza seasons for each surveillance component are available on FluView Interactive.

Key Points
  • The percent of specimens testing positive for influenza remains stable, indicating that influenza virus circulation has remained at similar levels during the past two weeks, even while overall levels of respiratory illness have declined. While influenza activity is difficult to predict, it is expected to continue for several more weeks.
  • The majority of influenza viruses detected are A(H3N2). Most of the H3N2 viruses identified so far this season are genetically closely related to the vaccine virus, but there are some antigenic differences that have developed as H3N2 viruses have continued to evolve.
  • The percentage of outpatient visits due to respiratory illness decreased nationally again this week but remains above baseline. Influenza is contributing to levels of respiratory illness, but other respiratory viruses are also circulating. The relative contribution of influenza varies by location.
  • The number of hospital admissions reported to HHS Protect declined slightly again this week.
  • The cumulative hospitalization rate in the FluSurv-NET system is higher than the rate for the entire 2020-2021 season, but lower than the rate seen at this time during the four seasons preceding the COVID-19 pandemic.
  • CDC estimates that so far this season there have been at least 2 million flu illnesses, 20,000 hospitalizations, and 1,200 deaths from flu.
  • There’s still time to get vaccinated. An annual flu vaccine is the best way to protect against flu and its potentially serious complications. CDC recommends everyone 6 months and older get a flu vaccine.
  • Flu vaccination coverage so far is lower this season compared to last.
  • Flu vaccines are available at many different locations, including pharmacies and health departments. Visit www.vaccines.gov to find a flu vaccine near you.
  • There are also flu antiviral drugs that can be used to treat flu illness.
U.S. Virologic Surveillance


Influenza A(H3N2) viruses have been the most frequently detected influenza viruses this season. For regional and state level data and age group distribution, please visit FluView Interactive. Viruses known to be associated with recent live attenuated influenza vaccine (LAIV) receipt or found upon further testing to be a vaccine virus are not included as they are not circulating influenza viruses.
Clinical Laboratories


The results of tests performed by clinical laboratories nationwide are summarized below. Data from clinical laboratories (the percentage of specimens tested that are positive for influenza) are used to monitor whether influenza activity is increasing or decreasing.

No. of specimens tested79,6671,360,940
No. of positive specimens (%)1,543 (1.9%)35,913 (2.6%)
Positive specimens by type
Influenza A1,503 (97.4%)35,104 (97.7%)
Influenza B40 (2.6%)809 (2.3%)


View Chart Data | View Full Screen Public Health Laboratories


The results of tests performed by public health laboratories nationwide are summarized below. Data from public health laboratories are used to monitor the proportion of circulating viruses that belong to each influenza subtype/lineage.
No. of specimens tested38,977490,190
No. of positive specimens50310,012
Positive specimens by type/subtype
Influenza A502 (99.8%)9,928 (99.2%)
(H1N1)pdm0905 (0.1%)
H3N2177 (100%)6,919 (99.9%)
H3N2v01 (<0.1%)
Subtyping not performed3253,003
Influenza B1 (0.2%)84 (0.8%)
Yamagata lineage01 (3.0%)
Victoria lineage032 (97.0%)
Lineage not performed151


View Chart Data | View Full Screen
Additional virologic surveillance information for current and past seasons:
Surveillance Methods | FluView Interactive: National, Regional, and State Data or Age Data
Influenza Virus Characterization


CDC performs genetic and antigenic characterization of U.S. viruses submitted from state and local public health laboratories using the Right Size Roadmap submission guidance. These data are used to compare how similar the currently circulating influenza viruses are to the reference viruses representing viruses contained in the current influenza vaccines. The data are also used to monitor evolutionary changes that continually occur in influenza viruses circulating in humans. CDC also tests susceptibility of circulating influenza viruses to antiviral medications including the neuraminidase inhibitors (oseltamivir, zanamivir, and peramivir) and the PA endonuclease inhibitor baloxavir.

CDC has genetically characterized 460 influenza viruses collected since October 3, 2021. Most of the H3N2 viruses so far are genetically closely related to the vaccine virus, but there are some antigenic differences that have developed as H3N2 viruses have continued to evolve. Virus antigenic data will be reported later this season when a sufficient number of specimens have been tested.
A/H13
6B.1A3 (100%) 5a.12 (66.7%)
5a.21 (33.3%)
A/H3437
3C.2a1b437(100%)1a1 (0.2%)
1b1 (0.2%)
2a0
2a.10
2a.2435 (99.5%)
3C.3a 03a0
B/Victoria20
V1A20 (100%) V1A0
V1A.10
V1A.39 (45.0%)
V1A.3a0
V1A.3a.10
V1A.3a.211 (55.0%)
B/Yamagata0
Y30
CDC assesses susceptibility of influenza viruses to the antiviral medications including the neuraminidase inhibitors (oseltamivir, zanamivir, and peramivir) and the PA endonuclease inhibitor baloxavir using next generation sequence analysis supplemented by laboratory assays. Information about antiviral susceptibility test methods can be found at U.S. Influenza Surveillance: Purpose and Methods | CDC.

Viruses collected in the United States since October 3, 2021, were tested for antiviral susceptibility as follows:
Neuraminidase
Inhibitors
OseltamivirViruses
Tested
4843461200
Reduced
Inhibition
(0.0%)(0.0%)(0.0%)(0.0%)(0.0%)
Highly
Reduced
Inhibition
(0.0%)(0.0%)(0.0%)(0.0%)(0.0%)
PeramivirViruses
Tested
4843461200
Reduced
Inhibition
(0.0%)(0.0%)(0.0%)(0.0%)(0.0%)
Highly
Reduced
Inhibition
(0.0%)(0.0%)(0.0%)(0.0%)(0.0%)
ZanamivirViruses
Tested
4843461200
Reduced
Inhibition
(0.0%)(0.0%)(0.0%)(0.0%)(0.0%)
Highly
Reduced
Inhibition
(0.0%)(0.0%)(0.0%)(0.0%)(0.0%)
PA Cap-Dependent Endonuclease InhibitorBaloxavirViruses
Tested
4793456200
Reduced
Susceptibility
(0.0%)(0.0%)(0.0%)(0.0%)(0.0%)
High levels of resistance to the adamantanes (amantadine and rimantadine) persist among influenza A(H1N1)pdm09 and influenza A(H3N2) viruses (the adamantanes are not effective against influenza B viruses). Therefore, use of these antivirals for treatment and prevention of influenza A virus infection is not recommended and data from adamantane resistance testing are not presented.
Outpatient Respiratory Illness Surveillance


The U.S. Outpatient Influenza-like Illness Surveillance Network (ILINet) monitors outpatient visits for influenza-like illness [ILI (fever plus cough or sore throat)], not laboratory-confirmed influenza, and will therefore capture respiratory illness visits due to infection with any pathogen that can present with similar symptoms, including influenza, SARS-CoV-2, and RSV. Due to the COVID-19 pandemic, health care-seeking behaviors have changed, and people may be accessing the health care system in alternative settings not captured as a part of ILINet or at a different point in their illness than they might have before the pandemic. Therefore, it is important to evaluate syndromic surveillance data, including that from ILINet, in the context of other sources of surveillance data to obtain a complete and accurate picture of influenza, SARS-CoV-2, and other respiratory virus activity. CDC is tracking the COVID-19 pandemic in a weekly publication called COVID Data Tracker Weekly Review. Information about other respiratory virus activity can be found on CDC’s National Respiratory and Enteric Virus Surveillance System (NREVSS) website.
Outpatient Respiratory Illness Visits


Nationwide, during week 3, 2.8% of patient visits reported through ILINet were due to respiratory illness that included fever plus a cough or sore throat, also referred to as ILI. This percentage is above the national baseline. Five of the 10 HHS regions are above their region-specific baselines (Regions 3,4,6,7, and 10), and the remaining regions are below their baselines. Multiple respiratory viruses are co-circulating, and the relative contribution of influenza virus infection to ILI varies by location.


* Effective October 3, 2021 (week 40), the ILI definition (fever plus cough or sore throat) no longer includes “without a known cause other than influenza.”


View Chart Data (current season only) | View Full ScreenOutpatient Respiratory Illness Visits by Age Group


More than 70% of ILINet participants provide both the number of patient visits for respiratory illness and the total number of patient visits for the week broken out by age group. Data from this subset of providers are used to calculate the percentages of patient visits for respiratory illness by age group.

The percentage of visits for respiratory illness reported in ILINet are trending downward for all age groups (0–4 years, 5–24 years, 25-49 years, 50–64 years, and 65+ years).


* Effective October 3, 2021 (week 40), the ILI definition (fever plus cough or sore throat) no longer includes “without a known cause other than influenza.”

View Chart Data | View Full Screen
Outpatient Respiratory Illness Activity Map


Data collected in ILINet are used to produce a measure of ILI activity* by state/jurisdiction and Core Based Statistical Areas (CBSA).
Week 3
(Week ending
Jan. 22, 2022)
Week 2
(Week ending
Jan. 15, 2022)
Week 3
(Week ending
Jan. 22, 2022)
Week 2
(Week ending
Jan. 15, 2022)
Very High121014
High11144487
Moderate61271103
Low1014151159
Minimal2513379305
Insufficient Data20274261


*Data collected in ILINet may disproportionally represent certain populations within a jurisdiction or CBSA, and therefore, may not accurately depict the full picture of influenza activity for the entire jurisdiction or CBSA. Differences in the data presented here by CDC and independently by some health departments likely represent differing levels of data completeness with data presented by the health department likely being the more complete.
Additional information about medically attended visits for ILI for current and past seasons:
Surveillance Methods | FluView Interactive: National, Regional, and State Data or ILI Activity Map
Long-term Care Facility (LTCF) Surveillance


LTCFs (e.g., nursing homes/skilled nursing, long-term care for the developmentally disabled, and assisted living facilities) from all 50 states and U.S. territories report data on influenza virus infections among residents through the National Healthcare Safety Network (NHSN) Long-term Care Facility Component. During week 3, 114 (0.8%) of 14,249 reporting LTCFs reported at least one influenza positive test among their residents.


View Chart Dataexcel icon | View Full Screen
Additional information about long-term care facility surveillance:
Surveillance Methods | Additional Dataexternal icon
Hospitalization Surveillance

FluSurv-NET


The Influenza Hospitalization Surveillance Network (FluSurv-NET) conducts population-based surveillance for laboratory-confirmed influenza-related hospitalizations in select counties in 14 states and represents approximately 9% of the U.S. population. FluSurv-NET hospitalization data are preliminary. As data are received each week, prior case counts and rates are updated accordingly.

A total of 1,250 laboratory-confirmed influenza-associated hospitalizations were reported by FluSurv-NET sites between October 1, 2021, and January 22, 2022. The overall cumulative hospitalization rate is 4.3 per 100,000 population. This cumulative hospitalization rate is higher than the cumulative in-season hospitalization rate observed for week 3 during the 2020-2021 season (0.5 per 100,000), but lower than the in-season rates observed for week 3 during the 4 seasons preceding the COVID-19 pandemic (these ranged from 14.8 to 41.9 per 100,000 during the 2016-17 through 2019-20 seasons).

When examining rates by age, the highest rate of hospitalization per 100,000 population was among adults aged ≥65 years (11.3); within this group, rates were highest among adults aged ≥85 years (24.0). Among persons aged <65 years, hospitalization rates per 100,000 population were highest among children aged 0-4 years (6.2) followed by adults aged 50-64 years (4.0). When examining rates by race and ethnicity, the highest rate of hospitalization per 100,000 population was among non-Hispanic American Indian or Alaska Native persons (5.4) followed by non-Hispanic Black persons (5.0).

Among 1,250 hospitalizations, 1,178 (94.2%) were associated with influenza A virus, 62 (5.0%) with influenza B virus, 5 (0.4%) with influenza A virus and influenza B virus co-infection, and 5 (0.4%) with influenza virus for which the type was not determined. Among 295 hospitalizations with influenza A subtype information, 292 (99.0%) were A(H3N2) and 3 (1.0%) were A(H1N1)pdm09. Based on preliminary data, of the 1,250 laboratory-confirmed influenza-associated hospitalizations, 1.9% also tested positive for SARS-CoV-2.

Among 444 hospitalized adults with information on underlying medical conditions, 89.6% had at least one reported underlying medical condition. Among 52 hospitalized children with information on underlying medical conditions, 55.8% had at least one reported underlying medical condition; the most commonly reported was asthma.


View Full Screen
Additional FluSurv-NET hospitalization surveillance information for current and past seasons and additional age groups:
Surveillance Methods |FluView Interactive: Rates by Age, Sex, and Race/Ethnicity or Data on Patient Characteristics

FluSurv-Net data are used to generate national estimates of the total numbers of influenza cases, medical visits, hospitalizations, and deaths. This season, CDC is reporting preliminary cumulative in-season estimates, which are available at https://www.cdc.gov/flu/about/burden...-estimates.htm
HHS-Protect Hospitalization Surveillance


Hospitals report to HHS-Protect the number of patients admitted with laboratory-confirmed influenza. During week 3, 971 patients with laboratory-confirmed influenza were admitted to the hospital.


View Chart Dataexcel icon | View Full Screen
Additional HHS Protect hospitalization surveillance information:
Surveillance Methods | Additional Dataexternal icon
Mortality Surveillance

National Center for Health Statistics (NCHS) Mortality Surveillance


Based on NCHS mortality surveillance data available on January 27, 2022, 28.4% of the deaths that occurred during the week ending January 22, 2022 (week 3), were due to pneumonia, influenza, and/or COVID-19 (PIC). This percentage is above the epidemic threshold of 7.1% for this week. Among the 5,940 PIC deaths reported for this week, 5,160 had COVID-19 listed as an underlying or contributing cause of death on the death certificate, and 27 listed influenza, indicating that current PIC mortality is due primarily to COVID-19 and not influenza. The data presented are preliminary and may change as more data are received and processed.


View Chart Dataexcel icon | View Full Screen
Additional pneumonia, influenza and COVID-19 mortality surveillance information for current and past seasons:
Surveillance Methods | FluView Interactive
Influenza-Associated Pediatric Mortality


No influenza-associated pediatric deaths were reported to CDC during week 3.

A total of five influenza-associated pediatric deaths occurring during the 2021-2022 season have been reported to CDC.


View Full Screen
Additional pediatric mortality surveillance information for current and past seasons:
Surveillance Methods | FluView Interactive


Additional National and International Influenza Surveillance Information


FluView Interactive: FluView includes enhanced web-based interactive applications that can provide dynamic visuals of the influenza data collected and analyzed by CDC. These FluView Interactive applications allow people to create customized, visual interpretations of influenza data, as well as make comparisons across flu seasons, regions, age groups and a variety of other demographics.

National Institute for Occupational Safety and Health: Monthly surveillance data on the prevalence of health-related workplace absenteeism among full-time workers in the United States are available from NIOSH.

U.S. State and local influenza surveillance: Select a jurisdiction below to access the latest local influenza information. World Health Organization:
Additional influenza surveillance information from participating WHO member nations is available through
FluNetexternal icon and the Global Epidemiology Reports.external icon

WHO Collaborating Centers for Influenza:
Australiaexternal icon, Chinaexternal icon, Japanexternal icon, the United Kingdomexternal icon, and the United States (CDC in Atlanta, Georgia)

Europe:
The most up-to-date influenza information from Europe is available from WHO/Europe and the European Centre for Disease Prevention and Controlexternal icon.

Public Health Agency of Canada:
The most up-to-date influenza information from Canada is available in Canada’s weekly FluWatch reportexternal icon.

Public Health England:
The most up-to-date influenza information from the United Kingdom is available from Public Health Englandexternal icon.

Any links provided to non-Federal organizations are provided solely as a service to our users. These links do not constitute an endorsement of these organizations or their programs by CDC or the Federal Government, and none should be inferred. CDC is not responsible for the content of the individual organization web pages found at these links.

A description of the CDC influenza surveillance system, including methodology and detailed descriptions of each data component is available on the surveillance methods page.

Page last reviewed: January 28, 2022, 11:00 AM

https://www.cdc.gov/flu/weekly/index.htm
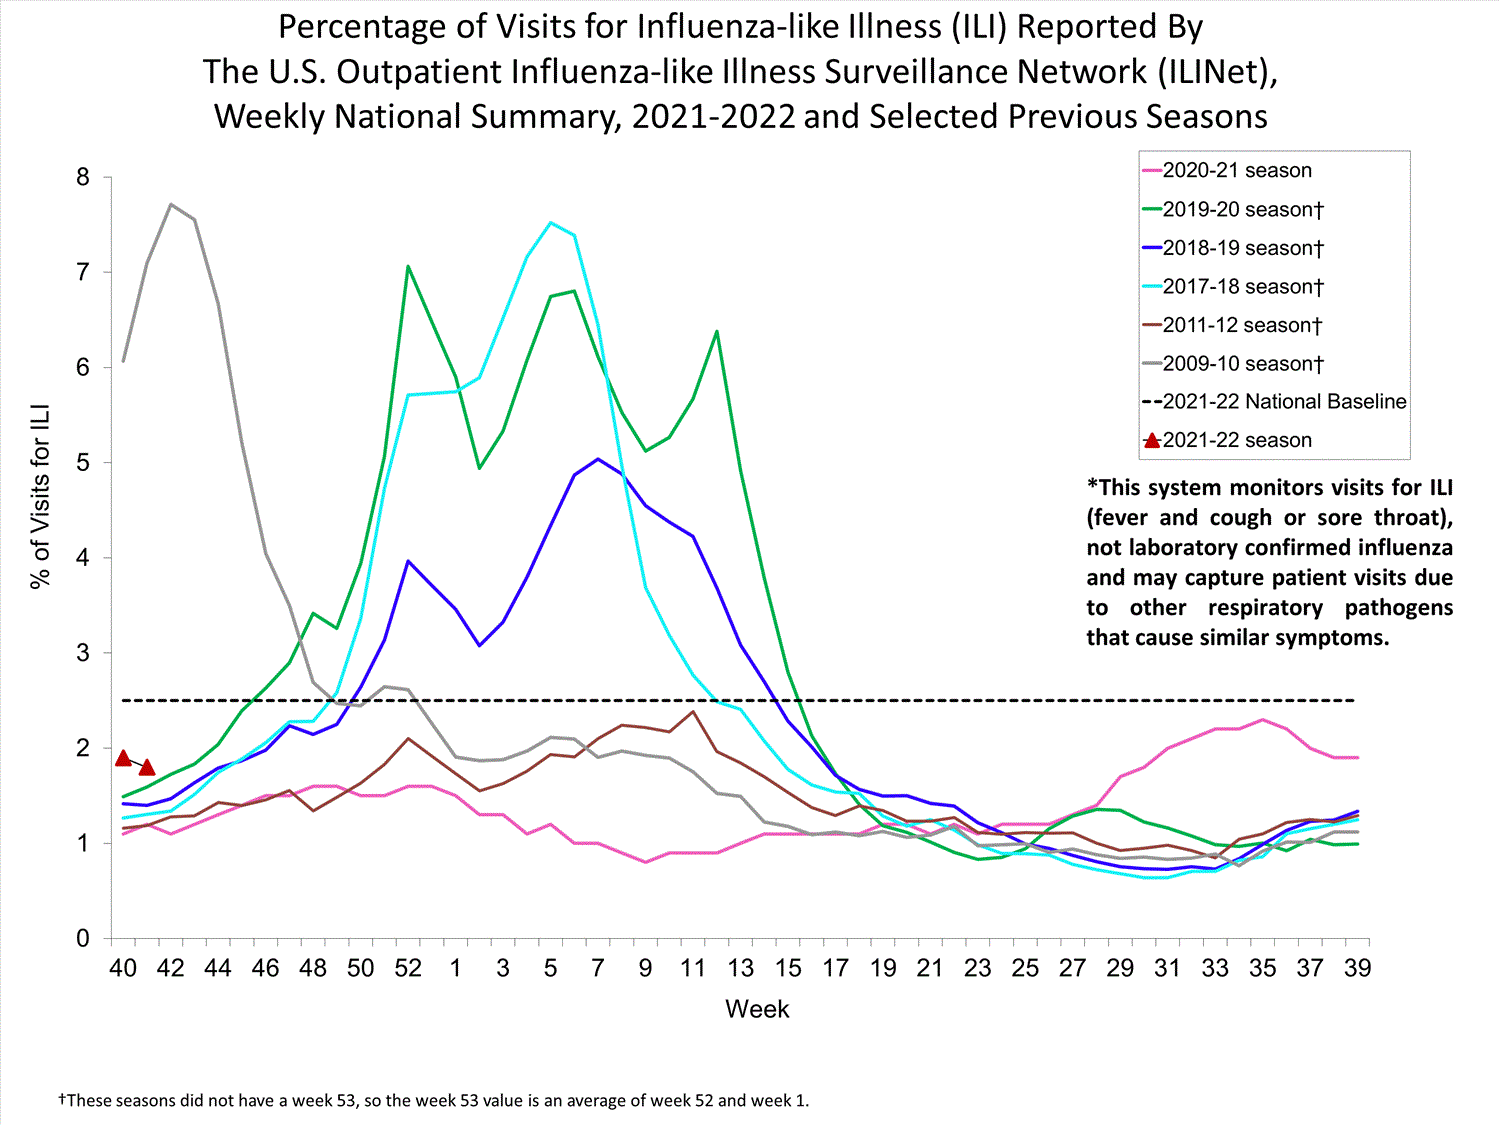
 
Back
Top