• FluTrackers.com Inc. does not provide medical advice. Information on this web site is collected from various internet resources, and the FluTrackers board of directors makes no warranty to the safety, efficacy, correctness or completeness of the information posted on this site by any author or poster. The information collated here is for instructional and/or discussion purposes only and is NOT intended to diagnose or treat any disease, illness, or other medical condition. Every individual reader or poster should seek advice from their personal physician/healthcare practitioner before considering or using any interventions that are discussed on this website. By continuing to access this website you agree to consult your personal physican before using any interventions posted on this website, and you agree to hold harmless FluTrackers.com Inc., the board of directors, the members, and all authors and posters for any effects from use of any medication, supplement, vitamin or other substance, device, intervention, etc. mentioned in posts on this website, or other internet venues referenced in posts on this website.
  • We are not asking for any donations. Do not donate to any entity who says they are raising funds for us.

US FluView 2020 - 2021 + season end report

sharon sanders

Editor-in-Chief & President
FluView Summary ending on October 3, 2020


fluview-banner2.jpg


Note: CDC is tracking the COVID-19 pandemic in a weekly publication called COVIDView.

Key Updates for Week 40, ending October 3, 2020

Seasonal influenza activity in the United States remains low.
Viruses


Clinical Labs
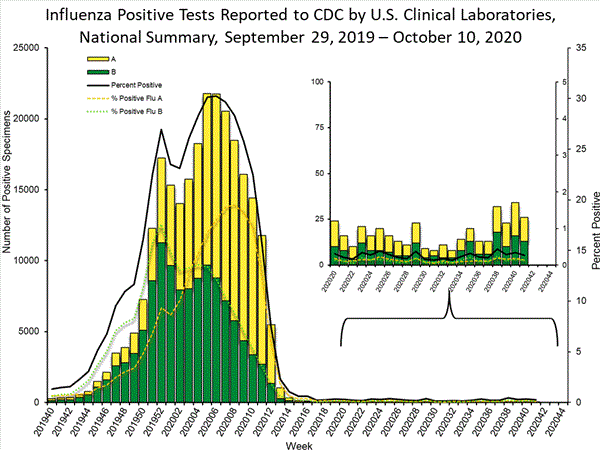
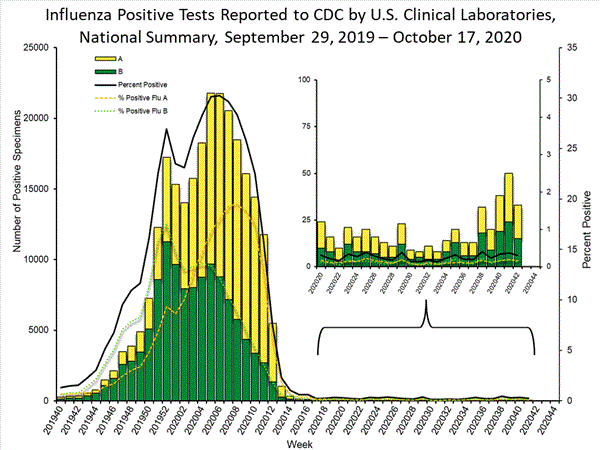
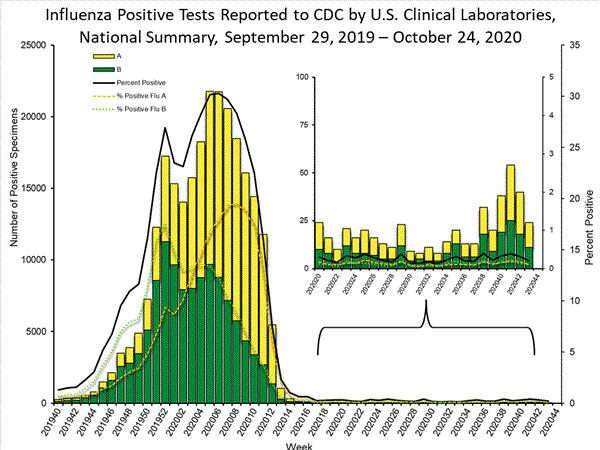
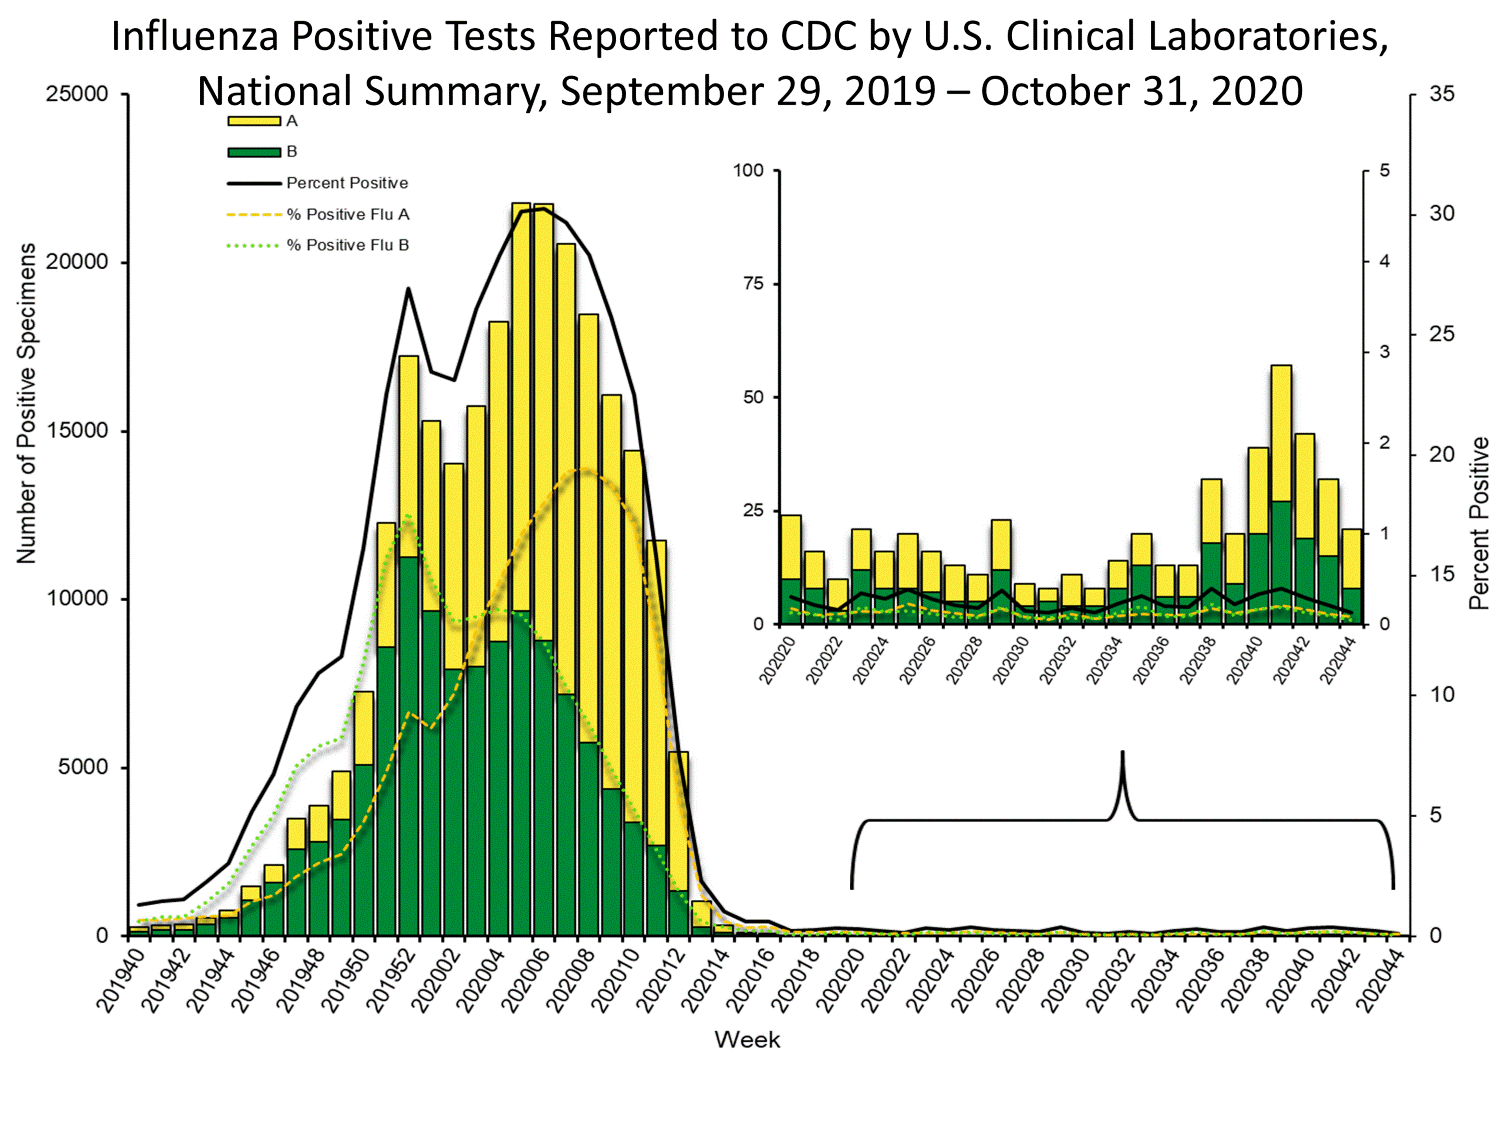
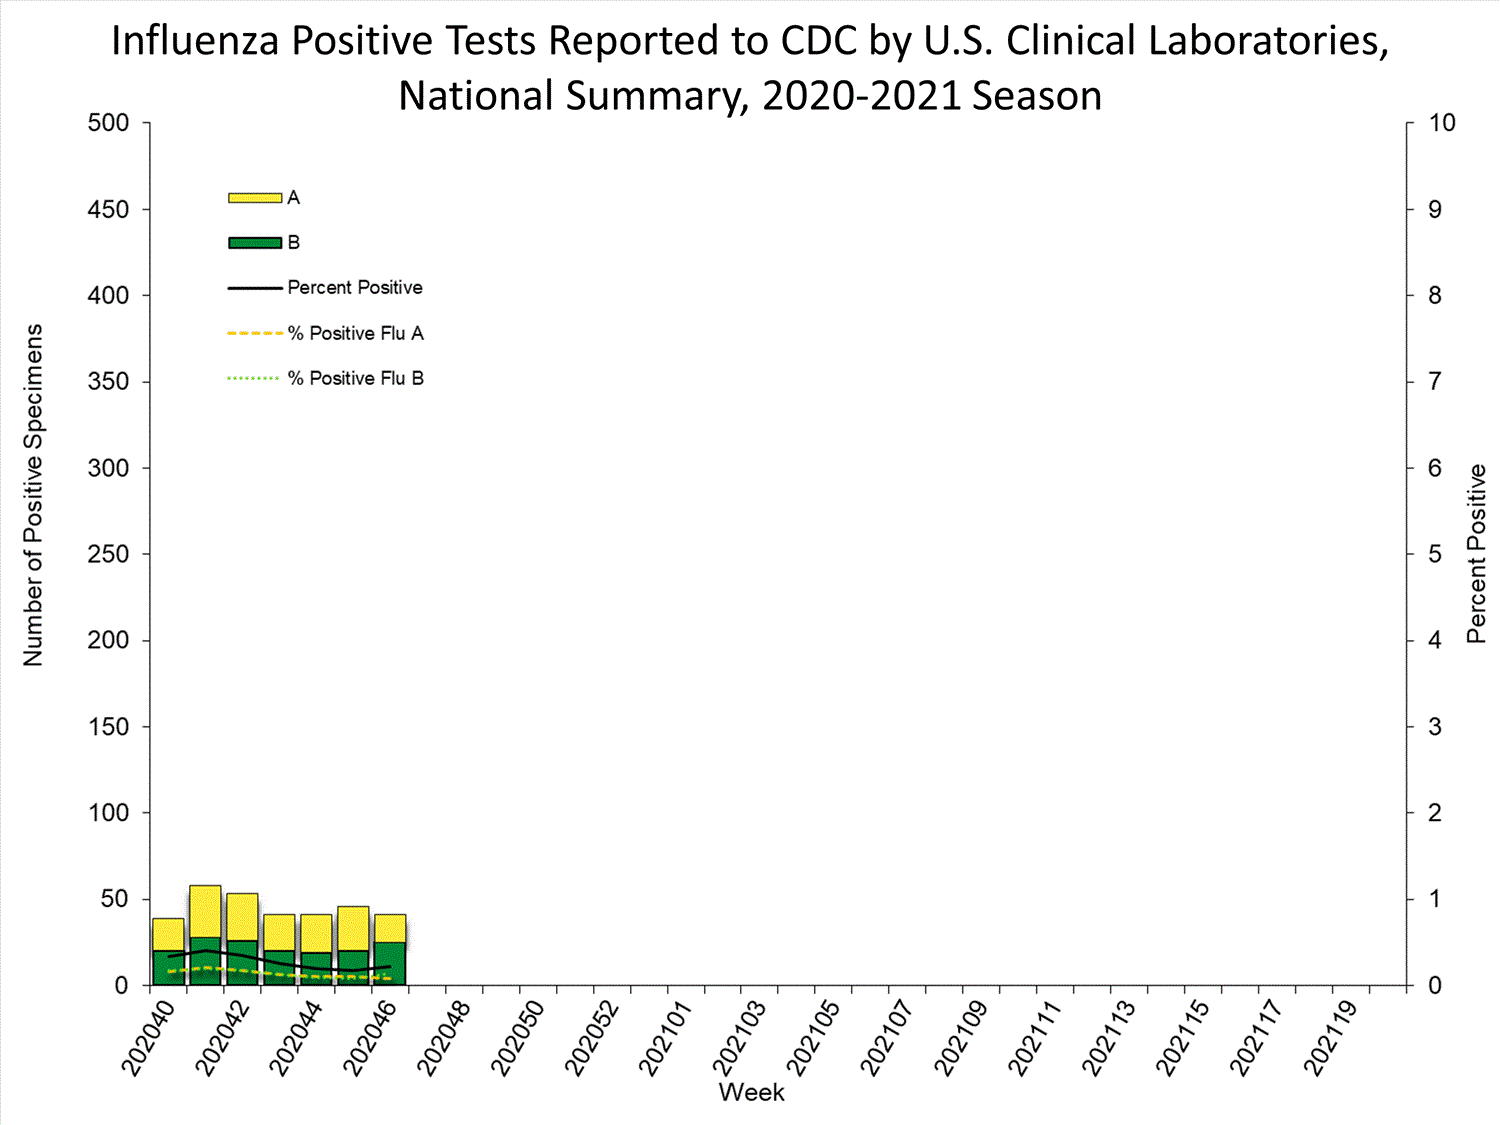
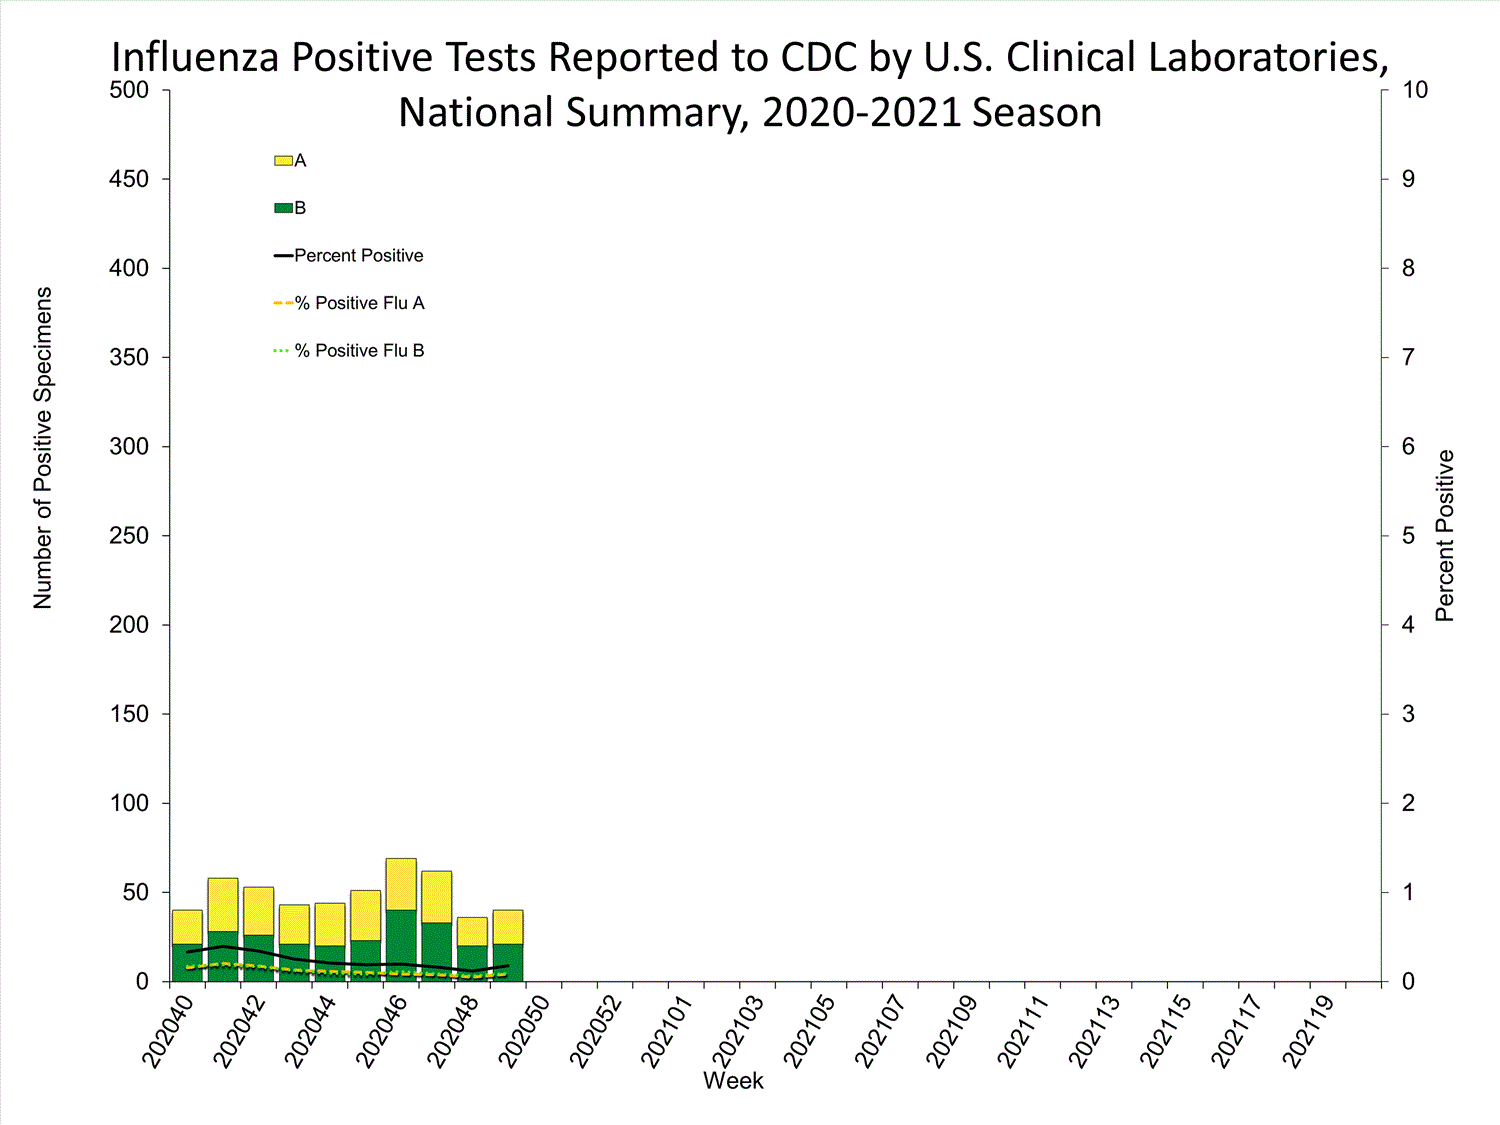
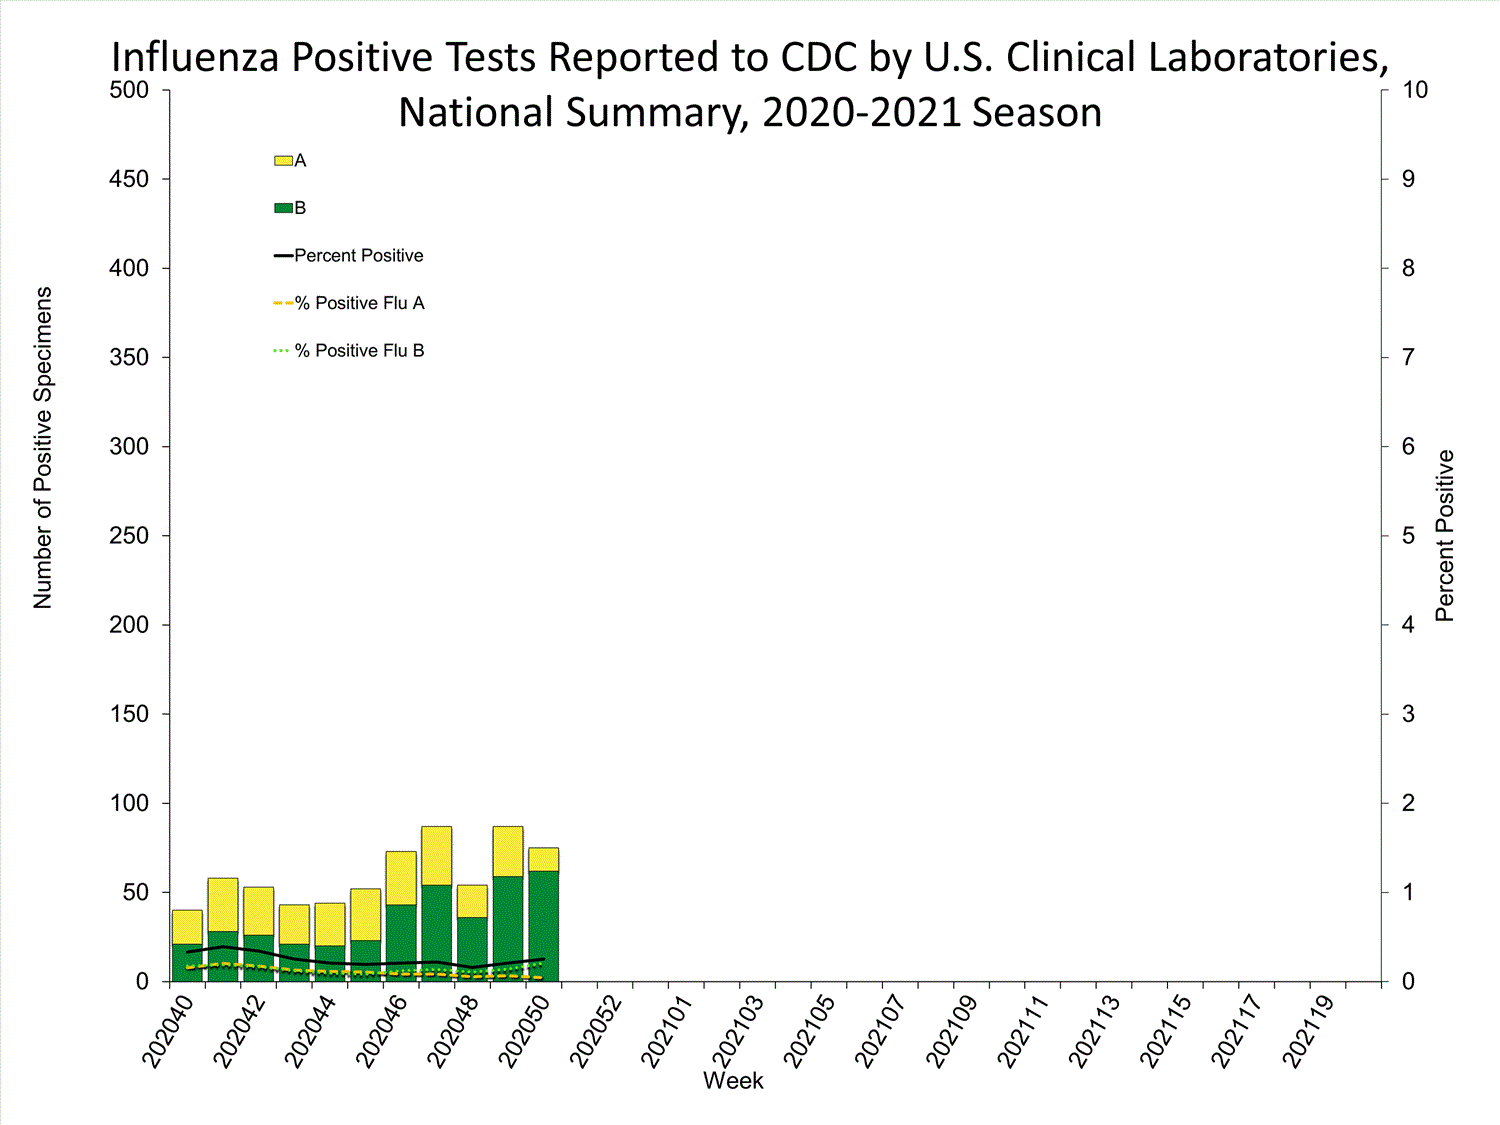
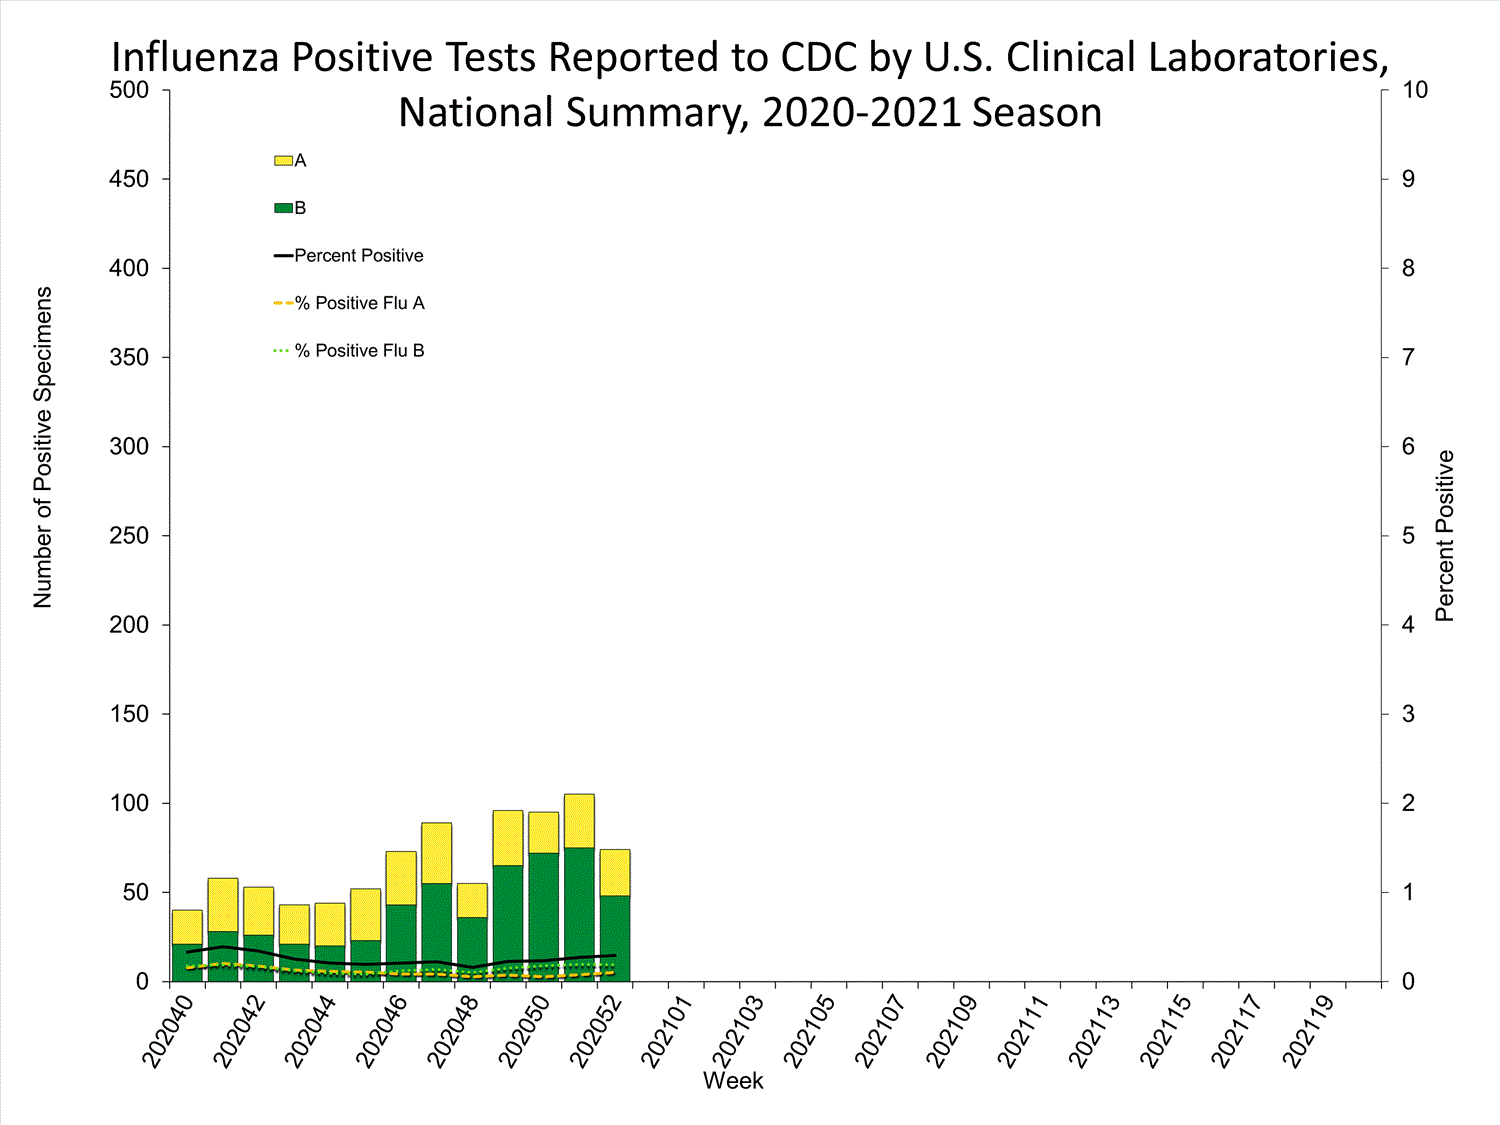
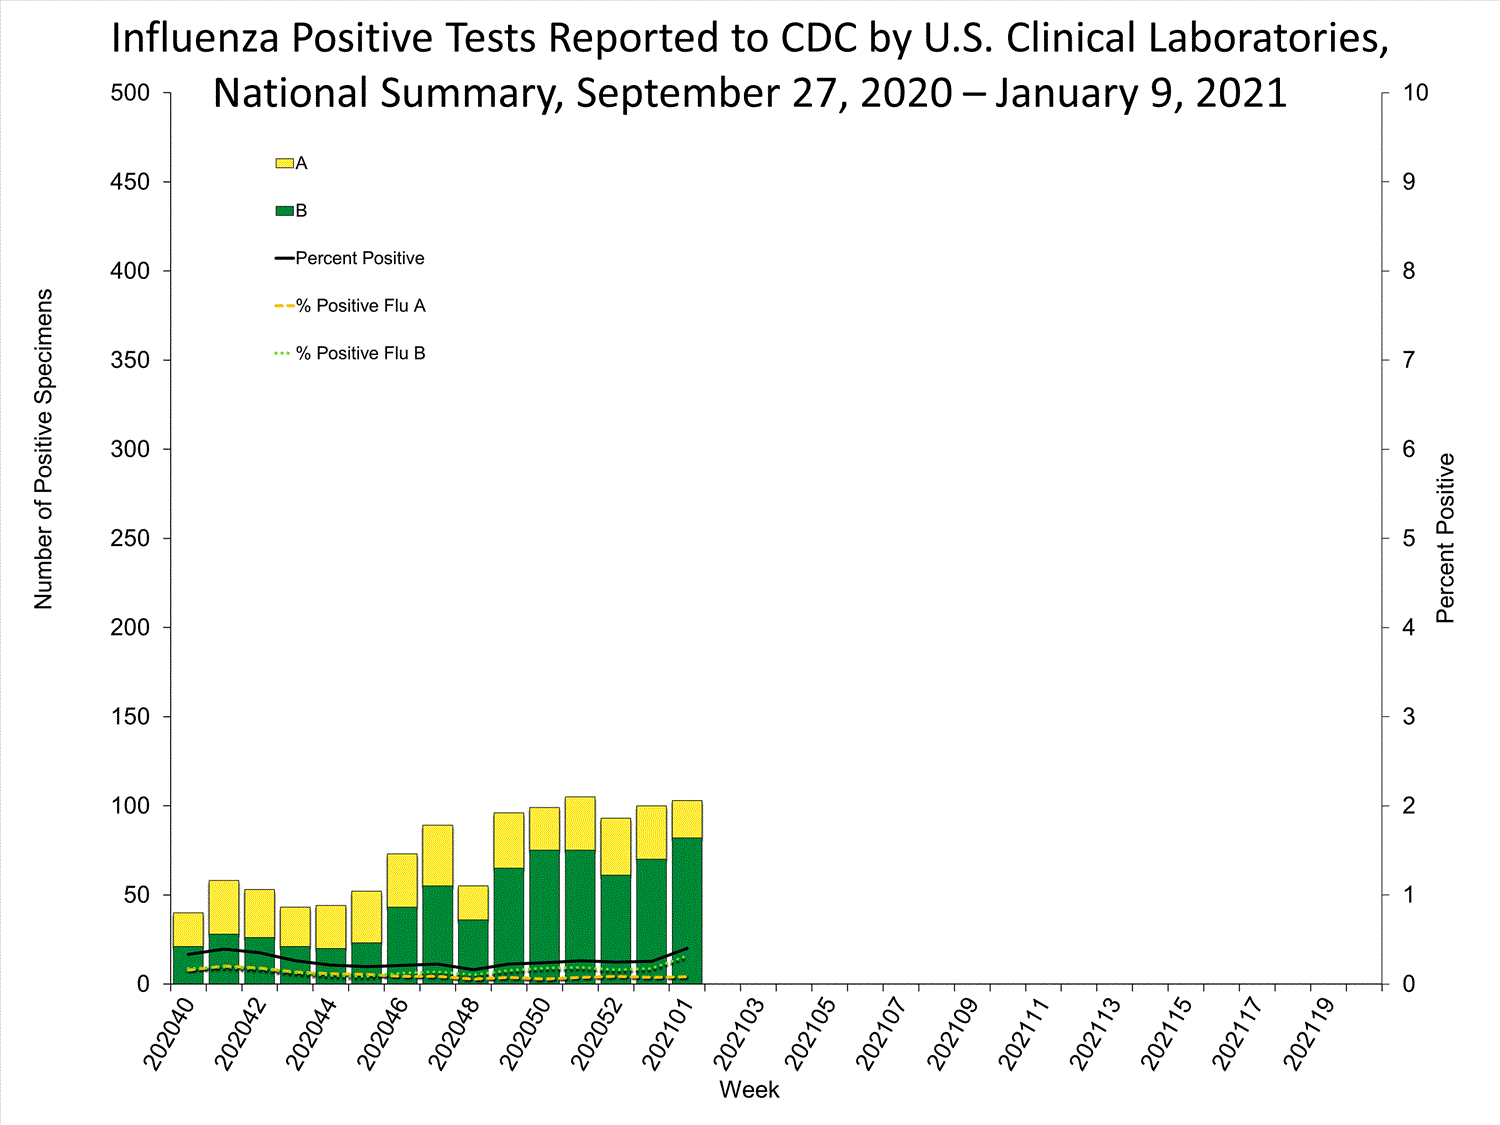
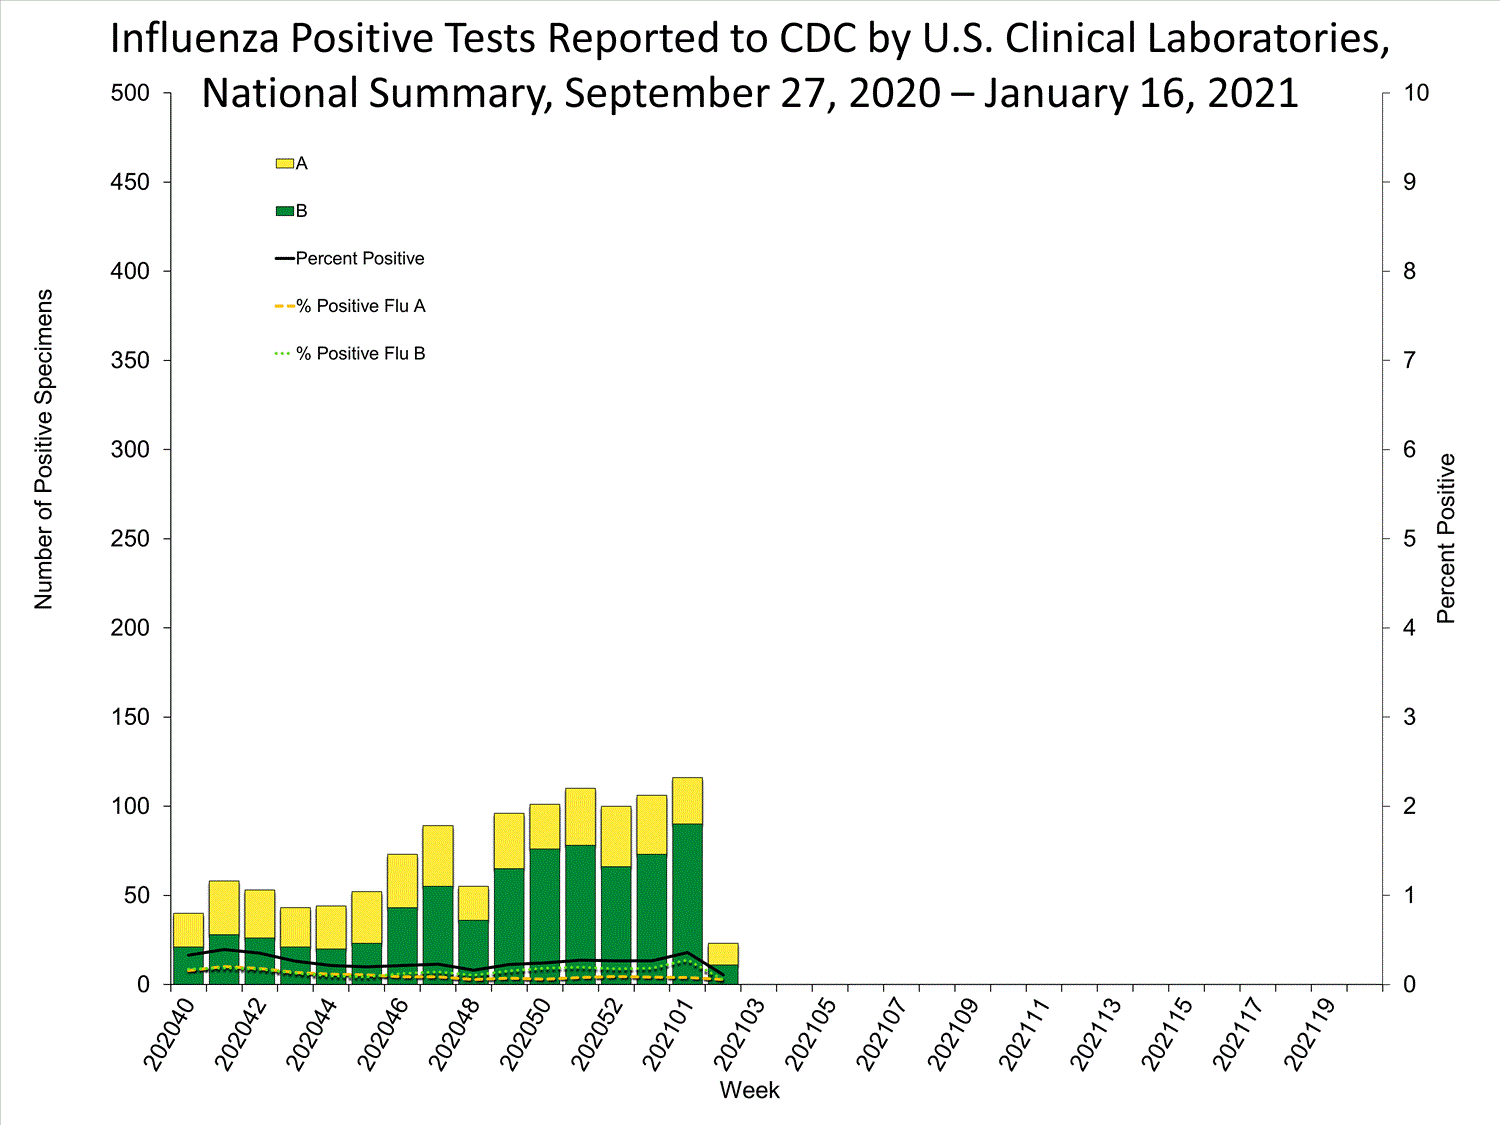
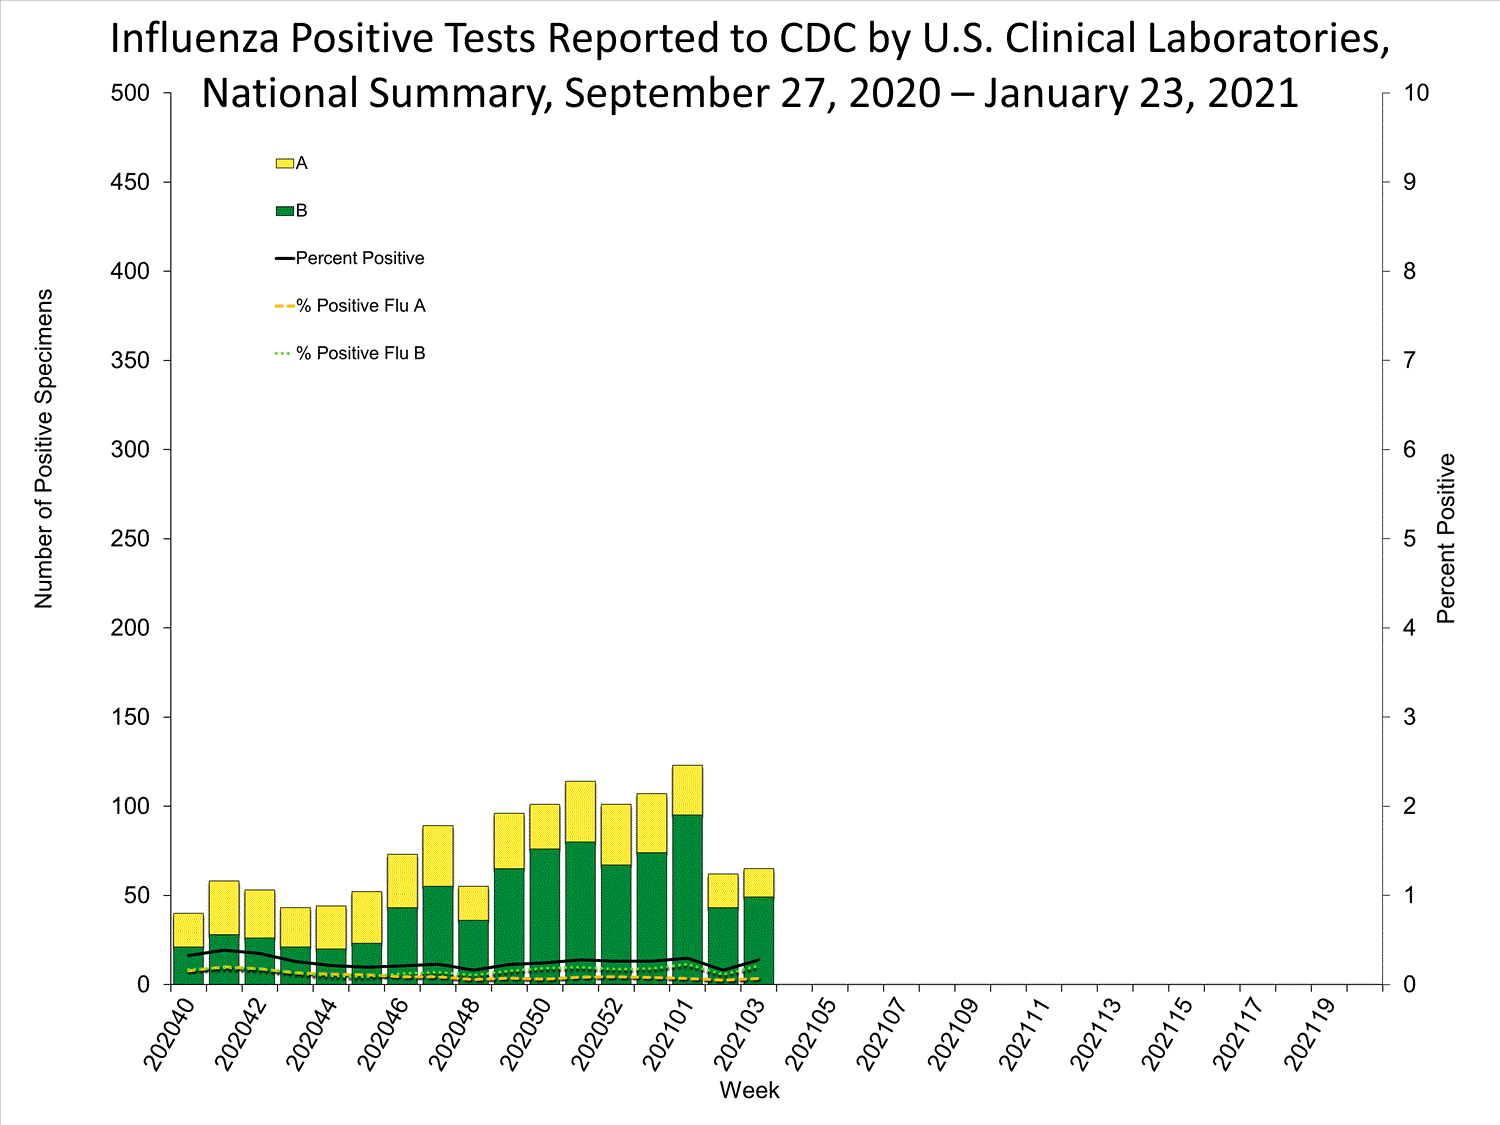
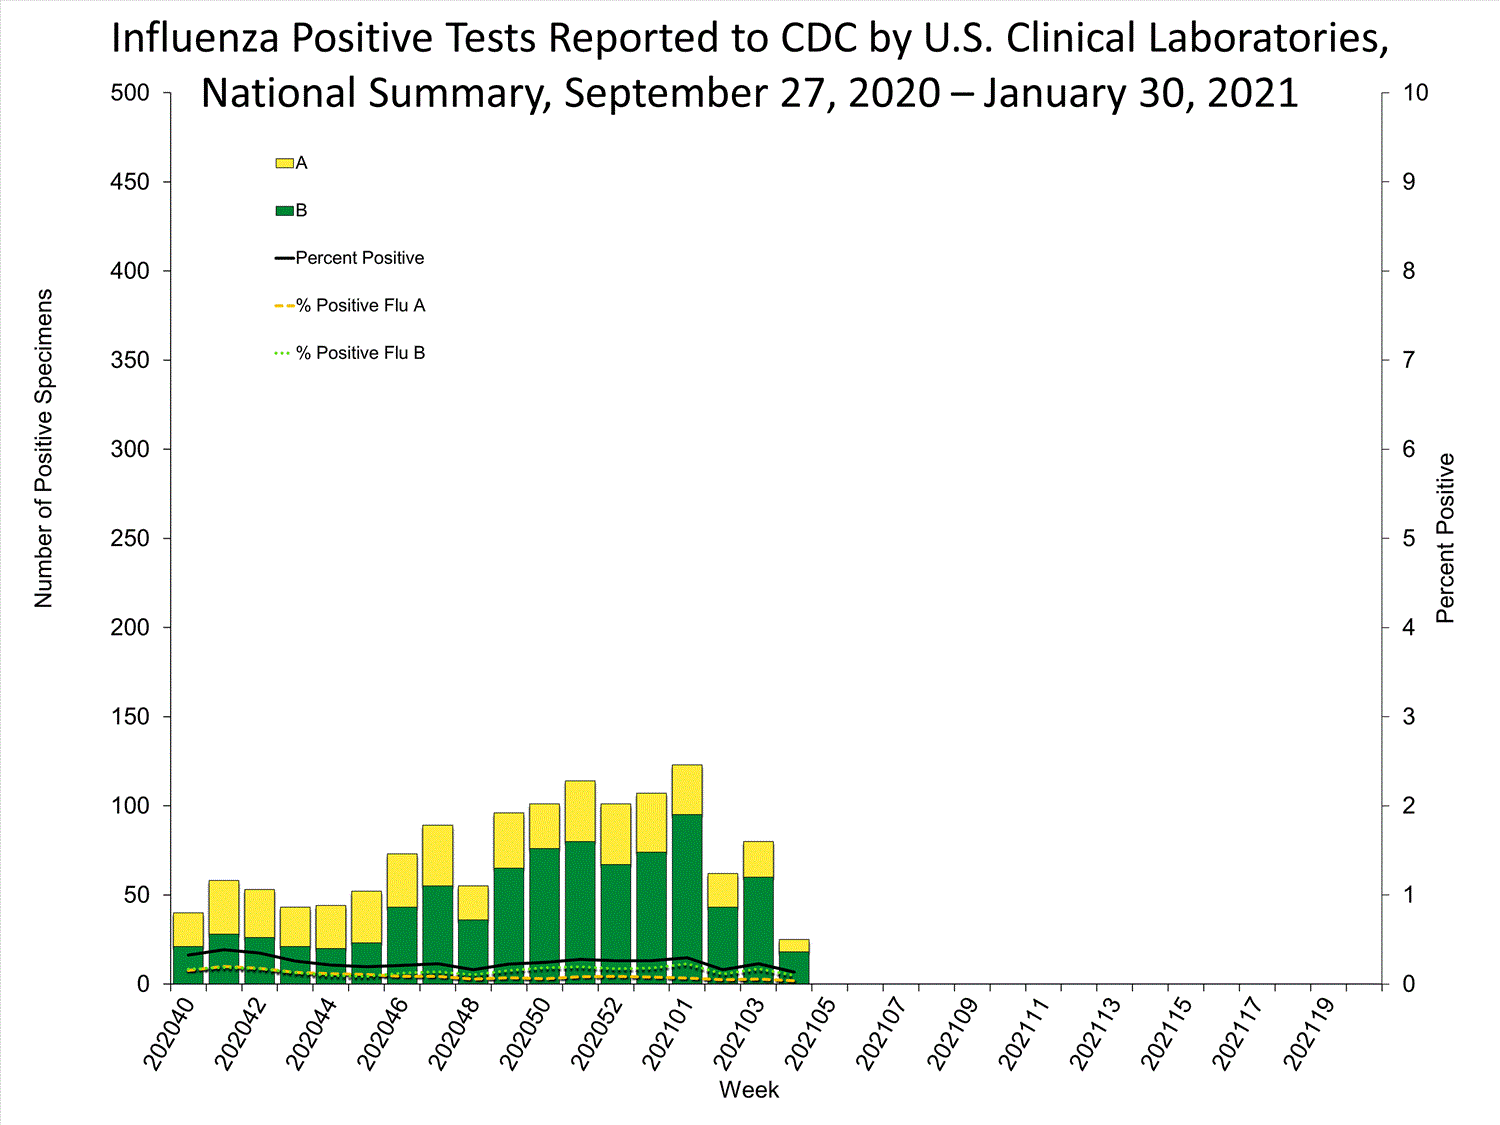
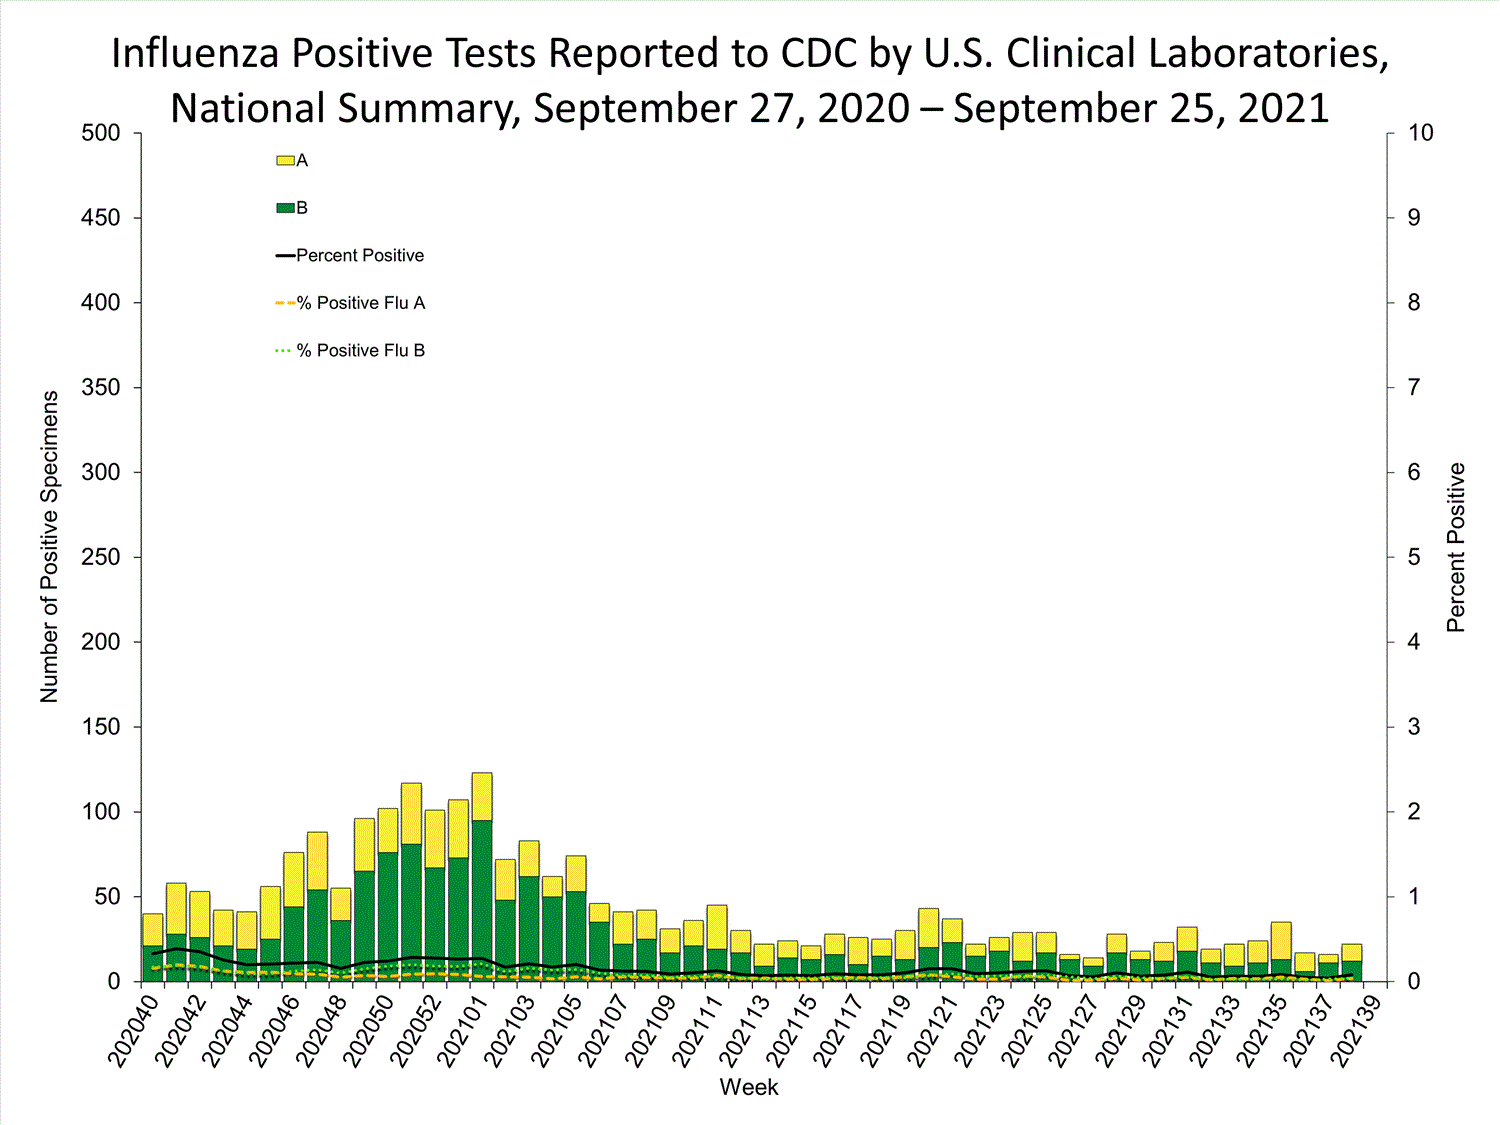
The percentage of respiratory specimens testing positive for influenza at clinical laboratories is 0.21% this week.

Public Health Labs
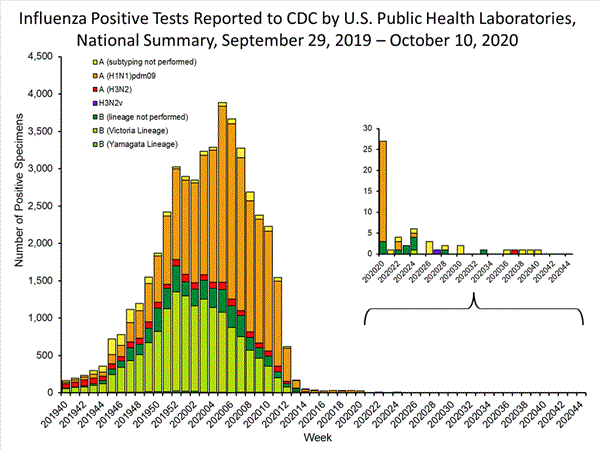
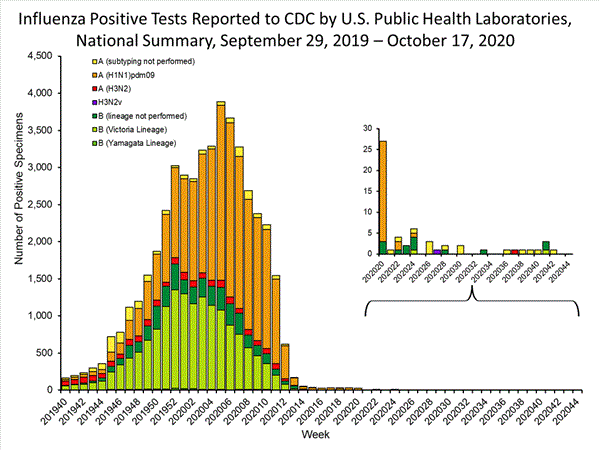
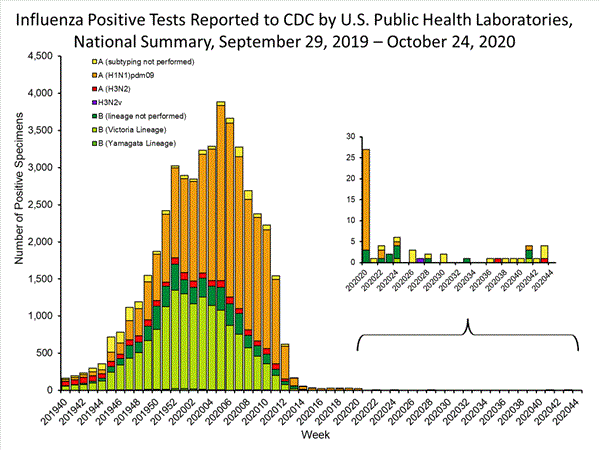
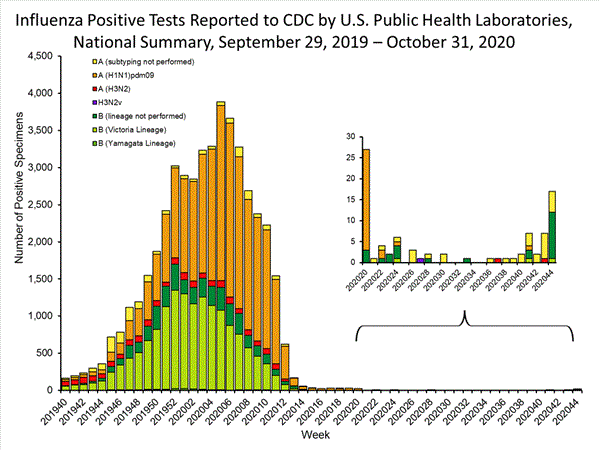
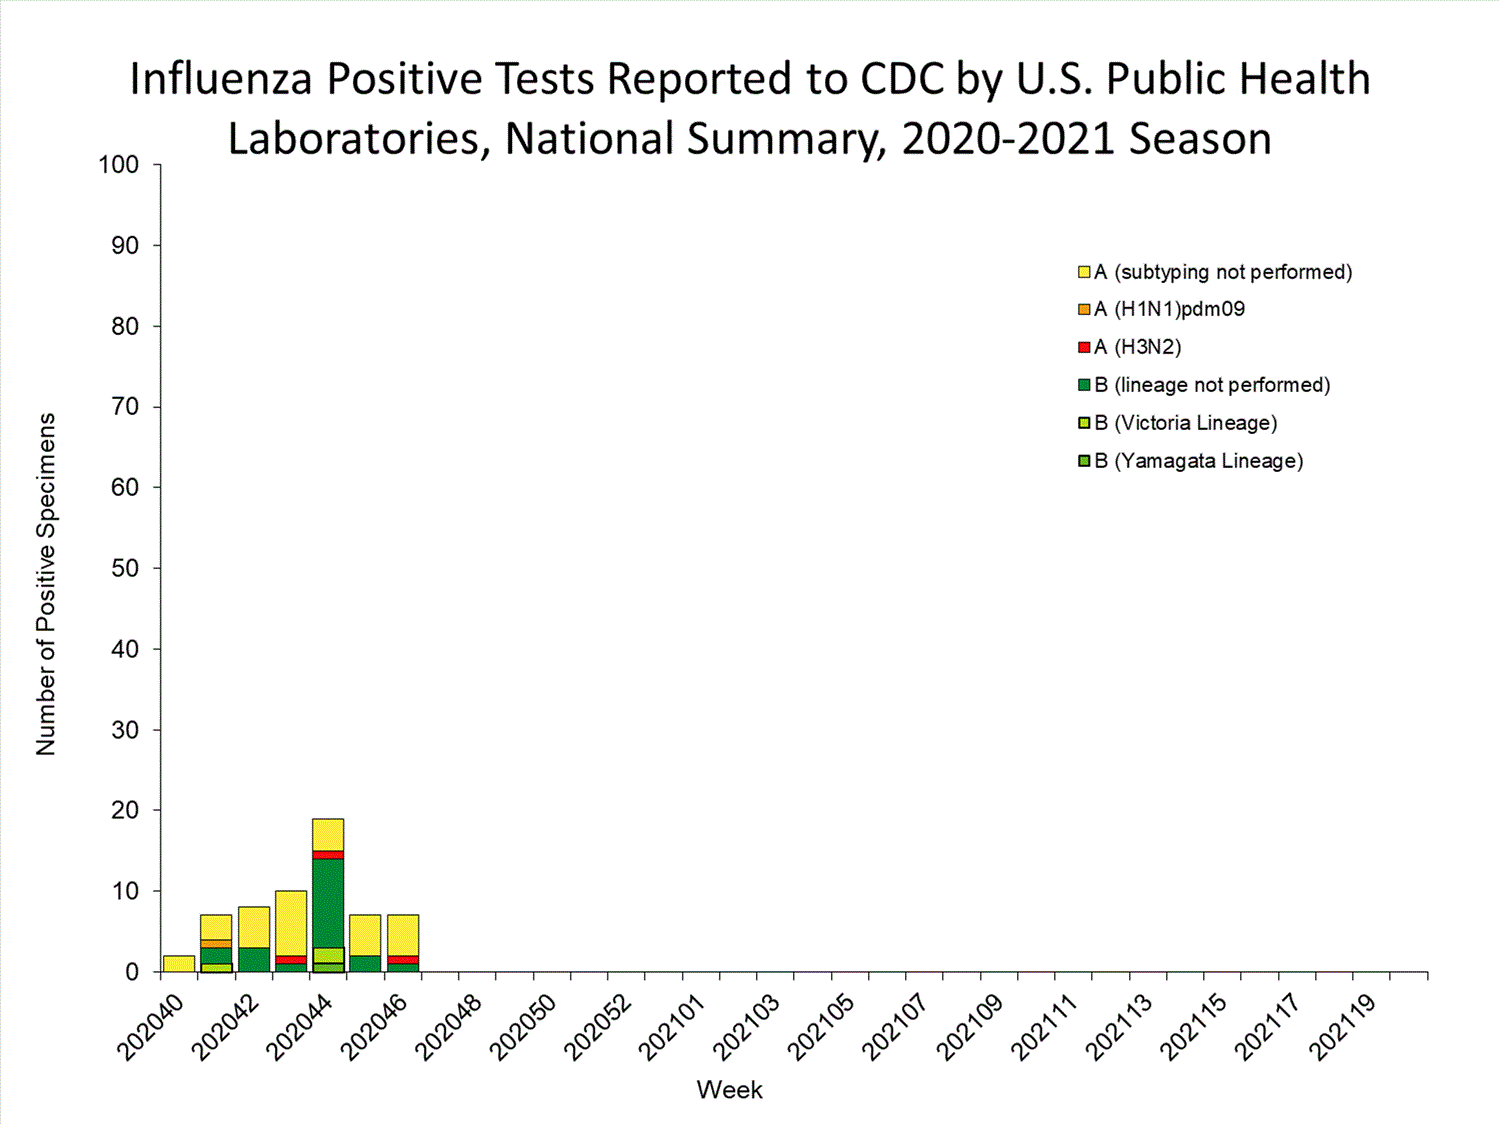
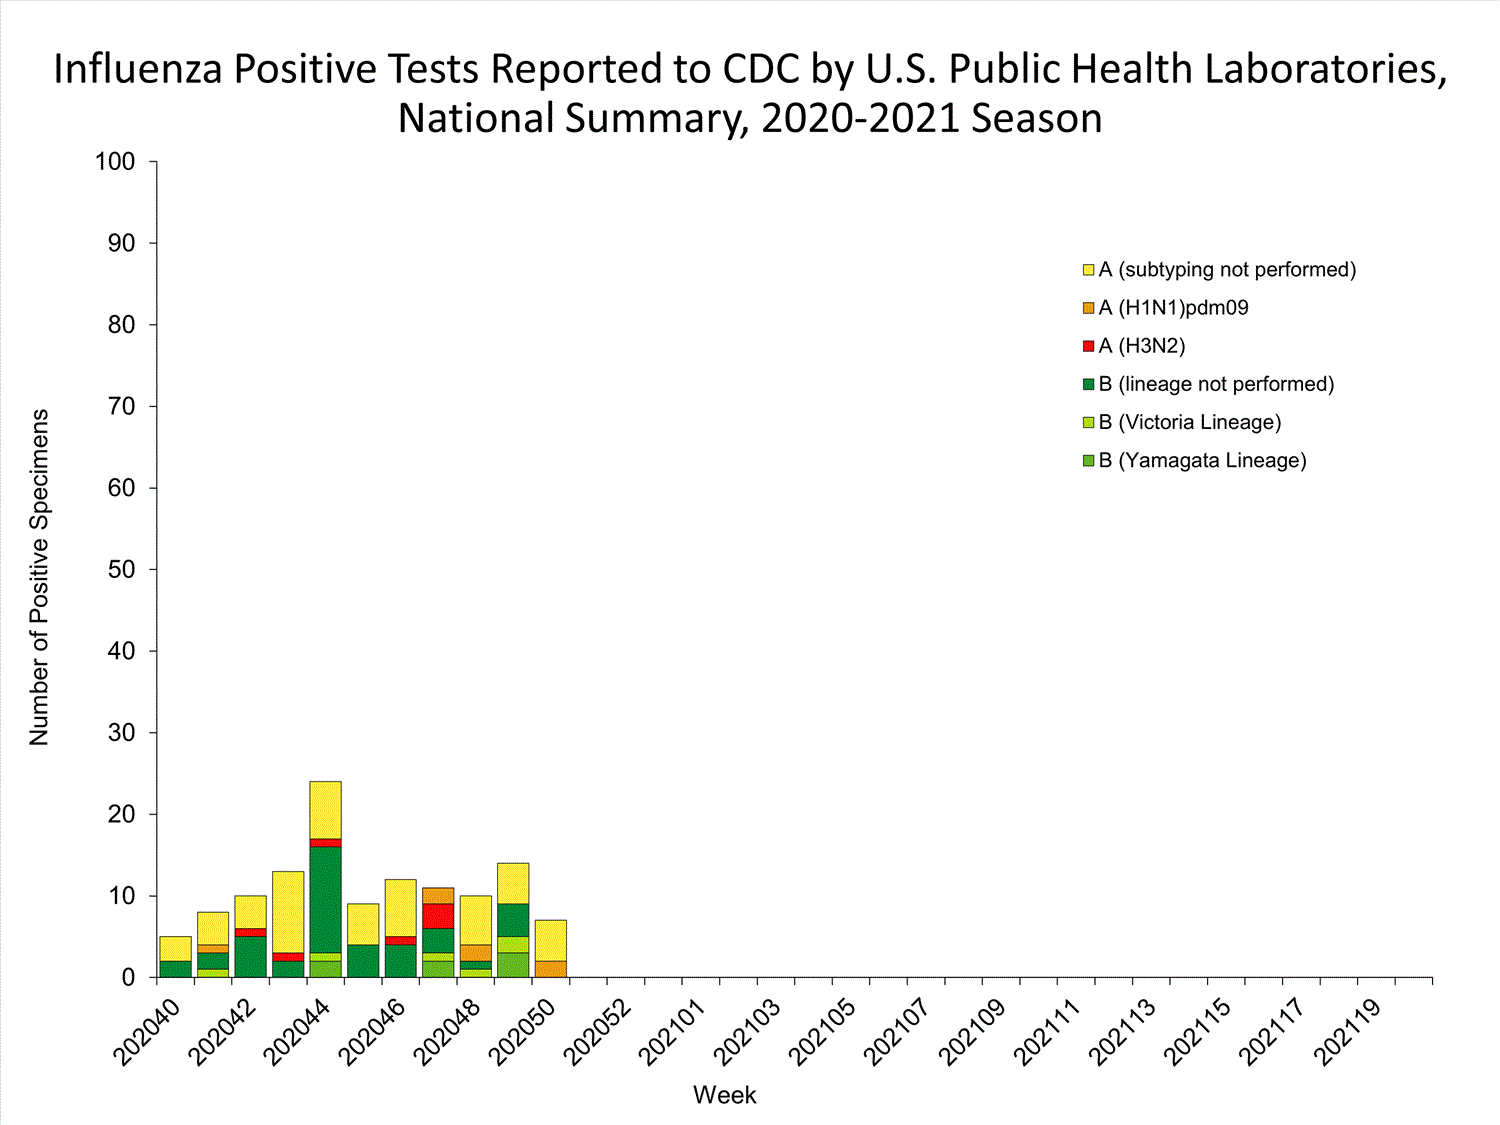
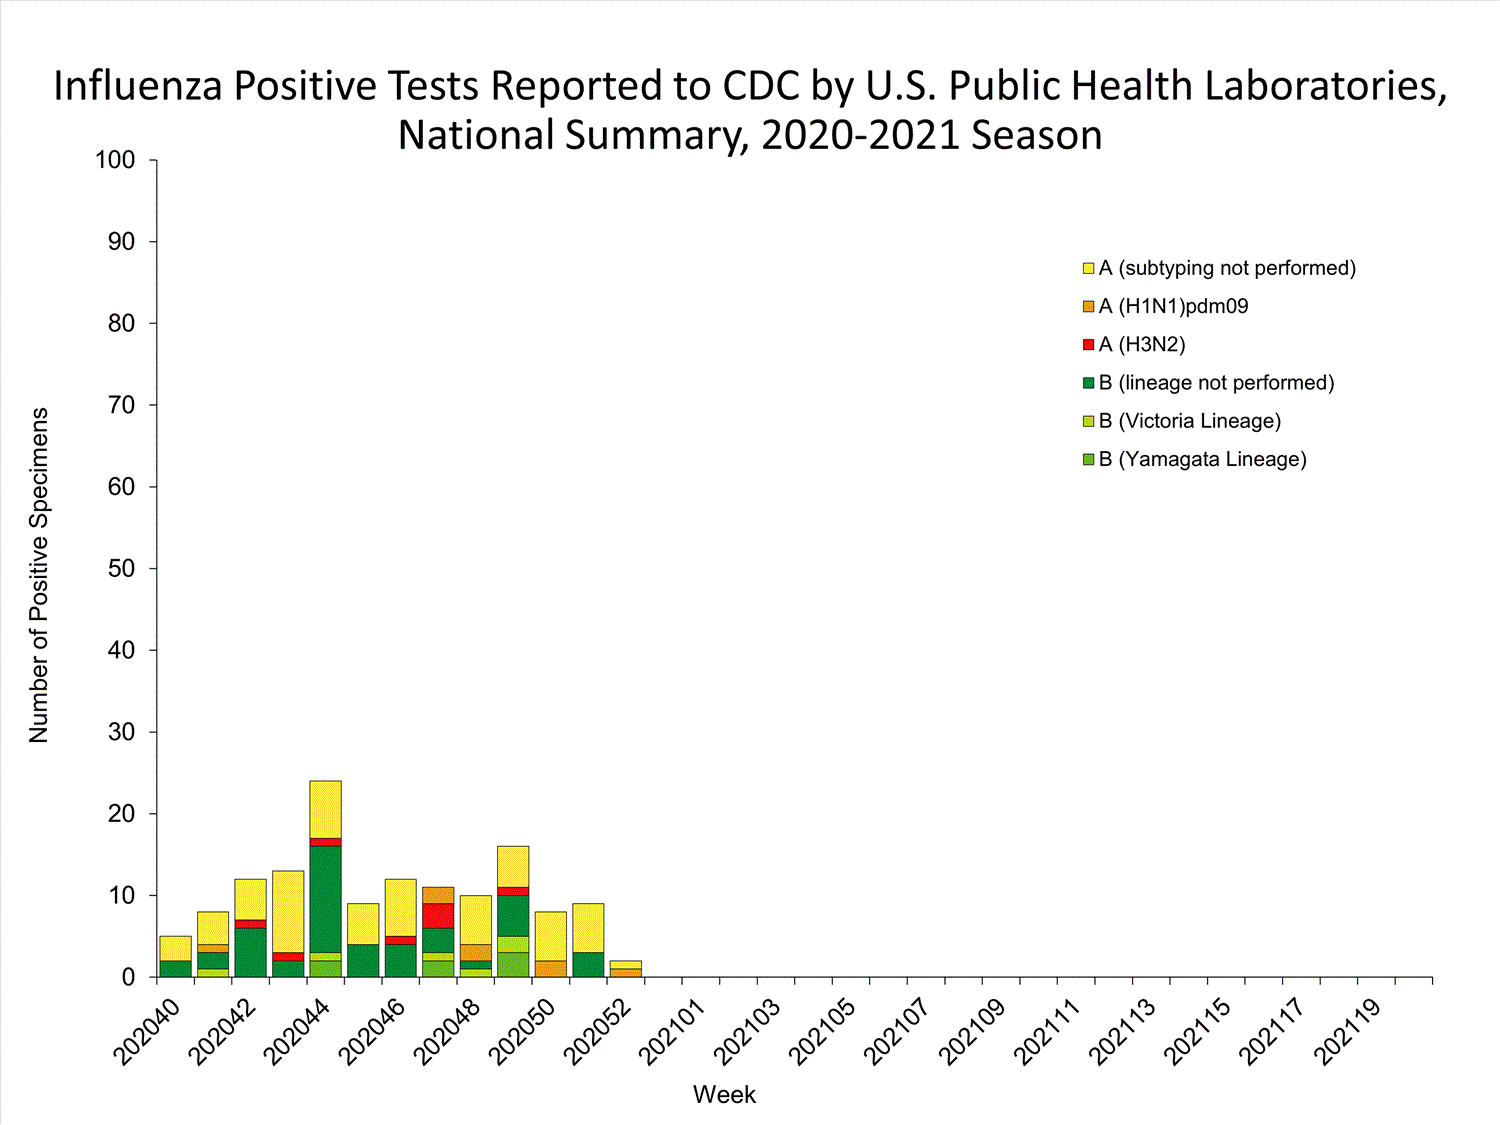
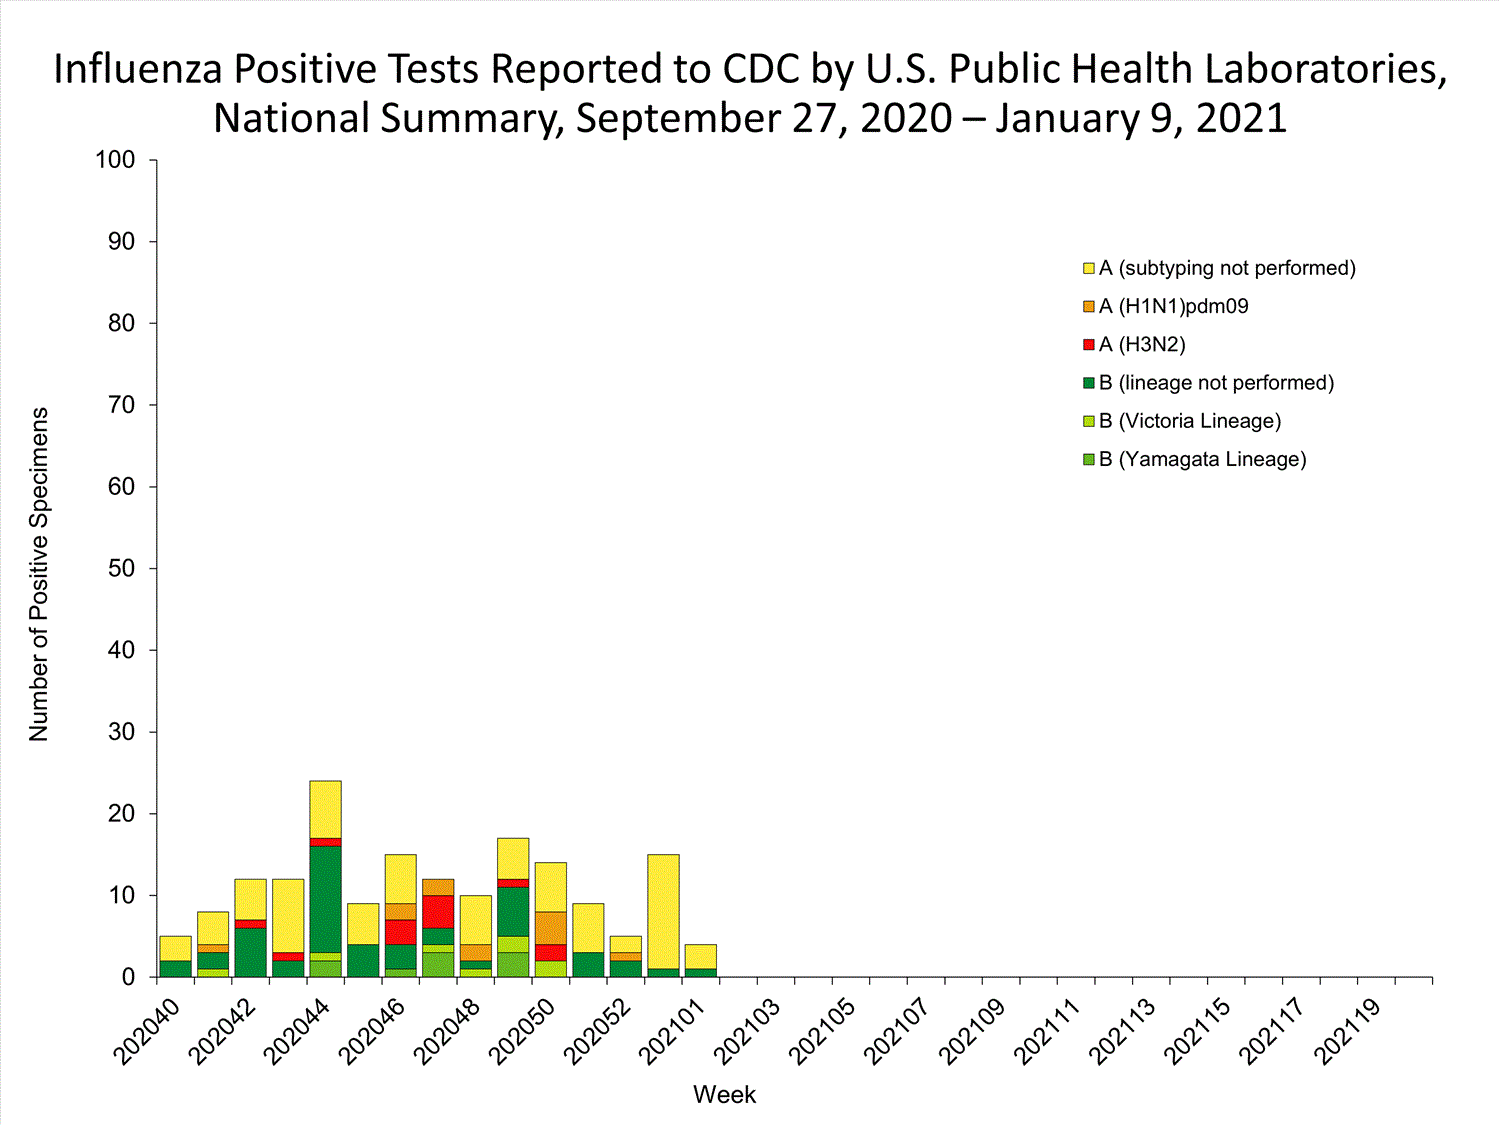
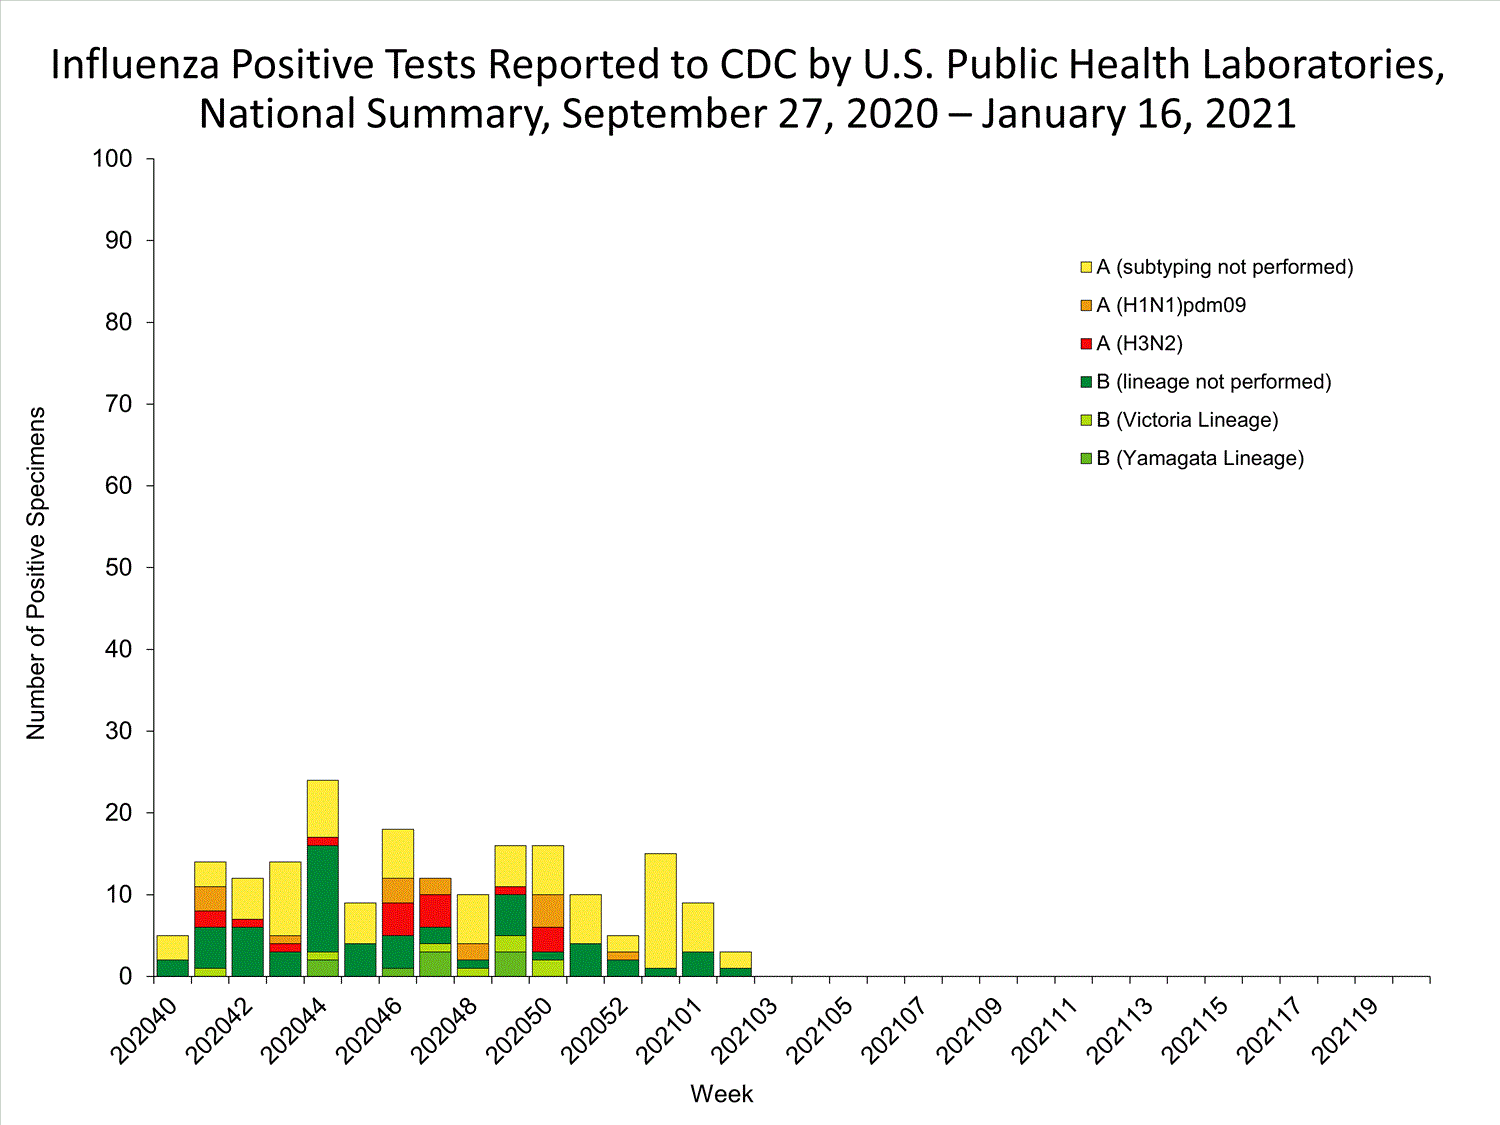
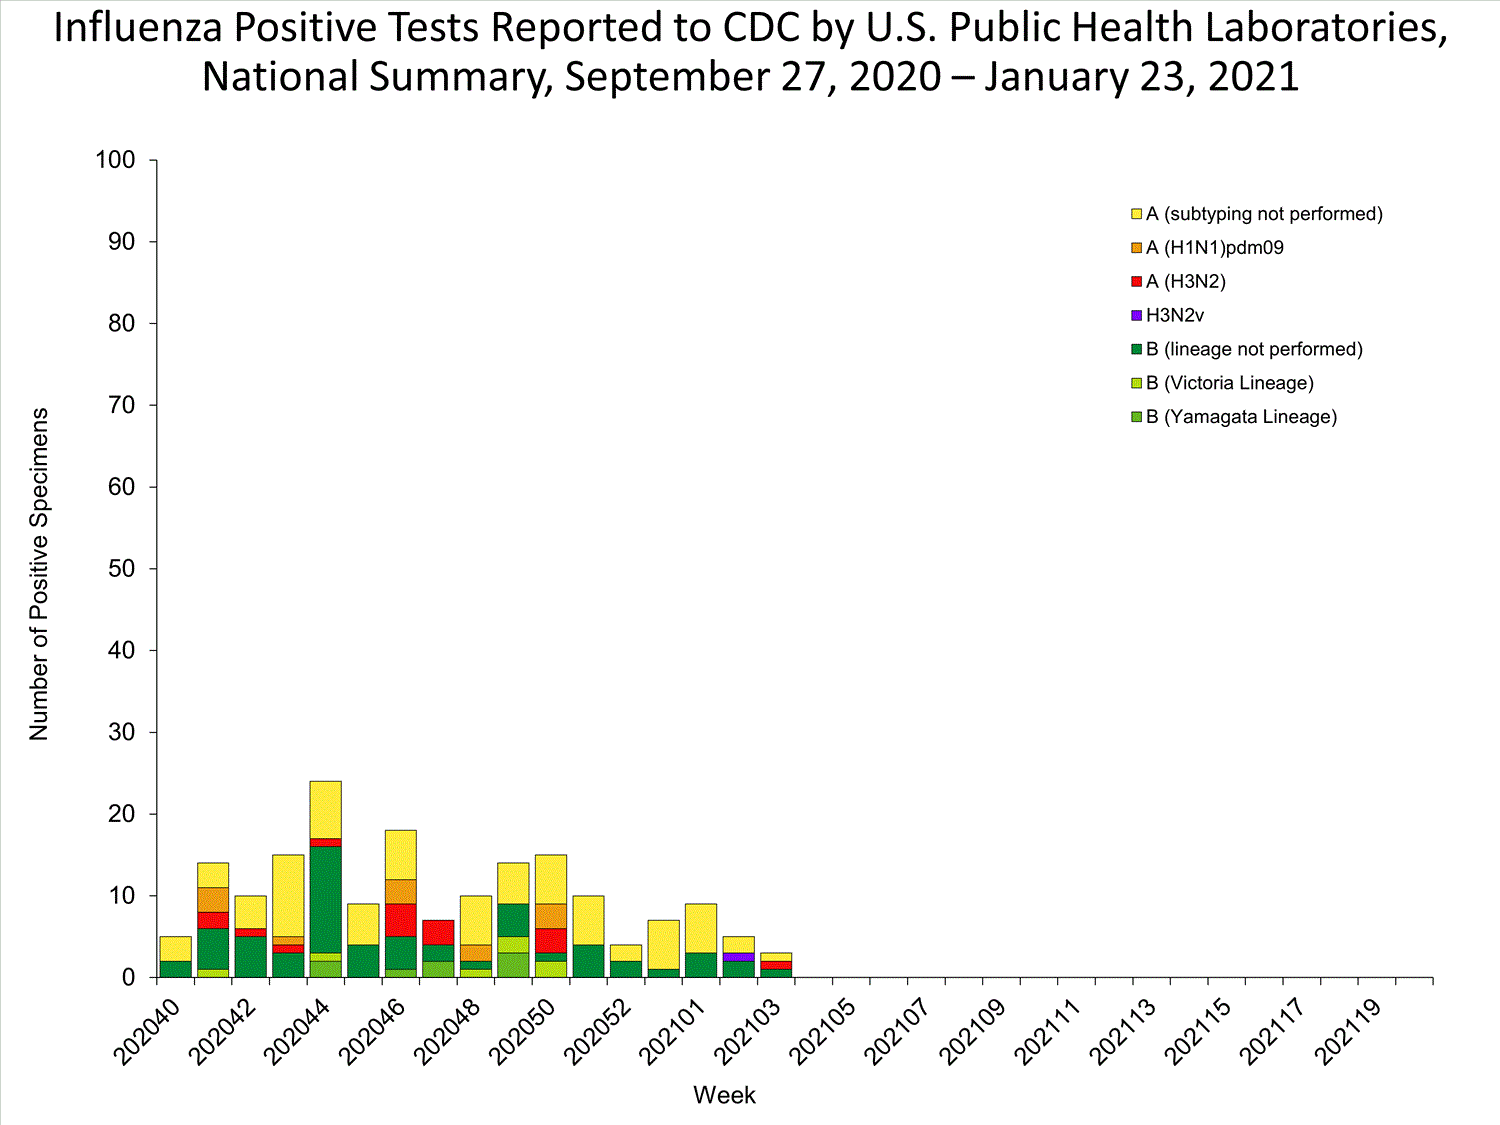
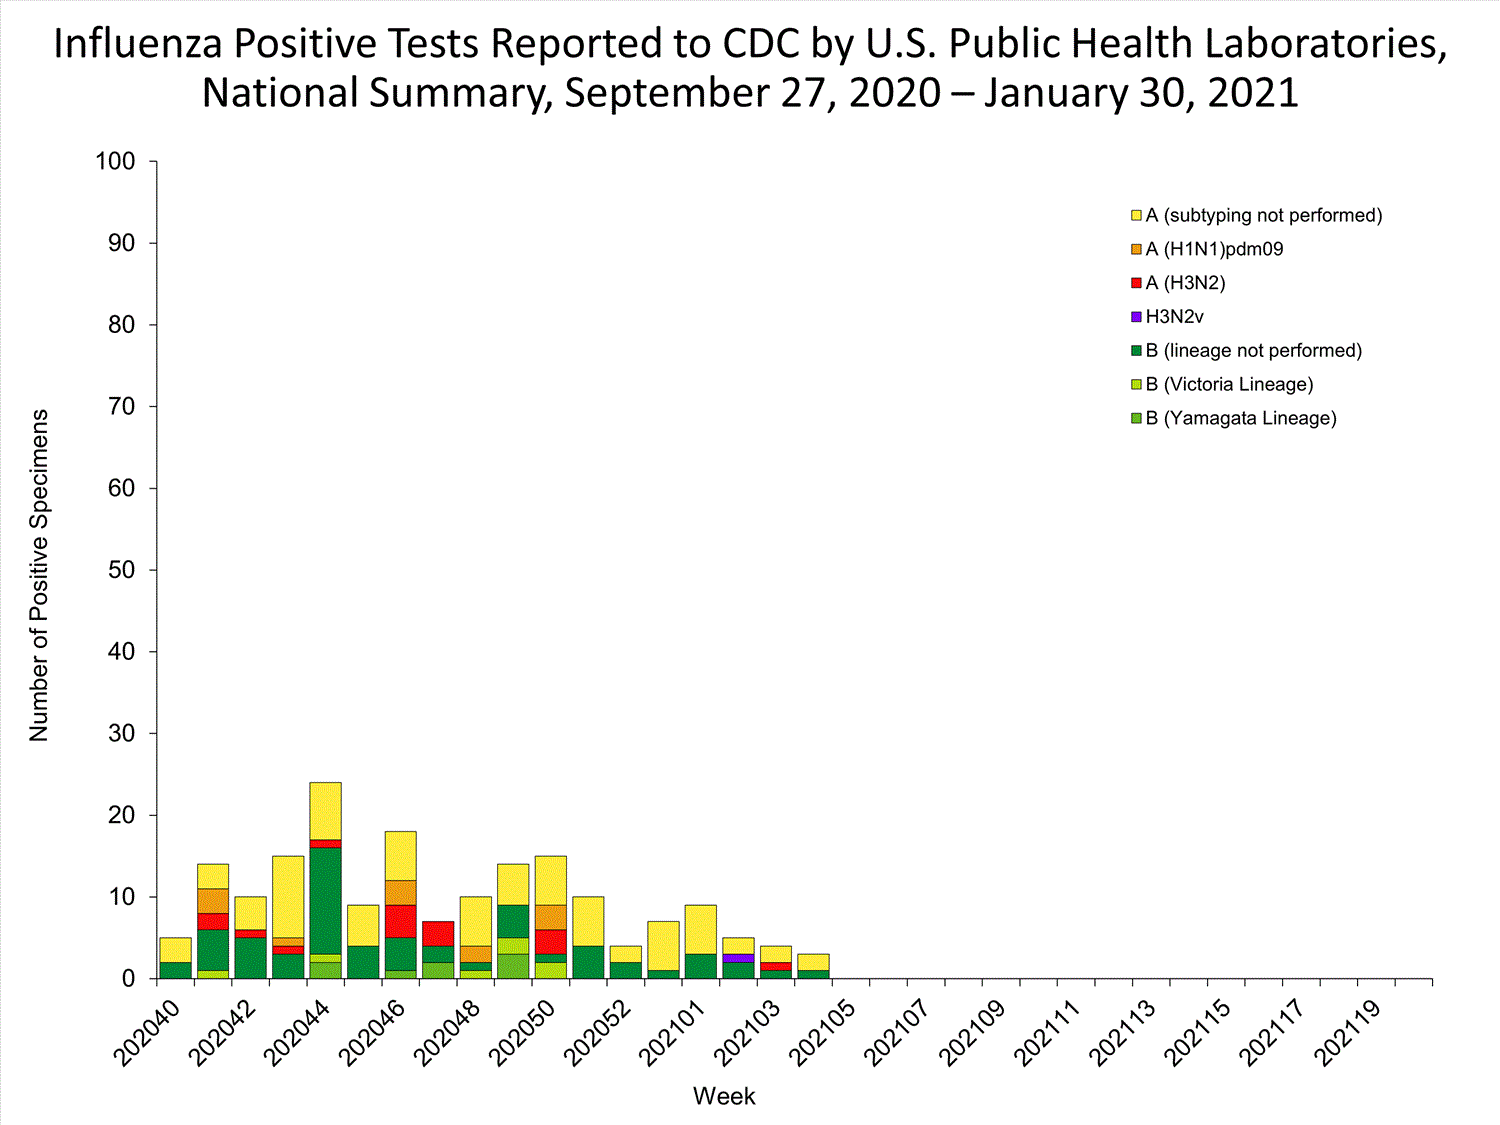
Influenza activity has been low over the summer months. Few specimens have tested positive in the public health labs during the most recent weeks.

Virus Characterization
Influenza virus characterization information will be updated weekly starting later this season.
Illness

Outpatient Illness: ILINet
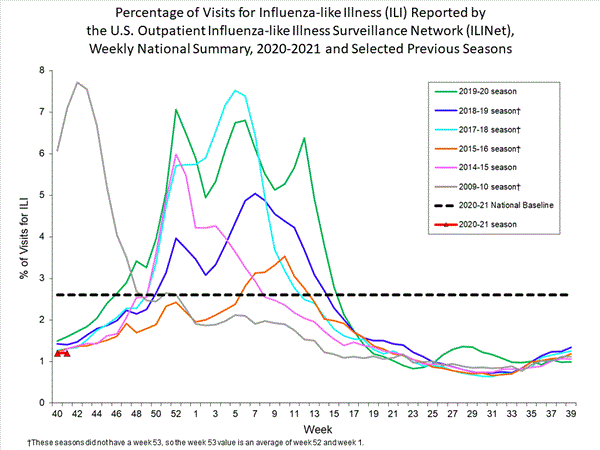
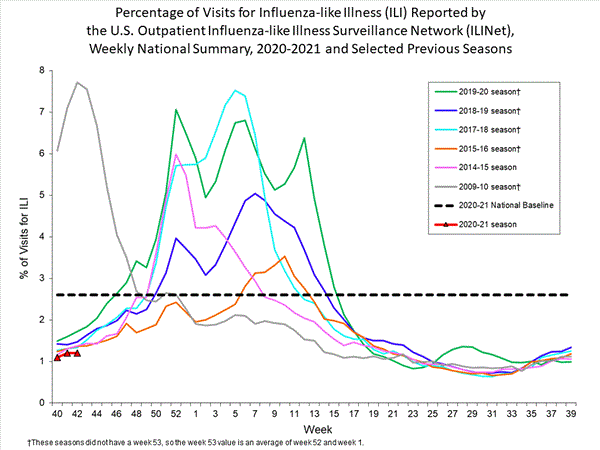
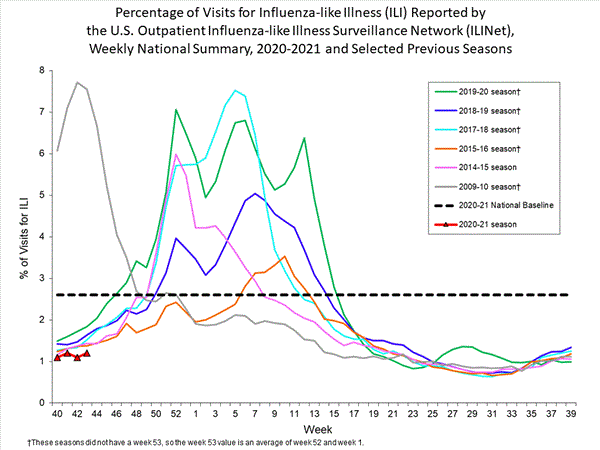
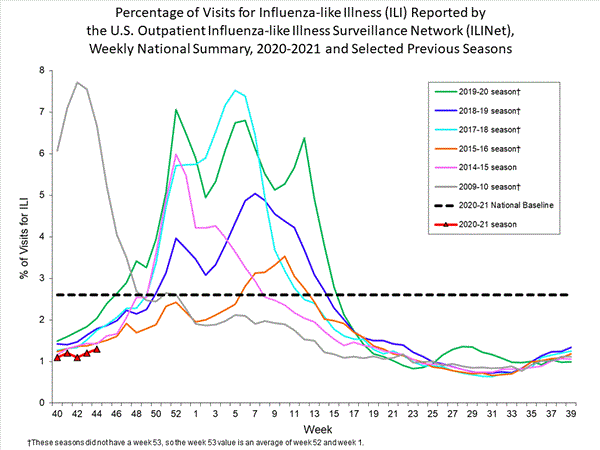
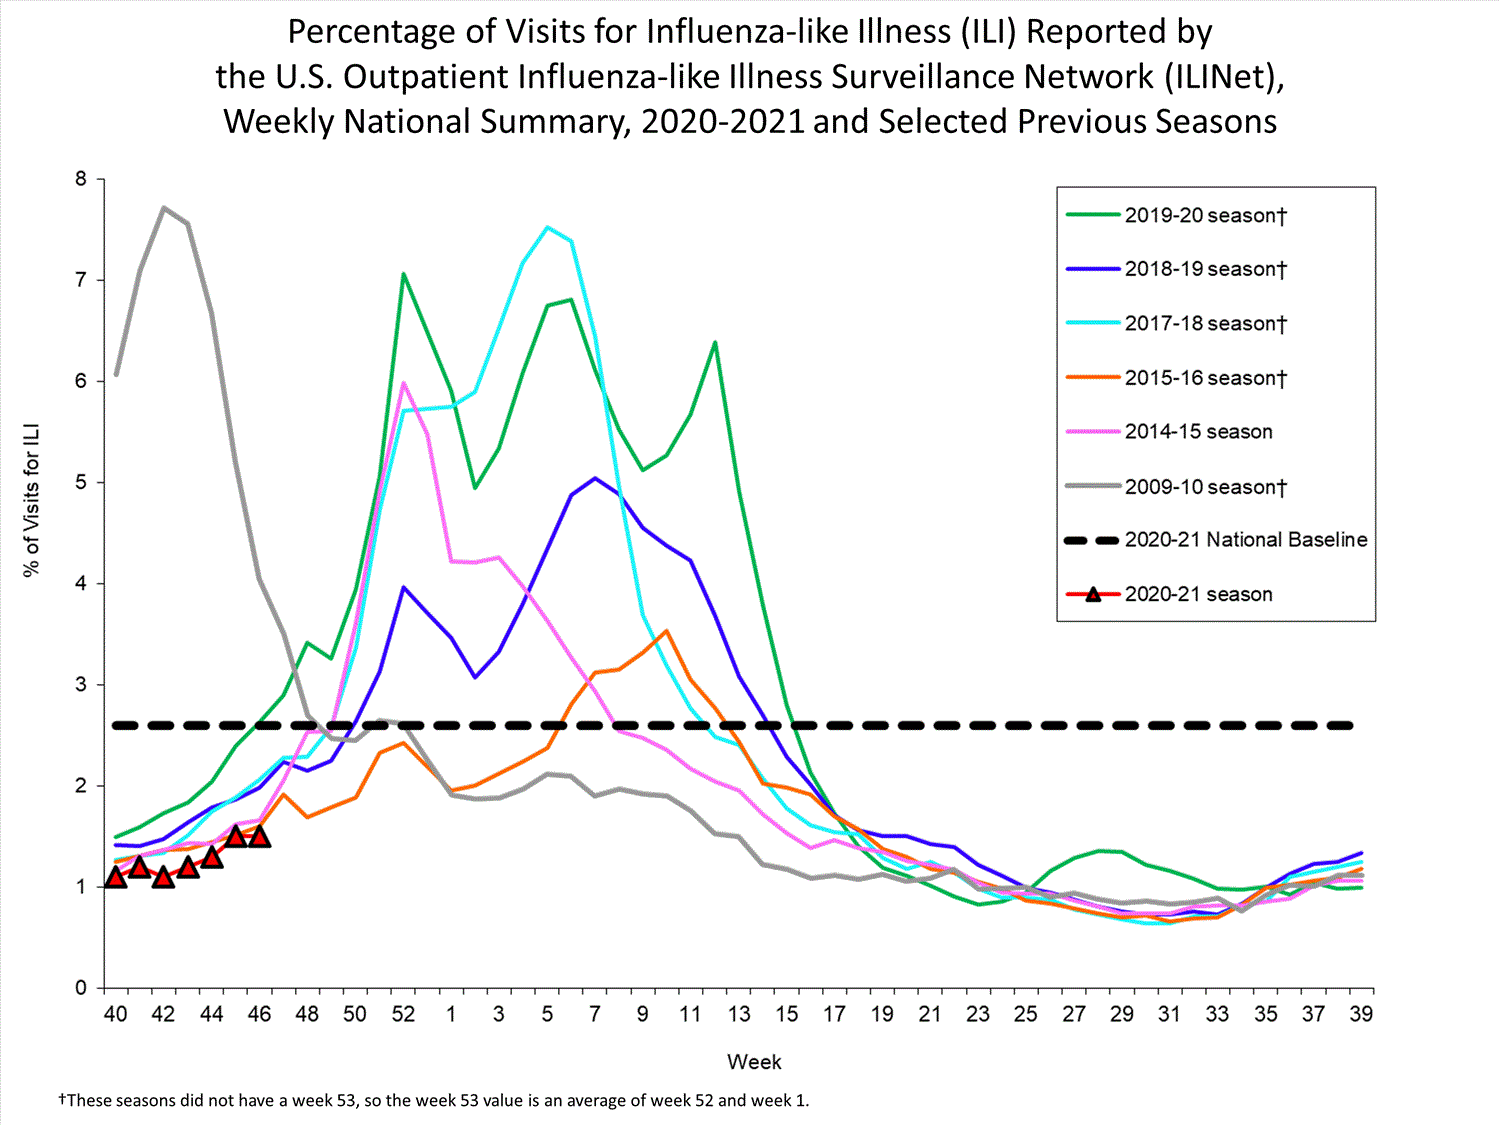
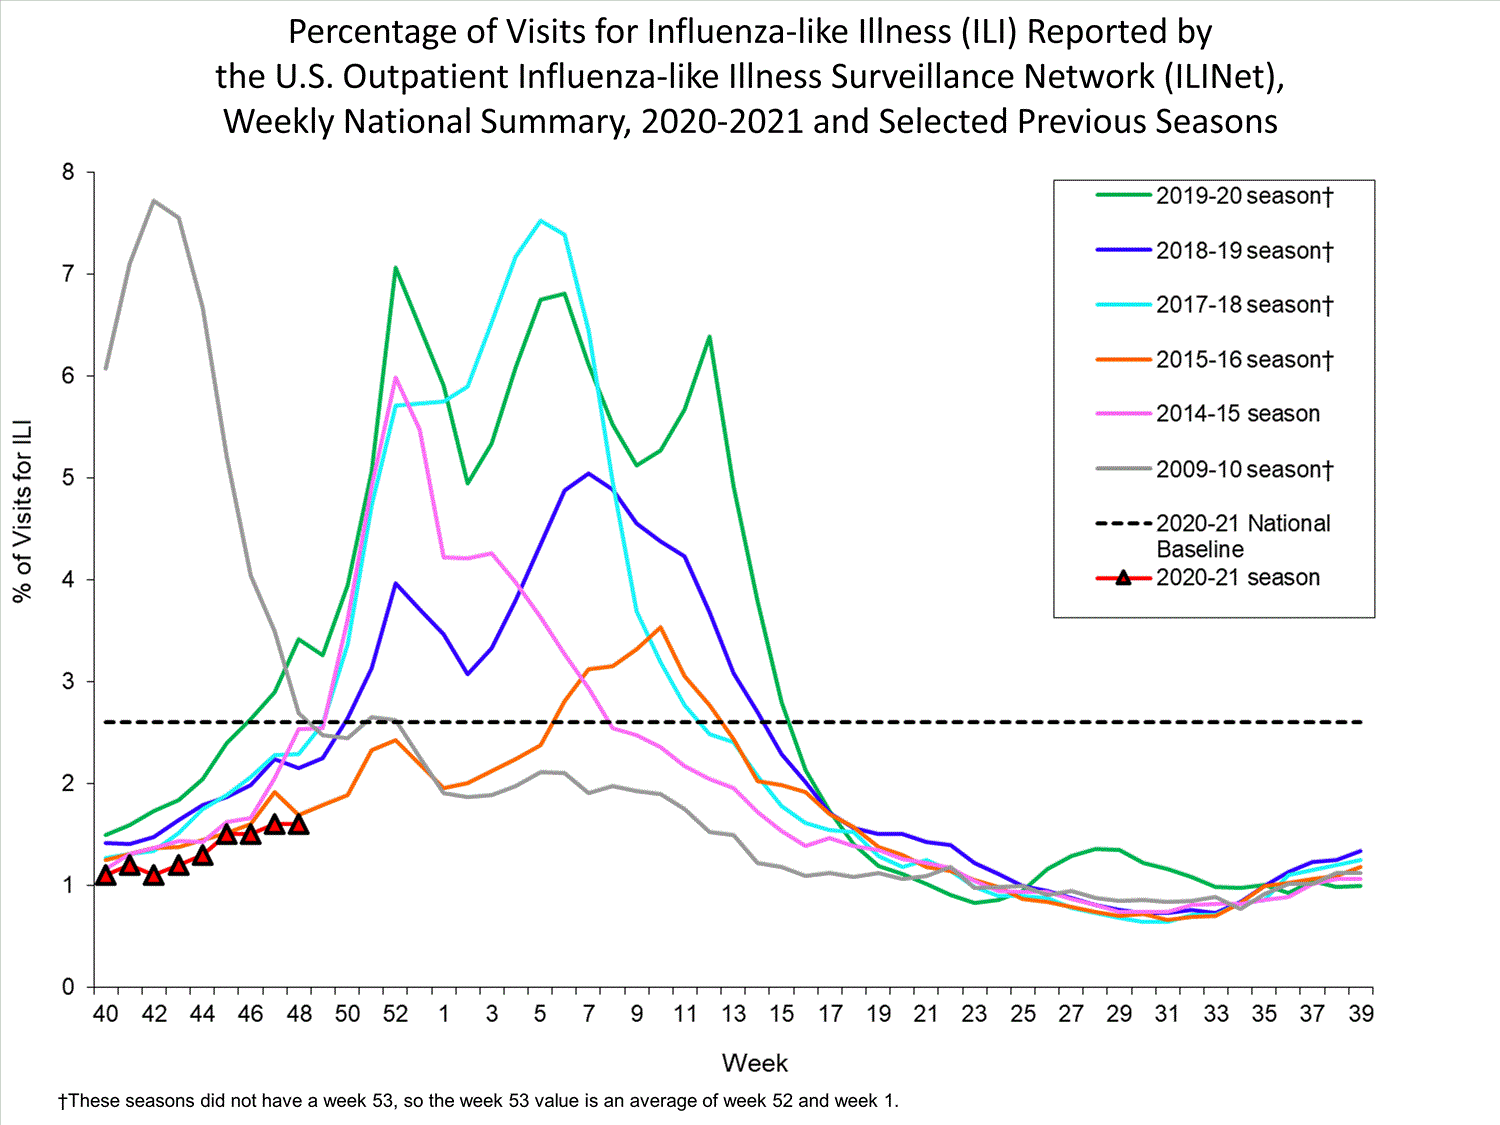
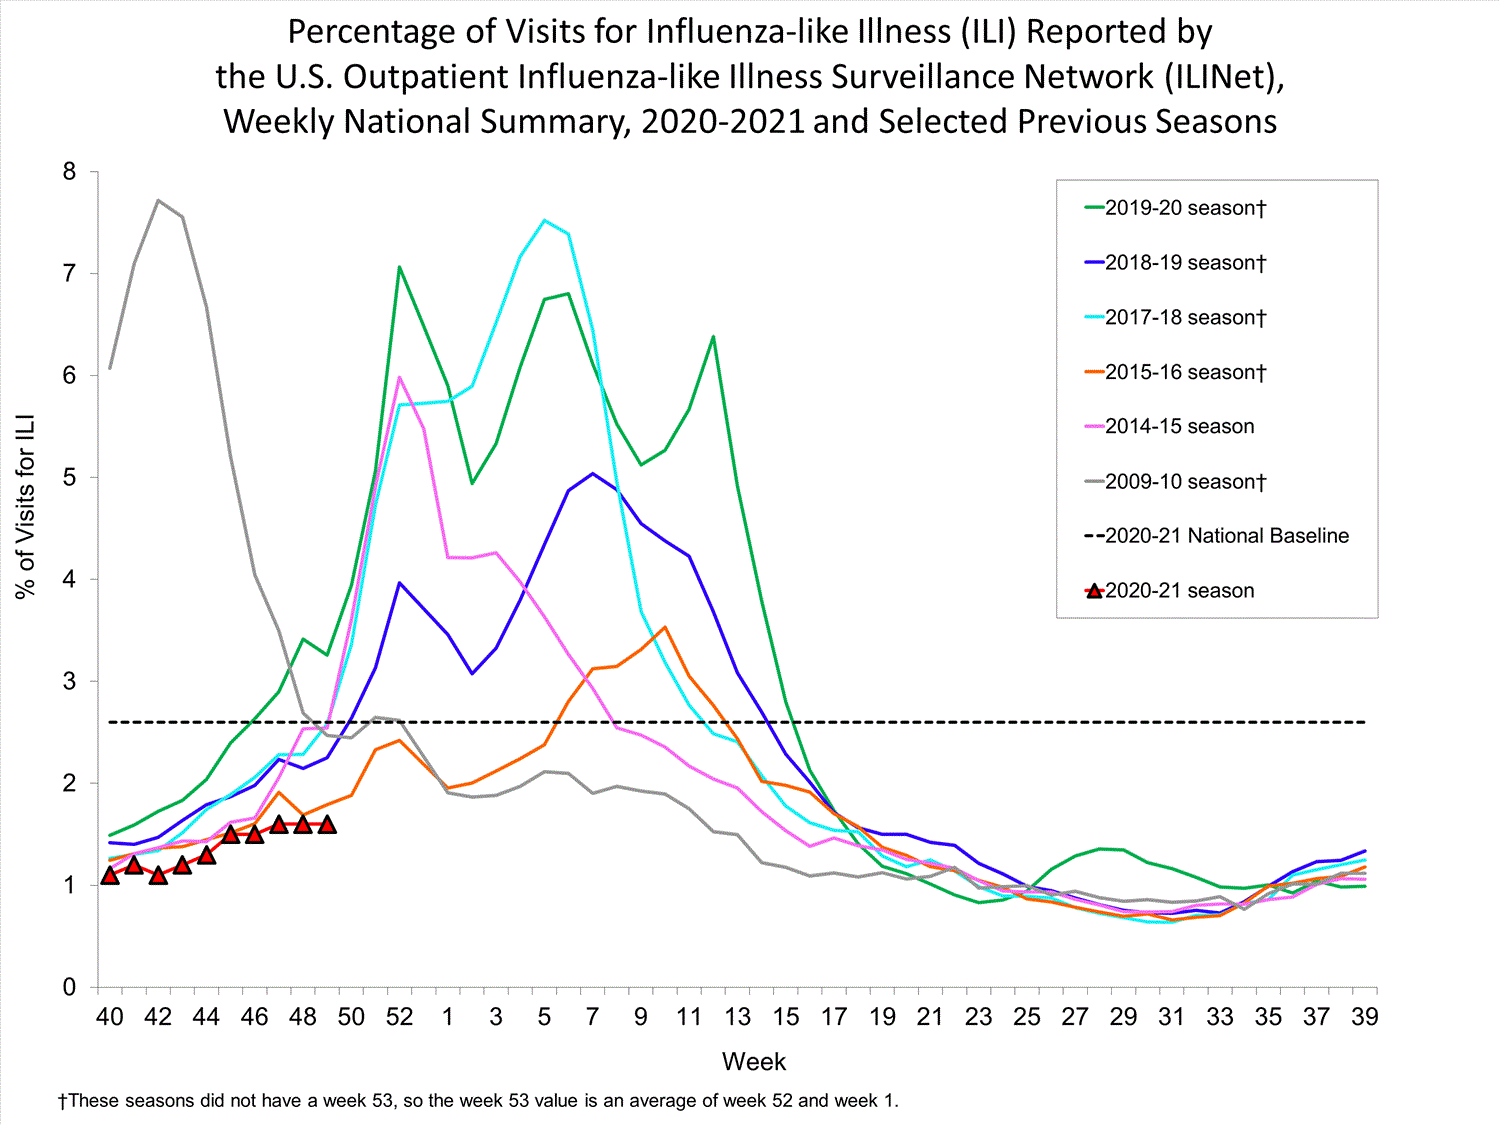
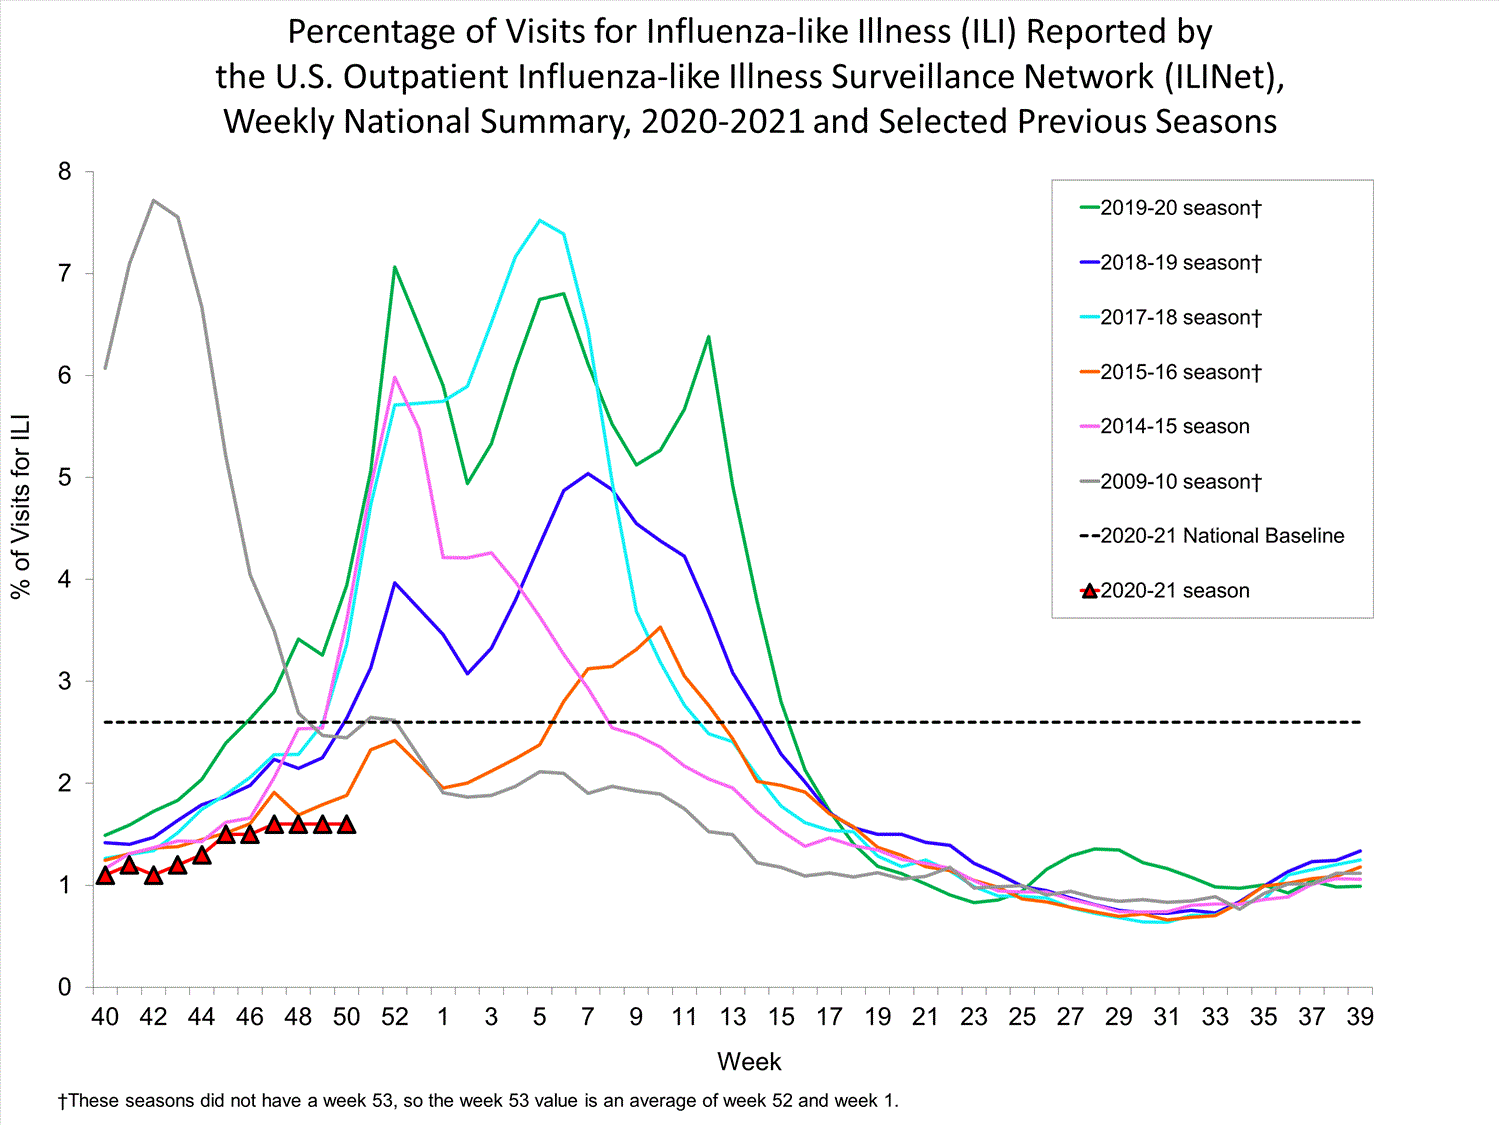
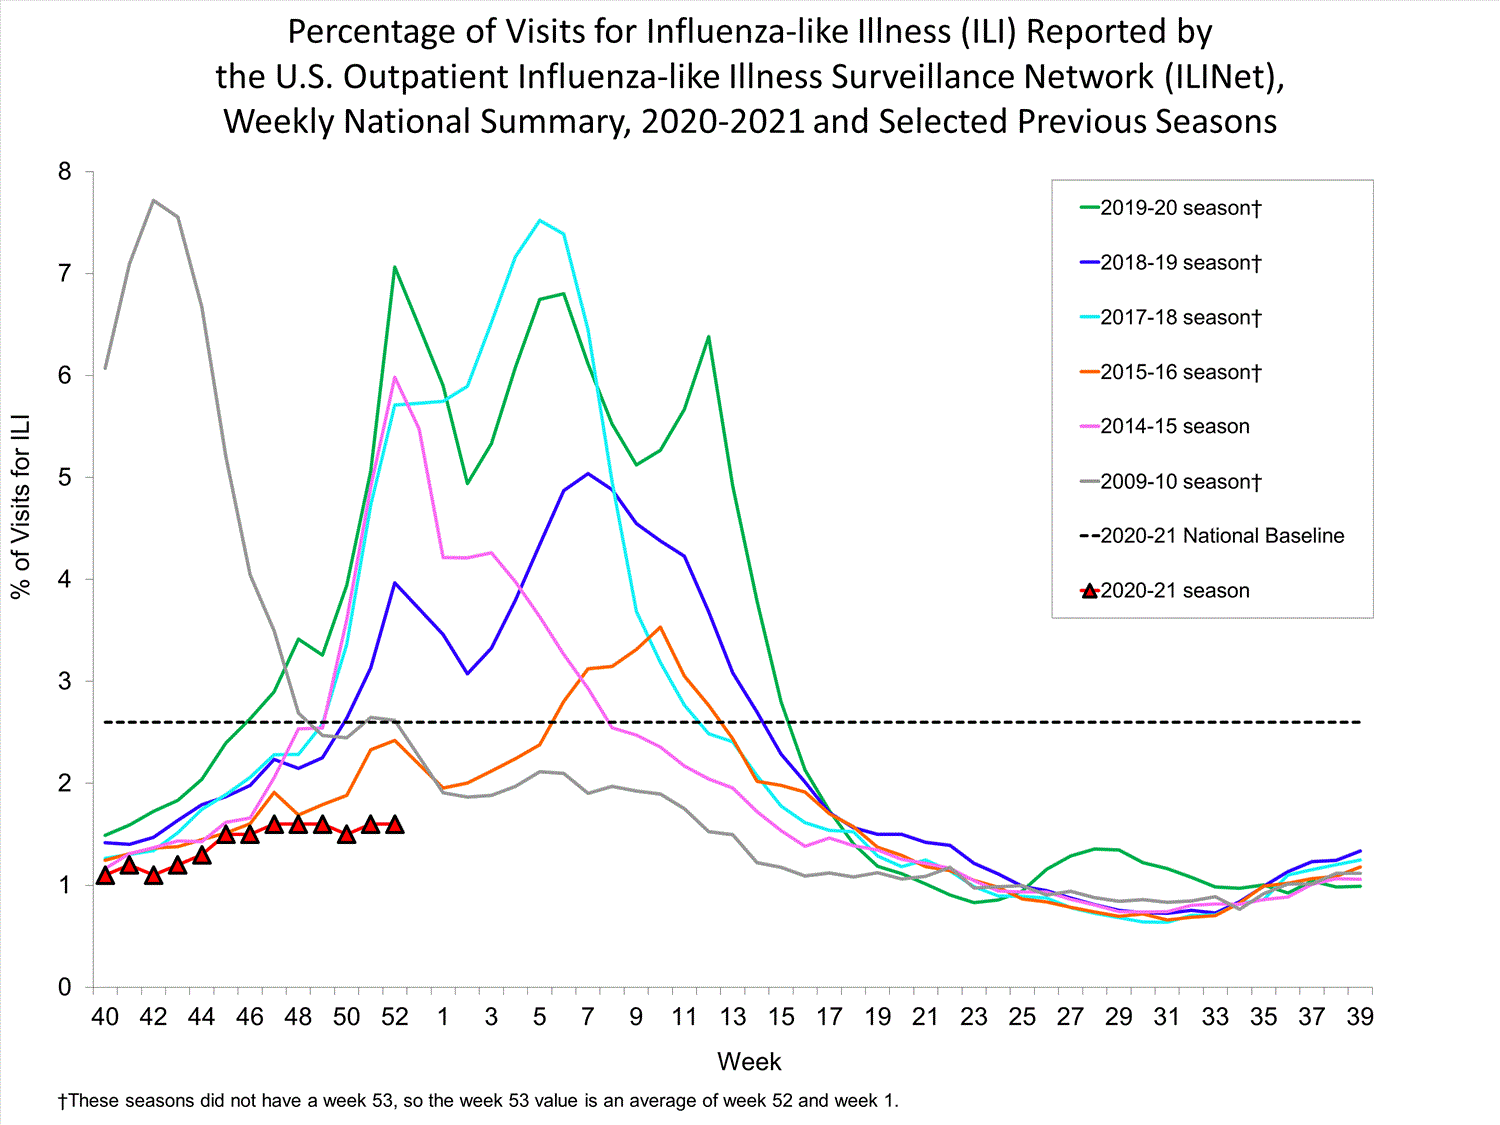
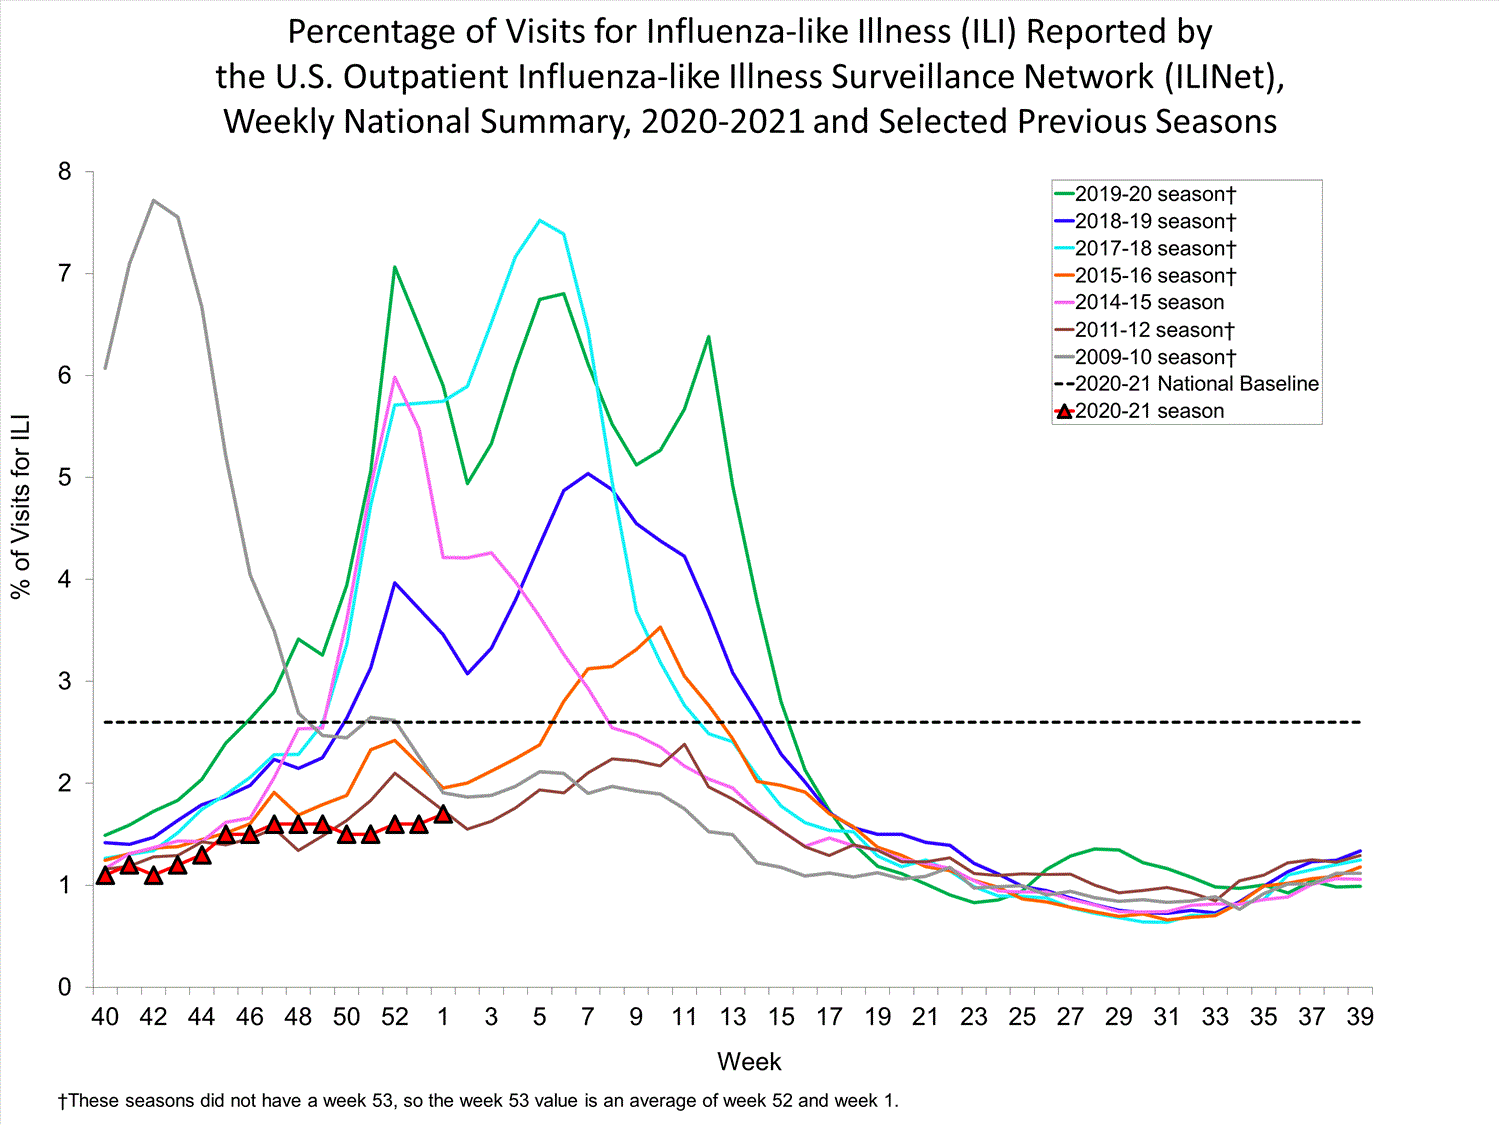
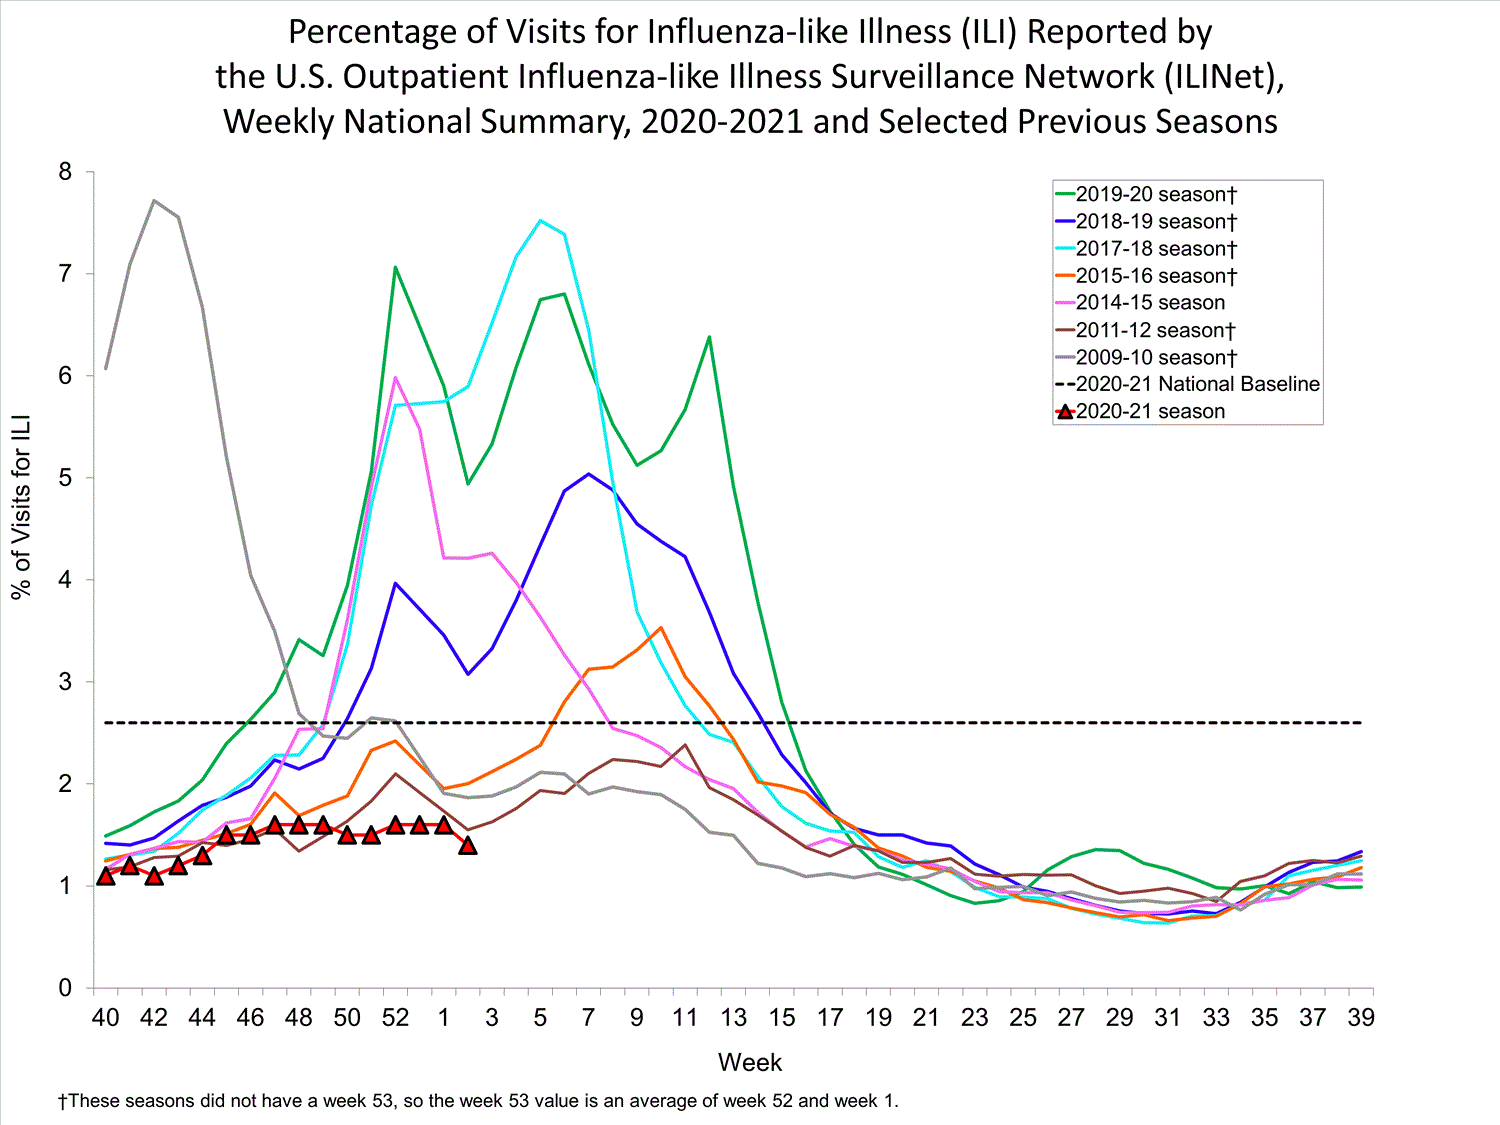
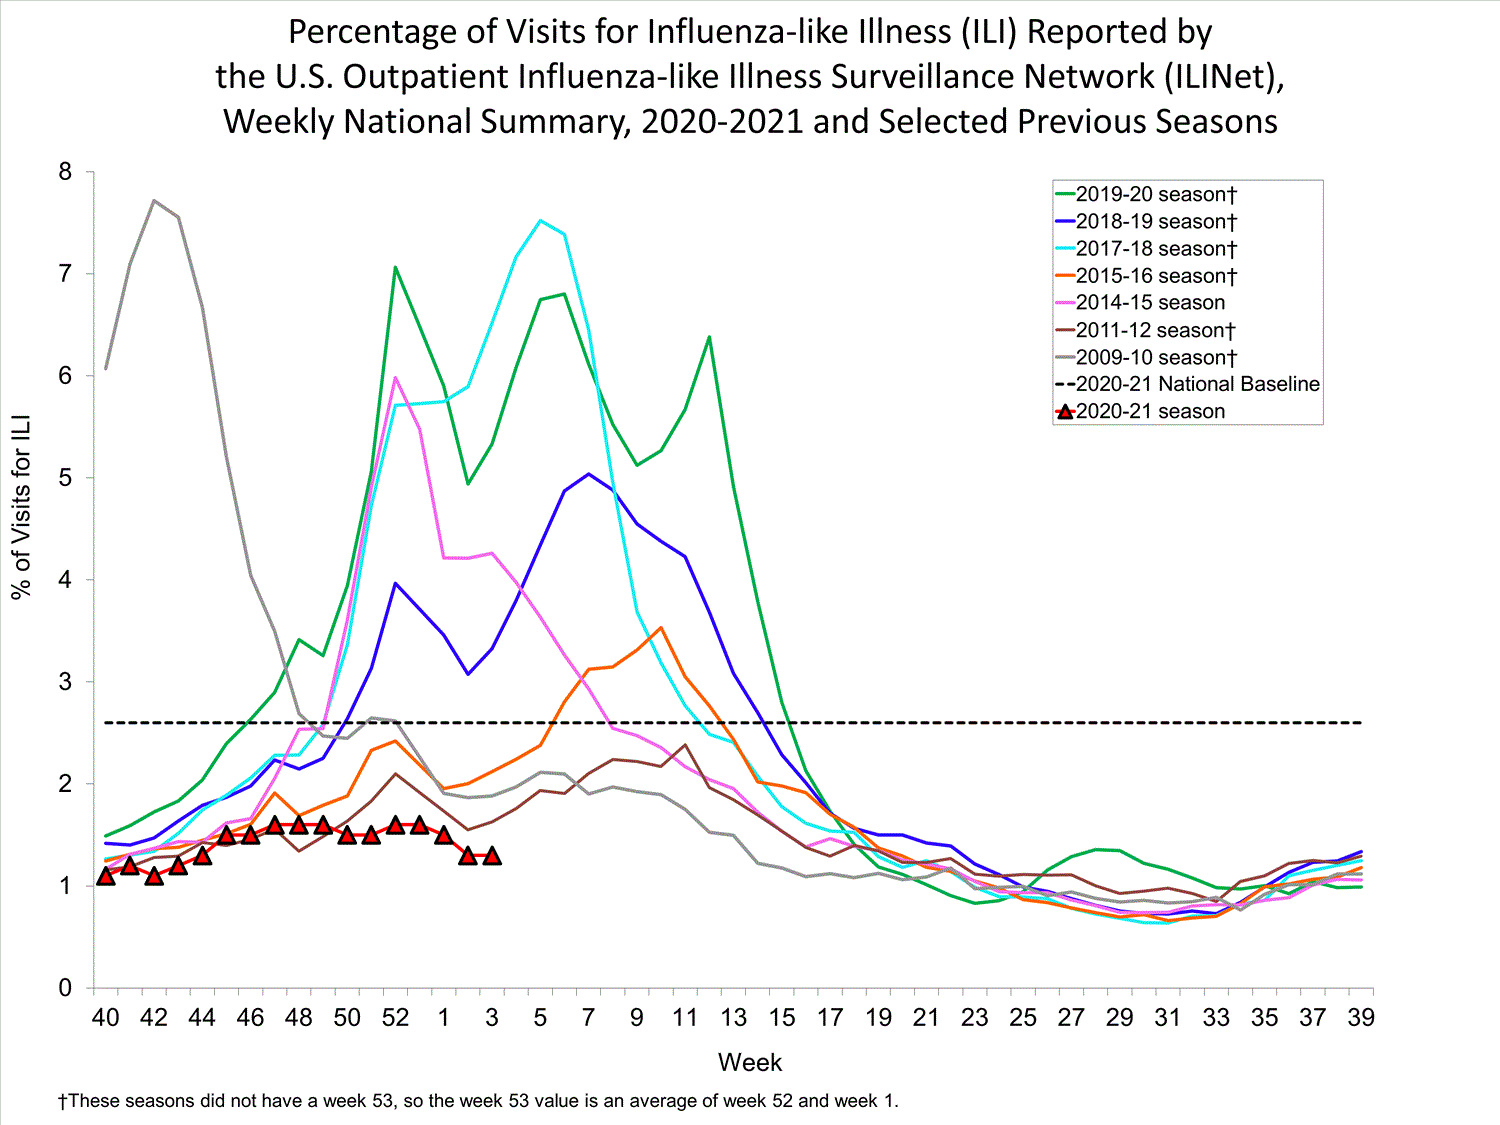
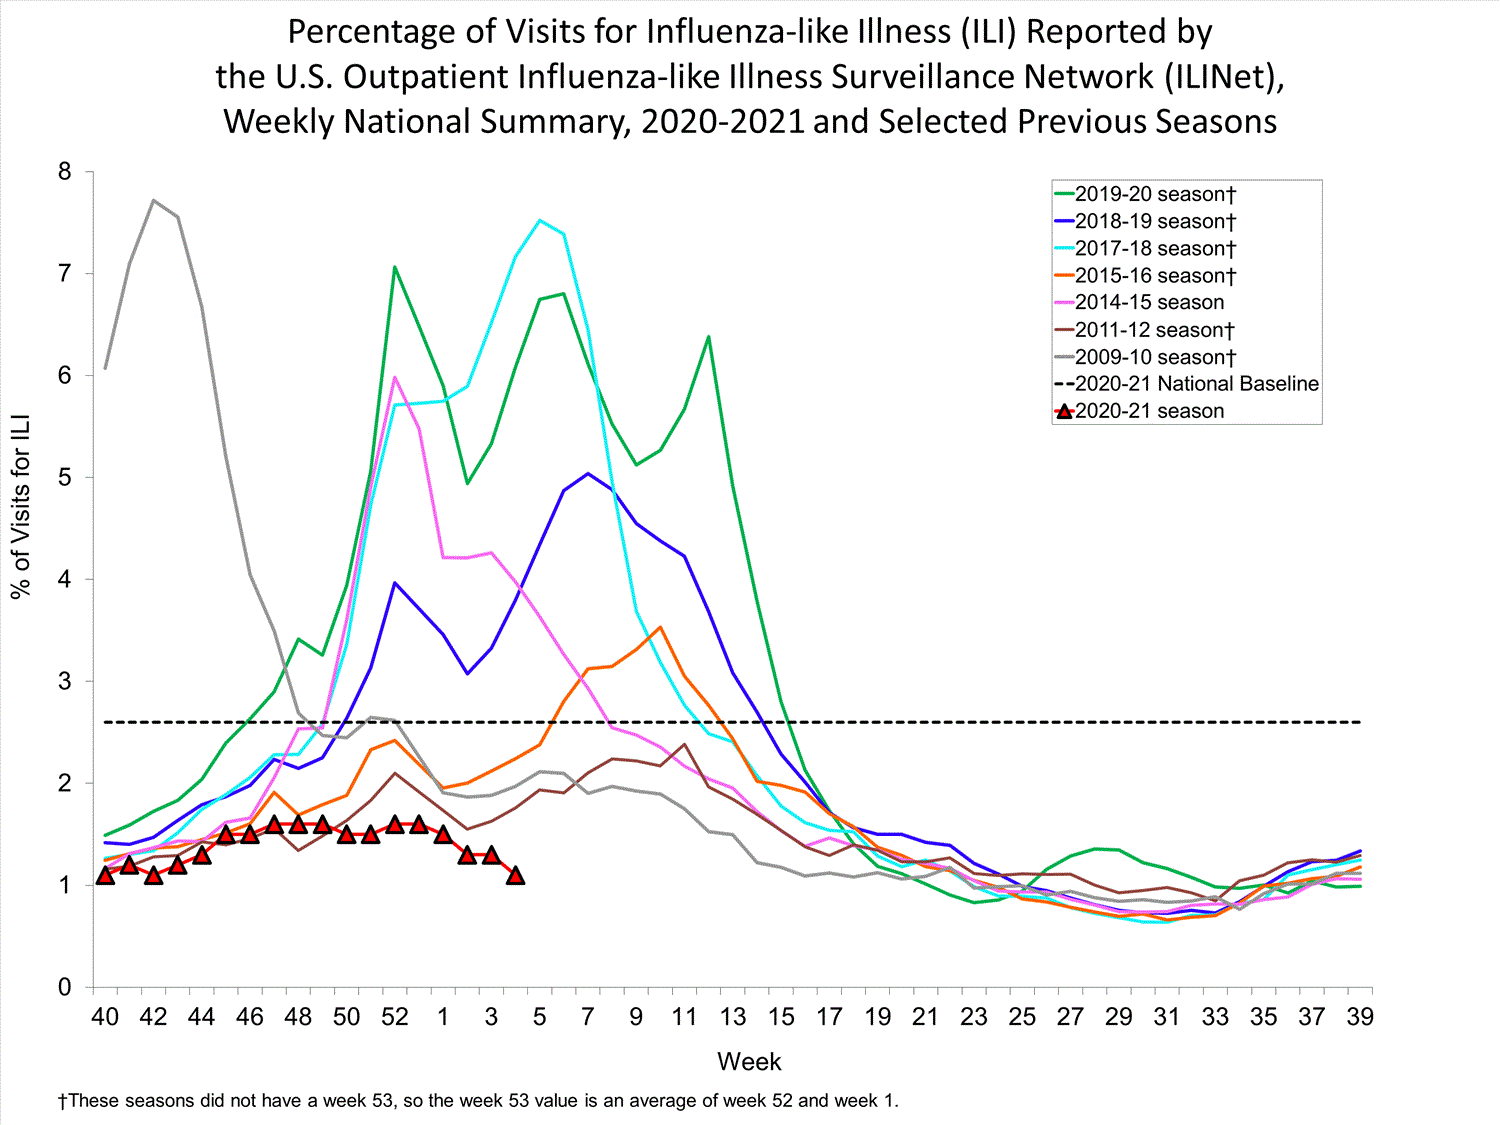
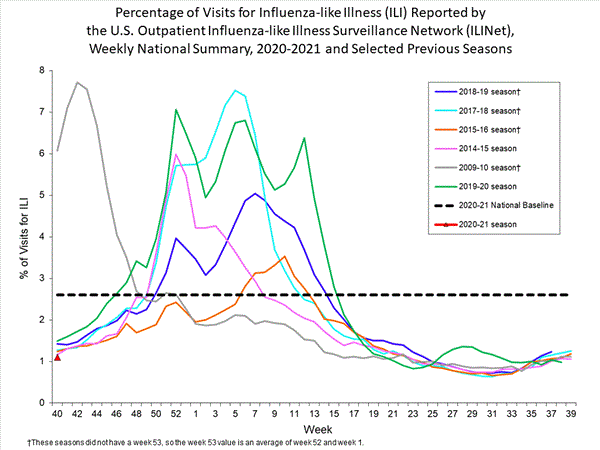
1.1% of visits to a health care provider were for ILI. ILI activity remains below the national baseline of 2.6% but increased slightly from the previous week.

Outpatient Illness: ILINet Activity Map
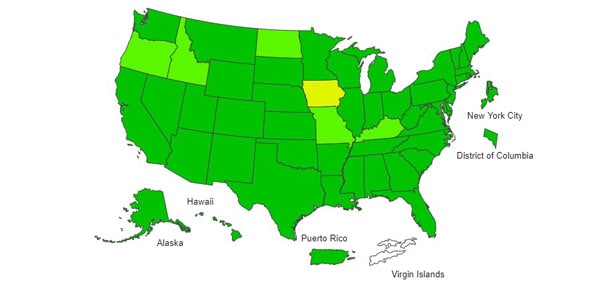

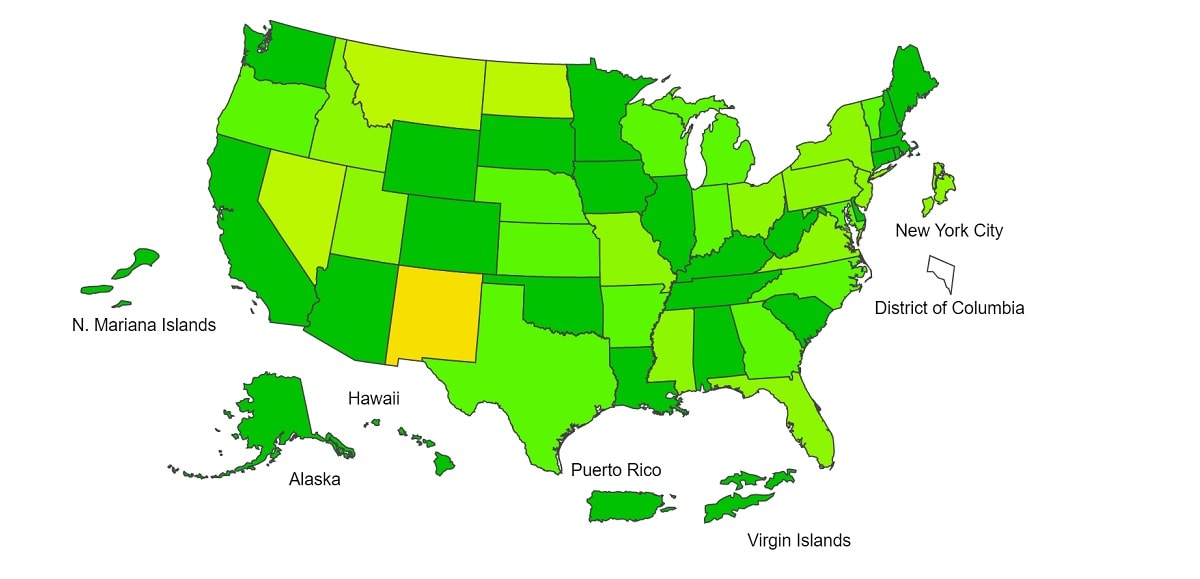
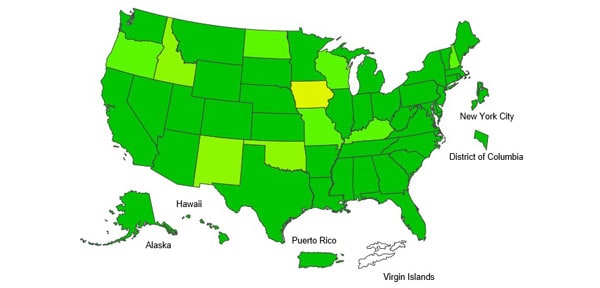
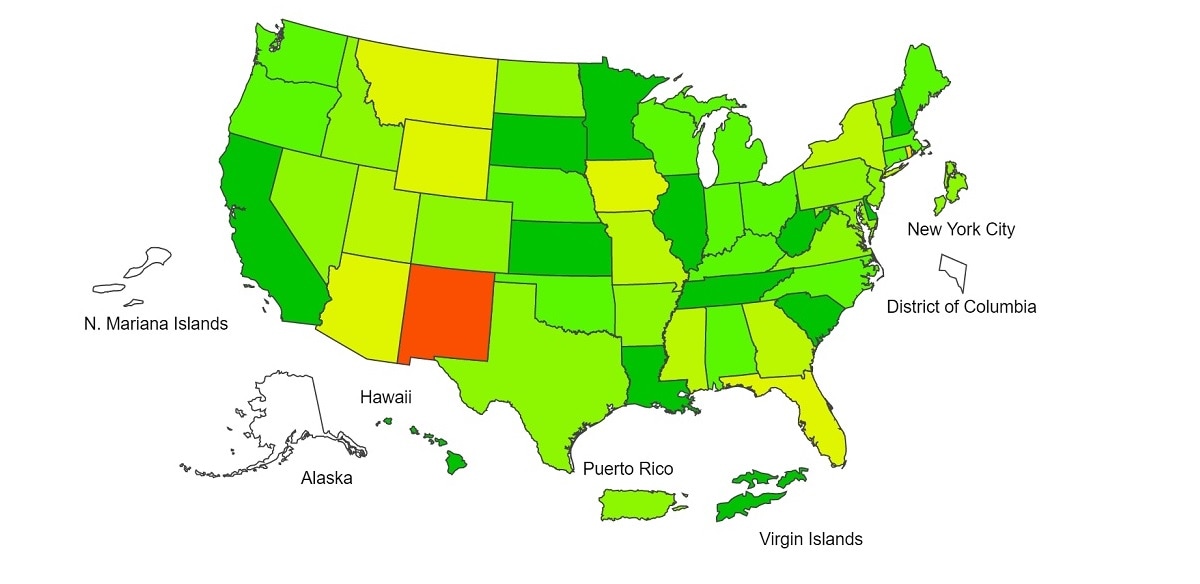
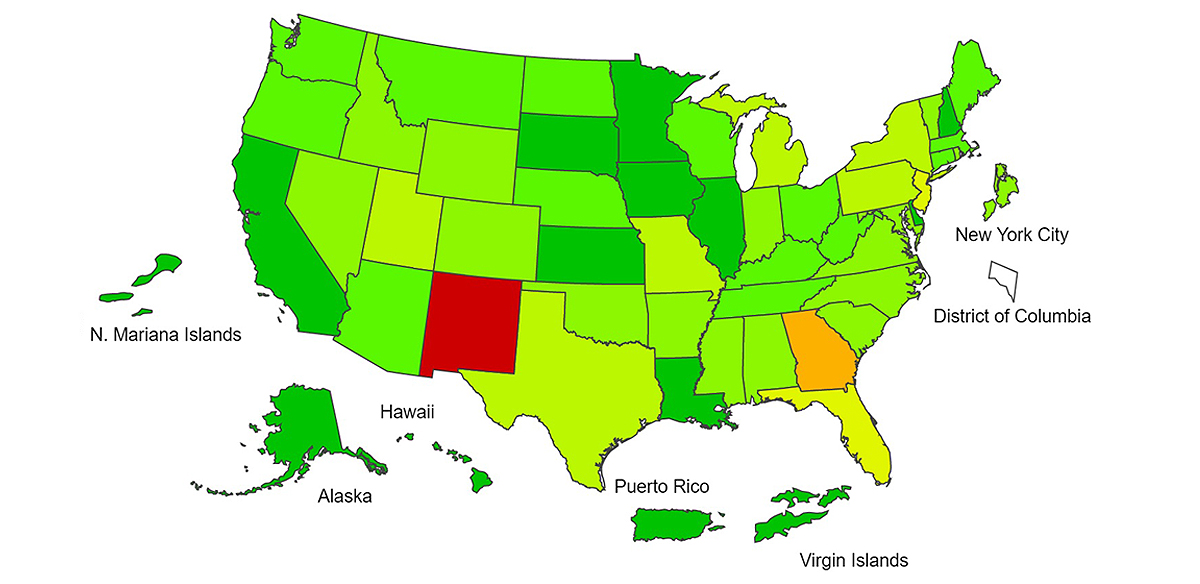
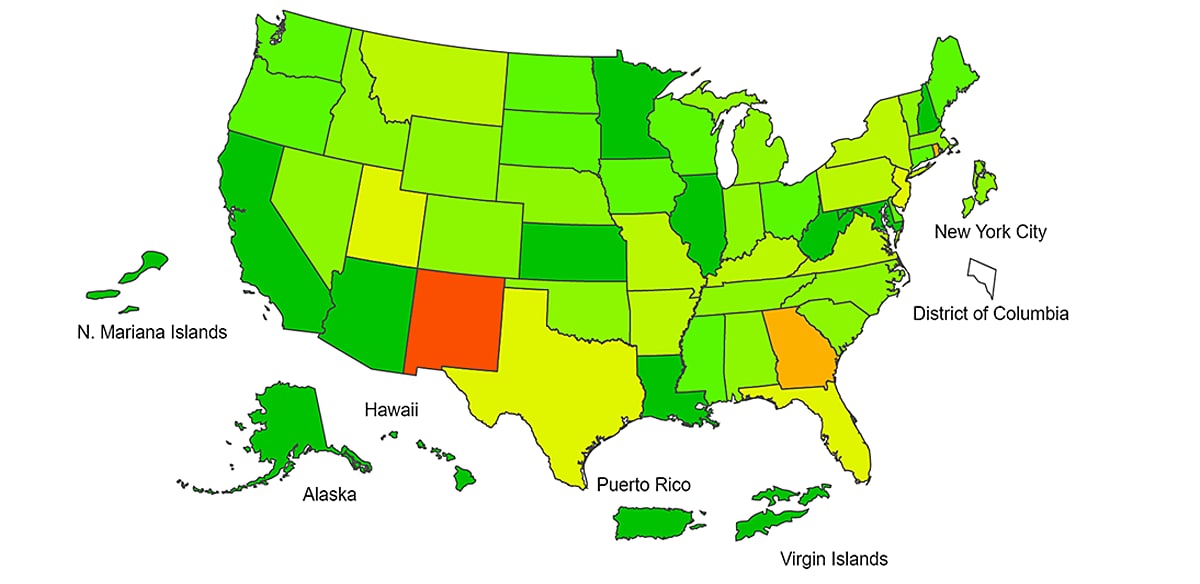
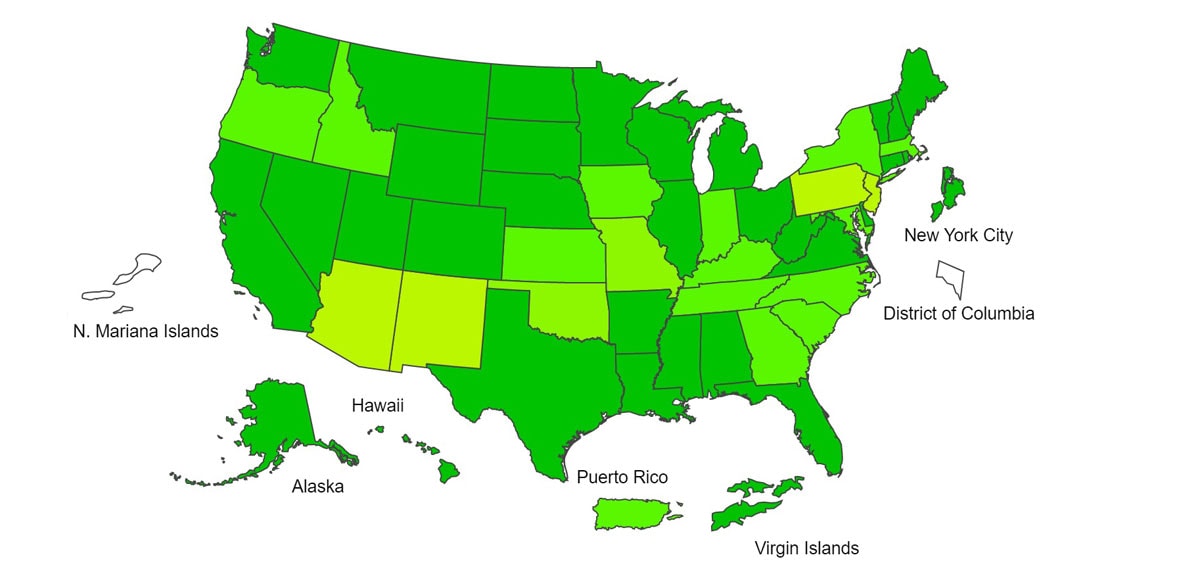
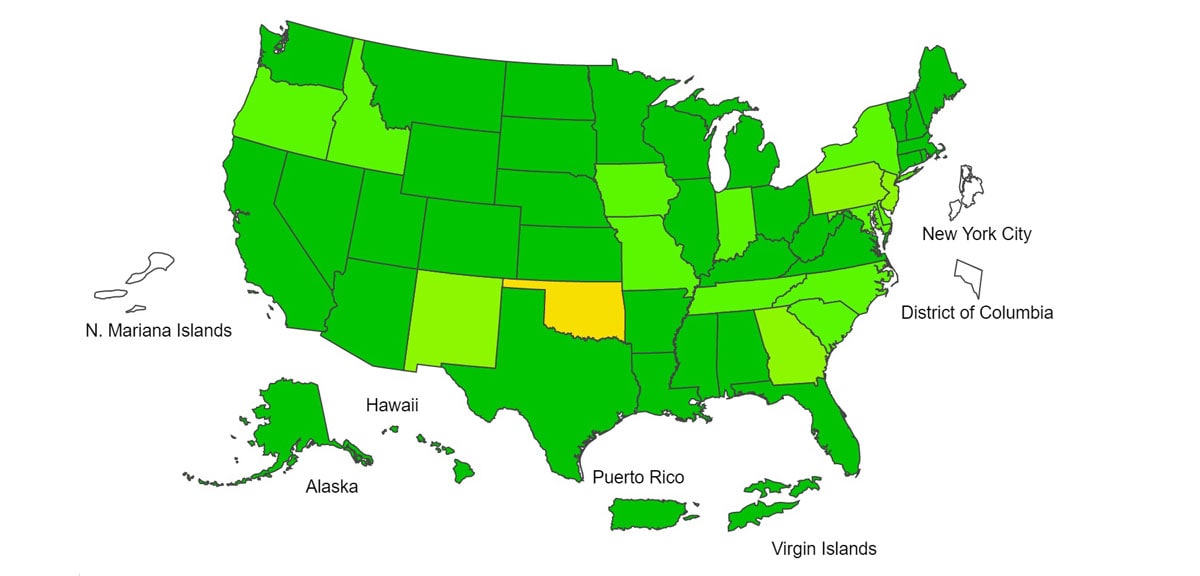
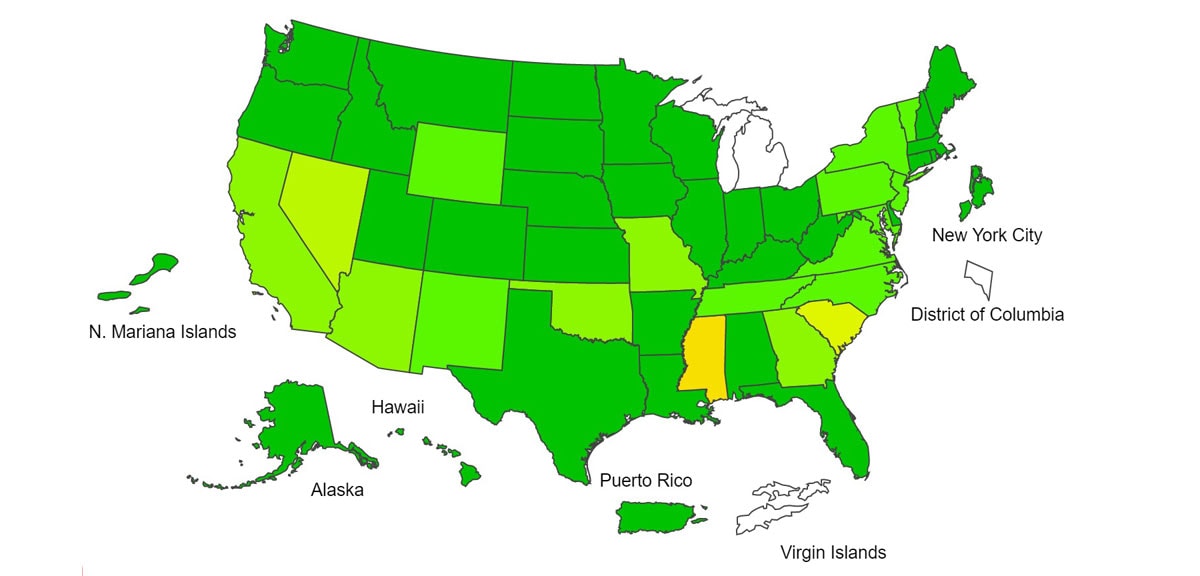
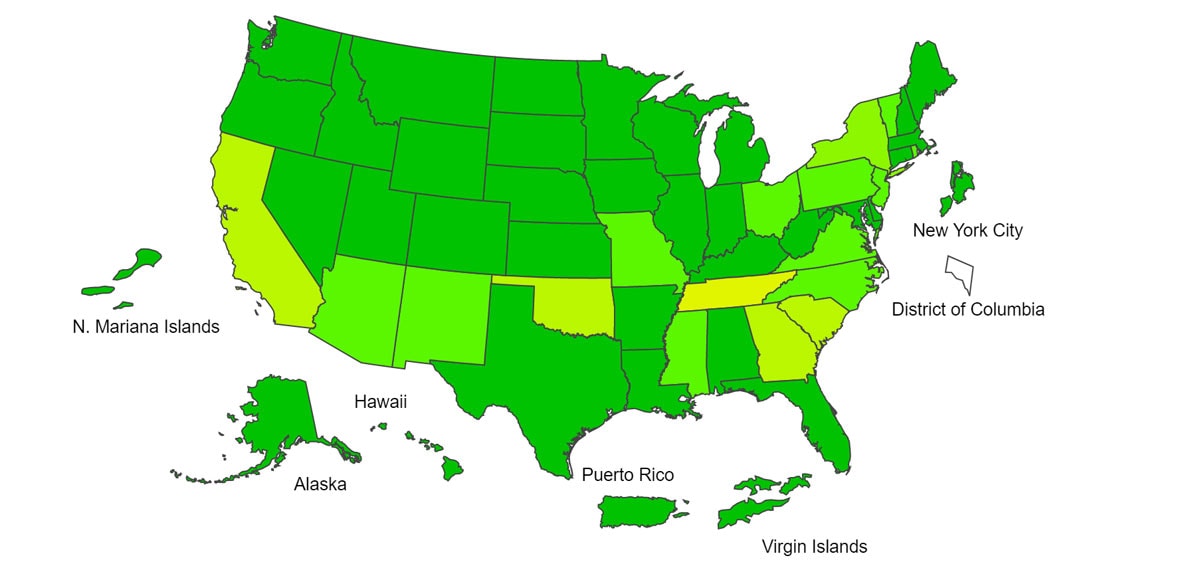
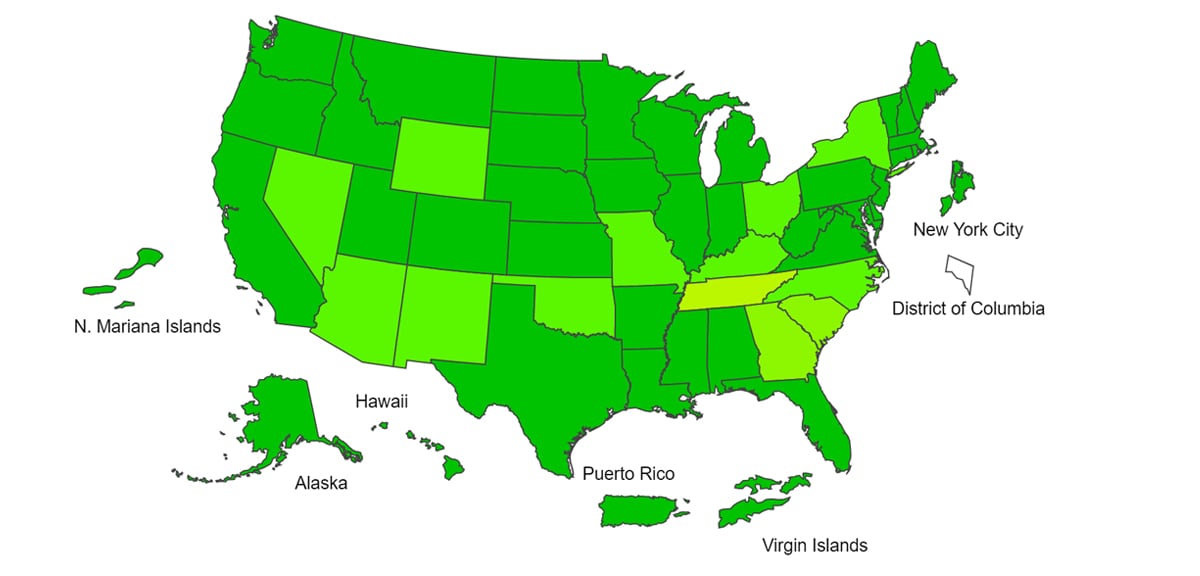
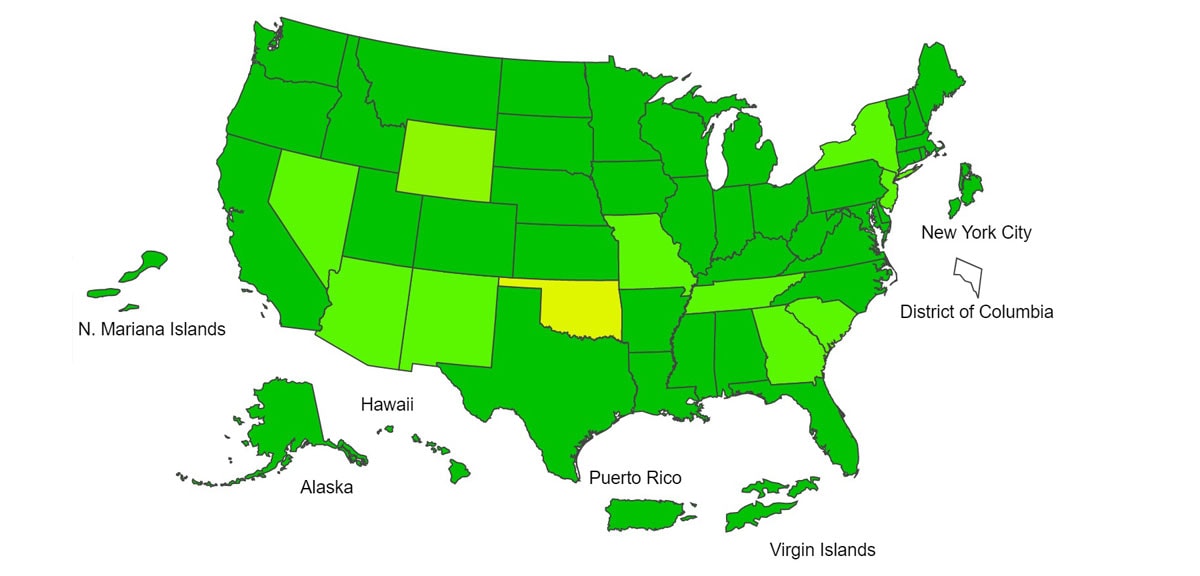
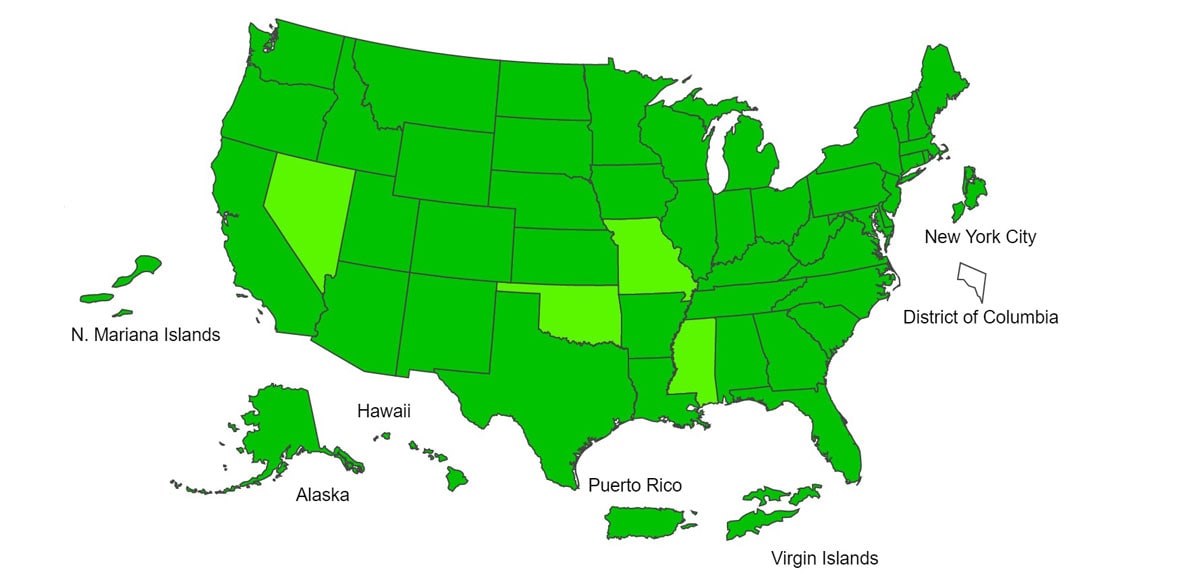
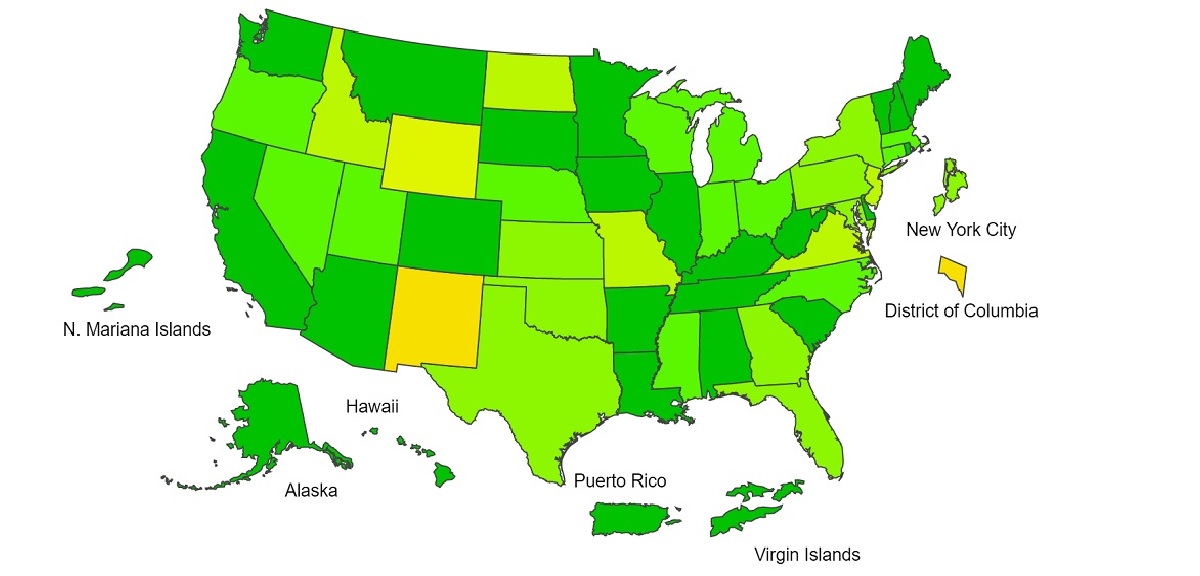
This week, 1 jurisdiction experienced low activity while the remaining jurisdictions experienced minimal activity.

Geographic Spread
Because of the ongoing COVID-19 pandemic, this system will suspend data collection for the 2020-21 influenza season.
Severe Disease


Hospitalizations
Hospitalization rates will be updated weekly starting later this season.

P&I Mortality
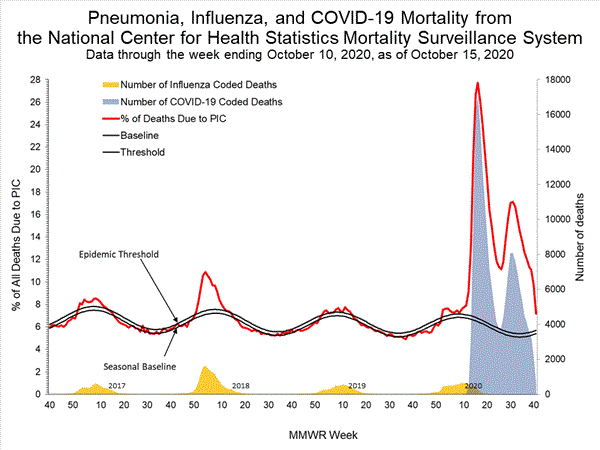
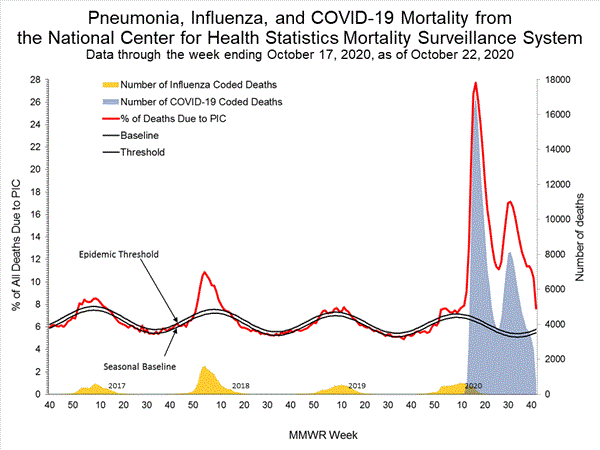
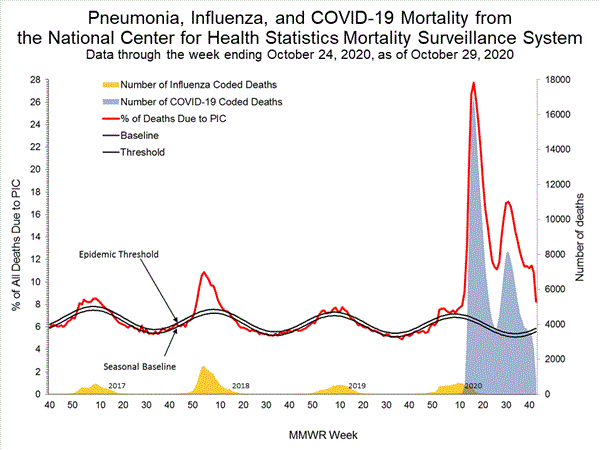
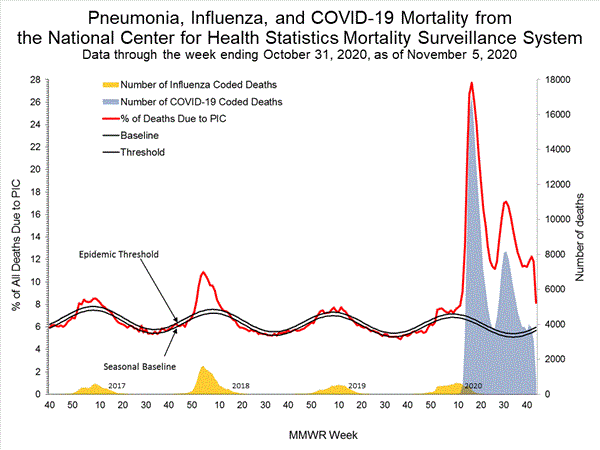
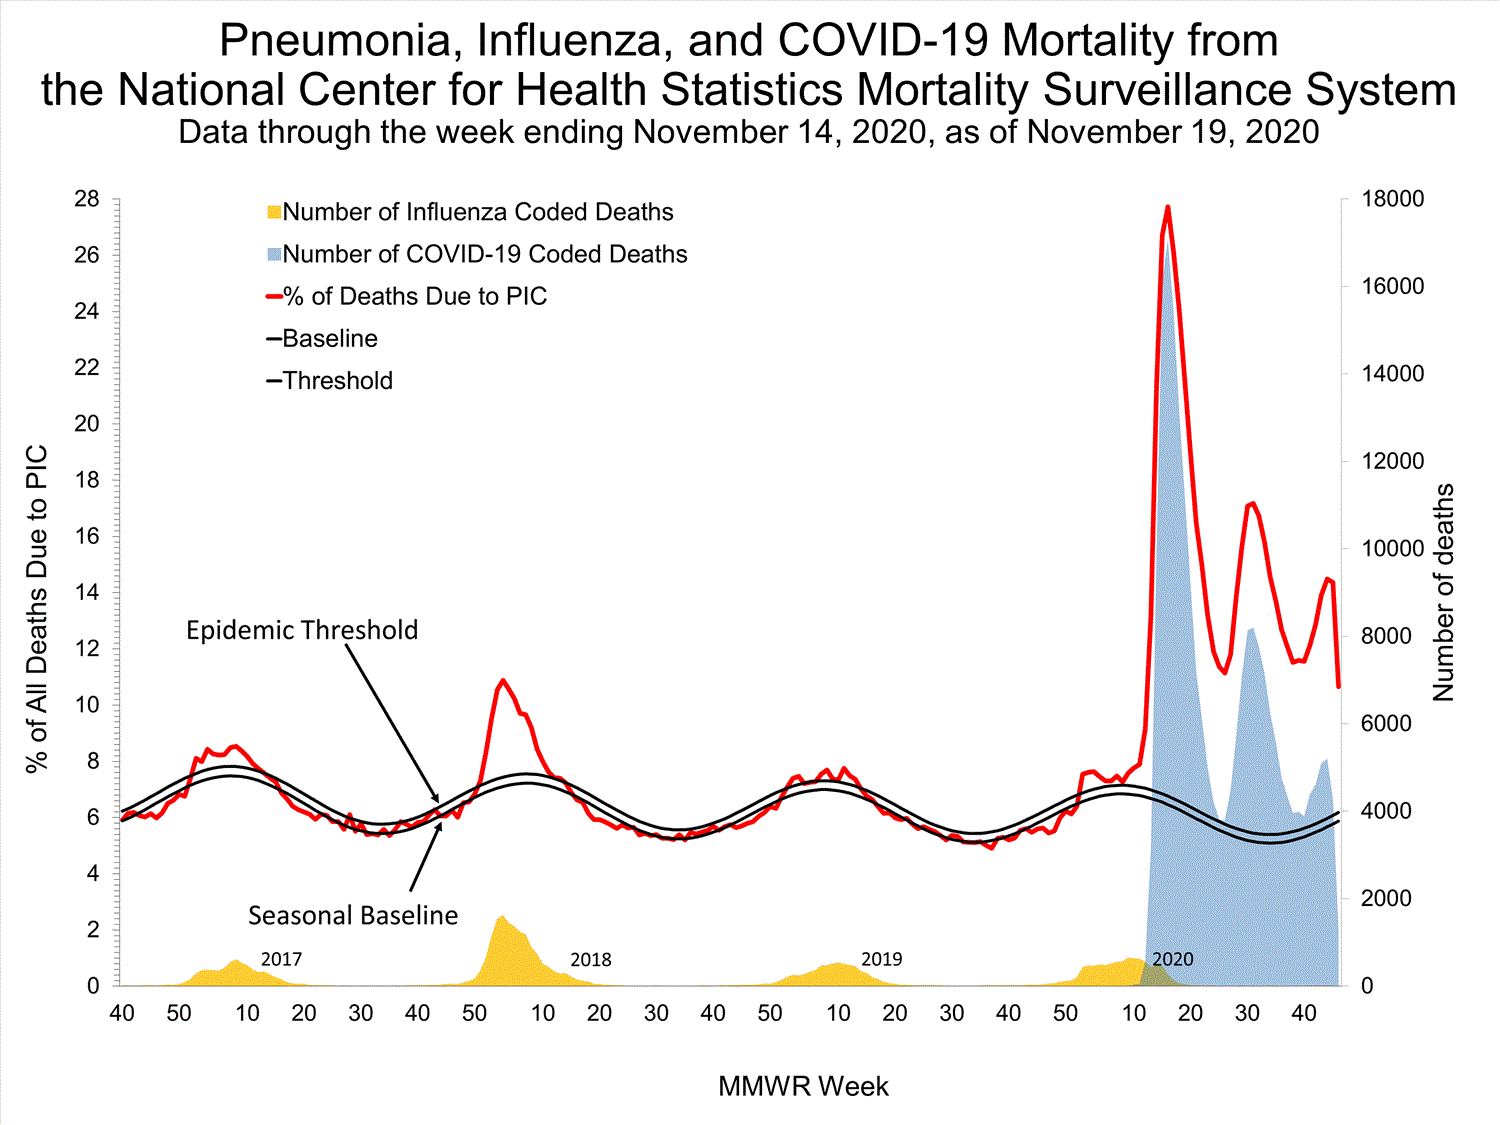
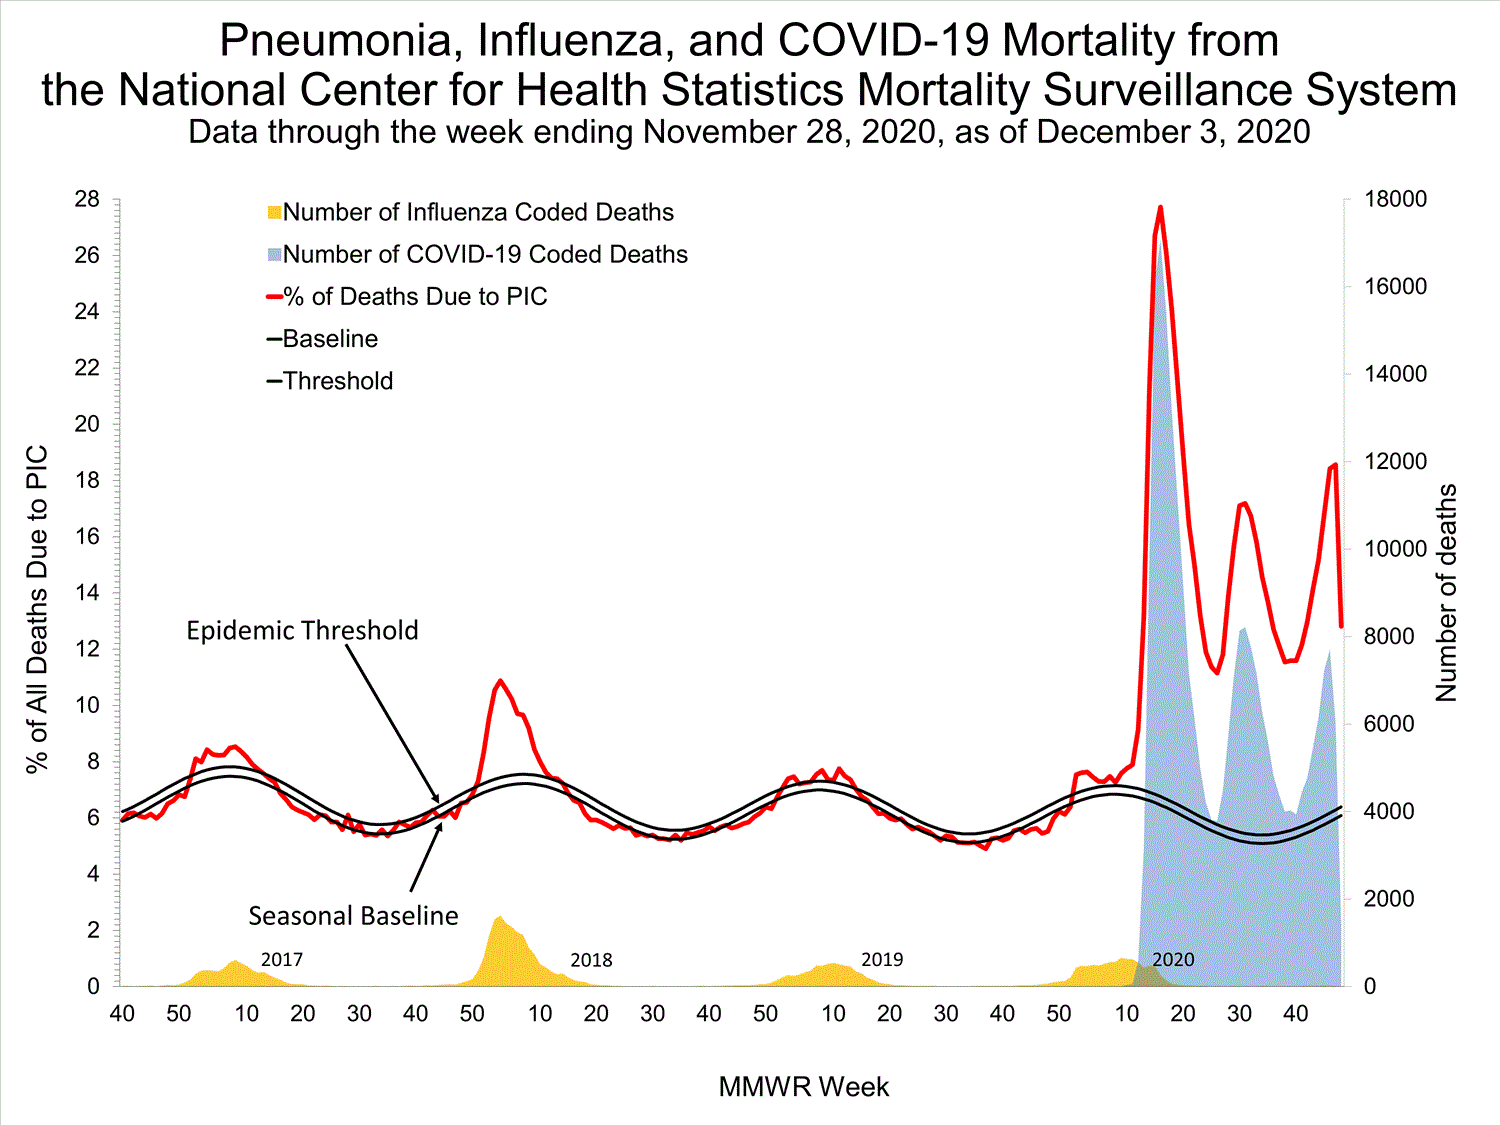
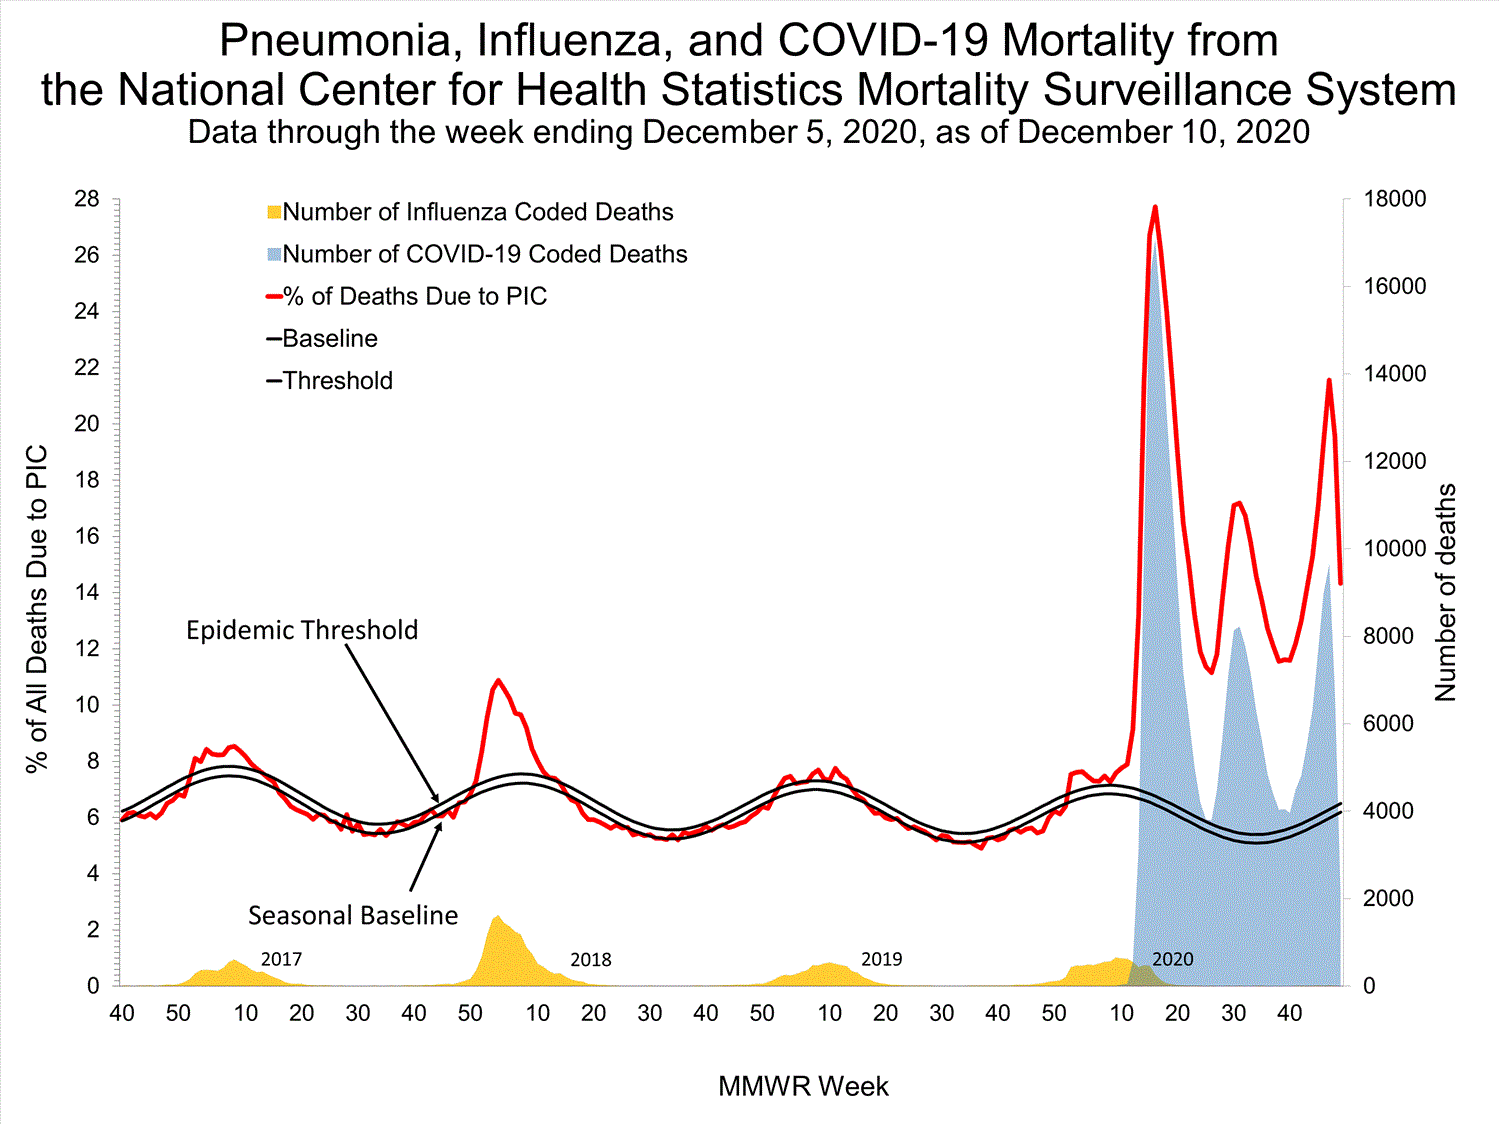
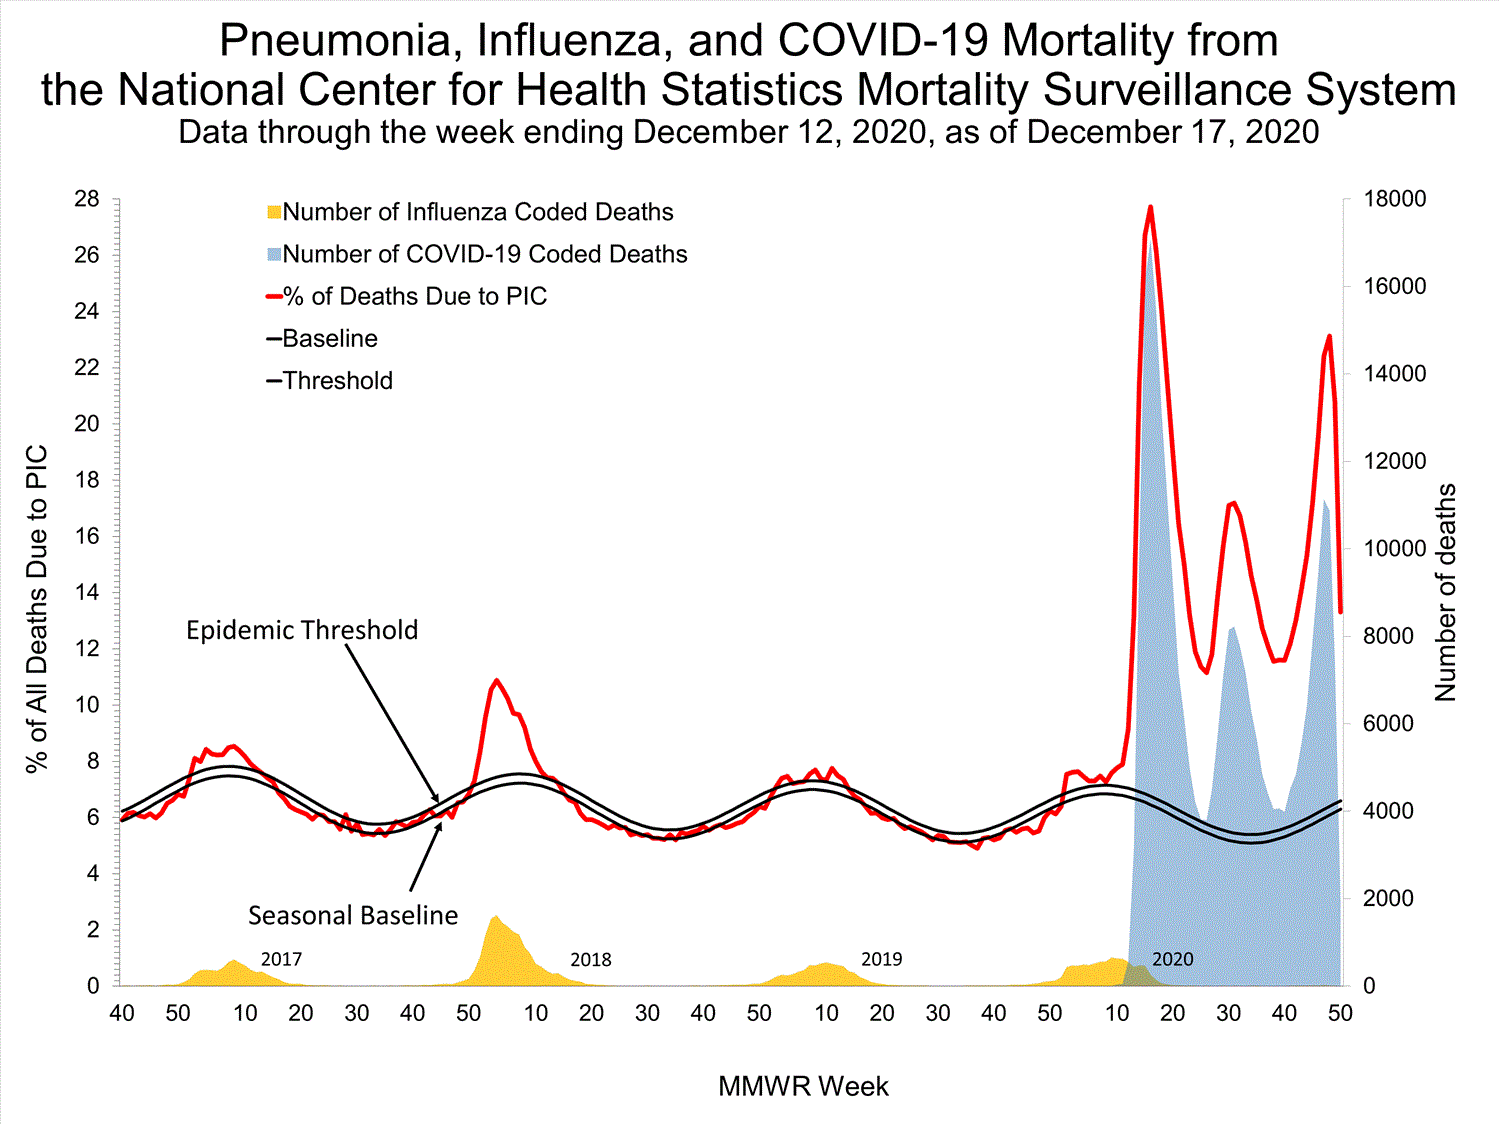
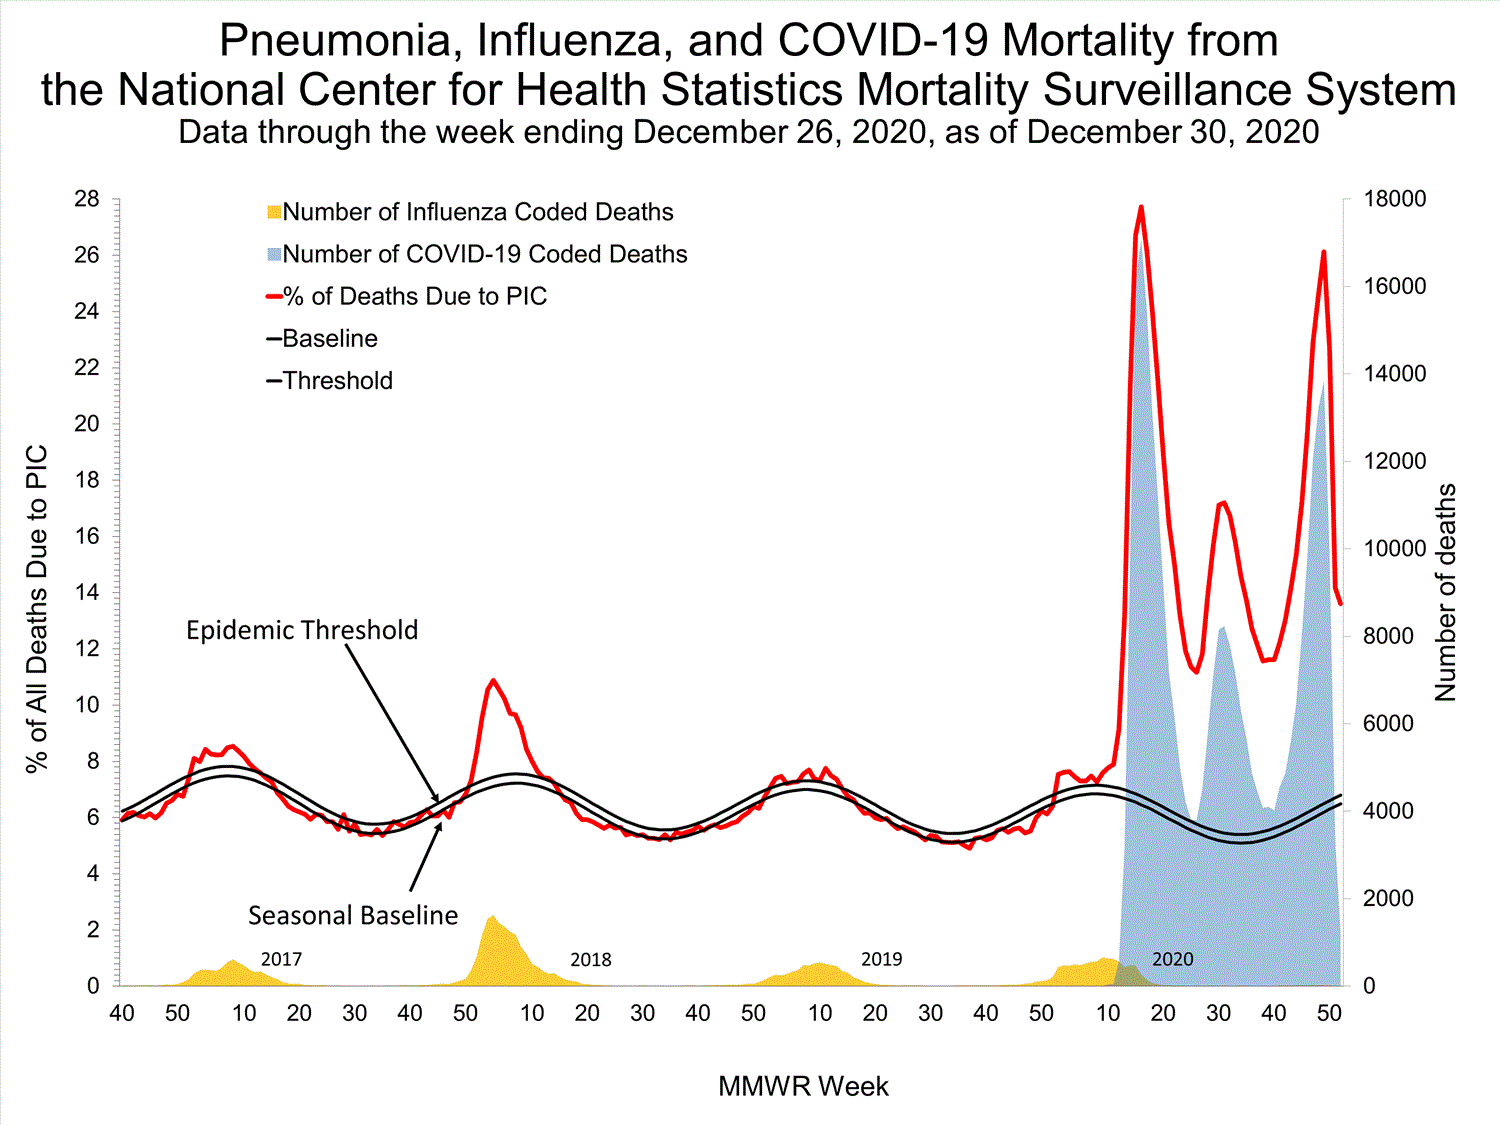
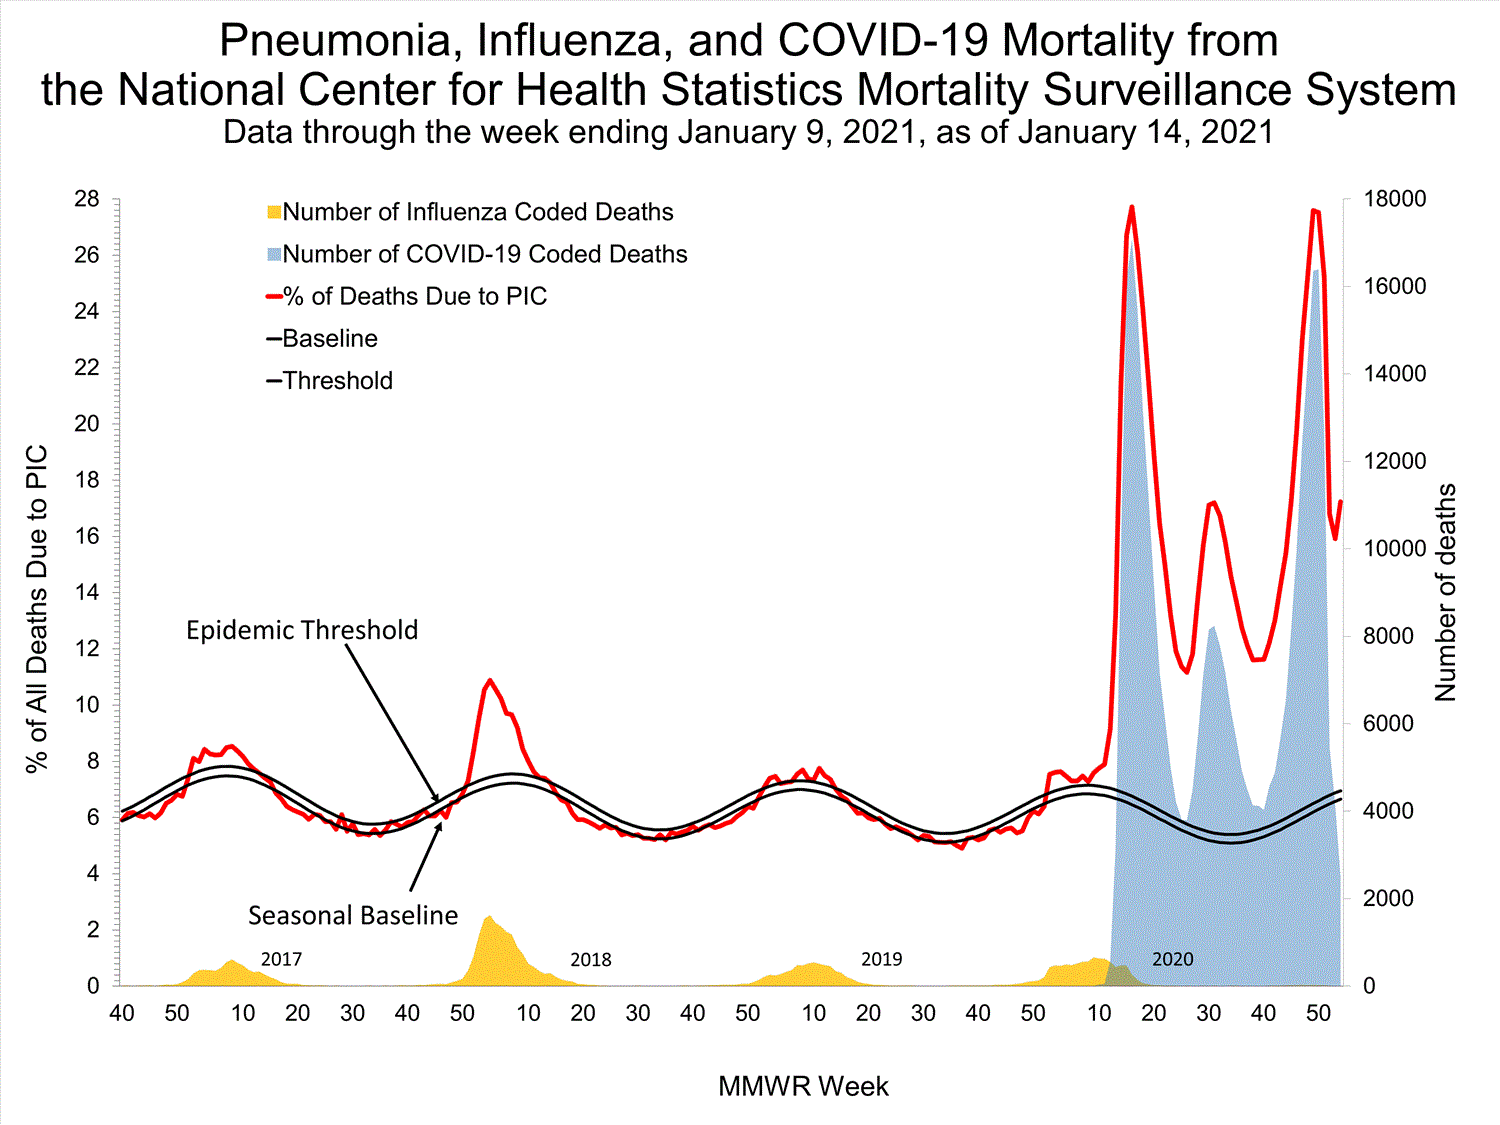
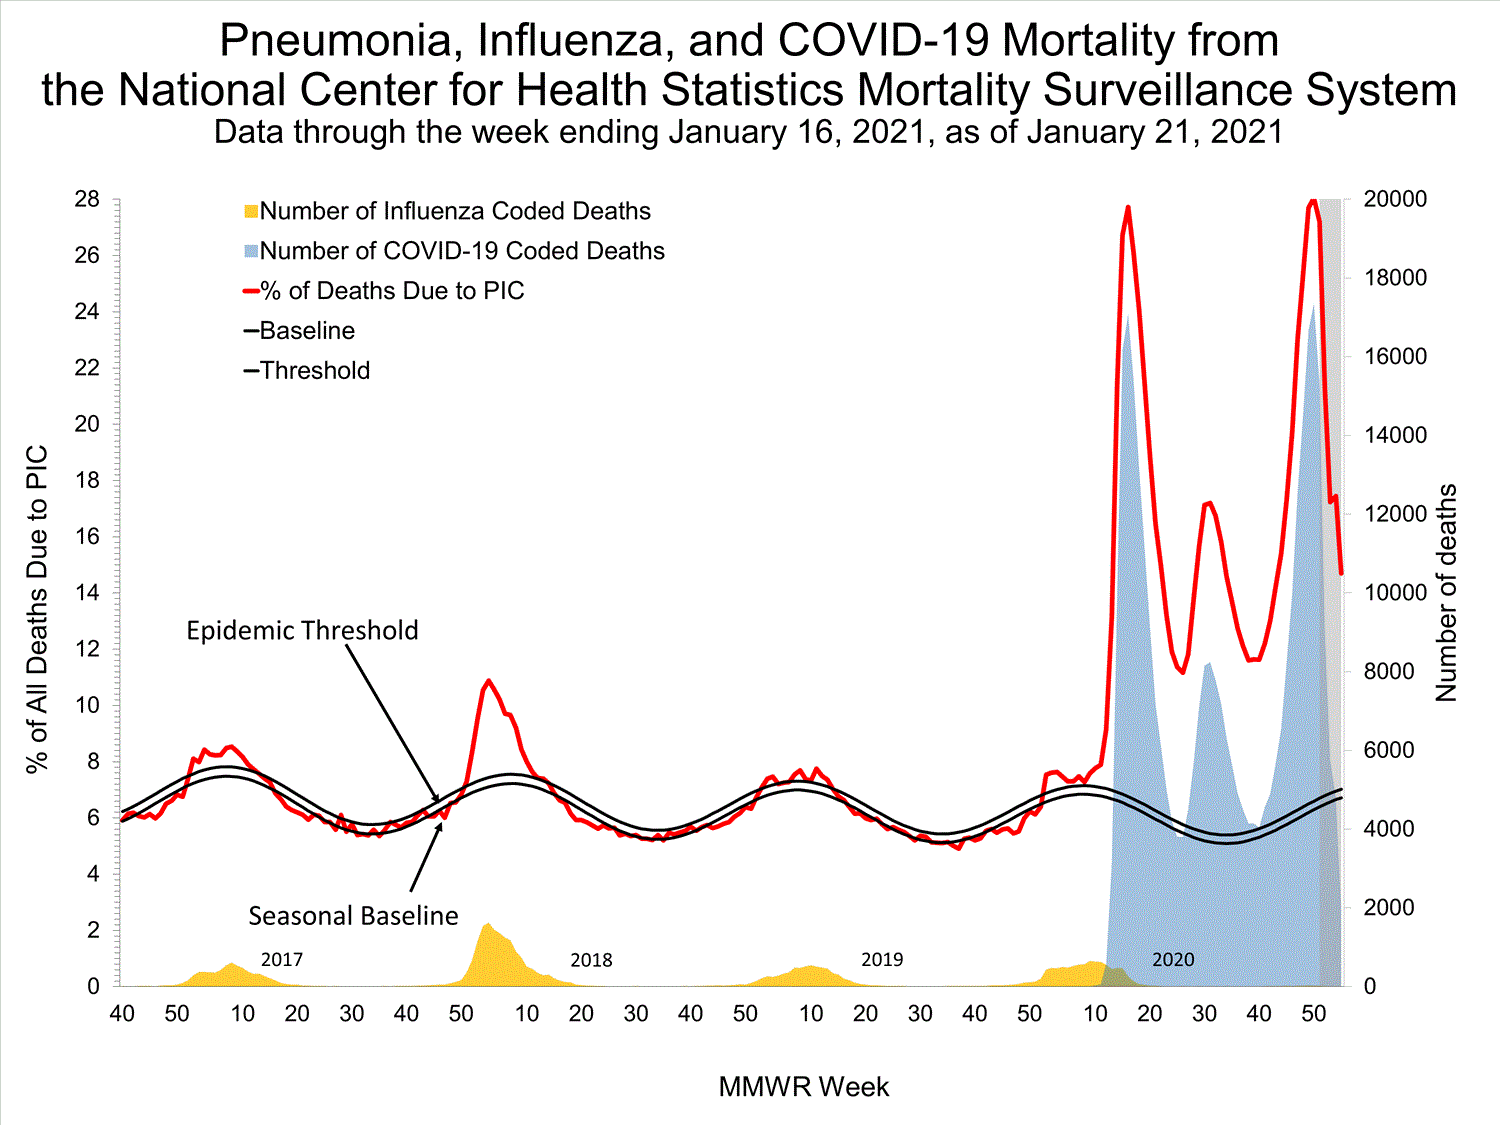
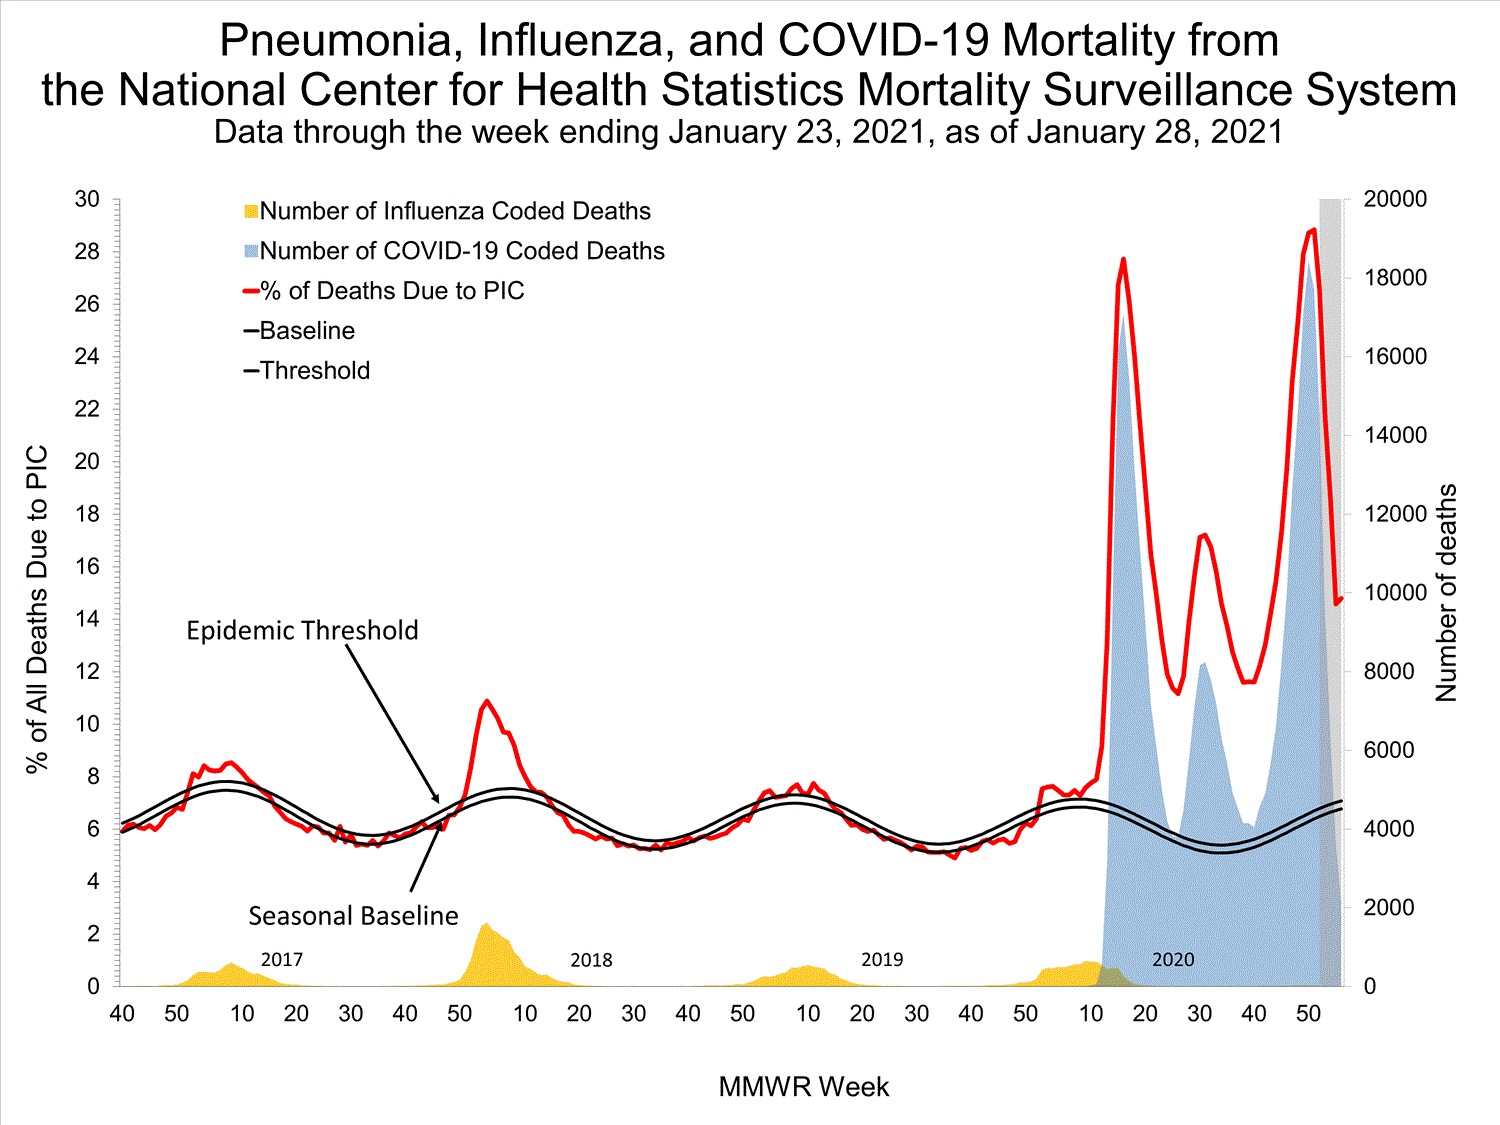
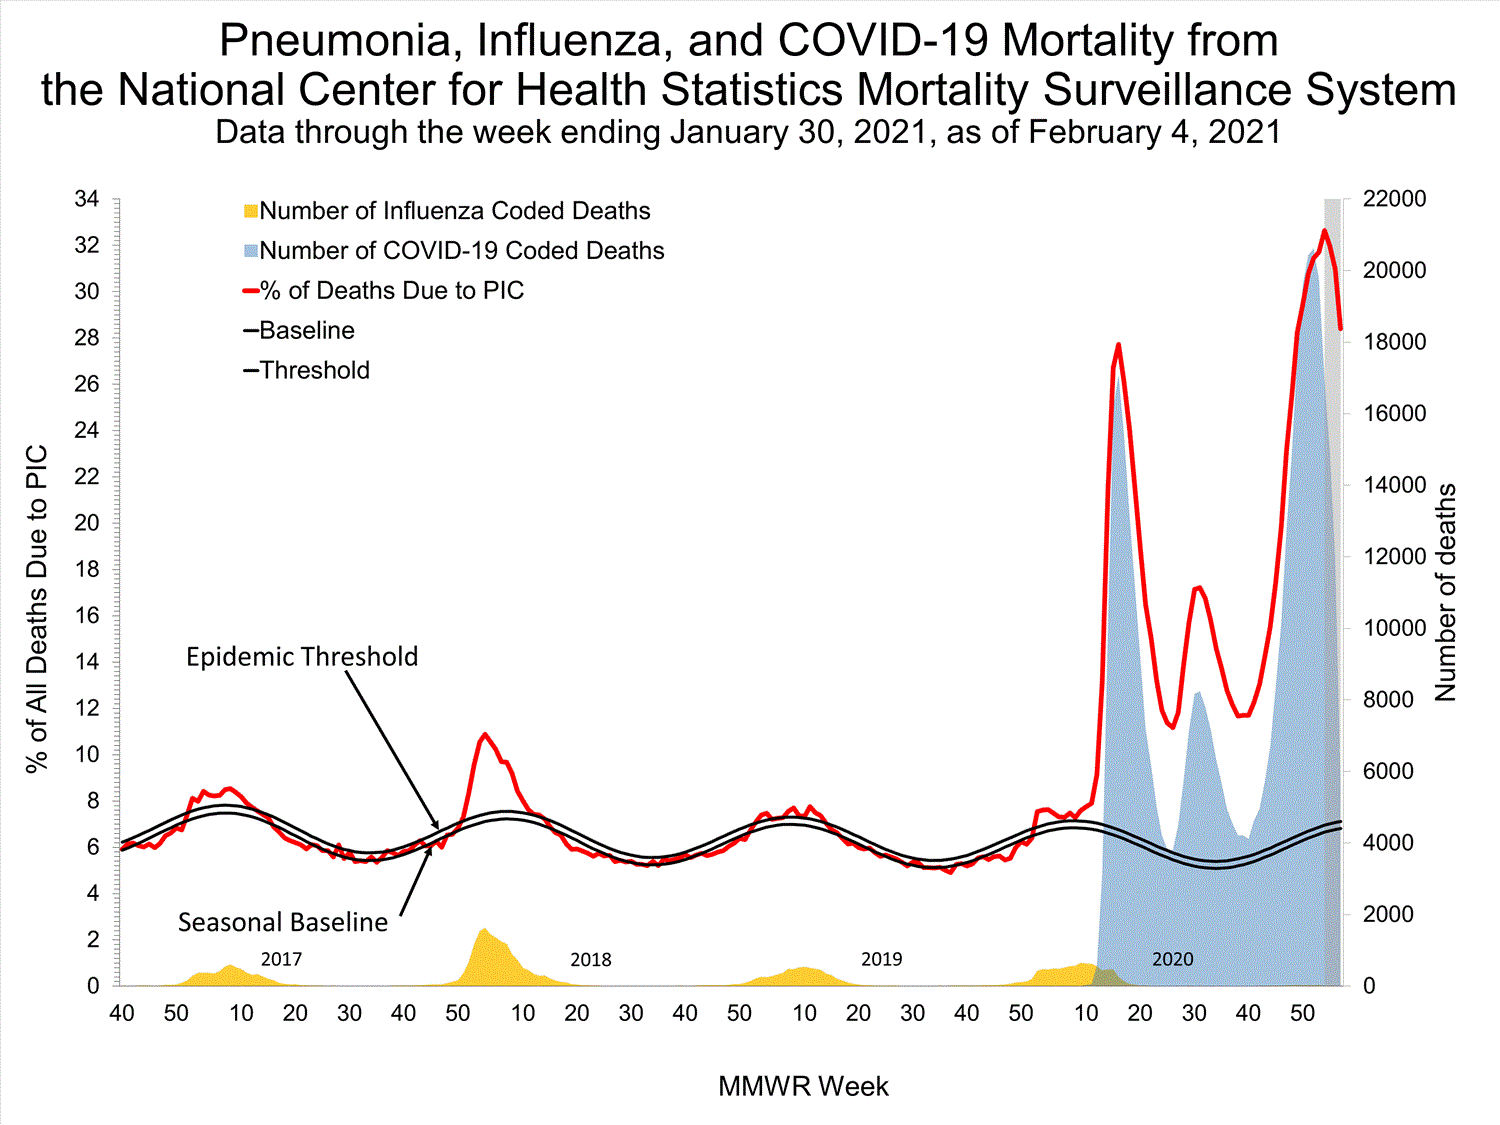
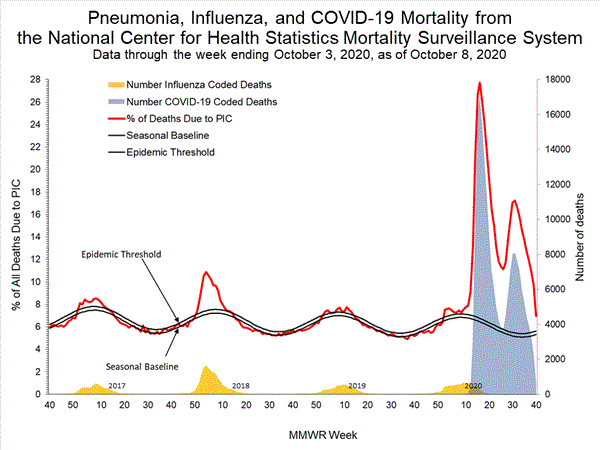
7.0% of deaths were attributed to pneumonia, influenza, or COVID-19 (PIC). This is above the epidemic threshold of 5.6%.

Pediatric Deaths
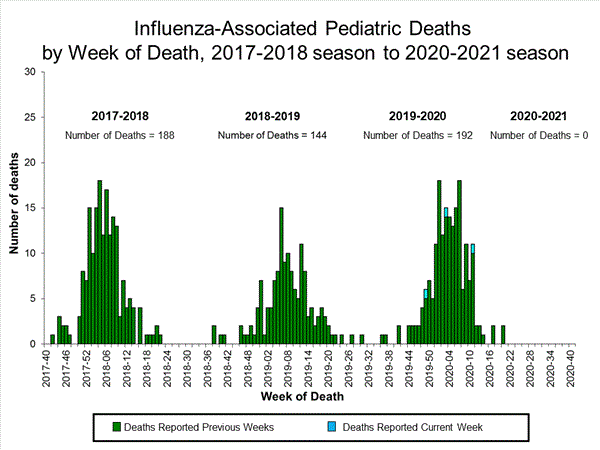
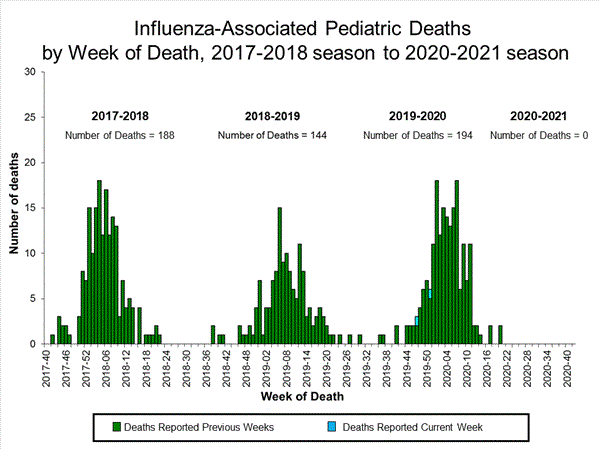
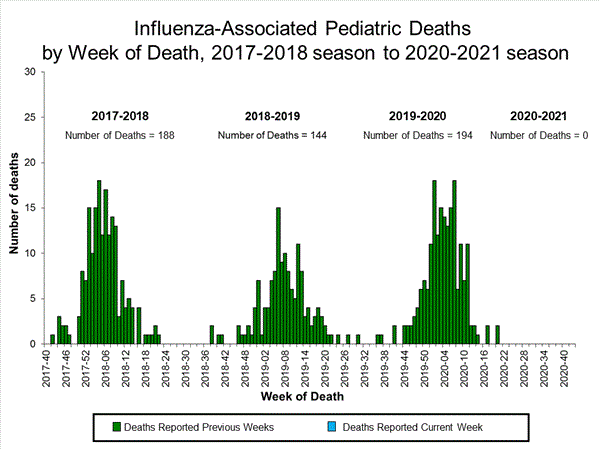
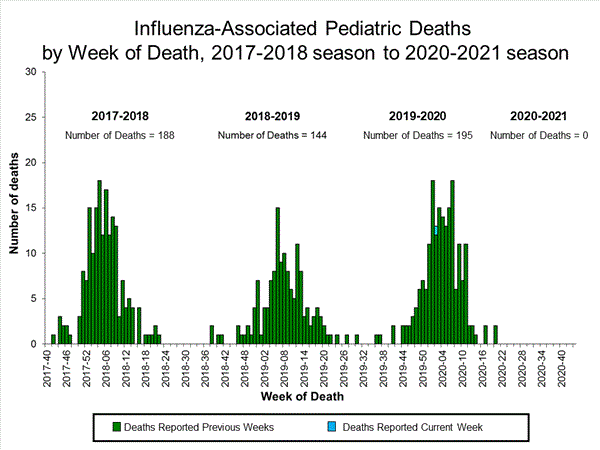
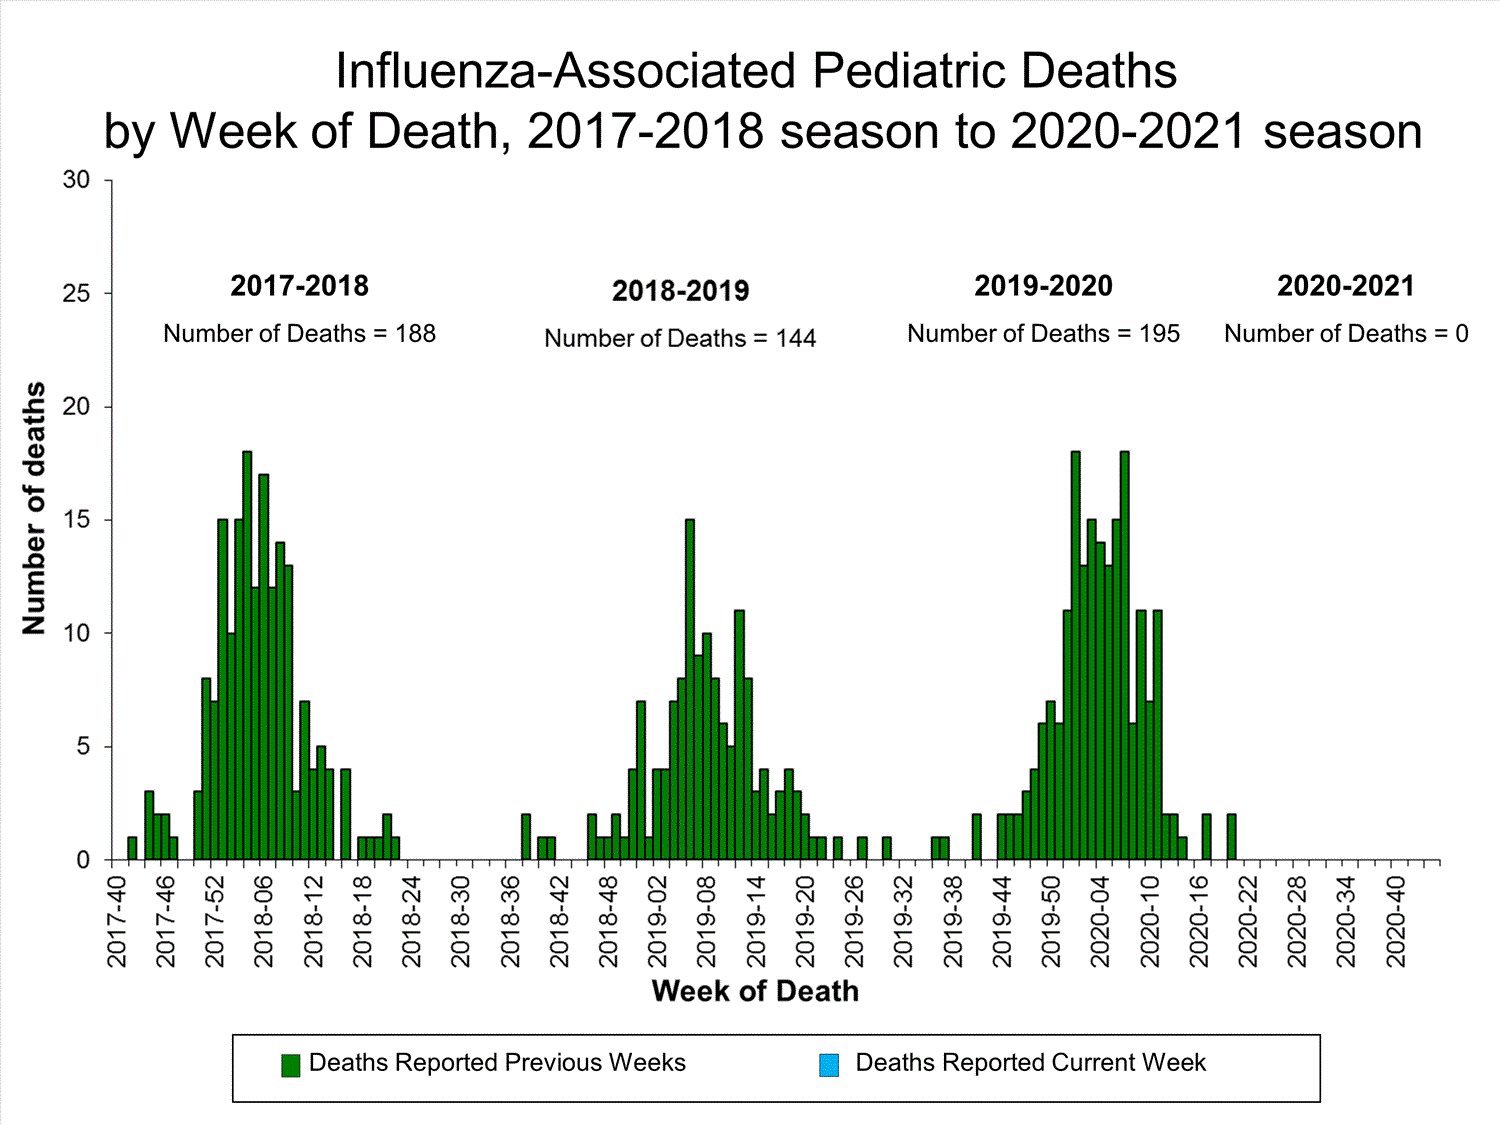
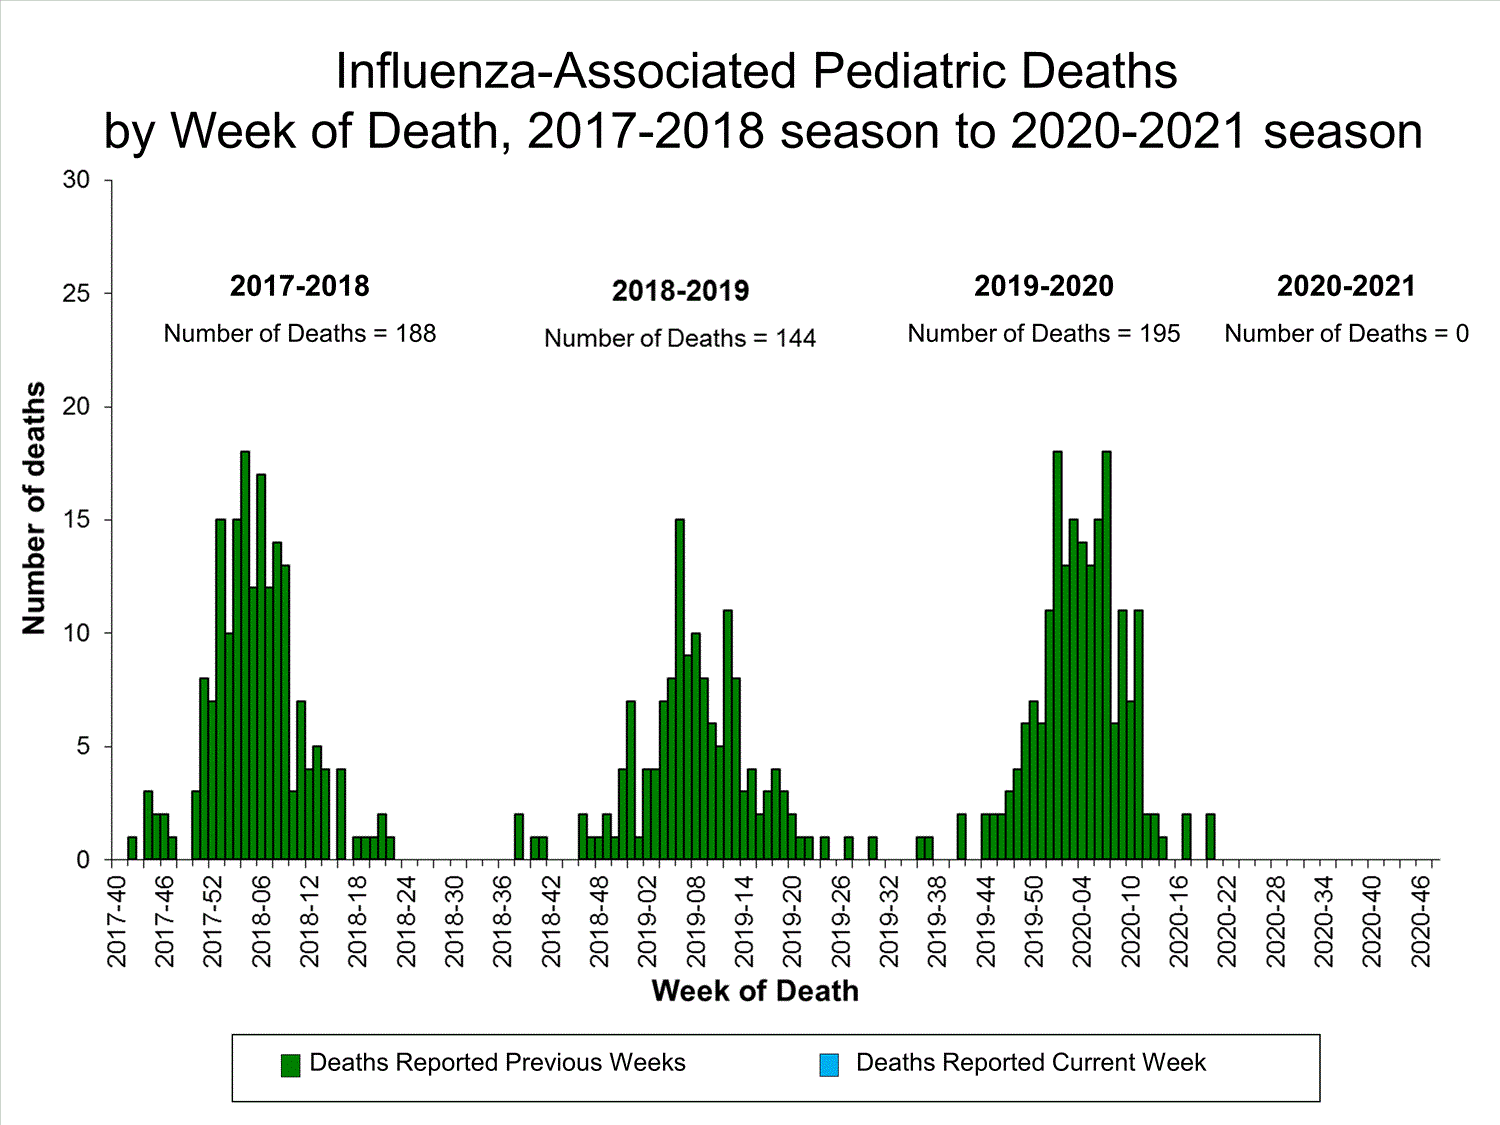
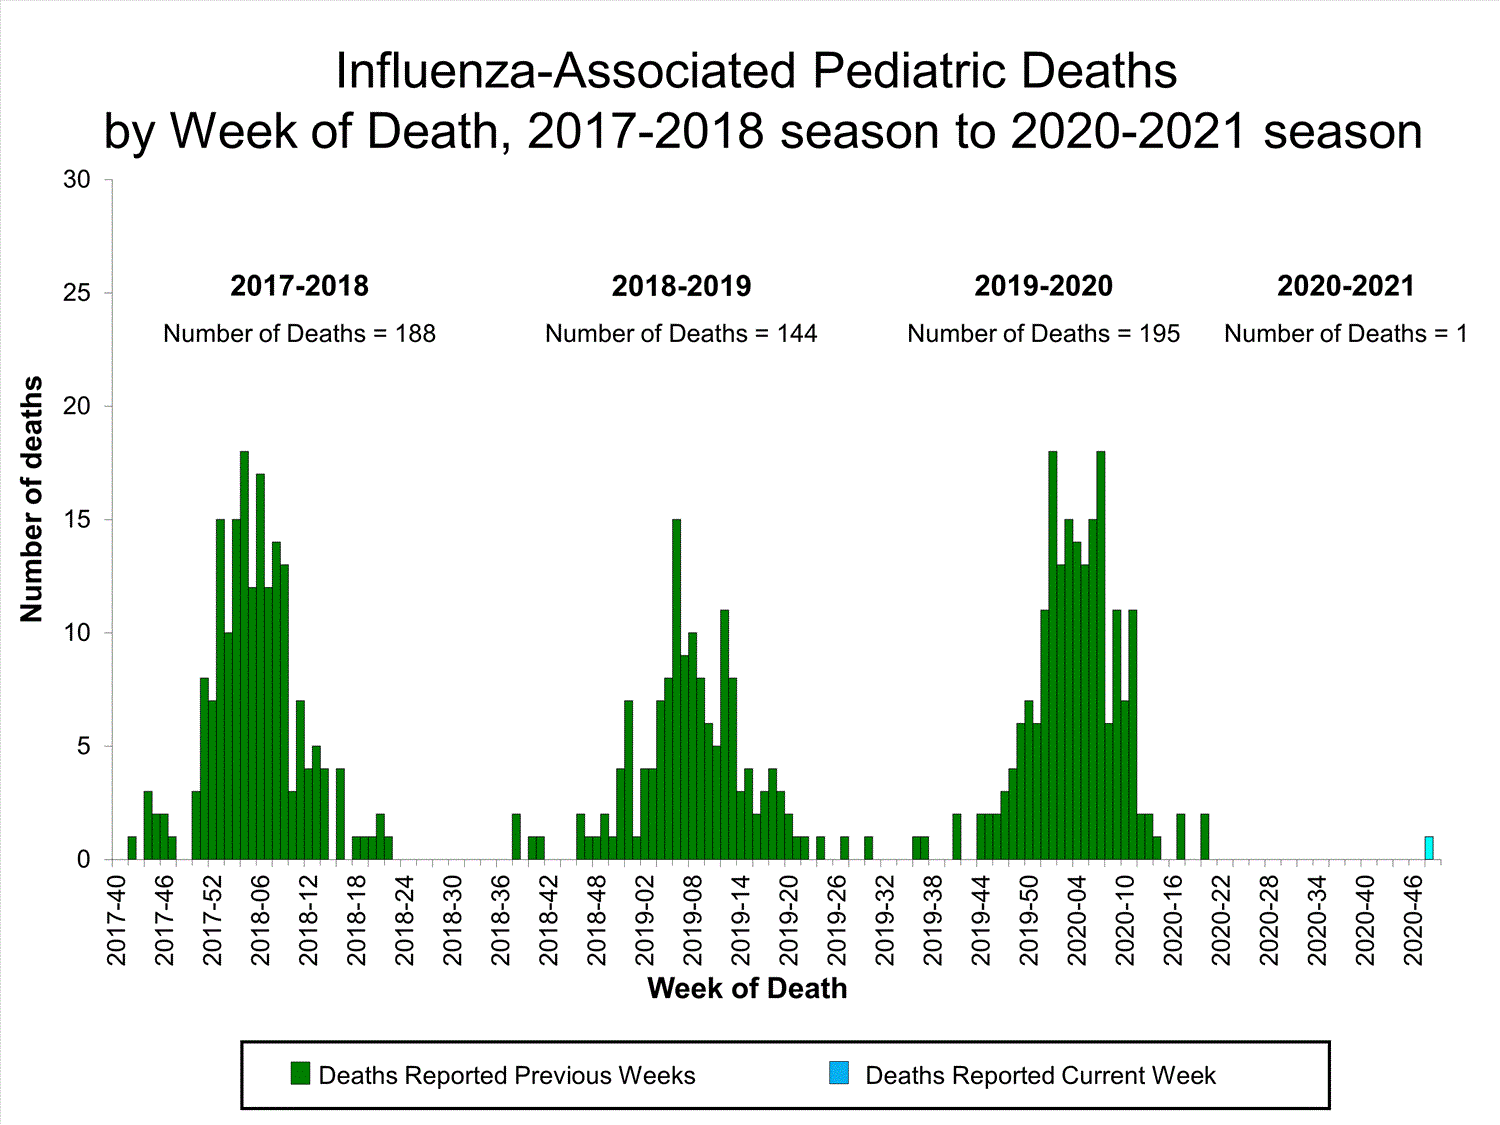
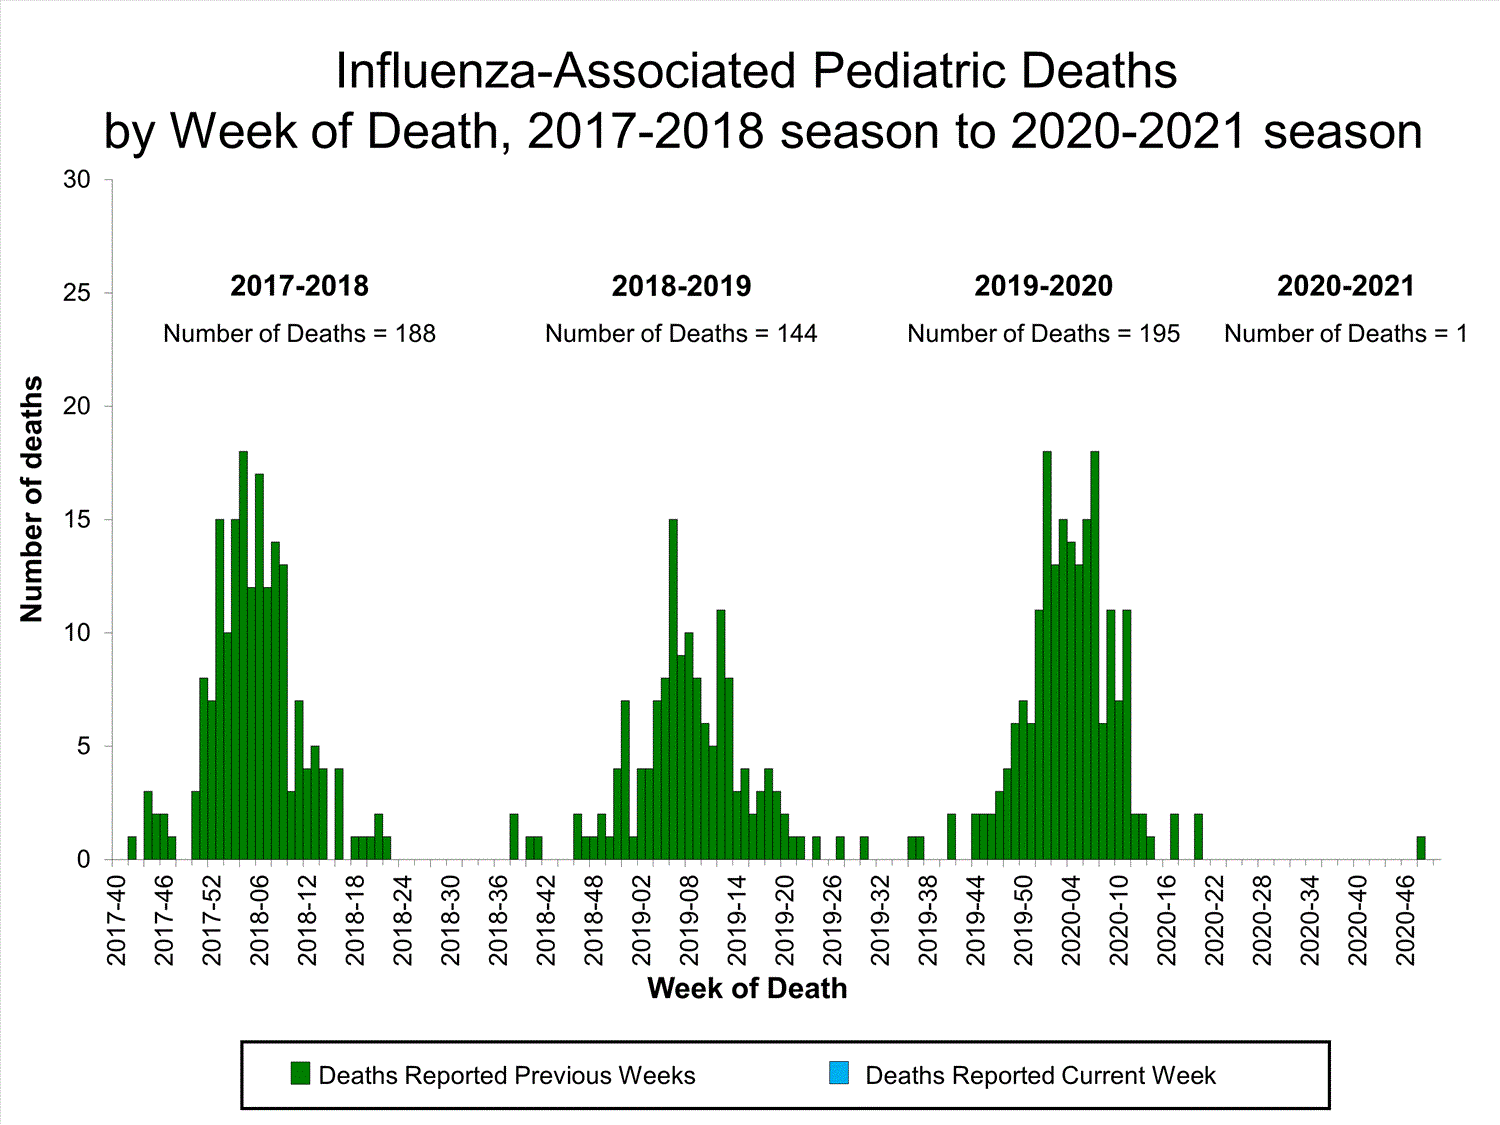
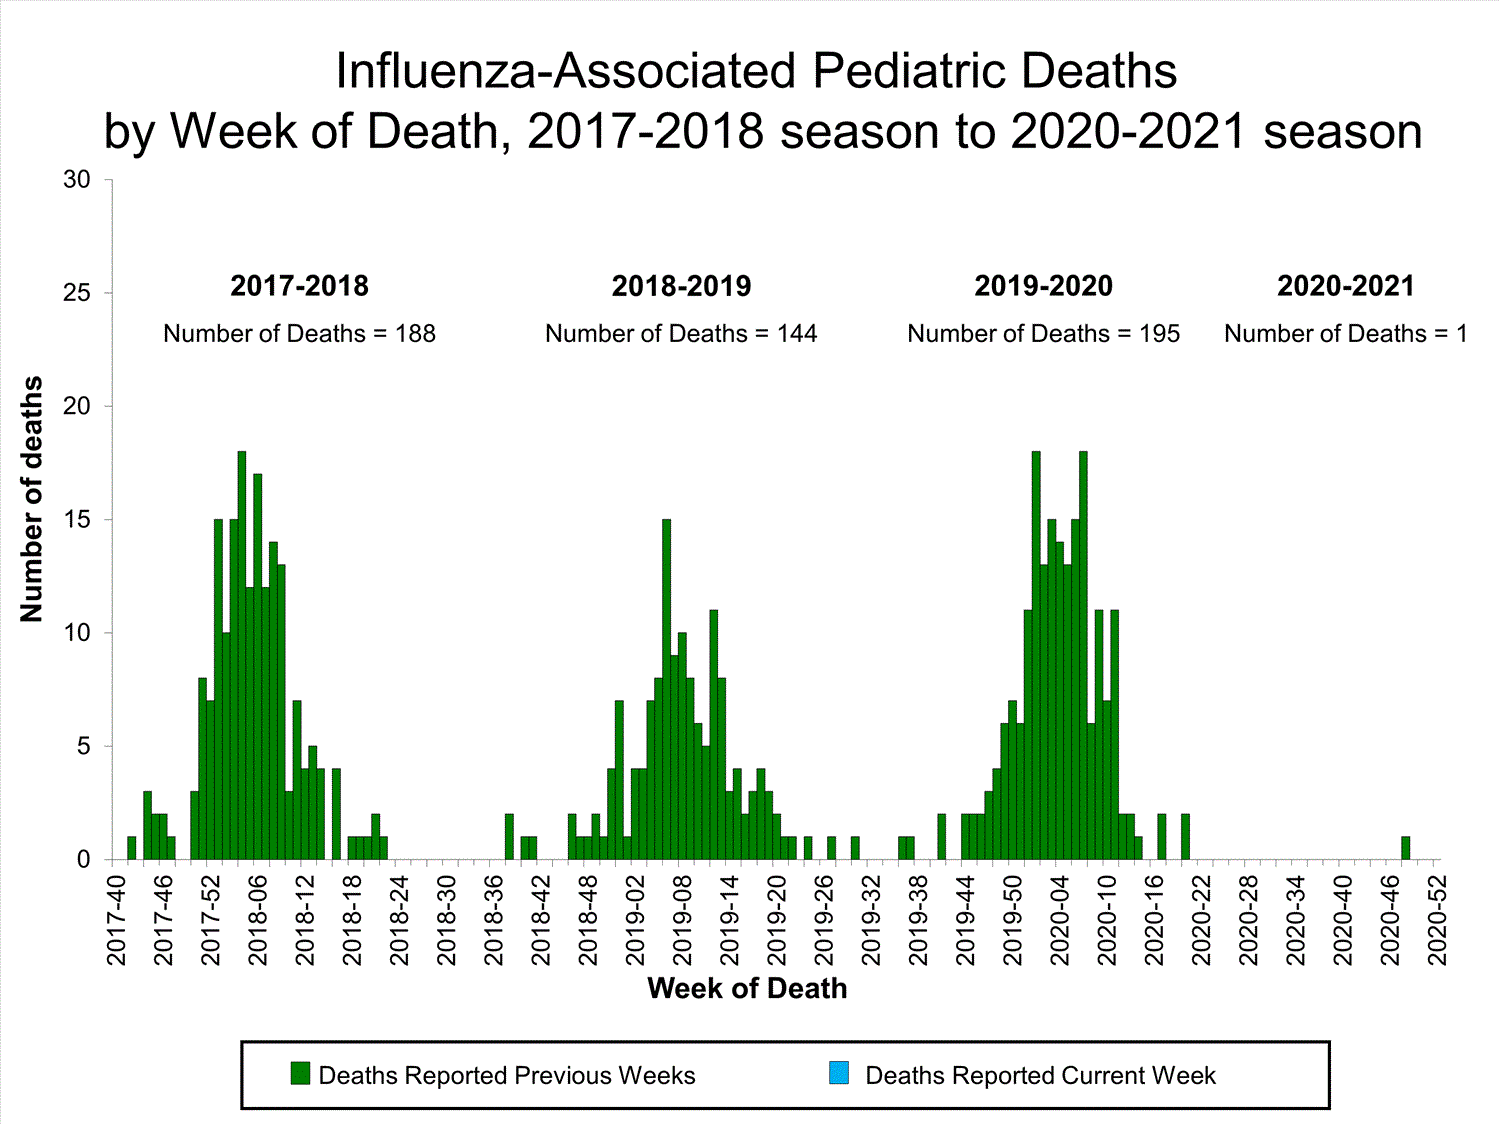
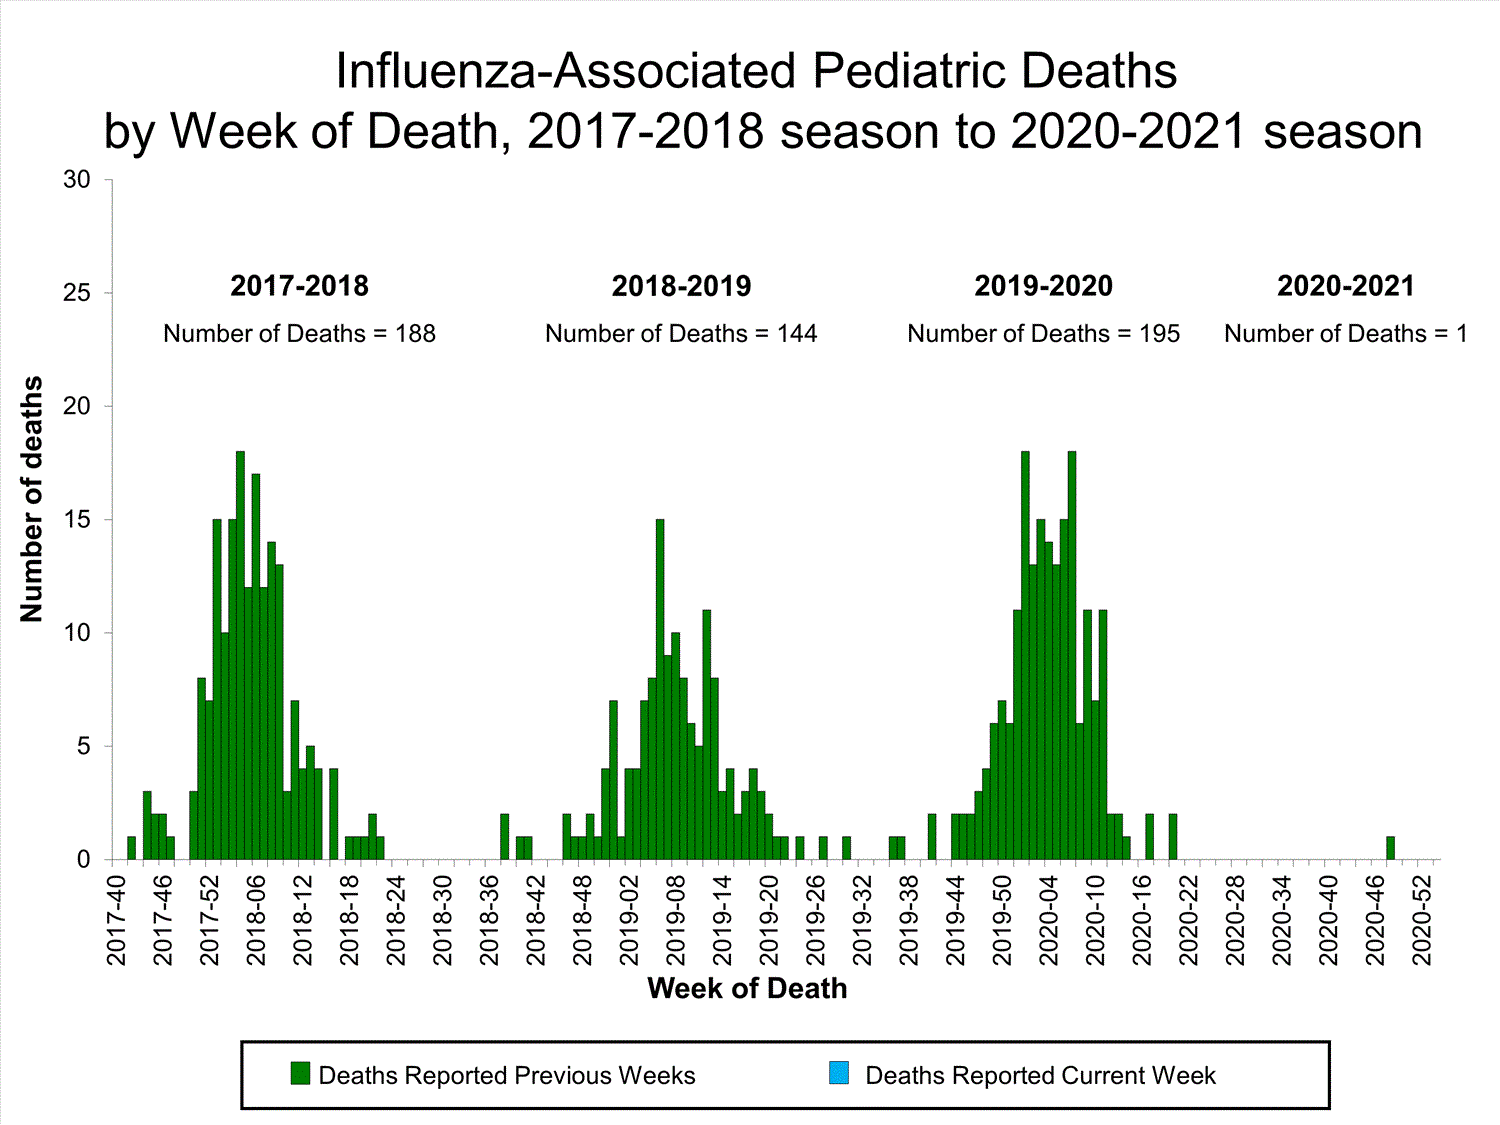
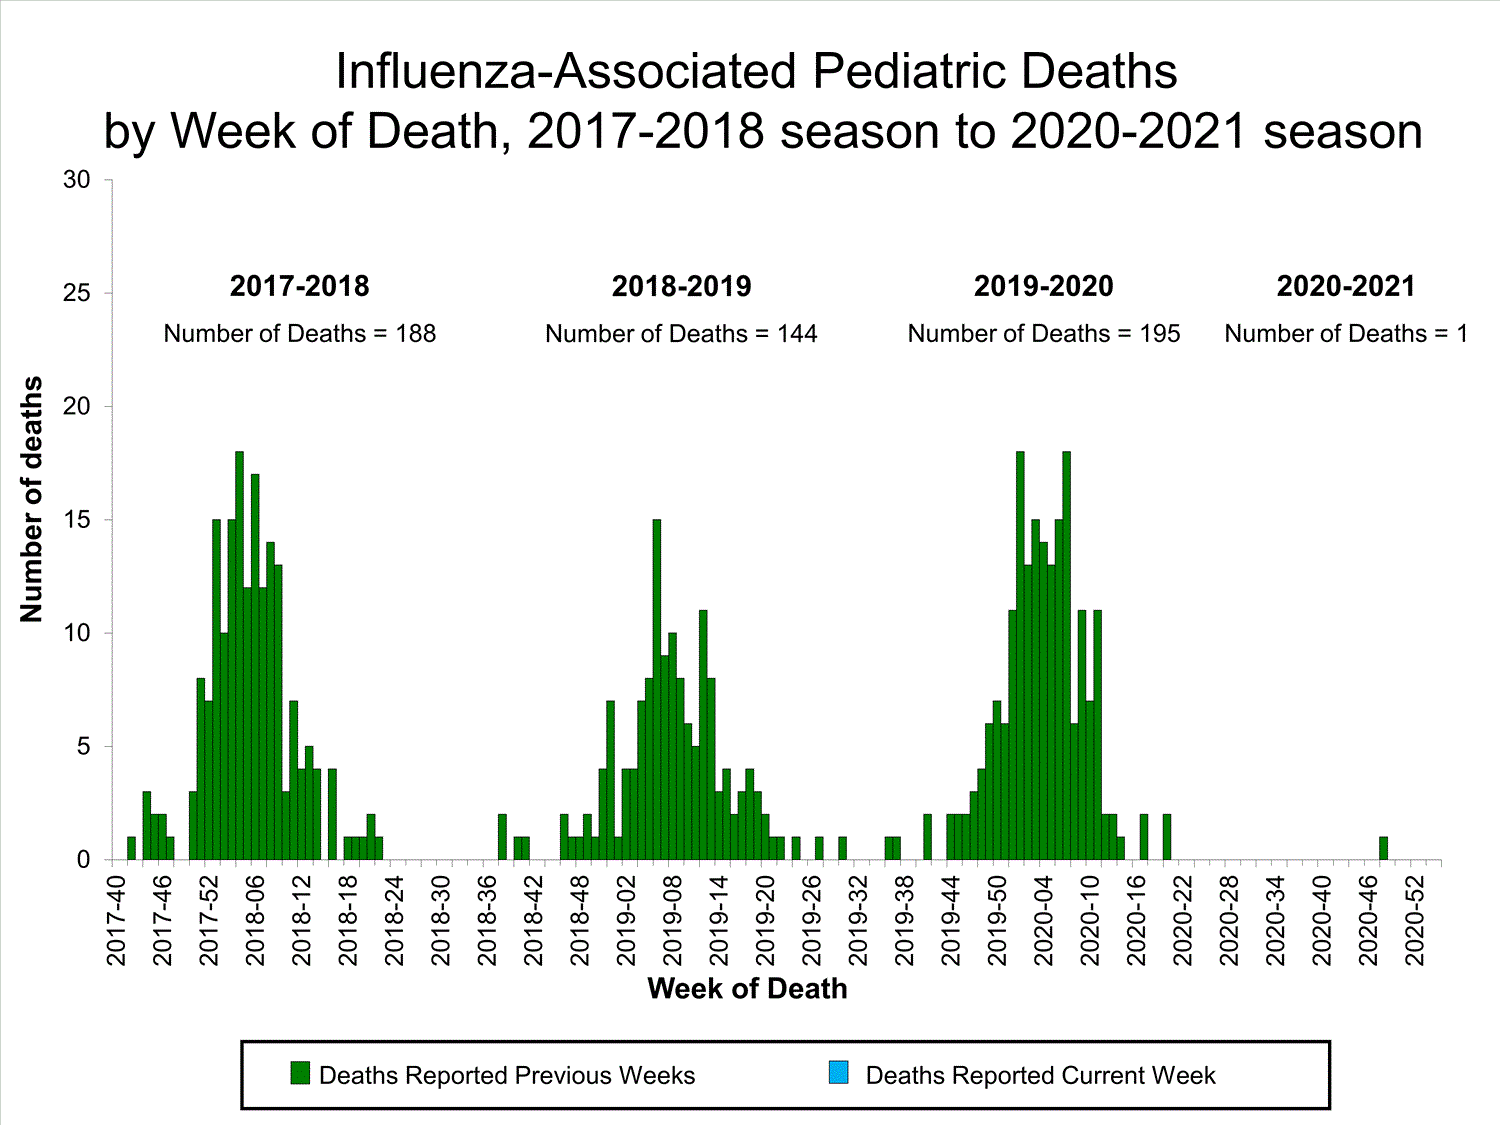
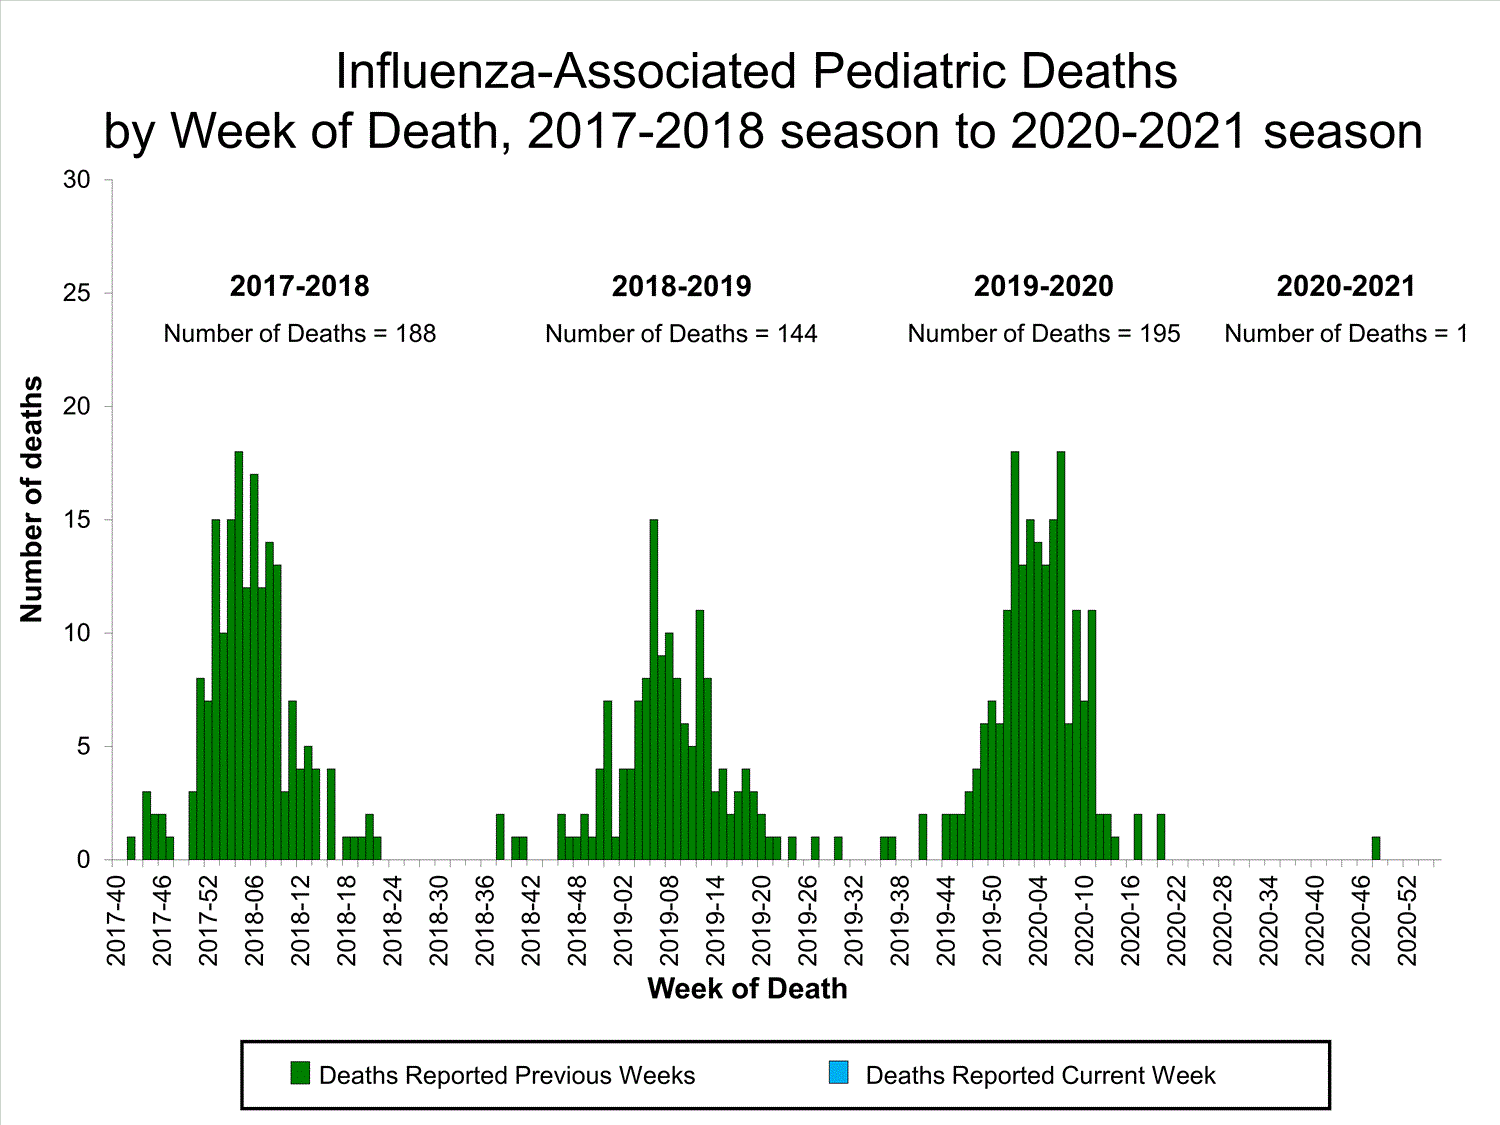
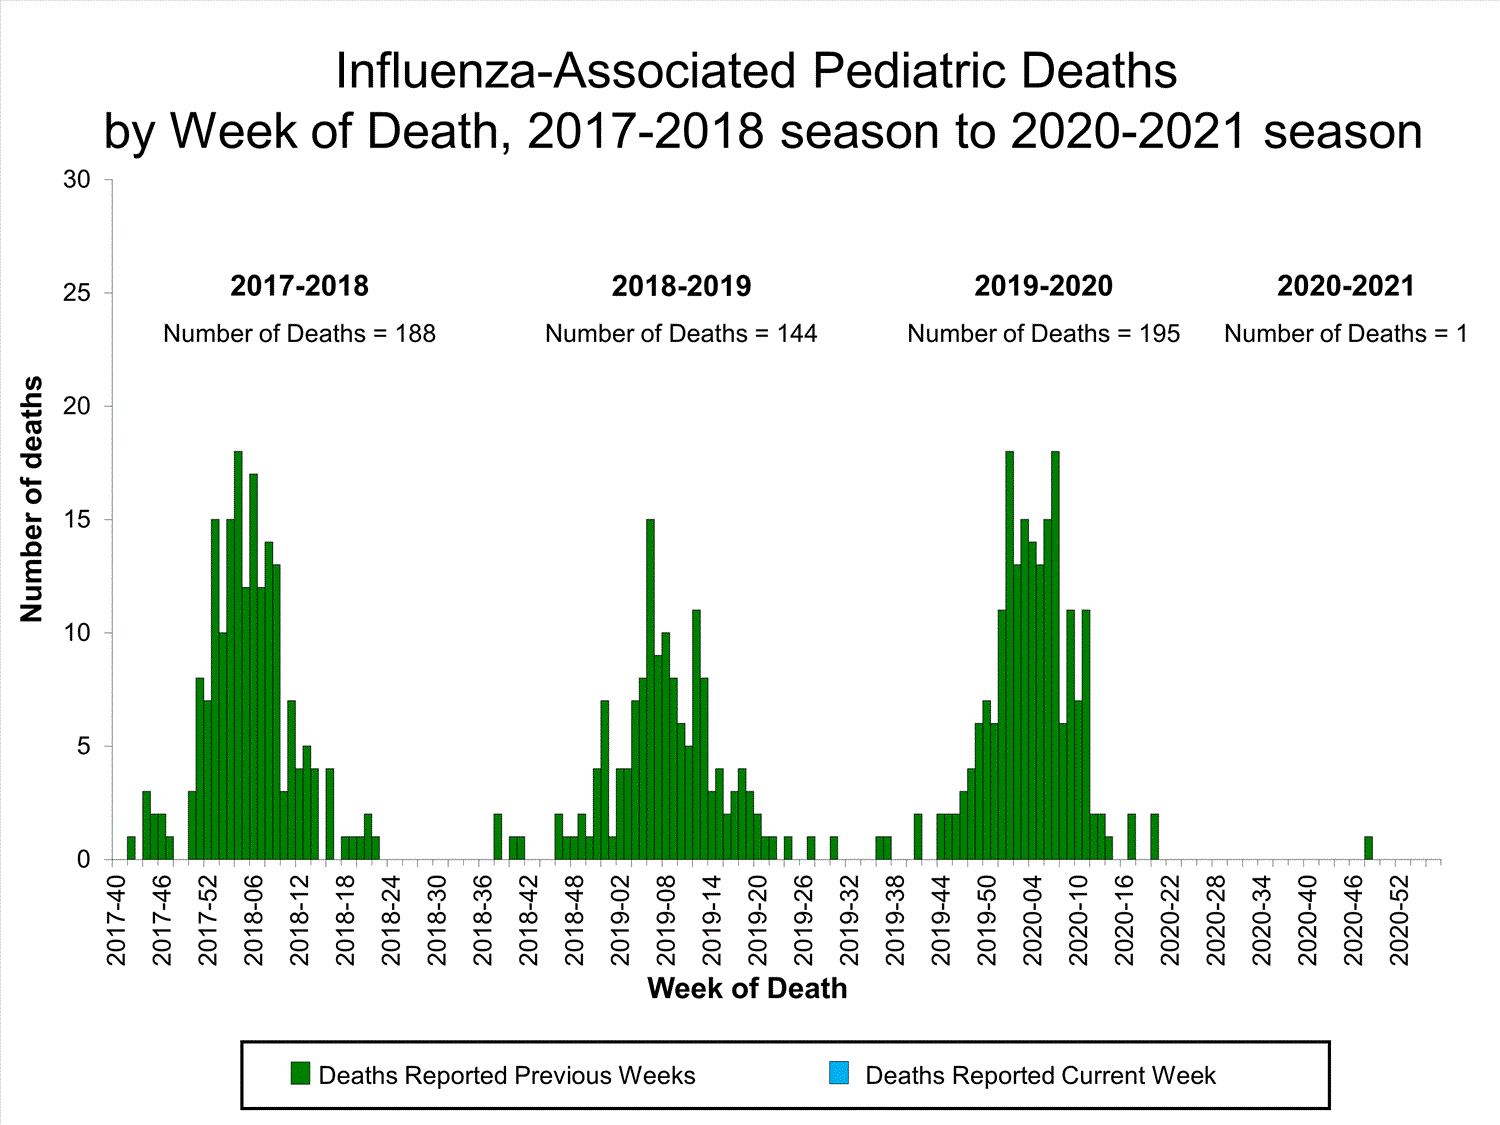
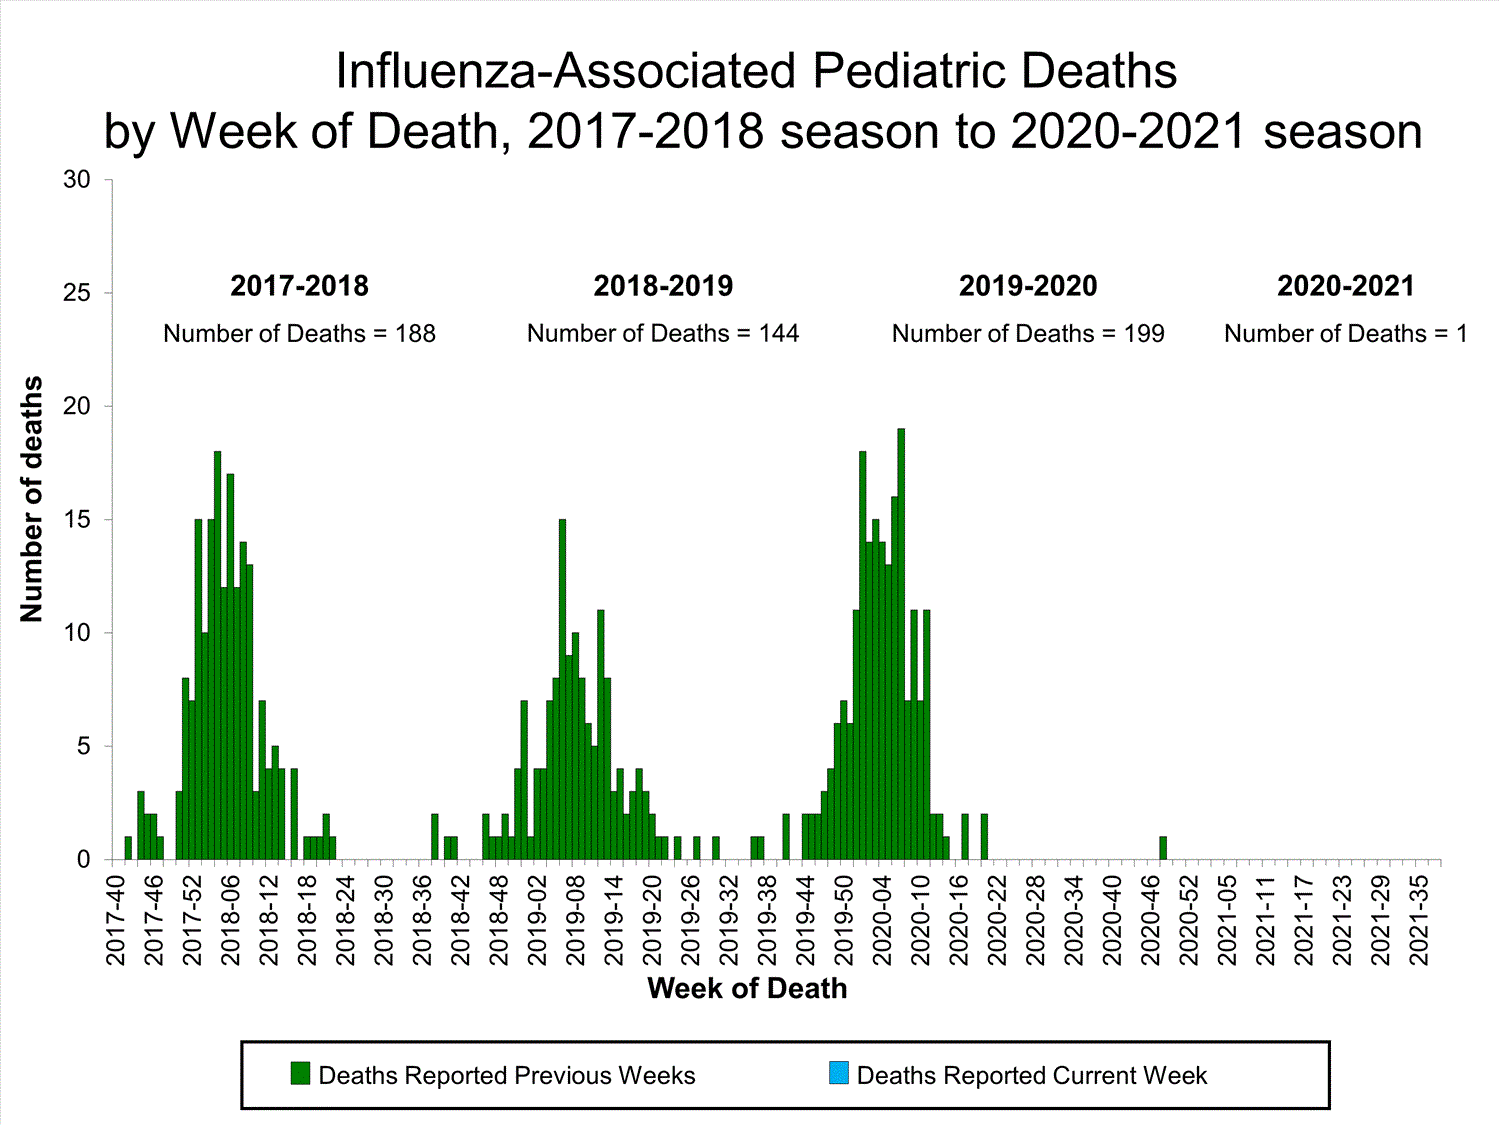
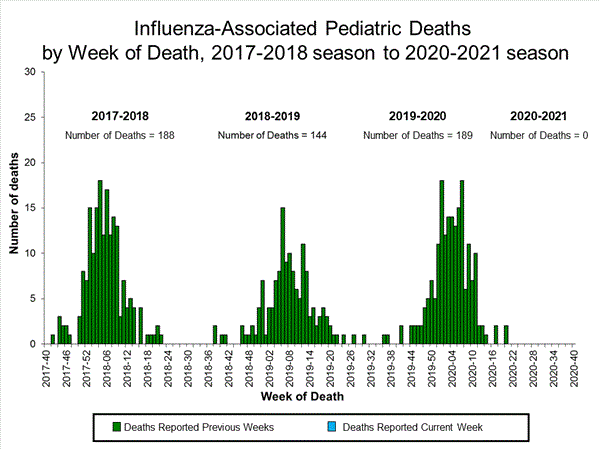
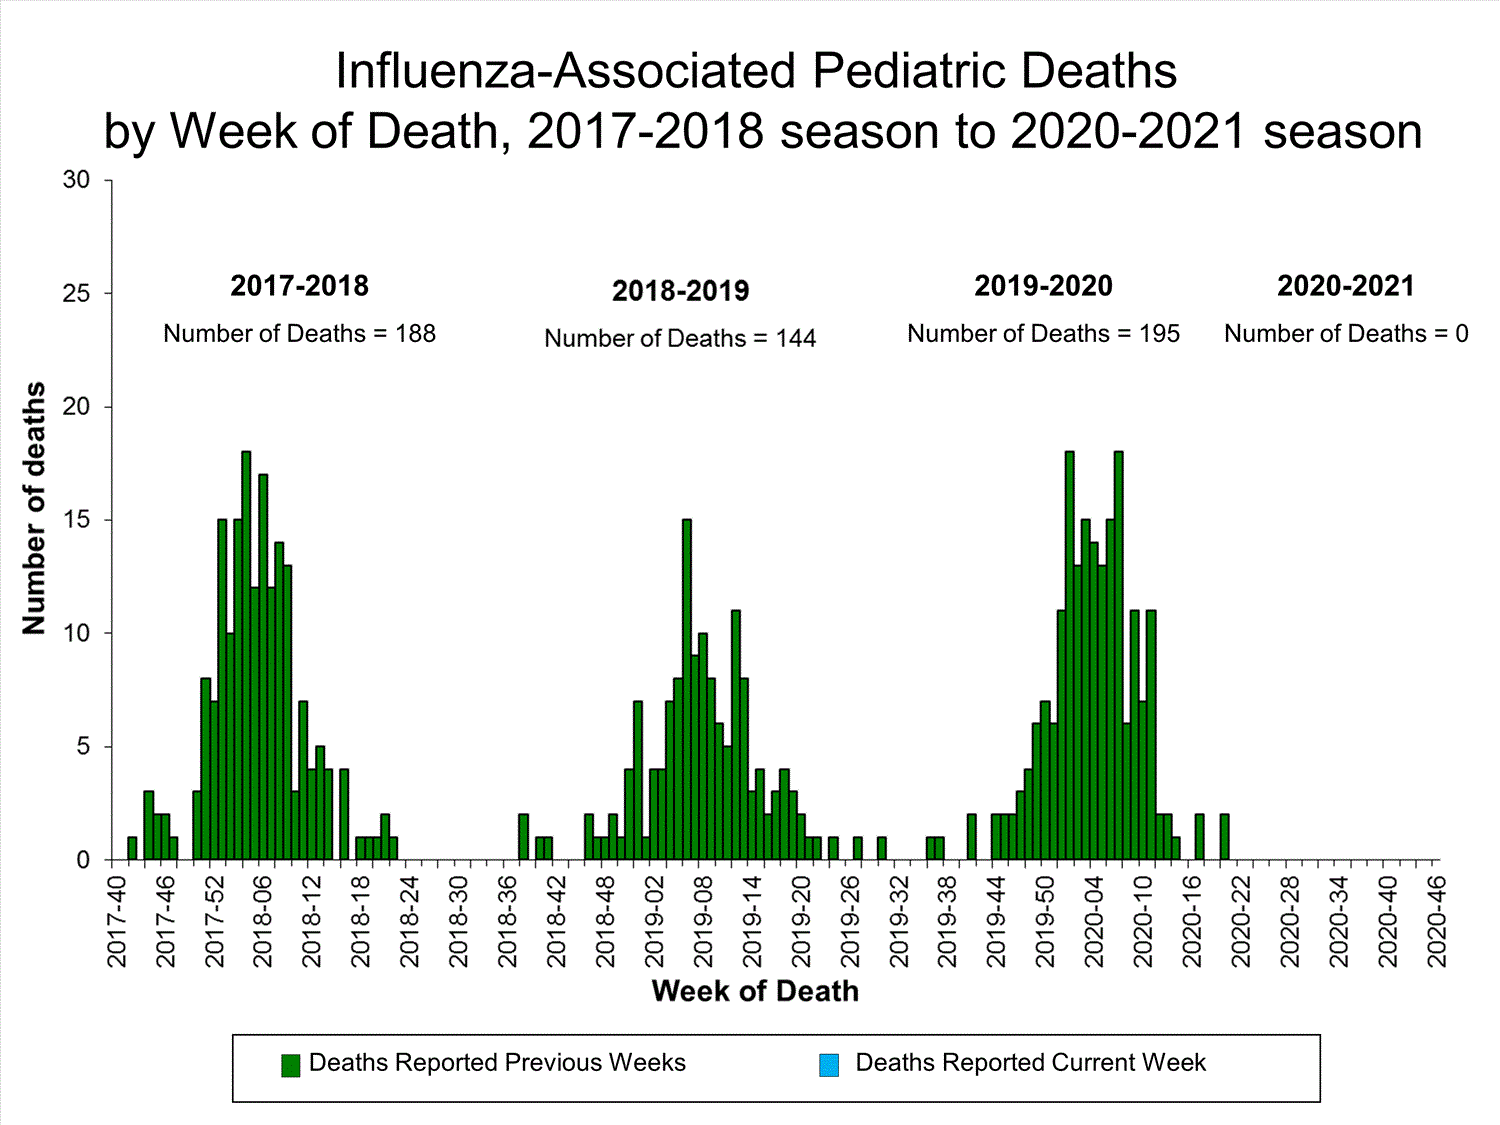
No influenza-associated pediatric deaths occurring during the 2020-21 season have been reported to CDC. 189 deaths occurring during the 2019-20 season have been reported.

All data are preliminary and may change as more reports are received.

A description of the CDC influenza surveillance system, including methodology and detailed descriptions of each data component is available on the surveillance methods page.

Additional information on the current and previous influenza seasons for each surveillance component are available on FluView Interactive.

Key Points
  • An annual flu vaccine is the best way to protect against flu and its potentially serious complications.
  • CDC recommends everyone 6 months or older get a flu vaccine by the end of October.
  • There also are flu antiviral drugs that can be used to treat flu illness.
U.S. Virologic Surveillance:

Clinical Laboratories


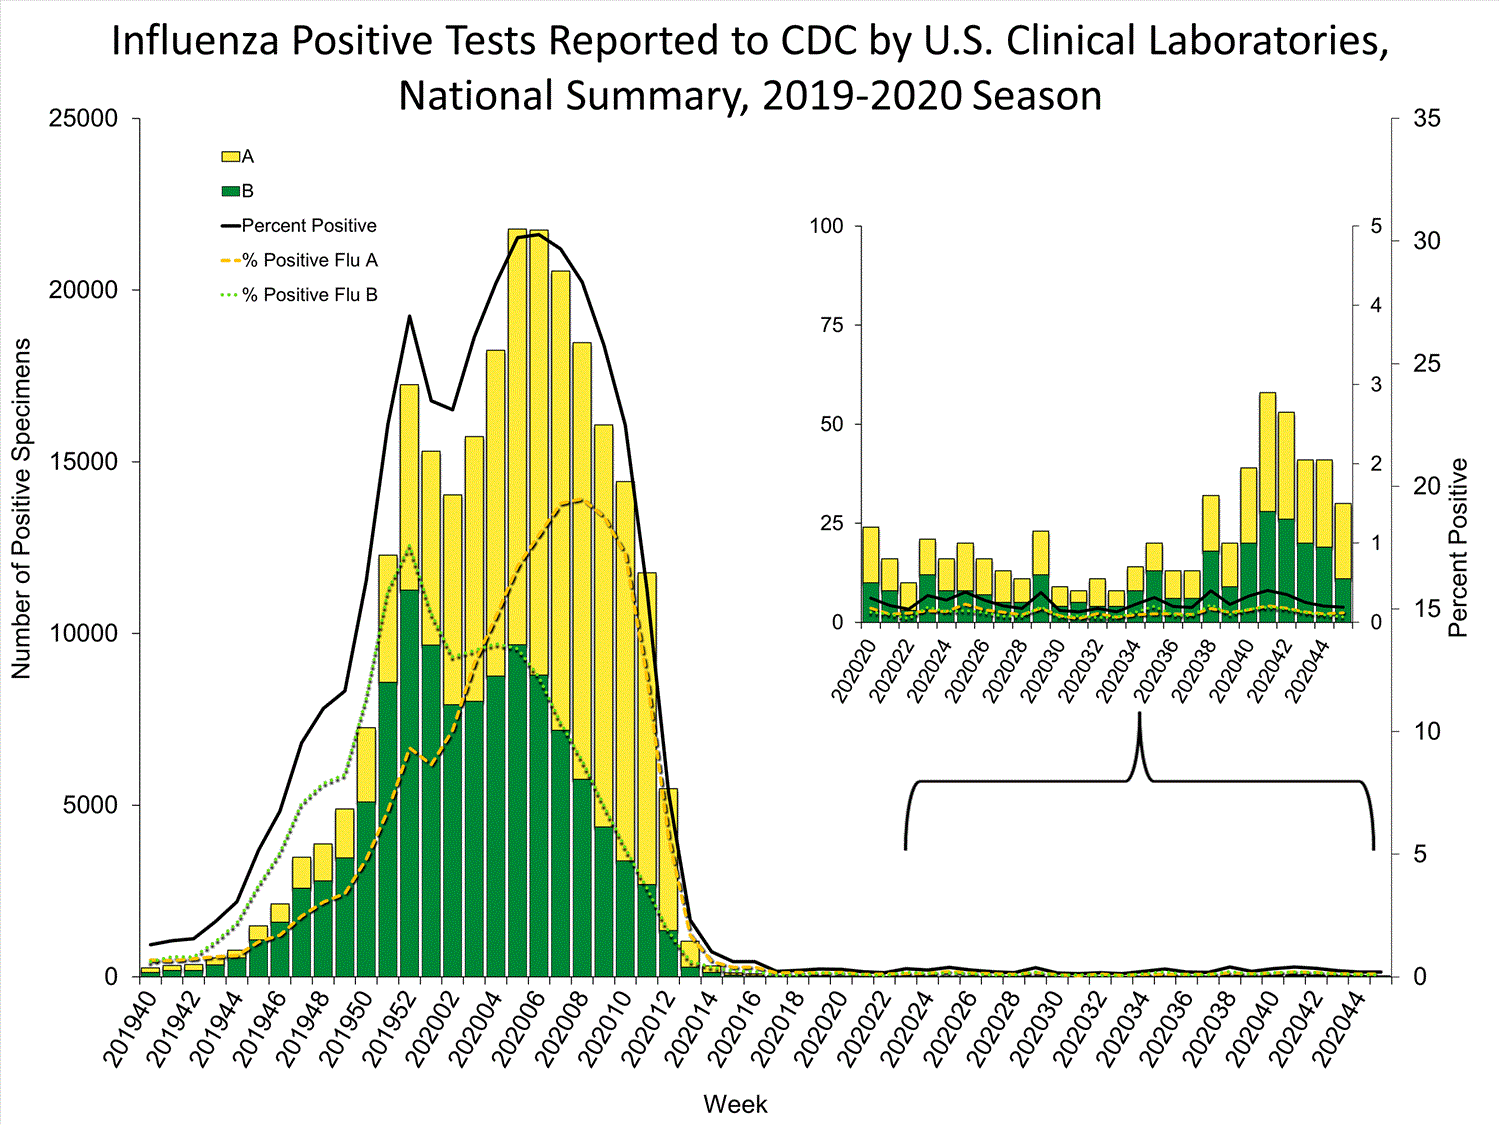
The results of tests performed by clinical laboratories nationwide are summarized below. Data from clinical laboratories (the percentage of specimens tested that are positive for influenza) are used to monitor whether influenza activity is increasing or decreasing.
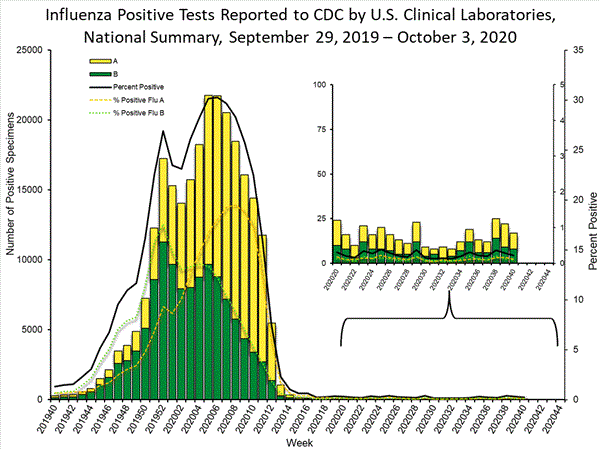
No. of specimens tested7,7747,923
No. of positive specimens (%)22 (0.3%)17 (0.2%)
Positive specimens by type
Influenza A13 (59.1%)9 (52.9%)
Influenza B9 (40.9%)8 (47.1%)


View Chart Data | View Full ScreenPublic Health Laboratories


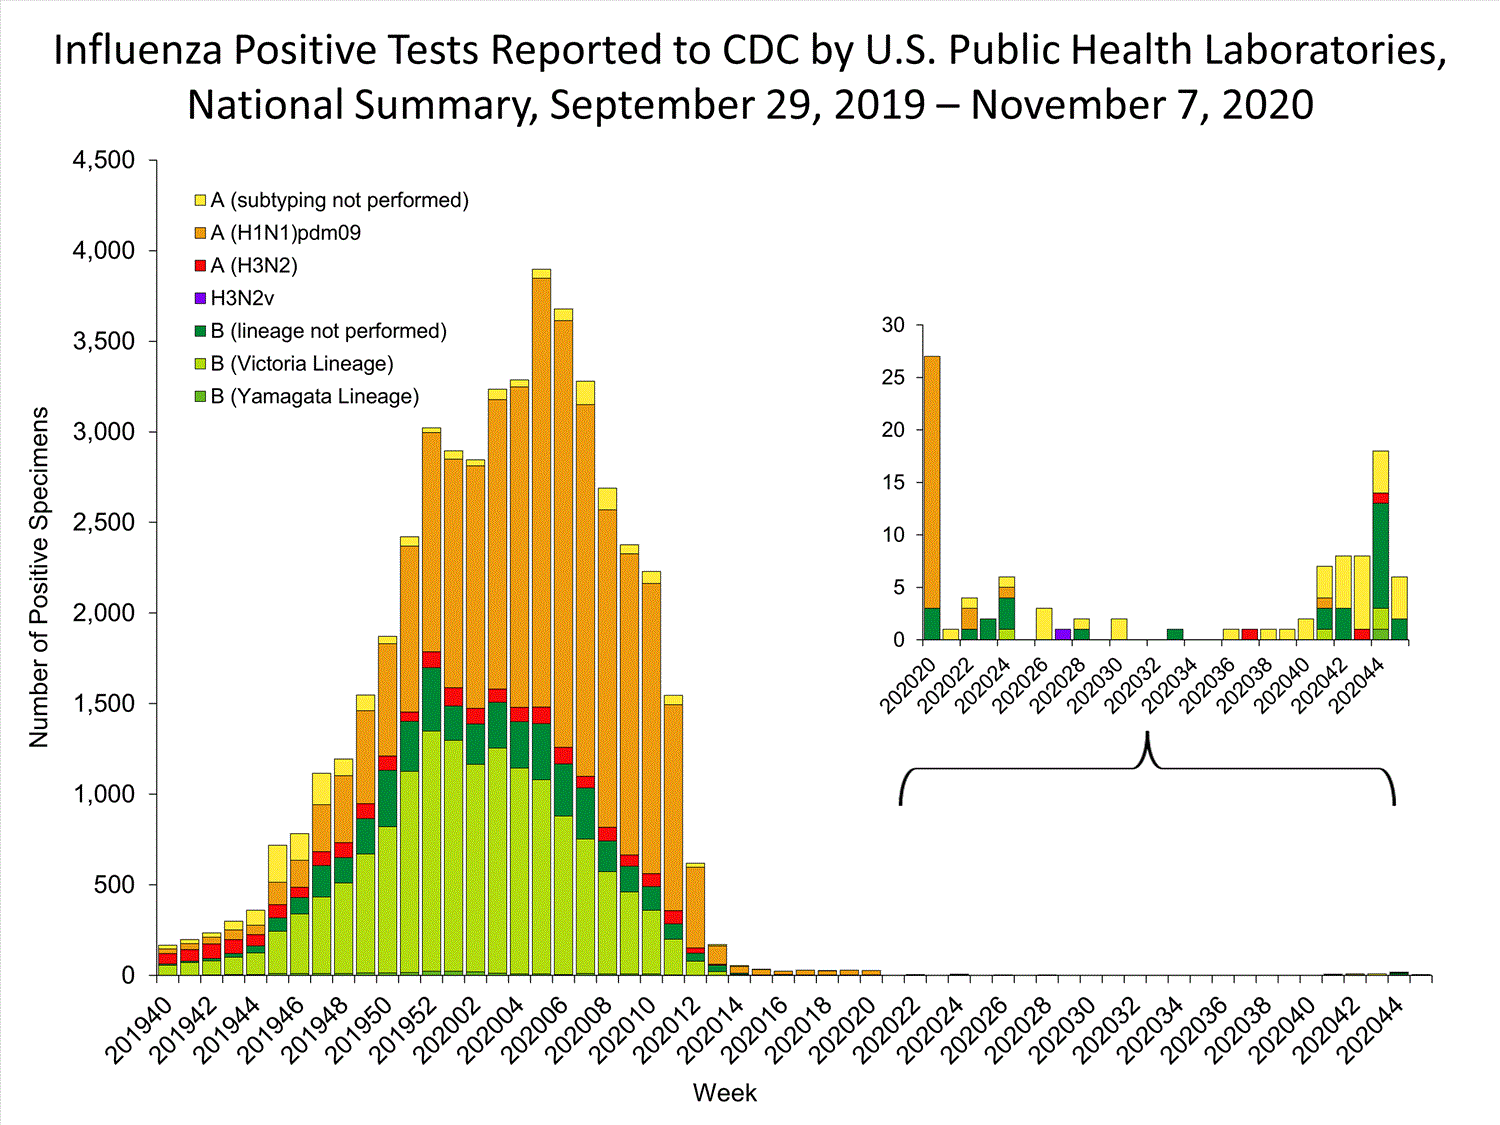
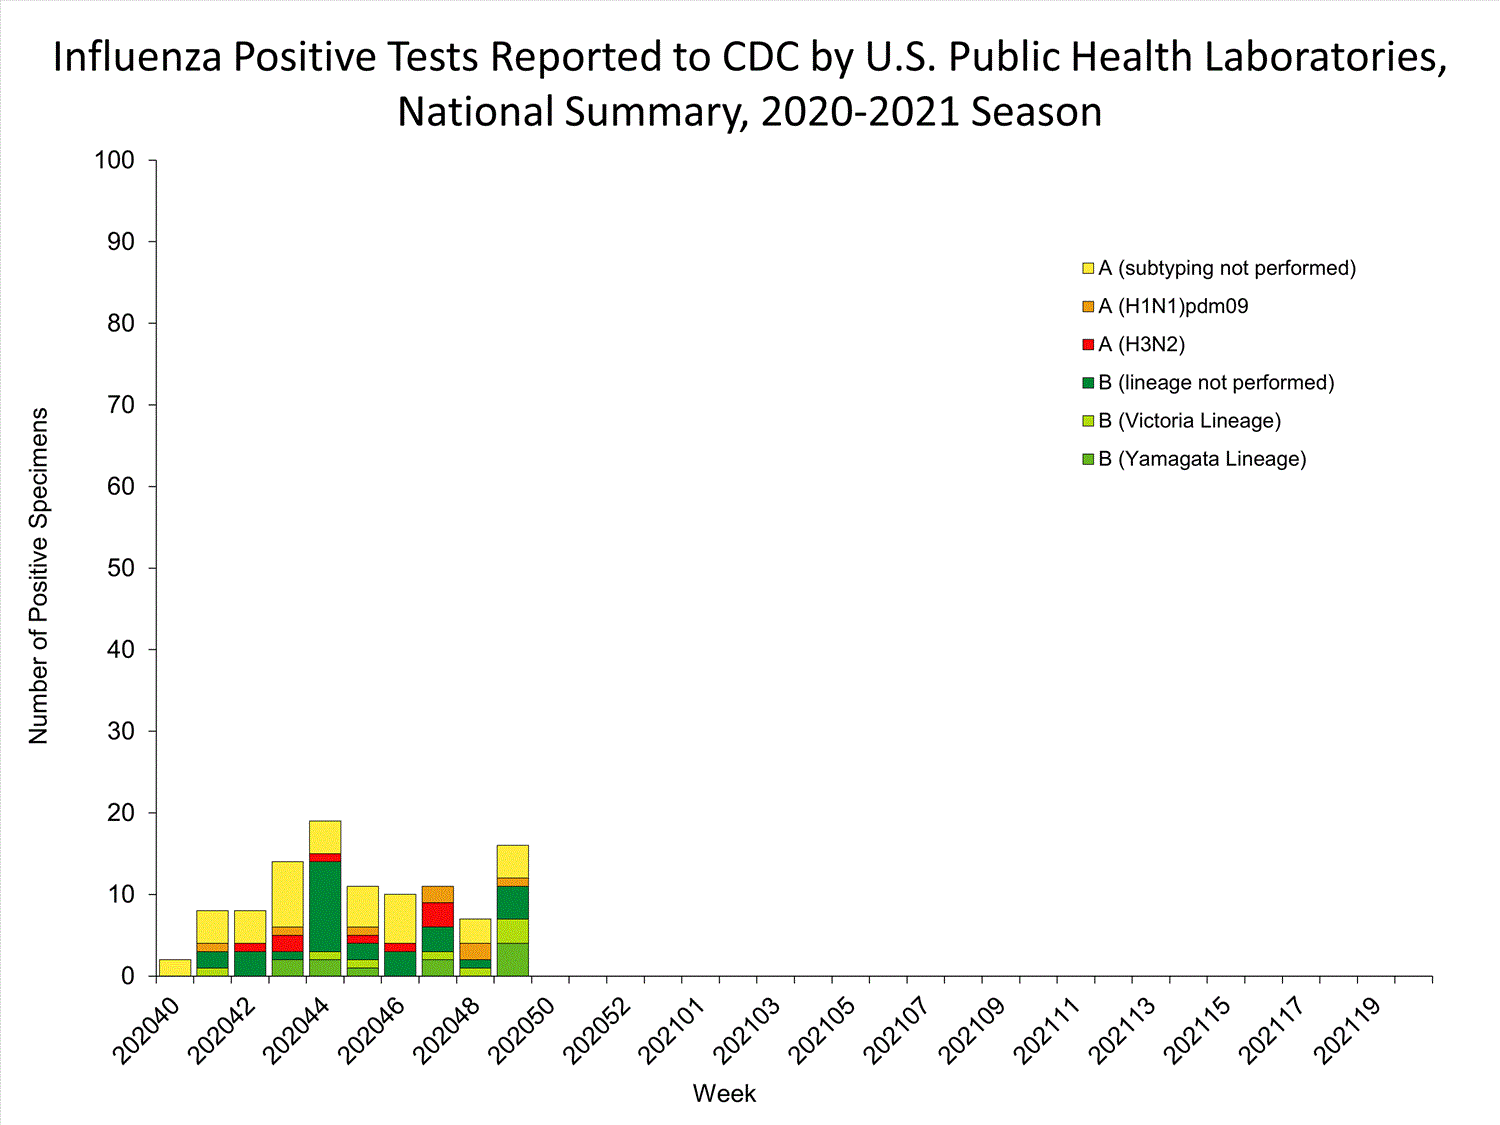
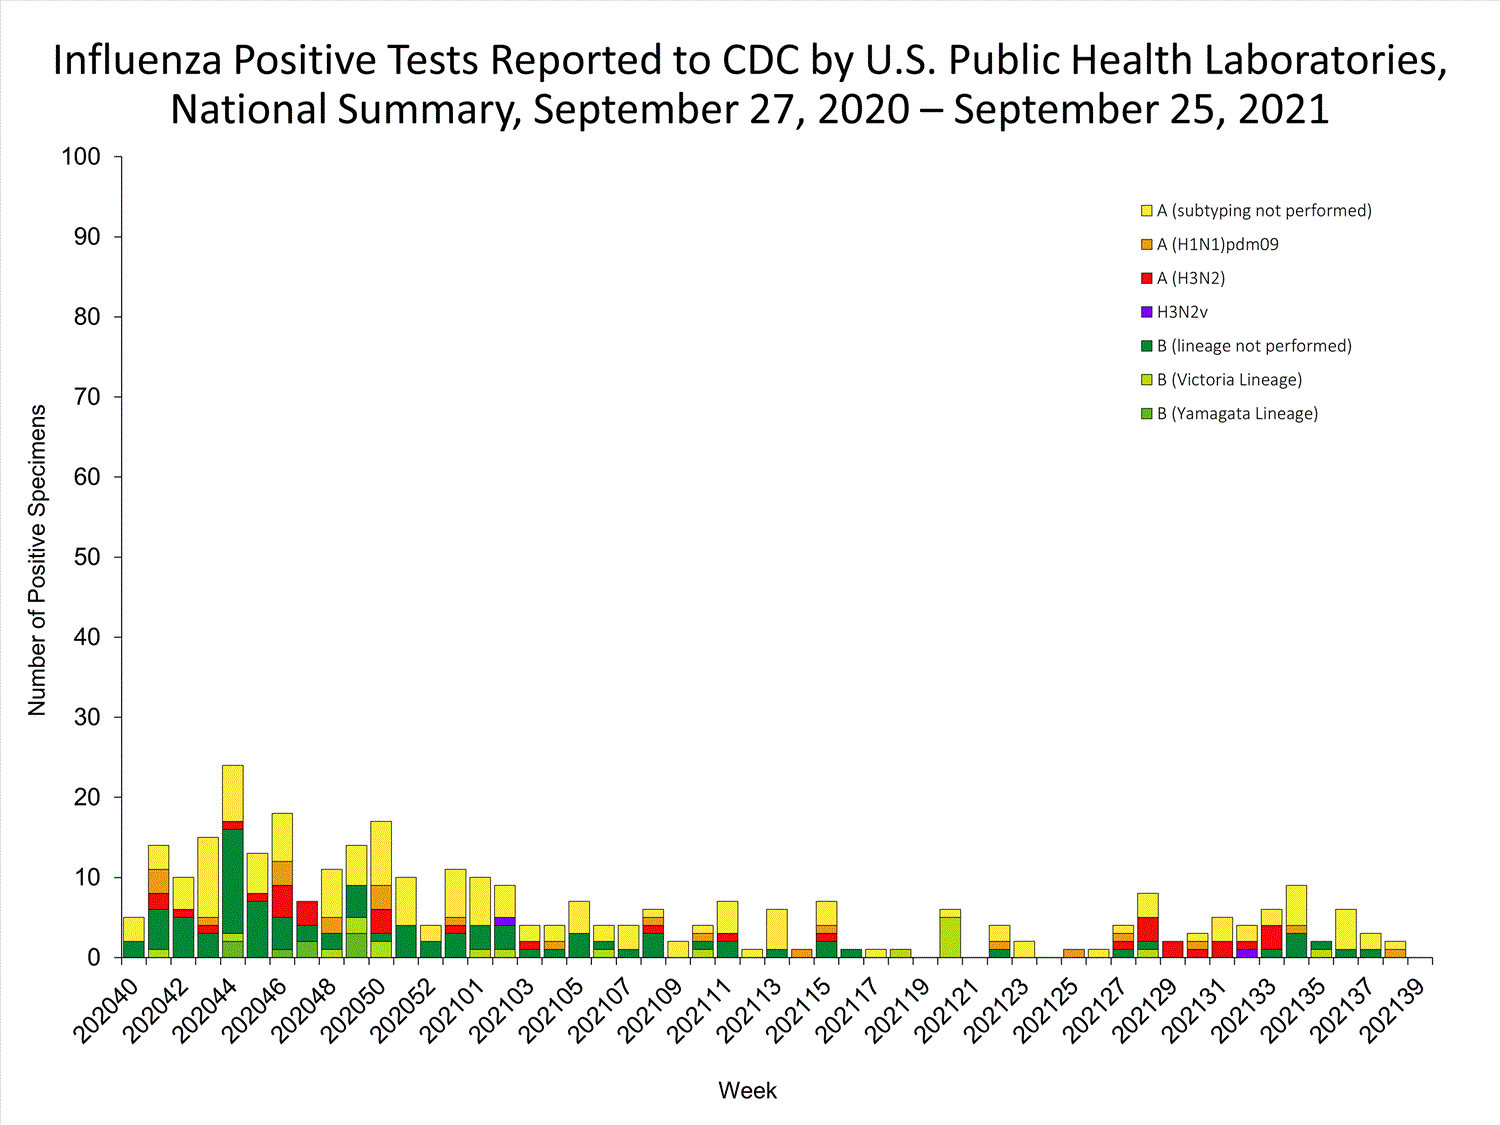
The results of tests performed by public health laboratories nationwide are summarized below. Data from public health laboratories are used to monitor the proportion of circulating viruses that belong to each influenza subtype/lineage.
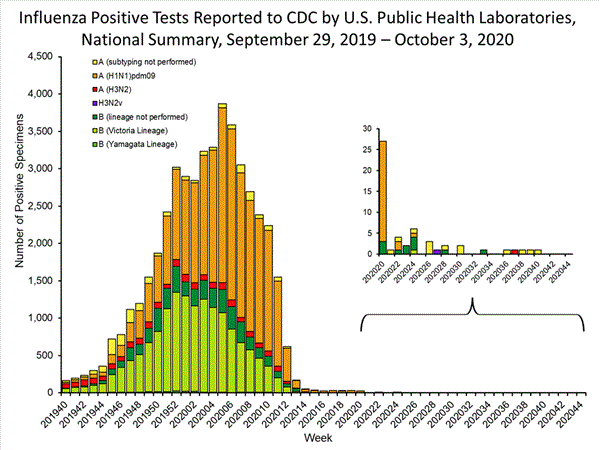
No. of specimens tested1,7185,755
No. of positive specimens11
Positive specimens by type/subtype
Influenza A1 (100.0%)1 (100.0%)
(H1N1)pdm090 (0.0%)0 (0.0%)
H3N20 (0.0%)0 (0.0%)
Subtyping not performed11
Influenza B0 (0.0%)0 (0.0%)
Yamagata lineage0 (0.0%)0 (0.0%)
Victoria lineage0 (0.0%)0 (0.0%)
Lineage not performed00


View Chart Data | View Full Screen
Additional virologic surveillance information for current and past seasons:
Surveillance Methods | FluView Interactive: National, Regional, and State Data or Age Data
Influenza Virus Characterization


CDC performs genetic and antigenic characterization of U.S. viruses submitted from state and local health laboratories using Right Size Roadmap submission guidance. These data are used to compare how similar the currently circulating influenza viruses are to the reference viruses representing viruses contained in the current influenza vaccines and to monitor evolutionary changes that continually occur in influenza viruses circulating in humans. CDC also tests susceptibility of influenza viruses to antiviral medications including the neuraminidase inhibitors (oseltamivir, zanamivir, and peramivir) and the PA endonuclease inhibitor baloxavir.

Virus characterization data will be updated weekly starting later this season when sufficient numbers of specimens have been tested.
Outpatient Illness Surveillance

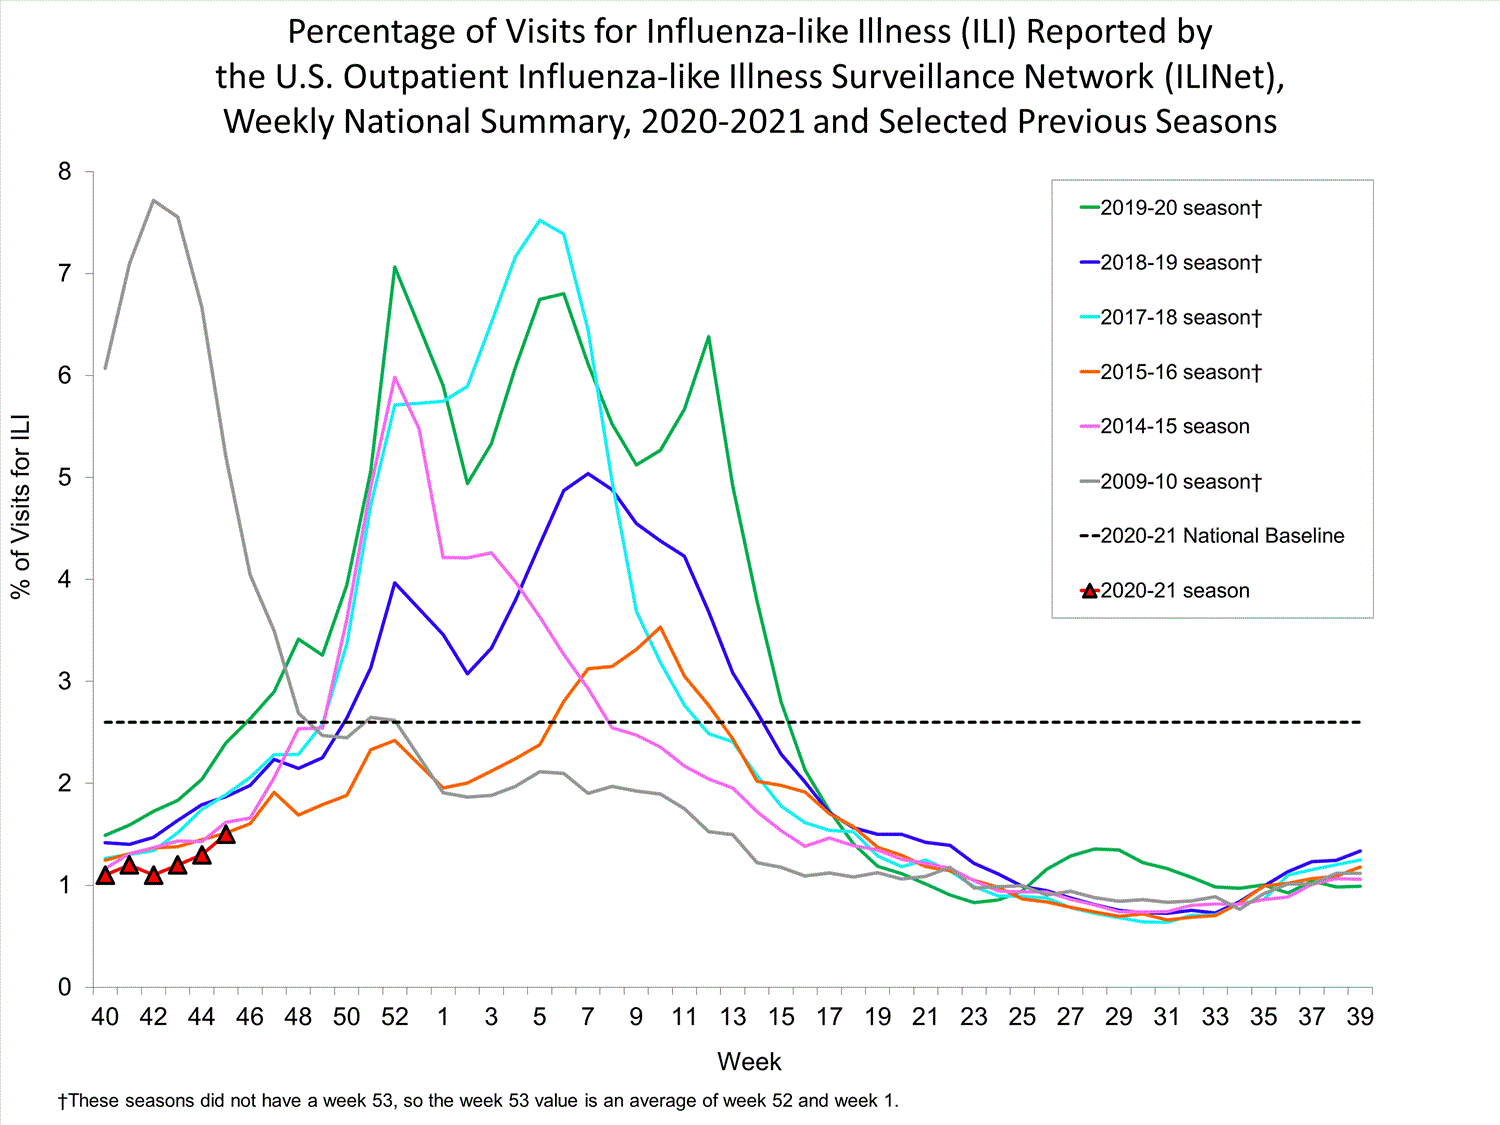
ILINet


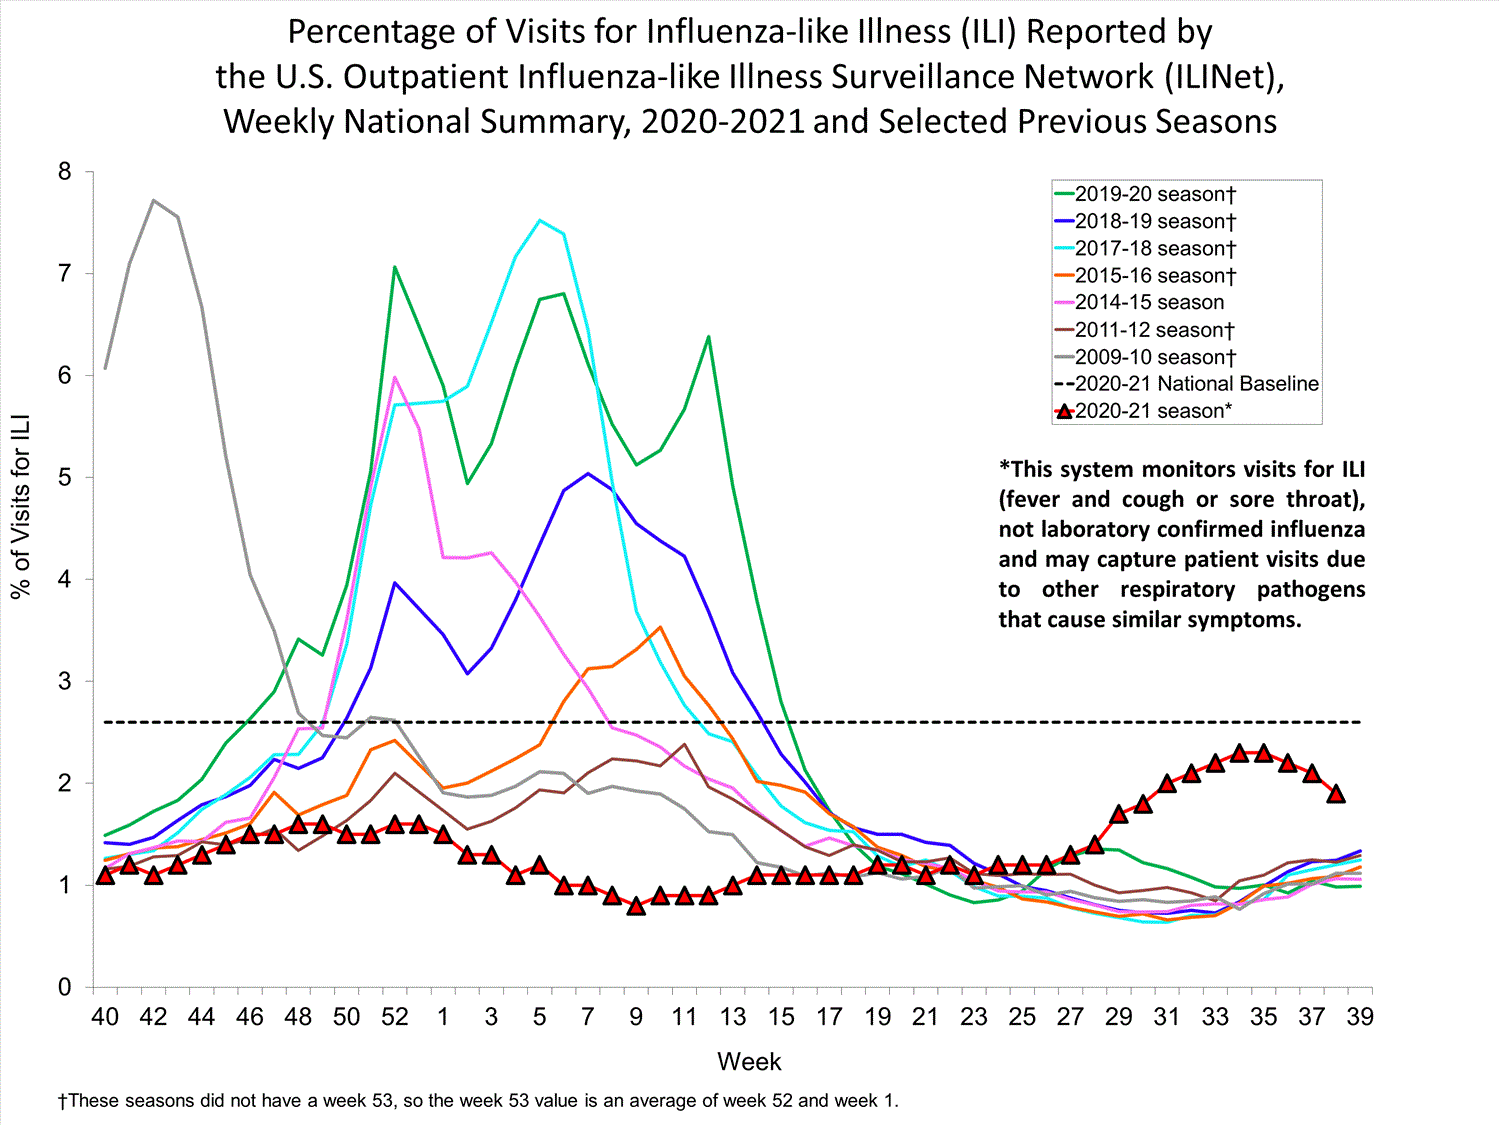
Nationwide during week 40, 1.1% of patient visits reported through the U.S. Outpatient Influenza-like Illness Surveillance Network (ILINet) were due to influenza-like illness (ILI). This percentage is below the national baseline of 2.6%.

Healthcare seeking behaviors have changed dramatically during the COVID-19 pandemic. While outpatient ILI activity remains low, many people are accessing the healthcare system in alternative settings. Therefore, while traditional healthcare providers are not seeing increased numbers of cases of ILI, it is important to evaluate other sources of surveillance data to obtain a complete and accurate picture of both COVID-19 and influenza activity.


View Chart Data (current season only) | View Full ScreenILI Activity Map


Data collected in ILINet are used to produce a measure of ILI activity* by state/jurisdiction and Core Based Statistical Areas (CBSA).
Week 40
(Week ending
Oct. 3, 2020)
Week 39
(Week ending
Sept. 26, 2020)
Week 40
(Week ending
Oct. 3, 2020)
Week 39
(Week ending
Sept. 26, 2020)
Very High0000
High0112
Moderate0143
Low101420
Minimal5249569523
Insufficient Data13341381


*Data collected in ILINet may disproportionally represent certain populations within a jurisdiction or CBSA, and therefore, may not accurately depict the full picture of influenza activity for the entire jurisdiction or CBSA. Differences in the data presented here by CDC and independently by some health departments likely represent differing levels of data completeness with data presented by the health department likely being the more complete.
Additional information about medically attended visits for ILI for current and past seasons:
Surveillance Methods | FluView Interactive: National, Regional, and State Data or ILI Activity Map
Geographic Spread of Influenza as Assessed by State and Territorial Epidemiologists


The geographic spread of influenza as reported by state and territorial epidemiologists indicates geographic spread of influenza viruses but does not measure the severity of influenza activity. Due to the impact of COVID-19 on ILI surveillance, and the fact that the state and territorial epidemiologists report relies heavily on ILI activity, reporting for this system will be suspended for the 2020-21 influenza season. Data from previous seasons is available on FluView Interactive.
Additional geographic spread surveillance information for current and past seasons:
Surveillance Methods | FluView Interactive
Influenza-Associated Hospitalizations:


The Influenza Hospitalization Surveillance Network (FluSurv-NET) conducts population-based surveillance for laboratory-confirmed influenza-related hospitalizations in select counties in the Emerging Infections Program (EIP) states and Influenza Hospitalization Surveillance Project (IHSP) states. FluSurv-NET estimated hospitalization rates will be updated weekly starting later this season.
Additional hospitalization surveillance information for current and past seasons and additional age groups:
Surveillance Methods | FluView Interactive: Rates by Age or Patient Characteristics
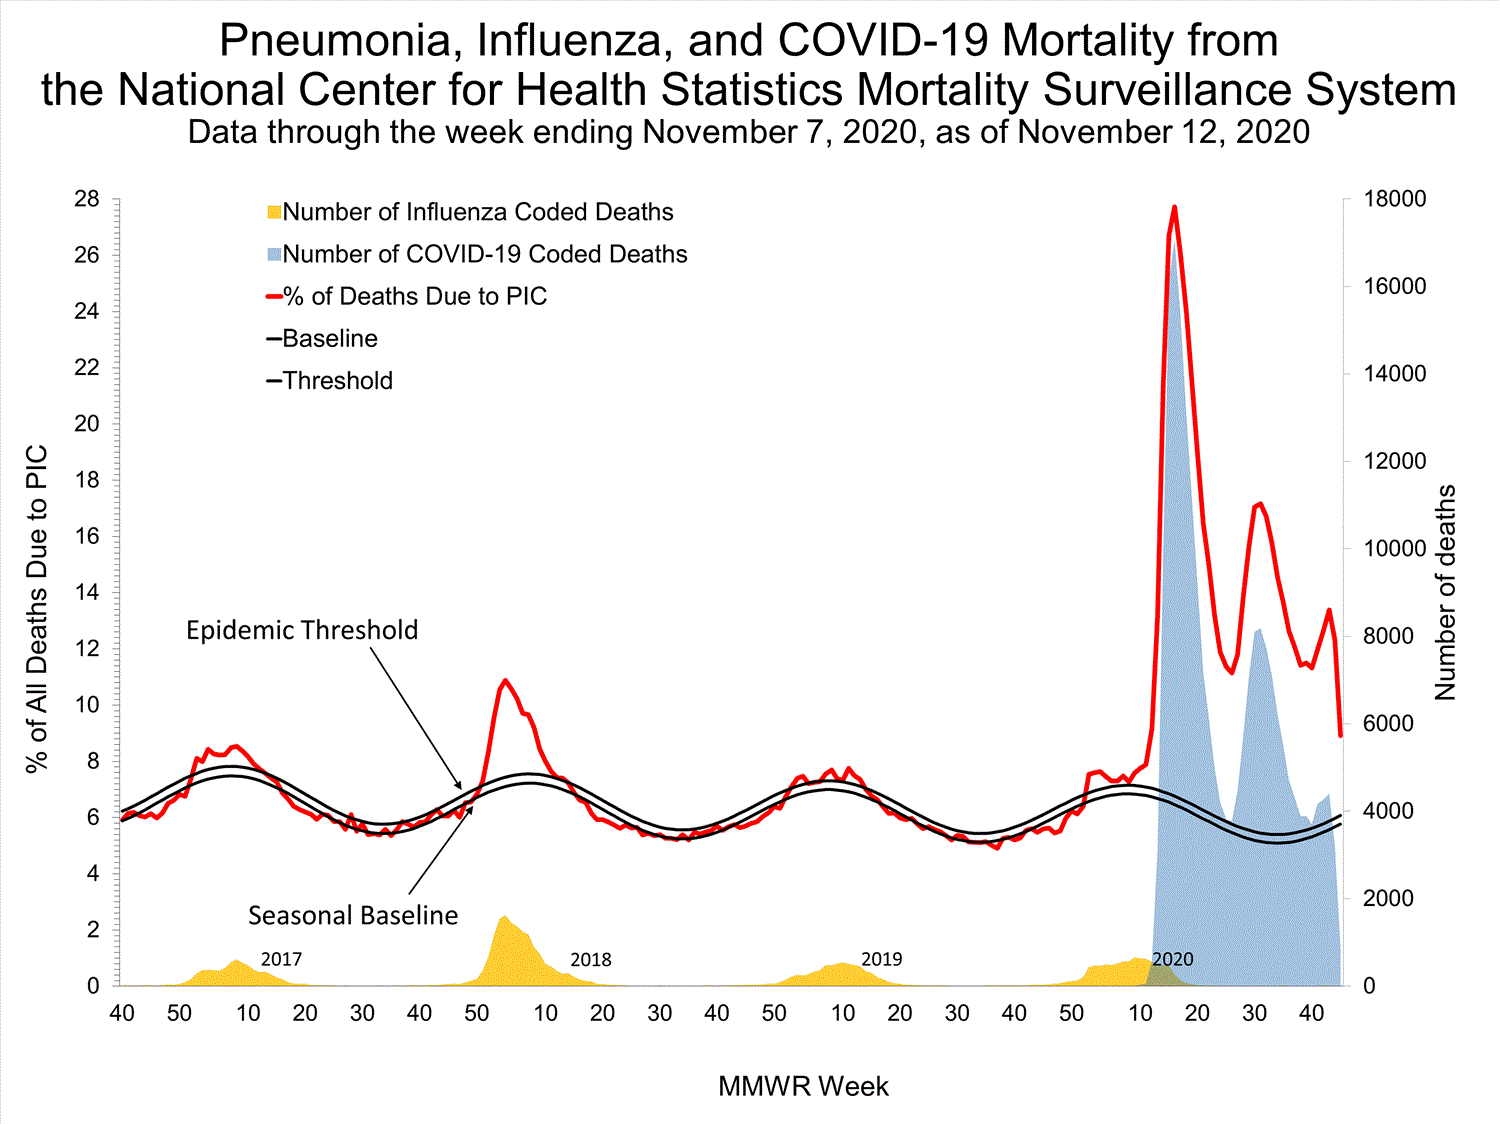
Pneumonia and Influenza (P&I) Mortality Surveillance


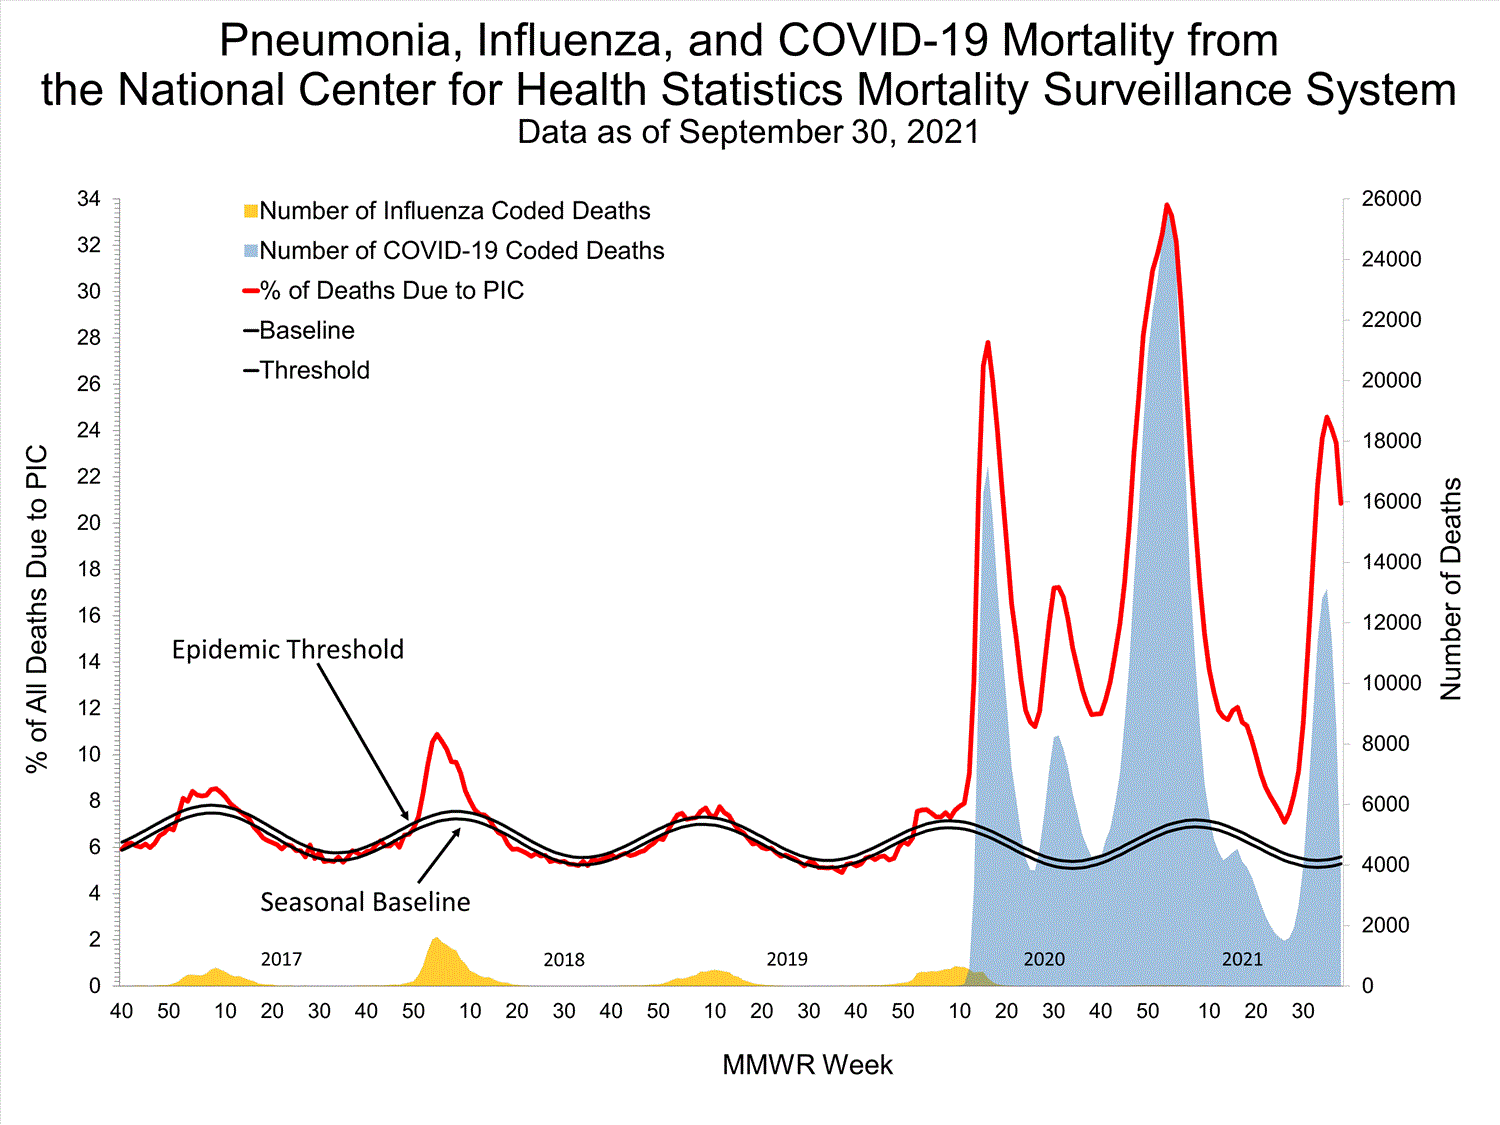
Based on NCHS mortality surveillance data available on October 8, 2020, 7.0% of the deaths occurring during the week ending October 3, 2020 (week 40) were due to pneumonia, influenza, and COVID-19 (PIC). This percentage is above the epidemic threshold of 5.6% for week 40.

Weekly mortality surveillance data include a combination of machine coded and manually coded causes of death collected from death certificates. Percentages of deaths due to pneumonia, influenza, or COVID-19 (PIC) are higher among manually coded records than more rapidly available machine coded records. Due to the additional time needed for manual coding, the initially reported PIC percentages are likely to increase as more data are received and processed.


View Chart Dataexcel icon | View Full Screen
Additional pneumonia and influenza mortality surveillance information for current and past seasons:
Surveillance Methods | FluView Interactive
Influenza-Associated Pediatric Mortality


No influenza-associated pediatric deaths occurring during the 2020-21 season have been reported to CDC.

View Full Screen
Additional pediatric mortality surveillance information for current and past seasons:
Surveillance Methods | FluView Interactive


Additional National and International Influenza Surveillance Information


FluView Interactive: FluView includes enhanced web-based interactive applications that can provide dynamic visuals of the influenza data collected and analyzed by CDC. These FluView Interactive applications allow people to create customized, visual interpretations of influenza data, as well as make comparisons across flu seasons, regions, age groups and a variety of other demographics.

National Institute for Occupational Safety and Health: Monthly surveillance data on the prevalence of health-related workplace absenteeism among full-time workers in the United States are available from NIOSH.

U.S. State and local influenza surveillance: Select a jurisdiction below to access the latest local influenza information. World Health Organization:
Additional influenza surveillance information from participating WHO member nations is available through
FluNetexternal icon and the Global Epidemiology Reports.external icon

WHO Collaborating Centers for Influenza:
Australiaexternal icon, Chinaexternal icon, Japanexternal icon, the United Kingdomexternal icon, and the United States (CDC in Atlanta, Georgia)

Europe:
The most up-to-date influenza information from Europe is available from WHO/Europe and the European Centre for Disease Prevention and Controlexternal icon.

Public Health Agency of Canada:
The most up-to-date influenza information from Canada is available in Canada’s weekly FluWatch reportexternal icon.

Public Health England:
The most up-to-date influenza information from the United Kingdom is available from Public Health Englandexternal icon.

Any links provided to non-Federal organizations are provided solely as a service to our users. These links do not constitute an endorsement of these organizations or their programs by CDC or the Federal Government, and none should be inferred. CDC is not responsible for the content of the individual organization web pages found at these links.

A description of the CDC influenza surveillance system, including methodology and detailed descriptions of each data component is available on the surveillance methods page.

Page last reviewed: October 9, 2020, 11:00 AM

https://www.cdc.gov/flu/weekly/weeklyarchives2020-2021/week40.htm
 
FluView Summary ending on October 10, 2020


fluview-banner2.jpg


Note: CDC is tracking the COVID-19 pandemic in a weekly publication called COVIDView.

Key Updates for Week 41, ending October 10, 2020

Seasonal influenza activity in the United States remains low.
Viruses


Clinical Labs
The percentage of respiratory specimens testing positive for influenza at clinical laboratories is 0.3% this week.

Public Health Labs
Influenza activity has been low over the summer months. Few specimens have tested positive in the public health labs during the most recent weeks.

Virus Characterization
Influenza virus characterization information will be updated weekly starting later this season.
Illness

Outpatient Illness: ILINet
1.2% of visits to a health care provider were for ILI. ILI activity remains below the national baseline of 2.6% and remained the same as the previous week.

Outpatient Illness: ILINet Activity Map


This week, 2 jurisdictions experienced moderate activity, while the remaining jurisdictions experienced minimal activity.
Severe Disease


Hospitalizations
Hospitalization rates will be updated weekly starting later this season.

P&I Mortality
7.2% of deaths were attributed to pneumonia, influenza, or COVID-19 (PIC). This is above the epidemic threshold of 5.7%.

Pediatric Deaths
Three influenza-associated pediatric deaths occurring during the 2019-20 season were reported to CDC bringing the total for that season to 192. No deaths occurring during the 2020-21 season were reported.

All data are preliminary and may change as more reports are received.

A description of the CDC influenza surveillance system, including methodology and detailed descriptions of each data component is available on the surveillance methods page.

Additional information on the current and previous influenza seasons for each surveillance component are available on FluView Interactive.

Key Points
  • An annual flu vaccine is the best way to protect against flu and its potentially serious complications.
  • CDC recommends everyone 6 months and older get a flu vaccine by the end of October.
  • There are also flu antiviral drugs that can be used to treat flu illness.
U.S. Virologic Surveillance:

Clinical Laboratories


The results of tests performed by clinical laboratories nationwide are summarized below. Data from clinical laboratories (the percentage of specimens tested that are positive for influenza) are used to monitor whether influenza activity is increasing or decreasing.

No. of specimens tested9,72719,768
No. of positive specimens (%)26 (0.27%)60 (0.30%)
Positive specimens by type
Influenza A13 (50.0%)31 (51.7%)
Influenza B13 (50.0%)29 (48.3%)


View Chart Data | View Full ScreenPublic Health Laboratories


The results of tests performed by public health laboratories nationwide are summarized below. Data from public health laboratories are used to monitor the proportion of circulating viruses that belong to each influenza subtype/lineage.
No. of specimens tested4,24911,200
No. of positive specimens01
Positive specimens by type/subtype
Influenza A0 (0.0%)1 (100.0%)
(H1N1)pdm090 (0.0%)0 (0.0%)
H3N20 (0.0%)0 (0.0%)
Subtyping not performed01
Influenza B0 (0.0%)0 (0.0%)
Yamagata lineage0 (0.0%)0 (0.0%)
Victoria lineage0 (0.0%)0 (0.0%)
Lineage not performed00


View Chart Data | View Full Screen
Additional virologic surveillance information for current and past seasons:
Surveillance Methods | FluView Interactive: National, Regional, and State Data or Age Data
Influenza Virus Characterization


CDC performs genetic and antigenic characterization of U.S. viruses submitted from state and local health laboratories using Right Size Roadmap submission guidance. These data are used to compare how similar the currently circulating influenza viruses are to the reference viruses representing viruses contained in the current influenza vaccines and to monitor evolutionary changes that continually occur in influenza viruses circulating in humans. CDC also tests susceptibility of influenza viruses to antiviral medications including the neuraminidase inhibitors (oseltamivir, zanamivir, and peramivir) and the PA endonuclease inhibitor baloxavir.

Virus characterization data will be updated weekly starting later this season when a sufficient number of specimens have been tested.
Outpatient Illness Surveillance

ILINet


Nationwide during week 41, 1.2% of patient visits reported through the U.S. Outpatient Influenza-like Illness Surveillance Network (ILINet) were due to influenza-like illness (ILI). This percentage is below the national baseline of 2.6%.

Healthcare seeking behaviors have changed dramatically during the COVID-19 pandemic. While outpatient ILI activity remains low, many people are accessing the healthcare system in alternative settings. Therefore, while traditional healthcare providers are not seeing increased numbers of cases of ILI, it is important to evaluate other sources of surveillance data to obtain a complete and accurate picture of both COVID-19 and influenza activity. CDC is tracking the COVID-19 pandemic in a weekly publication called COVIDView.


View Chart Data (current season only) | View Full ScreenILI Activity Map


Data collected in ILINet are used to produce a measure of ILI activity* by state/jurisdiction and Core Based Statistical Areas (CBSA).
Week 41
(Week ending
Oct. 10, 2020)
Week 40
(Week ending
Oct. 3, 2020)
Week 41
(Week ending
Oct. 10, 2020)
Week 40
(Week ending
Oct. 3, 2020)
Very High0000
High0032
Moderate2054
Low013016
Minimal5052534577
Insufficient Data21357330


*Data collected in ILINet may disproportionally represent certain populations within a jurisdiction or CBSA, and therefore, may not accurately depict the full picture of influenza activity for the entire jurisdiction or CBSA. Differences in the data presented here by CDC and independently by some health departments likely represent differing levels of data completeness with data presented by the health department likely being the more complete.
Additional information about medically attended visits for ILI for current and past seasons:
Surveillance Methods | FluView Interactive: National, Regional, and State Data or ILI Activity Map
Geographic Spread of Influenza as Assessed by State and Territorial Epidemiologists


The geographic spread of influenza as reported by state and territorial epidemiologists indicates geographic spread of influenza viruses but does not measure the severity of influenza activity. Due to the impact of COVID-19 on ILI surveillance, and the fact that the state and territorial epidemiologists report relies heavily on ILI activity, reporting for this system will be suspended for the 2020-21 influenza season. Data from previous seasons is available on FluView Interactive.
Additional geographic spread surveillance information for current and past seasons:
Surveillance Methods | FluView Interactive
Influenza-Associated Hospitalizations:


The Influenza Hospitalization Surveillance Network (FluSurv-NET) conducts population-based surveillance for laboratory-confirmed influenza-related hospitalizations in select counties in the Emerging Infections Program (EIP) states and Influenza Hospitalization Surveillance Project (IHSP) states. FluSurv-NET estimated hospitalization rates will be updated weekly starting later this season.
Additional hospitalization surveillance information for current and past seasons and additional age groups:
Surveillance Methods | FluView Interactive: Rates by Age or Patient Characteristics
National Center for Health Statistics (NCHS) Mortality Surveillance


Based on NCHS mortality surveillance data available on October 15, 2020, 7.2% of the deaths occurring during the week ending October 10, 2020 (week 41) were due to pneumonia, influenza, and COVID-19 (PIC). This percentage is above the epidemic threshold of 5.7% for week 41.

Weekly mortality surveillance data include a combination of machine coded and manually coded causes of death collected from death certificates. Percentages of deaths due to pneumonia, influenza, or COVID-19 (PIC) are higher among manually coded records than more rapidly available machine coded records. Due to the additional time needed for manual coding, the initially reported PIC percentages are likely to increase as more data are received and processed.


View Chart Dataexcel icon | View Full Screen
Additional pneumonia and influenza mortality surveillance information for current and past seasons:
Surveillance Methods | FluView Interactive
Influenza-Associated Pediatric Mortality


No influenza-associated pediatric deaths occurring during the 2020-21 season have been reported to CDC.

Three influenza-associated pediatric deaths were reported to CDC during week 41. All three deaths occurred during the 2019-2020 influenza season bringing the total number of deaths occurring during that season to 192. One death was associated with an influenza A virus for which no subtyping was performed and occurred during week 11 (the week ending March 14, 2020). Two deaths were associated with influenza B virus infection and occurred during week 3 (the week ending January 18, 2020) and week 49 (the week ending December 7, 2019).


View Full Screen
Additional pediatric mortality surveillance information for current and past seasons:
Surveillance Methods | FluView Interactive


Additional National and International Influenza Surveillance Information


FluView Interactive: FluView includes enhanced web-based interactive applications that can provide dynamic visuals of the influenza data collected and analyzed by CDC. These FluView Interactive applications allow people to create customized, visual interpretations of influenza data, as well as make comparisons across flu seasons, regions, age groups and a variety of other demographics.

National Institute for Occupational Safety and Health: Monthly surveillance data on the prevalence of health-related workplace absenteeism among full-time workers in the United States are available from NIOSH.

U.S. State and local influenza surveillance: Select a jurisdiction below to access the latest local influenza information. World Health Organization:
Additional influenza surveillance information from participating WHO member nations is available through
FluNetexternal icon and the Global Epidemiology Reports.external icon

WHO Collaborating Centers for Influenza:
Australiaexternal icon, Chinaexternal icon, Japanexternal icon, the United Kingdomexternal icon, and the United States (CDC in Atlanta, Georgia)

Europe:
The most up-to-date influenza information from Europe is available from WHO/Europe and the European Centre for Disease Prevention and Controlexternal icon.

Public Health Agency of Canada:
The most up-to-date influenza information from Canada is available in Canada’s weekly FluWatch reportexternal icon.

Public Health England:
The most up-to-date influenza information from the United Kingdom is available from Public Health Englandexternal icon.

Any links provided to non-Federal organizations are provided solely as a service to our users. These links do not constitute an endorsement of these organizations or their programs by CDC or the Federal Government, and none should be inferred. CDC is not responsible for the content of the individual organization web pages found at these links.

A description of the CDC influenza surveillance system, including methodology and detailed descriptions of each data component is available on the surveillance methods page.

Page last reviewed: October 16, 2020, 11:00 AM

https://www.cdc.gov/flu/weekly/weeklyarchives2020-2021/week41.htm
 
FluView Summary ending on October 17, 2020


fluview-banner2.jpg


Note: CDC is tracking the COVID-19 pandemic in a weekly publication called COVIDView.

Key Updates for Week 42, ending October 17, 2020

Seasonal influenza activity in the United States remains low.
Viruses


Clinical Labs
The percentage of respiratory specimens testing positive for influenza at clinical laboratories is 0.3% this week.

Public Health Labs
Influenza activity has been low over the summer months. Few specimens have tested positive in the public health labs during the most recent weeks.

Virus Characterization
Influenza virus characterization information will be updated weekly starting later this season.
Illness

Outpatient Illness: ILINet
1.2% of visits to a health care provider were for ILI. ILI activity remains below the national baseline of 2.6% and remained the same as the previous week.

Outpatient Illness: ILINet Activity Map


One jurisdiction experienced low activity, while the remaining jurisdictions experienced minimal activity.
Severe Disease


Hospitalizations
Hospitalization rates will be updated weekly starting later this season.

P&I Mortality
7.6% of deaths were attributed to pneumonia, influenza, or COVID-19 (PIC). This is above the epidemic threshold of 5.8%.

Pediatric Deaths
Two influenza-associated pediatric deaths occurring during the 2019-20 season were reported to CDC bringing the total for that season to 194. No deaths occurring during the 2020-21 season were reported.

All data are preliminary and may change as more reports are received.

A description of the CDC influenza surveillance system, including methodology and detailed descriptions of each data component is available on the surveillance methods page.

Additional information on the current and previous influenza seasons for each surveillance component are available on FluView Interactive.

Key Points
  • An annual flu vaccine is the best way to protect against flu and its potentially serious complications.
  • CDC recommends everyone 6 months and older get a flu vaccine by the end of October.
  • There are also flu antiviral drugs that can be used to treat flu illness.
U.S. Virologic Surveillance:

Clinical Laboratories


The results of tests performed by clinical laboratories nationwide are summarized below. Data from clinical laboratories (the percentage of specimens tested that are positive for influenza) are used to monitor whether influenza activity is increasing or decreasing.

No. of specimens tested10,80935,688
No. of positive specimens (%)33 (0.3%)121 (0.3%)
Positive specimens by type
Influenza A18 (54.5%)63 (52.1%)
Influenza B15 (45.5%)58 (47.9%)


View Chart Data | View Full ScreenPublic Health Laboratories


The results of tests performed by public health laboratories nationwide are summarized below. Data from public health laboratories are used to monitor the proportion of circulating viruses that belong to each influenza subtype/lineage.
No. of specimens tested3,07117,012
No. of positive specimens15
Positive specimens by type/subtype
Influenza A0 (0.0%)2 (40.0%)
(H1N1)pdm090 (0.0%)0 (0.0%)
H3N20 (0.0%)0 (0.0%)
Subtyping not performed12
Influenza B0 (0.0%)3 (60.0%)
Yamagata lineage0 (0.0%)0 (0.0%)
Victoria lineage0 (0.0%)1 (33.3%)
Lineage not performed02 (66.7%)


View Chart Data | View Full Screen
Additional virologic surveillance information for current and past seasons:
Surveillance Methods | FluView Interactive: National, Regional, and State Data or Age Data
Influenza Virus Characterization


CDC performs genetic and antigenic characterization of U.S. viruses submitted from state and local health laboratories using Right Size Roadmap submission guidance. These data are used to compare how similar the currently circulating influenza viruses are to the reference viruses representing viruses contained in the current influenza vaccines and to monitor evolutionary changes that continually occur in influenza viruses circulating in humans. CDC also tests susceptibility of influenza viruses to antiviral medications including the neuraminidase inhibitors (oseltamivir, zanamivir, and peramivir) and the PA endonuclease inhibitor baloxavir.

Virus characterization data will be updated weekly starting later this season when a sufficient number of specimens have been tested.
Outpatient Illness Surveillance

ILINet


Nationwide during week 42, 1.2% of patient visits reported through the U.S. Outpatient Influenza-like Illness Surveillance Network (ILINet) were due to influenza-like illness (ILI). This percentage is below the national baseline of 2.6%.

Healthcare seeking behaviors have changed dramatically during the COVID-19 pandemic. While outpatient ILI activity remains low, many people are accessing the healthcare system in alternative settings. Therefore, while traditional healthcare providers are not seeing increased numbers of cases of ILI, it is important to evaluate other sources of surveillance data to obtain a complete and accurate picture of both COVID-19 and influenza activity. CDC is tracking the COVID-19 pandemic in a weekly publication called COVIDView.


View Chart Data (current season only) | View Full ScreenILI Activity Map


Data collected in ILINet are used to produce a measure of ILI activity* by state/jurisdiction and Core Based Statistical Areas (CBSA).
Week 42
(Week ending
Oct. 17, 2020)
Week 41
(Week ending
Oct. 10, 2020)
Week 42
(Week ending
Oct. 17, 2020)
Week 41
(Week ending
Oct. 10, 2020)
Very High0000
High0013
Moderate0146
Low112830
Minimal5352541553
Insufficient Data00355337


*Data collected in ILINet may disproportionally represent certain populations within a jurisdiction or CBSA, and therefore, may not accurately depict the full picture of influenza activity for the entire jurisdiction or CBSA. Differences in the data presented here by CDC and independently by some health departments likely represent differing levels of data completeness with data presented by the health department likely being the more complete.
Additional information about medically attended visits for ILI for current and past seasons:
Surveillance Methods | FluView Interactive: National, Regional, and State Data or ILI Activity Map
Geographic Spread of Influenza as Assessed by State and Territorial Epidemiologists


The geographic spread of influenza as reported by state and territorial epidemiologists indicates geographic spread of influenza viruses but does not measure the severity of influenza activity. Due to the impact of COVID-19 on ILI surveillance, and the fact that the state and territorial epidemiologists report relies heavily on ILI activity, reporting for this system will be suspended for the 2020-21 influenza season. Data from previous seasons is available on FluView Interactive.
Additional geographic spread surveillance information for current and past seasons:
Surveillance Methods | FluView Interactive
Influenza-Associated Hospitalizations:


The Influenza Hospitalization Surveillance Network (FluSurv-NET) conducts population-based surveillance for laboratory-confirmed influenza-related hospitalizations in select counties in the Emerging Infections Program (EIP) states and Influenza Hospitalization Surveillance Project (IHSP) states. FluSurv-NET estimated hospitalization rates will be updated weekly starting later this season.
Additional hospitalization surveillance information for current and past seasons and additional age groups:
Surveillance Methods | FluView Interactive: Rates by Age or Patient Characteristics
National Center for Health Statistics (NCHS) Mortality Surveillance


Based on NCHS mortality surveillance data available on October 22, 2020, 7.6% of the deaths occurring during the week ending October 17, 2020 (week 42) were due to pneumonia, influenza, and COVID-19 (PIC). This percentage is above the epidemic threshold of 5.8% for week 42.

Weekly mortality surveillance data include a combination of machine coded and manually coded causes of death collected from death certificates. Percentages of deaths due to pneumonia, influenza, or COVID-19 (PIC) are higher among manually coded records than more rapidly available machine coded records. Due to the additional time needed for manual coding, the initially reported PIC percentages are likely to increase as more data are received and processed.


View Chart Dataexcel icon | View Full Screen
Additional pneumonia and influenza mortality surveillance information for current and past seasons:
Surveillance Methods | FluView Interactive
Influenza-Associated Pediatric Mortality


No influenza-associated pediatric deaths occurring during the 2020-21 season have been reported to CDC.

Two influenza-associated pediatric deaths were reported to CDC during week 42. Both deaths occurred during the 2019-2020 influenza season, bringing the total number of deaths occurring during the 2019-2020 season is 194. One death was associated with an influenza A(H3) virus and occurred during week 47 (the week ending November 23, 2019). One death was associated with an influenza B virus with no lineage determined and occurred during week 51 (the week ending December 21, 2019).


View Full Screen
Additional pediatric mortality surveillance information for current and past seasons:
Surveillance Methods | FluView Interactive


Additional National and International Influenza Surveillance Information


FluView Interactive: FluView includes enhanced web-based interactive applications that can provide dynamic visuals of the influenza data collected and analyzed by CDC. These FluView Interactive applications allow people to create customized, visual interpretations of influenza data, as well as make comparisons across flu seasons, regions, age groups and a variety of other demographics.

National Institute for Occupational Safety and Health: Monthly surveillance data on the prevalence of health-related workplace absenteeism among full-time workers in the United States are available from NIOSH.

U.S. State and local influenza surveillance: Select a jurisdiction below to access the latest local influenza information. World Health Organization:
Additional influenza surveillance information from participating WHO member nations is available through
FluNetexternal icon and the Global Epidemiology Reports.external icon

WHO Collaborating Centers for Influenza:
Australiaexternal icon, Chinaexternal icon, Japanexternal icon, the United Kingdomexternal icon, and the United States (CDC in Atlanta, Georgia)

Europe:
The most up-to-date influenza information from Europe is available from WHO/Europe and the European Centre for Disease Prevention and Controlexternal icon.

Public Health Agency of Canada:
The most up-to-date influenza information from Canada is available in Canada’s weekly FluWatch reportexternal icon.

Public Health England:
The most up-to-date influenza information from the United Kingdom is available from Public Health Englandexternal icon.

Any links provided to non-Federal organizations are provided solely as a service to our users. These links do not constitute an endorsement of these organizations or their programs by CDC or the Federal Government, and none should be inferred. CDC is not responsible for the content of the individual organization web pages found at these links.

A description of the CDC influenza surveillance system, including methodology and detailed descriptions of each data component is available on the surveillance methods page.

Page last reviewed: October 23, 2020, 11:00 AM

https://www.cdc.gov/flu/weekly/weeklyarchives2020-2021/week42.htm
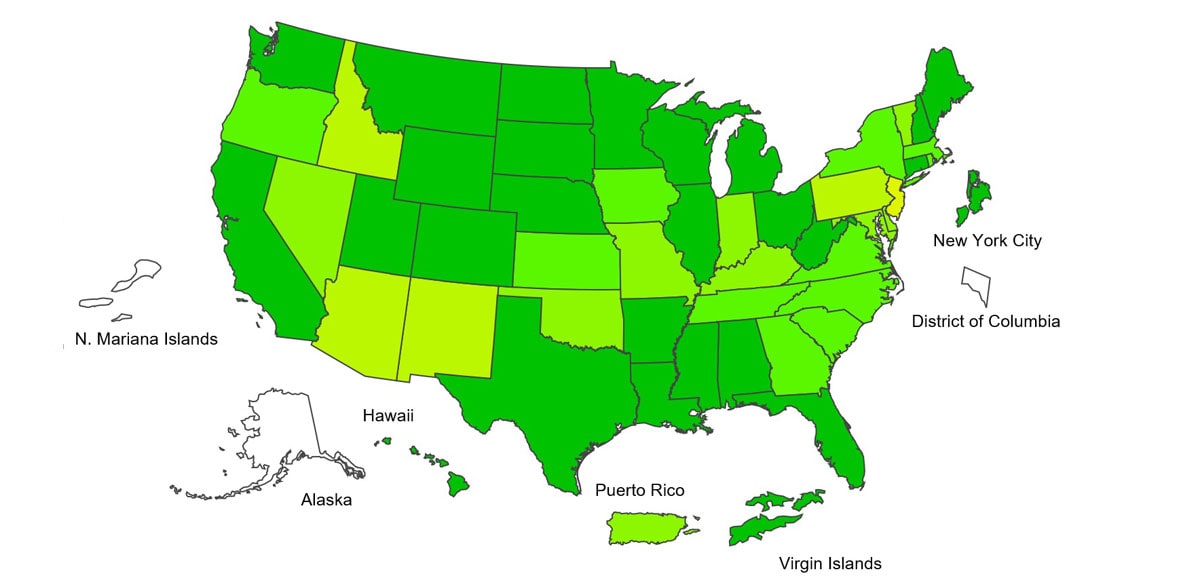
 
FluView Summary ending on October 24, 2020


fluview-banner2.jpg


Note: CDC is tracking the COVID-19 pandemic in a weekly publication called COVIDView.

Key Updates for Week 43, ending October 24, 2020

Seasonal influenza activity in the United States remains low.
Viruses


Clinical Labs
The percentage of respiratory specimens testing positive for influenza at clinical laboratories is 0.2% this week.

Public Health Labs
Influenza activity was low during the summer months and few specimens have tested positive in public health labs during recent weeks.

Virus Characterization
Influenza virus characterization information will be updated weekly starting later this season.
Illness

Outpatient Illness: ILINet
1.2% of visits to a health care provider were for ILI, which was a slight increase from the previous week (1.1%). ILI activity remains below the national baseline of 2.6%.

Outpatient Illness: ILINet Activity Map


This week, one jurisdiction experienced low ILI activity, while the remaining jurisdictions experienced minimal activity.
Severe Disease


Hospitalizations
Hospitalization rates will be updated weekly starting later this season.

P&I Mortality
8.2% of deaths were attributed to pneumonia, influenza, or COVID-19 (PIC). This is above the epidemic threshold of 5.9%.

Pediatric Deaths
No deaths occurring during the 2020-21 season were reported.

All data are preliminary and may change as more reports are received.

A description of the CDC influenza surveillance system, including methodology and detailed descriptions of each data component is available on the surveillance methods page.

Additional information on the current and previous influenza seasons for each surveillance component are available on FluView Interactive.

Key Points
  • An annual flu vaccine is the best way to protect against flu and its potentially serious complications.
  • CDC recommends everyone 6 months and older get a flu vaccine by the end of October.
  • There are also flu antiviral drugs that can be used to treat flu illness.
U.S. Virologic Surveillance:

Clinical Laboratories


The results of tests performed by clinical laboratories nationwide are summarized below. Data from clinical laboratories (the percentage of specimens tested that are positive for influenza) are used to monitor whether influenza activity is increasing or decreasing.

No. of specimens tested11,79149,937
No. of positive specimens (%)24 (0.2%)156 (0.3%)
Positive specimens by type
Influenza A13 (54.2%)83 (53.2%)
Influenza B11 (45.8%)73 (46.7%)


View Chart Data | View Full ScreenPublic Health Laboratories


The results of tests performed by public health laboratories nationwide are summarized below. Data from public health laboratories are used to monitor the proportion of circulating viruses that belong to each influenza subtype/lineage.
No. of specimens tested5,50425,031
No. of positive specimens410
Positive specimens by type/subtype
Influenza A4 (100%)7 (70.0%)
(H1N1)pdm090 (0.0%)1 (50.0%)
H3N21 (100%)1 (50.0%)
Subtyping not performed35
Influenza B0 (0.0%)3 (30.0%)
Yamagata lineage0 (0.0%)0 (0.0%)
Victoria lineage0 (0.0%)1 (100%)
Lineage not performed02


View Chart Data | View Full Screen
Additional virologic surveillance information for current and past seasons:
Surveillance Methods | FluView Interactive: National, Regional, and State Data or Age Data
Influenza Virus Characterization


CDC performs genetic and antigenic characterization of U.S. viruses submitted from state and local health laboratories using Right Size Roadmap submission guidance. These data are used to compare how similar the currently circulating influenza viruses are to the reference viruses representing viruses contained in the current influenza vaccines and to monitor evolutionary changes that continually occur in influenza viruses circulating in humans. CDC also tests susceptibility of influenza viruses to antiviral medications including the neuraminidase inhibitors (oseltamivir, zanamivir, and peramivir) and the PA endonuclease inhibitor baloxavir.

Virus characterization data will be updated weekly starting later this season when a sufficient number of specimens have been tested.
Outpatient Illness Surveillance

ILINet


Nationwide during week 43, 1.2% of patient visits reported through the U.S. Outpatient Influenza-like Illness Surveillance Network (ILINet) were due to influenza-like illness (ILI). This percentage is below the national baseline of 2.6%.

Healthcare seeking behaviors have changed dramatically during the COVID-19 pandemic. While outpatient ILI activity remains low, many people are accessing the healthcare system in alternative settings. Therefore, while traditional healthcare providers are not seeing increased numbers of cases of ILI, it is important to evaluate other sources of surveillance data to obtain a complete and accurate picture of both COVID-19 and influenza activity. CDC is tracking the COVID-19 pandemic in a weekly publication called COVIDView.


View Chart Data (current season only) | View Full ScreenILI Activity Map


Data collected in ILINet are used to produce a measure of ILI activity* by state/jurisdiction and Core Based Statistical Areas (CBSA).
Week 43
(Week ending
Oct. 24, 2020)
Week 42
(Week ending
Oct. 17, 2020)
Week 43
(Week ending
Oct. 24, 2020)
Week 42
(Week ending
Oct. 17, 2020)
Very High0000
High0011
Moderate0004
Low112628
Minimal5253554568
Insufficient Data10348328


*Data collected in ILINet may disproportionally represent certain populations within a jurisdiction or CBSA, and therefore, may not accurately depict the full picture of influenza activity for the entire jurisdiction or CBSA. Differences in the data presented here by CDC and independently by some health departments likely represent differing levels of data completeness with data presented by the health department likely being the more complete.
Additional information about medically attended visits for ILI for current and past seasons:
Surveillance Methods | FluView Interactive: National, Regional, and State Data or ILI Activity Map
Geographic Spread of Influenza as Assessed by State and Territorial Epidemiologists


The geographic spread of influenza as reported by state and territorial epidemiologists indicates geographic spread of influenza viruses but does not measure the severity of influenza activity. Due to the impact of COVID-19 on ILI surveillance, and the fact that the state and territorial epidemiologists report relies heavily on ILI activity, reporting for this system will be suspended for the 2020-21 influenza season. Data from previous seasons is available on FluView Interactive.
Additional geographic spread surveillance information for current and past seasons:
Surveillance Methods | FluView Interactive
Influenza-Associated Hospitalizations:


The Influenza Hospitalization Surveillance Network (FluSurv-NET) conducts population-based surveillance for laboratory-confirmed influenza-related hospitalizations in select counties in the Emerging Infections Program (EIP) states and Influenza Hospitalization Surveillance Project (IHSP) states. FluSurv-NET estimated hospitalization rates will be updated weekly starting later this season.
Additional hospitalization surveillance information for current and past seasons and additional age groups:
Surveillance Methods | FluView Interactive: Rates by Age or Patient Characteristics
National Center for Health Statistics (NCHS) Mortality Surveillance


Based on NCHS mortality surveillance data available on October 29, 2020, 8.2% of the deaths occurring during the week ending October 24, 2020 (week 43), were due to pneumonia, influenza, and COVID-19 (PIC). This percentage is above the epidemic threshold of 5.9% for week 43.

Weekly mortality surveillance data include a combination of machine coded and manually coded causes of death collected from death certificates. Percentages of deaths due to pneumonia, influenza, or COVID-19 (PIC) are higher among manually coded records than more rapidly available machine coded records. Due to the additional time needed for manual coding, the initially reported PIC percentages are likely to increase as more data are received and processed.


View Chart Dataexcel icon | View Full Screen
Additional pneumonia and influenza mortality surveillance information for current and past seasons:
Surveillance Methods | FluView Interactive
Influenza-Associated Pediatric Mortality


No influenza-associated pediatric deaths were reported to CDC during week 43.

No influenza-associated pediatric deaths occurring during the 2020-2021 season have been reported.


View Full Screen
Additional pediatric mortality surveillance information for current and past seasons:
Surveillance Methods | FluView Interactive


Additional National and International Influenza Surveillance Information


FluView Interactive: FluView includes enhanced web-based interactive applications that can provide dynamic visuals of the influenza data collected and analyzed by CDC. These FluView Interactive applications allow people to create customized, visual interpretations of influenza data, as well as make comparisons across flu seasons, regions, age groups and a variety of other demographics.

National Institute for Occupational Safety and Health: Monthly surveillance data on the prevalence of health-related workplace absenteeism among full-time workers in the United States are available from NIOSH.

U.S. State and local influenza surveillance: Select a jurisdiction below to access the latest local influenza information. World Health Organization:
Additional influenza surveillance information from participating WHO member nations is available through
FluNetexternal icon and the Global Epidemiology Reports.external icon

WHO Collaborating Centers for Influenza:
Australiaexternal icon, Chinaexternal icon, Japanexternal icon, the United Kingdomexternal icon, and the United States (CDC in Atlanta, Georgia)

Europe:
The most up-to-date influenza information from Europe is available from WHO/Europe and the European Centre for Disease Prevention and Controlexternal icon.

Public Health Agency of Canada:
The most up-to-date influenza information from Canada is available in Canada’s weekly FluWatch reportexternal icon.

Public Health England:
The most up-to-date influenza information from the United Kingdom is available from Public Health Englandexternal icon.

Any links provided to non-Federal organizations are provided solely as a service to our users. These links do not constitute an endorsement of these organizations or their programs by CDC or the Federal Government, and none should be inferred. CDC is not responsible for the content of the individual organization web pages found at these links.

A description of the CDC influenza surveillance system, including methodology and detailed descriptions of each data component is available on the surveillance methods page.

Page last reviewed: October 30, 2020, 11:00 AM

https://www.cdc.gov/flu/weekly/weeklyarchives2020-2021/week43.htm
 
FluView Summary ending on October 31, 2020


fluview-banner2.jpg


Note: CDC is tracking the COVID-19 pandemic in a weekly publication called COVIDView.

Key Updates for Week 44, ending October 31, 2020

Seasonal influenza activity in the United States remains low.
Viruses


Clinical Labs
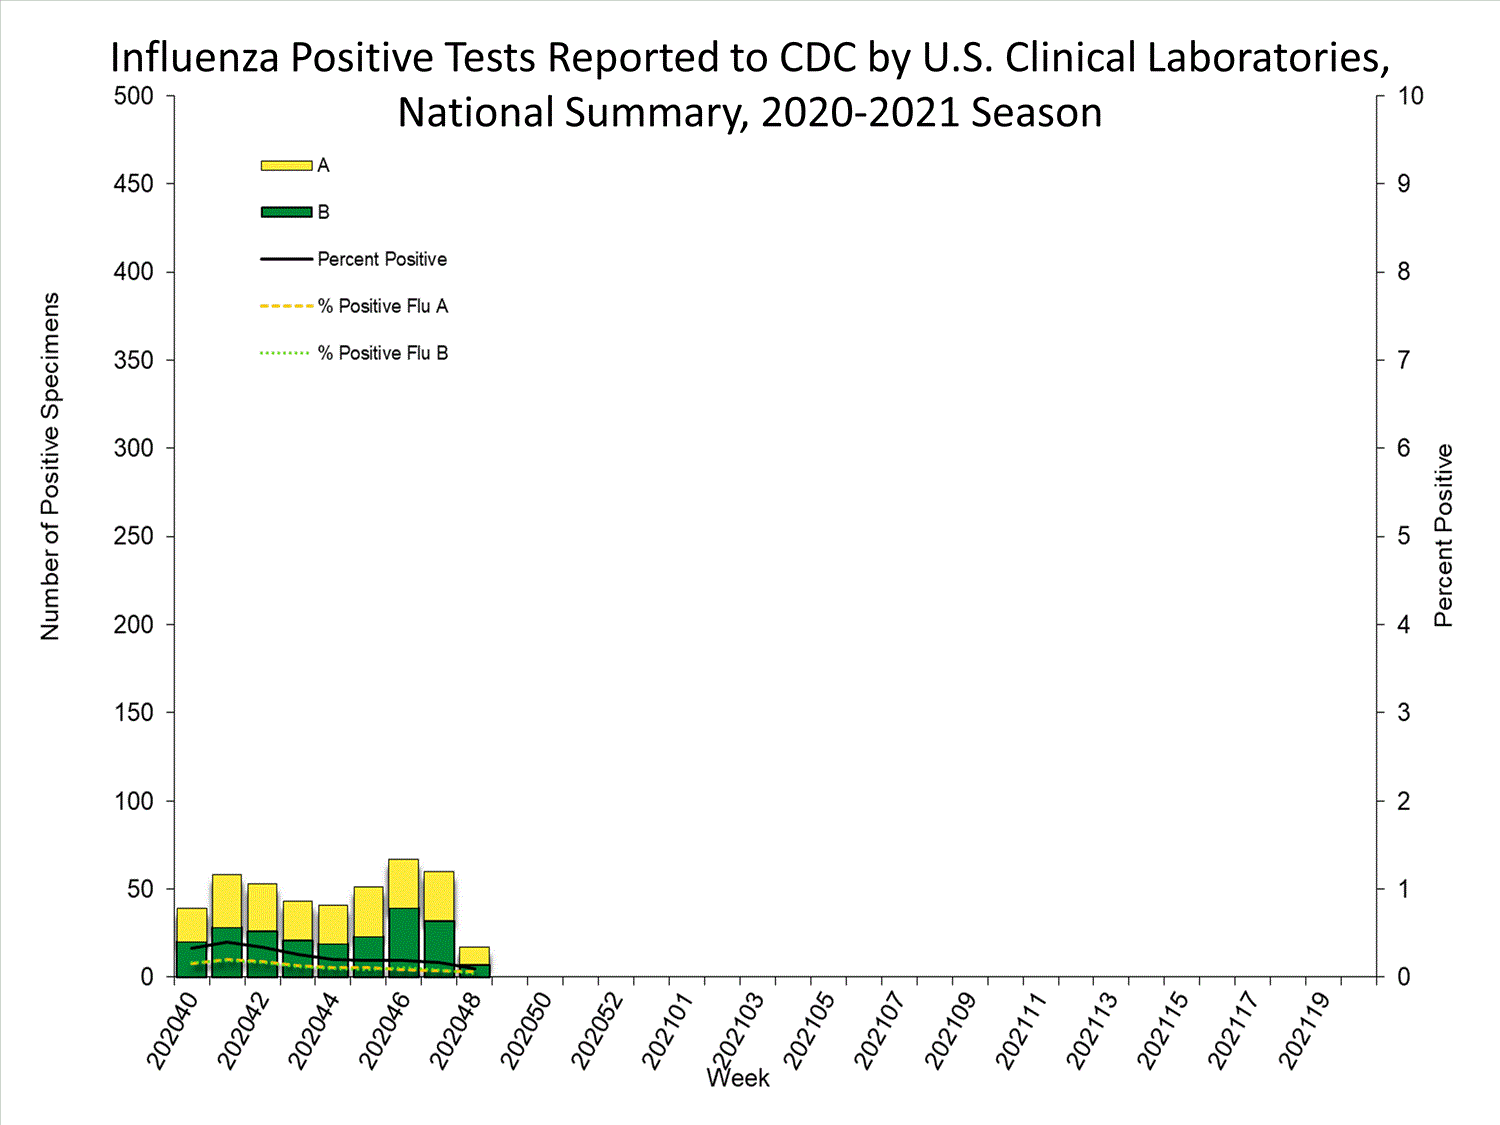
The percentage of respiratory specimens testing positive for influenza at clinical laboratories is 0.1% this week.

Public Health Labs
Influenza activity was low during the summer months and few specimens have tested positive in public health labs during recent weeks.

Virus Characterization
Influenza virus characterization information will be updated weekly starting later this season.
Illness

Outpatient Illness: ILINet
1.3% of visits to a health care provider were for ILI, which was a slight increase from the previous week (1.2%). ILI activity remains below the national baseline of 2.6%.
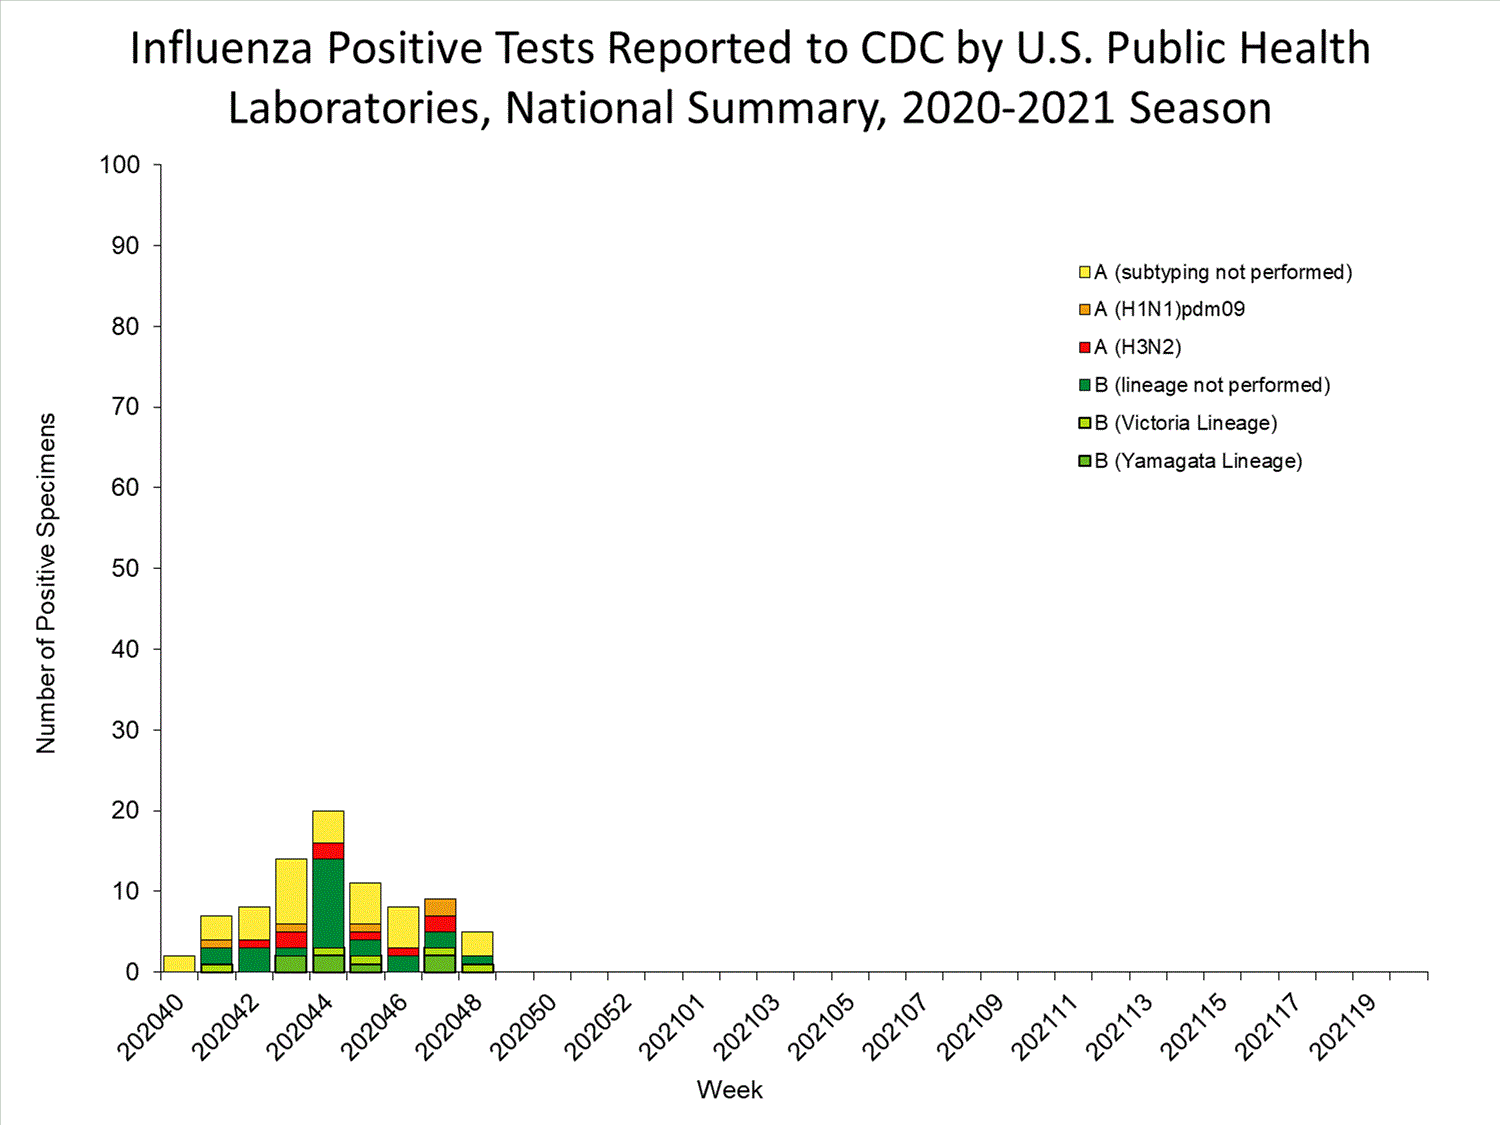
Outpatient Illness: ILINet Activity Map


This week, one jurisdiction experienced moderate ILI activity, one experienced low activity, and the remaining jurisdictions experienced minimal activity.
Severe Disease


Hospitalizations
Hospitalization rates will be updated weekly starting later this season.

P&I Mortality
8.1% of deaths were attributed to pneumonia, influenza, or COVID-19 (PIC). This is above the epidemic threshold of 6.0%.

Pediatric Deaths
One influenza-associated pediatric death occurring during the 2019-20 season was reported to CDC, bringing the total for that season to 195. No deaths occurring during the 2020-21 season were reported.

All data are preliminary and may change as more reports are received.

A description of the CDC influenza surveillance system, including methodology and detailed descriptions of each data component is available on the surveillance methods page.

Additional information on the current and previous influenza seasons for each surveillance component are available on FluView Interactive.

Key Points
  • An annual flu vaccine is the best way to protect against flu and its potentially serious complications.
  • If you haven’t gotten your flu vaccine yet, get vaccinated now.
  • There are also flu antiviral drugs that can be used to treat flu illness.
U.S. Virologic Surveillance:

Clinical Laboratories


The results of tests performed by clinical laboratories nationwide are summarized below. Data from clinical laboratories (the percentage of specimens tested that are positive for influenza) are used to monitor whether influenza activity is increasing or decreasing.

No. of specimens tested16,45671,814
No. of positive specimens (%)21 (0.1%)191 (0.3%)
Positive specimens by type
Influenza A13 (61.9%)102 (53.4%)
Influenza B8 (38.1%)89 (46.6%)


View Chart Data | View Full ScreenPublic Health Laboratories


The results of tests performed by public health laboratories nationwide are summarized below. Data from public health laboratories are used to monitor the proportion of circulating viruses that belong to each influenza subtype/lineage.
No. of specimens tested16,13957,877
No. of positive specimens1735
Positive specimens by type/subtype
Influenza A5 (29.4%)20 (57.1%)
(H1N1)pdm090 (0.0%)1 (50.0%)
H3N20 (0.0%)1 (50.0%)
Subtyping not performed518
Influenza B12 (70.6%)15 (42.9%)
Yamagata lineage0 (0.0%)0 (0.0%)
Victoria lineage1 (100.0%)2 (100%)
Lineage not performed1113


View Chart Data | View Full Screen
Additional virologic surveillance information for current and past seasons:
Surveillance Methods | FluView Interactive: National, Regional, and State Data or Age Data
Influenza Virus Characterization


CDC performs genetic and antigenic characterization of U.S. viruses submitted from state and local health laboratories using Right Size Roadmap submission guidance. These data are used to compare how similar the currently circulating influenza viruses are to the reference viruses representing viruses contained in the current influenza vaccines and to monitor evolutionary changes that continually occur in influenza viruses circulating in humans. CDC also tests susceptibility of influenza viruses to antiviral medications including the neuraminidase inhibitors (oseltamivir, zanamivir, and peramivir) and the PA endonuclease inhibitor baloxavir.

Virus characterization data will be updated weekly starting later this season when a sufficient number of specimens have been tested.
Outpatient Illness Surveillance

ILINet


Nationwide during week 44, 1.3% of patient visits reported through the U.S. Outpatient Influenza-like Illness Surveillance Network (ILINet) were due to influenza-like illness (ILI). This percentage is below the national baseline of 2.6%.

Healthcare seeking behaviors have changed dramatically during the COVID-19 pandemic. While outpatient ILI activity remains low, many people are accessing the healthcare system in alternative settings. Therefore, while traditional healthcare providers are not seeing increased numbers of cases of ILI, it is important to evaluate other sources of surveillance data to obtain a complete and accurate picture of both COVID-19 and influenza activity. CDC is tracking the COVID-19 pandemic in a weekly publication called COVIDView.


View Chart Data (current season only) | View Full ScreenILI Activity Map


Data collected in ILINet are used to produce a measure of ILI activity* by state/jurisdiction and Core Based Statistical Areas (CBSA).
Week 44
(Week ending
Oct. 31, 2020)
Week 43
(Week ending
Oct. 24, 2020)
Week 44
(Week ending
Oct. 31, 2020)
Week 43
(Week ending
Oct. 24, 2020)
Very High0000
High0021
Moderate1041
Low113827
Minimal5253544567
Insufficient Data00341333


*Data collected in ILINet may disproportionally represent certain populations within a jurisdiction or CBSA, and therefore, may not accurately depict the full picture of influenza activity for the entire jurisdiction or CBSA. Differences in the data presented here by CDC and independently by some health departments likely represent differing levels of data completeness with data presented by the health department likely being the more complete.
Additional information about medically attended visits for ILI for current and past seasons:
Surveillance Methods | FluView Interactive: National, Regional, and State Data or ILI Activity Map
Geographic Spread of Influenza as Assessed by State and Territorial Epidemiologists


The geographic spread of influenza as reported by state and territorial epidemiologists indicates geographic spread of influenza viruses but does not measure the severity of influenza activity. Due to the impact of COVID-19 on ILI surveillance, and the fact that the state and territorial epidemiologists report relies heavily on ILI activity, reporting for this system will be suspended for the 2020-21 influenza season. Data from previous seasons is available on FluView Interactive.
Additional geographic spread surveillance information for current and past seasons:
Surveillance Methods | FluView Interactive
Influenza-Associated Hospitalizations:


The Influenza Hospitalization Surveillance Network (FluSurv-NET) conducts population-based surveillance for laboratory-confirmed influenza-related hospitalizations in select counties in the Emerging Infections Program (EIP) states and Influenza Hospitalization Surveillance Project (IHSP) states. FluSurv-NET estimated hospitalization rates will be updated weekly starting later this season.
Additional hospitalization surveillance information for current and past seasons and additional age groups:
Surveillance Methods | FluView Interactive: Rates by Age or Patient Characteristics
National Center for Health Statistics (NCHS) Mortality Surveillance


Based on NCHS mortality surveillance data available on November 5, 2020, 8.1% of the deaths occurring during the week ending October 31, 2020 (week 44), were due to pneumonia, influenza, and COVID-19 (PIC). This percentage is above the epidemic threshold of 6.0% for week 44.

Weekly mortality surveillance data include a combination of machine coded and manually coded causes of death collected from death certificates. Percentages of deaths due to pneumonia, influenza, or COVID-19 (PIC) are higher among manually coded records than more rapidly available machine coded records. Due to the additional time needed for manual coding, the initially reported PIC percentages are likely to increase as more data are received and processed.


View Chart Dataexcel icon | View Full Screen
Additional pneumonia and influenza mortality surveillance information for current and past seasons:
Surveillance Methods | FluView Interactive
Influenza-Associated Pediatric Mortality


No influenza-associated pediatric deaths occurring during the 2020-21 season have been reported to CDC.

One influenza-associated pediatric death was reported to CDC during week 44. This death occurred during the 2019-2020 influenza season bringing the total number of deaths occurring during that season to 195. It was associated with an influenza B virus with no lineage determined and occurred during week 2 (the week ending January 11, 2020).


View Full Screen
Additional pediatric mortality surveillance information for current and past seasons:
Surveillance Methods | FluView Interactive


Additional National and International Influenza Surveillance Information


FluView Interactive: FluView includes enhanced web-based interactive applications that can provide dynamic visuals of the influenza data collected and analyzed by CDC. These FluView Interactive applications allow people to create customized, visual interpretations of influenza data, as well as make comparisons across flu seasons, regions, age groups and a variety of other demographics.

National Institute for Occupational Safety and Health: Monthly surveillance data on the prevalence of health-related workplace absenteeism among full-time workers in the United States are available from NIOSH.

U.S. State and local influenza surveillance: Select a jurisdiction below to access the latest local influenza information. World Health Organization:
Additional influenza surveillance information from participating WHO member nations is available through
FluNetexternal icon and the Global Epidemiology Reports.external icon

WHO Collaborating Centers for Influenza:
Australiaexternal icon, Chinaexternal icon, Japanexternal icon, the United Kingdomexternal icon, and the United States (CDC in Atlanta, Georgia)

Europe:
The most up-to-date influenza information from Europe is available from WHO/Europe and the European Centre for Disease Prevention and Controlexternal icon.

Public Health Agency of Canada:
The most up-to-date influenza information from Canada is available in Canada’s weekly FluWatch reportexternal icon.

Public Health England:
The most up-to-date influenza information from the United Kingdom is available from Public Health Englandexternal icon.

Any links provided to non-Federal organizations are provided solely as a service to our users. These links do not constitute an endorsement of these organizations or their programs by CDC or the Federal Government, and none should be inferred. CDC is not responsible for the content of the individual organization web pages found at these links.

A description of the CDC influenza surveillance system, including methodology and detailed descriptions of each data component is available on the surveillance methods page.

Page last reviewed: November 6, 2020, 11:00 AM

https://www.cdc.gov/flu/weekly/weeklyarchives2020-2021/week44.htm
 
FluView Summary ending on November 7, 2020

fluview-banner2.jpg


Note: CDC is tracking the COVID-19 pandemic in a weekly publication called COVIDView.

Key Updates for Week 45, ending November 7, 2020

Seasonal influenza activity in the United States remains low.
Viruses


Clinical Labs
The percentage of respiratory specimens testing positive for influenza at clinical laboratories is 0.2% this week.

Public Health Labs
Influenza activity was low during the summer months and few specimens have tested positive in public health labs during recent weeks.

Virus Characterization
Influenza virus characterization information will be updated weekly starting later this season.
Illness

Outpatient Illness: ILINet
1.5% of visits to a health care provider were for influenza-like illness (ILI), which was a slight increase from the previous week (1.3%). ILI activity remains below the national baseline of 2.6%; however, one of ten surveillance regions is above their region-specific baseline.

Outpatient Illness: ILINet Activity Map


This week, one jurisdiction experienced very high ILI activity, four experienced low activity, and the remaining jurisdictions experienced minimal activity.
Severe Disease


Hospitalizations
Hospitalization rates will be updated weekly starting later this season.

P&I Mortality
8.9% of deaths were attributed to pneumonia, influenza, or COVID-19 (PIC). This is above the epidemic threshold of 6.1%.

Pediatric Deaths
No influenza-associated pediatric deaths occurring during the 2020-21 season have been reported.

All data are preliminary and may change as more reports are received.

A description of the CDC influenza surveillance system, including methodology and detailed descriptions of each data component is available on the surveillance methods page.

Additional information on the current and previous influenza seasons for each surveillance component are available on FluView Interactive.

Key Points
  • An annual flu vaccine is the best way to protect against flu and its potentially serious complications.
  • If you haven’t gotten your flu vaccine yet, get vaccinated now.
  • There are also flu antiviral drugs that can be used to treat flu illness.
U.S. Virologic Surveillance:

Clinical Laboratories


The results of tests performed by clinical laboratories nationwide are summarized below. Data from clinical laboratories (the percentage of specimens tested that are positive for influenza) are used to monitor whether influenza activity is increasing or decreasing.

No. of specimens tested15,65693,482
No. of positive specimens (%)30 (0.2%)262 (0.3%)
Positive specimens by type
Influenza A19 (63.3%)138 (52.7%)
Influenza B11 (36.7%)124 (47.3%)


View Chart Data | View Full ScreenPublic Health Laboratories


The results of tests performed by public health laboratories nationwide are summarized below. Data from public health laboratories are used to monitor the proportion of circulating viruses that belong to each influenza subtype/lineage.
No. of specimens tested19,43985,746
No. of positive specimens649
Positive specimens by type/subtype
Influenza A4 (66.7%)28 (57.1%)
(H1N1)pdm090 (0.0%)1 (33.3%)
H3N20 (0.0%)2 (66.7%)
Subtyping not performed425
Influenza B2 (33.3%)21 (42.9%)
Yamagata lineage0 (0.0%)1 (25.0%)
Victoria lineage0 (0.0%) 3 (75.0%)
Lineage not performed217


View Chart Data | View Full Screen
Additional virologic surveillance information for current and past seasons:
Surveillance Methods | FluView Interactive: National, Regional, and State Data or Age Data
Influenza Virus Characterization


CDC performs genetic and antigenic characterization of U.S. viruses submitted from state and local health laboratories using Right Size Roadmap submission guidance. These data are used to compare how similar the currently circulating influenza viruses are to the reference viruses representing viruses contained in the current influenza vaccines and to monitor evolutionary changes that continually occur in influenza viruses circulating in humans. CDC also tests susceptibility of influenza viruses to antiviral medications, including the neuraminidase inhibitors (oseltamivir, zanamivir, and peramivir) and the PA endonuclease inhibitor baloxavir.

Virus characterization data will be updated weekly starting later this season when a sufficient number of specimens have been tested.
Outpatient Illness Surveillance

ILINet


Nationwide during week 45, 1.5% of patient visits reported through the U.S. Outpatient Influenza-like Illness Surveillance Network (ILINet) were due to influenza-like illness (ILI). This percentage is below the national baseline of 2.6%.

Healthcare seeking behaviors have changed dramatically during the COVID-19 pandemic. While outpatient ILI activity remains low, many people are accessing the healthcare system in alternative settings. Therefore, while traditional healthcare providers are not seeing increased numbers of cases of ILI, it is important to evaluate other sources of surveillance data to obtain a complete and accurate picture of both COVID-19 and influenza activity. CDC is tracking the COVID-19 pandemic in a weekly publication called COVIDView.


View Chart Data (current season only) | View Full Screen
One region, Region 7 (Iowa, Kansas, Missouri, and Nebraska), reported a percentage of outpatient visits for ILI (2.4%) above their region-specific baseline (1.7%). The remaining nine regions reported a percentage of outpatient visits for ILI below their region-specific baselines.
ILI Activity Map


Data collected in ILINet are used to produce a measure of ILI activity* by state/jurisdiction and Core Based Statistical Areas (CBSA).
Week 45
(Week ending
Nov. 7, 2020)
Week 44
(Week ending
Oct. 31, 2020)
Week 45
(Week ending
Nov. 7, 2020)
Week 44
(Week ending
Oct. 31, 2020)
Very High1010
High0012
Moderate0145
Low414038
Minimal4952540556
Insufficient Data10343328


*Data collected in ILINet may disproportionally represent certain populations within a jurisdiction or CBSA, and therefore, may not accurately depict the full picture of influenza activity for the entire jurisdiction or CBSA. Differences in the data presented here by CDC and independently by some health departments likely represent differing levels of data completeness with data presented by the health department likely being the more complete.
Additional information about medically attended visits for ILI for current and past seasons:
Surveillance Methods | FluView Interactive: National, Regional, and State Data or ILI Activity Map
Geographic Spread of Influenza as Assessed by State and Territorial Epidemiologists


The geographic spread of influenza as reported by state and territorial epidemiologists indicates geographic spread of influenza viruses but does not measure the severity of influenza activity. Due to the impact of COVID-19 on ILI surveillance, and the fact that the state and territorial epidemiologists report relies heavily on ILI activity, reporting for this system will be suspended for the 2020-21 influenza season. Data from previous seasons is available on FluView Interactive.
Additional geographic spread surveillance information for current and past seasons:
Surveillance Methods | FluView Interactive
Influenza-Associated Hospitalizations:


The Influenza Hospitalization Surveillance Network (FluSurv-NET) conducts population-based surveillance for laboratory-confirmed influenza-related hospitalizations in select counties in the Emerging Infections Program (EIP) states and Influenza Hospitalization Surveillance Project (IHSP) states. FluSurv-NET estimated hospitalization rates will be updated weekly starting later this season.
Additional hospitalization surveillance information for current and past seasons and additional age groups:
Surveillance Methods | FluView Interactive: Rates by Age or Patient Characteristics
National Center for Health Statistics (NCHS) Mortality Surveillance


Based on NCHS mortality surveillance data available on November 12, 2020, 8.9% of the deaths occurring during the week ending November 7, 2020 (week 45), were due to pneumonia, influenza, and COVID-19 (PIC). This percentage is above the epidemic threshold of 6.1% for week 45.

Weekly mortality surveillance data include a combination of machine coded and manually coded causes of death collected from death certificates. Percentages of deaths due to pneumonia, influenza, or COVID-19 (PIC) are higher among manually coded records than more rapidly available machine coded records. Due to the additional time needed for manual coding, the initially reported PIC percentages are likely to increase as more data are received and processed.


View Chart Dataexcel icon | View Full Screen
Additional pneumonia and influenza mortality surveillance information for current and past seasons:
Surveillance Methods | FluView Interactive
Influenza-Associated Pediatric Mortality


No influenza-associated pediatric deaths were reported to CDC during week 45.

No influenza-associated pediatric deaths occurring during the 2020-2021 season have been reported.


View Full Screen
Additional pediatric mortality surveillance information for current and past seasons:
Surveillance Methods | FluView Interactive


Additional National and International Influenza Surveillance Information


FluView Interactive: FluView includes enhanced web-based interactive applications that can provide dynamic visuals of the influenza data collected and analyzed by CDC. These FluView Interactive applications allow people to create customized, visual interpretations of influenza data, as well as make comparisons across flu seasons, regions, age groups and a variety of other demographics.

National Institute for Occupational Safety and Health: Monthly surveillance data on the prevalence of health-related workplace absenteeism among full-time workers in the United States are available from NIOSH.

U.S. State and local influenza surveillance: Select a jurisdiction below to access the latest local influenza information. World Health Organization:
Additional influenza surveillance information from participating WHO member nations is available through
FluNetexternal icon and the Global Epidemiology Reports.external icon

WHO Collaborating Centers for Influenza:
Australiaexternal icon, Chinaexternal icon, Japanexternal icon, the United Kingdomexternal icon, and the United States (CDC in Atlanta, Georgia)

Europe:
The most up-to-date influenza information from Europe is available from WHO/Europe and the European Centre for Disease Prevention and Controlexternal icon.

Public Health Agency of Canada:
The most up-to-date influenza information from Canada is available in Canada’s weekly FluWatch reportexternal icon.

Public Health England:
The most up-to-date influenza information from the United Kingdom is available from Public Health Englandexternal icon.

Any links provided to non-Federal organizations are provided solely as a service to our users. These links do not constitute an endorsement of these organizations or their programs by CDC or the Federal Government, and none should be inferred. CDC is not responsible for the content of the individual organization web pages found at these links.

A description of the CDC influenza surveillance system, including methodology and detailed descriptions of each data component is available on the surveillance methods page.

Page last reviewed: November 13, 2020, 11:00 AM

https://www.cdc.gov/flu/weekly/weeklyarchives2020-2021/week45.htm
 
Weekly U.S. Influenza Surveillance Report


Note: Due to the Thanksgiving holiday, the week 47 FluView report will be released on Monday, November 30, instead of Friday, November 27.​

fluview-banner2.jpg


Note: CDC is tracking the COVID-19 pandemic in a weekly publication called COVIDView.

Key Updates for Week 46, ending November 14, 2020

Seasonal influenza activity in the United States remains lower than usual for this time of year.
Viruses


Clinical Labs
The percentage of respiratory specimens testing positive for influenza at clinical laboratories is 0.2% this week.

Public Health Labs
Influenza activity was low during the summer months and few specimens have tested positive in public health labs during recent weeks.

Virus Characterization
Influenza virus characterization information will be updated weekly starting later this season.
Illness

Outpatient Illness: ILINet
1.5% of visits to a health care provider were for influenza-like illness (ILI), the same as the previous week (1.5%). ILI activity remains below the national baseline of 2.6%. ILI surveillance may be impacted by the COVID-19 pandemic and should be interpreted with caution.

Outpatient Illness: ILINet Activity Map


This week, two jurisdictions experienced low ILI activity while the remaining jurisdictions experienced minimal activity. ILI activity levels may be impacted by the COVID-19 pandemic and should be interpreted with caution.
Severe Disease


Hospitalizations
Hospitalization rates will be updated weekly starting later this season.

P&I Mortality
10.7% of deaths were attributed to pneumonia, influenza, or COVID-19 (PIC). This is above the epidemic threshold of 6.2%. The majority of PIC deaths are due to COVID-19.

Pediatric Deaths
No influenza-associated pediatric deaths occurring during the 2020-21 season have been reported.

All data are preliminary and may change as more reports are received.

A description of the CDC influenza surveillance system, including methodology and detailed descriptions of each data component is available on the surveillance methods page.

Additional information on the current and previous influenza seasons for each surveillance component are available on FluView Interactive.

Key Points
  • Flu activity is unusually low at this time but may increase in the coming months.
  • An annual flu vaccine is the best way to protect against flu and its potentially serious complications.
  • If you haven’t gotten your flu vaccine yet, get vaccinated now.
  • There are also flu antiviral drugs that can be used to treat flu illness.
U.S. Virologic Surveillance:

Clinical Laboratories


The results of tests performed by clinical laboratories nationwide are summarized below. Data from clinical laboratories (the percentage of specimens tested that are positive for influenza) are used to monitor whether influenza activity is increasing or decreasing.

No. of specimens tested18,482122,615
No. of positive specimens (%)41 (0.2%)319 (0.3%)
Positive specimens by type
Influenza A16 (39.0%)161 (50.5%)
Influenza B25 (61.0%)158 (49.5%)


View Chart Data | View Full ScreenPublic Health Laboratories


The results of tests performed by public health laboratories nationwide are summarized below. Data from public health laboratories are used to monitor the proportion of circulating viruses that belong to each influenza subtype/lineage.
No. of specimens tested14,089103,818
No. of positive specimens760
Positive specimens by type/subtype
Influenza A6 (85.7%)36 (60.0%)
(H1N1)pdm090 (0.0%)1 (25.0%)
H3N21 (100%)3 (75.0%)
Subtyping not performed532
Influenza B1 (14.3%)24 (40.0%)
Yamagata lineage0 (0%)1 (25.0%)
Victoria lineage0 (0%) 3 (75.0%)
Lineage not performed120


View Chart Data | View Full Screen
Additional virologic surveillance information for current and past seasons:
Surveillance Methods | FluView Interactive: National, Regional, and State Data or Age Data
Influenza Virus Characterization


CDC performs genetic and antigenic characterization of U.S. viruses submitted from state and local health laboratories using Right Size Roadmap submission guidance. These data are used to compare how similar the currently circulating influenza viruses are to the reference viruses representing viruses contained in the current influenza vaccines and to monitor evolutionary changes that continually occur in influenza viruses circulating in humans. CDC also tests susceptibility of influenza viruses to antiviral medications, including the neuraminidase inhibitors (oseltamivir, zanamivir, and peramivir) and the PA endonuclease inhibitor baloxavir.

Virus characterization data will be updated weekly starting later this season when a sufficient number of specimens have been tested.
Outpatient Illness Surveillance


Please note, the U.S. Outpatient Influenza-like Illness Surveillance Network (ILINet) monitors outpatient visits for influenza-like illness (ILI), not laboratory confirmed influenza, and as such, will capture visits due to other respiratory pathogens, such as SARS-CoV-2, that present with similar symptoms. In addition, healthcare seeking behaviors have changed dramatically during the COVID-19 pandemic. Many people are accessing the healthcare system in alternative settings which may or may not be captured as a part of ILINet. Therefore, ILI data, including ILI activity levels, should be interpreted with extreme caution. It is particularly important at this time to evaluate syndromic surveillance data, including that from ILINet, in the context of other sources of surveillance data to obtain a complete and accurate picture of both influenza and COVID-19 activity. CDC is tracking the COVID-19 pandemic in a weekly publication called COVIDView.
ILINet


Nationwide during week 46, 1.5% of patient visits reported through ILINet were due to ILI. This percentage is below the national baseline of 2.6%.


View Chart Data (current season only) | View Full Screen
Four regions (Region 2, Region 3, Region 9, Region 10) had increases in ILI activity, three regions had decreases in ILI activity (Region 1, Region 6, Region 7), and three regions (Region 4, Region 5, Region 8) remained stable (change of < 0.1%). All ten regions reported a percentage of outpatient visits for ILI below their region-specific baselines.
ILI Activity Map


Data collected in ILINet are used to produce a measure of ILI activity* by state/jurisdiction and Core Based Statistical Areas (CBSA).
Week 46
(Week ending
Nov. 14, 2020)
Week 45
(Week ending
Nov. 7, 2020)
Week 46
(Week ending
Nov. 14, 2020)
Week 45
(Week ending
Nov. 7, 2020)
Very High0101
High0031
Moderate0065
Low235641
Minimal5251515554
Insufficient Data10349327


*Data collected in ILINet may disproportionally represent certain populations within a jurisdiction or CBSA, and therefore, may not accurately depict the full picture of influenza activity for the entire jurisdiction or CBSA. Differences in the data presented here by CDC and independently by some health departments likely represent differing levels of data completeness with data presented by the health department likely being the more complete.
Additional information about medically attended visits for ILI for current and past seasons:
Surveillance Methods | FluView Interactive: National, Regional, and State Data or ILI Activity Map
Geographic Spread of Influenza as Assessed by State and Territorial Epidemiologists


The geographic spread of influenza as reported by state and territorial epidemiologists indicates geographic spread of influenza viruses but does not measure the severity of influenza activity. Due to the impact of COVID-19 on ILI surveillance, and the fact that the state and territorial epidemiologists report relies heavily on ILI activity, reporting for this system will be suspended for the 2020-21 influenza season. Data from previous seasons is available on FluView Interactive.
Additional geographic spread surveillance information for current and past seasons:
Surveillance Methods | FluView Interactive
Influenza-Associated Hospitalizations:


The Influenza Hospitalization Surveillance Network (FluSurv-NET) conducts population-based surveillance for laboratory-confirmed influenza-related hospitalizations in select counties in the Emerging Infections Program (EIP) states and Influenza Hospitalization Surveillance Project (IHSP) states. FluSurv-NET estimated hospitalization rates will be updated weekly starting later this season.
Additional hospitalization surveillance information for current and past seasons and additional age groups:
Surveillance Methods | FluView Interactive: Rates by Age or Patient Characteristics
National Center for Health Statistics (NCHS) Mortality Surveillance


Based on NCHS mortality surveillance data available on November 19, 2020, 10.7% of the deaths occurring during the week ending November 14, 2020 (week 46), were due to pneumonia, influenza, and COVID-19 (PIC). This percentage is above the epidemic threshold of 6.2% for week 46. Among the of the 2,187 PIC deaths reported for week 46, 1,260 had COVID-19 listed as an underlying or contributing cause of death on the death certificate and 2 listed influenza, indicating that the current increase in PIC mortality is due primarily to COVID-19 and not influenza.

Weekly mortality surveillance data include a combination of machine coded and manually coded causes of death collected from death certificates. Percentages of deaths due to pneumonia, influenza, or COVID-19 (PIC) are higher among manually coded records than more rapidly available machine coded records. Due to the additional time needed for manual coding, the initially reported PIC percentages are likely to increase as more data are received and processed.


View Chart Dataexcel icon | View Full Screen
Additional pneumonia and influenza mortality surveillance information for current and past seasons:
Surveillance Methods | FluView Interactive
Influenza-Associated Pediatric Mortality


No influenza-associated pediatric deaths were reported to CDC during week 46.

No influenza-associated pediatric deaths occurring during the 2020-2021 season have been reported.


View Full Screen
Additional pediatric mortality surveillance information for current and past seasons:
Surveillance Methods | FluView Interactive


Additional National and International Influenza Surveillance Information


FluView Interactive: FluView includes enhanced web-based interactive applications that can provide dynamic visuals of the influenza data collected and analyzed by CDC. These FluView Interactive applications allow people to create customized, visual interpretations of influenza data, as well as make comparisons across flu seasons, regions, age groups and a variety of other demographics.

National Institute for Occupational Safety and Health: Monthly surveillance data on the prevalence of health-related workplace absenteeism among full-time workers in the United States are available from NIOSH.

U.S. State and local influenza surveillance: Select a jurisdiction below to access the latest local influenza information. World Health Organization:
Additional influenza surveillance information from participating WHO member nations is available through
FluNetexternal icon and the Global Epidemiology Reports.external icon

WHO Collaborating Centers for Influenza:
Australiaexternal icon, Chinaexternal icon, Japanexternal icon, the United Kingdomexternal icon, and the United States (CDC in Atlanta, Georgia)

Europe:
The most up-to-date influenza information from Europe is available from WHO/Europe and the European Centre for Disease Prevention and Controlexternal icon.

Public Health Agency of Canada:
The most up-to-date influenza information from Canada is available in Canada’s weekly FluWatch reportexternal icon.

Public Health England:
The most up-to-date influenza information from the United Kingdom is available from Public Health Englandexternal icon.

Any links provided to non-Federal organizations are provided solely as a service to our users. These links do not constitute an endorsement of these organizations or their programs by CDC or the Federal Government, and none should be inferred. CDC is not responsible for the content of the individual organization web pages found at these links.

A description of the CDC influenza surveillance system, including methodology and detailed descriptions of each data component is available on the surveillance methods page.

Page last reviewed: November 20, 2020, 11:00 AM

https://www.cdc.gov/flu/weekly/
 
FluView Summary ending on November 28, 2020

fluview-banner2.jpg


Note: CDC is tracking the COVID-19 pandemic in a weekly publication called COVIDView.

Key Updates for Week 48, ending November 28, 2020

Seasonal influenza activity in the United States remains lower than usual for this time of year.
Viruses


Clinical Labs
The percentage of respiratory specimens testing positive for influenza at clinical laboratories is 0.1% this week.

Public Health Labs
Influenza activity was low during the summer months and few specimens have tested positive in public health labs during recent weeks.

Virus Characterization
Influenza virus characterization information will be updated weekly starting later this season.
Illness

Outpatient Illness: ILINet
1.6% of visits to a health care provider were for influenza-like illness (ILI), similar to the previous week (1.6%). ILI activity remains below the national baseline of 2.6%. ILI surveillance may be impacted by the COVID-19 pandemic and should be interpreted with caution.

Outpatient Illness: ILINet Activity Map


This week, five jurisdictions experienced low ILI activity, and the remaining jurisdictions experienced minimal ILI activity. ILI activity levels may be impacted by the COVID-19 pandemic and should be interpreted with caution.
Severe Disease


Hospitalizations
Hospitalization rates will be updated weekly starting later this season.

P&I Mortality
12.8% of deaths were attributed to pneumonia, influenza, or COVID-19 (PIC). This is above the epidemic threshold of 6.4%. The majority of PIC deaths are due to COVID-19.

Pediatric Deaths
No influenza-associated pediatric deaths occurring during the 2020-21 season have been reported.

All data are preliminary and may change as more reports are received.

A description of the CDC influenza surveillance system, including methodology and detailed descriptions of each data component is available on the surveillance methods page.

Additional information on the current and previous influenza seasons for each surveillance component are available on FluView Interactive.

Key Points
  • Flu activity is unusually low at this time but may increase in the coming months.
  • An annual flu vaccine is the best way to protect against flu and its potentially serious complications.
  • If you haven’t gotten your flu vaccine yet, get vaccinated now.
  • There are also flu antiviral drugs that can be used to treat flu illness.
U.S. Virologic Surveillance:

Clinical Laboratories


The results of tests performed by clinical laboratories nationwide are summarized below. Data from clinical laboratories (the percentage of specimens tested that are positive for influenza) are used to monitor whether influenza activity is increasing or decreasing.

No. of specimens tested17,104195,300
No. of positive specimens (%)17 (0.1%)429 (0.2%)
Positive specimens by type
Influenza A10 (58.8%)214 (49.9%)
Influenza B7 (41.2%)215 (50.1%)


View Chart Data | View Full ScreenPublic Health Laboratories


The results of tests performed by public health laboratories nationwide are summarized below. Data from public health laboratories are used to monitor the proportion of circulating viruses that belong to each influenza subtype/lineage.
No. of specimens tested10,175140,563
No. of positive specimens584
Positive specimens by type/subtype
Influenza A3 (60.0%)48 (57.1%)
(H1N1)pdm090 (0%)5 (35.7%)
H3N20 (0%)9 (64.3%)
Subtyping not performed334
Influenza B2 (40.0%)36 (42.9%)
Yamagata lineage0 (0%)5 (41.7%)
Victoria lineage1 (100%)7 (58.3%)
Lineage not performed124


View Chart Data | View Full Screen
Additional virologic surveillance information for current and past seasons:
Surveillance Methods | FluView Interactive: National, Regional, and State Data or Age Data
Influenza Virus Characterization


CDC performs genetic and antigenic characterization of U.S. viruses submitted from state and local health laboratories using Right Size Roadmap submission guidance. These data are used to compare how similar the currently circulating influenza viruses are to the reference viruses representing viruses contained in the current influenza vaccines and to monitor evolutionary changes that continually occur in influenza viruses circulating in humans. CDC also tests susceptibility of influenza viruses to antiviral medications, including the neuraminidase inhibitors (oseltamivir, zanamivir, and peramivir) and the PA endonuclease inhibitor baloxavir.

Virus characterization data will be updated weekly starting later this season when a sufficient number of specimens have been tested.
Outpatient Illness Surveillance


Please note, the U.S. Outpatient Influenza-like Illness Surveillance Network (ILINet) monitors outpatient visits for influenza-like illness (ILI), not laboratory-confirmed influenza, and as such, will capture visits due to other respiratory pathogens, such as SARS-CoV-2, that present with similar symptoms. In addition, healthcare-seeking behaviors have changed dramatically during the COVID-19 pandemic. Many people are accessing the healthcare system in alternative settings which may or may not be captured as a part of ILINet. Therefore, ILI data, including ILI activity levels, should be interpreted with extreme caution. It is particularly important at this time to evaluate syndromic surveillance data, including that from ILINet, in the context of other sources of surveillance data to obtain a complete and accurate picture of both influenza and COVID-19 activity. CDC is tracking the COVID-19 pandemic in a weekly publication called COVIDView.
ILINet


Nationwide during week 48, 1.6% of patient visits reported through ILINet were due to ILI. This percentage is below the national baseline of 2.6%.


View Chart Data (current season only) | View Full Screen
Two regions (Regions 3 and 9) had increases in ILI activity, three regions (Region 5, 6, and 7) had a decrease in ILI activity, and five regions (Regions 1, 2, 4, 8, and 10) remained stable (change of ≤ 0.1%). All ten regions reported a percentage of outpatient visits for ILI below their region-specific baselines.
ILI Activity Map


Data collected in ILINet are used to produce a measure of ILI activity* by state/jurisdiction and Core Based Statistical Areas (CBSA).
Week 48
(Week ending
Nov. 28, 2020)
Week 47
(Week ending
Nov. 21, 2020)
Week 48
(Week ending
Nov. 28, 2020)
Week 47
(Week ending
Nov. 21, 2020)
Very High0000
High0035
Moderate001416
Low525640
Minimal4753511551
Insufficient Data30345317


*Data collected in ILINet may disproportionally represent certain populations within a jurisdiction or CBSA, and therefore, may not accurately depict the full picture of influenza activity for the entire jurisdiction or CBSA. Differences in the data presented here by CDC and independently by some health departments likely represent differing levels of data completeness with data presented by the health department likely being the more complete.
Additional information about medically attended visits for ILI for current and past seasons:
Surveillance Methods | FluView Interactive: National, Regional, and State Data or ILI Activity Map
Geographic Spread of Influenza as Assessed by State and Territorial Epidemiologists


The geographic spread of influenza as reported by state and territorial epidemiologists indicates geographic spread of influenza viruses but does not measure the severity of influenza activity. Due to the impact of COVID-19 on ILI surveillance, and the fact that the state and territorial epidemiologists report relies heavily on ILI activity, reporting for this system will be suspended for the 2020-21 influenza season. Data from previous seasons is available on FluView Interactive.
Additional geographic spread surveillance information for current and past seasons:
Surveillance Methods | FluView Interactive
Influenza-Associated Hospitalizations:


The Influenza Hospitalization Surveillance Network (FluSurv-NET) conducts population-based surveillance for laboratory-confirmed influenza-related hospitalizations in select counties in the Emerging Infections Program (EIP) states and Influenza Hospitalization Surveillance Project (IHSP) states. FluSurv-NET estimated hospitalization rates will be updated weekly starting later this season.
Additional hospitalization surveillance information for current and past seasons and additional age groups:
Surveillance Methods | FluView Interactive: Rates by Age or Patient Characteristics
National Center for Health Statistics (NCHS) Mortality Surveillance


Based on NCHS mortality surveillance data available on December 3, 2020, 12.8% of the deaths occurring during the week ending November 28, 2020 (week 48), were due to pneumonia, influenza, and COVID-19 (PIC). This percentage is above the epidemic threshold of 6.4% for week 48. Among the 2,094 PIC deaths reported for week 48, 1,397 had COVID-19 listed as an underlying or contributing cause of death on the death certificate and three listed influenza, indicating that the current increase in PIC mortality is due primarily to COVID-19 and not influenza.

Weekly mortality surveillance data include a combination of machine coded and manually coded causes of death collected from death certificates. Percentages of deaths due to pneumonia, influenza, or COVID-19 (PIC) are higher among manually coded records than more rapidly available machine coded records. Due to the additional time needed for manual coding, the initially reported PIC percentages are likely to increase as more data are received and processed.


View Chart Dataexcel icon | View Full Screen
Additional pneumonia and influenza mortality surveillance information for current and past seasons:
Surveillance Methods | FluView Interactive
Influenza-Associated Pediatric Mortality


No influenza-associated pediatric deaths were reported to CDC during week 48.

No influenza-associated pediatric deaths occurring during the 2020-2021 season have been reported.


View Full Screen
Additional pediatric mortality surveillance information for current and past seasons:
Surveillance Methods | FluView Interactive


Additional National and International Influenza Surveillance Information


FluView Interactive: FluView includes enhanced web-based interactive applications that can provide dynamic visuals of the influenza data collected and analyzed by CDC. These FluView Interactive applications allow people to create customized, visual interpretations of influenza data, as well as make comparisons across flu seasons, regions, age groups and a variety of other demographics.

National Institute for Occupational Safety and Health: Monthly surveillance data on the prevalence of health-related workplace absenteeism among full-time workers in the United States are available from NIOSH.

U.S. State and local influenza surveillance: Select a jurisdiction below to access the latest local influenza information. World Health Organization:
Additional influenza surveillance information from participating WHO member nations is available through
FluNetexternal icon and the Global Epidemiology Reports.external icon

WHO Collaborating Centers for Influenza:
Australiaexternal icon, Chinaexternal icon, Japanexternal icon, the United Kingdomexternal icon, and the United States (CDC in Atlanta, Georgia)

Europe:
The most up-to-date influenza information from Europe is available from WHO/Europe and the European Centre for Disease Prevention and Controlexternal icon.

Public Health Agency of Canada:
The most up-to-date influenza information from Canada is available in Canada’s weekly FluWatch reportexternal icon.

Public Health England:
The most up-to-date influenza information from the United Kingdom is available from Public Health Englandexternal icon.

Any links provided to non-Federal organizations are provided solely as a service to our users. These links do not constitute an endorsement of these organizations or their programs by CDC or the Federal Government, and none should be inferred. CDC is not responsible for the content of the individual organization web pages found at these links.

A description of the CDC influenza surveillance system, including methodology and detailed descriptions of each data component is available on the surveillance methods page.

Page last reviewed: December 4, 2020, 11:00 AM

https://www.cdc.gov/flu/weekly/weeklyarchives2020-2021/week48.htm
 
Weekly U.S. Influenza Surveillance Report


fluview-banner2.jpg


Note: CDC is tracking the COVID-19 pandemic in a weekly publication called COVIDView.

Key Updates for Week 49, ending December 5, 2020

Seasonal influenza activity in the United States remains lower than usual for this time of year.
Viruses


Clinical Labs
The percentage of respiratory specimens testing positive for influenza at clinical laboratories is 0.2% this week.

Public Health Labs
Influenza activity was low during the summer months and few specimens have tested positive in public health labs during recent weeks.

Virus Characterization
Influenza virus characterization information will be updated weekly starting later this season.
Illness

Outpatient Illness: ILINet
The percentage of visits to a health care provider for influenza-like illness (ILI) remained at 1.6% for a third consecutive week. This is below the national baseline of 2.6%. ILI surveillance may be impacted by the COVID-19 pandemic and should be interpreted with caution.

Outpatient Illness: ILINet Activity Map


This week, four jurisdictions experienced low ILI activity, and the remaining jurisdictions experienced minimal ILI activity. ILI activity levels may be impacted by the COVID-19 pandemic and should be interpreted with caution.
Severe Disease


Hospitalizations
Hospitalization rates will be presented once case counts increase to a level that produces stable rates; in the interim, case counts will be reported each week.

NCHS Mortality
14.3% of deaths were attributed to pneumonia, influenza, or COVID-19 (PIC). This is above the epidemic threshold of 6.5%. The majority of PIC deaths are due to COVID-19.

Pediatric Deaths
The first influenza-associated pediatric death occurring during the 2020-21 season was reported to CDC this week.

All data are preliminary and may change as more reports are received.

A description of the CDC influenza surveillance system, including methodology and detailed descriptions of each data component is available on the surveillance methods page.

Additional information on the current and previous influenza seasons for each surveillance component are available on FluView Interactive.

Key Points
  • Flu activity is unusually low at this time but may increase in the coming months.
  • An annual flu vaccine is the best way to protect against flu and its potentially serious complications.
  • If you haven’t gotten your flu vaccine yet, get vaccinated now.
  • There are also flu antiviral drugs that can be used to treat flu illness.
U.S. Virologic Surveillance:

Clinical Laboratories


The results of tests performed by clinical laboratories nationwide are summarized below. Data from clinical laboratories (the percentage of specimens tested that are positive for influenza) are used to monitor whether influenza activity is increasing or decreasing.

No. of specimens tested22,474232,452
No. of positive specimens (%)40 (0.2%)496 (0.2%)
Positive specimens by type
Influenza A19 (47.5%)243 (49.0%)
Influenza B21 (52.5%)253 (51.0%)


View Chart Data | View Full ScreenPublic Health Laboratories


The results of tests performed by public health laboratories nationwide are summarized below. Data from public health laboratories are used to monitor the proportion of circulating viruses that belong to each influenza subtype/lineage.
No. of specimens tested16,550168,660
No. of positive specimens16106
Positive specimens by type/subtype
Influenza A5 (31.3%)57 (53.8%)
(H1N1)pdm091 (100%)8 (47.1%)
H3N20 (0%)9 (52.9%)
Subtyping not performed440
Influenza B11 (68.8%)49 (46.2%)
Yamagata lineage4 (57.1%)11 (57.9%)
Victoria lineage3 (42.9%)8 (42.1%)
Lineage not performed430


View Chart Data | View Full Screen
Additional virologic surveillance information for current and past seasons:
Surveillance Methods | FluView Interactive: National, Regional, and State Data or Age Data
Influenza Virus Characterization


CDC performs genetic and antigenic characterization of U.S. viruses submitted from state and local health laboratories using Right Size Roadmap submission guidance. These data are used to compare how similar the currently circulating influenza viruses are to the reference viruses representing viruses contained in the current influenza vaccines and to monitor evolutionary changes that continually occur in influenza viruses circulating in humans. CDC also tests susceptibility of influenza viruses to antiviral medications, including the neuraminidase inhibitors (oseltamivir, zanamivir, and peramivir) and the PA endonuclease inhibitor baloxavir.

Virus characterization data will be updated weekly starting later this season when a sufficient number of specimens have been tested.
Outpatient Illness Surveillance


Please note, the U.S. Outpatient Influenza-like Illness Surveillance Network (ILINet) monitors outpatient visits for influenza-like illness (ILI), not laboratory-confirmed influenza, and as such, will capture visits due to other respiratory pathogens, such as SARS-CoV-2, that present with similar symptoms. In addition, healthcare-seeking behaviors have changed dramatically during the COVID-19 pandemic. Many people are accessing the healthcare system in alternative settings which may or may not be captured as a part of ILINet. Therefore, ILI data, including ILI activity levels, should be interpreted with extreme caution. It is particularly important at this time to evaluate syndromic surveillance data, including that from ILINet, in the context of other sources of surveillance data to obtain a complete and accurate picture of both influenza and COVID-19 activity. CDC is tracking the COVID-19 pandemic in a weekly publication called COVIDView.
ILINet


Nationwide during week 49, 1.6% of patient visits reported through ILINet were due to ILI. This percentage is below the national baseline of 2.6%.


View Chart Data (current season only) | View Full Screen
During week 49 compared with week 48, one region (Region 2) had an increase in the percentage of visits for ILI, one region (Region 10) had a decrease in percentage of visits for ILI, and the remaining regions remained stable (change of ≤ 0.1%). All ten regions reported a percentage of outpatient visits for ILI below their region-specific baselines.
ILI Activity Map


Data collected in ILINet are used to produce a measure of ILI activity* by state/jurisdiction and Core Based Statistical Areas (CBSA).
Week 49
(Week ending
Dec. 5, 2020)
Week 48
(Week ending
Nov. 28, 2020)
Week 49
(Week ending
Dec. 5, 2020)
Week 48
(Week ending
Nov. 28, 2020)
Very High0000
High0043
Moderate001315
Low445360
Minimal4950547543
Insufficient Data21312308


*Data collected in ILINet may disproportionally represent certain populations within a jurisdiction or CBSA, and therefore, may not accurately depict the full picture of influenza activity for the entire jurisdiction or CBSA. Differences in the data presented here by CDC and independently by some health departments likely represent differing levels of data completeness with data presented by the health department likely being the more complete.
Additional information about medically attended visits for ILI for current and past seasons:
Surveillance Methods | FluView Interactive: National, Regional, and State Data or ILI Activity Map
Geographic Spread of Influenza as Assessed by State and Territorial Epidemiologists


The geographic spread of influenza as reported by state and territorial epidemiologists indicates geographic spread of influenza viruses but does not measure the severity of influenza activity. Due to the impact of COVID-19 on ILI surveillance, and the fact that the state and territorial epidemiologists report relies heavily on ILI activity, reporting for this system will be suspended for the 2020-21 influenza season. Data from previous seasons is available on FluView Interactive.
Additional geographic spread surveillance information for current and past seasons:
Surveillance Methods | FluView Interactive
Influenza-Associated Hospitalizations:


The Influenza Hospitalization Surveillance Network (FluSurv-NET) conducts population-based surveillance for laboratory-confirmed influenza-related hospitalizations in select counties in the Emerging Infections Program (EIP) states and Influenza Hospitalization Surveillance Project (IHSP) states.

A total of 61 laboratory-confirmed influenza-associated hospitalizations were reported by FluSurv-NET sites between October 1, 2020 and December 5, 2020 which is lower than average for this point in the season and comparable to counts seen at this point during the 2011-12 season. Hospitalization rates will be presented once case counts increase to a level that produces stable rates; in the interim, case counts will be reported each week.
Additional hospitalization surveillance information for current and past seasons and additional age groups:
Surveillance Methods | FluView Interactive: Rates by Age or Patient Characteristics
National Center for Health Statistics (NCHS) Mortality Surveillance


Based on NCHS mortality surveillance data available on December 10, 2020, 14.3% of the deaths occurring during the week ending December 5, 2020 (week 49), were due to pneumonia, influenza, and COVID-19 (PIC). This percentage is above the epidemic threshold of 6.5% for week 49. Among the 3,052 PIC deaths reported for week 49, 2,113 had COVID-19 listed as an underlying or contributing cause of death on the death certificate and five listed influenza, indicating that the current increase in PIC mortality is due primarily to COVID-19 and not influenza.

Weekly mortality surveillance data include a combination of machine coded and manually coded causes of death collected from death certificates. Percentages of deaths due to pneumonia, influenza, or COVID-19 (PIC) are higher among manually coded records than more rapidly available machine coded records. Due to the additional time needed for manual coding, the initially reported PIC percentages are likely to increase as more data are received and processed.


View Chart Dataexcel icon | View Full Screen
Additional pneumonia and influenza mortality surveillance information for current and past seasons:
Surveillance Methods | FluView Interactive
Influenza-Associated Pediatric Mortality


One influenza-associated pediatric death occurring during the 2020-2021 season was reported to CDC during week 49. This death was associated with an influenza B virus with no lineage determined and occurred during week 48 (the week ending November 28, 2020).

A total of one influenza-associated pediatric death occurring during the 2020-2021 season has been reported to CDC.


View Full Screen
Additional pediatric mortality surveillance information for current and past seasons:
Surveillance Methods | FluView Interactive


Additional National and International Influenza Surveillance Information


FluView Interactive: FluView includes enhanced web-based interactive applications that can provide dynamic visuals of the influenza data collected and analyzed by CDC. These FluView Interactive applications allow people to create customized, visual interpretations of influenza data, as well as make comparisons across flu seasons, regions, age groups and a variety of other demographics.

National Institute for Occupational Safety and Health: Monthly surveillance data on the prevalence of health-related workplace absenteeism among full-time workers in the United States are available from NIOSH.

U.S. State and local influenza surveillance: Select a jurisdiction below to access the latest local influenza information. World Health Organization:
Additional influenza surveillance information from participating WHO member nations is available through
FluNetexternal icon and the Global Epidemiology Reports.external icon

WHO Collaborating Centers for Influenza:
Australiaexternal icon, Chinaexternal icon, Japanexternal icon, the United Kingdomexternal icon, and the United States (CDC in Atlanta, Georgia)

Europe:
The most up-to-date influenza information from Europe is available from WHO/Europe and the European Centre for Disease Prevention and Controlexternal icon.

Public Health Agency of Canada:
The most up-to-date influenza information from Canada is available in Canada’s weekly FluWatch reportexternal icon.

Public Health England:
The most up-to-date influenza information from the United Kingdom is available from Public Health Englandexternal icon.

Any links provided to non-Federal organizations are provided solely as a service to our users. These links do not constitute an endorsement of these organizations or their programs by CDC or the Federal Government, and none should be inferred. CDC is not responsible for the content of the individual organization web pages found at these links.

A description of the CDC influenza surveillance system, including methodology and detailed descriptions of each data component is available on the surveillance methods page.

Page last reviewed: December 11, 2020, 11:00 AM

https://www.cdc.gov/flu/weekly/
 
Weekly U.S. Influenza Surveillance Report


Note: Due to the Christmas and New Year’s holidays, the week 51 and 52 FluView reports will be released on Monday, December 30, instead of Friday, December 25 and Monday, January 4th, instead of Friday January 1st, respectively.​

fluview-banner2.jpg


Note: CDC is tracking the COVID-19 pandemic in a weekly publication called COVIDView.

Key Updates for Week 50, ending December 12, 2020

Seasonal influenza activity in the United States remains lower than usual for this time of year.
Viruses


Clinical Labs
The percentage of respiratory specimens testing positive for influenza at clinical laboratories is 0.3% this week.

Public Health Labs
Influenza activity was low during the summer months and few specimens have tested positive in public health labs during recent weeks.

Virus Characterization
Influenza virus characterization information will be updated weekly starting later this season.
Illness

Outpatient Illness: ILINet
The percentage of visits to a health care provider for influenza-like illness (ILI) remained at 1.6% for the fourth consecutive week. This is below the national baseline of 2.6%. ILI surveillance may be impacted by the COVID-19 pandemic and should be interpreted with caution.

Outpatient Illness: ILINet Activity Map


This week, one jurisdiction experienced moderate ILI activity and the remaining jurisdictions experienced minimal ILI activity. ILI activity levels may be impacted by the COVID-19 pandemic and should be interpreted with caution.
Severe Disease


Hospitalizations
Hospitalization rates will be presented once case counts increase to a level that produces stable rates; in the interim, case counts will be reported each week.

NCHS Mortality
13.3% of deaths were attributed to pneumonia, influenza, or COVID-19 (PIC). This is above the epidemic threshold of 6.6%. The majority of PIC deaths are due to COVID-19.

Pediatric Deaths
No new influenza-associated pediatric deaths were reported to CDC this week. The total for the 2020-21 season is one.

All data are preliminary and may change as more reports are received.

A description of the CDC influenza surveillance system, including methodology and detailed descriptions of each data component is available on the surveillance methods page.

Additional information on the current and previous influenza seasons for each surveillance component are available on FluView Interactive.

Key Points
  • Flu activity is unusually low at this time but may increase in the coming months.
  • An annual flu vaccine is the best way to protect against flu and its potentially serious complications.
  • If you haven’t gotten your flu vaccine yet, get vaccinated now.
  • There are also flu antiviral drugs that can be used to treat flu illness.
U.S. Virologic Surveillance:

Clinical Laboratories


The results of tests performed by clinical laboratories nationwide are summarized below. Data from clinical laboratories (the percentage of specimens tested that are positive for influenza) are used to monitor whether influenza activity is increasing or decreasing.

No. of specimens tested29,578286,984
No. of positive specimens (%)75 (0.3%)666 (0.2%)
Positive specimens by type
Influenza A13 (17.3%)273 (41.0%)
Influenza B62 (82.7%)393 (59.0%)


View Chart Data | View Full ScreenPublic Health Laboratories


The results of tests performed by public health laboratories nationwide are summarized below. Data from public health laboratories are used to monitor the proportion of circulating viruses that belong to each influenza subtype/lineage.
No. of specimens tested15,298182,414
No. of positive specimens7123
Positive specimens by type/subtype
Influenza A7 (100%)70 (56.9%)
(H1N1)pdm092 (100%)7 (50.0%)
H3N20 (0%)7 (50.0%)
Subtyping not performed556
Influenza B0 (0%)53 (43.1%)
Yamagata lineage0 (0%)7 (53.8%)
Victoria lineage0 (0%)6 (46.2%)
Lineage not performed040


View Chart Data | View Full Screen
Additional virologic surveillance information for current and past seasons:
Surveillance Methods | FluView Interactive: National, Regional, and State Data or Age Data
Influenza Virus Characterization


CDC performs genetic and antigenic characterization of U.S. viruses submitted from state and local health laboratories using Right Size Roadmap submission guidance. These data are used to compare how similar the currently circulating influenza viruses are to the reference viruses representing viruses contained in the current influenza vaccines and to monitor evolutionary changes that continually occur in influenza viruses circulating in humans. CDC also tests susceptibility of influenza viruses to antiviral medications, including the neuraminidase inhibitors (oseltamivir, zanamivir, and peramivir) and the PA endonuclease inhibitor baloxavir.

Virus characterization data will be updated weekly starting later this season when a sufficient number of specimens have been tested.
Outpatient Illness Surveillance


Please note, the U.S. Outpatient Influenza-like Illness Surveillance Network (ILINet) monitors outpatient visits for influenza-like illness (ILI), not laboratory-confirmed influenza, and as such, will capture visits due to other respiratory pathogens, such as SARS-CoV-2, that present with similar symptoms. In addition, healthcare-seeking behaviors have changed dramatically during the COVID-19 pandemic. Many people are accessing the healthcare system in alternative settings which may or may not be captured as a part of ILINet. Therefore, ILI data, including ILI activity levels, should be interpreted with extreme caution. It is particularly important at this time to evaluate syndromic surveillance data, including that from ILINet, in the context of other sources of surveillance data to obtain a complete and accurate picture of both influenza and COVID-19 activity. CDC is tracking the COVID-19 pandemic in a weekly publication called COVIDView.
ILINet


Nationwide during week 50, 1.6% of patient visits reported through ILINet were due to ILI. This percentage is below the national baseline of 2.6%.


View Chart Data (current season only) | View Full Screen
During week 50 compared with week 49, one region (Region 9) had an increase in the percentage of visits for ILI, three regions (Regions 1, 2, and 7) had a decrease in percentage of visits for ILI, and the remaining regions remained stable (change of ≤ 0.1%). All 10 regions reported a percentage of outpatient visits for ILI below their region-specific baselines.
ILI Activity Map


Data collected in ILINet are used to produce a measure of ILI activity* by state/jurisdiction and Core Based Statistical Areas (CBSA).
Week 50
(Week ending
Dec. 12, 2020)
Week 49
(Week ending
Dec. 5, 2020)
Week 50
(Week ending
Dec. 12, 2020)
Week 49
(Week ending
Dec. 5, 2020)
Very High0000
High0045
Moderate10813
Low044359
Minimal5149566556
Insufficient Data32308296


*Data collected in ILINet may disproportionally represent certain populations within a jurisdiction or CBSA, and therefore, may not accurately depict the full picture of influenza activity for the entire jurisdiction or CBSA. Differences in the data presented here by CDC and independently by some health departments likely represent differing levels of data completeness with data presented by the health department likely being the more complete.
Additional information about medically attended visits for ILI for current and past seasons:
Surveillance Methods | FluView Interactive: National, Regional, and State Data or ILI Activity Map
Geographic Spread of Influenza as Assessed by State and Territorial Epidemiologists


The geographic spread of influenza as reported by state and territorial epidemiologists indicates geographic spread of influenza viruses but does not measure the severity of influenza activity. Due to the impact of COVID-19 on ILI surveillance, and the fact that the state and territorial epidemiologists report relies heavily on ILI activity, reporting for this system will be suspended for the 2020-21 influenza season. Data from previous seasons is available on FluView Interactive.
Additional geographic spread surveillance information for current and past seasons:
Surveillance Methods | FluView Interactive
Influenza-Associated Hospitalizations:


The Influenza Hospitalization Surveillance Network (FluSurv-NET) conducts population-based surveillance for laboratory-confirmed influenza-related hospitalizations in select counties in the Emerging Infections Program (EIP) states and Influenza Hospitalization Surveillance Project (IHSP) states.

A total of 75 laboratory-confirmed influenza-associated hospitalizations occurring between October 1, 2020 and December 12, 2020, were reported by FluSurv-NET sites. This number of influenza-associated hospitalizations is lower than average for this point in the season and comparable to counts seen at this point during the 2011-12 season. Hospitalization rates will be presented once case counts increase to a level that produces stable rates; in the interim, case counts will be reported each week.
Additional hospitalization surveillance information for current and past seasons and additional age groups:
Surveillance Methods | FluView Interactive: Rates by Age or Patient Characteristics
National Center for Health Statistics (NCHS) Mortality Surveillance


Based on NCHS mortality surveillance data available on December 17, 2020, 13.3% of the deaths occurring during the week ending December 12, 2020 (week 50), were due to pneumonia, influenza, and COVID-19 (PIC). This percentage is above the epidemic threshold of 6.6% for week 50. Among the 2,897 PIC deaths reported for week 50, 1,921 had COVID-19 listed as an underlying or contributing cause of death on the death certificate and two listed influenza, indicating that the current increase in PIC mortality is due primarily to COVID-19 and not influenza.

Weekly mortality surveillance data include a combination of machine coded and manually coded causes of death collected from death certificates. Percentages of deaths due to pneumonia, influenza, or COVID-19 (PIC) are higher among manually coded records than more rapidly available machine coded records. Due to the additional time needed for manual coding, the initially reported PIC percentages are likely to increase as more data are received and processed.


View Chart Dataexcel icon | View Full Screen
Additional pneumonia and influenza mortality surveillance information for current and past seasons:
Surveillance Methods | FluView Interactive
Influenza-Associated Pediatric Mortality


No influenza-associated pediatric deaths were reported to CDC during week 50.

A total of one influenza-associated pediatric death occurring during the 2020-2021 season has been reported to CDC.


View Full Screen
Additional pediatric mortality surveillance information for current and past seasons:
Surveillance Methods | FluView Interactive


Additional National and International Influenza Surveillance Information


FluView Interactive: FluView includes enhanced web-based interactive applications that can provide dynamic visuals of the influenza data collected and analyzed by CDC. These FluView Interactive applications allow people to create customized, visual interpretations of influenza data, as well as make comparisons across flu seasons, regions, age groups and a variety of other demographics.

National Institute for Occupational Safety and Health: Monthly surveillance data on the prevalence of health-related workplace absenteeism among full-time workers in the United States are available from NIOSH.

U.S. State and local influenza surveillance: Select a jurisdiction below to access the latest local influenza information. World Health Organization:
Additional influenza surveillance information from participating WHO member nations is available through
FluNetexternal icon and the Global Epidemiology Reports.external icon

WHO Collaborating Centers for Influenza:
Australiaexternal icon, Chinaexternal icon, Japanexternal icon, the United Kingdomexternal icon, and the United States (CDC in Atlanta, Georgia)

Europe:
The most up-to-date influenza information from Europe is available from WHO/Europe and the European Centre for Disease Prevention and Controlexternal icon.

Public Health Agency of Canada:
The most up-to-date influenza information from Canada is available in Canada’s weekly FluWatch reportexternal icon.

Public Health England:
The most up-to-date influenza information from the United Kingdom is available from Public Health Englandexternal icon.

Any links provided to non-Federal organizations are provided solely as a service to our users. These links do not constitute an endorsement of these organizations or their programs by CDC or the Federal Government, and none should be inferred. CDC is not responsible for the content of the individual organization web pages found at these links.

A description of the CDC influenza surveillance system, including methodology and detailed descriptions of each data component is available on the surveillance methods page.

Page last reviewed: December 18, 2020, 11:00 AM
 
FluView Summary ending on December 26, 2020

fluview-banner2.jpg


Note: CDC is tracking the COVID-19 pandemic in a weekly publication called COVIDView.

Key Updates for Week 52, ending December 26, 2020

Seasonal influenza activity in the United States remains lower than usual for this time of year.
Viruses


Clinical Labs
The percentage of respiratory specimens testing positive for influenza at clinical laboratories is 0.3% this week.

Public Health Labs
The number of influenza positives reported by public health labs remains much lower than normal despite a higher than normal number of tests performed.

Virus Characterization
Influenza virus characterization information will be updated weekly starting later this season.
Illness

Outpatient Illness: ILINet
The percentage of visits to a health care provider for influenza-like illness (ILI) is at 1.6% this week, similar to week 51 (change ≤ 0.1%). This is below the national baseline of 2.6%. ILI surveillance may be impacted by the COVID-19 pandemic and should be interpreted with caution.

Outpatient Illness: ILINet Activity Map


This week, one jurisdiction experienced moderate ILI activity, two jurisdictions experienced low activity, and the remaining jurisdictions experienced minimal activity. ILI activity levels may be impacted by the COVID-19 pandemic and should be interpreted with caution.
Severe Disease


Hospitalizations
Hospitalization rates will be presented once case counts increase to a level that produces stable rates; in the interim, case counts will be reported each week.

NCHS Mortality
13.6% of deaths were attributed to pneumonia, influenza, or COVID-19 (PIC). This is above the epidemic threshold of 6.8%. The majority of PIC deaths are due to COVID-19.

Pediatric Deaths
No new influenza-associated pediatric deaths were reported to CDC this week. The total for the 2020-21 season is one.

All data are preliminary and may change as more reports are received.

A description of the CDC influenza surveillance system, including methodology and detailed descriptions of each data component is available on the surveillance methods page.

Additional information on the current and previous influenza seasons for each surveillance component are available on FluView Interactive.

Key Points
  • Flu activity is unusually low at this time but may increase in the coming months.
  • An annual flu vaccine is the best way to protect against flu and its potentially serious complications.
  • If you haven’t gotten your flu vaccine yet, get vaccinated now.
  • There are also flu antiviral drugs that can be used to treat flu illness.
U.S. Virologic Surveillance:

Clinical Laboratories


The results of tests performed by clinical laboratories nationwide are summarized below. Data from clinical laboratories (the percentage of specimens tested that are positive for influenza) are used to monitor whether influenza activity is increasing or decreasing.

No. of specimens tested25,148363,627
No. of positive specimens (%)74 (0.3%)877 (0.2%)
Positive specimens by type
Influenza A26 (35.1%)344 (39.2%)
Influenza B48 (64.9%)533 (60.8%)


View Chart Data | View Full ScreenPublic Health Laboratories


The results of tests performed by public health laboratories nationwide are summarized below. Data from public health laboratories are used to monitor the proportion of circulating viruses that belong to each influenza subtype/lineage.
No. of specimens tested11,805209,116
No. of positive specimens2139
Positive specimens by type/subtype
Influenza A2 (100.0%)81 (58.3%)
(H1N1)pdm091 (100.0%)8 (50.0%)
H3N20 (0%)8 (50.0%)
Subtyping not performed165
Influenza B0 (0 %)58 (41.7%)
Yamagata lineage0 (0%)7 (53.8%)
Victoria lineage0 (0%)6 (46.2%)
Lineage not performed045


View Chart Data | View Full Screen
Additional virologic surveillance information for current and past seasons:
Surveillance Methods | FluView Interactive: National, Regional, and State Data or Age Data
Influenza Virus Characterization


CDC performs genetic and antigenic characterization of U.S. viruses submitted from state and local health laboratories using Right Size Roadmap submission guidance. These data are used to compare how similar the currently circulating influenza viruses are to the reference viruses representing viruses contained in the current influenza vaccines and to monitor evolutionary changes that continually occur in influenza viruses circulating in humans. CDC also tests susceptibility of influenza viruses to antiviral medications, including the neuraminidase inhibitors (oseltamivir, zanamivir, and peramivir) and the PA endonuclease inhibitor baloxavir.

Virus characterization data will be updated weekly starting later this season when a sufficient number of specimens have been tested.
Outpatient Illness Surveillance


Please note, the U.S. Outpatient Influenza-like Illness Surveillance Network (ILINet) monitors outpatient visits for influenza-like illness (ILI), not laboratory-confirmed influenza, and as such, will capture visits due to other respiratory pathogens, such as SARS-CoV-2, that present with similar symptoms. In addition, healthcare-seeking behaviors have changed dramatically during the COVID-19 pandemic. Many people are accessing the healthcare system in alternative settings which may or may not be captured as a part of ILINet. Therefore, ILI data, including ILI activity levels, should be interpreted with extreme caution. It is particularly important at this time to evaluate syndromic surveillance data, including that from ILINet, in the context of other sources of surveillance data to obtain a complete and accurate picture of both influenza and COVID-19 activity. CDC is tracking the COVID-19 pandemic in a weekly publication called COVIDView.
ILINet


Nationwide during week 52, 1.6% of patient visits reported through ILINet were due to ILI. This percentage is below the national baseline of 2.6%.


View Chart Data (current season only) | View Full Screen
During week 52, compared with week 51, the percentage of visits for ILI decreased in one region (Region 2) and remained stable (change of ≤ 0.1%) in nine regions. All 10 regions reported a percentage of outpatient visits for ILI below their region-specific baselines.
ILI Activity Map


Data collected in ILINet are used to produce a measure of ILI activity* by state/jurisdiction and Core Based Statistical Areas (CBSA).
Week 52
(Week ending
Dec. 26, 2020)
Week 51
(Week ending
Dec. 19, 2020)
Week 52
(Week ending
Dec. 26, 2020)
Week 51
(Week ending
Dec. 19, 2020)
Very High0001
High0035
Moderate1198
Low204950
Minimal4954531554
Insufficient Data30337311


*Data collected in ILINet may disproportionally represent certain populations within a jurisdiction or CBSA, and therefore, may not accurately depict the full picture of influenza activity for the entire jurisdiction or CBSA. Differences in the data presented here by CDC and independently by some health departments likely represent differing levels of data completeness with data presented by the health department likely being the more complete.
Additional information about medically attended visits for ILI for current and past seasons:
Surveillance Methods | FluView Interactive: National, Regional, and State Data or ILI Activity Map
Geographic Spread of Influenza as Assessed by State and Territorial Epidemiologists


The geographic spread of influenza as reported by state and territorial epidemiologists indicates geographic spread of influenza viruses but does not measure the severity of influenza activity. Due to the impact of COVID-19 on ILI surveillance, and the fact that the state and territorial epidemiologists report relies heavily on ILI activity, reporting for this system will be suspended for the 2020-21 influenza season. Data from previous seasons is available on FluView Interactive.
Additional geographic spread surveillance information for current and past seasons:
Surveillance Methods | FluView Interactive
Influenza-Associated Hospitalizations:


The Influenza Hospitalization Surveillance Network (FluSurv-NET) conducts population-based surveillance for laboratory-confirmed influenza-related hospitalizations in select counties in the Emerging Infections Program (EIP) states and Influenza Hospitalization Surveillance Project (IHSP) states.

A total of 101 laboratory-confirmed influenza-associated hospitalizations occurring between October 1, 2020 and December 26, 2020 were reported by FluSurv-NET sites. This number is lower than average for this point in the season and comparable to counts seen at this point during the 2011-12 season. Hospitalization rates will be presented once case counts increase to a level that produces stable rates; in the interim, case counts will be reported each week.
Additional hospitalization surveillance information for current and past seasons and additional age groups:
Surveillance Methods | FluView Interactive: Rates by Age or Patient Characteristics
National Center for Health Statistics (NCHS) Mortality Surveillance


Based on NCHS mortality surveillance data available on December 30, 2020, 13.6% of the deaths occurring during the week ending December 26, 2020 (week 52), were due to pneumonia, influenza, and COVID-19 (PIC). This percentage is above the epidemic threshold of 6.8% for week 52. Among the 1,848 PIC deaths reported for week 52, 1,215 had COVID-19 listed as an underlying or contributing cause of death on the death certificate and three listed influenza, indicating that the current increase in PIC mortality is due primarily to COVID-19 and not influenza.

Weekly mortality surveillance data include a combination of machine coded and manually coded causes of death collected from death certificates. Percentages of deaths due to pneumonia, influenza, or COVID-19 (PIC) are higher among manually coded records than more rapidly available machine coded records. Due to the additional time needed for manual coding, the initially reported PIC percentages are likely to increase as more data are received and processed. Because of the large number of deaths reported in recent weeks and the holidays, the delay in availability of manually coded records may be longer than usual.


View Chart Dataexcel icon | View Full Screen
Additional pneumonia and influenza mortality surveillance information for current and past seasons:
Surveillance Methods | FluView Interactive
Influenza-Associated Pediatric Mortality


No influenza-associated pediatric deaths were reported to CDC during week 52.

A total of one influenza-associated pediatric death occurring during the 2020-2021 season has been reported to CDC.


View Full Screen
Additional pediatric mortality surveillance information for current and past seasons:
Surveillance Methods | FluView Interactive


Additional National and International Influenza Surveillance Information


FluView Interactive: FluView includes enhanced web-based interactive applications that can provide dynamic visuals of the influenza data collected and analyzed by CDC. These FluView Interactive applications allow people to create customized, visual interpretations of influenza data, as well as make comparisons across flu seasons, regions, age groups and a variety of other demographics.

National Institute for Occupational Safety and Health: Monthly surveillance data on the prevalence of health-related workplace absenteeism among full-time workers in the United States are available from NIOSH.

U.S. State and local influenza surveillance: Select a jurisdiction below to access the latest local influenza information. World Health Organization:
Additional influenza surveillance information from participating WHO member nations is available through
FluNetexternal icon and the Global Epidemiology Reports.external icon

WHO Collaborating Centers for Influenza:
Australiaexternal icon, Chinaexternal icon, Japanexternal icon, the United Kingdomexternal icon, and the United States (CDC in Atlanta, Georgia)

Europe:
The most up-to-date influenza information from Europe is available from WHO/Europe and the European Centre for Disease Prevention and Controlexternal icon.

Public Health Agency of Canada:
The most up-to-date influenza information from Canada is available in Canada’s weekly FluWatch reportexternal icon.

Public Health England:
The most up-to-date influenza information from the United Kingdom is available from Public Health Englandexternal icon.

Any links provided to non-Federal organizations are provided solely as a service to our users. These links do not constitute an endorsement of these organizations or their programs by CDC or the Federal Government, and none should be inferred. CDC is not responsible for the content of the individual organization web pages found at these links.

A description of the CDC influenza surveillance system, including methodology and detailed descriptions of each data component is available on the surveillance methods page.

Page last reviewed: January 4, 2021, 11:00 AM
Content source: Centers for Disease Control and Prevention, National Center for Immunization and Respiratory Diseases (NCIRD)
 
Weekly U.S. Influenza Surveillance Report


fluview-banner2.jpg


Note: CDC is tracking the COVID-19 pandemic in a weekly publication called COVIDView.

Key Updates for Week 1, ending January 9, 2021

Seasonal influenza activity in the United States remains lower than usual for this time of year.
Viruses


Clinical Labs
The percentage of respiratory specimens testing positive for influenza at clinical laboratories is 0.4% this week.

Public Health Labs
The number of influenza positives reported by public health labs remains much lower than normal despite a higher than normal number of tests performed.

Virus Characterization
Influenza virus characterization information will be updated weekly starting later this season.
Illness

Outpatient Illness: ILINet
This week, 1.7% of patient visits to a health care provider were for influenza-like illness (ILI). This is similar to the percentage seen during week 53 (1.6%) and below the national baseline of 2.6%. ILI surveillance may be impacted by the COVID-19 pandemic and should be interpreted with caution.

Outpatient Illness: ILINet Activity Map


This week, five jurisdictions experienced low activity, and the remaining jurisdictions experienced minimal activity. ILI activity levels may be impacted by the COVID-19 pandemic and should be interpreted with caution.
Severe Disease


Hospitalizations
Hospitalization rates will be presented once case counts increase to a level that produces stable rates. In the interim, case counts will be reported each week.

NCHS Mortality
17.2% of deaths were attributed to pneumonia, influenza, or COVID-19 (PIC). This is above the epidemic threshold of 7.0%. Currently, the majority of PIC deaths are due to COVID-19.

Pediatric Deaths
No new influenza-associated pediatric deaths were reported to CDC this week. The total for the 2020-21 season is one.

All data are preliminary and may change as more reports are received.

A description of the CDC influenza surveillance system, including methodology and detailed descriptions of each data component is available on the surveillance methods page.

Additional information on the current and previous influenza seasons for each surveillance component are available on FluView Interactive.

Key Points
  • Flu activity is unusually low at this time but may increase in the coming months.
  • An annual flu vaccine is the best way to protect against flu and its potentially serious complications.
  • If you haven’t gotten your flu vaccine yet, get vaccinated now.
  • There are also flu antiviral drugs that can be used to treat flu illness.
U.S. Virologic Surveillance:

Clinical Laboratories


The results of tests performed by clinical laboratories nationwide are summarized below. Data from clinical laboratories (the percentage of specimens tested that are positive for influenza) are used to monitor whether influenza activity is increasing or decreasing.

No. of specimens tested25,817440,972
No. of positive specimens (%)103 (0.4%)1103 (0.3%)
Positive specimens by type
Influenza A21 (20.4%)402 (36.4%)
Influenza B82 (79.6%)701 (63.6%)


View Chart Data | View Full ScreenPublic Health Laboratories


The results of tests performed by public health laboratories nationwide are summarized below. Data from public health laboratories are used to monitor the proportion of circulating viruses that belong to each influenza subtype/lineage.
No. of specimens tested14,096234,610
No. of positive specimens4171
Positive specimens by type/subtype
Influenza A3 (75.0%)106 (62.0%)
(H1N1)pdm09 0 (0%)12 (48.0%)
H3N20 (0%)13 (52.0%)
Subtyping not performed381
Influenza B1 (25.0 %)65 (38.0%)
Yamagata lineage0 (0%) 9 (53.0%)
Victoria lineage0 (0%)8 (47.0%)
Lineage not performed148


View Chart Data | View Full Screen
Additional virologic surveillance information for current and past seasons:
Surveillance Methods | FluView Interactive: National, Regional, and State Data or Age Data
Influenza Virus Characterization


CDC performs genetic and antigenic characterization of U.S. viruses submitted from state and local health laboratories using Right Size Roadmap submission guidance. These data are used to compare how similar the currently circulating influenza viruses are to the reference viruses representing viruses contained in the current influenza vaccines and to monitor evolutionary changes that continually occur in influenza viruses circulating in humans. CDC also tests susceptibility of influenza viruses to antiviral medications, including the neuraminidase inhibitors (oseltamivir, zanamivir, and peramivir) and the PA endonuclease inhibitor baloxavir.

Virus characterization data will be updated weekly starting later this season when a sufficient number of specimens have been tested.
Outpatient Illness Surveillance


Please note, the U.S. Outpatient Influenza-like Illness Surveillance Network (ILINet) monitors outpatient visits for influenza-like illness (ILI), not laboratory-confirmed influenza, and as such, will capture visits due to other respiratory pathogens, such as SARS-CoV-2, that present with similar symptoms. In addition, healthcare-seeking behaviors have changed dramatically during the COVID-19 pandemic. Many people are accessing the healthcare system in alternative settings, which may or may not be captured as a part of ILINet. Therefore, ILI data, including ILI activity levels, should be interpreted with extreme caution. It is particularly important at this time to evaluate syndromic surveillance data, including that from ILINet, in the context of other sources of surveillance data to obtain a complete and accurate picture of both influenza and COVID-19 activity. CDC is tracking the COVID-19 pandemic in a weekly publication called COVIDView.
ILINet


Nationwide during week 1, 1.7% of patient visits reported through ILINet were due to ILI. This percentage is below the national baseline of 2.6%.


View Chart Data (current season only) | View Full Screen
During week 1, compared with week 53, the percentage of visits for ILI increased in two regions (Regions 5 and 9), decreased for two regions (Regions 6 and 7), and remained stable (change of ≤ 0.1%) in the remaining regions. One region reported a percentage of outpatient visits for ILI above their region-specific baseline (Region 9).
ILI Activity Map


Data collected in ILINet are used to produce a measure of ILI activity* by state/jurisdiction and Core Based Statistical Areas (CBSA).
Week 1
(Week ending
Jan. 9, 2021)
Week 53
(Week ending
Jan. 2, 2020)
Week 1
(Week ending
Jan. 9, 2021)
Week 53
(Week ending
Jan. 2, 2020)
Very High0020
High0034
Moderate001215
Low544750
Minimal4950544547
Insufficient Data11321313


*Data collected in ILINet may disproportionally represent certain populations within a jurisdiction or CBSA, and therefore, may not accurately depict the full picture of influenza activity for the entire jurisdiction or CBSA. Differences in the data presented here by CDC and independently by some health departments likely represent differing levels of data completeness with data presented by the health department likely being the more complete.
Additional information about medically attended visits for ILI for current and past seasons:
Surveillance Methods | FluView Interactive: National, Regional, and State Data or ILI Activity Map
Geographic Spread of Influenza as Assessed by State and Territorial Epidemiologists


The geographic spread of influenza as reported by state and territorial epidemiologists indicates geographic spread of influenza viruses but does not measure the severity of influenza activity. Due to the impact of COVID-19 on ILI surveillance, and the fact that the state and territorial epidemiologists report relies heavily on ILI activity, reporting for this system will be suspended for the 2020-21 influenza season. Data from previous seasons is available on FluView Interactive.
Additional geographic spread surveillance information for current and past seasons:
Surveillance Methods | FluView Interactive
Influenza-Associated Hospitalizations:


The Influenza Hospitalization Surveillance Network (FluSurv-NET) conducts population-based surveillance for laboratory-confirmed influenza-related hospitalizations in select counties in the Emerging Infections Program (EIP) states and Influenza Hospitalization Surveillance Project (IHSP) states.

A total of 129 laboratory-confirmed influenza-associated hospitalizations occurring between October 1, 2020, and January 9, 2021, were reported by FluSurv-NET sites. This number is lower than average for this point in the season and comparable to counts seen at this point during the 2011-12 season. Hospitalization rates will be presented once case counts increase
Additional hospitalization surveillance information for current and past seasons and additional age groups:
Surveillance Methods | FluView Interactive: Rates by Age or Patient Characteristics
National Center for Health Statistics (NCHS) Mortality Surveillance


Based on NCHS mortality surveillance data available on January 14, 2021, 17.2% of the deaths occurring during the week ending January 9, 2021 (week 1), were due to pneumonia, influenza, and COVID-19 (PIC). This percentage is above the epidemic threshold of 7.0% for week 1. Among the 3,337 PIC deaths reported for week 1, 2,486 had COVID-19 listed as an underlying or contributing cause of death on the death certificate and two listed influenza, indicating that the current increase in PIC mortality is due primarily to COVID-19 and not influenza.

Weekly mortality surveillance data include a combination of machine coded and manually coded causes of death collected from death certificates. Percentages of deaths due to pneumonia, influenza, or COVID-19 (PIC) are higher among manually coded records than more rapidly available machine coded records. Because of additional time needed for manual coding, the initially reported PIC percentages are likely to increase as more data are received and processed. Additionally, due to the large number of deaths reported in recent weeks and the holidays, the delay in availability of manually coded records may be longer than usual; therefore, data from recent weeks should be interpreted with caution.


View Chart Dataexcel icon | View Full Screen
Additional pneumonia and influenza mortality surveillance information for current and past seasons:
Surveillance Methods | FluView Interactive
Influenza-Associated Pediatric Mortality


No influenza-associated pediatric deaths were reported to CDC during week 1.

One influenza-associated pediatric death occurring during the 2020-2021 season has been reported to CDC.


View Full Screen
Additional pediatric mortality surveillance information for current and past seasons:
Surveillance Methods | FluView Interactive


Additional National and International Influenza Surveillance Information


FluView Interactive: FluView includes enhanced web-based interactive applications that can provide dynamic visuals of the influenza data collected and analyzed by CDC. These FluView Interactive applications allow people to create customized, visual interpretations of influenza data, as well as make comparisons across flu seasons, regions, age groups and a variety of other demographics.

National Institute for Occupational Safety and Health: Monthly surveillance data on the prevalence of health-related workplace absenteeism among full-time workers in the United States are available from NIOSH.

U.S. State and local influenza surveillance: Select a jurisdiction below to access the latest local influenza information. World Health Organization:
Additional influenza surveillance information from participating WHO member nations is available through
FluNetexternal icon and the Global Epidemiology Reports.external icon

WHO Collaborating Centers for Influenza:
Australiaexternal icon, Chinaexternal icon, Japanexternal icon, the United Kingdomexternal icon, and the United States (CDC in Atlanta, Georgia)

Europe:
The most up-to-date influenza information from Europe is available from WHO/Europe and the European Centre for Disease Prevention and Controlexternal icon.

Public Health Agency of Canada:
The most up-to-date influenza information from Canada is available in Canada’s weekly FluWatch reportexternal icon.

Public Health England:
The most up-to-date influenza information from the United Kingdom is available from Public Health Englandexternal icon.

Any links provided to non-Federal organizations are provided solely as a service to our users. These links do not constitute an endorsement of these organizations or their programs by CDC or the Federal Government, and none should be inferred. CDC is not responsible for the content of the individual organization web pages found at these links.

A description of the CDC influenza surveillance system, including methodology and detailed descriptions of each data component is available on the surveillance methods page.

Page last reviewed: January 15, 2021, 11:00 AM
Content source: Centers for Disease Control and Prevention, National Center for Immunization and Respiratory Diseases (NCIRD)
 
Weekly U.S. Influenza Surveillance Report


fluview-banner2.jpg


Note: CDC is tracking the COVID-19 pandemic in a weekly publication called COVIDView.

Key Updates for Week 2, ending January 16, 2021

Seasonal influenza activity in the United States remains lower than usual for this time of year.
Viruses


Clinical Labs
The percentage of respiratory specimens testing positive for influenza at clinical laboratories is 0.1% this week.

Public Health Labs
The number of influenza positives reported by public health labs remains much lower than normal despite a higher than normal number of tests performed.

Virus Characterization
Influenza virus characterization information will be updated weekly starting later this season.
Illness

Outpatient Illness: ILINet
This week, 1.4% of patient visits to a health care provider were for influenza-like illness (ILI), which decreased compared to the ILI percentage of week 1 (1.6%). National ILI remains below the national baseline of 2.6%. ILI surveillance may be impacted by the COVID-19 pandemic and should be interpreted with caution.

Outpatient Illness: ILINet Activity Map


This week, one jurisdiction experienced low activity, and the remaining jurisdictions experienced minimal activity. ILI activity levels may be impacted by the COVID-19 pandemic and should be interpreted with caution.
Severe Disease


Hospitalizations
FluSurv-NET sites have reported 136 laboratory-confirmed influenza hospitalizations so far this season for an overall cumulative hospitalization rate of 0.5 per 100,000 population.

NCHS Mortality
14.7% of deaths were attributed to pneumonia, influenza, or COVID-19 (PIC). This is above the epidemic threshold of 7.0%. Currently, the majority of PIC deaths are due to COVID-19.

Pediatric Deaths
No new influenza-associated pediatric deaths were reported to CDC this week. The total for the 2020-21 season is one.

All data are preliminary and may change as more reports are received.

A description of the CDC influenza surveillance system, including methodology and detailed descriptions of each data component is available on the surveillance methods page.

Additional information on the current and previous influenza seasons for each surveillance component are available on FluView Interactive.

Key Points
  • Flu activity is unusually low at this time but may increase in the coming months.
  • An annual flu vaccine is the best way to protect against flu and its potentially serious complications.
  • If you haven’t gotten your flu vaccine yet, get vaccinated now.
  • There are also flu antiviral drugs that can be used to treat flu illness.
U.S. Virologic Surveillance:

Clinical Laboratories


The results of tests performed by clinical laboratories nationwide are summarized below. Data from clinical laboratories (the percentage of specimens tested that are positive for influenza) are used to monitor whether influenza activity is increasing or decreasing.

No. of specimens tested21,244468,064
No. of positive specimens (%)23 (0.1%)1,159 (0.2%)
Positive specimens by type
Influenza A12 (52.2%)427 (36.8%)
Influenza B11 (47.8%)732 (63.2%)


View Chart Data | View Full ScreenPublic Health Laboratories


The results of tests performed by public health laboratories nationwide are summarized below. Data from public health laboratories are used to monitor the proportion of circulating viruses that belong to each influenza subtype/lineage.
No. of specimens tested14,937253,256
No. of positive specimens3192
Positive specimens by type/subtype
Influenza A2 (66.7%)118 (61.5%)
(H1N1)pdm09 0 (0%)16 (48.5%)
H3N20 (0%)17 (51.5%)
Subtyping not performed285
Influenza B1 (33.3 %)74 (38.5%)
Yamagata lineage0 (0%)9 (52.9%)
Victoria lineage0 (0%)8 (47.1%)
Lineage not performed157


View Chart Data | View Full Screen
Additional virologic surveillance information for current and past seasons:
Surveillance Methods | FluView Interactive: National, Regional, and State Data or Age Data
Influenza Virus Characterization


CDC performs genetic and antigenic characterization of U.S. viruses submitted from state and local health laboratories using Right Size Roadmap submission guidance. These data are used to compare how similar the currently circulating influenza viruses are to the reference viruses representing viruses contained in the current influenza vaccines and to monitor evolutionary changes that continually occur in influenza viruses circulating in humans. CDC also tests susceptibility of influenza viruses to antiviral medications, including the neuraminidase inhibitors (oseltamivir, zanamivir, and peramivir) and the PA endonuclease inhibitor baloxavir.

Virus characterization data will be updated weekly starting later this season when a sufficient number of specimens have been tested.
Outpatient Illness Surveillance


Please note, the U.S. Outpatient Influenza-like Illness Surveillance Network (ILINet) monitors outpatient visits for influenza-like illness (ILI), not laboratory-confirmed influenza, and as such, will capture visits due to other respiratory pathogens, such as SARS-CoV-2, that present with similar symptoms. In addition, healthcare-seeking behaviors have changed dramatically during the COVID-19 pandemic. Many people are accessing the healthcare system in alternative settings, which may or may not be captured as a part of ILINet. Therefore, ILI data, including ILI activity levels, should be interpreted with extreme caution. It is particularly important at this time to evaluate syndromic surveillance data, including that from ILINet, in the context of other sources of surveillance data to obtain a complete and accurate picture of both influenza and COVID-19 activity. CDC is tracking the COVID-19 pandemic in a weekly publication called COVIDView.
ILINet


Nationwide during week 2, 1.4% of patient visits reported through ILINet were due to ILI. This percentage is below the national baseline of 2.6%.


View Chart Data (current season only) | View Full Screen
During week 2, compared with week 1, the percentage of visits for ILI decreased for five regions (Regions 2, 3, 4, 6, 9), and remained stable (change of ≤ 0.1%) in the remaining five regions.
ILI Activity Map


Data collected in ILINet are used to produce a measure of ILI activity* by state/jurisdiction and Core Based Statistical Areas (CBSA).
Week 2
(Week ending
Jan. 16, 2021)
Week 1
(Week ending
Jan. 9, 2020)
Week 2
(Week ending
Jan. 16, 2021)
Week 1
(Week ending
Jan. 9, 2020)
Very High0012
High0022
Moderate00512
Low133050
Minimal5351565560
Insufficient Data11326303


*Data collected in ILINet may disproportionally represent certain populations within a jurisdiction or CBSA, and therefore, may not accurately depict the full picture of influenza activity for the entire jurisdiction or CBSA. Differences in the data presented here by CDC and independently by some health departments likely represent differing levels of data completeness with data presented by the health department likely being the more complete.
Additional information about medically attended visits for ILI for current and past seasons:
Surveillance Methods | FluView Interactive: National, Regional, and State Data or ILI Activity Map
Geographic Spread of Influenza as Assessed by State and Territorial Epidemiologists


The geographic spread of influenza as reported by state and territorial epidemiologists indicates geographic spread of influenza viruses but does not measure the severity of influenza activity. Due to the impact of COVID-19 on ILI surveillance, and the fact that the state and territorial epidemiologists report relies heavily on ILI activity, reporting for this system will be suspended for the 2020-21 influenza season. Data from previous seasons is available on FluView Interactive.
Additional geographic spread surveillance information for current and past seasons:
Surveillance Methods | FluView Interactive
Influenza-Associated Hospitalizations:


The Influenza Hospitalization Surveillance Network (FluSurv-NET) conducts population-based surveillance for laboratory-confirmed influenza-related hospitalizations in select counties in the Emerging Infections Program (EIP) states and Influenza Hospitalization Surveillance Project (IHSP) states.

A total of 136 laboratory-confirmed influenza-associated hospitalizations occurring between October 1, 2020, and January 16, 2021, were reported by FluSurv-NET sites for an overall cumulative hospitalization rate of 0.5 per 100,000 population. This is lower than average for this point in the season and comparable to the overall rate seen at this point during the 2011-12 season. Hospitalization rates stratified by age will be presented once case counts increase to a level that produces stable rates by age.
Additional hospitalization surveillance information for current and past seasons and additional age groups:
Surveillance Methods | FluView Interactive: Rates by Age or Patient Characteristics
National Center for Health Statistics (NCHS) Mortality Surveillance


Based on NCHS mortality surveillance data available on January 21, 2021, 14.7% of the deaths that occurred during the week ending January 16, 2021 (week 2), were due to pneumonia, influenza, and COVID-19 (PIC). This percentage is above the epidemic threshold of 7.0% for week 2. Among the 2,799 PIC deaths reported for this week (week 2), 1,774 had COVID-19 listed as an underlying or contributing cause of death on the death certificate and four listed influenza, indicating that the current increase in PIC mortality is due primarily to COVID-19 and not influenza.

Weekly mortality surveillance data include a combination of machine coded and manually coded causes of death collected from death certificates. Percentages of deaths due to pneumonia, influenza, or COVID-19 (PIC) are higher among manually coded records than more rapidly available machine coded records. Because of additional time needed for manual coding, the initially reported PIC percentages are likely to increase as more data are received and processed. The lag in availability of manually coded data increased during the holiday weeks at the end of 2020, and because of the large numbers of deaths reported during recent weeks, the delay in availability of manually coded data continues to increase. Weeks for which the largest changes in the percentage of deaths due to PIC are expected are highlighted in gray in the figure below and should be interpreted with caution.


View Chart Dataexcel icon | View Full Screen
Additional pneumonia and influenza mortality surveillance information for current and past seasons:
Surveillance Methods | FluView Interactive
Influenza-Associated Pediatric Mortality


No influenza-associated pediatric deaths were reported to CDC during week 2.

One influenza-associated pediatric death occurring during the 2020-2021 season has been reported to CDC.


View Full Screen
Additional pediatric mortality surveillance information for current and past seasons:
Surveillance Methods | FluView Interactive


Additional National and International Influenza Surveillance Information


FluView Interactive: FluView includes enhanced web-based interactive applications that can provide dynamic visuals of the influenza data collected and analyzed by CDC. These FluView Interactive applications allow people to create customized, visual interpretations of influenza data, as well as make comparisons across flu seasons, regions, age groups and a variety of other demographics.

National Institute for Occupational Safety and Health: Monthly surveillance data on the prevalence of health-related workplace absenteeism among full-time workers in the United States are available from NIOSH.

U.S. State and local influenza surveillance: Select a jurisdiction below to access the latest local influenza information. World Health Organization:
Additional influenza surveillance information from participating WHO member nations is available through
FluNetexternal icon and the Global Epidemiology Reports.external icon

WHO Collaborating Centers for Influenza:
Australiaexternal icon, Chinaexternal icon, Japanexternal icon, the United Kingdomexternal icon, and the United States (CDC in Atlanta, Georgia)

Europe:
The most up-to-date influenza information from Europe is available from WHO/Europe and the European Centre for Disease Prevention and Controlexternal icon.

Public Health Agency of Canada:
The most up-to-date influenza information from Canada is available in Canada’s weekly FluWatch reportexternal icon.

Public Health England:
The most up-to-date influenza information from the United Kingdom is available from Public Health Englandexternal icon.

Any links provided to non-Federal organizations are provided solely as a service to our users. These links do not constitute an endorsement of these organizations or their programs by CDC or the Federal Government, and none should be inferred. CDC is not responsible for the content of the individual organization web pages found at these links.

A description of the CDC influenza surveillance system, including methodology and detailed descriptions of each data component is available on the surveillance methods page.

Page last reviewed: January 22, 2021, 11:00 AM
Content source: Centers for Disease Control and Prevention, National Center for Immunization and Respiratory Diseases (NCIRD)
 
FluView Summary ending on January 23, 2021

fluview-banner2.jpg


Note: CDC is tracking the COVID-19 pandemic in a weekly publication called COVIDView.

Key Updates for Week 3, ending January 23, 2021

Seasonal influenza activity in the United States remains lower than usual for this time of year. The first novel influenza A virus infection of the 2020-2021 season was reported this week.
Viruses


Clinical Labs
The percentage of respiratory specimens testing positive for influenza at clinical laboratories is 0.3% this week.

Public Health Labs
The number of influenza positives reported by public health labs remains unusually low, however, one novel influenza A virus infection was reported.

Virus Characterization
Influenza virus characterization information will be updated weekly starting later this season.
Illness

Outpatient Illness: ILINet
This week, 1.3% of patient visits to a health care provider were for influenza-like illness (ILI), remaining stable (≤0.1% change) compared to week 2. National ILI remains below the national baseline of 2.6%. ILI surveillance may be impacted by the COVID-19 pandemic and should be interpreted with caution.

Outpatient Illness: ILINet Activity Map


This week, one jurisdiction experienced low activity, and the remaining jurisdictions experienced minimal activity. ILI activity levels may be impacted by the COVID-19 pandemic and should be interpreted with caution.
Severe Disease


Hospitalizations
FluSurv-NET sites have reported 142 laboratory-confirmed influenza hospitalizations so far this season for an overall cumulative hospitalization rate of 0.5 per 100,000 population.

NCHS Mortality
14.8% of deaths were attributed to pneumonia, influenza, or COVID-19 (PIC). This is above the epidemic threshold of 7.1%. Currently, the majority of PIC deaths are due to COVID-19.

Pediatric Deaths
No new influenza-associated pediatric deaths were reported to CDC this week. The total for the 2020-21 season is one.

All data are preliminary and may change as more reports are received.

A description of the CDC influenza surveillance system, including methodology and detailed descriptions of each data component is available on the surveillance methods page.

Additional information on the current and previous influenza seasons for each surveillance component are available on FluView Interactive.

Key Points
  • Flu activity is unusually low at this time but may increase in the coming months.
  • An annual flu vaccine is the best way to protect against flu and its potentially serious complications.
  • If you haven’t gotten your flu vaccine yet, get vaccinated now.
  • There are also flu antiviral drugs that can be used to treat flu illness.
U.S. Virologic Surveillance:

Clinical Laboratories


The results of tests performed by clinical laboratories nationwide are summarized below. Data from clinical laboratories (the percentage of specimens tested that are positive for influenza) are used to monitor whether influenza activity is increasing or decreasing.
No. of specimens tested23,549524,037
No. of positive specimens (%)65 (0.3%)1,276 (0.2%)
Positive specimens by type
Influenza A16 (24.6%)454 (35.6%)
Influenza B49 (75.4%)822 (64.4%)


View Chart Data | View Full ScreenPublic Health Laboratories


The results of tests performed by public health laboratories nationwide are summarized below. Data from public health laboratories are used to monitor the proportion of circulating viruses that belong to each influenza subtype/lineage.
No. of specimens tested13,202266,865
No. of positive specimens3179
Positive specimens by type/subtype
Influenza A2 (66.7%)107 (59.8%)
(H1N1)pdm090 (0%)12 (41.4%)
H3N21 (100%)16 (55.2%)
H3N2v0 (0%)1 (3.4%)
Subtyping not performed179
Influenza B1 (33.3 %)72 (40.2%)
Yamagata lineage0 (0%)7 (46.7%)
Victoria lineage0 (0%)8 (53.3%)
Lineage not performed157

View Chart Data | View Full Screen
Additional virologic surveillance information for current and past seasons:
Surveillance Methods | FluView Interactive: National, Regional, and State Data or Age Data
Influenza Virus Characterization


CDC performs genetic and antigenic characterization of U.S. viruses submitted from state and local health laboratories using Right Size Roadmap submission guidance. These data are used to compare how similar the currently circulating influenza viruses are to the reference viruses representing viruses contained in the current influenza vaccines and to monitor evolutionary changes that continually occur in influenza viruses circulating in humans. CDC also tests susceptibility of influenza viruses to antiviral medications, including the neuraminidase inhibitors (oseltamivir, zanamivir, and peramivir) and the PA endonuclease inhibitor baloxavir.

Virus characterization data will be updated weekly starting later this season when a sufficient number of specimens have been tested.
Outpatient Illness Surveillance


Please note, the U.S. Outpatient Influenza-like Illness Surveillance Network (ILINet) monitors outpatient visits for influenza-like illness (ILI), not laboratory-confirmed influenza, and will capture visits due to other respiratory pathogens, such as SARS-CoV-2, that present with similar symptoms. In addition, healthcare-seeking behaviors have changed dramatically during the COVID-19 pandemic. Many people are accessing the healthcare system in alternative settings, which may or may not be captured as a part of ILINet. Therefore, ILI data, including ILI activity levels, should be interpreted with extreme caution. It is particularly important at this time to evaluate syndromic surveillance data, including that from ILINet, in the context of other sources of surveillance data to obtain a complete and accurate picture of both influenza and COVID-19 activity. CDC is tracking the COVID-19 pandemic in a weekly publication called COVIDView.
ILINet


Nationwide during week 3, 1.3% of patient visits reported through ILINet were due to ILI. This percentage is below the national baseline of 2.6%.


View Chart Data (current season only) | View Full Screen
During week 3, compared with week 2, the percentage of visits for ILI increased for two regions (Regions 2 and 6), decreased for two regions (Regions 4 and 10) and remained stable (change of ≤ 0.1%) in the remaining six regions. All regions reported percentages of outpatient visits for ILI below their region-specific baselines.
ILI Activity Map


Data collected in ILINet are used to produce a measure of ILI activity* by state/jurisdiction and Core Based Statistical Areas (CBSA).
Week 3
(Week ending
Jan. 23, 2021)
Week 2
(Week ending
Jan. 16, 2020)
Week 3
(Week ending
Jan. 23, 2021)
Week 2
(Week ending
Jan. 16, 2020)
Very High0000
High0032
Moderate0045
Low102631
Minimal5354584588
Insufficient Data11312303


*Data collected in ILINet may disproportionally represent certain populations within a jurisdiction or CBSA, and therefore, may not accurately depict the full picture of influenza activity for the entire jurisdiction or CBSA. Differences in the data presented here by CDC and independently by some health departments likely represent differing levels of data completeness with data presented by the health department likely being the more complete.
Additional information about medically attended visits for ILI for current and past seasons:
Surveillance Methods | FluView Interactive: National, Regional, and State Data or ILI Activity Map
Geographic Spread of Influenza as Assessed by State and Territorial Epidemiologists


The geographic spread of influenza as reported by state and territorial epidemiologists indicates geographic spread of influenza viruses but does not measure the severity of influenza activity. Due to the impact of COVID-19 on ILI surveillance, and the fact that the state and territorial epidemiologists report relies heavily on ILI activity, reporting for this system will be suspended for the 2020-21 influenza season. Data from previous seasons is available on FluView Interactive.
Additional geographic spread surveillance information for current and past seasons:
Surveillance Methods | FluView Interactive
Influenza-Associated Hospitalizations:


The Influenza Hospitalization Surveillance Network (FluSurv-NET) conducts population-based surveillance for laboratory-confirmed influenza-related hospitalizations in select counties in the Emerging Infections Program (EIP) states and Influenza Hospitalization Surveillance Project (IHSP) states.

A total of 142 laboratory-confirmed influenza-associated hospitalizations occurring between October 1, 2020, and January 23, 2021, were reported by FluSurv-NET sites for an overall cumulative hospitalization rate of 0.5 per 100,000 population. This is lower than average for this point in the season and comparable to the overall rate seen at this point during the 2011-12 season. Hospitalization rates stratified by age will be presented once case counts increase to a level that produces stable rates by age.
Additional hospitalization surveillance information for current and past seasons and additional age groups:
Surveillance Methods | FluView Interactive: Rates by Age or Patient Characteristics
National Center for Health Statistics (NCHS) Mortality Surveillance


Based on NCHS mortality surveillance data available on January 28, 2021, 14.8% of the deaths that occurred during the week ending January 23, 2021 (week 3), were due to pneumonia, influenza, and COVID-19 (PIC). This percentage is above the epidemic threshold of 7.1% for week 3. Among the 3,043 PIC deaths reported for this week (week 3), 2,102 had COVID-19 listed as an underlying or contributing cause of death on the death certificate and seven listed influenza, indicating that the current increase in PIC mortality is due primarily to COVID-19 and not influenza.

Weekly mortality surveillance data include a combination of machine coded and manually coded causes of death collected from death certificates. Percentages of deaths due to pneumonia, influenza, or COVID-19 (PIC) are higher among manually coded records than more rapidly available machine coded records. Because of additional time needed for manual coding, the initially reported PIC percentages are likely to increase as more data are received and processed. The lag in availability of manually coded data increased during the holiday weeks at the end of 2020, and because of the large numbers of deaths reported during recent weeks, the delay in availability of manually coded data continues to increase. Weeks for which the largest changes in the percentage of deaths due to PIC are expected are highlighted in gray in the figure below and should be interpreted with caution.


View Chart Dataexcel icon | View Full Screen
Additional pneumonia and influenza mortality surveillance information for current and past seasons:
Surveillance Methods | FluView Interactive
Influenza-Associated Pediatric Mortality


No influenza-associated pediatric deaths were reported to CDC during week 3.

One influenza-associated pediatric death occurring during the 2020-2021 season has been reported to CDC.


View Full Screen
Additional pediatric mortality surveillance information for current and past seasons:
Surveillance Methods | FluView Interactive


Additional National and International Influenza Surveillance Information


FluView Interactive: FluView includes enhanced web-based interactive applications that can provide dynamic visuals of the influenza data collected and analyzed by CDC. These FluView Interactive applications allow people to create customized, visual interpretations of influenza data, as well as make comparisons across flu seasons, regions, age groups and a variety of other demographics.

National Institute for Occupational Safety and Health: Monthly surveillance data on the prevalence of health-related workplace absenteeism among full-time workers in the United States are available from NIOSH.

U.S. State and local influenza surveillance: Select a jurisdiction below to access the latest local influenza information. World Health Organization:
Additional influenza surveillance information from participating WHO member nations is available through
FluNetexternal icon and the Global Epidemiology Reports.external icon

WHO Collaborating Centers for Influenza:
Australiaexternal icon, Chinaexternal icon, Japanexternal icon, the United Kingdomexternal icon, and the United States (CDC in Atlanta, Georgia)

Europe:
The most up-to-date influenza information from Europe is available from WHO/Europe and the European Centre for Disease Prevention and Controlexternal icon.

Public Health Agency of Canada:
The most up-to-date influenza information from Canada is available in Canada’s weekly FluWatch reportexternal icon.

Public Health England:
The most up-to-date influenza information from the United Kingdom is available from Public Health Englandexternal icon.

Any links provided to non-Federal organizations are provided solely as a service to our users. These links do not constitute an endorsement of these organizations or their programs by CDC or the Federal Government, and none should be inferred. CDC is not responsible for the content of the individual organization web pages found at these links.

A description of the CDC influenza surveillance system, including methodology and detailed descriptions of each data component is available on the surveillance methods page.

Page last reviewed: January 29, 2021, 11:00 AM
Content source: Centers for Disease Control and Prevention, National Center for Immunization and Respiratory Diseases (NCIRD)

https://www.cdc.gov/flu/weekly/weeklyarchives2020-2021/week03.htm
 
Weekly U.S. Influenza Surveillance Report


fluview-banner2.jpg


Note: CDC is tracking the COVID-19 pandemic in a weekly publication called COVIDView.

Key Updates for Week 4, ending January 30, 2021

Seasonal influenza activity in the United States remains lower than usual for this time of year.
Viruses


Clinical Labs
The percentage of respiratory specimens testing positive for influenza at clinical laboratories is 0.1% this week.

Public Health Labs
The number of influenza positives reported by public health labs remains unusually low.

Virus Characterization
Influenza virus characterization information will be updated weekly starting later this season.
Illness

Outpatient Illness: ILINet
This week, 1.1% of patient visits to a health care provider were for influenza-like illness (ILI), which was a decrease compared to week 3 (1.3%). National ILI remains below the national baseline of 2.6%. ILI surveillance may be impacted by the COVID-19 pandemic and should be interpreted with caution.

Outpatient Illness: ILINet Activity Map


This week, all jurisdictions experienced minimal activity. ILI activity levels may be impacted by the COVID-19 pandemic and should be interpreted with caution.
Severe Disease


Hospitalizations
FluSurv-NET sites have reported 155 laboratory-confirmed influenza hospitalizations so far this season for an overall cumulative hospitalization rate of 0.5 per 100,000 population.

NCHS Mortality
28.4% of deaths were attributed to pneumonia, influenza, or COVID-19 (PIC). This is above the epidemic threshold of 7.1%. Currently, the majority of PIC deaths are due to COVID-19.

Pediatric Deaths
No new influenza-associated pediatric deaths were reported to CDC this week. The total for the 2020-21 season is one.

All data are preliminary and may change as more reports are received.

A description of the CDC influenza surveillance system, including methodology and detailed descriptions of each data component is available on the surveillance methods page.

Additional information on the current and previous influenza seasons for each surveillance component are available on FluView Interactive.

Key Points
  • Flu activity is unusually low at this time but may increase in the coming months.
  • An annual flu vaccine is the best way to protect against flu and its potentially serious complications.
  • If you haven’t gotten your flu vaccine yet, get vaccinated now.
  • There are also flu antiviral drugs that can be used to treat flu illness.
U.S. Virologic Surveillance:

Clinical Laboratories


The results of tests performed by clinical laboratories nationwide are summarized below. Data from clinical laboratories (the percentage of specimens tested that are positive for influenza) are used to monitor whether influenza activity is increasing or decreasing.
No. of specimens tested18,531554,588
No. of positive specimens (%)25 (0.1%)1,316 (0.2%)
Positive specimens by type
Influenza A7 (28.0%)465 (35.3%)
Influenza B18 (72.0%)851 (64.7%)


View Chart Data | View Full ScreenPublic Health Laboratories


The results of tests performed by public health laboratories nationwide are summarized below. Data from public health laboratories are used to monitor the proportion of circulating viruses that belong to each influenza subtype/lineage.
No. of specimens tested9,102276,200
No. of positive specimens3183
Positive specimens by type/subtype
Influenza A2 (66.7%)110 (60.1%)
(H1N1)pdm090 (0%)12 (41.4%)
H3N20 (0%)16 (55.2%)
H3N2v0 (0%)1 (3.4%)
Subtyping not performed281
Influenza B1 (33.3 %)73 (39.9%)
Yamagata lineage0 (0%)7 (46.7%)
Victoria lineage0 (0%)8 (53.3%)
Lineage not performed158

View Chart Data | View Full Screen
Additional virologic surveillance information for current and past seasons:
Surveillance Methods | FluView Interactive: National, Regional, and State Data or Age Data
Influenza Virus Characterization


CDC performs genetic and antigenic characterization of U.S. viruses submitted from state and local health laboratories using Right Size Roadmap submission guidance. These data are used to compare how similar the currently circulating influenza viruses are to the reference viruses representing viruses contained in the current influenza vaccines and to monitor evolutionary changes that continually occur in influenza viruses circulating in humans. CDC also tests susceptibility of influenza viruses to antiviral medications, including the neuraminidase inhibitors (oseltamivir, zanamivir, and peramivir) and the PA endonuclease inhibitor baloxavir.

Virus characterization data will be updated weekly starting later this season when a sufficient number of specimens have been tested.
Outpatient Illness Surveillance


Please note, the U.S. Outpatient Influenza-like Illness Surveillance Network (ILINet) monitors outpatient visits for influenza-like illness (ILI), not laboratory-confirmed influenza, and will capture visits due to other respiratory pathogens, such as SARS-CoV-2, that present with similar symptoms. In addition, healthcare-seeking behaviors have changed dramatically during the COVID-19 pandemic. Many people are accessing the healthcare system in alternative settings, which may or may not be captured as a part of ILINet. Therefore, ILI data, including ILI activity levels, should be interpreted with extreme caution. It is particularly important at this time to evaluate syndromic surveillance data, including that from ILINet, in the context of other sources of surveillance data to obtain a complete and accurate picture of both influenza and COVID-19 activity. CDC is tracking the COVID-19 pandemic in a weekly publication called COVIDView.
ILINet


Nationwide during week 4, 1.1% of patient visits reported through ILINet were due to ILI. This percentage is below the national baseline of 2.6%.


View Chart Data (current season only) | View Full Screen
During week 4, compared with week 3, the percentage of visits for ILI decreased for two regions (Regions 2 and 6) and remained stable (change of ≤ 0.1%) in the remaining eight regions. All regions reported percentages of outpatient visits for ILI below their region-specific baselines.
ILI Activity Map


Data collected in ILINet are used to produce a measure of ILI activity* by state/jurisdiction and Core Based Statistical Areas (CBSA).
Week 4
(Week ending
Jan. 30, 2021)
Week 3
(Week ending
Jan. 23, 2021)
Week 4
(Week ending
Jan. 30, 2021)
Week 3
(Week ending
Jan. 23, 2021)
Very High0000
High0023
Moderate0054
Low011922
Minimal5453587602
Insufficient Data11316298


*Data collected in ILINet may disproportionally represent certain populations within a jurisdiction or CBSA, and therefore, may not accurately depict the full picture of influenza activity for the entire jurisdiction or CBSA. Differences in the data presented here by CDC and independently by some health departments likely represent differing levels of data completeness with data presented by the health department likely being the more complete.
Additional information about medically attended visits for ILI for current and past seasons:
Surveillance Methods | FluView Interactive: National, Regional, and State Data or ILI Activity Map
Geographic Spread of Influenza as Assessed by State and Territorial Epidemiologists


The geographic spread of influenza as reported by state and territorial epidemiologists indicates geographic spread of influenza viruses but does not measure the severity of influenza activity. Due to the impact of COVID-19 on ILI surveillance, and the fact that the state and territorial epidemiologists report relies heavily on ILI activity, reporting for this system will be suspended for the 2020-21 influenza season. Data from previous seasons is available on FluView Interactive.
Additional geographic spread surveillance information for current and past seasons:
Surveillance Methods | FluView Interactive
Influenza-Associated Hospitalizations:


The Influenza Hospitalization Surveillance Network (FluSurv-NET) conducts population-based surveillance for laboratory-confirmed influenza-related hospitalizations in select counties in the Emerging Infections Program (EIP) states and Influenza Hospitalization Surveillance Project (IHSP) states.

A total of 155 laboratory-confirmed influenza-associated hospitalizations occurring between October 1, 2020, and January 30, 2021, were reported by FluSurv-NET sites for an overall cumulative hospitalization rate of 0.5 per 100,000 population. This is lower than average for this point in the season and comparable to the overall rate seen at this point during the 2011-12 season. Hospitalization rates stratified by age will be presented once case counts increase to a level that produces stable rates by age.
Additional hospitalization surveillance information for current and past seasons and additional age groups:
Surveillance Methods | FluView Interactive: Rates by Age or Patient Characteristics
National Center for Health Statistics (NCHS) Mortality Surveillance


Based on NCHS mortality surveillance data available on February 4, 2021, 28.4% of the deaths that occurred during the week ending January 30, 2021 (week 4), were due to pneumonia, influenza, and COVID-19 (PIC). This percentage is above the epidemic threshold of 7.1% for week 4. Among the 6,424 PIC deaths reported for this week (week 4), 5,648 had COVID-19 listed as an underlying or contributing cause of death on the death certificate and four listed influenza, indicating that the current increase in PIC mortality is due primarily to COVID-19 and not influenza.

Weekly mortality surveillance data include a combination of machine coded and manually coded causes of death collected from death certificates. Prior to week 4 (the week ending January 30, 2021), the percentages of deaths due to PIC were higher among manually coded records than more rapidly available machine coded records. Improvements have been made to the machine coding process that allow for more COVID-19 related deaths to be machine coded, and going forward, the percentage of PIC deaths among machine coded and manually coded data are expected to be more similar. The data presented are preliminary and expected to change as more data are received and processed, but the amount of change in the percentage of deaths due to PIC should be lower going forward. Weeks for which the largest changes in the percentage of deaths due to PIC may occur are highlighted in gray in the figure below and should be interpreted with caution.


View Chart Dataexcel icon | View Full Screen
Additional pneumonia and influenza mortality surveillance information for current and past seasons:
Surveillance Methods | FluView Interactive
Influenza-Associated Pediatric Mortality


No influenza-associated pediatric deaths were reported to CDC during week 4.

One influenza-associated pediatric death occurring during the 2020-2021 season has been reported to CDC.


View Full Screen
Additional pediatric mortality surveillance information for current and past seasons:
Surveillance Methods | FluView Interactive


Additional National and International Influenza Surveillance Information


FluView Interactive: FluView includes enhanced web-based interactive applications that can provide dynamic visuals of the influenza data collected and analyzed by CDC. These FluView Interactive applications allow people to create customized, visual interpretations of influenza data, as well as make comparisons across flu seasons, regions, age groups and a variety of other demographics.

National Institute for Occupational Safety and Health: Monthly surveillance data on the prevalence of health-related workplace absenteeism among full-time workers in the United States are available from NIOSH.

U.S. State and local influenza surveillance: Select a jurisdiction below to access the latest local influenza information. World Health Organization:
Additional influenza surveillance information from participating WHO member nations is available through
FluNetexternal icon and the Global Epidemiology Reports.external icon

WHO Collaborating Centers for Influenza:
Australiaexternal icon, Chinaexternal icon, Japanexternal icon, the United Kingdomexternal icon, and the United States (CDC in Atlanta, Georgia)

Europe:
The most up-to-date influenza information from Europe is available from WHO/Europe and the European Centre for Disease Prevention and Controlexternal icon.

Public Health Agency of Canada:
The most up-to-date influenza information from Canada is available in Canada’s weekly FluWatch reportexternal icon.

Public Health England:
The most up-to-date influenza information from the United Kingdom is available from Public Health Englandexternal icon.

Any links provided to non-Federal organizations are provided solely as a service to our users. These links do not constitute an endorsement of these organizations or their programs by CDC or the Federal Government, and none should be inferred. CDC is not responsible for the content of the individual organization web pages found at these links.

A description of the CDC influenza surveillance system, including methodology and detailed descriptions of each data component is available on the surveillance methods page.

Page last reviewed: February 5, 2021, 11:22 am
Content source: Centers for Disease Control and Prevention, National Center for Immunization and Respiratory Diseases (NCIRD)

https://www.cdc.gov/flu/weekly/index.htm
 
Season end report for 2020/2021

Weekly U.S. Influenza Surveillance Report


fluview-banner2.jpg


Note: CDC is tracking the COVID-19 pandemic in a weekly publication called COVID Data Tracker Weekly Review.

2020-2021 Influenza Season for Week 38, ending September 25, 2021

All data are preliminary and may change as more reports are received.

A description of the CDC influenza surveillance system, including methodology and detailed descriptions of each data component is available on the surveillance methods page.

Additional information on the current and previous influenza seasons for each surveillance component are available on FluView Interactive.
U.S. Virologic Surveillance:

Clinical Laboratories


Data from clinical laboratories (the percentage of specimens tested that are positive for influenza) are used to monitor whether influenza activity is increasing or decreasing.


View Chart Data | View Full ScreenPublic Health Laboratories


Data from public health laboratories are used to monitor the proportion of circulating viruses that belong to each influenza subtype/lineage.


View Chart Data | View Full Screen


Additional information about medically attended visits for ILI for current and past seasons:
Surveillance Methods | FluView Interactive: National, Regional, and State Data or ILI Activity Map
Outpatient Illness Surveillance


Please note, the U.S. Outpatient Influenza-like Illness Surveillance Network (ILINet) monitors outpatient visits for influenza-like illness (ILI), not laboratory-confirmed influenza, and will capture visits due to other respiratory pathogens, such as SARS-CoV-2, that present with similar symptoms. In addition, health care-seeking behaviors have changed dramatically during the COVID-19 pandemic. Many people are accessing the health care system in alternative settings, which may or may not be captured as a part of ILINet. Therefore, ILI data, including ILI activity levels, should be interpreted with caution. It is particularly important at this time to evaluate syndromic surveillance data, including that from ILINet, in the context of other sources of surveillance data to obtain a complete and accurate picture of influenza, COVID-19, and other respiratory virus activity. CDC is tracking the COVID-19 pandemic in a weekly publication called COVID Data Tracker Weekly Review. Information about other respiratory virus activity can be found on CDC’s National Respiratory and Enteric Virus Surveillance System (NREVSS) website.
ILINet


Nationwide during week 38, 1.9% of patient visits reported through ILINet were due to ILI. The percentage of patient visits for ILI remains below the baseline of 2.6% nationally. One region (Region 3) is at their region-specific baseline while the remaining nine regions are below their region-specific baselines.

Influenza virus circulation remains low; therefore, increases in ILI activity are likely due to increased circulation of other respiratory viruses.


View Chart Data (current season only) | View Full ScreenILI Visits by Age Group


About 65% of ILINet participants provide both the number of patient visits for ILI and the total number of patient visits for the week broken out by age group. Data from this subset of providers are used to calculate the percentages of patient visits for ILI by age group.

The percentages of visits for ILI reported in ILINet are decreasing among all age groups (0-4 years, 5-24 years, 25-49 years, 50-64 years, and 65+ years).


View Chart Data | View Full ScreenILI Activity Map


Data collected in ILINet are used to produce a measure of ILI activity* by state/jurisdiction and Core Based Statistical Areas (CBSA).
Week 38
(Week ending
Sep. 25, 2021)
Week 37
(Week ending
Sep. 18, 2021)
Week 38
(Week ending
Sep. 25, 2021)
Week 37
(Week ending
Sep. 18, 2021)
Very High0000
High00517
Moderate103224
Low91271100
Minimal4442484462
Insufficient Data11337326


*Data collected in ILINet may disproportionally represent certain populations within a jurisdiction or CBSA, and therefore, may not accurately depict the full picture of influenza activity for the entire jurisdiction or CBSA. Differences in the data presented here by CDC and independently by some health departments likely represent differing levels of data completeness with data presented by the health department likely being the more complete.
Additional information about medically attended visits for ILI for current and past seasons:
Surveillance Methods | FluView Interactive: National, Regional, and State Data or ILI Activity Map
Influenza-Associated Hospitalizations:


The Influenza Hospitalization Surveillance Network (FluSurv-NET) conducts population-based surveillance for laboratory-confirmed influenza-related hospitalizations in select counties in 14 states and represents approximately 9% of the U.S. population. As in previous seasons, patients admitted for laboratory-confirmed influenza-related hospitalization after April 30, 2021, will not be included in FluSurv-NET. Data on patients admitted through April 30, 2021, will continue to be updated as additional information is received.
Additional hospitalization surveillance information for current and past seasons and additional age groups:
Surveillance Methods | FluView Interactive: Rates by Age or Patient Characteristics
National Center for Health Statistics (NCHS) Mortality Surveillance


Based on NCHS mortality surveillance data available on September 30, 2021, 20.9% of the deaths that occurred during the week ending September 25, 2021 (week 38), were due to pneumonia, influenza, and/or COVID-19 (PIC). This percentage is above the epidemic threshold of 5.6% for this week. Among the 4,451 PIC deaths reported for this week, 3,606 had COVID-19 listed as an underlying or contributing cause of death on the death certificate, and four listed influenza, indicating that current PIC mortality is due primarily to COVID-19 and not influenza. The data presented are preliminary and may change as more data are received and processed.


View Chart Dataexcel icon | View Full Screen
Additional pneumonia and influenza mortality surveillance information for current and past seasons:
Surveillance Methods | FluView Interactive
Influenza-Associated Pediatric Mortality


No influenza-associated pediatric deaths were reported to CDC during week 38.

One influenza-associated pediatric death occurring during the 2020-2021 season has been reported to CDC.


View Full Screen
Additional pediatric mortality surveillance information for current and past seasons:
Surveillance Methods | FluView Interactive


Additional National and International Influenza Surveillance Information


FluView Interactive: FluView includes enhanced web-based interactive applications that can provide dynamic visuals of the influenza data collected and analyzed by CDC. These FluView Interactive applications allow people to create customized, visual interpretations of influenza data, as well as make comparisons across flu seasons, regions, age groups and a variety of other demographics.

National Institute for Occupational Safety and Health: Monthly surveillance data on the prevalence of health-related workplace absenteeism among full-time workers in the United States are available from NIOSH.

U.S. State and local influenza surveillance: Select a jurisdiction below to access the latest local influenza information. World Health Organization:
Additional influenza surveillance information from participating WHO member nations is available through
FluNetexternal icon and the Global Epidemiology Reports.external icon

WHO Collaborating Centers for Influenza:
Australiaexternal icon, Chinaexternal icon, Japanexternal icon, the United Kingdomexternal icon, and the United States (CDC in Atlanta, Georgia)

Europe:
The most up-to-date influenza information from Europe is available from WHO/Europe and the European Centre for Disease Prevention and Controlexternal icon.

Public Health Agency of Canada:
The most up-to-date influenza information from Canada is available in Canada’s weekly FluWatch reportexternal icon.

Public Health England:
The most up-to-date influenza information from the United Kingdom is available from Public Health Englandexternal icon.

Any links provided to non-Federal organizations are provided solely as a service to our users. These links do not constitute an endorsement of these organizations or their programs by CDC or the Federal Government, and none should be inferred. CDC is not responsible for the content of the individual organization web pages found at these links.

A description of the CDC influenza surveillance system, including methodology and detailed descriptions of each data component is available on the surveillance methods page.

Page last reviewed: October 1, 2021, 11:00 AM

https://www.cdc.gov/flu/weekly/index.htm
 
Back
Top