
• FluTrackers.com Inc. does not provide medical advice. Information on this web site is collected from various internet resources, and the FluTrackers board of directors makes no warranty to the safety, efficacy, correctness or completeness of the information posted on this site by any author or poster. The information collated here is for instructional and/or discussion purposes only and is NOT intended to diagnose or treat any disease, illness, or other medical condition. Every individual reader or poster should seek advice from their personal physician/healthcare practitioner before considering or using any interventions that are discussed on this website. By continuing to access this website you agree to consult your personal physican before using any interventions posted on this website, and you agree to hold harmless FluTrackers.com Inc., the board of directors, the members, and all authors and posters for any effects from use of any medication, supplement, vitamin or other substance, device, intervention, etc. mentioned in posts on this website, or other internet venues referenced in posts on this website.
  • We are not asking for any donations. Do not donate to any entity who says they are raising funds for us.

US - COVID-19 Heat Map, Based on CDC Wastewater Data and Levels, for discussion only - August 17, 2026+

sharon sanders

Editor-in-Chief & President
I do not know if I am a 100% believer in wastewater data due to possible sampling issues but it is interesting.

hat tip @michael_hoerger
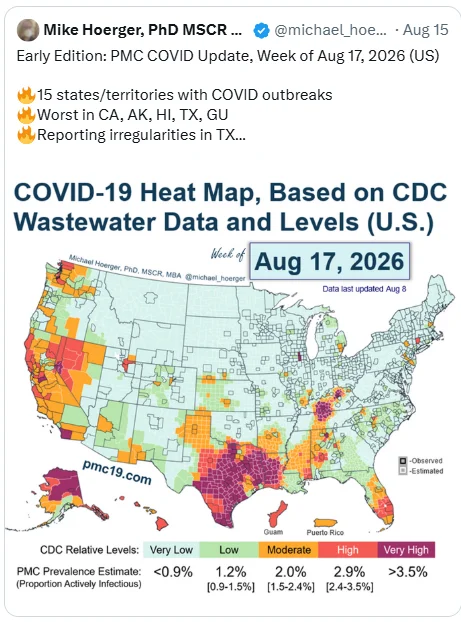
Click image for larger version  Name:	Screenshot 2026-08-17 071451.png Views:	1 Size:	272.9 KB ID:	1040111


https://pmc19.com/
 
hat tip @michael_hoerger


Screenshot 2026-08-29 093817.webp


Screenshot 2026-08-29 093843.webp


Screenshot 2026-08-29 093956.webp


Again, this thread is not an endorsement but is offered for discussion. If you have any questions about COVID-19 in your area, consult your local public health department and/or your medical practitioner.
 

COVID Rates Low But Are Increasing Across The United States


#19,315

Four weeks ago, in Mainland China, Taiwan & Hong Kong All Reporting Summer Surge of COVID, we looked at rising rates of COVID around the globe and the CDC's National Outlook which warned of a possible return visit later in the summer.

The CDC's latest wastewater analysis now shows increasing COVID viral activity across much of the southern tier of states and the the west coast, and the overall epidemic trend is growing across the entire country (see below).


None of this is to suggest we are seeing a major wave, but we are seeing an uptick. As the following CDC chart illustrates, while influenza and RSV have flatlined over the summer, COVID (in orange) is on the ascendent.


Testing, and reporting, of COVID cases remain low, and so the CDC's Nowcast is unable provide us with much in the way of details on this summer's variants.


This past week the FDA approved a new JN.1 lineage XFG subvariant COVID vaccine (see CIDRAP FDA approves new COVID vaccines) which should be available later this fall.


Getting people to actually take the vaccine remains a challenge, particularly given the amount of anti-vaccine rhetoric on the internet. As the following CDC chart illustrates, uptake continues to decline.


But having spent the past 2 decades chronicling the impact of viral infection (and reinfections) on individual health, I will be gladly rolling up my sleeve for both COVID and flu jabs again this fall.

A few examples include:


https://afludiary.blogspot.com/2026/08/covid-rates-low-but-are-increasing.html
 
Back
Top Bottom