• FluTrackers.com Inc. does not provide medical advice. Information on this web site is collected from various internet resources, and the FluTrackers board of directors makes no warranty to the safety, efficacy, correctness or completeness of the information posted on this site by any author or poster. The information collated here is for instructional and/or discussion purposes only and is NOT intended to diagnose or treat any disease, illness, or other medical condition. Every individual reader or poster should seek advice from their personal physician/healthcare practitioner before considering or using any interventions that are discussed on this website. By continuing to access this website you agree to consult your personal physican before using any interventions posted on this website, and you agree to hold harmless FluTrackers.com Inc., the board of directors, the members, and all authors and posters for any effects from use of any medication, supplement, vitamin or other substance, device, intervention, etc. mentioned in posts on this website, or other internet venues referenced in posts on this website.
  • We are not asking for any donations. Do not donate to any entity who says they are raising funds for us.

US - CDC: COVID Data Tracker Weekly Review 2021 - 2024 - For trend analysis only


Print
Subscribe to the Weekly Review

Interpretive Summary for March 31, 2023
COVID-19 Data Modernization

This is part of a series of Weekly Review issues coinciding with the end of the COVID-19 public health emergency and what it means for CDC and the data we report. The first issue published on February 24, 2023, and the final two issues will publish on April 14 and May 12.

The COVID-19 pandemic fundamentally changed expectations for public health, especially the speed at which credible health information is delivered. It created an opportunity to further transform how we collect, use, and share data at CDC and beyond. That momentum won’t stop when the public health emergency ends on May 11. CDC will continue tracking and reporting COVID-19 data, with some changes, while improving our readiness for the next public health emergency.

The Data Modernization Initiative (DMI) is our solution to the challenges public health has faced for too long, which have been highlighted during the pandemic. Through the initiative, CDC is creating a world in which data can move faster than disease. Our ultimate goal is to get better, faster, actionable data for decision-making at all levels of public health.

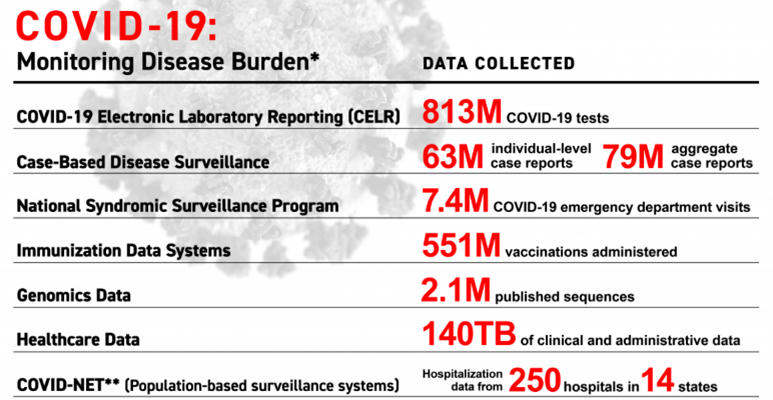
The pandemic underscored the importance of good data across the nation’s public health system. CDC is working to advance eight core goals [240 KB, 1 page] for public health surveillance of COVID-19:
  • Monitor trends and intensity of SARS-CoV-2 transmission, identify outbreaks, and provide data to initiate case and contact investigations
  • Understand disease severity and the spectrum of illness
  • Monitor and track vaccine distribution, uptake, and effectiveness
  • Describe risk factors for severe disease and transmission
  • Monitor for variants
  • Assess impact on healthcare systems
  • Estimate disease burden, and forecast trends, impact, and clinical and public health needs
  • Monitor impact of disease and interventions on health equity
DMI’s vision is to create one public health community that can engage robustly with healthcare, communicate meaningfully with the public, improve health equity, and have the means to protect and promote health. The gains we’ve made during the pandemic are now building a bridge to a new kind of surveillance and better approaches to public health data.

What’s New:
  • The Vaccine Effectiveness page was updated to highlight vaccine effectiveness studies published from October 2022 to February 2023.
  • The new Links to Archived Data and Visualizations page is now live to the public. This new page lists all pages archived from COVID Data Tracker and where the archived information can be found.
COVID-19 Community Levels*


As of March 30, 2023, there are 25 (0.8%) counties, districts, or territories with a high COVID-19 Community Level, 279 (8.7%) with a medium Community Level, and 2,915 (90.5%) with a low Community Level. Compared with last week, the number of counties, districts, or territories in the high level decreased by 0.1%, the medium level increased by 2.8%, and in the low level decreased by 2.7%. Overall, 35 out of 52 jurisdictions** had high- or medium-level counties this week. California, Connecticut, Delaware, District of Columbia, Kentucky, Maine, Maryland, Massachusetts, Nevada, New Jersey, North Carolina, Oregon, Puerto Rico, Rhode Island, South Carolina, Utah, and Washington are the jurisdictions that have all counties at low Community Levels.

To check your COVID-19 Community Level, visit COVID Data Tracker. To learn which prevention measures are recommended based on your COVID-19 Community Level, visit COVID-19 Community Level and COVID-19 Prevention.

*CDC recommends use of COVID-19 Community Levels to determine the impact of COVID-19 on communities and to take action. CDC also provides Community Transmission Levels to describe the amount of COVID-19 spread within each county. Healthcare facilities use Community Transmission Levels to determine infection control interventions.

**Includes the 50 states, the District of Columbia, and Puerto Rico.

U.S. COVID-19 Community Levels by County
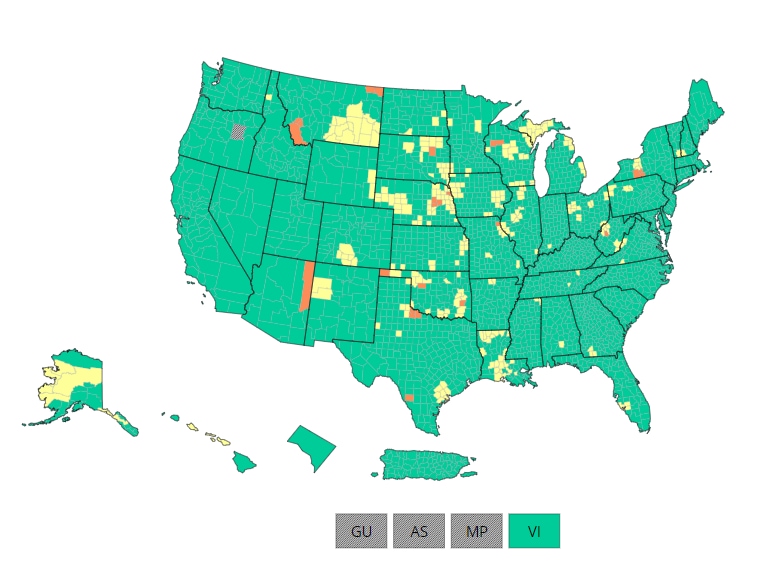

View Larger

COVID-Community-Levels-2.png
COVID-19 Community Levels
Reported Cases


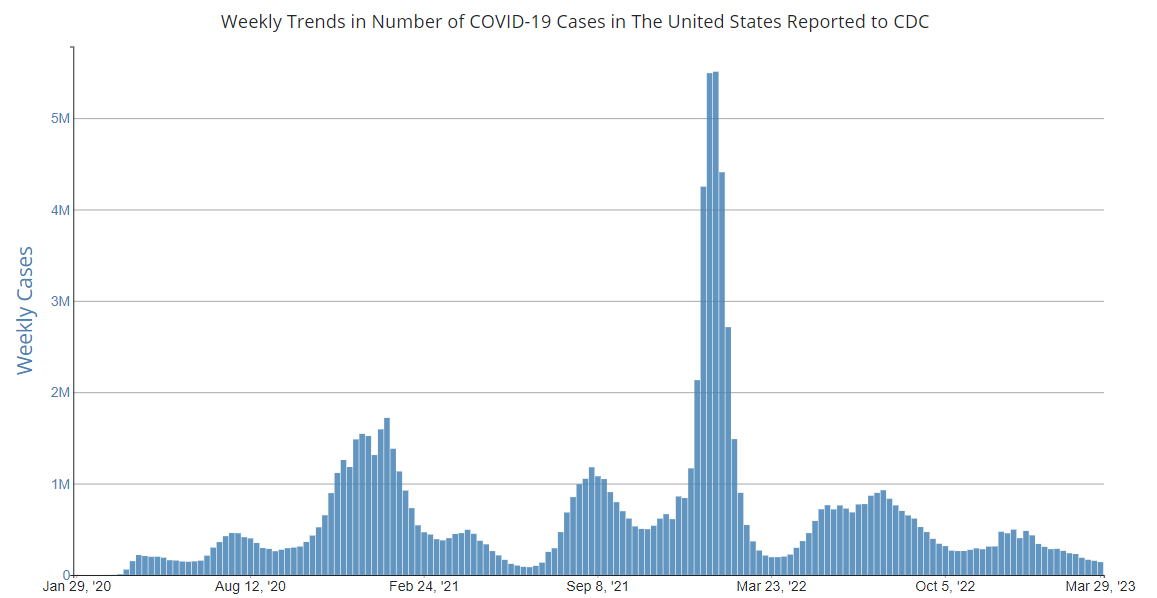
As of March 29, 2023, the current 7-day average of weekly new cases (19,999) decreased 9.2% compared with the previous 7-day average (22,035). A total of 104,137,196 COVID-19 cases have been reported in the United States as of March 29, 2023.

104,137,196
Total Cases Reported

19,999
Current 7-Day Average*

22,035
Previous 7-Day Average

-9.2%
Change in 7-Day Average since Previous Period

*Historical cases are excluded from weekly new cases and 7-day average calculations until they are incorporated into the dataset for the applicable date. Of 79,780 historical cases reported retroactively, 5,347 were reported in the current week and 18,232 in the prior week.

Weekly Trends in COVID-19 Cases in the United States Reported to CDC

View Larger
More Case DataCOVID-19 Variants


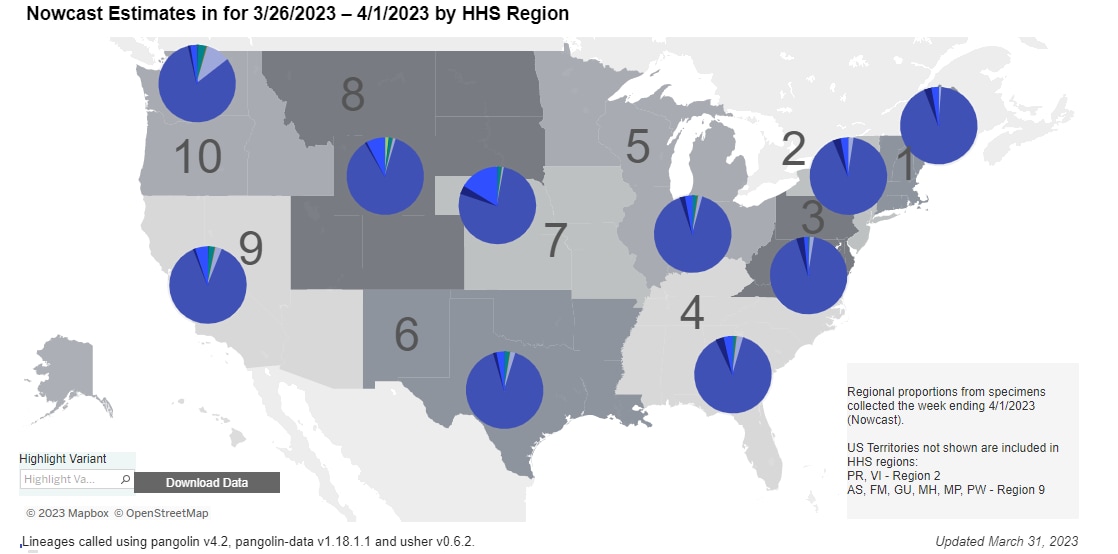
CDC Nowcast projections* for the week ending April 1, 2023, estimate the proportion of these lineages designated as Omicron with estimates above 1%: XBB.1.5, XBB.1.9.1, XBB, XBB.1.5.1, and BQ.1.1.

XBB.1.5 is projected to be at approximately 87.9% (95% PI 85.0-90.4%).

XBB.1.9.1, XBB, XBB.1.5.1, and BQ.1.1 are projected to be between 1.9% and 4.6% of circulating lineages.

XBB.1.5 has reached saturation, and XBB.1.9.1, XBB, and XBB.1.5.1 all have positive growth. All other virus lineages are predicted to have very slow or no growth in proportion.

See COVID Data Tracker for the proportions of all relevant lineages currently circulating.

*CDC uses Nowcast projections to predict current variant proportions circulating in the United States. The median time from specimen collection to sequence data reporting is about 3 weeks. As a result, weighted estimates for the most recent few weeks may be unstable or unavailable. View Nowcast estimates on CDC’s COVID Data Tracker website on the Variant Proportions page.

Variant Proportions

View Larger
Vaccinations


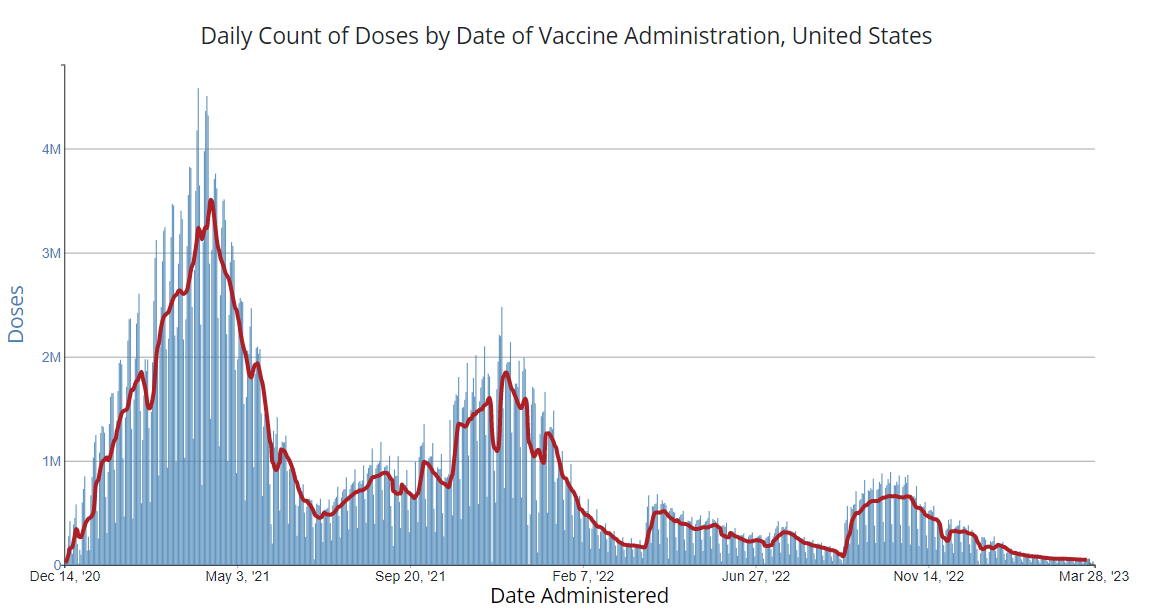
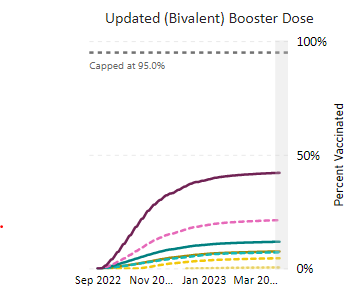
As of March 29, 2023, 674.0 million vaccine doses have been administered in the United States. Overall, about 230.4 million people, or 69.4% of the total U.S. population, have completed a primary series.* About 54.9 million people, or 16.5% of the U.S. population, have received an updated booster dose.

674,024,493
Vaccine Doses Administered

55,352,840
Updated Booster Doses Administered**

230,368,815
People who have completed a primary series* (69.4% of the U.S. population)

54,864,032
People who have received an updated booster (16.5% of the eligible U.S. population)

+0.1
Percentage point change from last week

+0.1
Percentage point change from last week

*Represents the number of people who have received the second dose in a two-dose COVID-19 vaccine series (such as the Pfizer-BioNTech, Moderna, or Novavax vaccines) or one dose of the single-shot Johnson & Johnson’s Janssen vaccine.

**The number of updated booster doses administered is larger than the number of people who have received an updated booster because one person may receive more than one booster dose.

Daily Change in the Total Number of Administered COVID-19 Vaccine Doses Reported to CDC by the Date of Administration, United States

7-Day moving average

View Larger
COVID-19 Updated Booster Dose Administration, United States

View Larger

More Vaccination Data
Hospitalizations

New Hospital Admissions


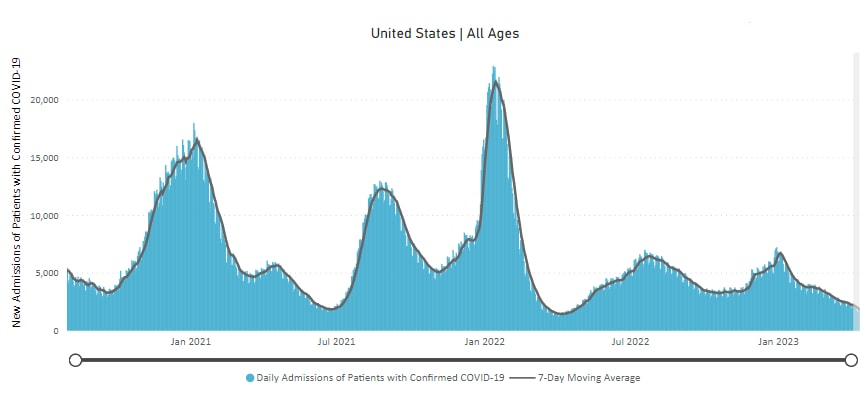
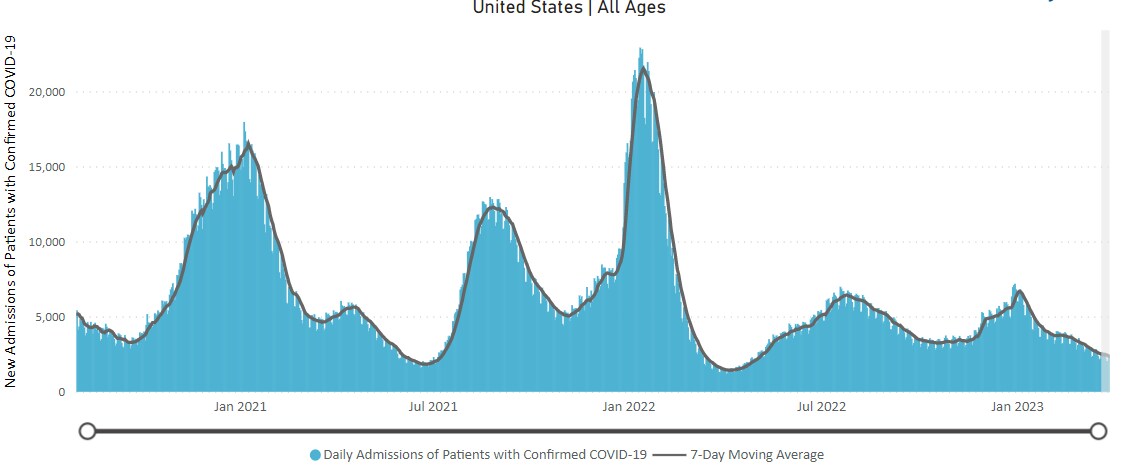
The current 7-day daily average for March 22–28, 2023, was 2,370. This is a 5.3% decrease from the prior 7-day average (2,501) from March 15–21, 2023.

6,074,793
Total New Admissions

2,370
Current 7-Day Average

2,501
Prior 7-Day Average

-5.3%
Change in 7-Day Average

The start of consistent reporting of hospital admissions data was August 1, 2020.

Daily Trends in Number of New COVID-19 Hospital Admissions in the United States

View Larger
New admissions are pulled from a 10 am EDT snapshot of the HHS Unified Hospital Data – Analytic Dataset. Due to potential reporting delays, data from the most recent 7 days, as noted in the figure above with the grey bar, should be interpreted with caution. Small shifts in historic data may also occur due to changes in the Centers for Medicare & Medicaid Services (CMS) Provider of Services file, which is used to identify the cohort of included hospitals.

More Hospital Data
COVID-NET: Trends in COVID-19 Hospitalization Rates Among Adults and Children (All Ages)


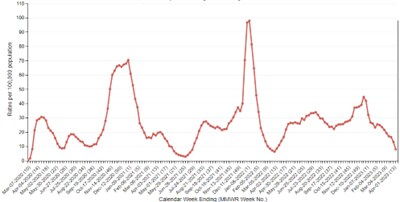
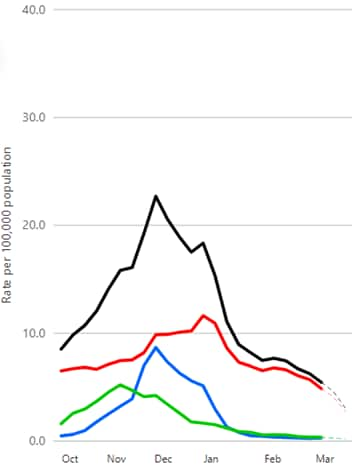
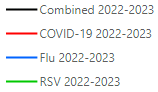
CDC’s Coronavirus Disease 2019-Associated Hospitalization Surveillance Network (COVID-NET) shows that overall COVID-19-associated hospitalizations have continued to decline since late December 2022. Hospitalization rates among people of all ages have declined from a peak of 11.6 per 100,000 population for the week ending December 31, 2022, and have remained below 7.0 per 100,000 population since the week ending January 28, 2023.

Weekly Rates of COVID-19-Associated Hospitalizations Among Adults and Children (All Ages)

View Larger
COVID-NET-legend.png


The dashed lines for the current season indicate potential reporting delays and interpretation of trends should exclude data from recent weeks. Coronavirus Disease 2019 (COVID-19)-Associate­­d Hospitalization Surveillance Network (COVID-NET), a RESP-NET platform, is an additional source for hospitalization data collected through a network of more than 250 acute-care hospitals in 13 states (representing ~10% of the U.S. population). Detailed data on patient demographics, including race and ethnicity, underlying medical conditions, medical interventions, and clinical outcomes, are collected using a standardized case reporting form.

More COVID-NET Data
Deaths


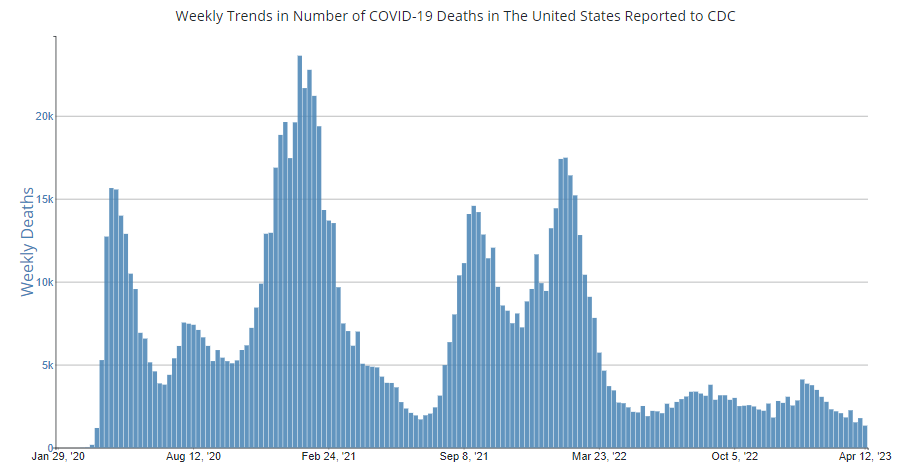
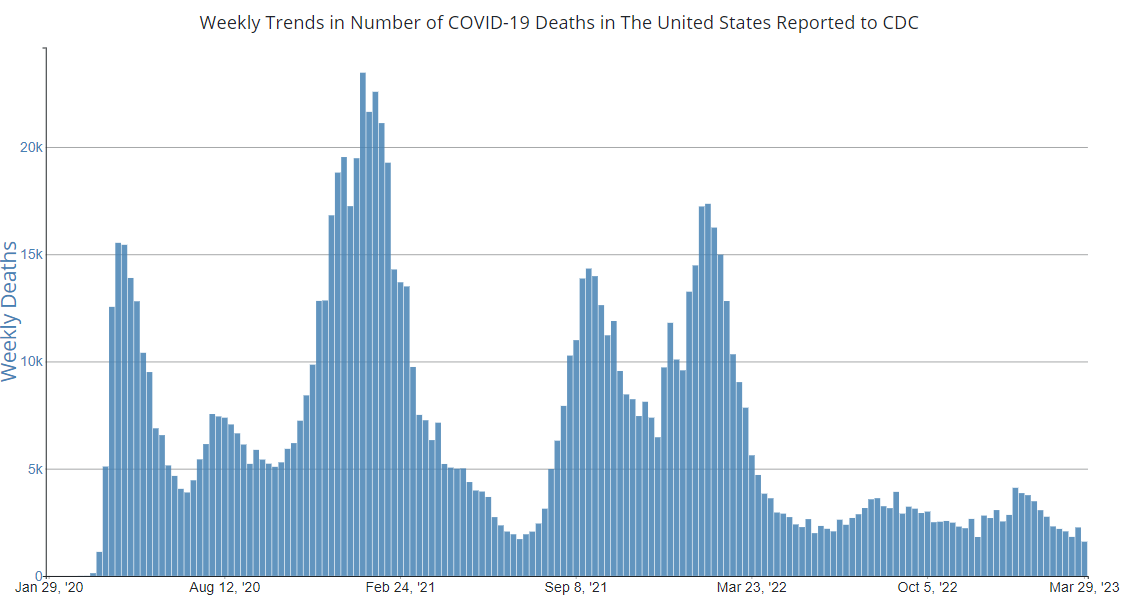
The current 7-day average of new deaths (228) decreased 29.4% compared with the previous 7-day average (323). As of March 29, 2023, a total of 1,125,366 COVID-19 deaths have been reported in the United States.

1,125,366
Total Deaths Reported

228
Current 7-Day Average*

323
Prior 7-Day Average

-29.4%
Change in 7-Day Average Since Prior Period

*Historical deaths are excluded from the weekly new deaths and 7-day average calculations until they are incorporated into the dataset by their applicable date. Of 4,113 historical deaths reported retroactively, none were reported in the current week and none were reported in the prior week.

Weekly Trends in Number of COVID-19 Deaths in the United States Reported to CDC

View Larger
More Death Data
Testing


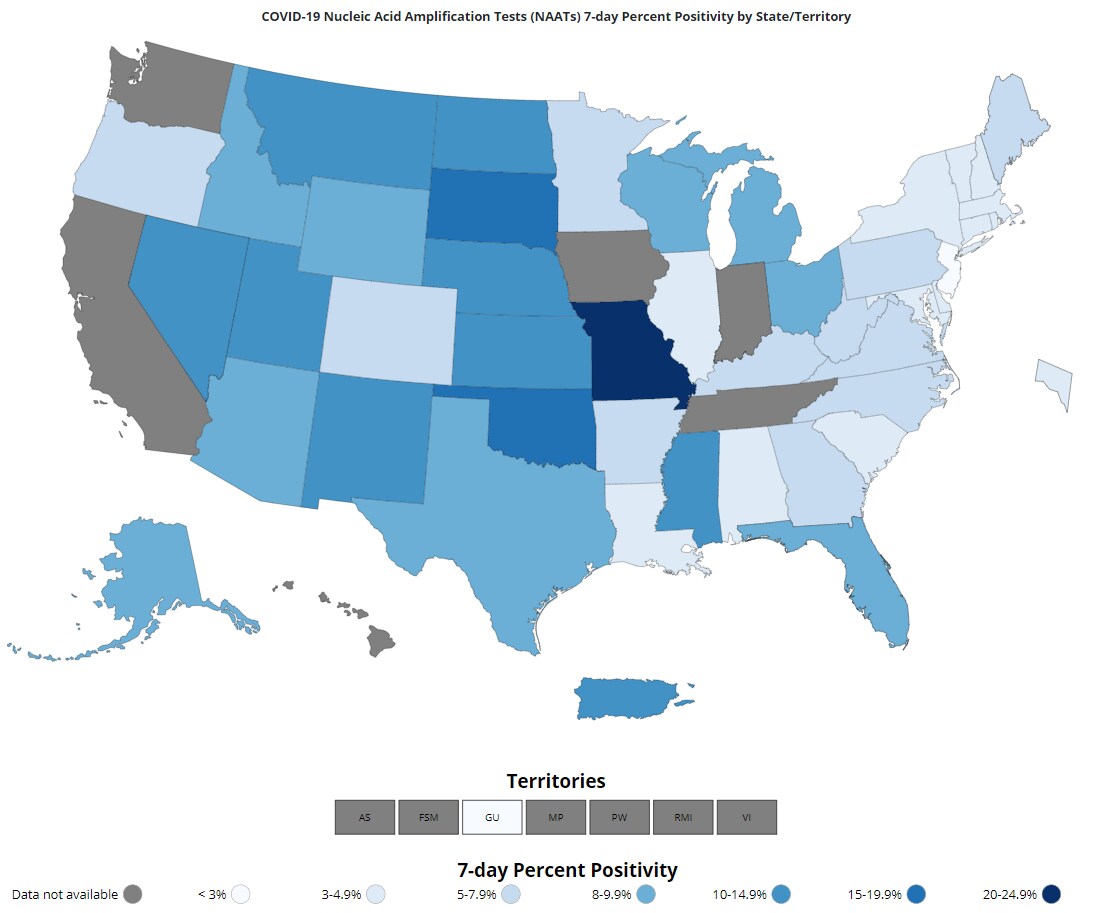
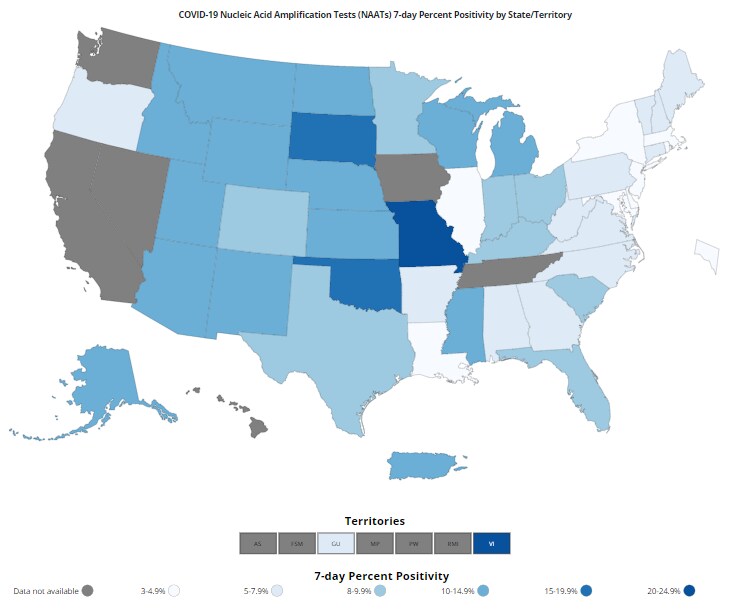
The percentage of COVID-19 NAATs (nucleic acid amplification tests)* that are positive is decreasing in comparison to the previous week. The 7-day average of percent positivity from NAATs is now 7.1%. The 7-day average number of tests reported for March 17–23, 2023, was 192,093, down 22.0% from 246,346 for the prior 7 days.

1,027,565,117
Total Tests Reported

192,093
7-Day Average Tests Reported

7.1%
7-Day Average % Positivity

6.5%
Previous 7-Day Average % Positivity

+0.56
Percentage point change in 7-Day Average % Positivity since Prior Week

*Test for SARS-CoV-2, the virus that causes COVID-19

COVID-19 NAAT Laboratory Test 7-day Percent Positivity by State/Territory

View Larger
More Testing DataWastewater Surveillance


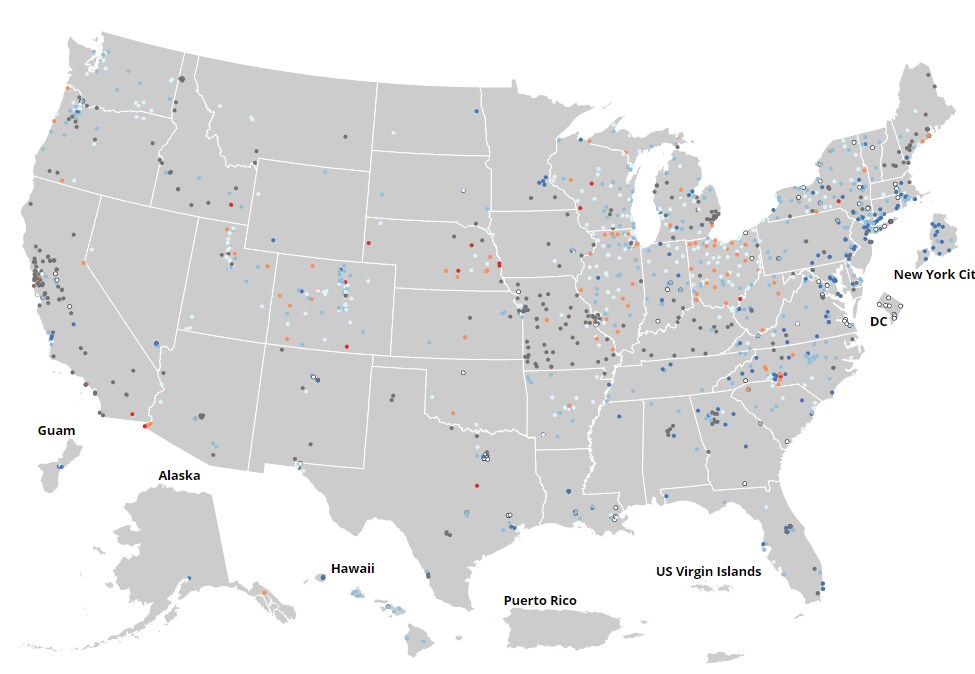
COVID Data Tracker’s Wastewater Surveillance tab tracks levels, changes, and detections of SARS-CoV-2* viral RNA in wastewater at over 1,400 testing sites across the country.

Currently, about 43% of sites across the country are reporting moderate to high SARS-CoV-2 levels in wastewater. About 11% of sites reporting wastewater data are currently seeing some of the highest levels for those sites since December 1, 2021. About 42% of sites are experiencing a decrease in SARS-CoV-2 levels, and about 51% are reporting an increase.

For more information on how to use wastewater data, visit CDC’s wastewater surveillance website.

*The virus that causes COVID-19

SARS-CoV-2 Levels in Wastewater by Site

View Larger
Wastewater-legend.jpg


0% denotes that levels are the lowest they have been at the site; 100% denotes that levels are the highest they have been at the site.

More Wastewater Data

https://www.cdc.gov/coronavirus/2019-ncov/covid-data/covidview/index.html
 

Print
Subscribe to the Weekly Review

Interpretive Summary for April 14, 2023
Moving Forward with COVID-19 Data


CDC launched COVID Data Tracker in 2020 to provide state and local public health officials and communities with the COVID-19 data they need in one consolidated, easy-to-use location. Over the past three years, COVID Data Tracker has grown to incorporate county, state, national, and global data streams into more than 70 webpages of key pandemic-related information.

To prepare for the end of the COVID-19 public health emergency [165KB, 2 pages] declaration on May 11, 2023, CDC is transitioning to sustainable national COVID-19 surveillance. CDC will continue to use all available resources to track COVID-19 and monitor its long-term effect on the United States and globally. Variant data is a good example of sustainable surveillance. The virus that causes COVID-19 is constantly changing, with new lineages emerging and then spreading or disappearing. XBB.1.5 became the dominant lineage over the past few months, but it is now starting to wane as other lineages rise. Newer lineages like XBB.1.9.2 and XBB.1.16, both close relatives of XBB.1.5, are starting to rise and could displace XBB.1.5. At this time, the best ways to protect yourself and others from COVID-19 remain the same, regardless of which lineage causes infection. CDC will keep a close watch on these changes and continue to communicate about their potential impact.

Most data activities on COVID Data Tracker won’t be affected by the end of the public health emergency. In the next and final Weekly Review on May 12, we’ll give a more comprehensive summary of the updates to COVID Data Tracker and where you’ll be able to find the COVID-19 data you need.

COVID-19 Community Levels*


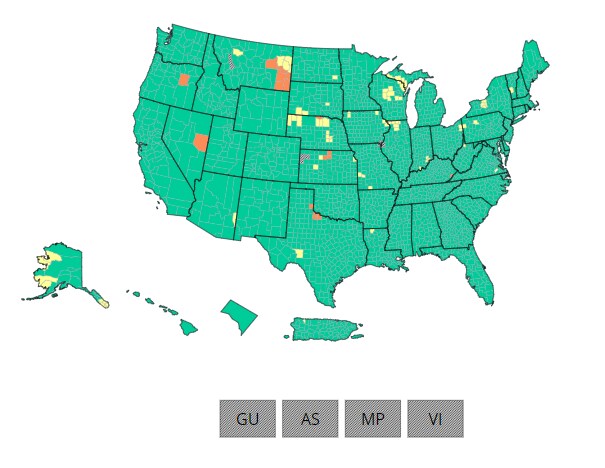
As of April 13, 2023, there are 17 (0.5%) counties, districts, or territories with a high COVID-19 Community Level, 79 (2.5%) with a medium Community Level, and 3,117 (96.8%) with a low Community Level. Compared with last week, the number of counties, districts, or territories in the high level increased by 0.1%, in the medium level decreased by 0.9%, and in the low level increased by 0.7%. Overall, 25 out of 52 jurisdictions** had high- or medium-level counties this week.

To check your COVID-19 Community Level, visit COVID Data Tracker. To learn which prevention measures are recommended based on your COVID-19 Community Level, visit COVID-19 Community Level and COVID-19 Prevention.

*CDC recommends use of COVID-19 Community Levels to determine the impact of COVID-19 on communities and to take action. CDC also provides Community Transmission Levels to describe the amount of COVID-19 spread within each county. Healthcare facilities use Community Transmission Levels to determine infection control interventions.

**Includes the 50 states, the District of Columbia, and Puerto Rico.

U.S. COVID-19 Community Levels by County


View Larger
CCL-legend.PNG
COVID-19 Community Levels
Reported Cases


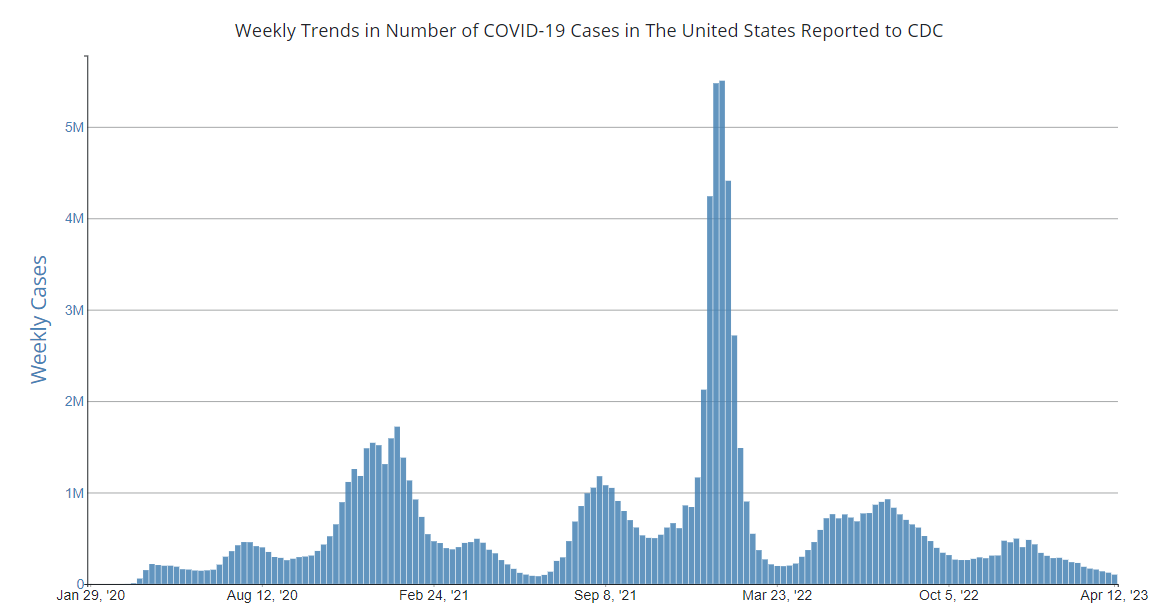
As of April 12, 2023, the current 7-day average of weekly new cases (14,491) decreased 17.3% compared with the previous 7-day average (17,519). A total of 104,348,746 COVID-19 cases have been reported in the United States as of April 12, 2023.

104,348,746
Total Cases Reported

14,491
Current 7-Day Average*

17,519
Previous 7-Day Average

-17.3%
Change in 7-Day Average since Previous Period

*Historical cases are excluded from weekly new cases and 7-day average calculations until they are incorporated into the dataset for the applicable date. Of 79,780 historical cases reported retroactively, none were reported in the current week and none in the prior week.

Weekly Trends in COVID-19 Cases in the United States Reported to CDC


View Larger
More Case DataCOVID-19 Variants


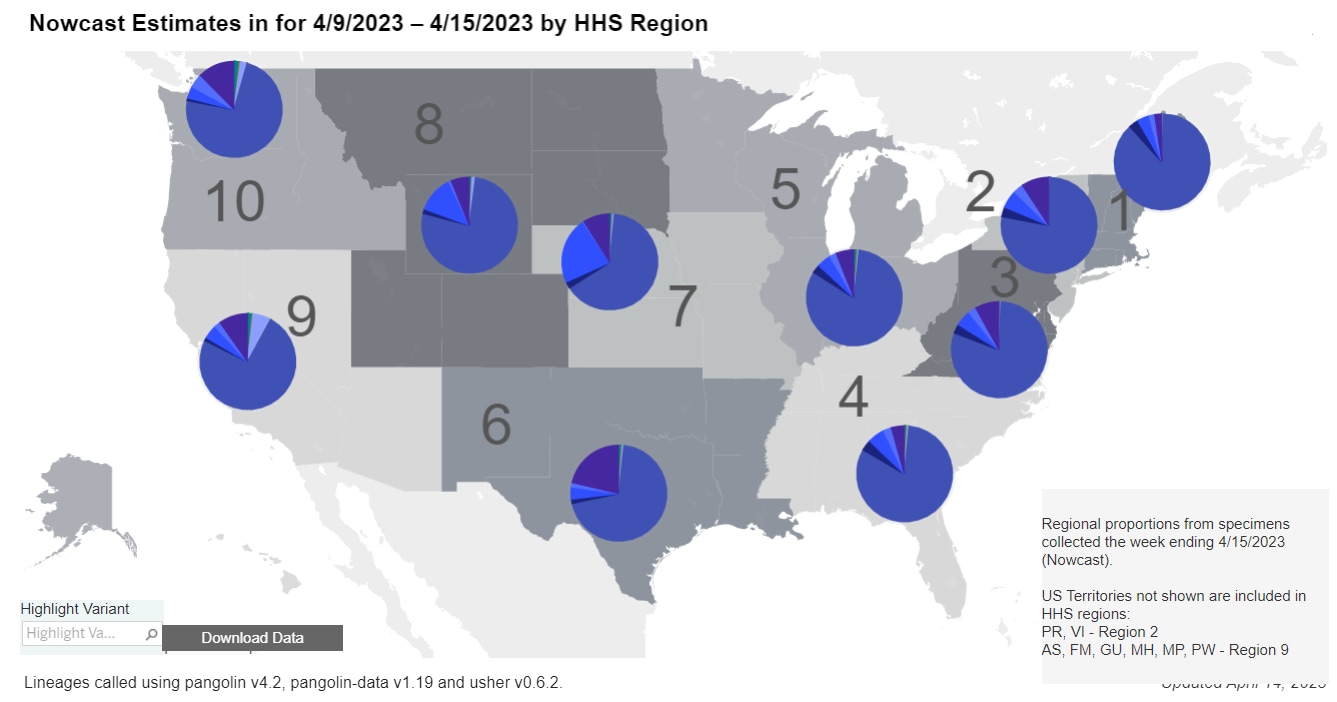
CDC Nowcast projections* for the week ending April 15, 2023, estimate the proportion of these lineages designated as Omicron with estimates above 1%: XBB.1.5, XBB.1.16, XBB.1.9.1, XBB.1.9.2, XBB.1.5.1, FD.2, and BQ.1.1.

XBB.1.5 is projected to be at approximately 78.0% (95% PI 73.6-81.8%).

XBB.1.16, XBB.1.9.1, XBB.1.9.2, XBB.1.5.1, FD.2, and BQ.1.1 are projected to be between 1.0% and 7.2% of circulating lineages.

XBB.1.16, XBB.1.9.1, XBB.1.9.2, and XBB.1.5.1 all have positive growth. XBB.1.5, FD.2, and BQ.1.1 are all decreasing in proportion. All other virus lineages are predicted to have very slow or no change in proportion.

See COVID Data Tracker for the proportions of all relevant lineages currently circulating.

*CDC uses Nowcast projections to predict current variant proportions circulating in the United States. The median time from specimen collection to sequence data reporting is about 3 weeks. As a result, weighted estimates for the most recent few weeks may be unstable or unavailable. View Nowcast estimates on CDC’s COVID Data Tracker website on the Variant Proportions page.

Variant Proportions


View Larger
Vaccinations


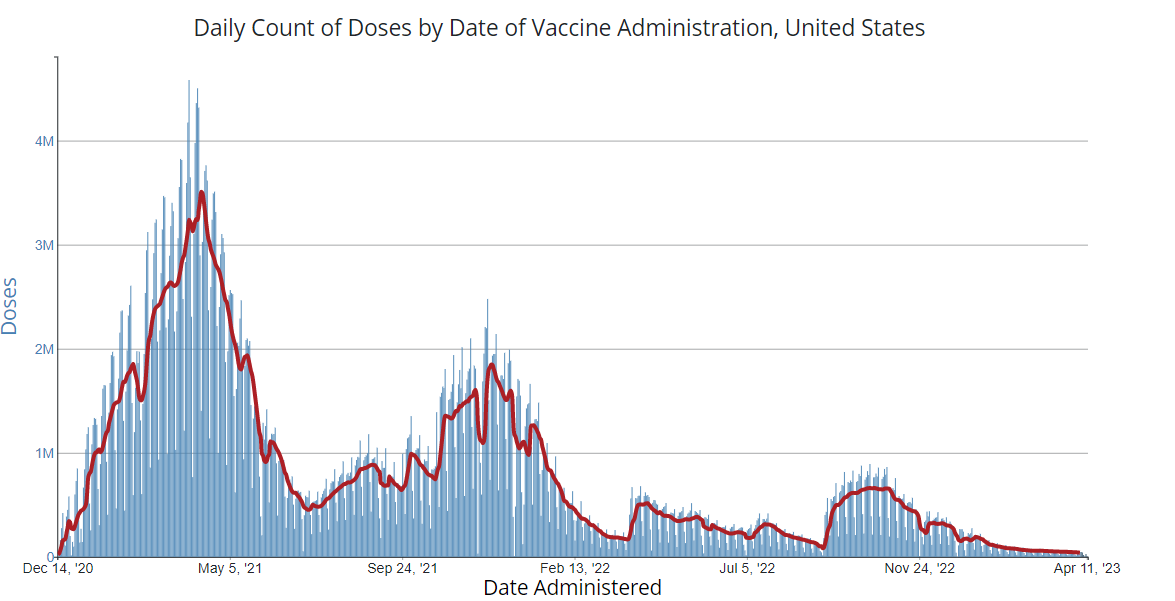
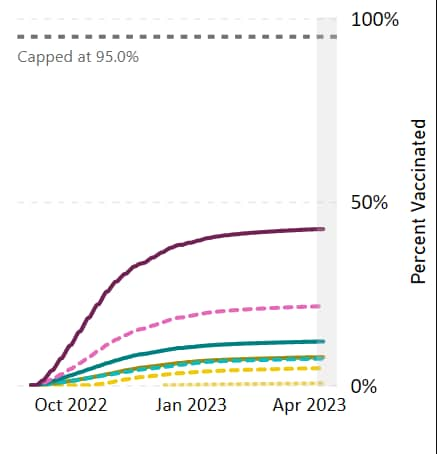
As of April 12, 2023, 674.7 million vaccine doses have been administered in the United States. Overall, about 230.5 million people, or 69.4% of the total U.S. population, have completed a primary series.* About 55.6 million people, or 16.7% of the U.S. population, have received an updated booster dose.

674,711,945
Vaccine Doses Administered

55,818,024
Updated Booster Doses Administered**

230,467,642
People who have completed a primary series* (69.4% of the U.S. population)

55,577,285
People who have received an updated booster (16.5% of the eligible U.S. population)

+0
Percentage point change from last week

+0
Percentage point change from last week

*Represents the number of people who have received the second dose in a two-dose COVID-19 vaccine series (such as the Pfizer-BioNTech, Moderna, or Novavax vaccines) or one dose of the single-shot Johnson & Johnson’s Janssen vaccine.

**The number of updated booster doses administered is larger than the number of people who have received an updated booster because one person may receive more than one booster dose.

Daily Change in the Total Number of Administered COVID-19 Vaccine Doses Reported to CDC by the Date of Administration, United States

7-Day moving average


View Larger
COVID-19 Updated Booster Dose Administration, United States


View Larger
More Vaccination Data
Hospitalizations

New Hospital Admissions


The current 7-day daily average for April 4–11, 2023, was 1,870. This is a 14.6% decrease from the prior 7-day average (2,191) from March 29-April 4, 2023.

6,103,743
Total New Admissions

1,870
Current 7-Day Average

2,191
Prior 7-Day Average

-14.6%
Change in 7-Day Average

The start of consistent reporting of hospital admissions data was August 1, 2020.

Daily Trends in Number of New COVID-19 Hospital Admissions in the United States


View Larger
New admissions are pulled from a 10 am EDT snapshot of the HHS Unified Hospital Data – Analytic Dataset. Due to potential reporting delays, data from the most recent 7 days, as noted in the figure above with the grey bar, should be interpreted with caution. Small shifts in historic data may also occur due to changes in the Centers for Medicare & Medicaid Services (CMS) Provider of Services file, which is used to identify the cohort of included hospitals.

More Hospital Data
COVID-NET: Trends in COVID-19 Hospitalization Rates Among Adults ages 65 Years and Older


CDC’s Coronavirus Disease 2019-Associated Hospitalization Surveillance Network (COVID-NET) shows that since the start of the COVID-19 pandemic, people ages 65 years and older have had the highest rates of hospitalization among all adults. While rates remain highest in this age group, they have generally continued to decrease since late December 2022. Preliminary data show a rate of 16.6 per 100,000 population for the week ending March 25, 2023.

Weekly Rates of COVID-19-Associated Hospitalizations Among Adults and Children (All Ages)


View Larger
The Coronavirus Disease 2019 (COVID-19)-Associate­­d Hospitalization Surveillance Network (COVID-NET), a RESP-NET platform, is an additional source for hospitalization data collected through a network of more than 250 acute-care hospitals in 13 states (representing ~10% of the U.S. population). Detailed data on patient demographics, including race and ethnicity, underlying medical conditions, medical interventions, and clinical outcomes, are collected using a standardized case reporting form.

More COVID-NET Data
Deaths


The current 7-day average of new deaths (190) decreased 25.4% compared with the previous 7-day average (254). As of April 12, 2023, a total of 1,128,404 COVID-19 deaths have been reported in the United States.

1,128,404
Total Deaths Reported

190
Current 7-Day Average*

254
Prior 7-Day Average

-25.4%
Change in 7-Day Average Since Prior Period

*Historical deaths are excluded from the weekly new deaths and 7-day average calculations until they are incorporated into the dataset by their applicable date. Of 4,113 historical deaths reported retroactively, none were reported in the current week and none were reported in the prior week.

Weekly Trends in Number of COVID-19 Deaths in the United States Reported to CDC


View Larger
More Death Data
Testing


The percentage of COVID-19 NAATs (nucleic acid amplification tests)* that are positive is decreasing in comparison to the previous week. The 7-day average of percent positivity from NAATs is now 6.2%. The 7-day average number of tests reported for March 31–April 6, 2023, was 173,079, down 15.9% from 205,834 for the prior 7 days.

1,030,796,107
Total Tests Reported

173,079
7-Day Average Tests Reported

6.2%
7-Day Average % Positivity

6.5%
Previous 7-Day Average % Positivity

+0.23
Percentage point change in 7-Day Average % Positivity since Prior Week

*Test for SARS-CoV-2, the virus that causes COVID-19

COVID-19 NAAT Laboratory Test 7-day Percent Positivity by State/Territory


View Larger
More Testing DataWastewater Surveillance


COVID Data Tracker’s Wastewater Surveillance tab tracks levels, changes, and detections of SARS-CoV-2* viral RNA in wastewater at over 1,400 testing sites across the country.

Currently, about 33% of sites across the country are reporting moderate to high SARS-CoV-2 levels in wastewater. About 8% of sites reporting wastewater data are currently seeing some of the highest levels for those sites since December 1, 2021. About 54% of sites are experiencing a decrease in SARS-CoV-2 levels, and about 39% are reporting an increase.

For more information on how to use wastewater data, visit CDC’s wastewater surveillance website.

*The virus that causes COVID-19

SARS-CoV-2 Levels in Wastewater by Site


View Larger
Wastewater-legend.jpg


0% denotes that levels are the lowest they have been at the site; 100% denotes that levels are the highest they have been at the site.

https://www.cdc.gov/coronavirus/2019-ncov/covid-data/covidview/index.html
 
Covid Tracker Weekly Review
Print
Interpretive Summary for May 12, 2023 Weekly Review, Signing Off

intro - Intro - 05-12-2023
This is the 97th and final issue of the COVID Data Tracker Weekly Review.

Yesterday, May 11, 2023, marked the end of the federal COVID-19 public health emergency (PHE) declaration. This doesn’t mean that COVID-19 is over, but the end of the PHE did initiate a cascade of updates to COVID-19 data collection, reporting, and surveillance. Some surveillance metrics will remain the same, but some will change in terms of reporting frequency, data sources, or availability.

The latest updates to CDC’s COVID Data Tracker reflect these changes. The homepage has a new look, and there are also new landing pages for hospitalizations, emergency department (ED) visits, and death data, as well as visualizations of trends and maps. Several pages have also been retired, but COVID Data Tracker has a page with links to archived data and visualizations.

These are the most notable changes to COVID Data Tracker:
  • Hospital admission rates and the percentage of COVID-19 deaths among all deaths are now the primary surveillance metrics.
  • COVID-19 hospital admission levels replace COVID-19 Community Levels (CCLs) as the main indicator of county trends. COVID-19 hospital admission levels are comparable with CCLs.
  • Provisional death certificate data from the National Vital Statistics System (NVSS) will become the primary source for mortality surveillance, replacing aggregate death counts.
  • Aggregate case and death count reporting has been discontinued.
  • ED visit data will serve as an early indicator of COVID-19 activity.
  • County-level COVID-19 Electronic Laboratory Reporting data on test positivity will no longer be posted because national reporting of negative laboratory results is no longer required.
  • The National Respiratory and Enteric Virus Surveillance System (NREVSS), a voluntary reporting network of more than 450 laboratories, will be the new primary source for regional test positivity data and another early indicator.
Please see two new MMWR reports published May 5, 2023—COVID-19 Surveillance After Expiration of the Public Health Emergency Declaration and Correlations and Timeliness of COVID-19 Surveillance Data Sources and Indicators—for more details about the changes.

The United States has mobilized and sustained a historic response to the COVID-19 pandemic. The past three years have been highly challenging in many ways, but together we have made significant progress to reduce the impact COVID-19 has on the health of people and our communities.

CDC will continue to report and monitor valuable data, like genomic surveillance; wastewater surveillance; vaccination coverage, safety, and effectiveness; and hospital-related outcomes, from sentinel surveillance platforms like COVID-NET. These data will help inform individual and community public health actions to protect those at highest risk of severe COVID-19, such as older adults and people with underlying conditions. People with weakened immune systems should consider taking additional prevention measures, developing a COVID-19 Personal Plan to protect themselves from severe COVID-19, and speaking to their healthcare providers about early antiviral treatment options to prevent severe disease, hospitalization, and death. And everyone, high-risk or not, should stay up to date with COVID-19 vaccines.

In the future, CDC will move toward integrating COVID-19 monitoring within a sustainable respiratory viruses surveillance strategy. CDC displays data for diagnosed or laboratory-confirmed COVID-19, flu, and respiratory syncytial virus (RSV) on the National Syndromic Surveillance Program dashboard (for ED visits) and the RESP-NET dashboard (hospitalizations).

For more information: Fact Sheet: COVID-19 Public Health Emergency Transition Roadmap

What’s New:
Top of Page
Last Updated May 12, 2023​

https://www.cdc.gov/coronavirus/2019-ncov/covid-data/covidview/index.html

 
As of October 6, 2023

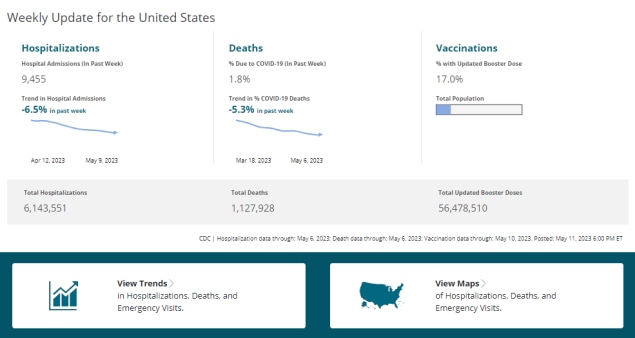
Effective September 29, 2023, weekly updates to maps, charts, and data provided by CDC for COVID Data Tracker will occur on Fridays by 12 p.m. ET. This change aligns with the timing of CDC’s weekly updates for respiratory viruses (https://www.cdc.gov/respiratory-viruses/index.html).​


Trend in % Test Positivity
-1.2% in most recent week


Trend in % Emergency Department Visits
-14.5% in most recent week


Trend in Hospital Admissions
-6% in most recent week

Total Hospitalizations
6,388,647

Trend in % COVID-19 Deaths
+3.8% in most recent week

Total Deaths
1,145,958​


https://covid.cdc.gov/covid-data-tracker/#maps_percent-covid-deaths
 
Back
Top