• FluTrackers.com Inc. does not provide medical advice. Information on this web site is collected from various internet resources, and the FluTrackers board of directors makes no warranty to the safety, efficacy, correctness or completeness of the information posted on this site by any author or poster. The information collated here is for instructional and/or discussion purposes only and is NOT intended to diagnose or treat any disease, illness, or other medical condition. Every individual reader or poster should seek advice from their personal physician/healthcare practitioner before considering or using any interventions that are discussed on this website. By continuing to access this website you agree to consult your personal physican before using any interventions posted on this website, and you agree to hold harmless FluTrackers.com Inc., the board of directors, the members, and all authors and posters for any effects from use of any medication, supplement, vitamin or other substance, device, intervention, etc. mentioned in posts on this website, or other internet venues referenced in posts on this website.
  • We are not asking for any donations. Do not donate to any entity who says they are raising funds for us.

US - CDC: COVID Data Tracker Weekly Review 2021 - 2024 - For trend analysis only

covid-tracker-header-lrg.jpg

Print
Subscribe to the Weekly Review


Interpretive Summary for April 29, 2022
Up to Date, Feeling Great

resize iconView Larger
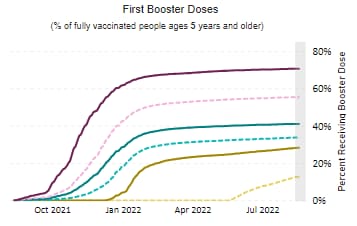
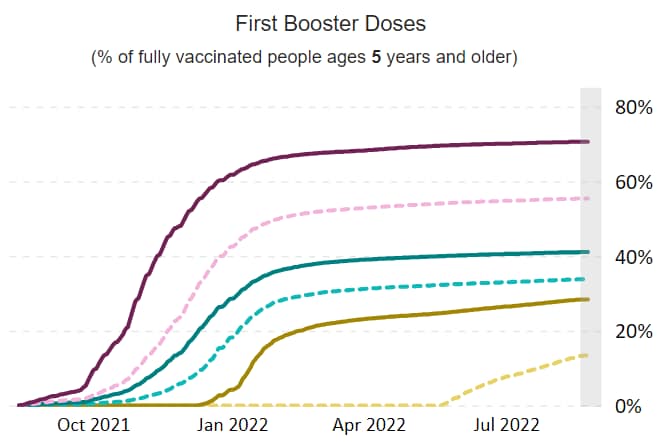
This week, the U.S. COVID-19 Vaccination Program marks two milestones: 500 days since the first COVID-19 vaccine was approved for use in the United States, and 100 million first booster doses administered. While 100 million boosters is certainly something to celebrate, the fact remains that half of those eligible for a COVID-19 booster shot—about 91 million people—have not yet received one. Staying up to date with COVID-19 vaccines, including recommended boosters, is the safest way to protect against severe outcomes from COVID-19.

Vaccines increase our protection against COVID-19, even for those with a previous COVID-19 infection. A new CDC study shows that the record number of infections during the Omicron wave gave many Americans infection-induced immunity. Between December 2021 and February 2022, the estimated percentage of the U.S. population with infection-induced antibodies increased from 34% to 58% across all age groups. The largest increases were in children and adolescents.

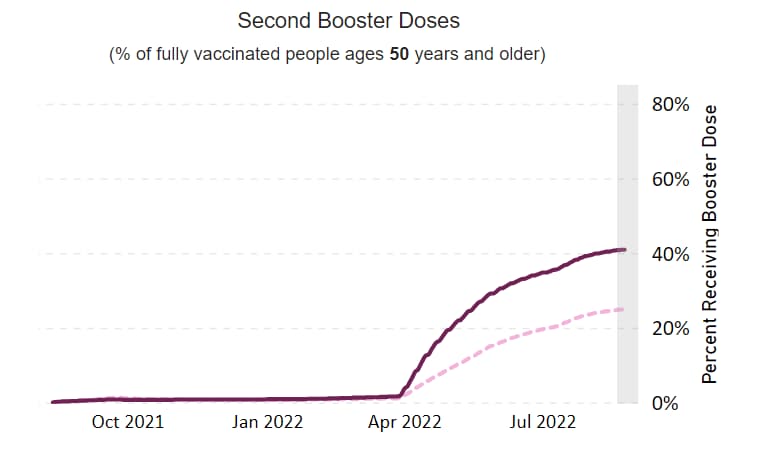
Reinfections can occur. Everyone should stay up to date with recommended COVID-19 vaccinations, including boosters for those who are eligible. In the United States, this means a primary series for everyone ages 5 years and older and a booster for everyone ages 12 years and older. Some peoplepdf icon are also eligible to receive a second booster. Getting a COVID-19 vaccine is fast, easy, and free. Find a vaccine near you.


What's New

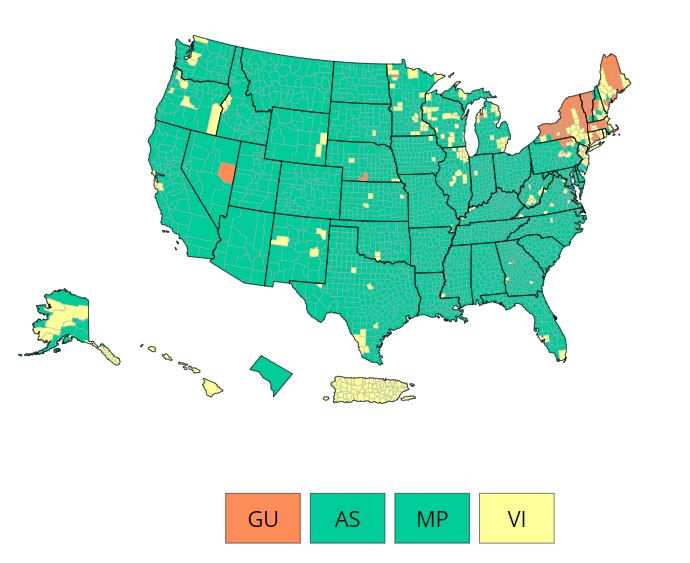
COVID-19 Community Levels


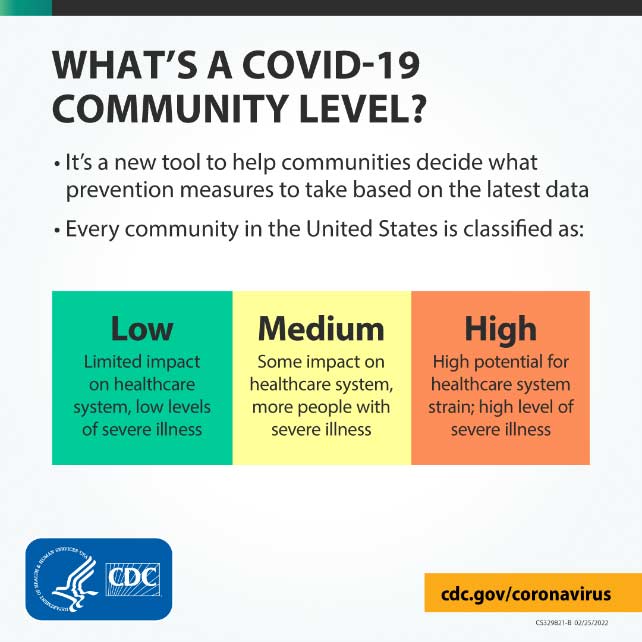
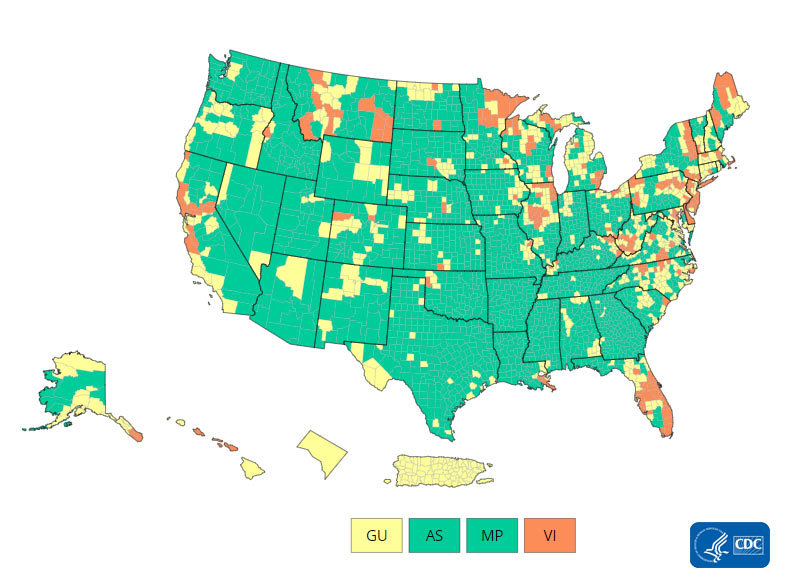
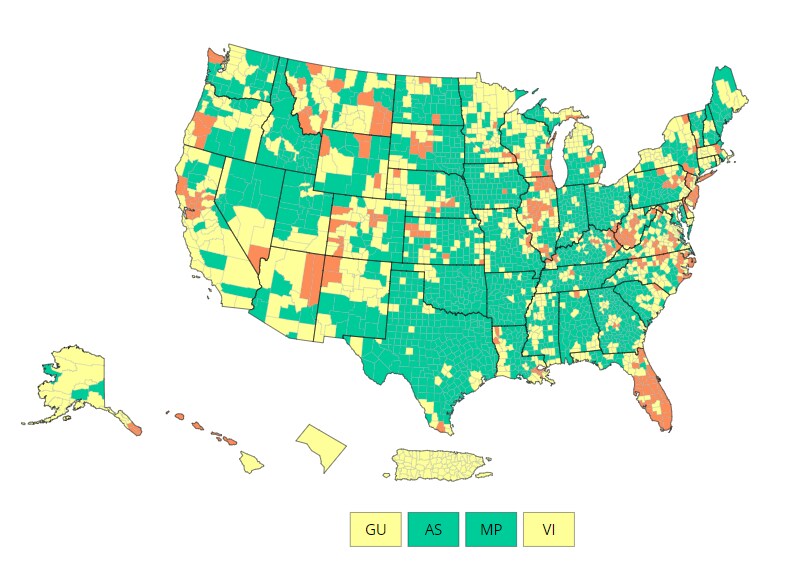
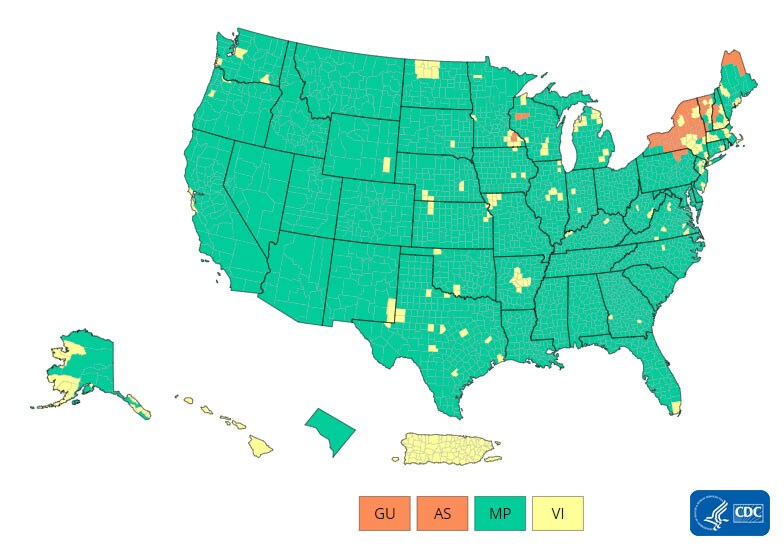
On February 25, 2022, CDC updated the way it monitors COVID-19’s impact on our communities. Widespread availability of vaccines and testing, advances in treatments, and increasing levels of immunity in the population through vaccination or previous infection have moved the COVID-19 pandemic to a new phase. While we can’t prevent all cases of COVID-19, we can continue to limit the spread and protect those who are most at risk of severe illness.

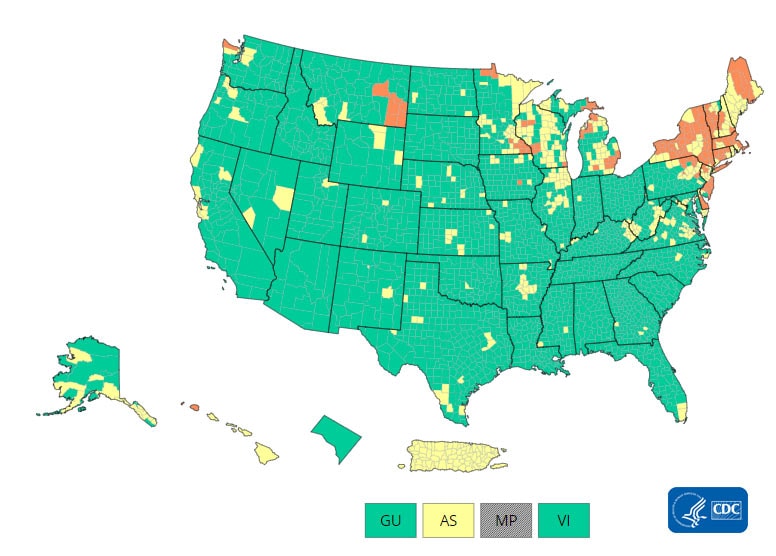
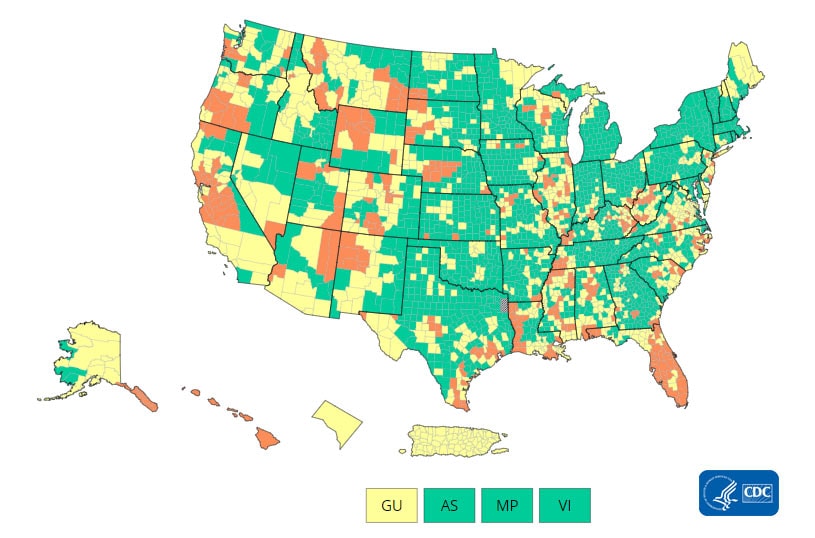
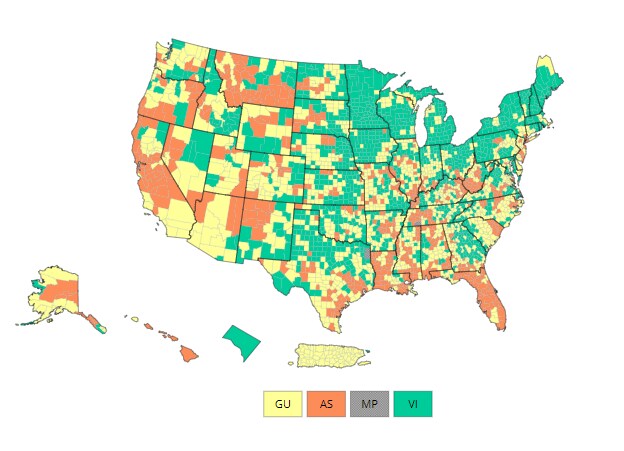
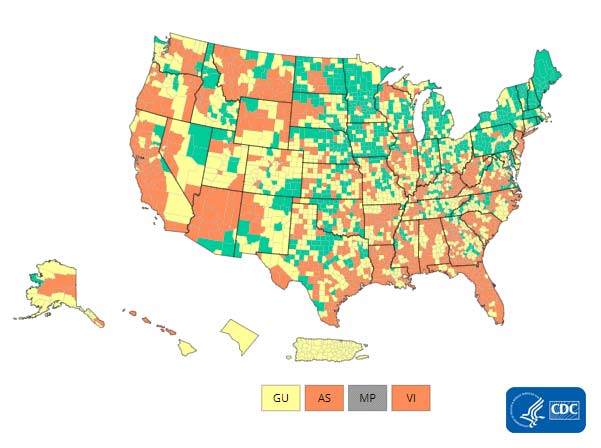
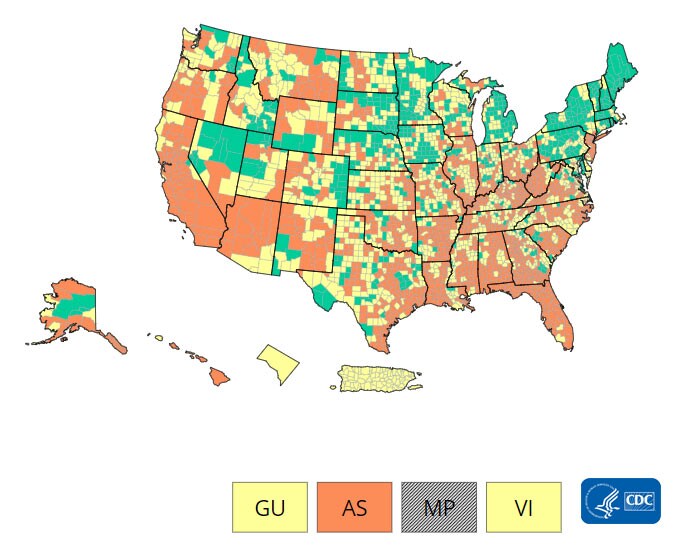
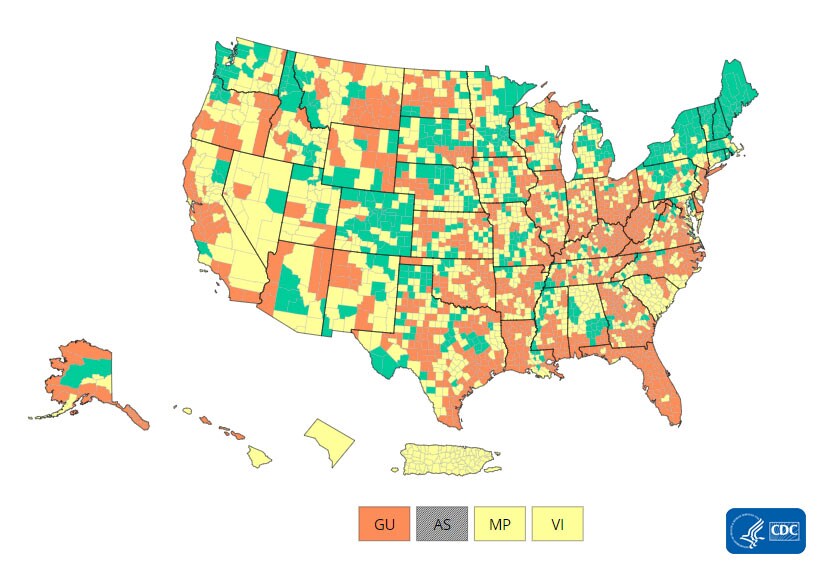
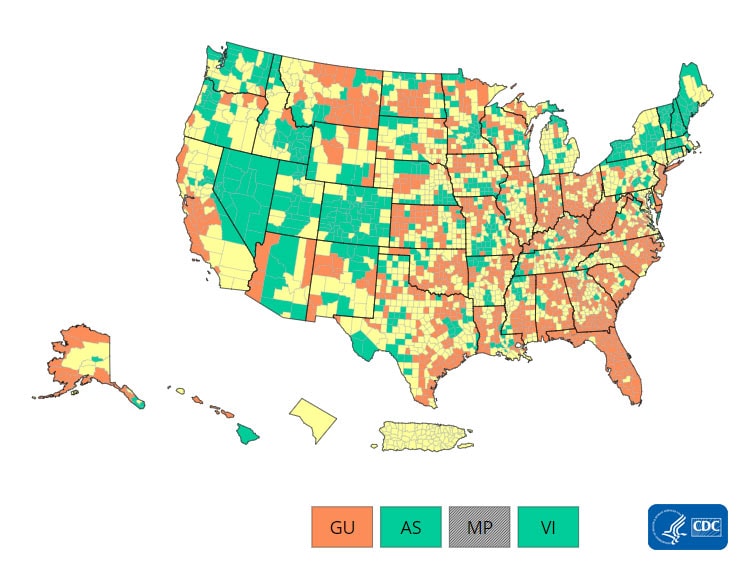
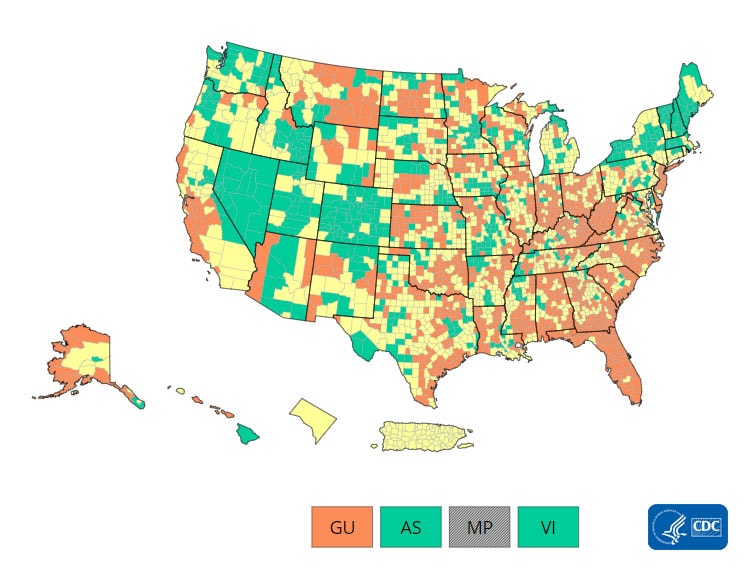
Currently, there are 54 (1.68%) counties, districts, or territories with a high COVID-19 Community Level, 256 (7.95%) counties with a medium Community Level, and 2,910 (90.37%) counties with a low Community Level. This represents a slight (0.59%) increase in the number of high-level counties, a small (+1.43%) increase in the number of medium-level counties, and a corresponding (−2.02%) decrease in the number of low-level counties. Seventeen (30.36%) of 56 jurisdictions had no high- or medium-level counties this week.

To check your COVID-19 community level, visit COVID Data Tracker.

U.S. COVID-19 Community Levels by County
resize iconView Larger

COVID19-Community-Levels_2_04012022.jpg

COVID-19 Community Levels

Reported Cases


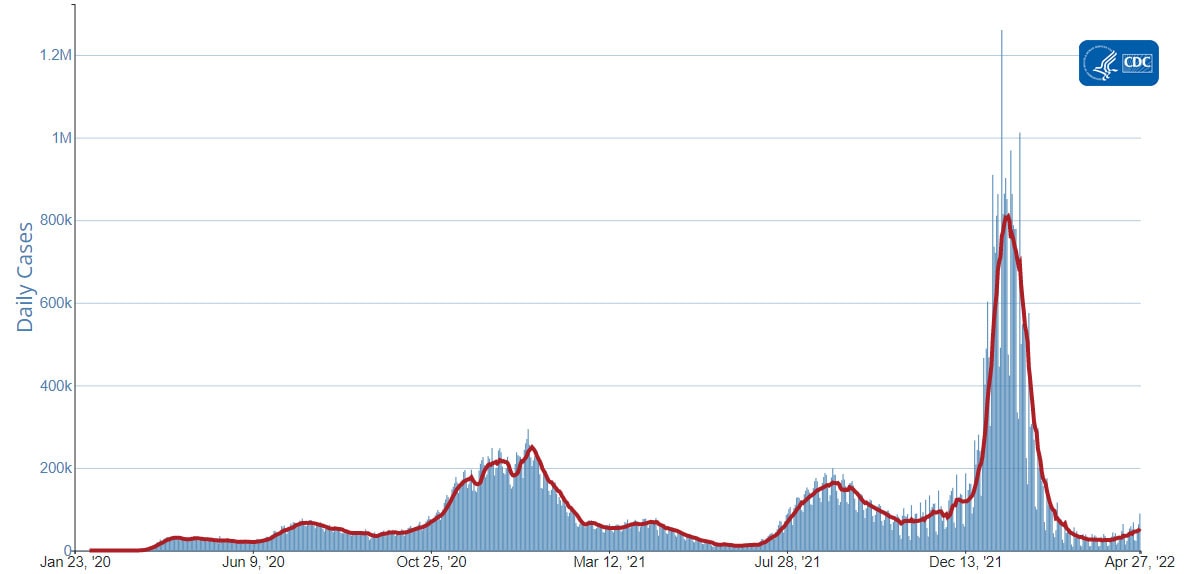
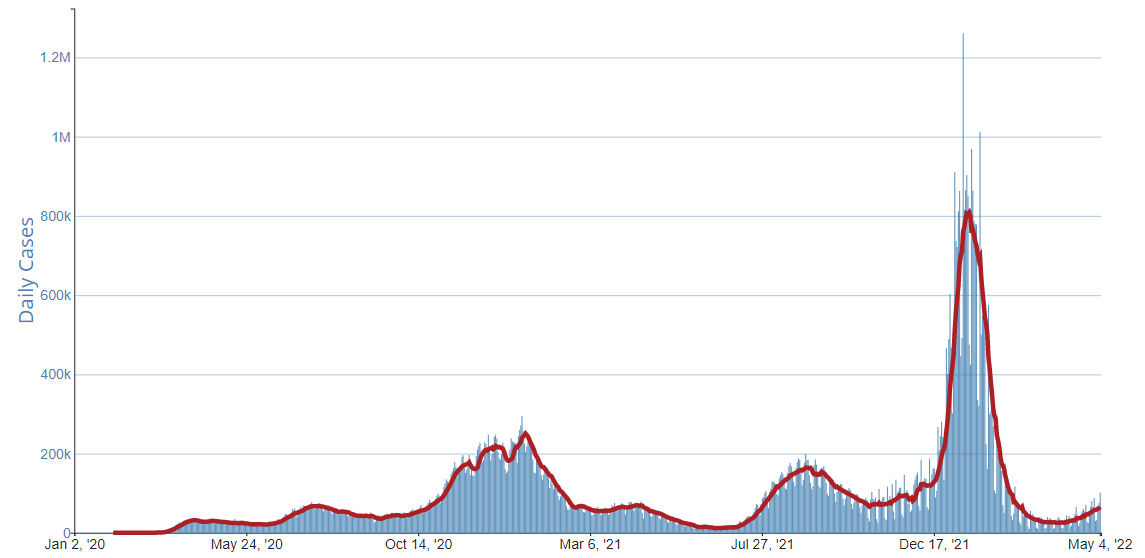
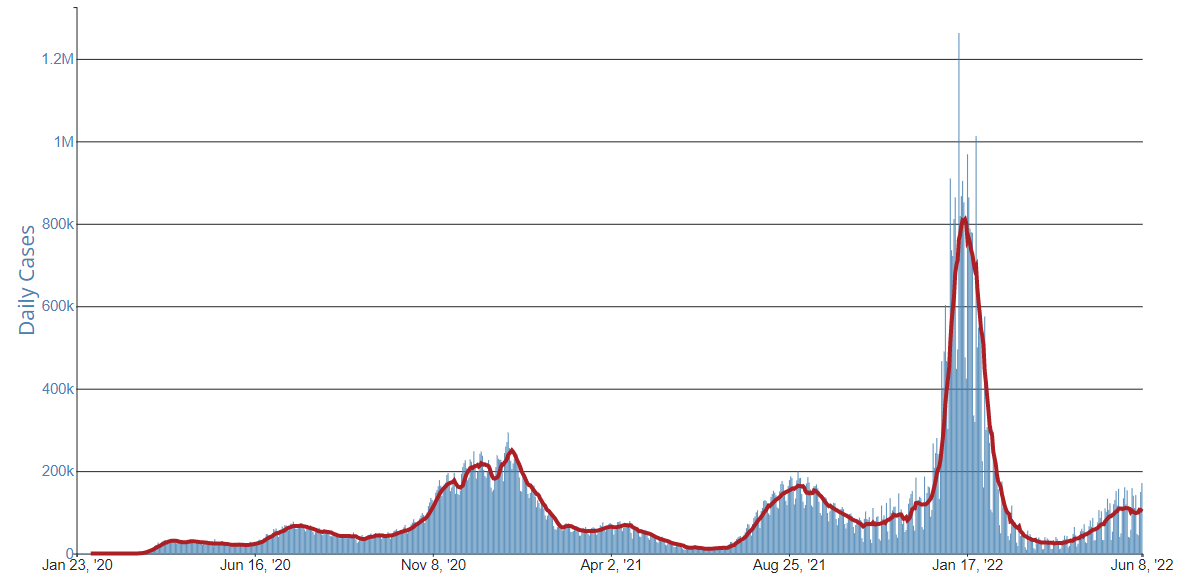
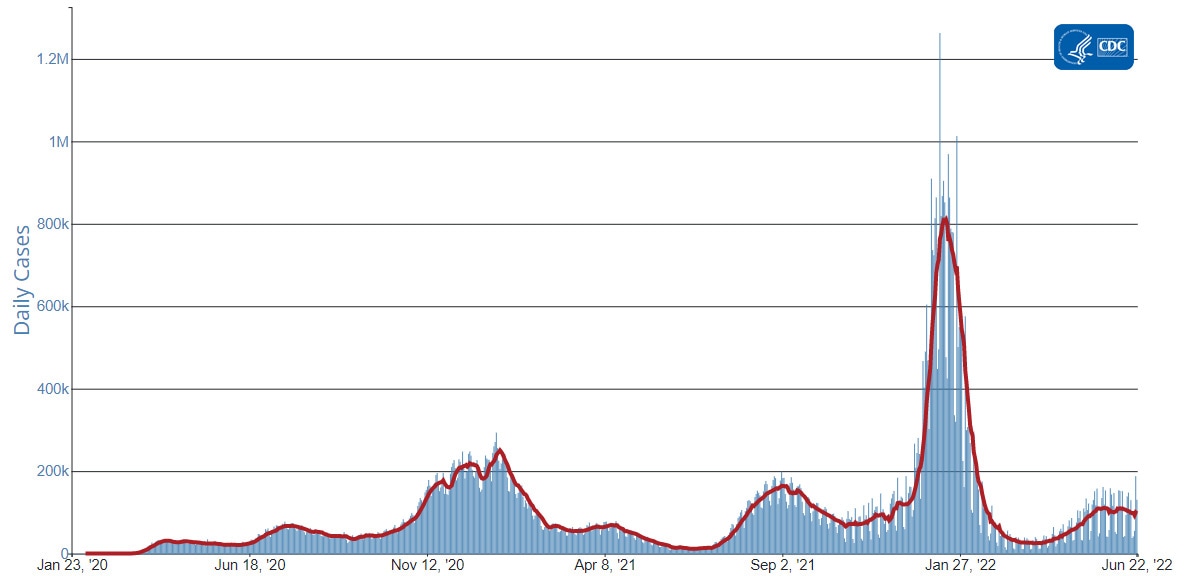
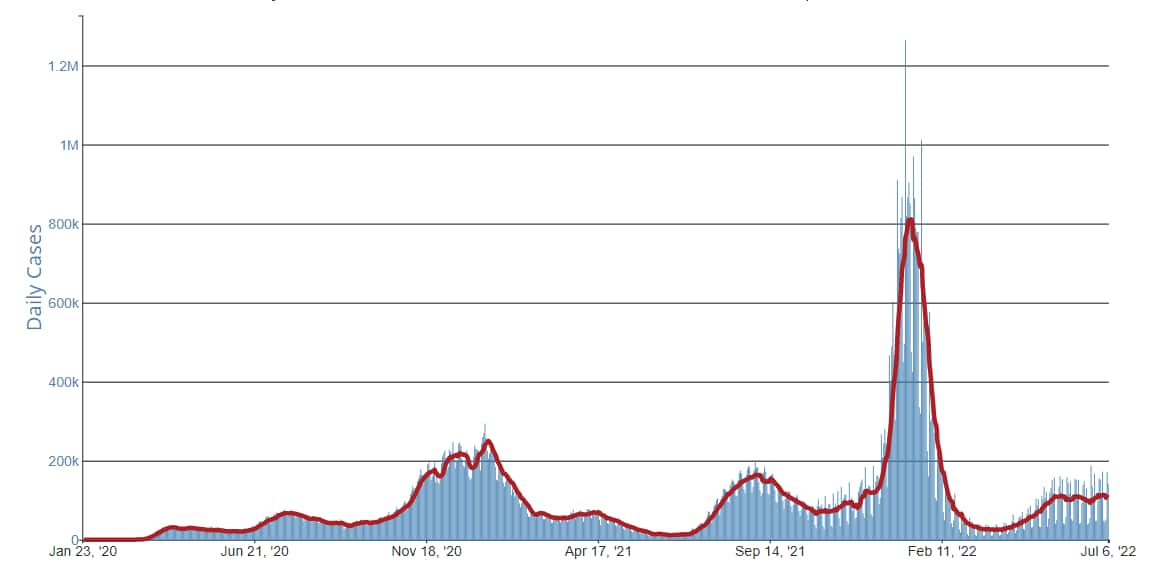
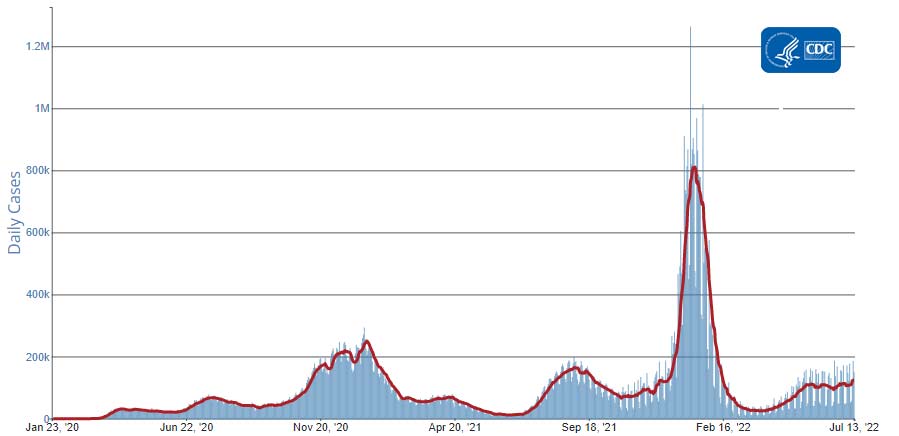
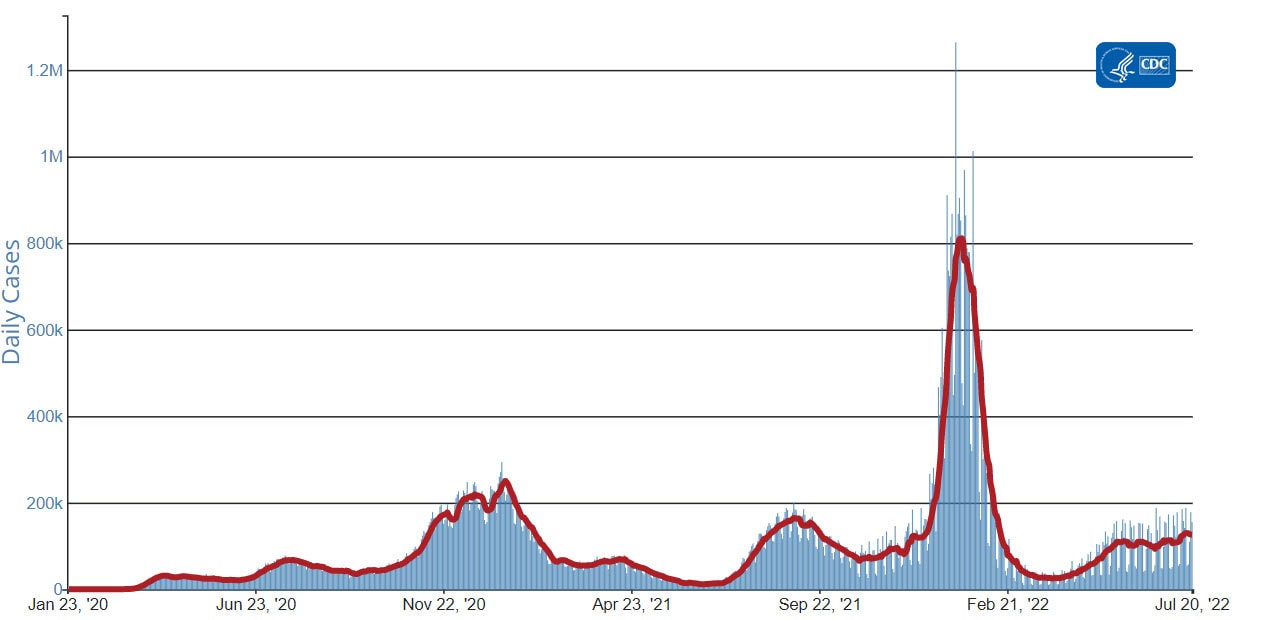
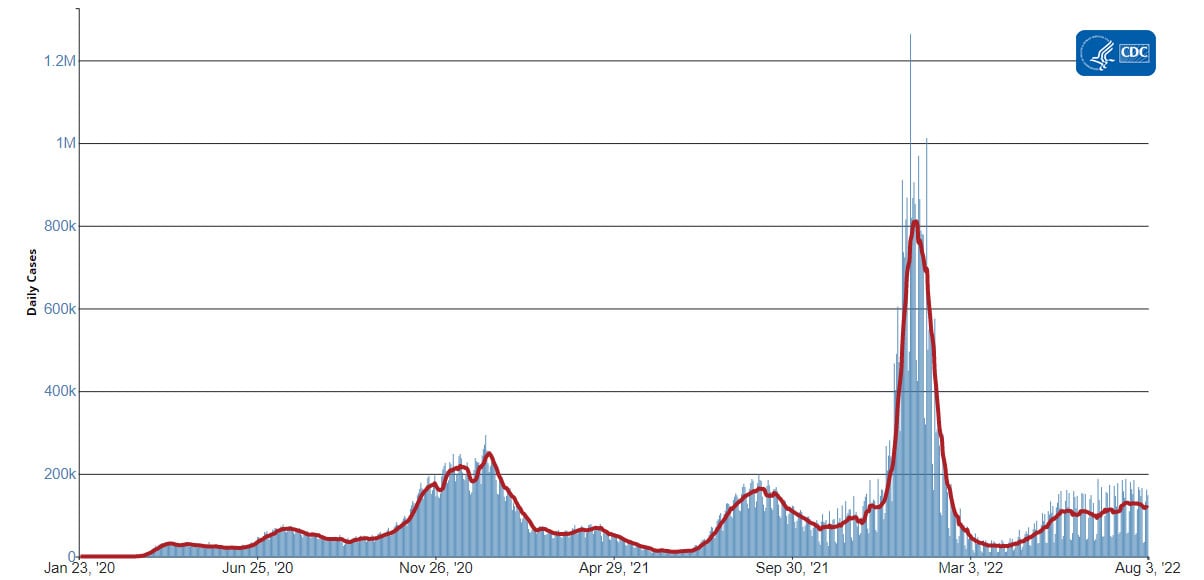
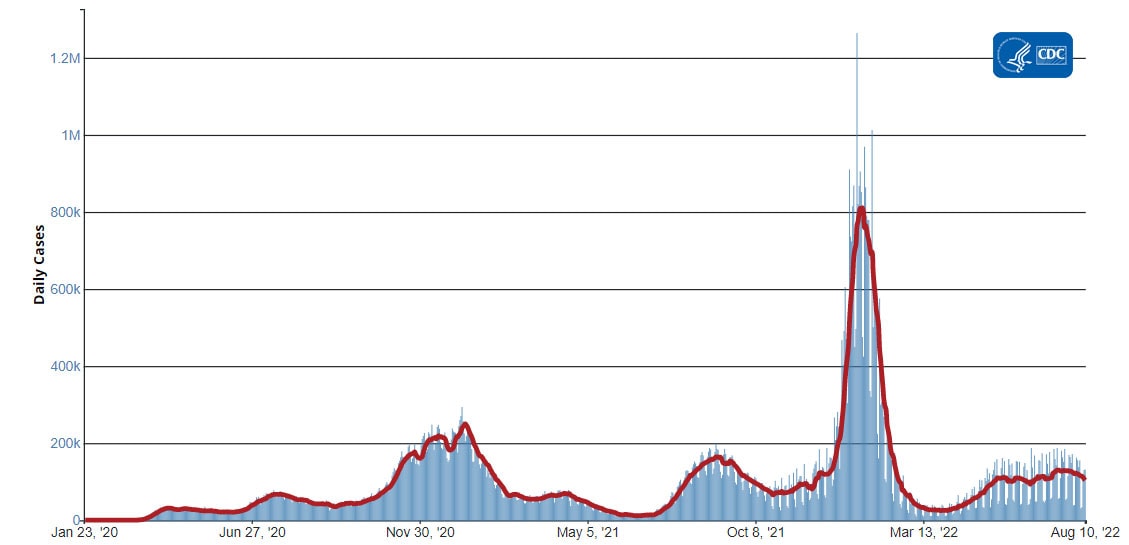
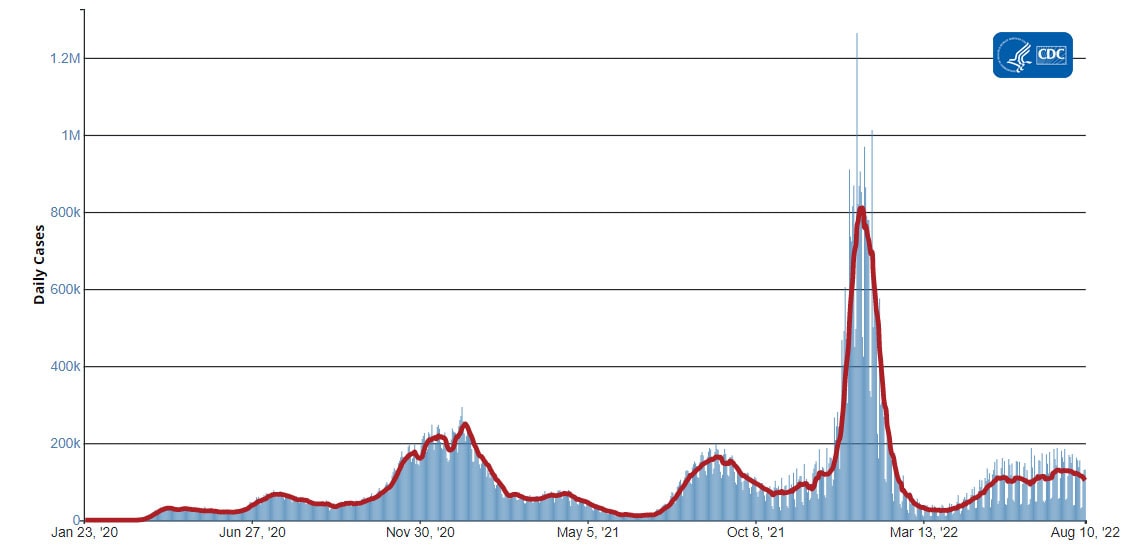
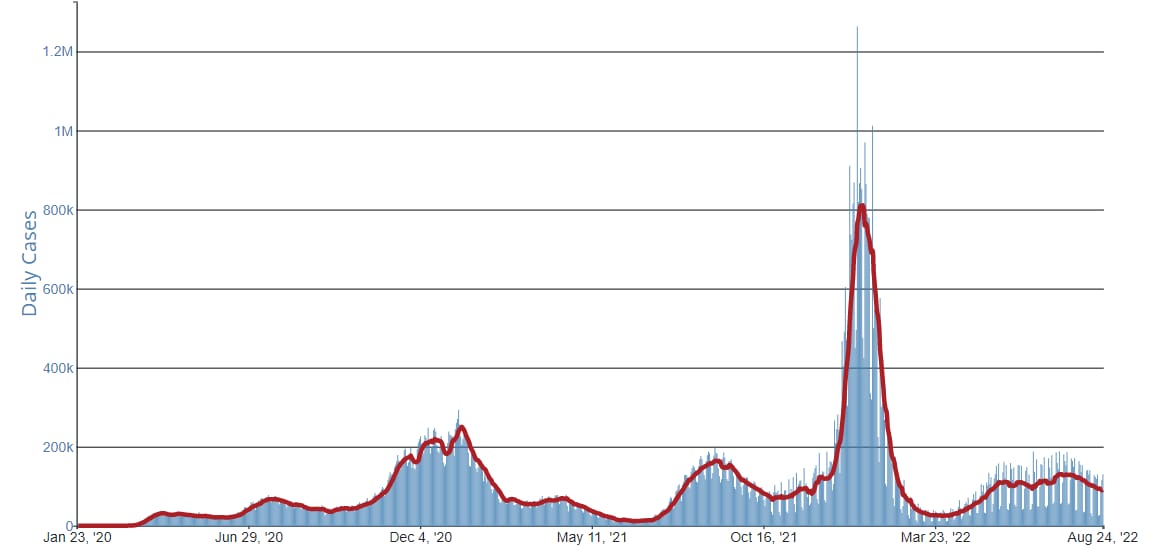
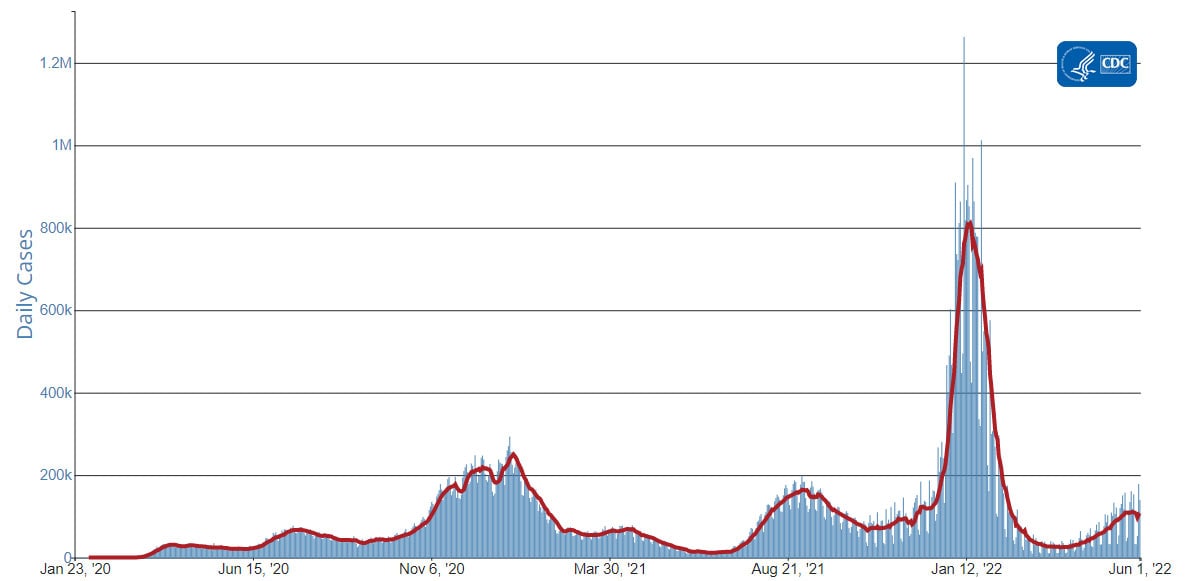
As of April 27, 2022, the current 7-day moving average of daily new cases (53,133) increased 25.2% compared with the previous 7-day moving average (42,427). A total of 81,028,797 COVID-19 cases have been reported in the United States as of April 27, 2022.

CDC Nowcast projections* for the week ending April 23, 2022, estimate the combined national proportion of lineages designated as Omicron to be 100%. There are several lineages of Omicron: B.1.1.529, BA.1, BA.2, BA.3, BA.4 and BA.5 and within each lineage are multiple sublineages. COVID Data Tracker shows the proportions of Omicron lineages grouped as follows: the B.1.1.529 lineage (includes BA.1, BA.3, BA.4 and BA.5), the BA.1.1** lineage, the BA.2 lineage, and the BA.2.12.1 lineage. The predominant Omicron lineage in the United States is BA.2. The national proportion of BA.2 is projected to be 68.5% (95% PI 61.8-74.5%). The national proportion of BA.2.12.1 is projected to be 28.2% (95% PI 21.9-35.4%). BA.1.1 is projected to be 2.8% (95% PI 2.4-3.4%) and B.1.1.529 (BA.1, BA.3, BA.4 and BA.5) is projected to be 0.2% (95% PI 0.1-0.3%). Omicron is predicted to be 100% in all HHS regions.

81,028,797
Total Cases Reported

53,133
Current 7-Day Average***

42,427
Prior 7-Day Average

25.2%
Change in 7-Day Average since Prior Week

*The median time from specimen collection to sequence data reporting is about 3 weeks. As a result, weighted estimates for the most recent few weeks may be unstable or unavailable. CDC’s Nowcast is a data projection tool that helps fill this gap by generating timely estimates of variant proportions for variants that are circulating in the United States. View Nowcast estimates on CDC’s COVID Data Tracker website on the Variant Proportions page.

**For national data, the proportion of BA.1.1 is shown separately. For regional data, the proportion of BA.1.1 is also aggregated with B.1.1.529.

***Historical cases are excluded from daily new cases and 7-day average calculations until they are incorporated into the dataset for the applicable date. Of 519,862 historical cases reported retroactively, 3,033 were reported in the current week and 559 were reported in the prior week.

Daily Trends in COVID-19 Cases in the United States Reported to CDC
red-line.jpg

7-Day moving average

resize iconView Larger
More Case Data

Vaccinations


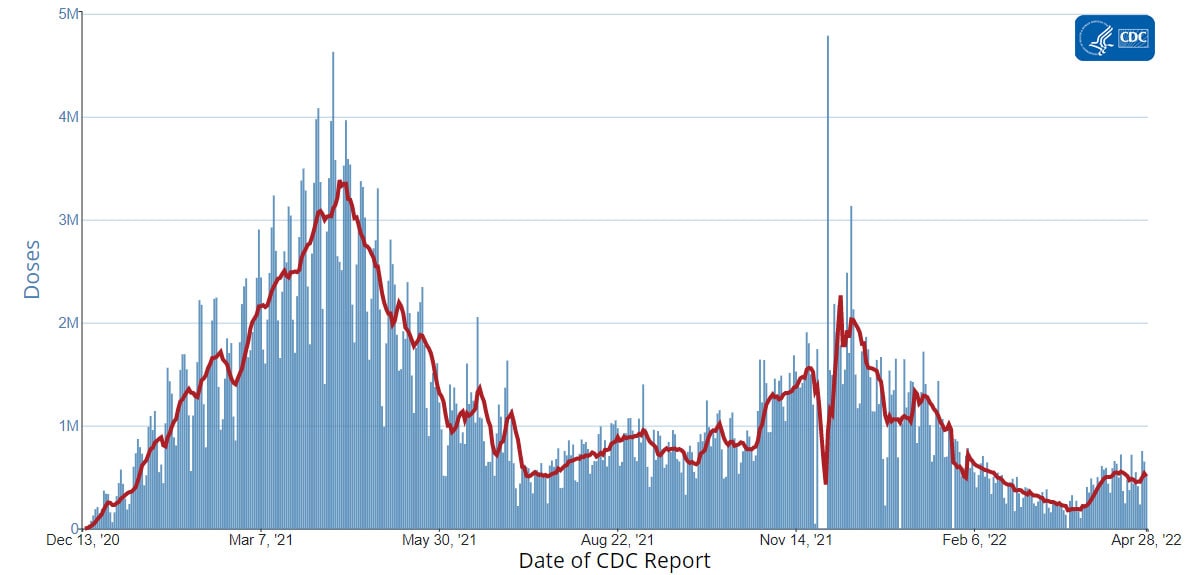
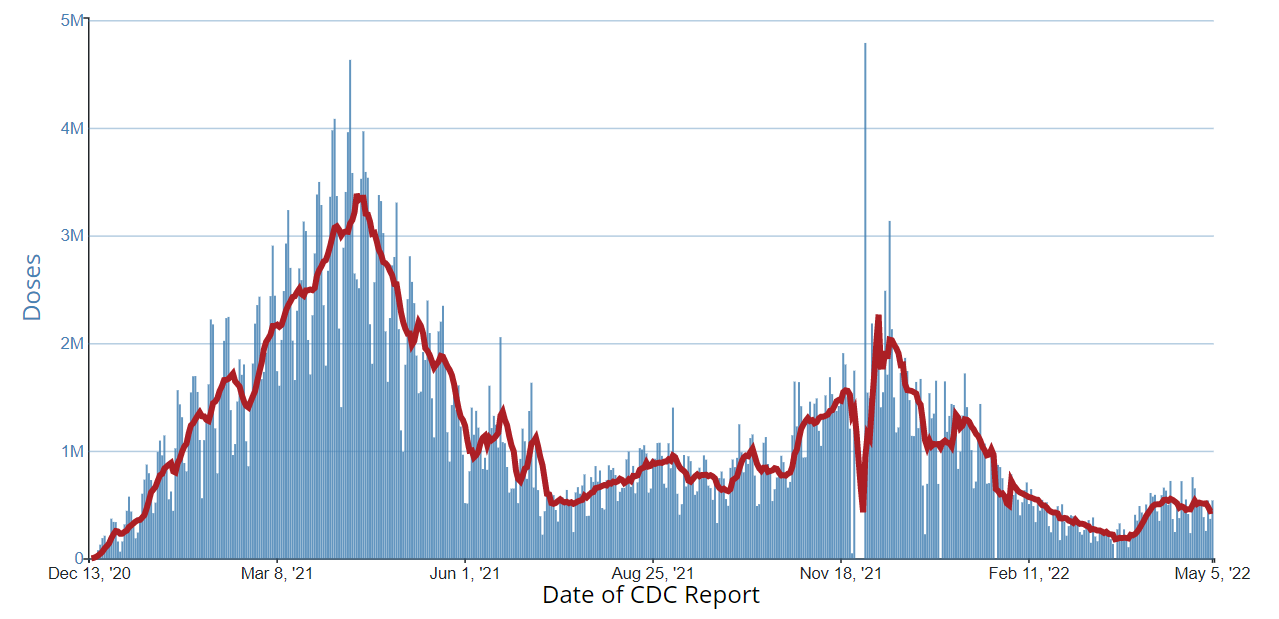
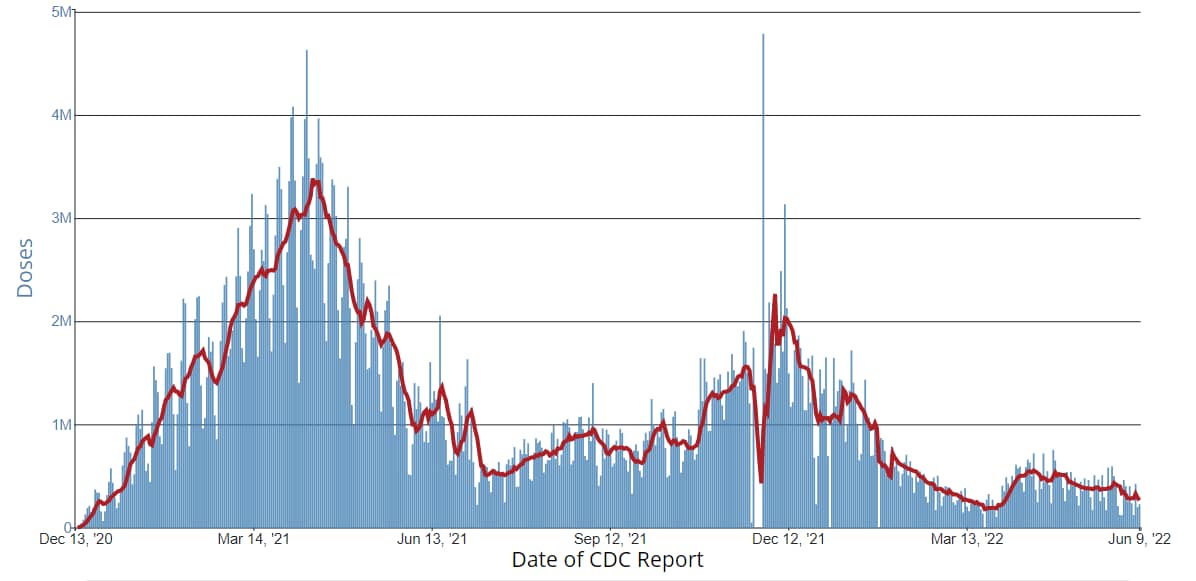
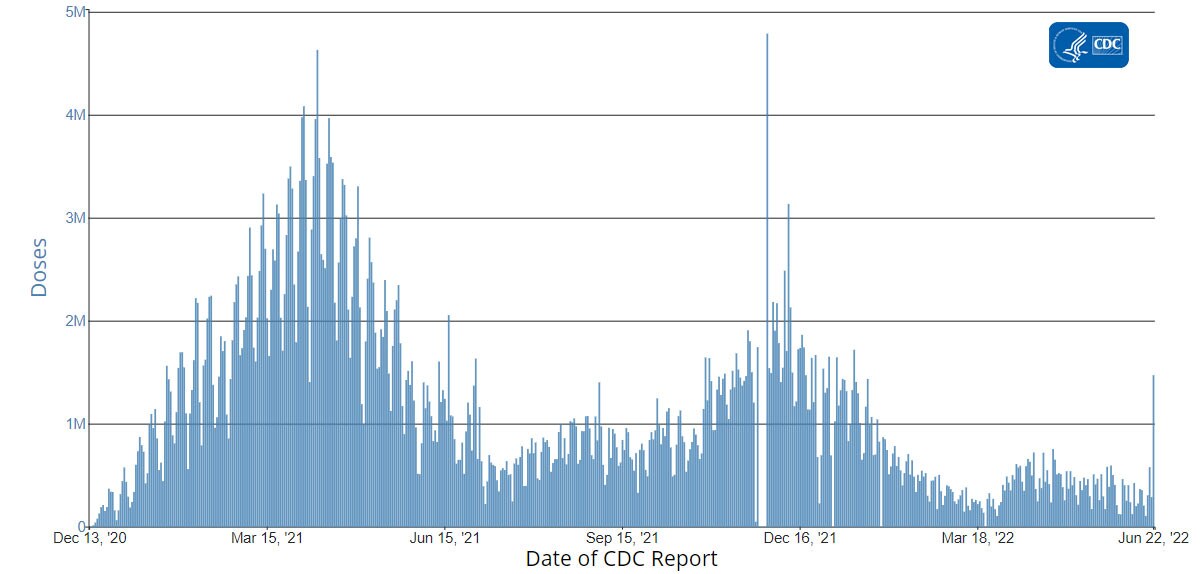
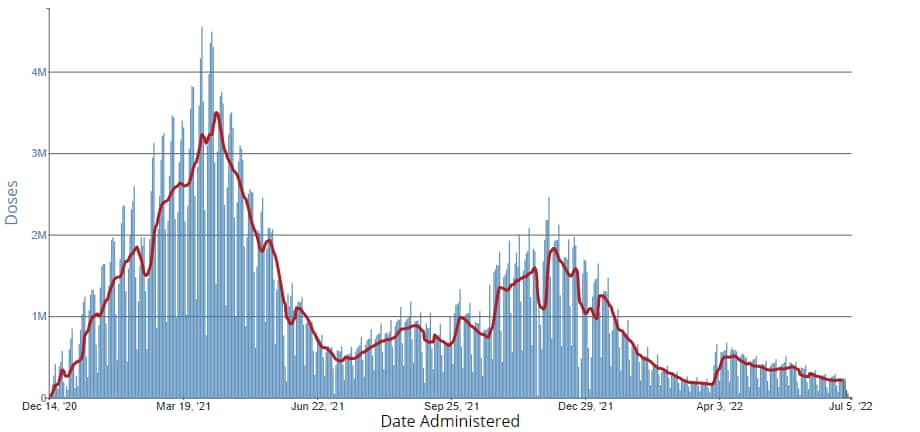
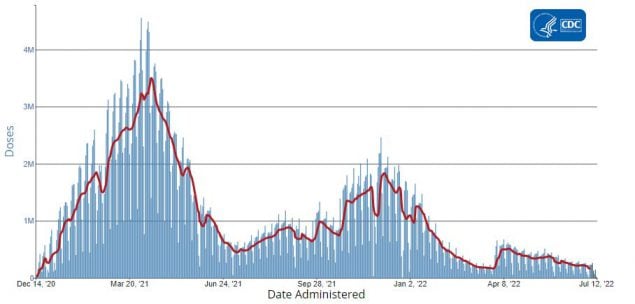
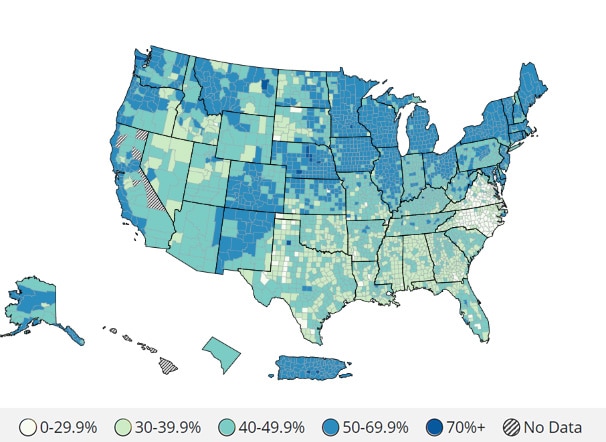
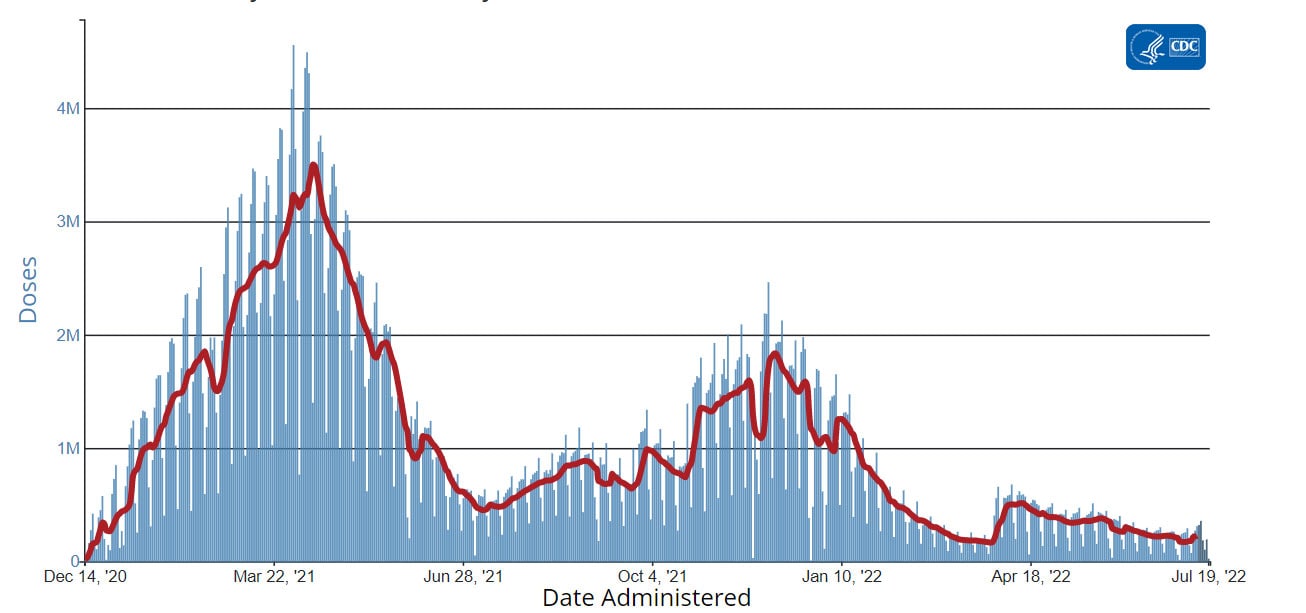
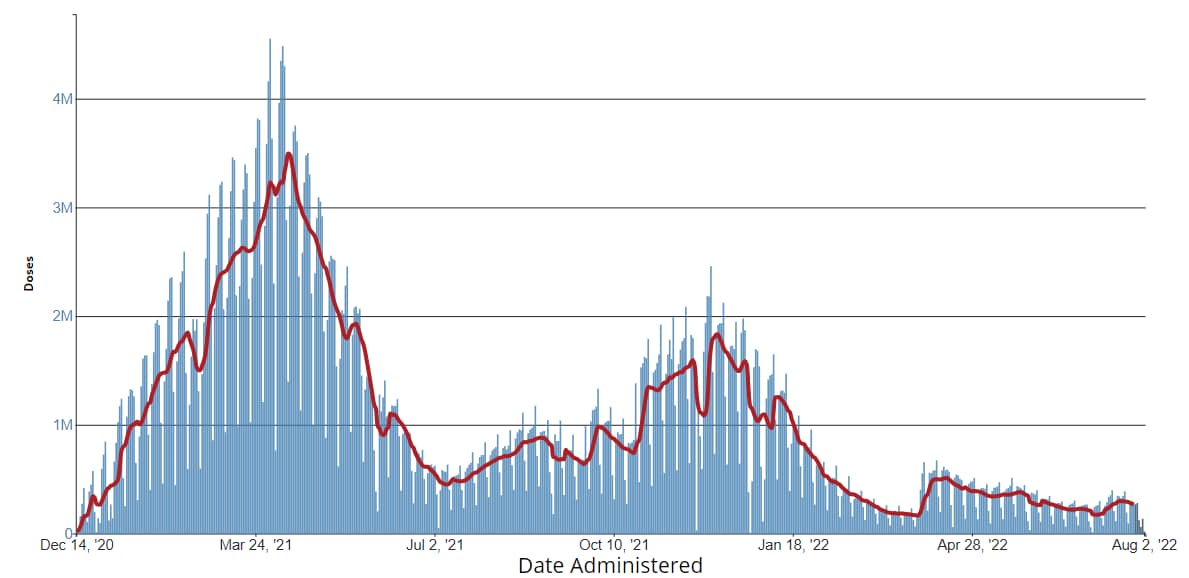
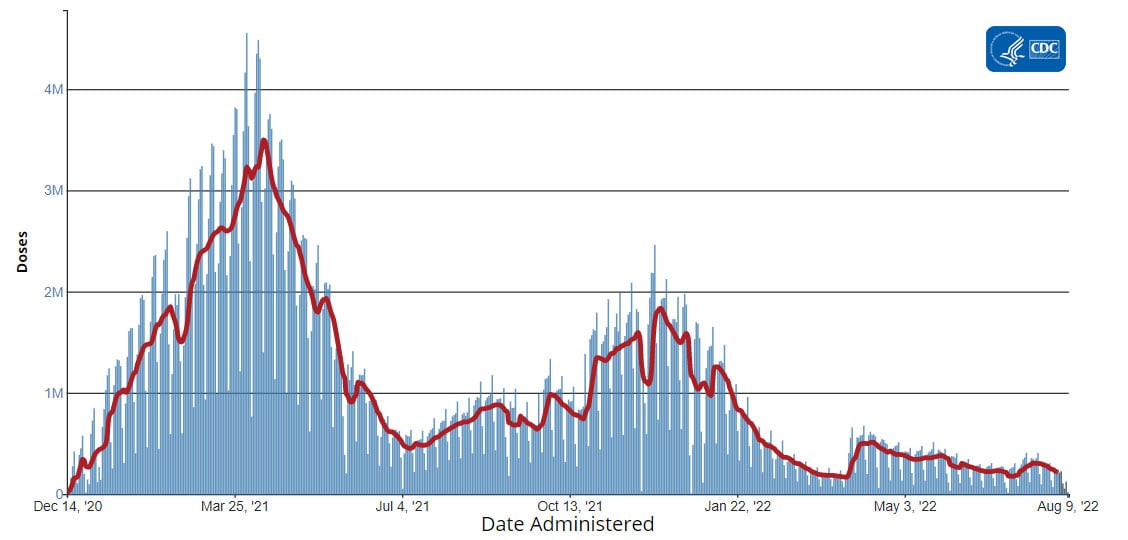
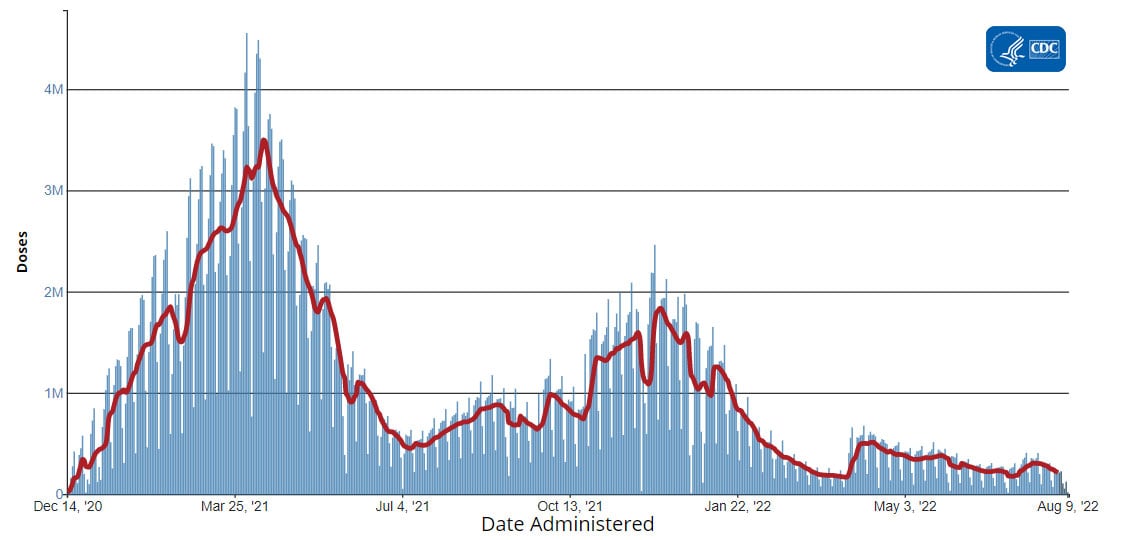
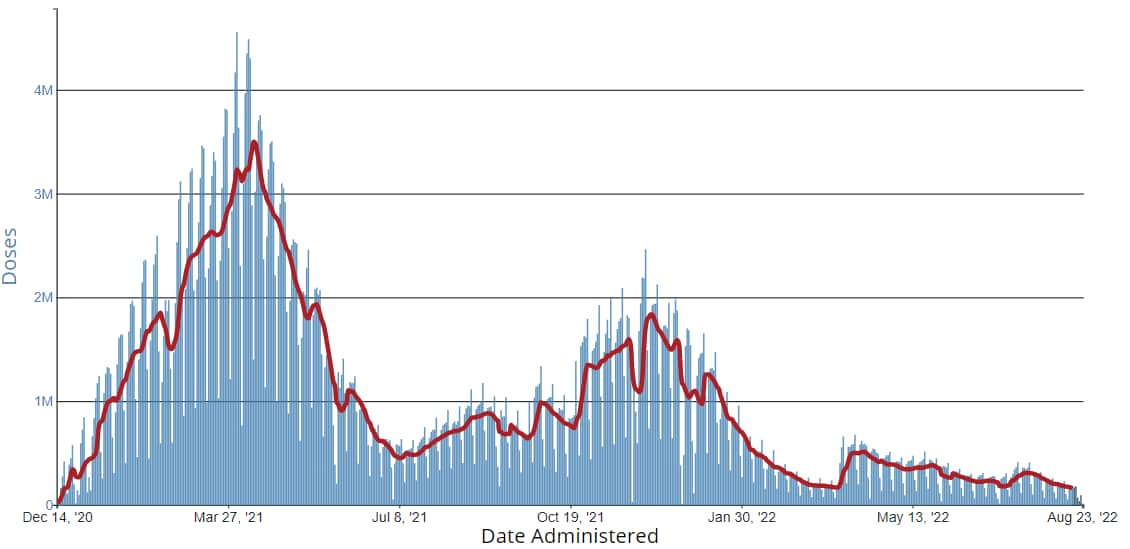
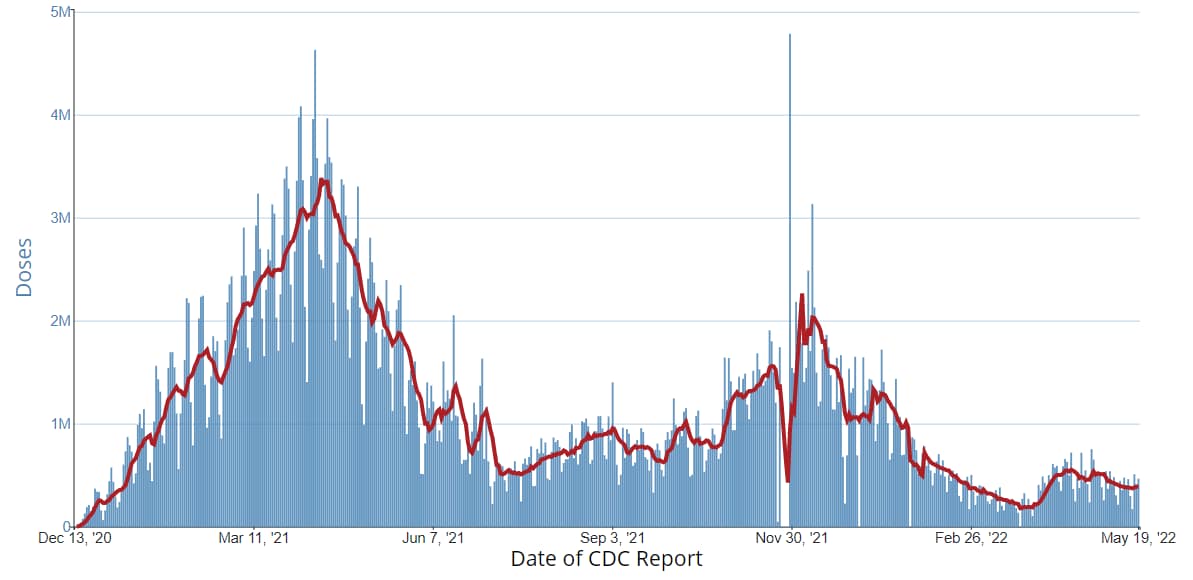
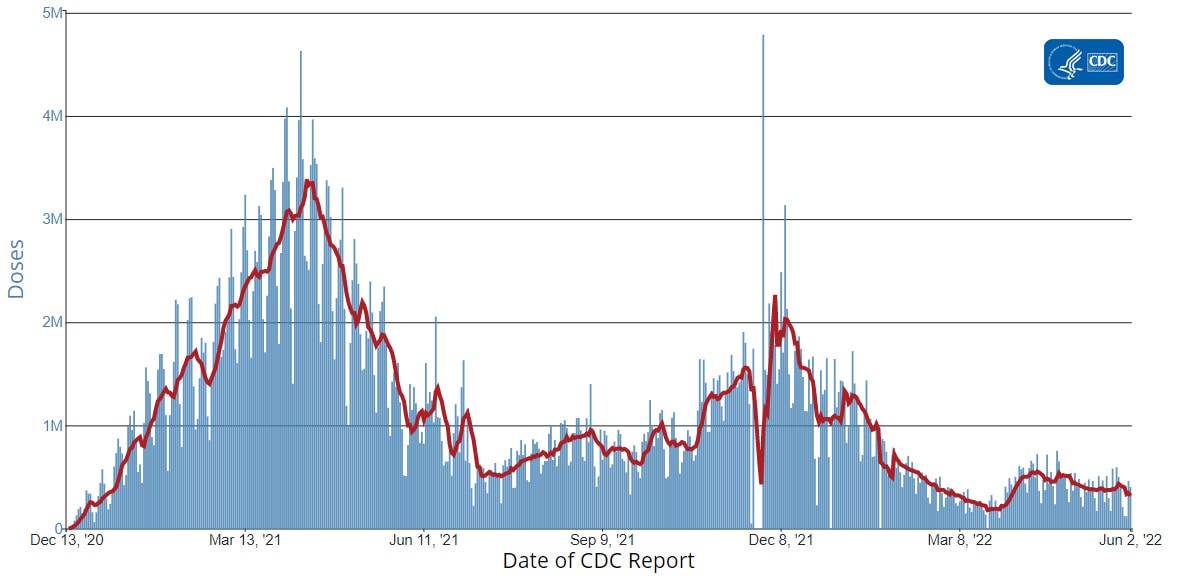
The U.S. COVID-19 Vaccination Program began December 14, 2020. As of April 27, 2022, 574.2 million vaccine doses have been administered in the United States. Overall, about 257.4 million people, or 77.5% of the total U.S. population, have received at least one dose of vaccine. About 219.5 million people, or 66.1% of the total U.S. population, have been fully vaccinated.* Of those fully vaccinated, about 100.3 million people have received a booster dose,** but 49.5% of the total booster-eligible population has not yet received a booster dose. As of April 27, 2022, the 7-day average number of administered vaccine doses reported (by date of CDC report) to CDC per day was 535,362, a 13.7% increase from the previous week.

CDC’s COVID Data Tracker displays vaccination trends by age group, race/ethnicity, and urban/rural status. To see trends by age group and race/ethnicity, visit the Vaccination Demographic Trends tab. To see trends by urban/rural status, visit the COVID-19 Vaccination Equity tab.

574,232,736
Vaccine Doses Administered

257,423,254
People who received at least one dose

219,483,386
People who are fully vaccinated*

77.5%
Percentage of the U.S. population that has received at least one dose

66.1%
Percentage of the U.S. population that has been fully vaccinated*

+0.1
Percentage point increase from last week

+0.1
Percentage point increase from last week

*Represents the number of people who have received the second dose in a two-dose COVID-19 vaccine series (such as the Pfizer-BioNTech or Moderna vaccines) or one dose of the single-shot Johnson & Johnson’s Janssen vaccine.

**Represents the number of people who are fully vaccinated and have received another dose of COVID-19 vaccine since August 13, 2021. This includes people who received their first additional dose or booster dose.

Daily Change in the Total Number of Administered COVID-19 Vaccine Doses Reported to CDC by the Date of CDC Report, United States
red-line.jpg

7-Day moving average

resize iconView Larger
More Vaccination Data

Hospitalizations

New Hospital Admissions


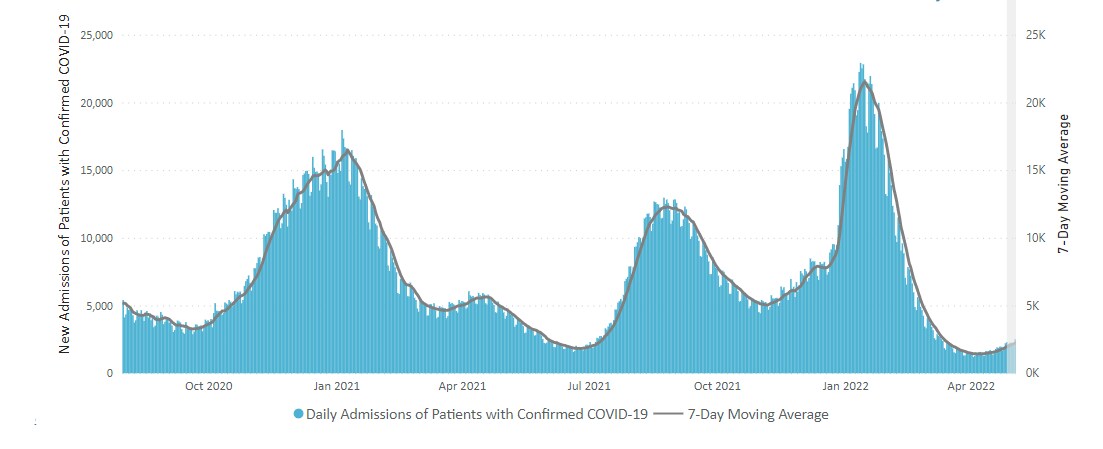
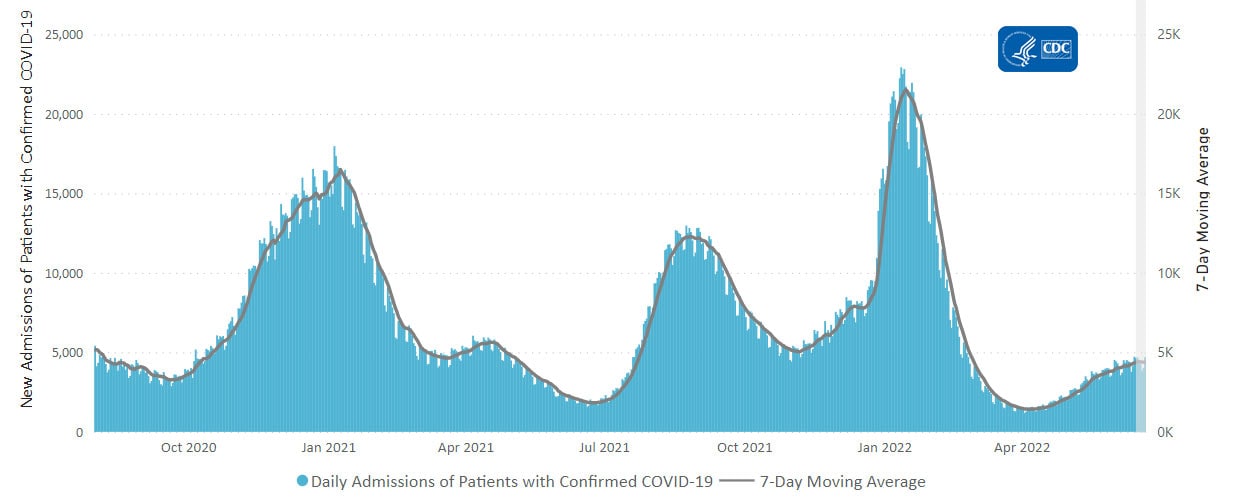
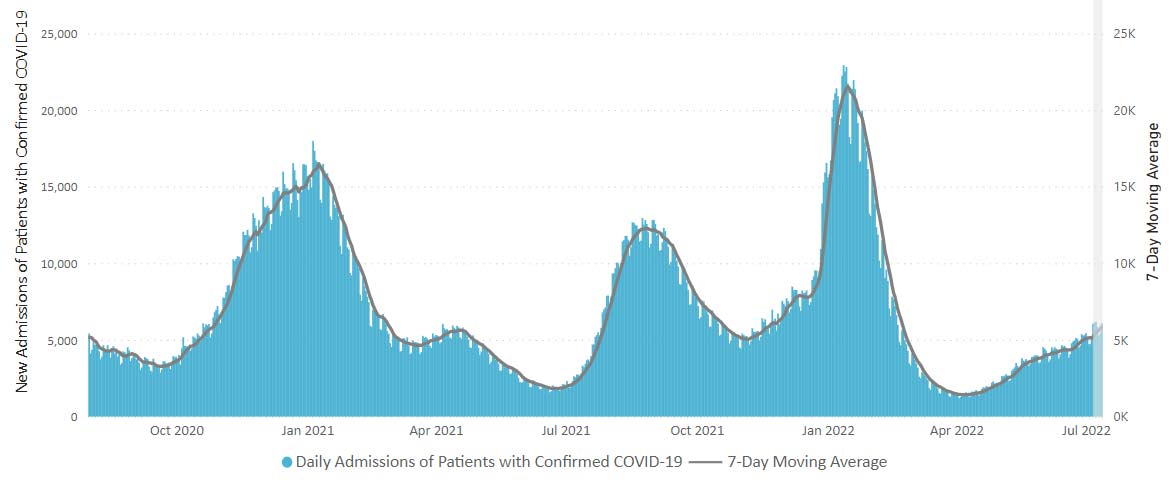
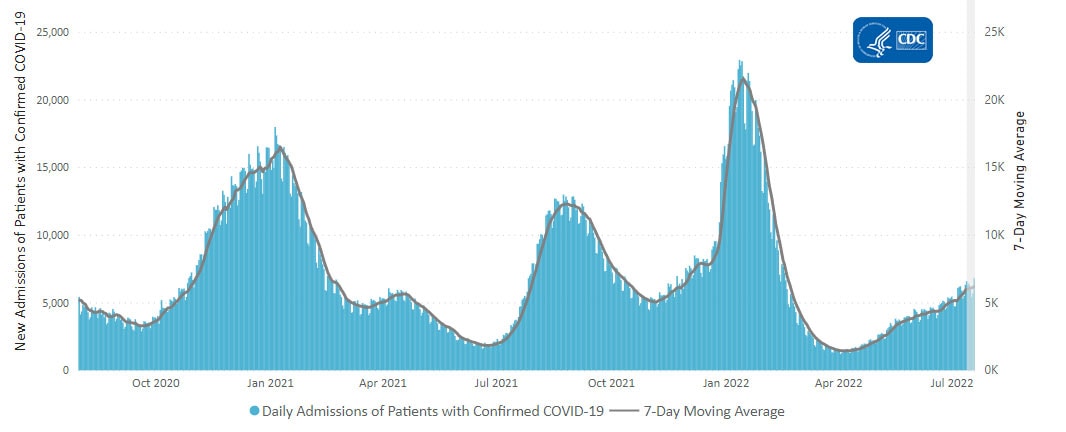
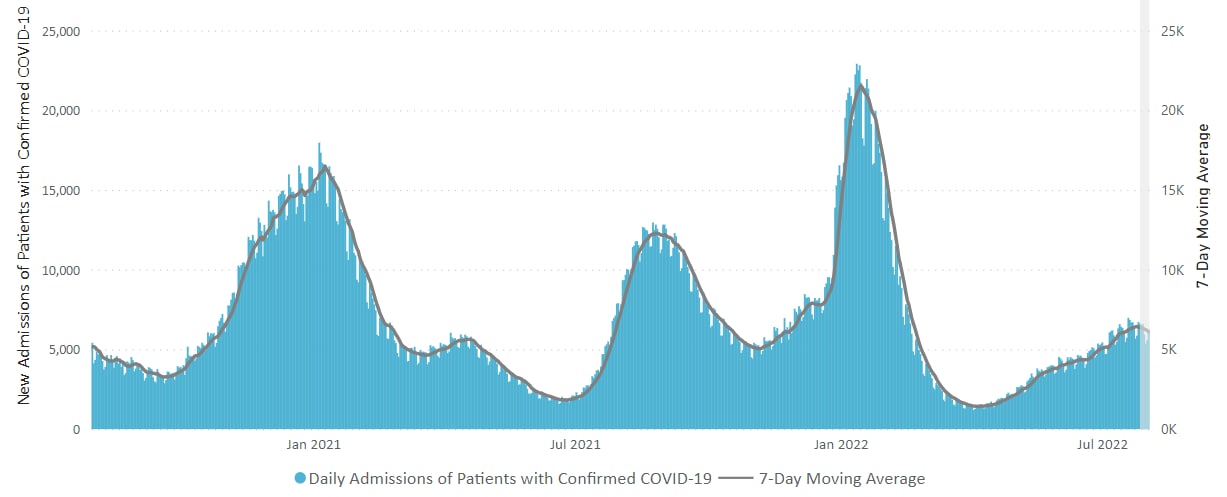
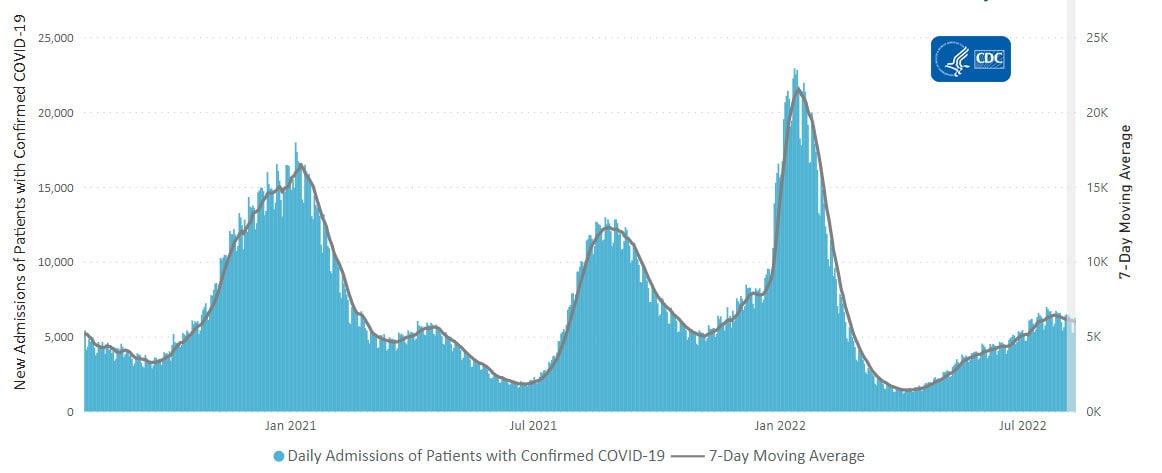
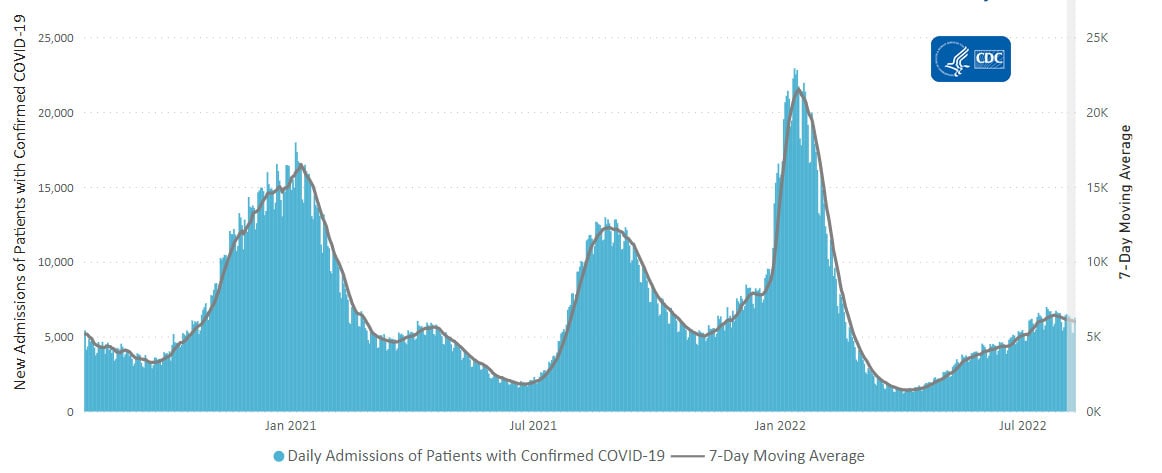
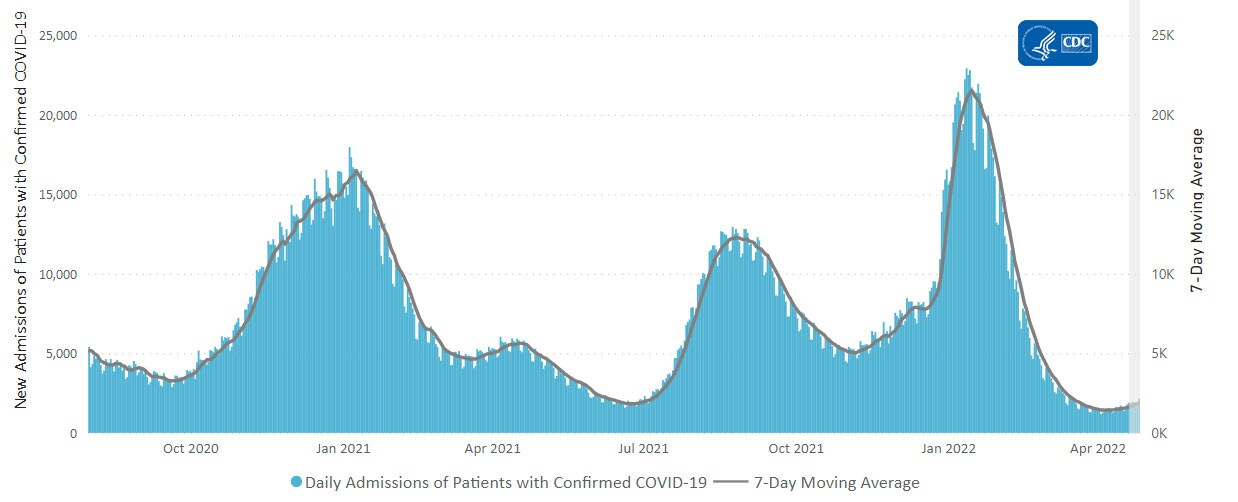
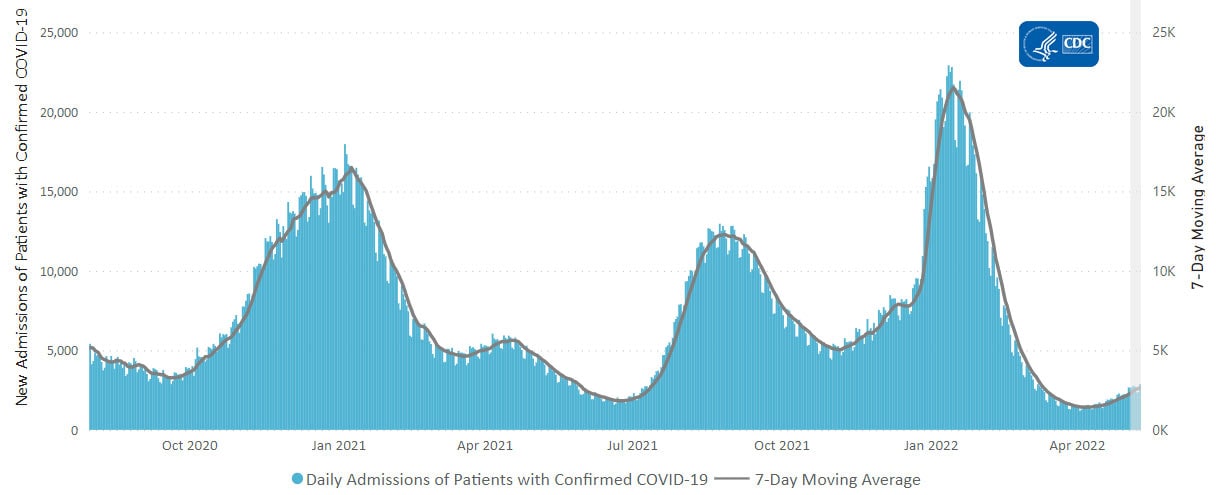
The current 7-day daily average for April 20–26, 2022, was 1,889. This is a 18.5% increase from the prior 7-day average (1,594) from April 13–19, 2022.

4,636,994
Total New Admissions

1,889
Current 7-Day Average

1,594
Prior 7-Day Average

+18.5%
Change in 7-Day Average

The start of consistent reporting of hospital admissions data was August 1, 2020.

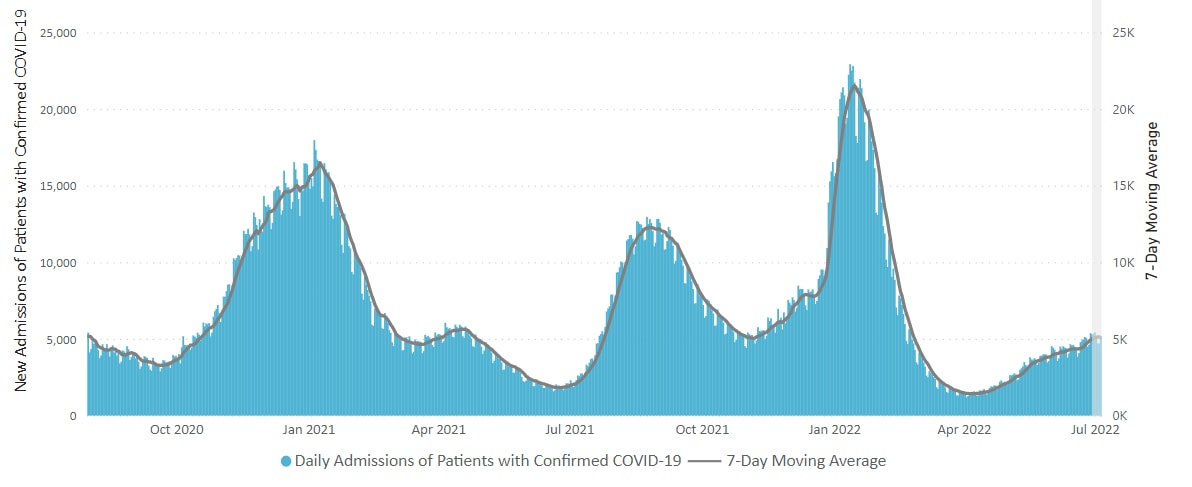
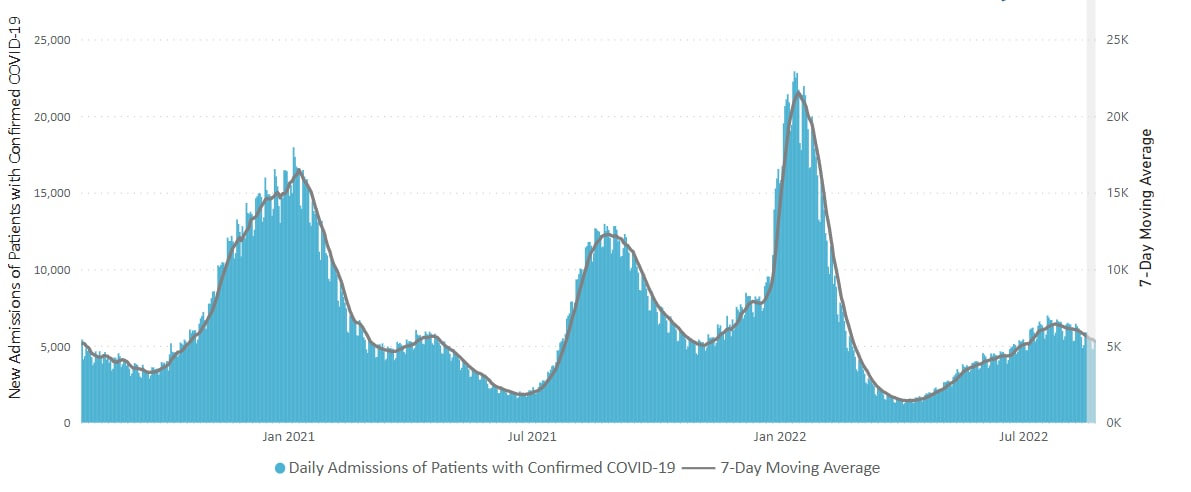
Daily Trends in Number of New COVID-19 Hospital Admissions in the United States
resize iconView Larger
New admissions are pulled from a 10 am EDT snapshot of the HHS Unified Hospital Data – Analytic Dataset. Due to potential reporting delays, data from the most recent 7 days, as noted in the figure above with the grey bar, should be interpreted with caution. Small shifts in historic data may also occur due to changes in the Centers for Medicare & Medicaid Services (CMS) Provider of Services file, which is used to identify the cohort of included hospitals.

More Hospital Data

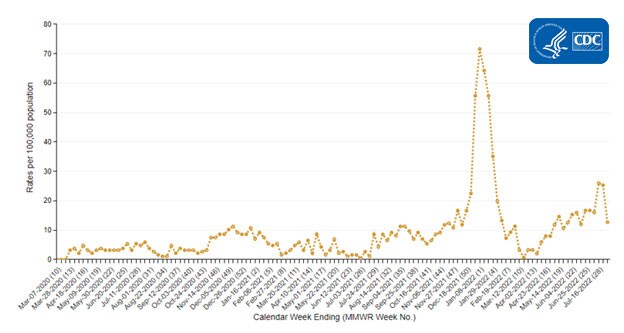
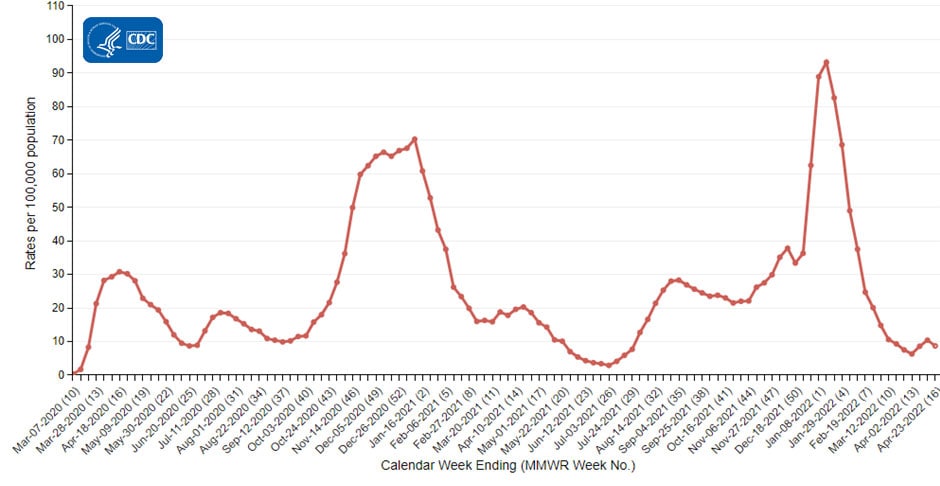
COVID-NET: Trends in Hospitalizations in Adults Ages 65 Years and Older


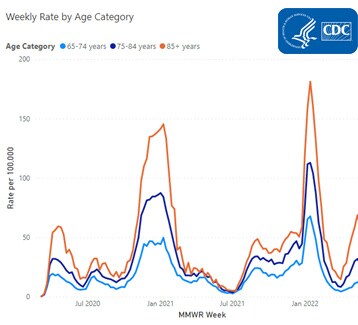
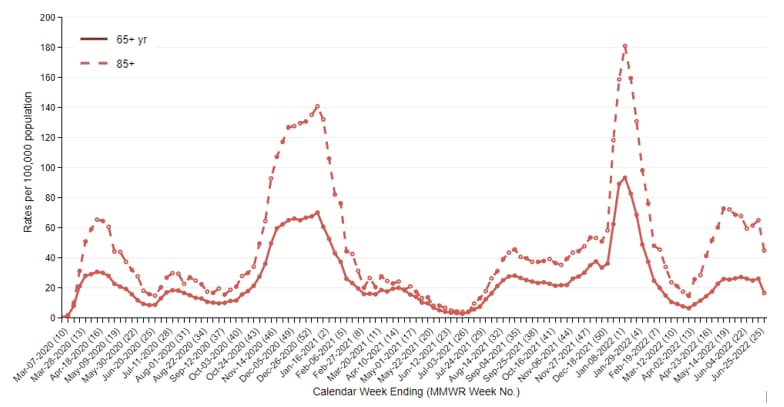
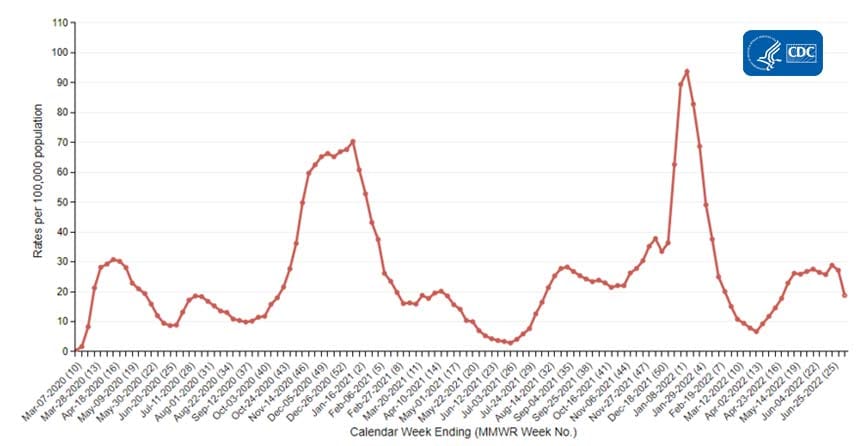
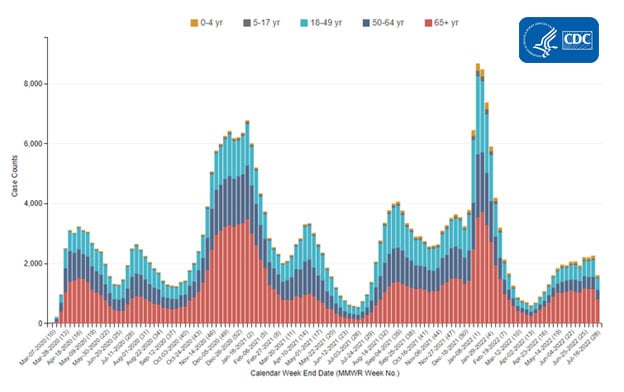
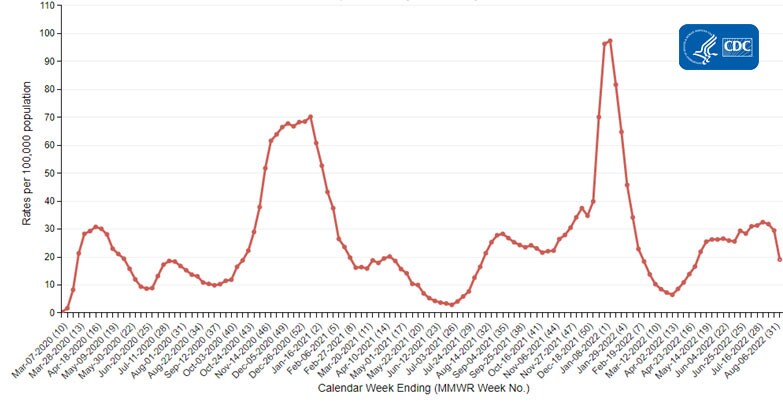
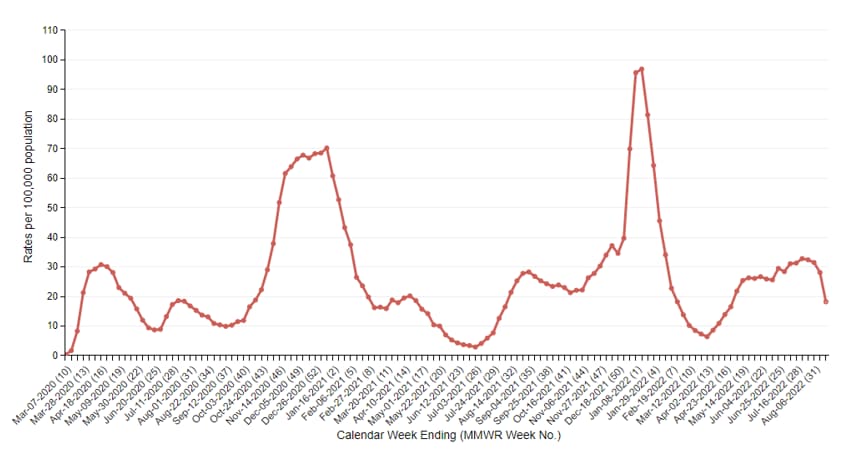
CDC’s Coronavirus Disease 2019-Associated Hospitalization Surveillance Network (COVID-NET) shows that since the start of the COVID-19 pandemic, people ages 65 years and older were the age group with the highest rates of hospitalization among all adults. While hospitalization rates in this age group had been decreasing over several months, preliminary data show that rates of COVID-19-associated hospitalizations among adults ages 65 years and older have begun to rise beginning the week ending April 9, 2022. These are the first increases in rates of COVID-19-associated hospitalizations seen in this age group since the week ending January 15, 2022.

Rates of COVID-19-Associated Hospitalizations in Adults Ages 65 Years and Older

resize iconView Larger
The Coronavirus Disease 2019 (COVID-19)-Associated Hospitalization Surveillance Network (COVID-NET) is an additional source for hospitalization data collected through a network of more than 250 acute-care hospitals in 14 states (representing ~10% of the U.S. population). Detailed data on patient demographics, including race/ethnicity, underlying medical conditions, medical interventions, and clinical outcomes, are collected using a standardized case reporting form.
More COVID-NET Data

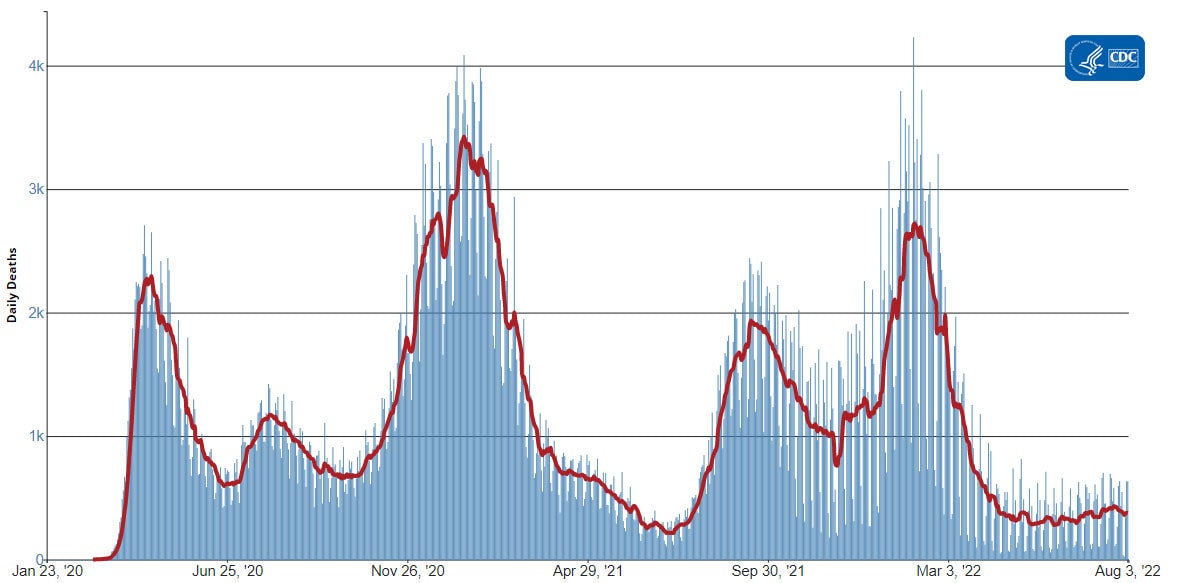
Deaths


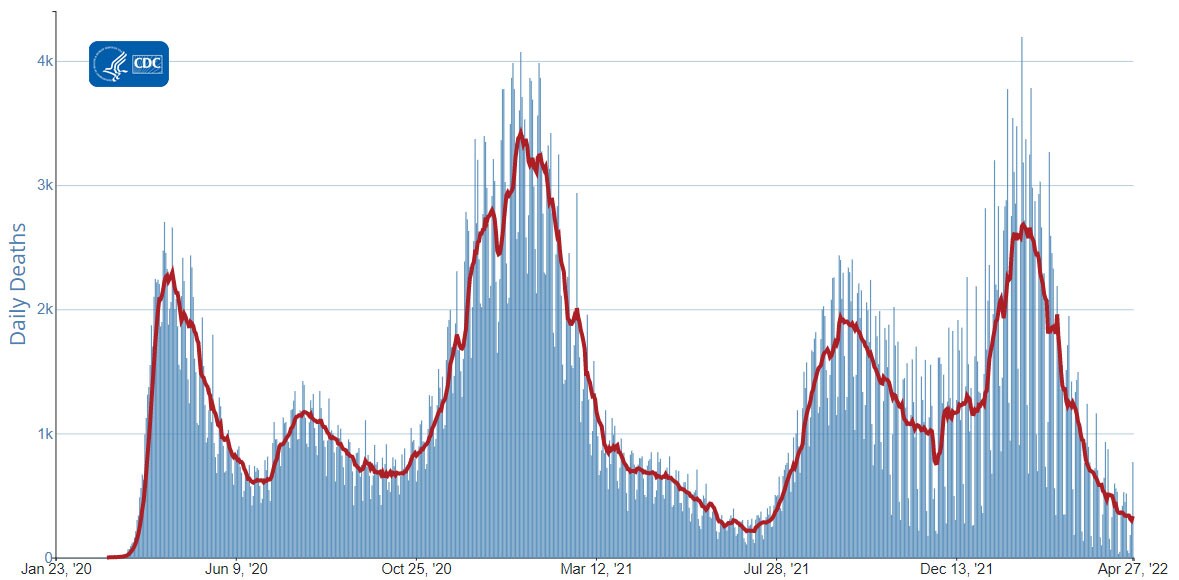
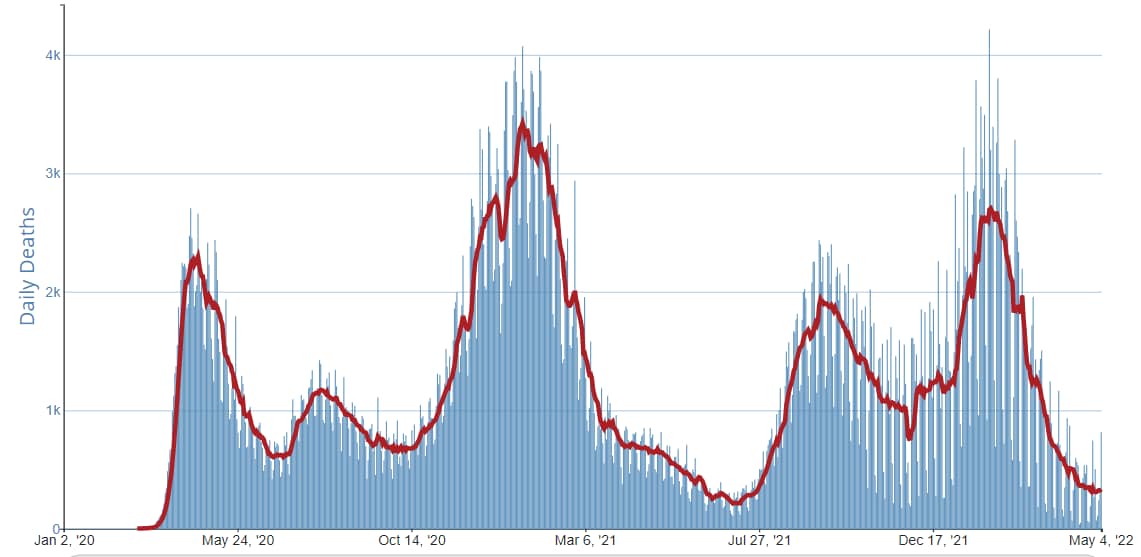
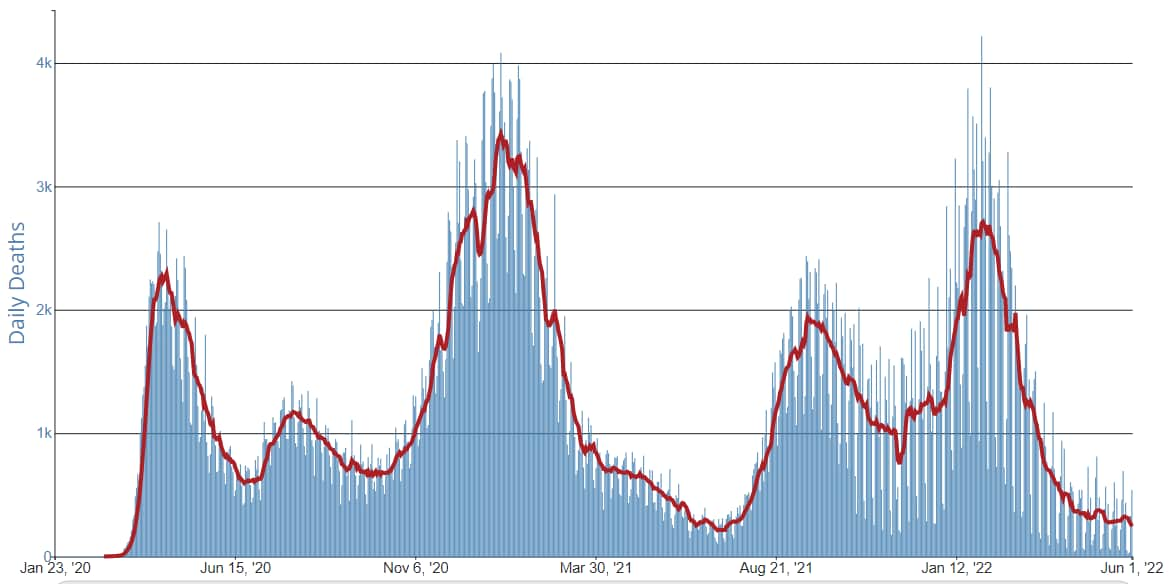
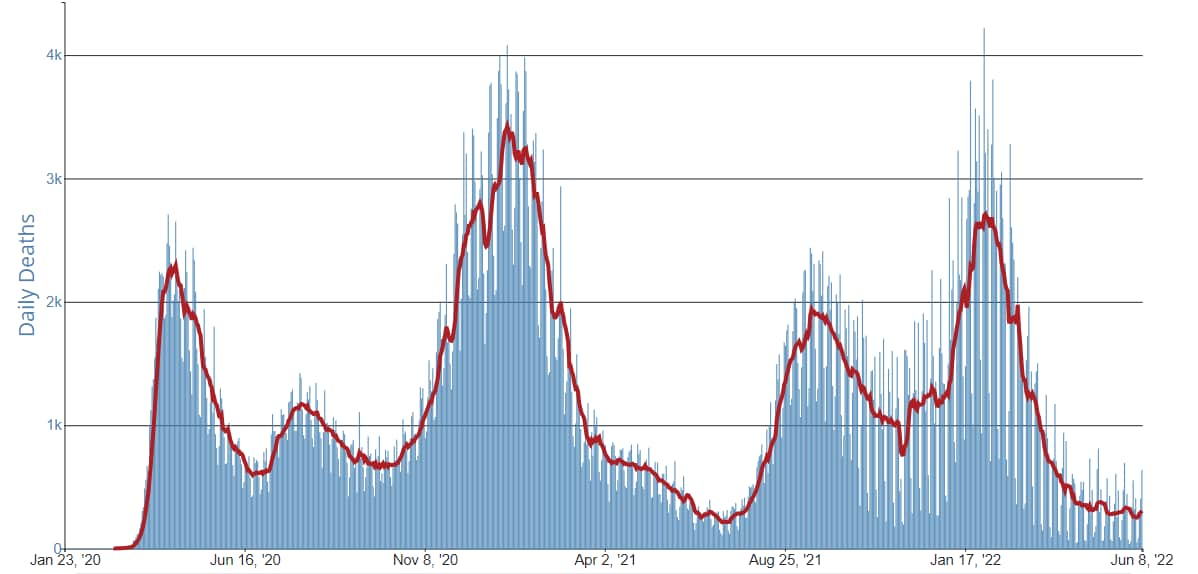
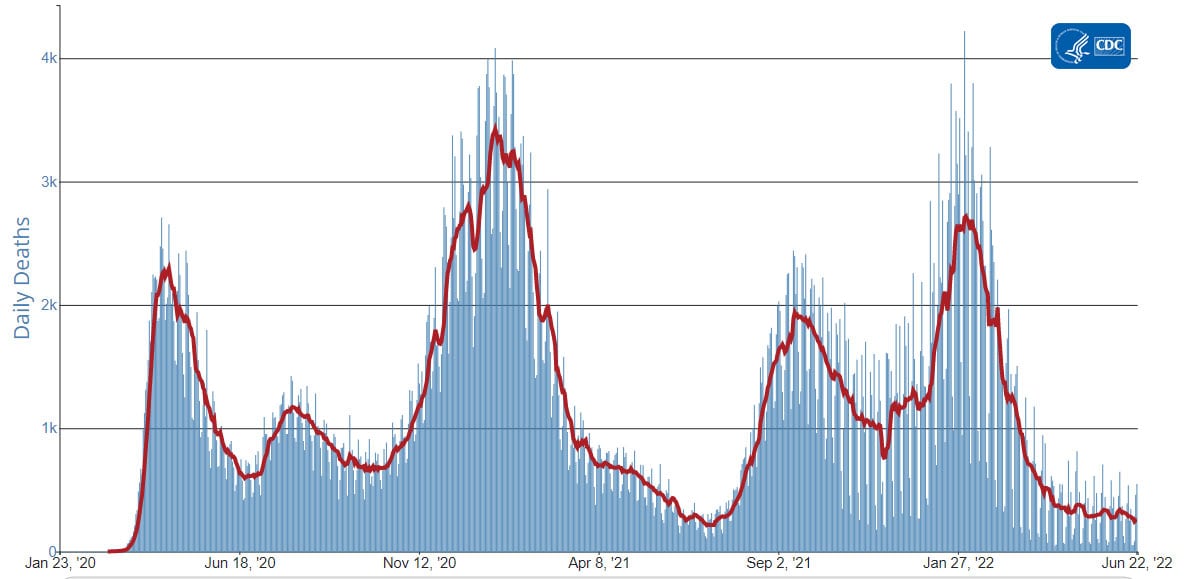
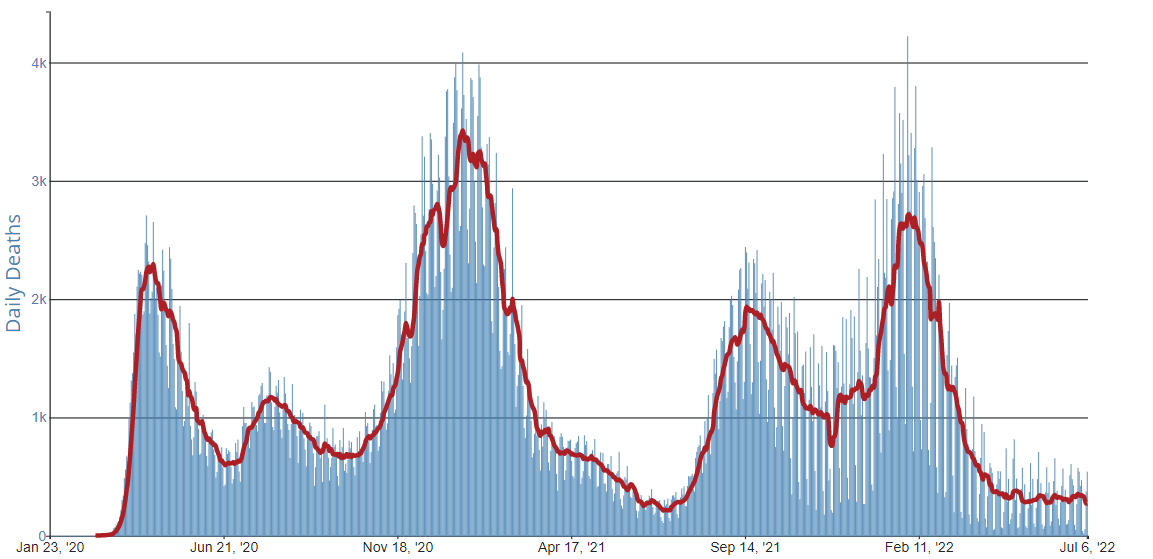
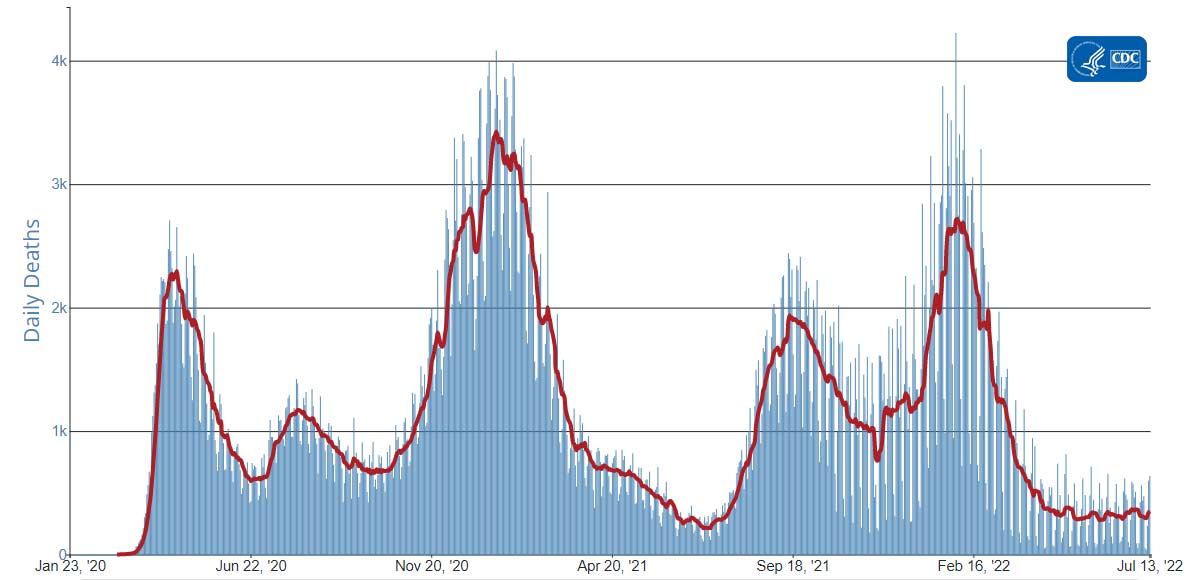
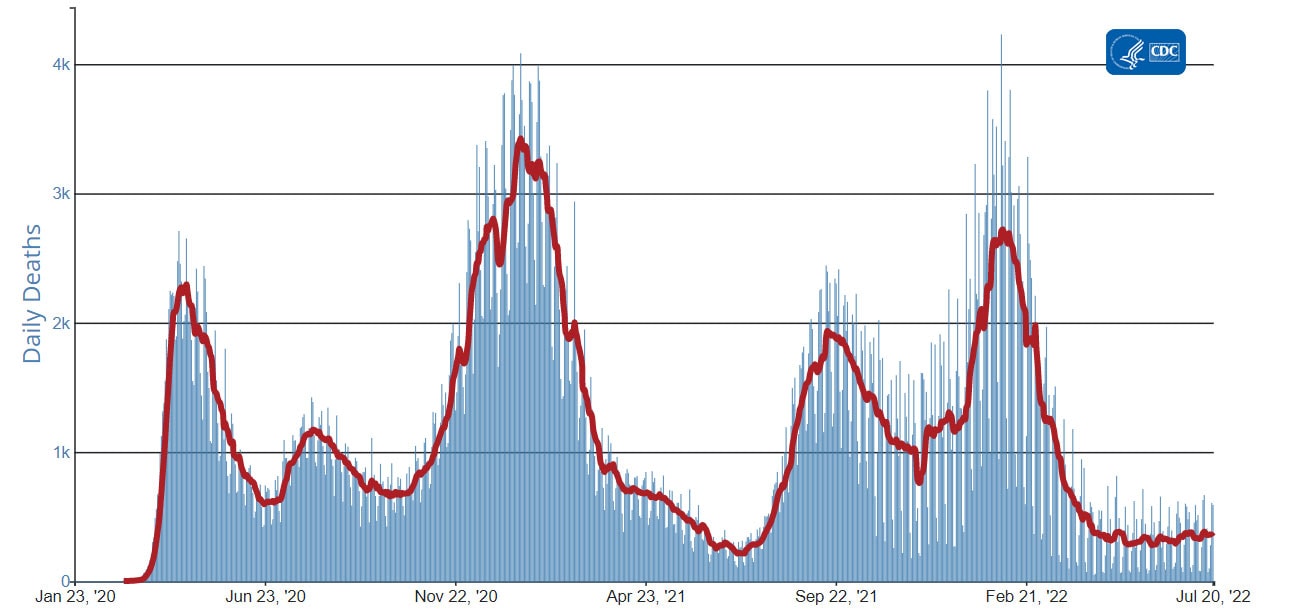
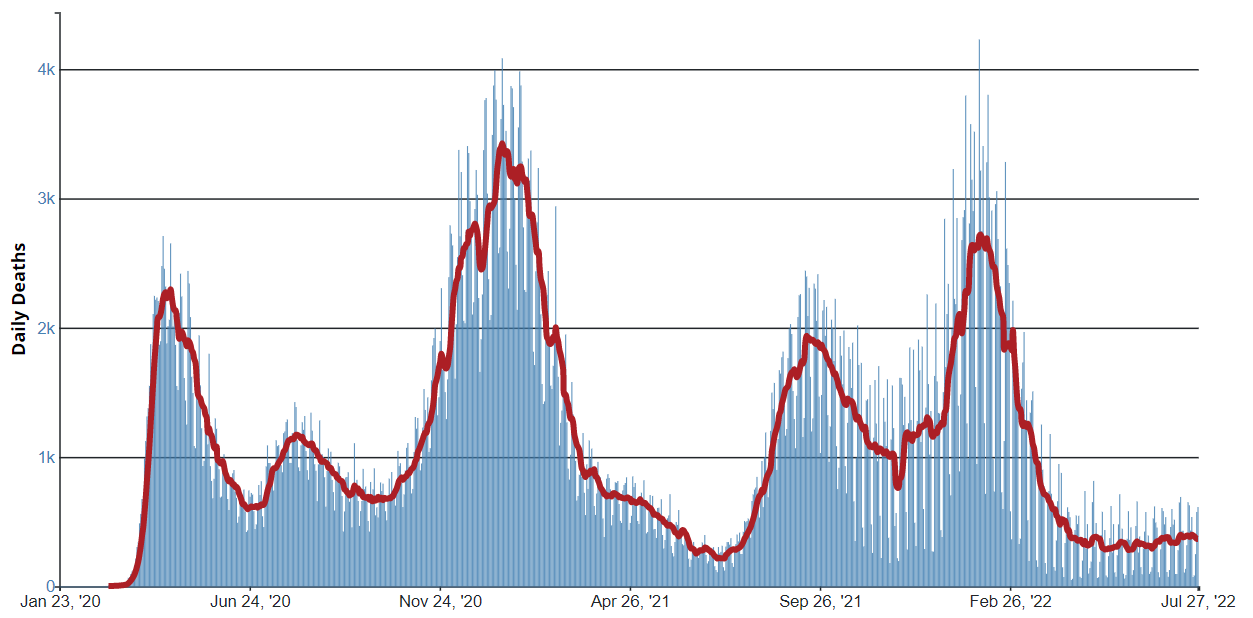
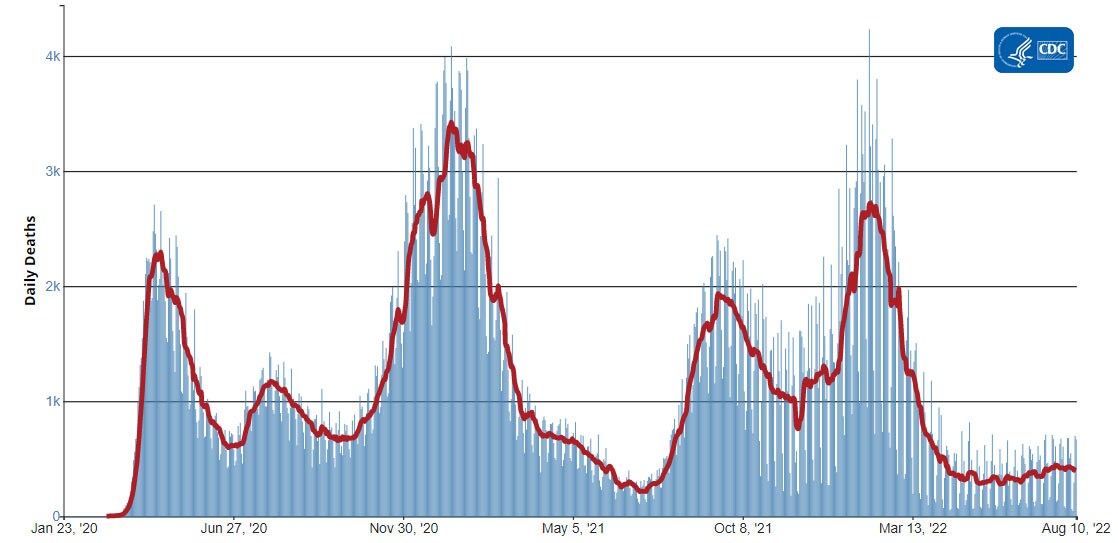
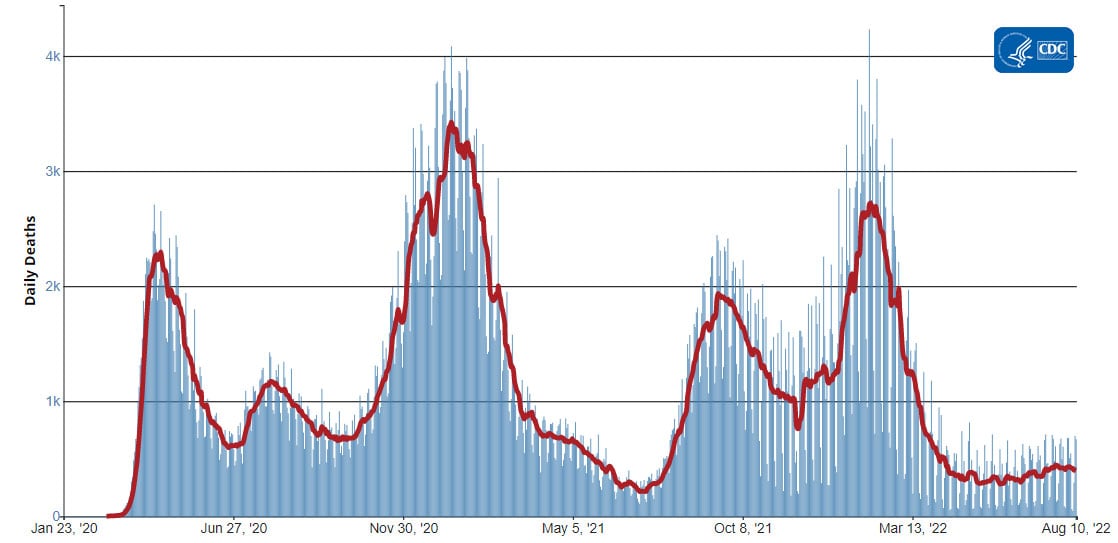
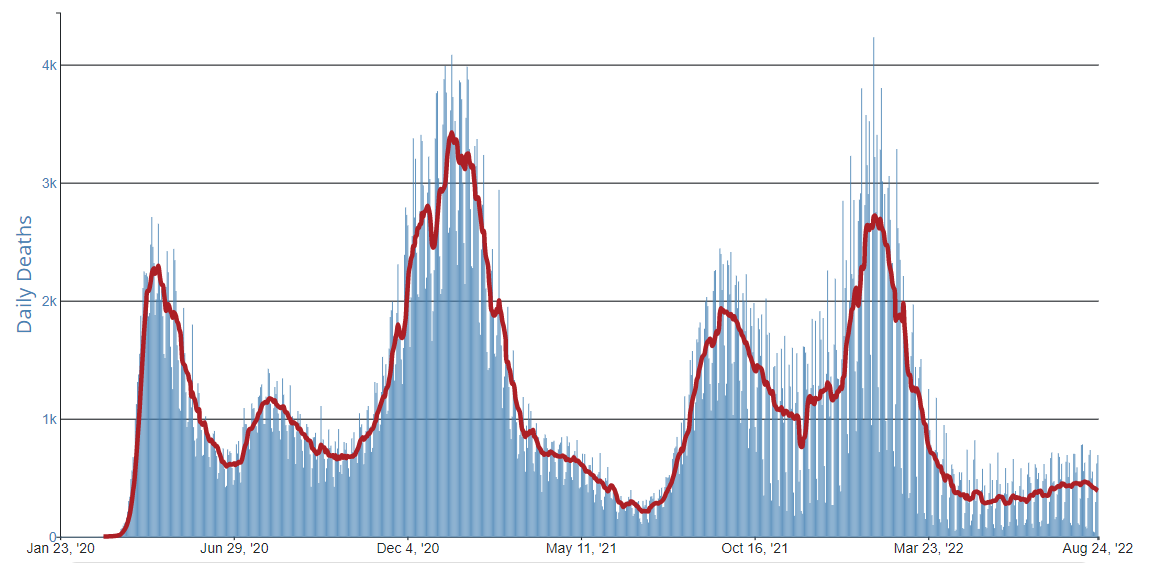
The current 7-day moving average of new deaths (334) has decreased 5.3% compared with the previous 7-day moving average (353). As of April 27, 2022, a total of 990,208 COVID-19 deaths have been reported in the United States.

990,208
Total Deaths Reported

334
Current 7-Day Average*

353
Prior 7-Day Average

-5.3%
Change in 7-Day Average Since Prior Week

*Historical deaths are excluded from the daily new deaths and 7-day average calculations until they are incorporated into the dataset by their applicable date. Of 21,418 historical deaths reported retroactively, 235 were reported in the current week; and 137 were reported in the prior week.

Daily Trends in Number of COVID-19 Deaths in the United States Reported to CDC
red-line.jpg

7-Day moving average

resize iconView Larger
More Death Data

Testing


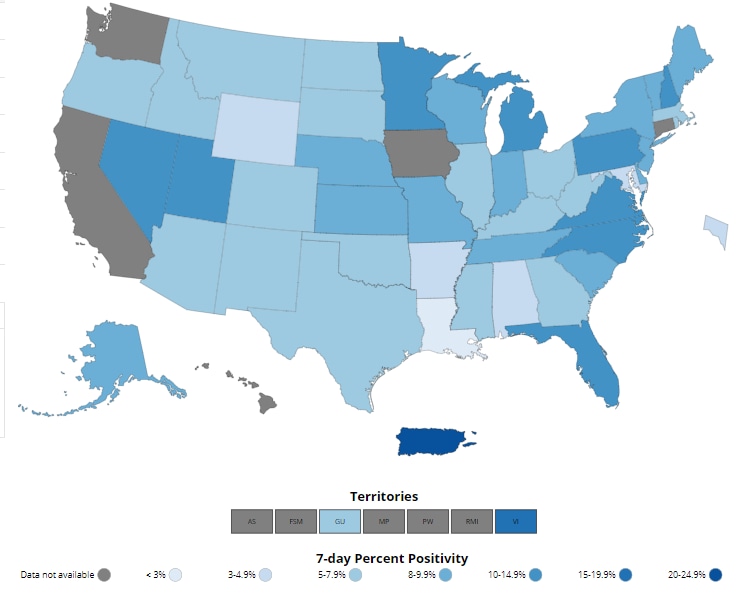
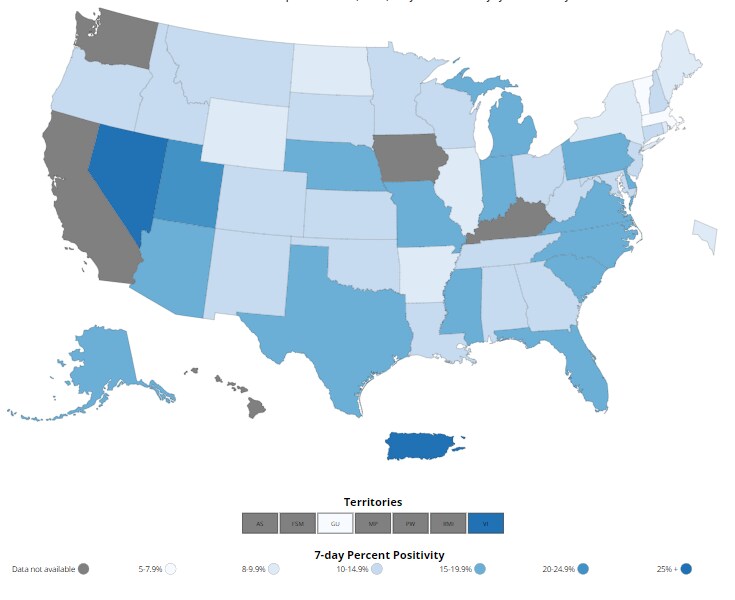
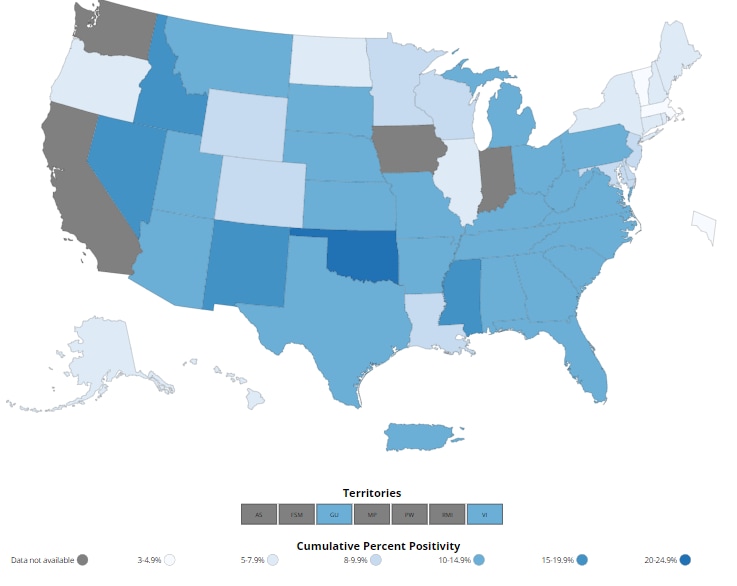
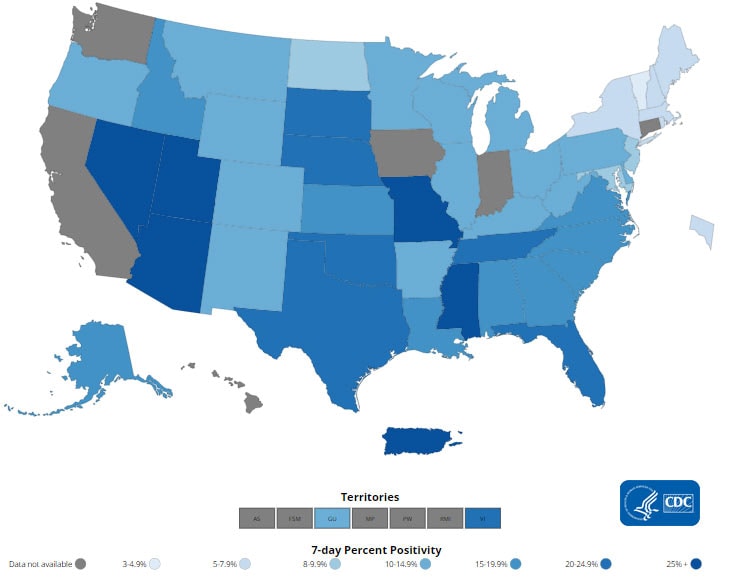
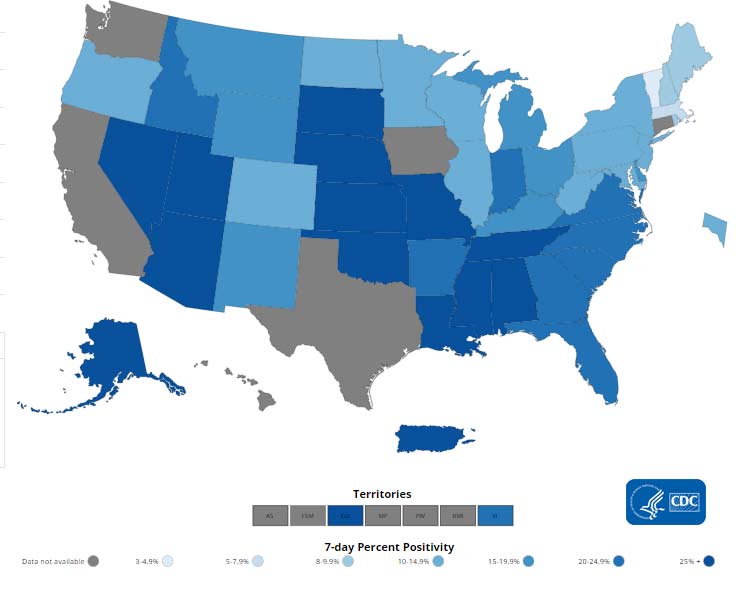
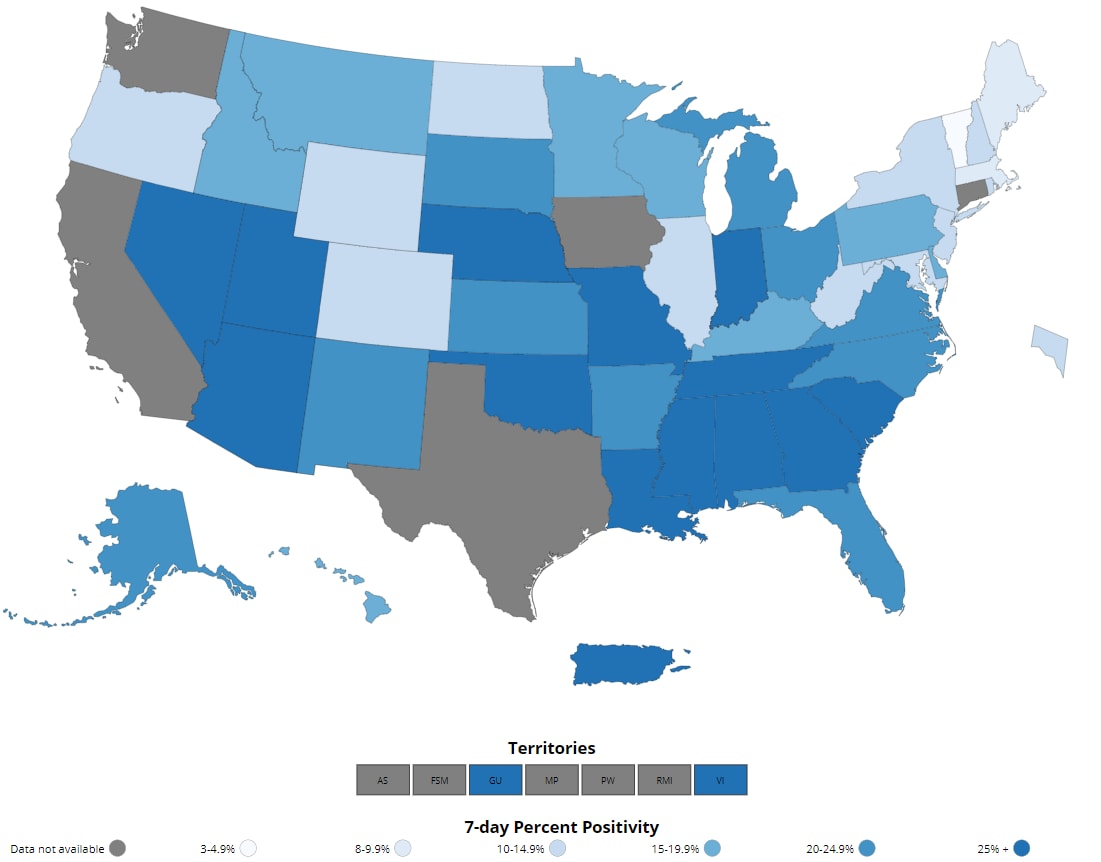
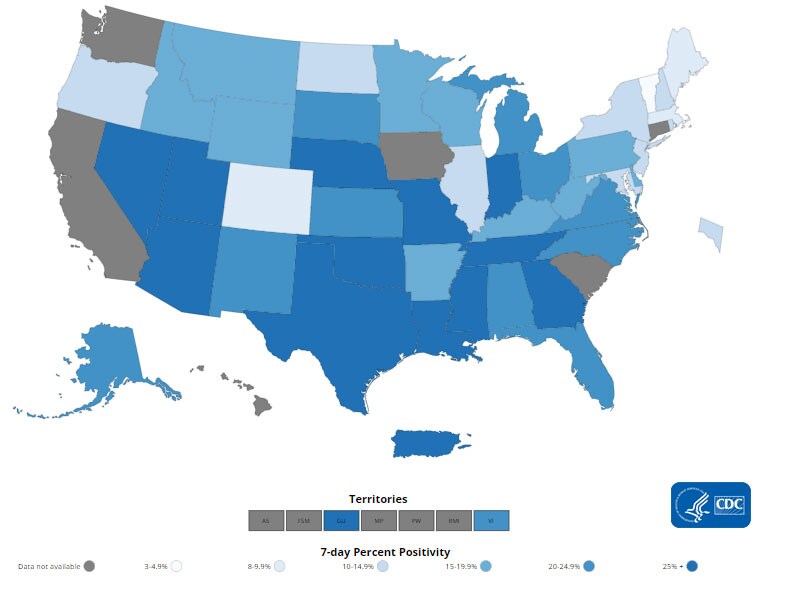
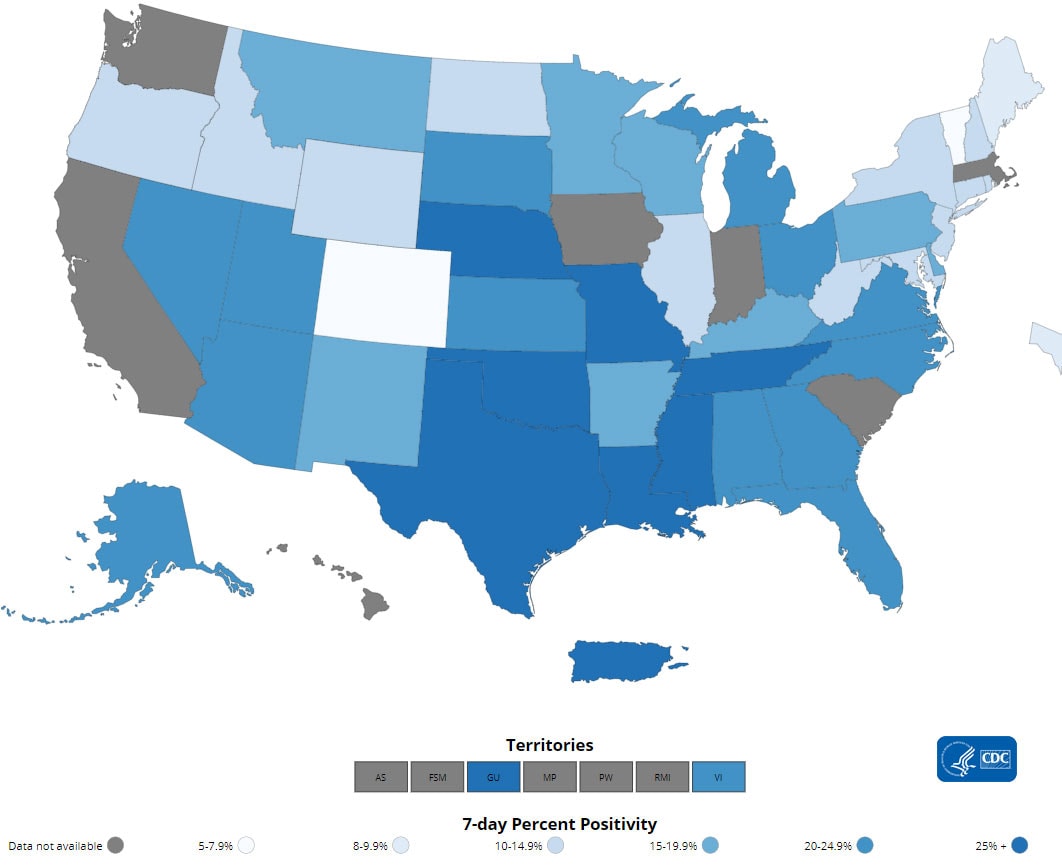
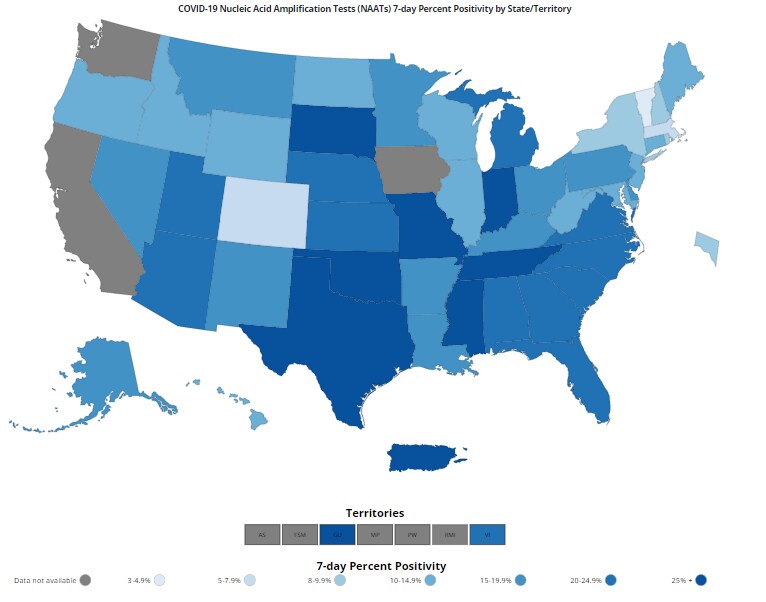
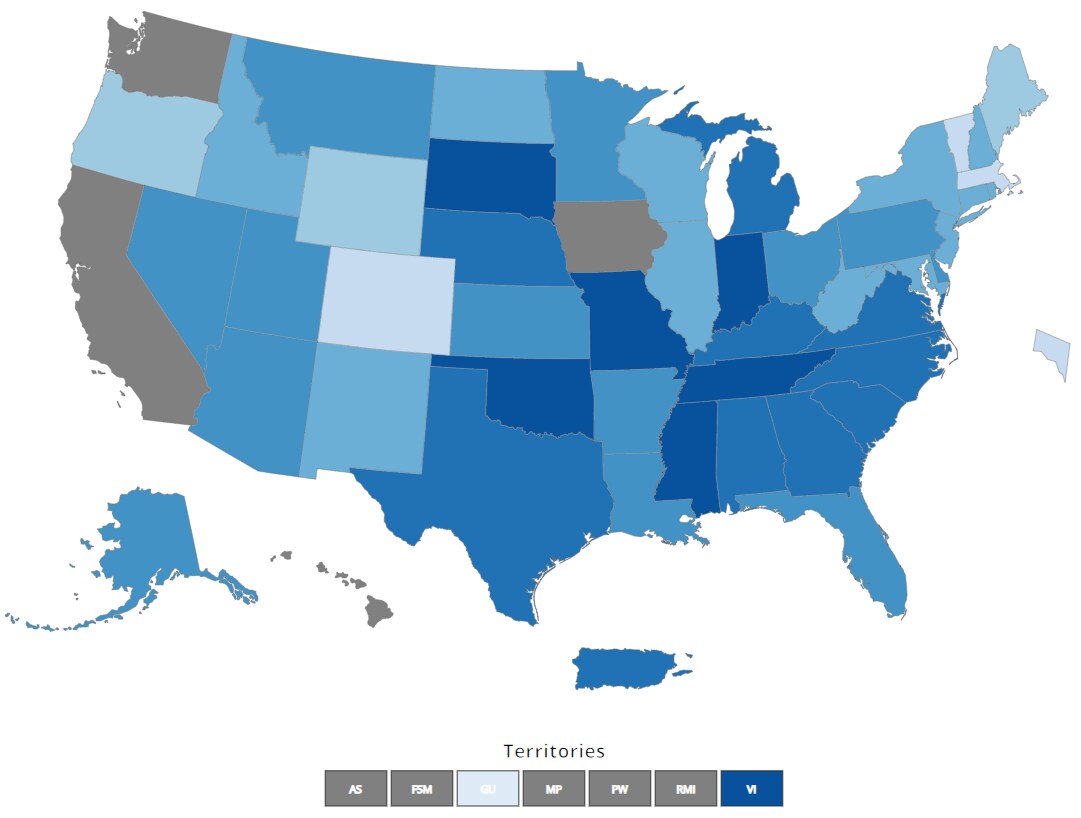
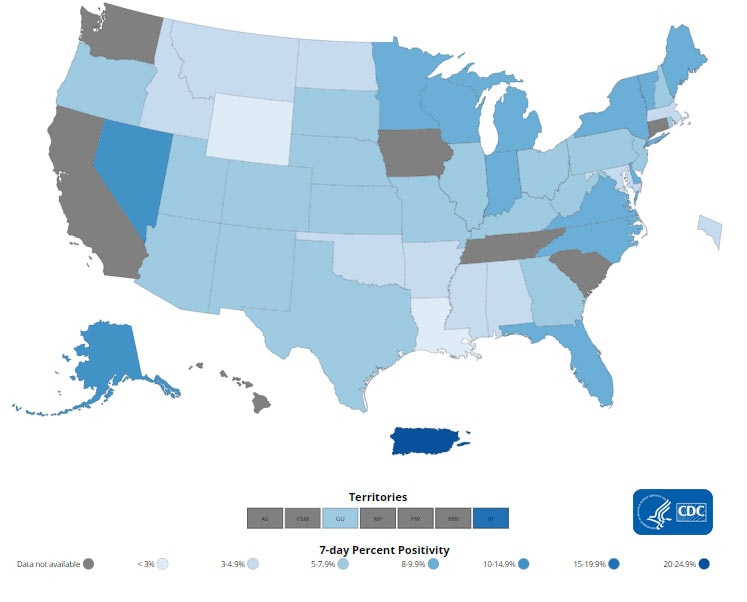
The percentage of COVID-19 NAATs (nucleic acid amplification tests)* that are positive (percent positivity) is increasing in comparison to the previous week. The 7-day average of percent positivity from NAATs is now 6.1%. The 7-day average number of tests reported for April 15-21, 2022, was 588,505, down 20.0% from 735,366 for the prior 7 days.

864,803,009
Total Tests Reported

588,505
7-Day Average Tests Reported

6.1%
7-Day Average % Positivity

5.2%
Previous 7-Day Average % Positivity

+0.91
Percentage point change in 7-Day Average % Positivity since Prior Week

*Test for SARS-CoV-2, the virus that causes COVID-19

COVID-19 NAAT Laboratory Test 7-day Percent Positivity by State/Territory
resize iconView Larger
More Testing DataWastewater Surveillance


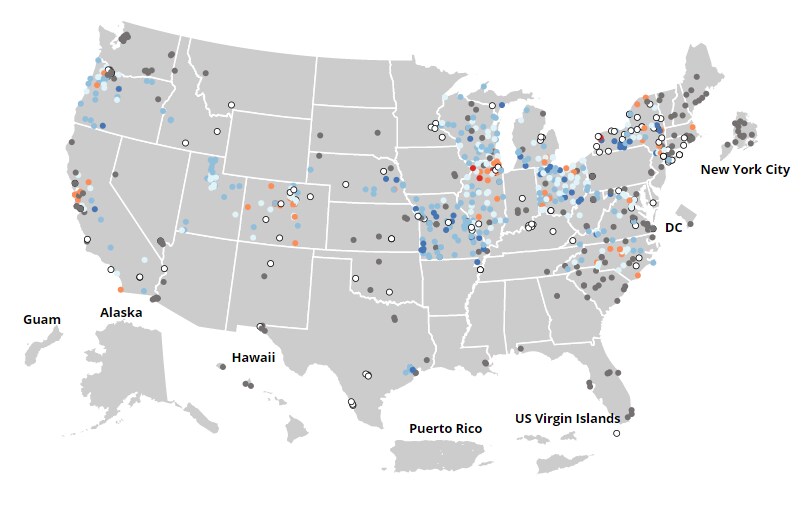
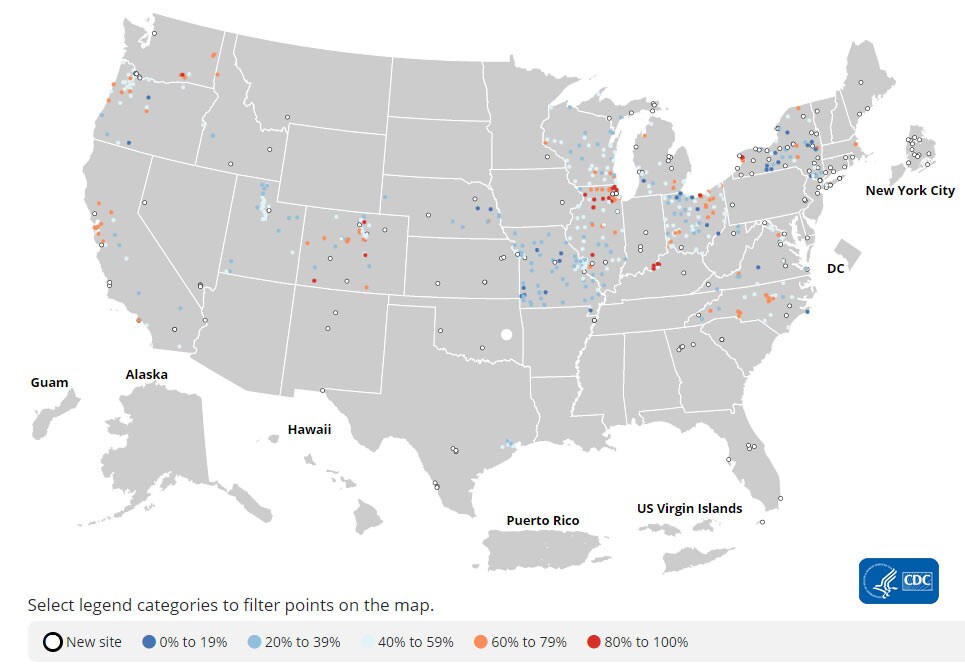
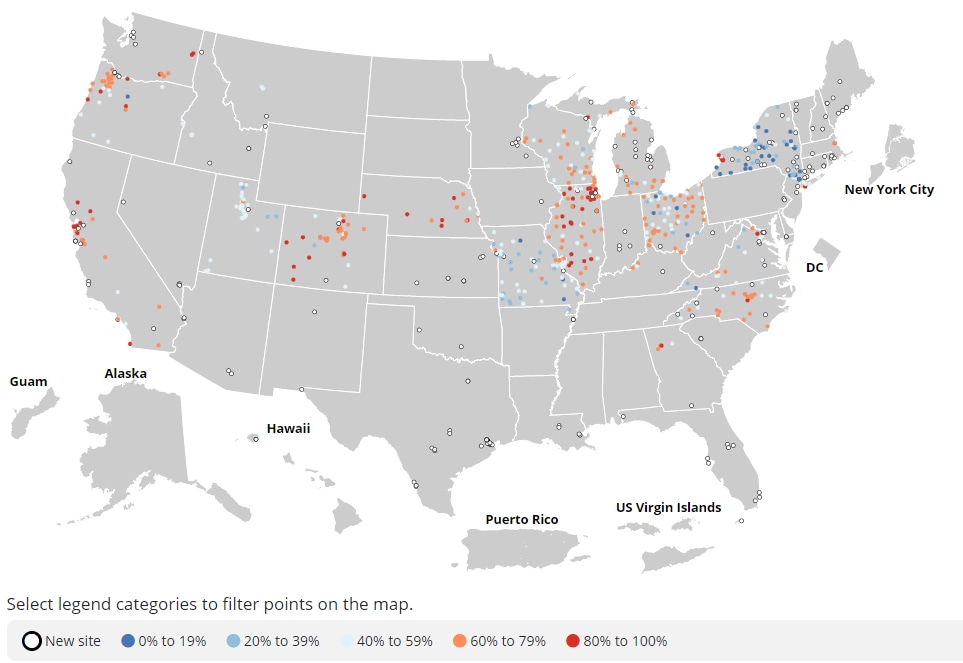
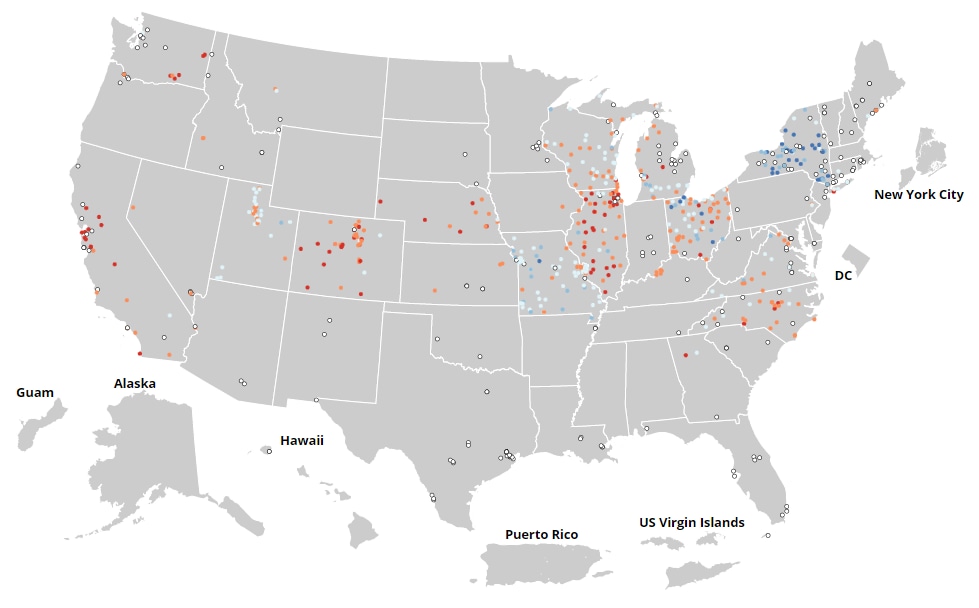
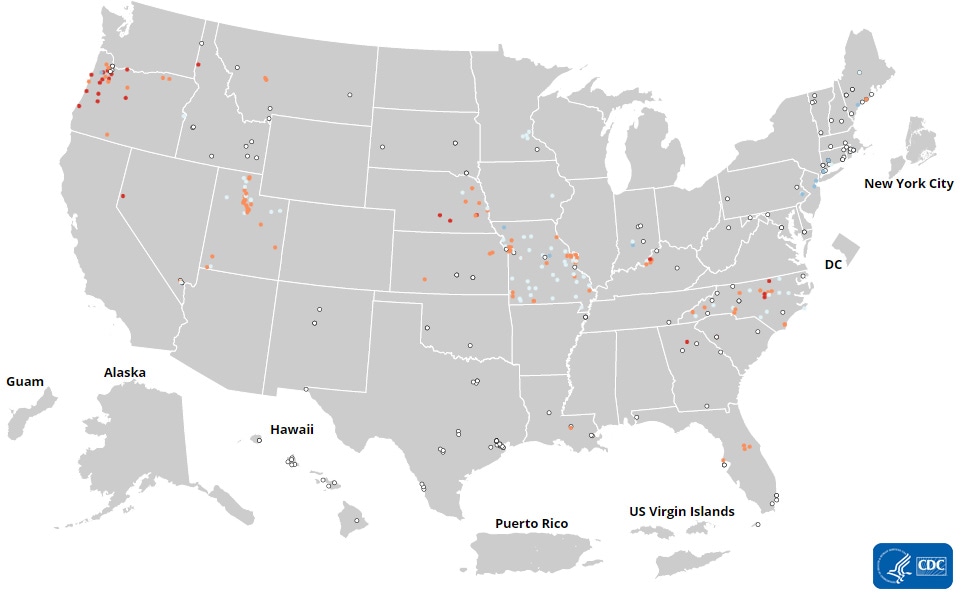
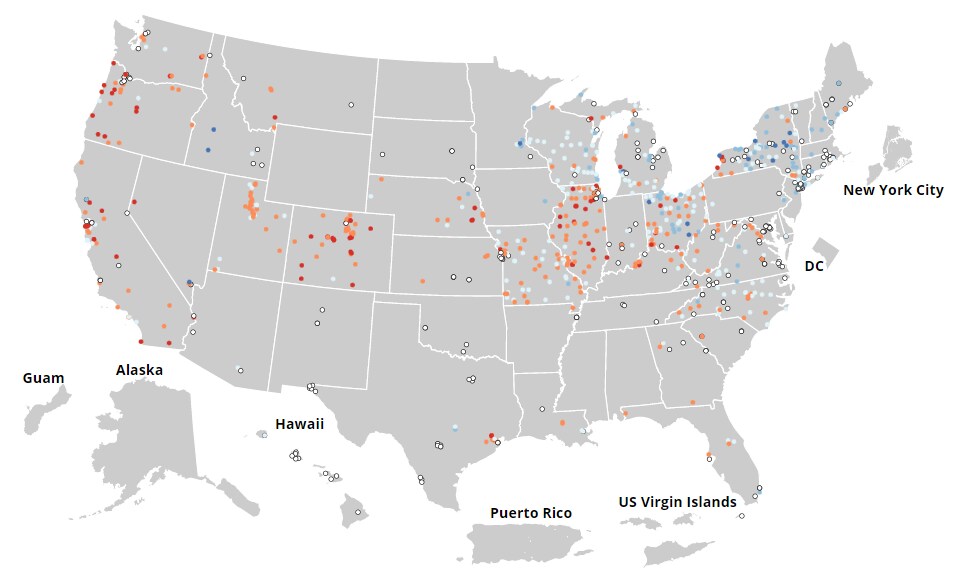
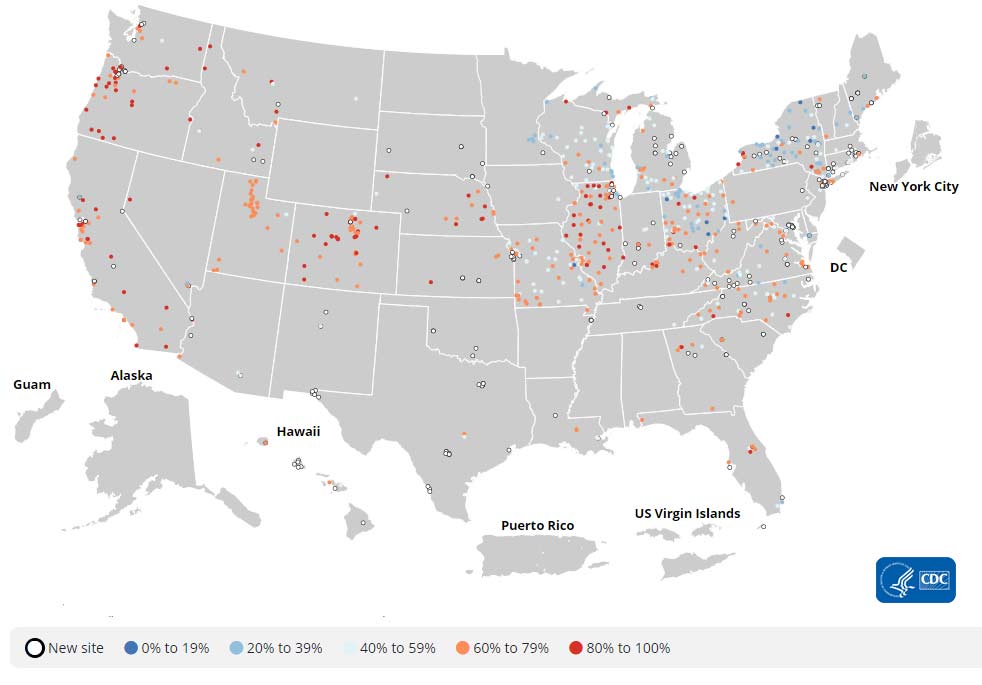
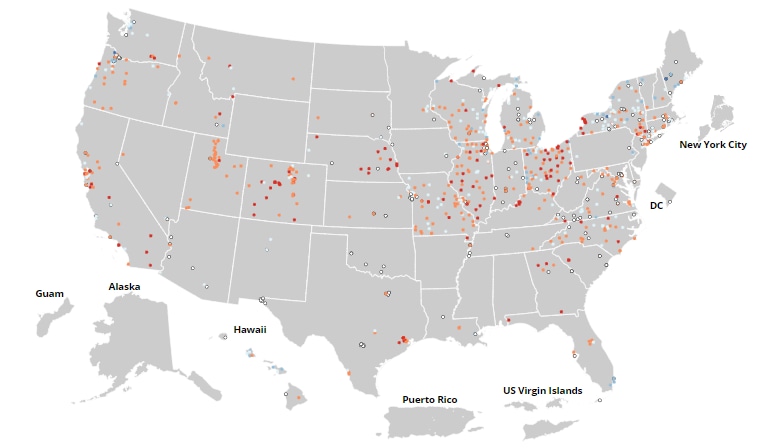
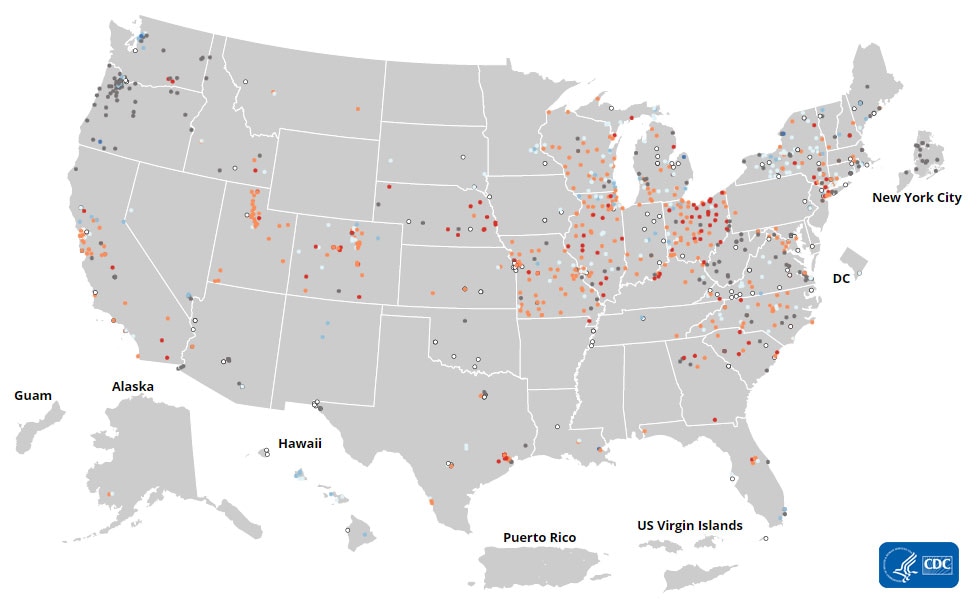
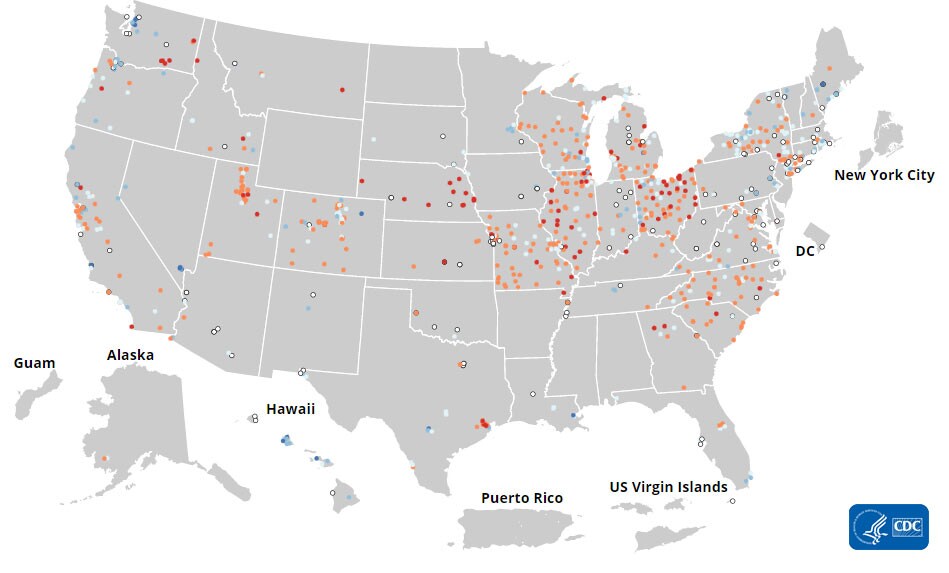
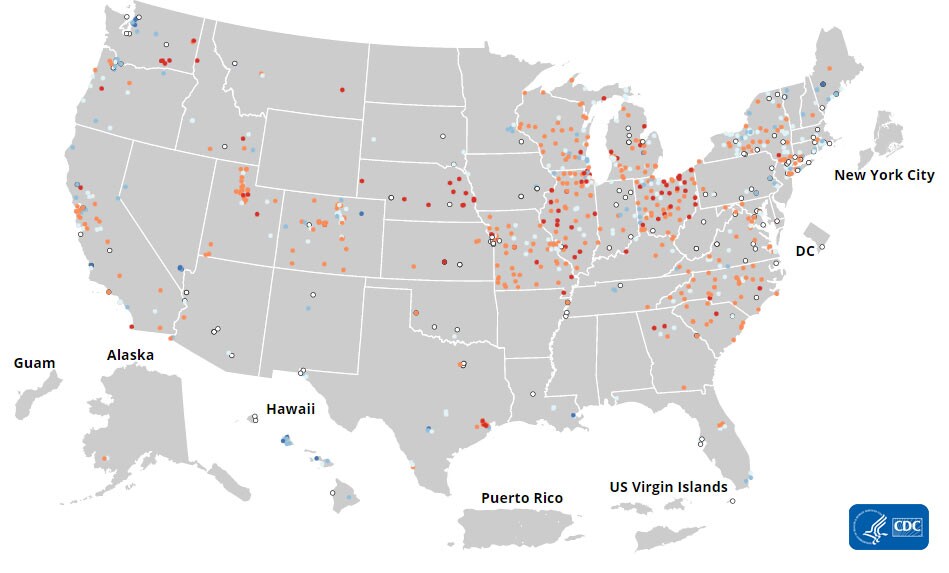
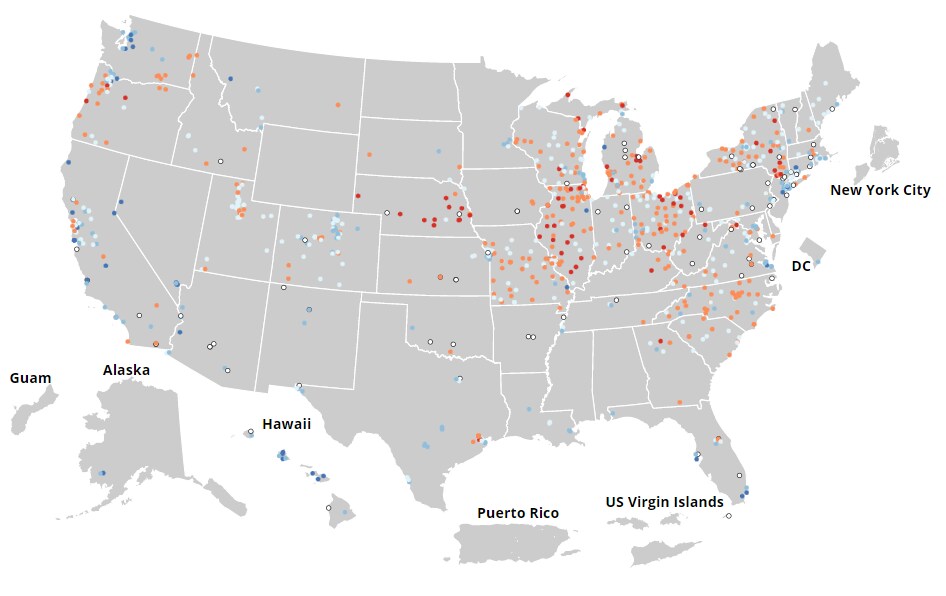
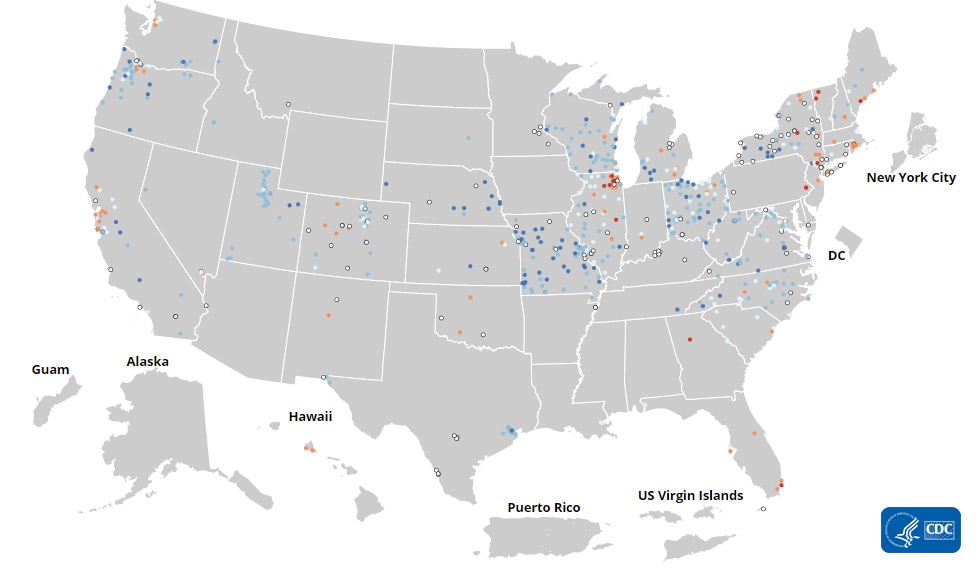
In February 2022, CDC’s COVID Data Tracker released a Wastewater Surveillance tab, which tracks levels, changes, and detections of SARS-CoV-2 viral RNA in wastewater at more than 800 testing sites across the country. Because many people with COVID-19 shed the virus in their feces, wastewater testing can help us monitor COVID-19 in communities. Wastewater surveillance can provide an early warning of increasing COVID-19 cases and help communities prepare.

Currently, virus levels in wastewater are relatively low across the country. However, more than half of all sites reporting wastewater data are experiencing a modest increase in SARS-CoV-2 levels. These increases often reflect minor changes from very low levels to levels that are still low. It’s important to note that even a small increase when levels are low can appear like a dramatic increase in the percent change. For more information on how to use wastewater data, visit CDC’s website.

SARS-CoV-2 Levels in Wastewater by Site
resize iconView Larger
0% means levels are the lowest they have been at the site; 100% means levels are the highest they have been at the site.

wastewater-legend_04292022.jpg
More Wastewater Data
Top of Page
 
covid-tracker-header-lrg.jpg

Print
Subscribe to the Weekly Review


Interpretive Summary for May 5, 2022
News You Can Use


resize iconView Larger
COVID-19 cases and hospitalizations are on the rise in the United States. Although deaths continue to decrease, the United States is expected to reach 1 million deaths soon.

When trends start to change across the country and in your community, you can use CDC’s COVID-19 Integrated County View to find out how to protect yourself and others from severe illness. For example, each county’s COVID-19 Community Level is ranked as low, medium, or high, based on hospital beds being used by patients with COVID-19, new hospital admissions among people with COVID-19, and the total number of new COVID-19 cases in your area. It’s easy to check your county’s level on CDC’s website and learn what actions you should take.

No matter what your COVID-19 Community Level, everyone should stay up to date with vaccination for the best protection against becoming severely ill from COVID-19,* including those who have already had COVID-19. COVID Data Tracker shows that 46% of the U.S. population has received one booster, but half of those who are booster-eligible haven’t gotten one yet. Find a vaccine provider and get your booster as soon as you are eligible.

*At any level, people with or around those with higher risk for serious illness, with symptoms, exposure to someone with COVID-19, or a positive test should take extra precautions to protect themselves and others. For people who are more likely to get very sick from COVID-19, medications that can reduce your chances of severe illness and death are available. If you are moderately or severely immunocompromised or severely allergic to COVID-19 vaccines, you may be eligible for Evusheldexternal icon, a medicine given by your healthcare provider to help prevent you from getting COVID-19.


What's New

COVID-19 Community Levels


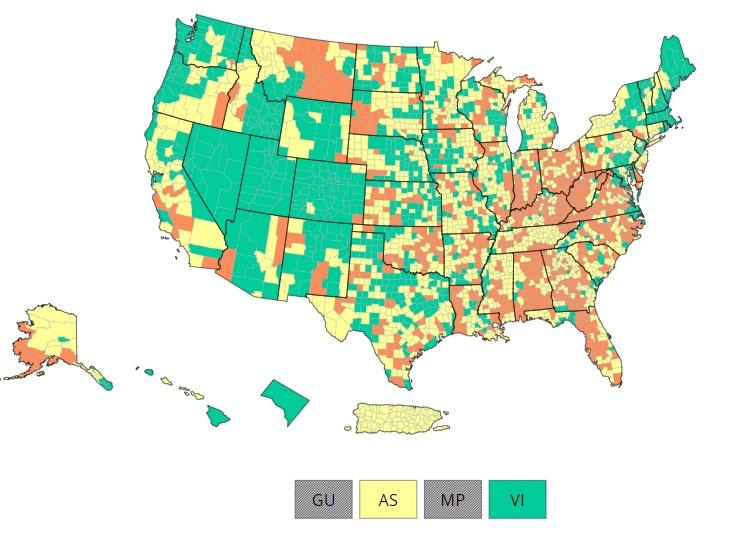
As of May 5, 2022, there are 78 (2.42%) counties, districts, or territories with a high COVID-19 Community Level, 316 (9.81%) counties with a medium Community Level, and 2,826 (87.76%) counties with a low Community Level. This represents a slight (0.75 percentage points) increase in the number of high-level counties, a small (+1.86 percentage points) increase in the number of medium-level counties, and a corresponding (−2.61 percentage points) decrease in the number of low-level counties. Sixteen (28.57%) of 56 jurisdictions had no high- or medium-level counties this week.

To check your COVID-19 community level, visit COVID Data Tracker.

U.S. COVID-19 Community Levels by County

resize iconView Larger
Community-Levels-2.png

COVID-19 Community Levels

Reported Cases


As of May 4, 2022, the current 7-day moving average of daily new cases (64,781) increased 21.4% compared with the previous 7-day moving average (53,362). A total of 81,492,170 COVID-19 cases have been reported in the United States as of May 4, 2022.

CDC Nowcast projections* for the week ending April 30, 2022, estimate the combined national proportion of lineages designated as Omicron to be 100%. There are several lineages of Omicron (B.1.1.529, BA.1, BA.2, BA.3, BA.4, and BA.5), and each one has multiple sublineages. COVID Data Tracker shows the proportions of Omicron lineages grouped as follows: the B.1.1.529 lineage (includes BA.1, BA.3, BA.4 and BA.5), the BA.1.1** lineage, the BA.2 lineage, and the BA.2.12.1 lineage. The predominant Omicron lineage in the United States is BA.2. The national proportion of BA.2 is projected to be 61.9% (95% PI 53.8-69.4%). The national proportion of BA.2.12.1 is projected to be 36.5% (95% PI 28.9-44.9%). BA.1.1 is projected to be 1.3% (95% PI 1.0-1.6%) and B.1.1.529 (BA.1, BA.3, BA.4 and BA.5) is projected to be 0.1% (95% PI 0.1-0.2%). Omicron is predicted to be 100% in all HHS regions.

81,492,170
Total Cases Reported

64,781
Current 7-Day Average***

53,362
Prior 7-Day Average

21.4%
Change in 7-Day Average since Prior Week

*The median time from specimen collection to sequence data reporting is about 3 weeks. As a result, weighted estimates for the most recent few weeks may be unstable or unavailable. CDC’s Nowcast is a data projection tool that helps fill this gap by generating timely estimates of variant proportions for variants that are circulating in the United States. View Nowcast estimates on CDC’s COVID Data Tracker website on the Variant Proportions page.

**For national data, the proportion of BA.1.1 is shown separately. For regional data, the proportion of BA.1.1 is also aggregated with B.1.1.529.

***Historical cases are excluded from daily new cases and 7-day average calculations until they are incorporated into the dataset for the applicable date. Of 523,223 historical cases reported retroactively, 2,316 were reported in the current week and 4,078 were reported in the prior week.


Daily Trends in COVID-19 Cases in the United States Reported to CDC
red-line.jpg

7-Day moving average

resize iconView Larger
More Case Data

Vaccinations


The U.S. COVID-19 Vaccination Program began December 14, 2020. As of May 4, 2022, 577.3 million vaccine doses have been administered in the United States. Overall, about 257.9 million people, or 77.7% of the total U.S. population, have received at least one dose of vaccine. About 219.9 million people, or 66.2% of the total U.S. population, have been fully vaccinated.* Of those fully vaccinated, about 100.9 million people have received a booster,** but 49.4% of the total booster-eligible population has not yet received a booster. As of May 4, 2022, the 7-day average number of administered vaccine doses reported (by date of CDC report) to CDC per day was 439,158, a 18.0% increase from the previous week.

CDC’s COVID Data Tracker displays vaccination trends by age group, race/ethnicity, and urban/rural status. To see trends by age group and race/ethnicity, visit the Vaccination Demographic Trends tab. To see trends by urban/rural status, visit the COVID-19 Vaccination Equity tab.

577,306,842
Vaccine Doses Administered

257,881,623
People who received at least one dose

219,902,417
People who are fully vaccinated*

77.7%
Percentage of the U.S. population that has received at least one dose

66.2%
Percentage of the U.S. population that has been fully vaccinated*

+0.2
Percentage point increase from last week

+0.1
Percentage point increase from last week

*Represents the number of people who have received the second dose in a two-dose COVID-19 vaccine series (such as the Pfizer-BioNTech or Moderna vaccines) or one dose of the single-shot Johnson & Johnson’s Janssen vaccine.

**Represents the number of people who are fully vaccinated and have received another dose of COVID-19 vaccine since August 13, 2021. This includes people who received their first additional dose or booster.

Daily Change in the Total Number of Administered COVID-19 Vaccine Doses Reported to CDC by the Date of CDC Report, United States
red-line.jpg

7-Day moving average

resize iconView Larger
More Vaccination Data

Hospitalizations

New Hospital Admissions


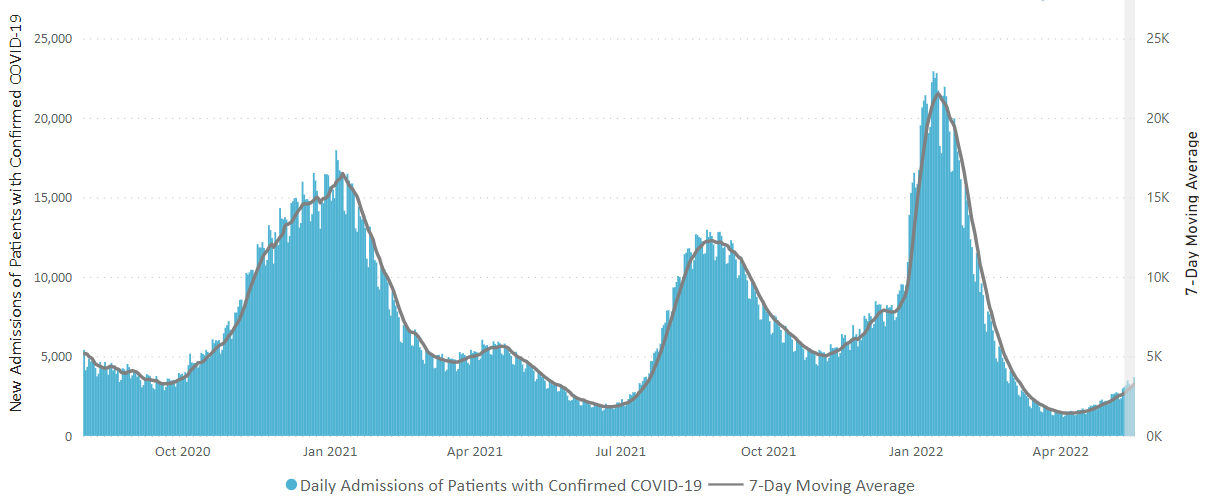
The current 7-day daily average for April 27–May 3, 2022, was 2,219. This is a 16.6% increase from the prior 7-day average (1,903) from April 20–26, 2022.

4,652,617
Total New Admissions

2,219
Current 7-Day Average

1,903
Prior 7-Day Average

+16.6%
Change in 7-Day Average

The start of consistent reporting of hospital admissions data was August 1, 2020.

Daily Trends in Number of New COVID-19 Hospital Admissions in the United States

resize iconView Larger
New admissions are pulled from a 10 am EDT snapshot of the HHS Unified Hospital Data – Analytic Dataset. Due to potential reporting delays, data from the most recent 7 days, as noted in the figure above with the grey bar, should be interpreted with caution. Small shifts in historic data may also occur due to changes in the Centers for Medicare & Medicaid Services (CMS) Provider of Services file, which is used to identify the cohort of included hospitals.

More Hospital Data

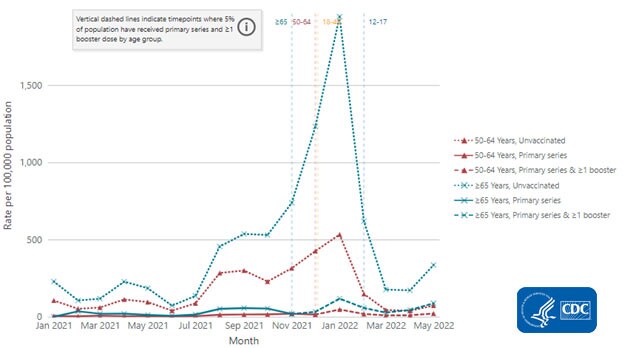
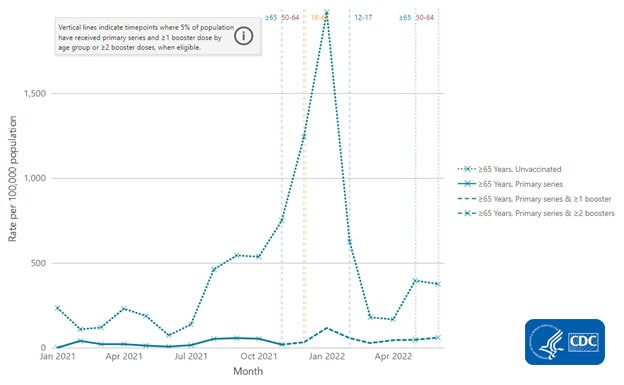
COVID-NET: Hospitalization Rates by Vaccination Status among Adults Ages 50 Years and Older


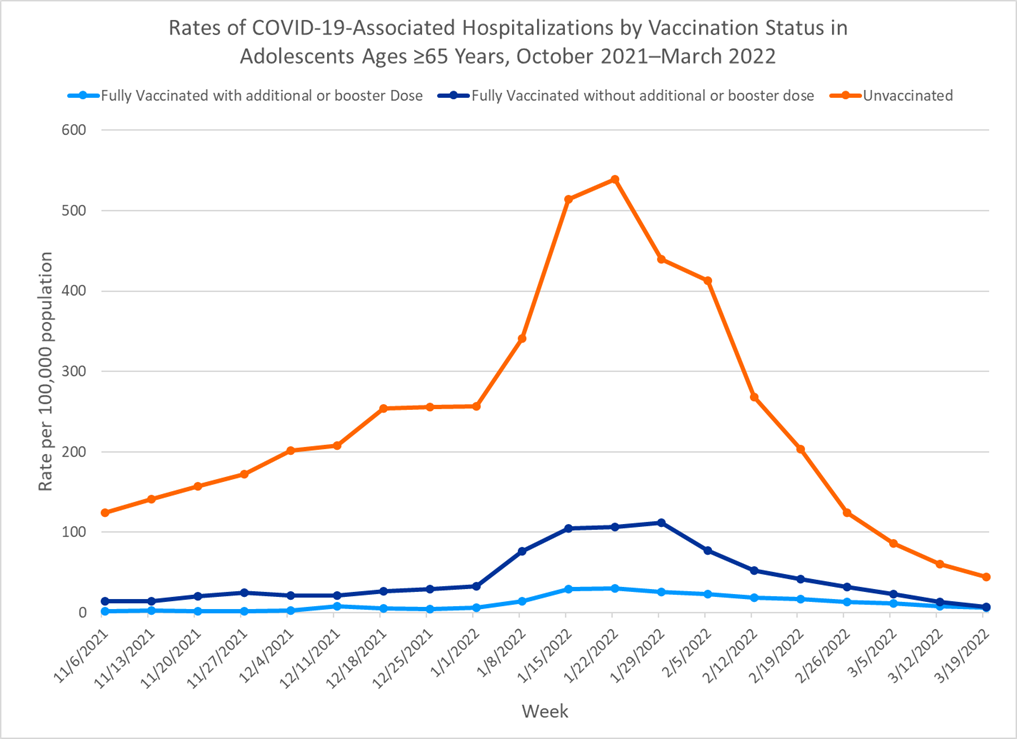
CDC’s Coronavirus Disease 2019-Associated Hospitalization Surveillance Network (COVID-NET) shows that rates of COVID-19-associated hospitalizations in March 2022 were higher in unvaccinated adults compared to adults who received a primary vaccination series plus a booster or additional dose of COVID-19 vaccine. Among adults ages 50–64 years, the COVID-19-associated hospitalization rate in March among unvaccinated persons was 4.7 times higher than among those who received a booster or additional dose. Among adults ages 65 years and older, the rate of COVID-19-associated hospitalizations was 6.2 times higher among unvaccinated adults compared with adults who received a booster or additional dose.

Hospitalization Rates by Vaccination Status among Adults Ages 65 Years and Older


resize iconView Larger
The Coronavirus Disease 2019 (COVID-19)-Associated Hospitalization Surveillance Network (COVID-NET) is an additional source for hospitalization data collected through a network of more than 250 acute-care hospitals in 14 states (representing ~10% of the U.S. population). Detailed data on patient demographics, including race/ethnicity, underlying medical conditions, medical interventions, and clinical outcomes, are collected using a standardized case reporting form.
More COVID-NET Data

Deaths


The current 7-day moving average of new deaths (334) has decreased 2.5% compared with the previous 7-day moving average (343). As of May 4, 2022, a total of 994,187 COVID-19 deaths have been reported in the United States.

994,187
Total Deaths Reported

334
Current 7-Day Average*

343
Prior 7-Day Average

-2.5%
Change in 7-Day Average Since Prior Week

*Historical deaths are excluded from the daily new deaths and 7-day average calculations until they are incorporated into the dataset by their applicable date. Of 21,721 historical deaths reported retroactively, 303 were reported in the current week; and 235 were reported in the prior week.

Daily Trends in Number of COVID-19 Deaths in the United States Reported to CDC
red-line.jpg

7-Day moving average

resize iconView Larger
More Death Data

Testing


The percentage of COVID-19 NAATs (nucleic acid amplification tests)* that are positive (percent positivity) is increasing in comparison to the previous week. The 7-day average of percent positivity from NAATs is now 7.4%. The 7-day average number of tests reported for April 22-28, 2022, was 754,129, up 22.3% from 616,619 for the prior 7 days.

870,773,474
Total Tests Reported

754,129
7-Day Average Tests Reported

7.4%
7-Day Average % Positivity

5.8%
Previous 7-Day Average % Positivity

+1.62
Percentage point change in 7-Day Average % Positivity since Prior Week

*Test for SARS-CoV-2, the virus that causes COVID-19

COVID-19 NAAT Laboratory Test 7-day Percent Positivity by State/Territory

resize iconView Larger
More Testing DataWastewater Surveillance


COVID Data Tracker’s Wastewater Surveillance tab tracks levels, changes, and detections of SARS-CoV-2* viral RNA in wastewater at more than 800 testing sites across the country. Because many people with COVID-19 shed the virus in their feces, wastewater testing can help us monitor COVID-19 in communities. Wastewater surveillance can provide an early warning of increasing COVID-19 cases and help communities prepare.

Currently, most sites are reporting low to moderate SARS-CoV-2 levels. But about 15% are seeing their highest levels since December 1, 2021. More than half of all sites are experiencing a modest increase. These increases often reflect minor changes from very low levels to levels that are still low. It’s important to note that even a small increase when levels are low can appear like a dramatic increase in the percent change. For more information on how to use wastewater data, visit CDC’s website.

*The virus that causes COVID-19

SARS-CoV-2 Levels in Wastewater by Site

resize iconView Larger
0% means levels are the lowest they have been at the site; 100% means levels are the highest they have been at the site.
wastewater-legend.jpg
More Wastewater Data
Top of Page
Content source: National Center for Immunization and Respiratory Diseases (NCIRD), Division of Viral Diseases

https://www.cdc.gov/coronavirus/2019-ncov/covid-data/covidview/index.html
 
covid-tracker-header-lrg.jpg

Print
Subscribe to the Weekly Review


Interpretive Summary for May 13, 2022
A Tragic Milestone

intro.jpg

The first COVID-19 death in the United States was recorded the week of January 11, 2020. More than two years later, we are approaching a tragic milestone: one million lives lost to COVID-19. The toll of this disease, the continued loss of life around the world, and the impact on our nation has been heartbreaking. Beyond causing sickness and death, the pandemic has triggered education disruptions, job loss, separation from friends and family, food insecurity, financial burden, and an unprecedented mental health crisis. By October 2021, more than 140,000 children in the United States had lost a parent or caregiver to COVID-19. Since then the number has risen to more than 241,000external icon.

The pandemic has affected everyone deeply, but some have experienced the burden of COVID-19 more than others. The past two years have shed light on the fact that health equity is still not a reality. Many racial and ethnic minority groups, older adults, people with disabilities, and people living in rural areas have been disproportionately impacted, putting them more at risk of severe illness and death from COVID-19. Efforts to tailor programs and messages must continue to ensure that everyone has equitable access to information, resources, vaccines, and treatments. When we focus our public health efforts on health equity, all communities will be stronger, safer, healthier, and more resilient.

Every life lost to COVID-19 is a tragedy and should be a reminder to continue taking precautions to prevent further serious illness and death. We have more tools now, like powerful vaccines and treatments, to protect ourselves and the people around us. We must continue to do our part to get vaccinated, remain up to date, and encourage others to do the same, to reduce the amount of COVID-19 in our communities, and protect those who are at increased risk of severe illness and death.
Note to Readers: The COVID-19 pandemic has had a major effect on our lives. Many of us are facing challenges and losses that can be stressful and overwhelming. CDC has resources to help people with the range of emotions they may face. For information on connecting with a trained mental health professional, visit the CDC webpage People Seeking Help.

A Closer Look

What's New
  • COVID Data Tracker is now available in Spanish. Visit Herramienta de seguimiento de datos del COVID-19 de los CDC.
  • COVID Data Tracker’s Vaccine Effectiveness page was updated to highlight the most current relevant studies and findings, allowing for easier interpretation. The page includes a summary table of CDC-authored vaccine effectiveness studies published in the previous month, as well as key findings from the studies by age group.
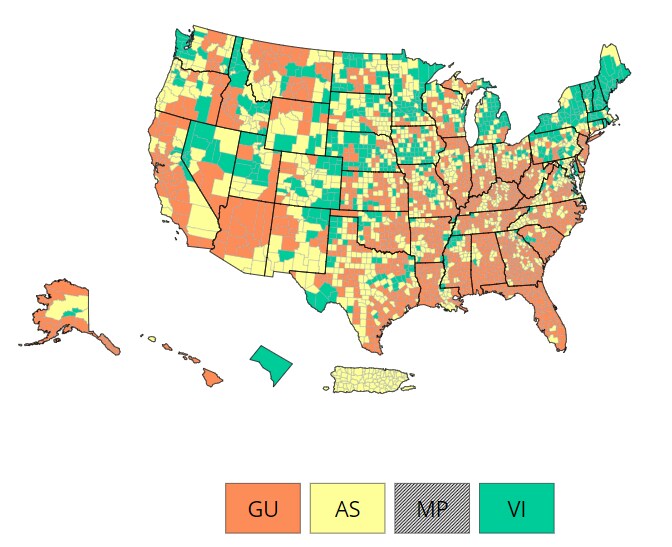

  • COVID Data Tracker’s Communications Toolkit now includes a resource that displays COVID-19 Community Levels over time.

COVID-19 Community Levels


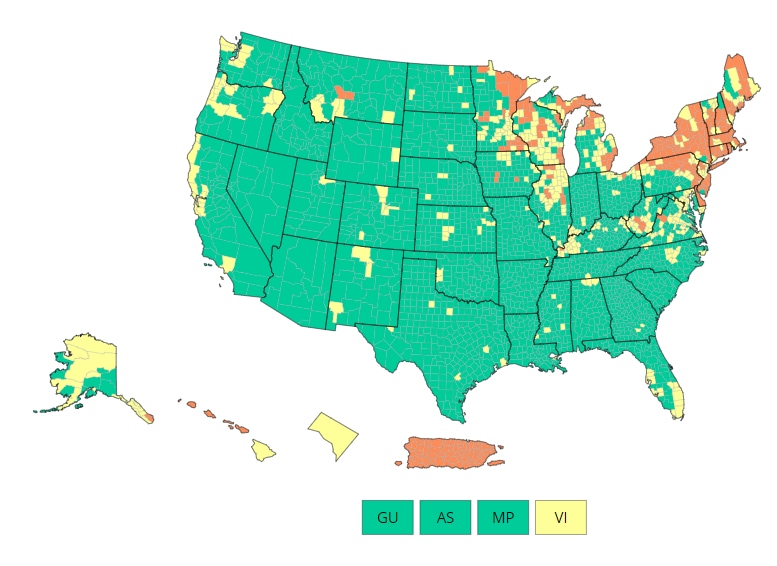
As of May 12, 2022, there are 137 (4.25%) counties, districts, or territories with a high COVID-19 Community Level, 453 (14.07%) counties with a medium Community Level, and 2,630 (81.68%) counties with a low Community Level. This represents a small (+1.77 percentage points) increase in the number of high-level counties, a moderate (+4.10 percentage points) increase in the number of medium-level counties, and a corresponding (−5.87 percentage points) decrease in the number of low-level counties. Eight (15.38%) of 52 jurisdictions had no high- or medium-level counties this week.

To check your COVID-19 Community Level, visit COVID Data Tracker.

U.S. COVID-19 Community Levels by County

resize iconView Larger
COVID19-Community-Levels-legend.jpg

COVID-19 Community Levels

Reported Cases


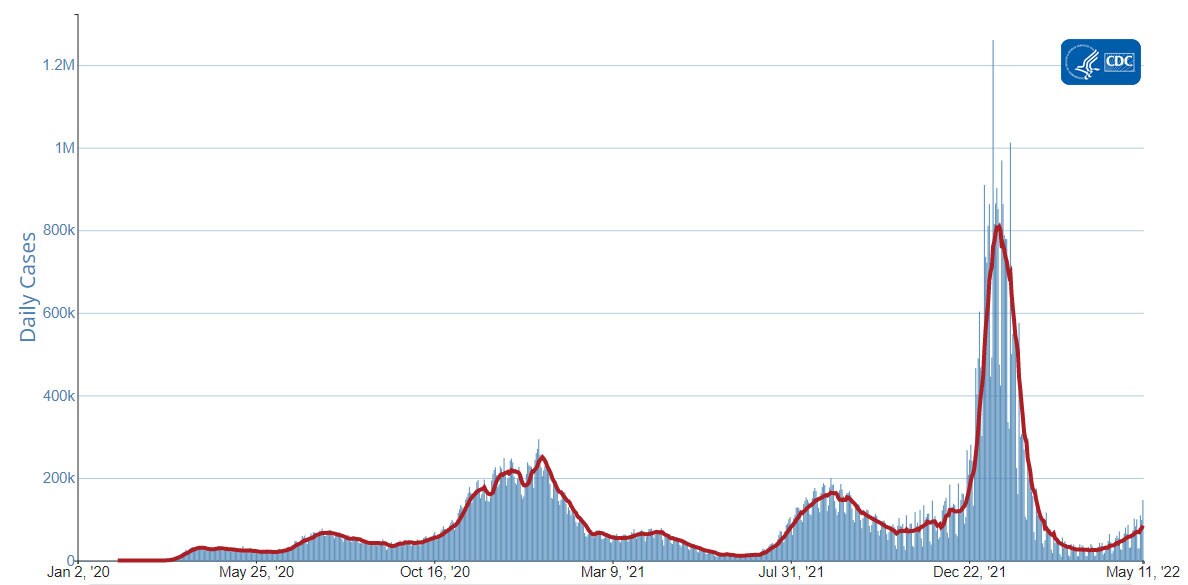
As of May 11, 2022, the current 7-day moving average of daily new cases (84,778) increased 30.7% compared with the previous 7-day moving average (64,863). A total of 82,087,117 COVID-19 cases have been reported in the United States as of May 11, 2022.

CDC Nowcast projections* for the week ending May 7, 2022, estimate the combined national proportion of lineages designated as Omicron to be 100%. There are several lineages of Omicron (B.1.1.529, BA.1, BA.2, BA.3, BA.4, and BA.5), and within each are multiple sublineages. COVID Data Tracker shows the proportions of Omicron lineages grouped as follows: the B.1.1.529 lineage (includes BA.1, BA.3, BA.4 and BA.5), the BA.1.1** lineage, the BA.2 lineage, and the BA.2.12.1 lineage. The predominant Omicron lineage in the United States is BA.2. The national proportion of BA.2 is projected to be 56.4% (95% PI 49.3-63.3%). The national proportion of BA.2.12.1 is projected to be 42.6% (95% PI 35.6-49.9%). BA.1.1 is projected to be 0.6% (95% PI 0.5-0.8%) and B.1.1.529 (BA.1, BA.3, BA.4 and BA.5) is projected to be 0.2% (95% PI 0.1-0.4%). Omicron is predicted to be 100% in all HHS regions.

82,087,117
Total Cases Reported

84,778
Current 7-Day Average***

64,863
Prior 7-Day Average

30.7%
Change in 7-Day Average since Prior Week

*The median time from specimen collection to sequence data reporting is about 3 weeks. As a result, weighted estimates for the most recent few weeks may be unstable or unavailable. CDC’s Nowcast is a data projection tool that helps fill this gap by generating timely estimates of variant proportions for variants that are circulating in the United States. View Nowcast estimates on CDC’s COVID Data Tracker website on the Variant Proportions page.

**For national data, the proportion of BA.1.1 is shown separately. For regional data, the proportion of BA.1.1 is also aggregated with B.1.1.529.

***Historical cases are excluded from daily new cases and 7-day average calculations until they are incorporated into the dataset for the applicable date. Of 522,870 historical cases reported retroactively, 5 were reported in the current week and 2,316 were reported in the prior week.

Daily Trends in COVID-19 Cases in the United States Reported to CDC
red-line.jpg

7-Day moving average

resize iconView Larger
More Case Data

Vaccinations


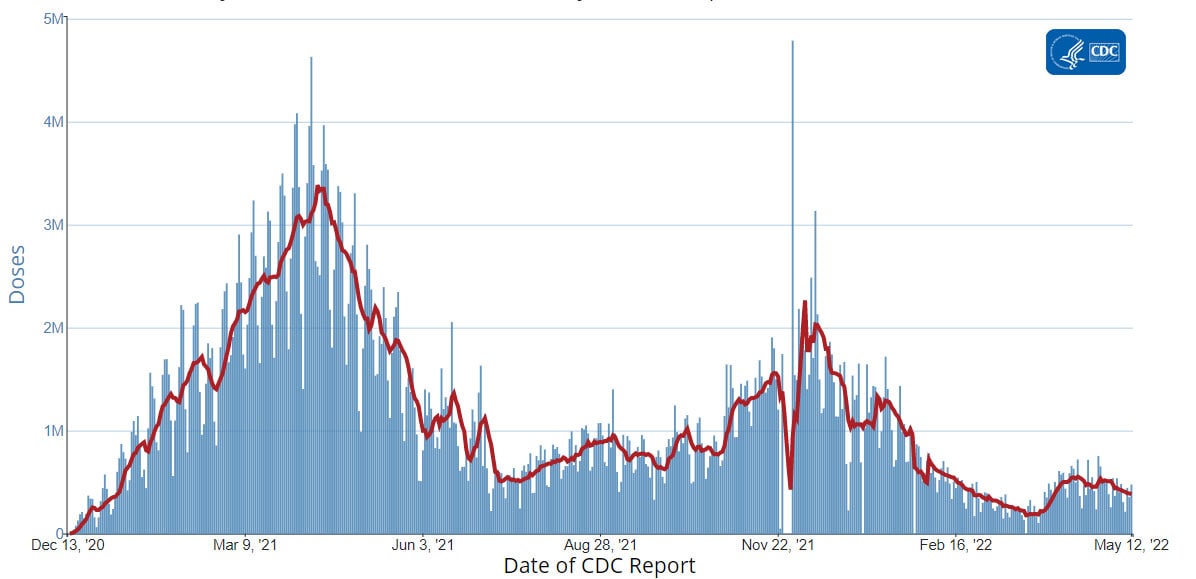
The U.S. COVID-19 Vaccination Program began December 14, 2020. As of May 12, 2022, 580.0 million vaccine doses have been administered in the United States. Overall, about 258.3 million people, or 77.8% of the total U.S. population, have received at least one dose of vaccine. About 220.3 million people, or 66.3% of the total U.S. population, have been fully vaccinated.* Of those fully vaccinated, about 101.5 million people have received a booster dose,** but 49.4% of the total booster-eligible population has not yet received a booster dose. As of May 11, 2022, the 7-day average number of administered vaccine doses reported (by date of CDC report) to CDC per day was 390,306, an 11.1% decrease from the previous week.

CDC’s COVID Data Tracker displays vaccination trends by age group, race/ethnicity, and urban/rural status. To see trends by age group and race/ethnicity, visit the Vaccination Demographic Trends tab. To see trends by urban/rural status, visit the COVID-19 Vaccination Equity tab.

580,038,981
Vaccine Doses Administered

258,284,015
People who received at least one dose

220,287,778
People who are fully vaccinated*

77.8%
Percentage of the U.S. population that has received at least one dose

66.3%
Percentage of the U.S. population that has been fully vaccinated*

+0.2
Percentage point increase from last week

+0.1
Percentage point increase from last week

*Represents the number of people who have received the second dose in a two-dose COVID-19 vaccine series (such as the Pfizer-BioNTech or Moderna vaccines) or one dose of the single-shot Johnson & Johnson’s Janssen vaccine.

**Represents the number of people who are fully vaccinated and have received another dose of COVID-19 vaccine since August 13, 2021. This includes people who received their first additional dose or booster.

Daily Change in the Total Number of Administered COVID-19 Vaccine Doses Reported to CDC by the Date of CDC Report, United States
red-line.jpg

7-Day moving average

resize iconView Larger
More Vaccination Data

Hospitalizations

New Hospital Admissions


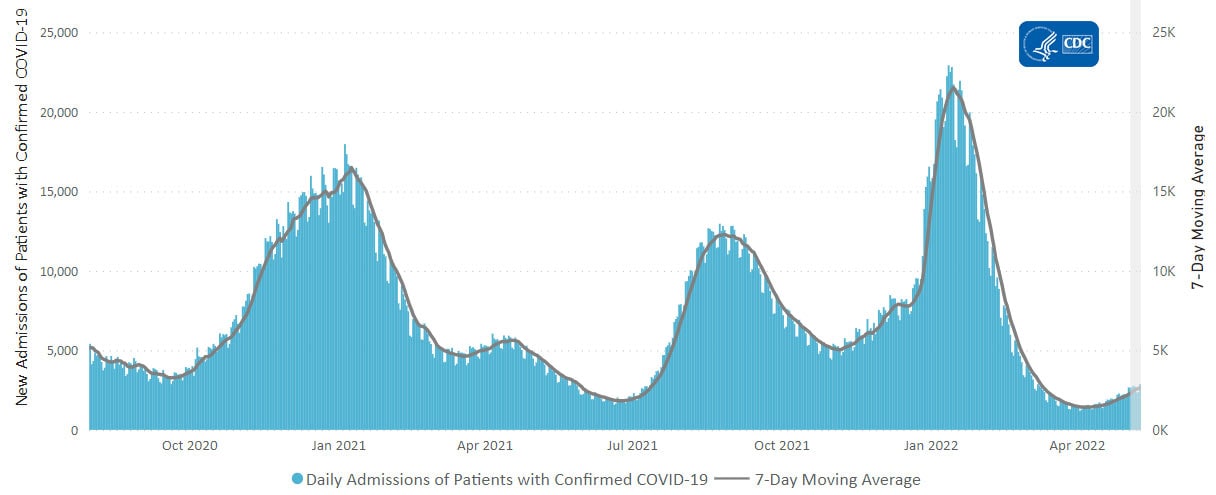
The current 7-day daily average for May 4–10, 2022, was 2,629. This is a 17.5% increase from the prior 7-day average (2,238) from April 27–May 3, 2022.

4,671,162
Total New Admissions

2,629
Current 7-Day Average

2,238
Prior 7-Day Average

+17.5%
Change in 7-Day Average

The start of consistent reporting of hospital admissions data was August 1, 2020.

Daily Trends in Number of New COVID-19 Hospital Admissions in the United States

resize iconView Larger
New admissions are pulled from a 10 am EDT snapshot of the HHS Unified Hospital Data – Analytic Dataset. Due to potential reporting delays, data from the most recent 7 days, as noted in the figure above with the grey bar, should be interpreted with caution. Small shifts in historic data may also occur due to changes in the Centers for Medicare & Medicaid Services (CMS) Provider of Services file, which is used to identify the cohort of included hospitals.

More Hospital Data

COVID-NET: Hospitalization Rates by Vaccination Status among Adults Ages 65 Years and Older


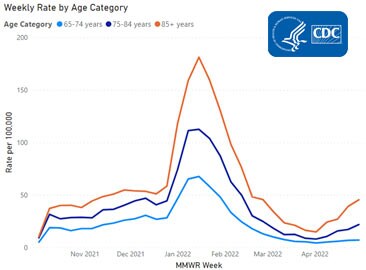
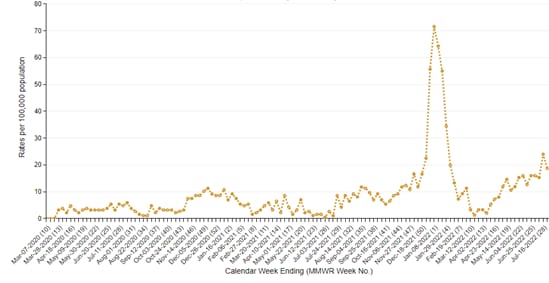
CDC’s Coronavirus Disease 2019-Associated Hospitalization Surveillance Network (COVID-NET) shows that overall rates of COVID-19-associated hospitalizations have increased since the week ending April 2, 2022. Notably, rates among adults ages 65 years and older have seen the sharpest increase in rates, from 6.5 per 100,000 population on April 2, to 15.6 per 100,000 population on April 30. Among this group, older adults ages 85 and older have had the largest increase in hospitalization rates, increasing from 14.8 per 100,000 population on April 2, to 45.4 per 100,000 population on April 30.

Hospitalization Rates among Adults Ages 65 Years and Older


resize iconView Larger


The Coronavirus Disease 2019 (COVID-19)-Associate­­d Hospitalization Surveillance Network (COVID-NET) is an additional source for hospitalization data collected through a network of more than 250 acute-care hospitals in 14 states (representing ~10% of the U.S. population). Detailed data on patient demographics, including race/ethnicity, underlying medical conditions, medical interventions, and clinical outcomes, are collected using a standardized case reporting form.


Deaths


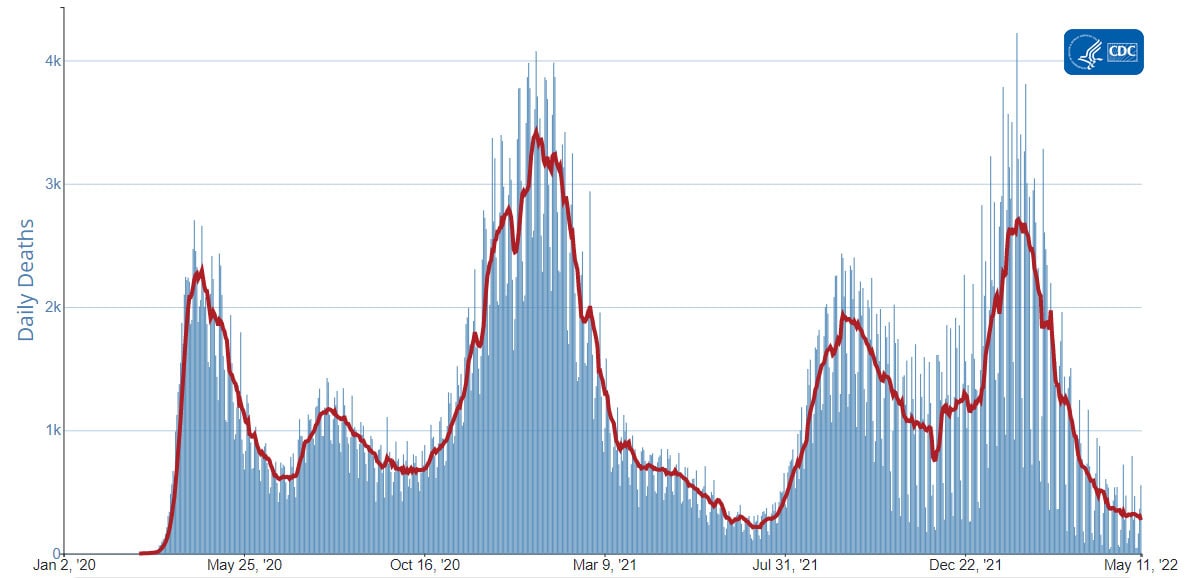
The current 7-day moving average of new deaths (273) has decreased 15.4% compared with the previous 7-day moving average (322). As of May 11, 2022, a total of 996,376 COVID-19 deaths have been reported in the United States.

996,376
Total Deaths Reported

273
Current 7-Day Average*

322
Prior 7-Day Average

-15.4%
Change in 7-Day Average Since Prior Week

*Historical deaths are excluded from the daily new deaths and 7-day average calculations until they are incorporated into the dataset by their applicable date. Of 21,721 historical deaths reported retroactively, 0 were reported in the current week; and 303 were reported in the prior week.

Daily Trends in Number of COVID-19 Deaths in the United States Reported to CDC
red-line.jpg

7-Day moving average

resize iconView Larger
More Death Data

Testing


The percentage of COVID-19 NAATs (nucleic acid amplification tests)* that are positive (percent positivity) is increasing in comparison to the previous week. The 7-day average of percent positivity from NAATs is now 9.1%. The 7-day average number of tests reported for April 29–May 5, 2022, was 746,765, down 4.6% from 783,008 for the prior 7 days.

876,537,308
Total Tests Reported

746,765
7-Day Average Tests Reported

9.1%
7-Day Average % Positivity

7.1%
Previous 7-Day Average % Positivity

+1.98
Percentage point change in 7-Day Average % Positivity since Prior Week

*Test for SARS-CoV-2, the virus that causes COVID-19

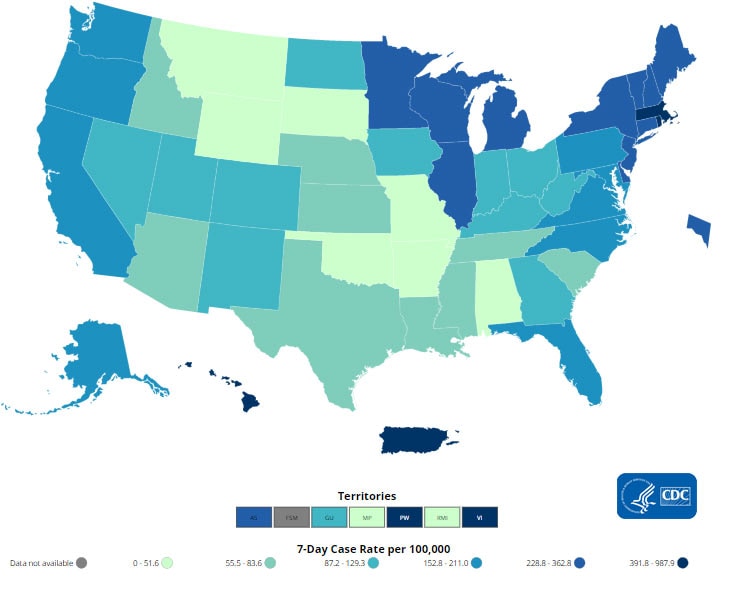
COVID-19 NAAT Laboratory Test 7-day Percent Positivity by State/Territory

resize iconView Larger
More Testing DataWastewater Surveillance


COVID Data Tracker’s Wastewater Surveillance tab tracks levels, changes, and detections of SARS-CoV-2* viral RNA in wastewater at more than 900 testing sites across the country.

Currently, most of the country is reporting low to moderate SARS-CoV-2 levels in wastewater. However, around 20% of sites are currently seeing some of the highest levels for those sites since December 1, 2021. More than half of all sites reporting wastewater data are experiencing a modest increase in SARS-CoV-2 levels. These increases often reflect minor changes from very low levels to levels that are still low. It’s important to note that even a small increase when levels are low can appear like a dramatic increase in the percent change. For more information on how to use wastewater data, visit CDC’s website.

*The virus that causes COVID-19

SARS-CoV-2 Levels in Wastewater by Site

resize iconView Larger


0% means levels are the lowest they have been at the site; 100% means levels are the highest they have been at the site.
More Wastewater DataA Closer Look

Understanding COVID-19 Mortality Surveillance Systems


Mortality (death) is a key metric in epidemiologic investigations. During the pandemic, CDC has used three main sources of death data for COVID-19 surveillance:
  • The National Center for Health Statistics’ (NCHS) National Vital Statistics System (NVSS): NVSS data are the gold standard for tracking deaths in the United States across a variety of health conditions, but they require time to collect and verify. NVSS collects official death certificate data from 57 jurisdictions (public health agencies in all 50 states; Washington, D.C.; New York City; and five territories), receiving about 60% of records within 10 days of the date of death. NCHS codes the cause of death, reviews the death certificate, and processes the data for use in surveillance and final mortality statistics. The coded certificates are shared back with the states, and these become the official counts of cause of death. NCHS publishes preliminary counts by cause of death with about a two-week lag and publishes final counts by cause of death 11 to 12 months after the conclusion of the calendar year. Sometimes, the NVSS data may be slower than case-based surveillance (lags of one to eight weeks or more), but they have more complete and accurate information on demographics and date of death.
  • COVID-19 Aggregate Case and Death Surveillance (ACS): In January 2020, CDC established the ACS system for tracking aggregate COVID-19 case and death data. ACS provides the timeliest information of the three systems, publishing the daily number of new and cumulative COVID-19 cases and deaths from each jurisdiction and summarizing the day-to-day changes. The data are based on date of report to the public health agency, but the actual date of death could be up to a few weeks earlier. The data are considered preliminary because the official death certificates might not yet have been processed with a coded cause of death. ACS data have proved critical for COVID-19 surveillance and continue to inform CDC’s response operations.
  • Case-level surveillance data: These data are collected at the individual level and provide more detailed information on cases and deaths than aggregate case reporting. Case-level data include patient demographics, such as age, race and ethnicity, signs and symptoms of illness, underlying health conditions, and possible routes of exposure. Public health agencies routinely link their case surveillance data and death registries to determine if and when a person may have died. The death information can be collected before or after NVSS death certificate processing. This source, like the aggregate case data, might underestimate the number of deaths because not everyone who has COVID-19 is officially identified as a case.
Mortality data continue to play a central role in the COVID-19 pandemic. The use of multiple data streams has informed CDC recommendations and established new data collection methods in preparation for future responses. All three CDC mortality systems yield roughly similar death trends but provide different levels of timeliness and detail. Across these three different systems, the collection of similar death counts, reinforces our confidence in the death statistics. The breadth of data collected during the COVID-19 response is unprecedented and would not be possible without the strong public health collaboration between CDC and its jurisdictional partners. Mortality data continue to be collected, aggregated, and made public via CDC’s COVID Data Tracker.

CDC continues to examine data collection procedures and is working to apply lessons learned from the COVID-19 pandemic in future efforts. For more information, visit CDC’s Public Health and Data Authority website.

https://www.cdc.gov/coronavirus/2019-ncov/covid-data/covidview/index.html
 
covid-tracker-header-lrg.jpg

Print
Subscribe to the Weekly Review


Interpretive Summary for May 20, 2022
It’s Time for a Boost


For the week ending May 20, 2022, cases and hospitalizations continued to rise as the United States marked one million deaths from COVID-19. While about 54% of the U.S. population is experiencing low COVID-19 Community Levels, many areas have moved into medium and high levels. COVID-19 Community Levels can help communities and individuals make decisions based on their local context and their unique needs.

COVID-19 vaccination remains the best option to lower your risk of severe illness, hospitalization, and death if you get infected. Many people have started vaccination, but most have not stayed up to date. About 78% of people in the United States have received at least one dose of a COVID-19 vaccine, and 66.5% are fully vaccinated. Of those who are fully vaccinated, 46.4% have received a booster and are considered up to date. Everyone ages 5 years and older is eligible to receive one booster after receiving their COVID-19 vaccine primary series. Some people are eligible to receive a second booster.

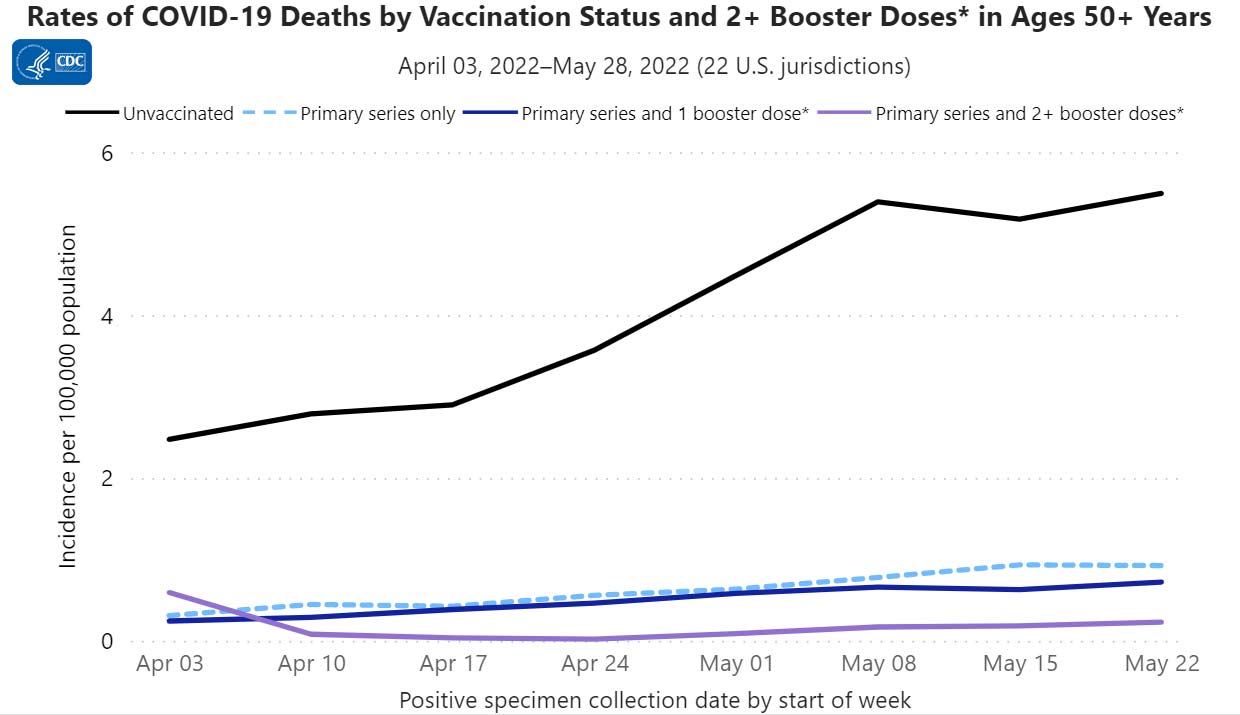
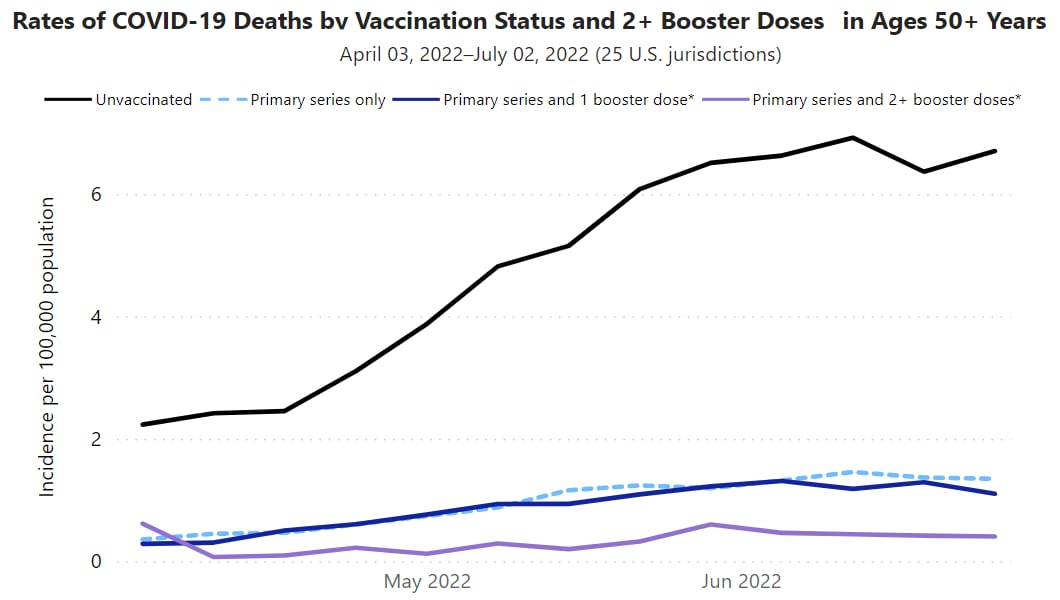
People who are up to date on vaccines have much lower risk of serious illness and death from COVID-19 compared with people who are unvaccinated. CDC’s COVID Data Tracker shows that in March 2022, adults ages 18 years and older who were unvaccinated were about 5 times more likely to be hospitalized with COVID-19 than those who were up to date. In the same month, people ages 12 years and older and unvaccinated were 17 times more likely to die of COVID-19 than those who were up to date.

COVID-19 vaccines available in the United States are effective at protecting people from getting seriously ill, being hospitalized, and even dying—especially people who are boosted. As with other diseases, you are protected best from COVID-19 when you stay up to date with recommended vaccines. Find a vaccine provider near you.

Note to Readers: CDC will not publish the COVID Data Tracker Weekly Review on Friday, May 27, 2022. The Weekly Review will resume publication on Friday, June 3, 2022. To find all the latest COVID-19 data, visit COVID Data Tracker.


What's New

COVID-19 Community Levels


As of May 19, 2022, there are 301 (9.35%) counties, districts, or territories with a high COVID-19 Community Level, 477 (14.81%) counties with a medium Community Level, and 2,442 (75.84%) counties with a low Community Level. This represents a moderate (+5.10 percentage points) increase in the number of high-level counties, a slight (−0.74 percentage points) decrease in the number of medium-level counties, and a corresponding (−5.84 percentage points) decrease in the number of low-level counties. Five (9.62%) of 52 jurisdictions had no high- or medium-level counties this week.

To check your COVID-19 Community Level, visit COVID Data Tracker.

U.S. COVID-19 Community Levels by County

resize iconView Larger
COVID19-Community-Levels-legend.jpg

COVID-19 Community Levels

Reported Cases


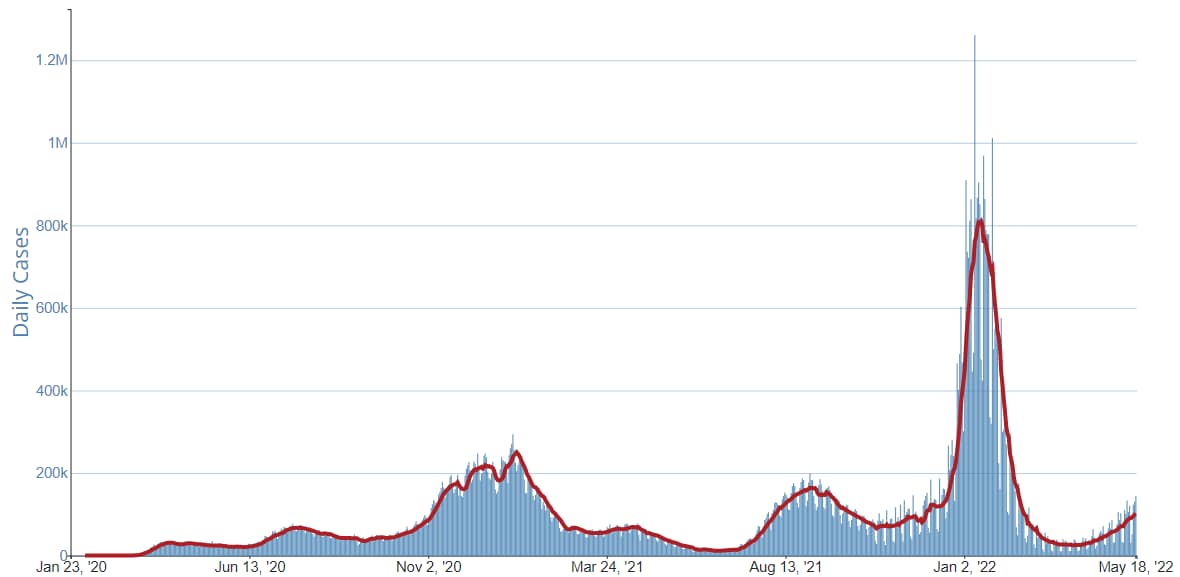
As of May 18, 2022, the current 7-day moving average of daily new cases (101,130) increased by 18.8% compared with the previous 7-day moving average (85,143). A total of 82,820,565 COVID-19 cases have been reported in the United States as of May 18, 2022.

CDC Nowcast projections* for the week ending May 14, 2022, estimate the combined national proportion of lineages designated as Omicron to be 100%. There are several lineages of Omicron (B.1.1.529, BA.1, BA.2, BA.3, BA.4, and BA.5), and within each are multiple sublineages. COVID Data Tracker shows the proportions of Omicron lineages grouped as follows: the B.1.1.529 lineage (includes BA.1, BA.3, BA.4 and BA.5), the BA.1.1** lineage, the BA.2 lineage, and the BA.2.12.1 lineage. The predominant Omicron lineage in the United States is BA.2. The national proportion of BA.2 is projected to be 50.9% (95% PI 44.9-56.9%). The national proportion of BA.2.12.1 is projected to be 47.5% (95% PI 41.5-53.5%). B.1.1.529 (BA.1, BA.3, BA.4 and BA.5) is projected to be 1.2% (95% PI 0.6-2.2%), and BA.1.1 is projected to be 0.3% (95% PI 0.2-0.4%). Omicron is predicted to be 100% in all HHS regions.

82,820,565
Total Cases Reported

101,130
Current 7-Day Average***

85,143
Prior 7-Day Average

18.8%
Change in 7-Day Average since Prior Week

**The median time from specimen collection to sequence data reporting is about 3 weeks. As a result, weighted estimates for the most recent few weeks may be unstable or unavailable. CDC’s Nowcast is a data projection tool that helps fill this gap by generating timely estimates of variant proportions for variants that are circulating in the United States. View Nowcast estimates on CDC’s COVID Data Tracker website on the Variant Proportions page.

**For national data, the proportion of BA.1.1 is shown separately. For regional data, the proportion of BA.1.1 is also aggregated with B.1.1.529.

***Historical cases are excluded from daily new cases and 7-day average calculations until they are incorporated into the dataset for the applicable date. Of 533,665 historical cases reported retroactively, 10,795 were reported in the current week and 5 were reported in the prior week.


Daily Trends in COVID-19 Cases in the United States Reported to CDC
red-line.jpg

7-Day moving average

resize iconView Larger
More Case Data

Vaccinations


The U.S. COVID-19 Vaccination Program began December 14, 2020. As of May 18, 2022, 582.8 million vaccine doses have been administered in the United States. Overall, about 258.0 million people, or 77.7% of the total U.S. population, have received at least one dose of vaccine. About 220.7 million people, or 66.5% of the total U.S. population, have been fully vaccinated.* Of those fully vaccinated, about 102.4 million people have received a booster dose,** but 49.1% of the total booster-eligible population has not yet received a booster dose. As of May 18, 2022, the 7-day average number of administered vaccine doses reported (by date of CDC report) to CDC per day was 388,308, a 0.5% decrease from the previous week.

CDC’s COVID Data Tracker displays vaccination trends by age group, race/ethnicity, and urban/rural status. To see trends by age group and race/ethnicity, visit the Vaccination Demographic Trends tab. To see trends by urban/rural status, visit the COVID-19 Vaccination Equity tab.

582,757,136
Vaccine Doses Administered

258,008,907
People who received at least one dose

220,739,345
People who are fully vaccinated*

77.7%
Percentage of the U.S. population that has received at least one dose

66.5%
Percentage of the U.S. population that has been fully vaccinated*

-0.1
Percentage point increase from last week

+0.2
Percentage point increase from last week

*Represents the number of people who have received the second dose in a two-dose COVID-19 vaccine series (such as the Pfizer-BioNTech or Moderna vaccines) or one dose of the single-shot Johnson & Johnson’s Janssen vaccine.

**Represents the number of people who are fully vaccinated and have received another dose of COVID-19 vaccine since August 13, 2021. This includes people who received their first additional dose or booster.

Daily Change in the Total Number of Administered COVID-19 Vaccine Doses Reported to CDC by the Date of CDC Report, United States
red-line.jpg

7-Day moving average

resize iconView Larger
More Vaccination Data

Hospitalizations

New Hospital Admissions


The current 7-day daily average for May 11–17, 2022, was 3,250. This is a 24.2% increase from the prior 7-day average (2,617) from May 4–10, 2022.

4,693,725
Total New Admissions

3,250
Current 7-Day Average

2,617
Prior 7-Day Average

+24.2%
Change in 7-Day Average

The start of consistent reporting of hospital admissions data was August 1, 2020.

Daily Trends in Number of New COVID-19 Hospital Admissions in the United States

resize iconView Larger
New admissions are pulled from a 10 am EDT snapshot of the HHS Unified Hospital Data – Analytic Dataset. Due to potential reporting delays, data from the most recent 7 days, as noted in the figure above with the grey bar, should be interpreted with caution. Small shifts in historic data may also occur due to changes in the Centers for Medicare & Medicaid Services (CMS) Provider of Services file, which is used to identify the cohort of included hospitals.

More Hospital Data

COVID-NET: Hospitalization Rates among Certain Racial and Ethnic Groups


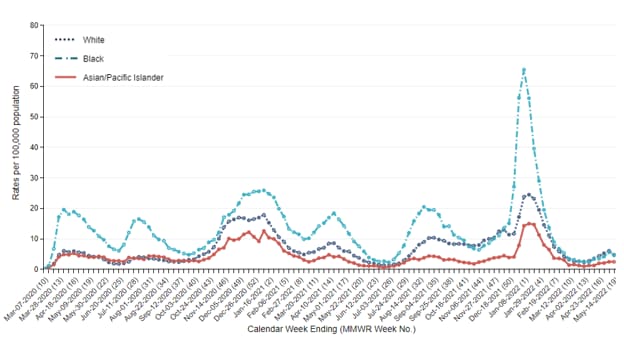
CDC’s Coronavirus Disease 2019-Associated Hospitalization Surveillance Network (COVID-NET) shows that overall rates of COVID-19-associated hospitalizations have increased more sharply within certain racial and ethnic groups. The largest increase was seen among non-Hispanic White persons when rates increased from 2.3 per 100,000 population for week ending April 2 to 5.3 per 100,000 population for the week ending May 7, 2022. Rates among non-Hispanic Black persons also increased, from 2.3 per 100,000 population on April 2 to 4.2 per 100,000 population on May 7. Additionally, rates among non-Hispanic Asian and Pacific Islander persons have increased from 1.0 per 100,000 population on April 2 to 2.1 per 100,000 population on May 7.

Rates of COVID-19-Associated Hospitalizations among non-Hispanic White, Black, and Asian/Pacific Islander Persons


resize iconView Larger


The Coronavirus Disease 2019 (COVID-19)-Associate­­d Hospitalization Surveillance Network (COVID-NET) is an additional source for hospitalization data collected through a network of more than 250 acute-care hospitals in 14 states (representing ~10% of the U.S. population). Detailed data on patient demographics, including race/ethnicity, underlying medical conditions, medical interventions, and clinical outcomes, are collected using a standardized case reporting form.


Deaths


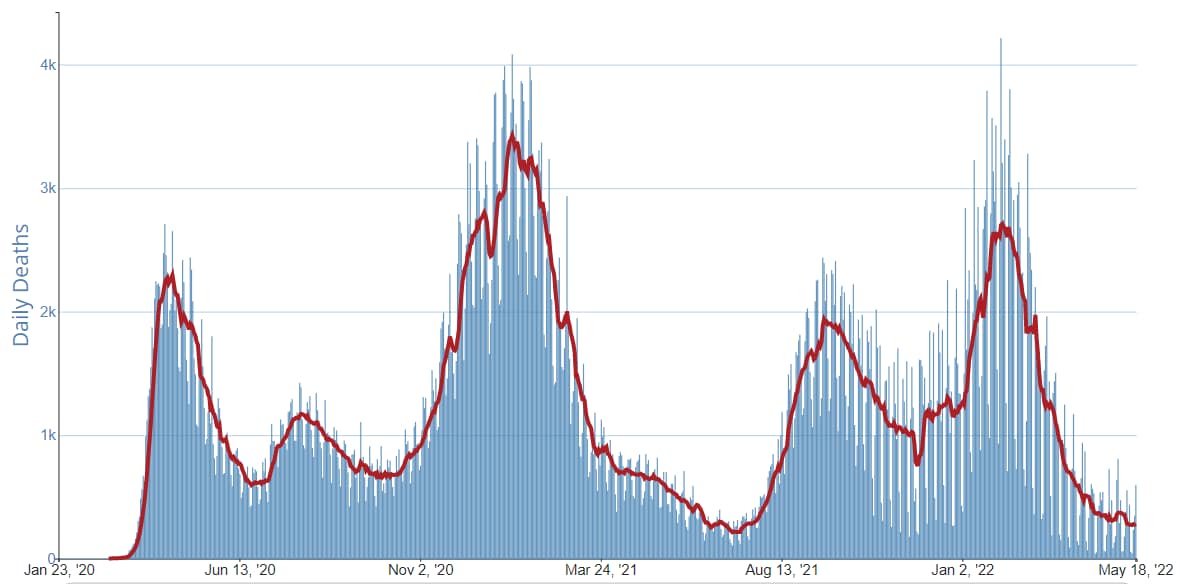
The current 7-day moving average of new deaths (280) has decreased 1.2% compared with the previous 7-day moving average (284). As of May 18, 2022, a total of 998,512 COVID-19 deaths have been reported in the United States.

998,512
Total Deaths Reported

280
Current 7-Day Average*

284
Prior 7-Day Average

-1.2%
Change in 7-Day Average Since Prior Week

*Historical deaths are excluded from the daily new deaths and 7-day average calculations until they are incorporated into the dataset by their applicable date. Of 21,418 historical deaths reported retroactively, 0 were reported in the current week; and 0 were reported in the prior week.

Daily Trends in Number of COVID-19 Deaths in the United States Reported to CDC
red-line.jpg

7-Day moving average

resize iconView Larger
More Death Data

Testing


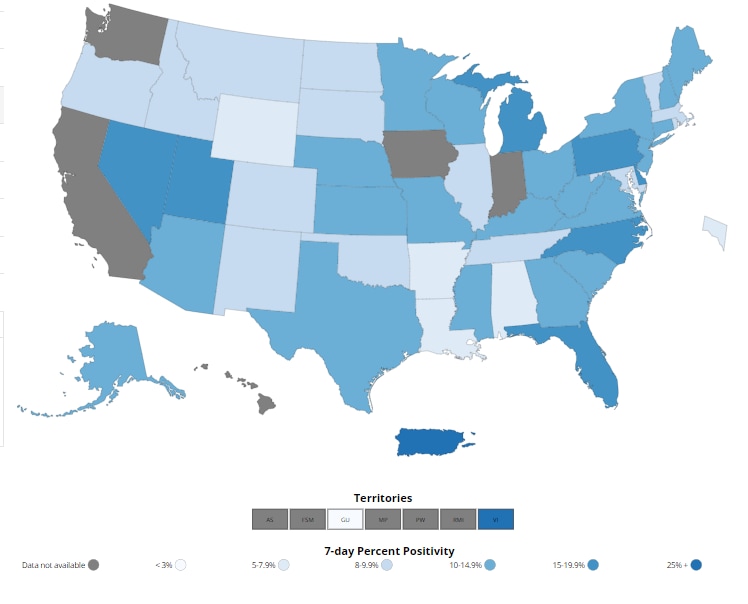
The percentage of COVID-19 NAATs (nucleic acid amplification tests)* that are positive (percent positivity) is increasing in comparison to the previous week. The 7-day average of percent positivity from NAATs is now 10.6%. The 7-day average number of tests reported for May 6-May 12, 2022, was 798,164, up 0.9% from 791,248 for the prior 7 days.

882,620,173
Total Tests Reported

798,164
7-Day Average Tests Reported

10.6%
7-Day Average % Positivity

8.6%
Previous 7-Day Average % Positivity

+2.01
Percentage point change in 7-Day Average % Positivity since Prior Week

*Test for SARS-CoV-2, the virus that causes COVID-19

COVID-19 NAAT Laboratory Test 7-day Percent Positivity by State/Territory

resize iconView Larger
More Testing DataWastewater Surveillance


COVID Data Tracker’s Wastewater Surveillance tab tracks levels, changes, and detections of SARS-CoV-2* viral RNA in wastewater at nearly 900 testing sites across the country.

Currently, most of the country is reporting moderate SARS-CoV-2 levels in wastewater. Around 27% of sites are currently seeing some of the highest levels for those sites since December 1, 2021. More than half of all sites reporting wastewater data are experiencing a modest increase in SARS-CoV-2 levels, but about a quarter of sites are reporting a decrease in SARS-CoV-2 levels in wastewater. It’s important to note that even a small increase when levels are low can appear like a dramatic increase in the percent change. For more information on how to use wastewater data, visit CDC’s website.

*The virus that causes COVID-19

SARS-CoV-2 Levels in Wastewater by Site

resize iconView Larger


0% means levels are the lowest they have been at the site; 100% means levels are the highest they have been at the site.
 
covid-tracker-header-lrg.jpg

Print
Subscribe to the Weekly Review


Interpretive Summary for June 3, 2022
The Time is Now


On May 19, 2022, CDC recommended that children ages 5 through 11 years old receive a booster five months after completion of their initial Pfizer-BioNTech COVID-19 vaccination series. This means that everyone ages 5 years and older in the United States is now eligible for a booster.

COVID-19 cases are increasing across the country, yet vaccination rates among children ages 5 through 11 years old continue to lag behind other age groups, which leaves them at increased risk for serious illness. As of June 1, 2022, 35.9% of children ages 5 through 11 years old have received at least one dose of a COVID-19 vaccine, compared to 69.5% of children ages 12 through 17 years old. Since the pandemic began, more than 4.8 million children ages 5 through 11 years old have been diagnosed with COVID-19, 15,000 have been hospitalized, and almost 200 have died.

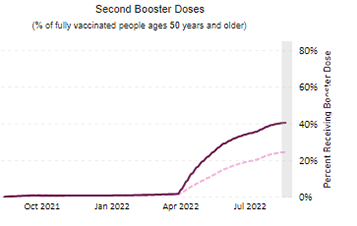
CDC also strengthened its recommendation that adults ages 50 years and older, as well as those 12 years and older who have weakened immune systems, should get a second booster at least four months after their first. Older Americans have the highest coverage of any age group of first booster doses, but most received their last dose (either their primary series or their first booster dose) many months ago, leaving many without optimal protection against serious illness, hospitalization, and death.

Bottom line: Whether it is your first or second booster, if you haven’t had a vaccine dose since the beginning of December 2021 or earlier and you are eligible, now is the time to get one. CDC developed a tool to help you understand your need for booster doses based on your age, health conditions, and vaccine history. After you use the tool, visit vaccines.gov to find a vaccine provider near you.


What's New
COVID-19 Community Levels


As of June 2, 2022, there are 240 (7.45%) counties, districts, or territories with a high COVID-19 Community Level, 733 (22.76%) counties with a medium Community Level, and 2,247 (69.78%) counties with a low Community Level. This represents a slight (−0.53 percentage points) decrease in the number of high-level counties, a small (+1.37 percentage points) increase in the number of medium-level counties, and a corresponding (−0.84 percentage points) decrease in the number of low-level counties. Fifty-one (98.1%) of 52 jurisdictions had high- or medium-level counties this week.

To check your COVID-19 Community Level, visit COVID Data Tracker. To learn which prevention measures are recommended based on your COVID-19 Community Level, visit COVID-19 Community Level and COVID-19 Prevention.

U.S. COVID-19 Community Levels by County

View Larger
COVID19-Community-Levels-legend.jpg

COVID-19 Community Levels
Reported Cases


As of June 1, 2022, the current 7-day moving average of daily new cases (100,684) decreased 8.5% compared with the previous 7-day moving average (110,081). A total of 84,315,762 COVID-19 cases have been reported in the United States as of June 1, 2022.

CDC Nowcast projections* for the week ending May 28, 2022, estimate the combined national proportion of lineages designated as Omicron to be 100%. There are several lineages of Omicron (B.1.1.529, BA.1, BA.2, BA.3, BA.4, and BA.5), and within each are multiple sublineages. COVID Data Tracker shows the proportions of Omicron lineages grouped as follows: the B.1.1.529 lineage (includes BA.1, BA.3, BA.4, and BA.5), the BA.1.1** lineage, the BA.2 lineage, and the BA.2.12.1 lineage. The predominant Omicron lineage in the United States is BA.2.12.1. The national proportion of BA.2.12.1 is projected to be 59.1% (95% PI 54.7-63.3%). The national proportion of BA.2 is projected to be 34.7% (95% PI 30.8-38.8%). B.1.1.529 (BA.1, BA.3, BA.4 and BA.5) is projected to be 6.1% (95% PI 4.1-8.8%), and BA.1.1 is projected to be 0.1% (95% PI 0.0-0.1%). Omicron is predicted to be 100% in all HHS regions.

84,315,762
Total Cases Reported

100,684
Current 7-Day Average***

110,081
Prior 7-Day Average

-8.5%
Change in 7-Day Average since Prior Week

*The median time from specimen collection to sequence data reporting is about 3 weeks. As a result, weighted estimates for the most recent few weeks may be unstable or unavailable. CDC’s Nowcast is a data projection tool that helps fill this gap by generating timely estimates of variant proportions for variants that are circulating in the United States. View Nowcast estimates on CDC’s COVID Data Tracker website on the Variant Proportions page.

**For national data, the proportion of BA.1.1 is shown separately. For regional data, the proportion of BA.1.1 is also aggregated with B.1.1.529.

***Historical cases are excluded from daily new cases and 7-day average calculations until they are incorporated into the dataset for the applicable date. Of 533,663 historical cases reported retroactively, 0 were reported in the current week and 3 were reported in the prior week.

Daily Trends in COVID-19 Cases in the United States Reported to CDC
red-line.jpg

7-Day moving average

View Larger
More Case Data
Vaccinations


The U.S. COVID-19 Vaccination Program began December 14, 2020. As of June 1, 2022, 587.8 million vaccine doses have been administered in the United States. Overall, about 258.7 million people, or 77.9% of the total U.S. population, have received at least one dose of vaccine. About 221.4 million people, or 66.7% of the total U.S. population, have been fully vaccinated.* Of those fully vaccinated, about 103.5 million people have received a booster dose,** but 49.0% of the total booster-eligible population has not yet received a booster dose. As of June 1, 2022, the 7-day average number of administered vaccine doses reported (by date of CDC report) to CDC per day was 343,662, a 9.5% decrease from the previous week.

CDC’s COVID Data Tracker displays vaccination trends by age group, race/ethnicity, and urban/rural status. To see trends by age group and race/ethnicity, visit the Vaccination Demographic Trends tab. To see trends by urban/rural status, visit the COVID-19 Vaccination Equity tab.

587,821,662
Vaccine Doses Administered

258,655,540
People who received at least one dose

221,350,544
People who are fully vaccinated*

77.9%
Percentage of the U.S. population that has received at least one dose

66.7%
Percentage of the U.S. population that has been fully vaccinated*

+0.2
Percentage point increase from last week

+0.2
Percentage point increase from last week

*Represents the number of people who have received the second dose in a two-dose COVID-19 vaccine series (such as the Pfizer-BioNTech or Moderna vaccines) or one dose of the single-shot Johnson & Johnson’s Janssen vaccine.

**Represents the number of people who are fully vaccinated and have received another dose of COVID-19 vaccine since August 13, 2021. This includes people who received their first additional dose or booster dose.

Daily Change in the Total Number of Administered COVID-19 Vaccine Doses Reported to CDC by the Date of CDC Report, United States
red-line.jpg

7-Day moving average

View Larger
More Vaccination Data
Hospitalizations

New Hospital Admissions


The current 7-day daily average for May 25–31, 2022, was 3,789. This is a 4.7% increase from the prior 7-day average (3,619) from May 18–24, 2022.

4,745,738
Total New Admissions

3,789
Current 7-Day Average

3,619
Prior 7-Day Average

+4.7%
Change in 7-Day Average

The start of consistent reporting of hospital admissions data was August 1, 2020.

Daily Trends in Number of New COVID-19 Hospital Admissions in the United States

View Larger
New admissions are pulled from a 10 am EDT snapshot of the HHS Unified Hospital Data – Analytic Dataset. Due to potential reporting delays, data from the most recent 7 days, as noted in the figure above with the grey bar, should be interpreted with caution. Small shifts in historic data may also occur due to changes in the Centers for Medicare & Medicaid Services (CMS) Provider of Services file, which is used to identify the cohort of included hospitals.

More Hospital Data
COVID-NET: Hospitalization Rates among Adults Ages 65 Years and Older


CDC’s Coronavirus Disease 2019-Associated Hospitalization Surveillance Network (COVID-NET) shows that overall rates of COVID-19-associated hospitalizations have increased since the week ending April 2, 2022. Notably, adults ages 65 years and older have seen the sharpest increase in rates, from 6.7 per 100,000 population on April 2, to 24.3 per 100,000 population on May 14. Among this group, older adults ages 85 and older have had the largest increase in hospitalization rates, increasing from 14.8 per 100,000 population on April 2, to 68.7 per 100,000 population on May 14.

Hospitalization Rates among Adults Ages 65 Years and Older


View Larger


The Coronavirus Disease 2019 (COVID-19)-Associate­­d Hospitalization Surveillance Network (COVID-NET) is an additional source for hospitalization data collected through a network of more than 250 acute-care hospitals in 14 states (representing ~10% of the U.S. population). Detailed data on patient demographics, including race/ethnicity, underlying medical conditions, medical interventions, and clinical outcomes, are collected using a standardized case reporting form.
More COVID-NET Data
Deaths


The current 7-day moving average of new deaths (244) has decreased 23.1% compared with the previous 7-day moving average (318). As of June 1, 2022, a total of 1,002,993 COVID-19 deaths have been reported in the United States.

1,002,993
Total Deaths Reported

244
Current 7-Day Average*

318
Prior 7-Day Average

-23.1%
Change in 7-Day Average Since Prior Week

*Historical deaths are excluded from the daily new deaths and 7-day average calculations until they are incorporated into the dataset by their applicable date. Of 21,705 historical deaths reported retroactively, 133 were reported in the current week; and 154 were reported in the prior week.

Daily Trends in Number of COVID-19 Deaths in the United States Reported to CDC
red-line.jpg

7-Day moving average

View Larger
More Death Data
Testing


The percentage of COVID-19 NAATs (nucleic acid amplification tests)* that are positive (percent positivity) is increasing in comparison to the previous week. The 7-day average of percent positivity from NAATs is now 11.7%. The 7-day average number of tests reported for May 20-May 26, 2022, was 855,184, down 2.4% from 876,467 for the prior 7 days.

894,951,691
Total Tests Reported

855,184
7-Day Average Tests Reported

11.7%
7-Day Average % Positivity

11.0%
Previous 7-Day Average % Positivity

+0.74
Percentage point change in 7-Day Average % Positivity since Prior Week

*Test for SARS-CoV-2, the virus that causes COVID-19

COVID-19 NAAT Laboratory Test 7-day Percent Positivity by State/Territory

View Larger
More Testing DataWastewater Surveillance


COVID Data Tracker’s Wastewater Surveillance tab tracks levels, changes, and detections of SARS-CoV-2* viral RNA in wastewater at nearly 900 testing sites across the country.

Currently, most of the country is reporting moderate SARS-CoV-2 levels in wastewater. Around 32% of sites are currently seeing some of the highest levels for those sites since December 1, 2021. Additionally, more than half of all sites reporting wastewater data are experiencing a modest increase in SARS-CoV-2 levels, but about 40% of sites are reporting a decrease in SARS-CoV-2 levels in wastewater. It’s important to note that even a small increase when levels are low can appear like a dramatic increase in the percent change.

This week, a Wastewater Metric Chart was added to COVID Data Tracker’s Wastewater Surveillance page. This chart shows how virus levels in wastewater have increased or decreased across the United States since January 2021. For more information on how to use wastewater data, visit CDC’s National Wastewater Surveillance System website.

*The virus that causes COVID-19

SARS-CoV-2 Levels in Wastewater by Site

View Larger


0% means levels are the lowest they have been at the site; 100% means levels are the highest they have been at the site.
More Wastewater Data

https://www.cdc.gov/coronavirus/2019-ncov/covid-data/covidview/index.html
 
covid-tracker-header-lrg.jpg

Print
Subscribe to the Weekly Review


Interpretive Summary for June 10, 2022
Intro-06102022.jpg
Happy Campers


As we head into summer, many people are at much lower risk of serious illness, hospitalization, and death from COVID-19 because of increased immunity through vaccination or previous infection. Almost 71% of the U.S. population ages 5 years and older has completed their primary COVID-19 vaccine series, and treatments are widely available. While this is certainly good news, it is still important to protect yourself and others around you, including those who are at increased risk for severe illness.

CDC recently updated its guidance for K–12 schools and early care and education settings, which also applies to summer camps. Based on the COVID-19 Community Levels, this guidance gives schools and camps the flexibility to adapt to their changing local situations. It features a variety of strategies for keeping all kids safe, like promoting vaccination, offering testing, ensuring proper ventilation, and encouraging hand hygiene and mask-wearing. The guidance also provides advice on what to do if an outbreak occurs, regardless of community level. If you’re sending your kids to camp this summer, ask the camp director what steps they are taking to prevent COVID-19.

Make sure this summer is a safe one! Check your COVID-19 Community Level when planning activities, consider getting tested before you travel, and remember that being outdoors is safest. CDC recommends COVID-19 vaccines, including boosters, for everyone ages 5 years and older. Use CDC’s COVID-19 booster tool to learn if and when you can get boosters to stay up to date and protected with your COVID-19 vaccines.

Note to Readers: Learn more about COVID-19 vaccine recommendations for people who are moderately or severely immunocompromised.


What's New
COVID-19 Community Levels


As of June 9, 2022, there are 314 (9.75%) counties, districts, or territories with a high COVID-19 Community Level, 1,052 (32.67%) counties with a medium Community Level, and 1,854 (57.58%) counties with a low Community Level. This represents a small (+2.20 percentage points) increase in the number of high-level counties, a moderate (+9.57 percentage points) increase in the number of medium-level counties, and a corresponding (−11.77 percentage points) decrease in the number of low-level counties. Fifty-two (100%) of 52 jurisdictions* had high- or medium-level counties this week.

To check your COVID-19 Community Level, visit COVID Data Tracker. To learn which prevention measures are recommended based on your COVID-19 Community Level, visit COVID-19 Community Level and COVID-19 Prevention.

*Includes the 50 states, the District of Columbia, and Puerto Rico.

U.S. COVID-19 Community Levels by County

View Larger
Community-Level-2-06102022.jpg

COVID-19 Community Levels
Reported Cases


As of June 8, 2022, the current 7-day moving average of daily new cases (109,032) increased 8.0% compared with the previous 7-day moving average (100,916). A total of 85,084,715 COVID-19 cases have been reported in the United States as of June 8, 2022.

CDC Nowcast projections* for the week ending June 4, 2022, estimate the combined national proportion of lineages designated as Omicron to be 100%. There are several lineages of Omicron (B.1.1.529, BA.1, BA.2, BA.3, BA.4, and BA.5), and within each are multiple sublineages. COVID Data Tracker shows the proportions of Omicron lineages grouped as follows: B.1.1.529 (includes BA.1 and BA.3), BA.1.1**, BA.2, BA.2.12.1, BA.4, and BA.5. Previously, BA.4 and BA.5 were grouped with their parent lineage, BA.1.1.529, because the sublineages were circulating below 1%.

The predominant Omicron lineage in the United States is BA.2.12.1. The national proportion of BA.2.12.1 is projected to be 62.2% (95% PI 58.5-65.7%). The national proportion of BA.2 is projected to be 24.8% (95% PI 22.4-23.7%). BA.5 is projected to be 7.6% (95% PI 5.6-10.1%). BA.4 is projected to be 5.4% (95% PI 3.8-7.5%). Omicron is predicted to be 100% in all HHS regions.

85,084,715
Total Cases Reported

109,032
Current 7-Day Average***

100,916
Prior 7-Day Average

8.0%
Change in 7-Day Average since Prior Week

*The median time from specimen collection to sequence data reporting is about 3 weeks. As a result, weighted estimates for the most recent few weeks may be unstable or unavailable. CDC’s Nowcast is a data projection tool that helps fill this gap by generating timely estimates of variant proportions for variants that are circulating in the United States. View Nowcast estimates on CDC’s COVID Data Tracker website on the Variant Proportions page.

**For national data, the proportion of BA.1.1 is shown separately. For regional data, the proportion of BA.1.1 is also aggregated with B.1.1.529.

***Historical cases are excluded from daily new cases and 7-day average calculations until they are incorporated into the dataset for the applicable date. Of 533,664 historical cases reported retroactively, 4 were reported in the current week and none were reported in the prior week.

Daily Trends in COVID-19 Cases in the United States Reported to CDC
red-line.jpg

7-Day moving average

View Larger
More Case Data
Vaccinations


The U.S. COVID-19 Vaccination Program began December 14, 2020. As of June 8, 2022, 589.9 million vaccine doses have been administered in the United States. Overall, about 258.9 million people, or 78.0% of the total U.S. population, have received at least one dose of vaccine. About 221.6 million people, or 66.7% of the total U.S. population, have been fully vaccinated.* Of those fully vaccinated, about 104.1 million people have received a booster dose,** but 49.0% of the total booster-eligible population has not yet received a booster dose. As of June 8, 2022, the 7-day average number of administered vaccine doses reported (by date of CDC report) to CDC per day was 290,078, a 15.6% decrease from the previous week.

CDC’s COVID Data Tracker displays vaccination trends by age group, race/ethnicity, and urban/rural status. To see trends by age group and race/ethnicity, visit the Vaccination Demographic Trends tab. To see trends by urban/rural status, visit the COVID-19 Vaccination Equity tab.

589,852,206
Vaccine Doses Administered

258,881,611
People who received at least one dose

221,567,092
People who are fully vaccinated*

78.0%
Percentage of the U.S. population that has received at least one dose

66.7%
Percentage of the U.S. population that has been fully vaccinated*

+0.1
Percentage point increase from last week

+0.0
Percentage point change from last week

*Represents the number of people who have received the second dose in a two-dose COVID-19 vaccine series (such as the Pfizer-BioNTech or Moderna vaccines) or one dose of the single-shot Johnson & Johnson’s Janssen vaccine.

**Represents the number of people who are fully vaccinated and have received another dose of COVID-19 vaccine since August 13, 2021. This includes people who received their first additional dose or booster dose.

Daily Change in the Total Number of Administered COVID-19 Vaccine Doses Reported to CDC by the Date of CDC Report, United States
red-line.jpg

7-Day moving average

View Larger
More Vaccination Data
Hospitalizations

New Hospital Admissions


The current 7-day daily average for June 1–7, 2022, was 4,127. This is an 8.0% increase from the prior 7-day average (3,820) from May 25–31, 2022.

4,774,751
Total New Admissions

4,127
Current 7-Day Average

3,820
Prior 7-Day Average

+8.0%
Change in 7-Day Average

The start of consistent reporting of hospital admissions data was August 1, 2020.

Daily Trends in Number of New COVID-19 Hospital Admissions in the United States

View Larger
New admissions are pulled from a 10 am EDT snapshot of the HHS Unified Hospital Data – Analytic Dataset. Due to potential reporting delays, data from the most recent 7 days, as noted in the figure above with the grey bar, should be interpreted with caution. Small shifts in historic data may also occur due to changes in the Centers for Medicare & Medicaid Services (CMS) Provider of Services file, which is used to identify the cohort of included hospitals.

More Hospital Data
COVID-NET: Rates of COVID-19-Associated Hospitalizations among Children Ages 0-17 Years


CDC’s Coronavirus Disease 2019-Associated Hospitalization Surveillance Network (COVID-NET) shows that pediatric rates of COVID-19-associated hospitalizations remain highest among young children ages 0-4 years, who are not yet eligible for vaccination. Hospitalization rates among this age group are 2.5 per 100,000 population, compared to 0.8 and 1.5 per 100,000 population for children ages 5-11 years and 12-17 years, respectively, for the week ending May 21, 2022.

Rates of COVID-19-Associated Hospitalizations among Children Ages 0-17 Years


View Larger


The Coronavirus Disease 2019 (COVID-19)-Associate­­d Hospitalization Surveillance Network (COVID-NET) is an additional source for hospitalization data collected through a network of more than 250 acute-care hospitals in 14 states (representing ~10% of the U.S. population). Detailed data on patient demographics, including race/ethnicity, underlying medical conditions, medical interventions, and clinical outcomes, are collected using a standardized case reporting form.
More COVID-NET Data
Deaths


The current 7-day moving average of new deaths (306) has increased 18.6% compared with the previous 7-day moving average (258). As of June 8, 2022, a total of 1,005,823 COVID-19 deaths have been reported in the United States.

1,005,823
Total Deaths Reported

306
Current 7-Day Average*

258
Prior 7-Day Average

18.6%
Change in 7-Day Average Since Prior Week

*Historical deaths are excluded from the daily new deaths and 7-day average calculations until they are incorporated into the dataset by their applicable date. Of 22,114 historical deaths reported retroactively, 409 were reported in the current week; and 133 were reported in the prior week.

Daily Trends in Number of COVID-19 Deaths in the United States Reported to CDC
red-line.jpg

7-Day moving average

View Larger
More Death Data
Testing


The percentage of COVID-19 NAATs (nucleic acid amplification tests)* that are positive (percent positivity) is increasing in comparison to the previous week. The 7-day average of percent positivity from NAATs is now 13.7%. The 7-day average number of tests reported for May 27–June 2, 2022, was 476,710, down 26.7% from 650,347 for the prior 7 days.

896,910,194
Total Tests Reported

476,710
7-Day Average Tests Reported

13.7%
7-Day Average % Positivity

13.3%
Previous 7-Day Average % Positivity

+0.38
Percentage point change in 7-Day Average % Positivity since Prior Week

*Test for SARS-CoV-2, the virus that causes COVID-19

COVID-19 NAAT Laboratory Test 7-day Percent Positivity by State/Territory

View Larger
More Testing DataWastewater Surveillance


COVID Data Tracker’s Wastewater Surveillance tab tracks levels, changes, and detections of SARS-CoV-2* viral RNA in wastewater at over 900 testing sites across the country.

Currently, most of the country is reporting moderate SARS-CoV-2 levels in wastewater. Around 33% of sites are currently seeing some of the highest levels for those sites since December 1, 2021. Additionally, more than half of all sites reporting wastewater data are experiencing a modest increase in SARS-CoV-2 levels, but about 35 of sites are reporting a decrease in SARS-CoV-2 levels in wastewater. It is important to note that even a small increase when levels are low can appear like a dramatic increase in the percent change.

Last week, a Wastewater Metric Chart was added to COVID Data Tracker’s Wastewater Surveillance page. This chart shows how virus levels in wastewater have increased or decreased across the United States since January 2021. For more information on how to use wastewater data, visit CDC’s National Wastewater Surveillance System website.

*The virus that causes COVID-19

SARS-CoV-2 Levels in Wastewater by Site

View Larger
Wastewater-2-06102022.jpg


0% means levels are the lowest they have been at the site; 100% means levels are the highest they have been at the site.

https://www.cdc.gov/coronavirus/2019-ncov/covid-data/covidview/index.html
 
covid-tracker-header-lrg.jpg

Print
Subscribe to the Weekly Review


Interpretive Summary for June 24, 2022
Intro_06242022.jpg
New Kids on the Block


It’s the moment so many parents have been waiting for: COVID-19 vaccines are now recommended for children ages 6 months and older. This means that nearly 20 million more children can now be protected against COVID-19. Vaccination provides a critical opportunity to prevent serious illness, giving families with young children more options to participate in childcare, school, and other activities while protecting themselves and others through vaccination.

Both the Moderna and Pfizer-BioNTech COVID-19 vaccines have been approved for use in children ages 6 months through 5 years. The Moderna vaccine will be a two-dose primary series, and the Pfizer-BioNTech vaccine will be a three-dose primary series. After vaccination, children could have some mild and temporary side effects like those seen with other routine childhood vaccines.

CDC recommends that everyone ages 6 months and older get vaccinated, including children who have already had COVID-19. Both vaccines are safe and proven to protect children against serious illness from COVID-19. These vaccines have undergone—and will continue to undergo—the most intensive safety monitoring in U.S. history. Thousands of children participated in robust clinical trials to evaluate the safety of the vaccines and how well they work.

Vaccination provides the best defense against serious outcomes related to COVID-19. To find COVID-19 vaccines for children, visit vaccines.gov.

Note to parents and caregivers: You can register your child for v-safe to share how they’re feeling after vaccination. V-safe uses confidential text messaging and web surveys to provide personalized health check-ins following COVID-19 vaccination.


What's New
COVID-19 Community Levels


As of June 23, 2022, there are 391 (12.1%) counties, districts, or territories with a high COVID-19 Community Level, 996 (30.9%) counties with a medium Community Level, and 1,830 (56.8%) counties with a low Community Level. This represents an increase (+1.9 percentage points) in the number of high-level counties, a slight increase (+1.6 percentage points) in the number of medium-level counties, and a corresponding decrease (−3.6 percentage points) in the number of low-level counties. 51 jurisdictions* had high- or medium-level counties this week. Rhode Island is the only jurisdiction to have all counties at low Community Level.

To check your COVID-19 Community Level, visit COVID Data Tracker. To learn which prevention measures are recommended based on your COVID-19 Community Level, visit COVID-19 Community Level and COVID-19 Prevention.

*There are 52 jurisdictions in the United States: the 50 states, the District of Columbia, and Puerto Rico.

U.S. COVID-19 Community Levels by County

View Larger
Community-Level-2-06102022.jpg

COVID-19 Community Levels
Reported Cases


As of June 22, 2022, the current 7-day moving average of daily new cases (97,430) decreased 5.6% compared with the previous 7-day moving average (103,175). A total of 86,512,787 COVID-19 cases have been reported in the United States as of June 22, 2022.

CDC Nowcast projections* for the week ending June 18, 2022, estimate that the combined national proportion of lineages designated as Omicron will continue to be 100%. There are several lineages of Omicron, and within each are multiple sublineages.

The predominant Omicron lineage in the United States is BA.2.12.1. The national proportion is projected to be 56.0% (95% PI 51.4-60.5%). CDC has been monitoring increased numbers of the Omicron lineages BA.4 and BA.5. Previously, BA.4 and BA.5 were grouped with their parent lineage, BA.1.1.529, because the sublineages were circulating below 1%. BA.5 is now projected to be 23.5% (95% PI 20.3-27.0%) and BA.4 is projected to be 11.4% (95% PI 8.8-14.5%). See COVID DataTracker for current data.

86,512,787
Total Cases Reported

97,430
Current 7-Day Average**

103,175
Prior 7-Day Average

-5.6%
Change in 7-Day Average since Prior Week

*The median time from specimen collection to sequence data reporting is about 3 weeks. As a result, weighted estimates for the most recent few weeks may be unstable or unavailable. CDC’s Nowcast is a data projection tool that helps fill this gap by generating timely estimates of variant proportions for variants that are circulating in the United States. View Nowcast estimates on CDC’s COVID Data Tracker website on the Variant Proportions page.

**Historical cases are excluded from daily new cases and 7-day average calculations until they are incorporated into the dataset for the applicable date. Of 533,666 historical cases reported retroactively, 3 were reported in the current week and none were reported in the prior week.


Daily Trends in COVID-19 Cases in the United States Reported to CDC
red-line.jpg

7-Day moving average

View Larger
More Case Data
Vaccinations


The U.S. COVID-19 Vaccination Program began December 14, 2020. As of June 22, 2022, 592.3 million vaccine doses have been administered in the United States. Overall, about 259.2 million people, or 78.1% of the total U.S. population, have received at least one dose of vaccine. About 221.9 million people, or 66.8% of the total U.S. population, have been fully vaccinated.* Of those fully vaccinated, about 104.7 million people have received a booster dose,** but 48.9% of the total booster-eligible population has not yet received a booster dose. As of June 21, 2022, the 7-day average number of administered vaccine doses reported (by date of CDC report) to CDC per day was 154,906, a 34.7% decrease from the previous week.

CDC’s COVID Data Tracker displays vaccination trends by age group, race/ethnicity, and urban/rural status. To see trends by age group and race/ethnicity, visit the Vaccination Demographic Trends tab. To see trends by urban/rural status, visit the COVID-19 Vaccination Equity tab.

592,269,252
Vaccine Doses Administered

259,198,178
People who received at least one dose

221,924,152
People who are fully vaccinated*

78.1%
Percentage of the U.S. population that has received at least one dose

66.8%
Percentage of the U.S. population that has been fully vaccinated*

+0.1
Percentage point increase from last week

+0.1
Percentage point change from last week

*Represents the number of people who have received the second dose in a two-dose COVID-19 vaccine series (such as the Pfizer-BioNTech or Moderna vaccines) or one dose of the single-shot Johnson & Johnson’s Janssen vaccine.

**Represents the number of people who are fully vaccinated and have received another dose of COVID-19 vaccine since August 13, 2021. This includes people who received their first additional dose or booster dose.

Daily Change in the Total Number of Administered COVID-19 Vaccine Doses Reported to CDC by the Date of CDC Report, United States
red-line.jpg

7-Day moving average

View Larger
More Vaccination Data
Hospitalizations

New Hospital Admissions


The current 7-day daily average for June 15–21, 2022, was 4,375. This is a 1.0% increase from the prior 7-day average (4,329) from June 8–14, 2022.

4,836,324
Total New Admissions

4,375
Current 7-Day Average

4,329
Prior 7-Day Average

+1.0%
Change in 7-Day Average

The start of consistent reporting of hospital admissions data was August 1, 2020.

Daily Trends in Number of New COVID-19 Hospital Admissions in the United States

View Larger
New admissions are pulled from a 10 am EDT snapshot of the HHS Unified Hospital Data – Analytic Dataset. Due to potential reporting delays, data from the most recent 7 days, as noted in the figure above with the grey bar, should be interpreted with caution. Small shifts in historic data may also occur due to changes in the Centers for Medicare & Medicaid Services (CMS) Provider of Services file, which is used to identify the cohort of included hospitals.

More Hospital Data
COVID-NET: Hospitalization Rates by Vaccination Status in Adults Ages ≥50 Years


CDC’s Coronavirus Disease 2019-Associated Hospitalization Surveillance Network (COVID-NET) shows that May 2022 rates of COVID-19-associated hospitalizations were higher in unvaccinated adults compared to adults who received a primary vaccination series plus a booster or additional dose of COVID-19 vaccine. Among adults ages 50–64 years, the rate was 3.4 times higher. Among adults ages 65 years and older, the rate was 3.8 times higher.

Rates of COVID-19-Associated Hospitalizations among Adults Ages ≥50 Years


View Larger


The Coronavirus Disease 2019 (COVID-19)-Associate­­d Hospitalization Surveillance Network (COVID-NET) is an additional source for hospitalization data collected through a network of more than 250 acute-care hospitals in 14 states (representing ~10% of the U.S. population). Detailed data on patient demographics, including race/ethnicity, underlying medical conditions, medical interventions, and clinical outcomes, are collected using a standardized case reporting form.
More COVID-NET Data
Deaths


The current 7-day moving average of new deaths (255) has decreased 10.4% compared with the previous 7-day moving average (285). As of June 22, 2022, a total of 1,010,089 COVID-19 deaths have been reported in the United States.

1,010,089
Total Deaths Reported

255
Current 7-Day Average*

285
Prior 7-Day Average

-10.4%
Change in 7-Day Average Since Prior Week

*Historical deaths are excluded from the daily new deaths and 7-day average calculations until they are incorporated into the dataset by their applicable date. Of 21,715 historical deaths reported retroactively, none were reported in the current week; and none were reported in the prior week.

Daily Trends in Number of COVID-19 Deaths in the United States Reported to CDC
red-line.jpg

7-Day moving average

View Larger
More Death Data
Testing


The percentage of COVID-19 NAATs (nucleic acid amplification tests)* that are positive (percent positivity) is increasing in comparison to the previous week. The 7-day average of percent positivity from NAATs is now 13.6%. The 7-day average number of tests reported for June 10–16, 2022, was 544,429, down 22.6% from 703,169 for the prior 7 days.

908,997,218
Total Tests Reported

544,429
7-Day Average Tests Reported

13.6%
7-Day Average % Positivity

12.1%
Previous 7-Day Average % Positivity

+1.50
Percentage point change in 7-Day Average % Positivity since Prior Week

*Test for SARS-CoV-2, the virus that causes COVID-19

COVID-19 NAAT Laboratory Test 7-day Percent Positivity by State/Territory

View Larger
More Testing DataWastewater Surveillance


COVID Data Tracker’s Wastewater Surveillance tab tracks levels, changes, and detections of SARS-CoV-2* viral RNA in wastewater at over 1,000 testing sites across the country.

Currently, most of the country is reporting moderate to high SARS-CoV-2 levels in wastewater. Around 35% of sites are currently seeing some of the highest levels for those sites since December 1, 2021. Additionally, more than half of all sites reporting wastewater data are experiencing a decrease in SARS-CoV-2 levels, but about 41% of sites are reporting an increase in SARS-CoV-2 levels in wastewater. It’s important to note that even a small increase when levels are low can appear like a dramatic increase in the percent change.

For more information on how to use wastewater data visit CDC’s website.

*The virus that causes COVID-19

SARS-CoV-2 Levels in Wastewater by Site

View Larger
Wastewater-2-06102022.jpg


0% means levels are the lowest they have been at the site; 100% means levels are the highest they have been at the site.

https://www.cdc.gov/coronavirus/2019-ncov/covid-data/covidview/index.html
 
covid-tracker-header-lrg.jpg

Print
Subscribe to the Weekly Review


Interpretive Summary for July 8, 2022
The Best Defense


Twenty million more children became eligible for COVID-19 vaccination on June 18, when CDC expanded recommendations to include children ages 6 months through 5 years. CDC now recommends COVID-19 primary series vaccines for everyone ages 6 months and older and COVID-19 boosters for everyone ages 5 years and older, if eligible. CDC’s COVID Data Tracker shows that over 267,000 children in this youngest age group have received at least one dose of either the three-dose pediatric Pfizer vaccine or the two-dose pediatric Moderna vaccine since June 18. Over 654,000 children ages 5 to 11 years have received a booster.

COVID-19 vaccines are safe and continue to undergo the most intensive safety monitoring in U.S. history. Not all places that offer adult vaccines, like pharmacies, are able to vaccinate young children. COVID-19 vaccines for young children are primarily administered at health departments and pediatrician offices, so it’s always a good idea to call ahead to schedule an appointment.

Vaccinating everyone ages 6 months and older is the best defense against serious illness, hospitalization, and death related to COVID-19. Even healthy children without underlying medical conditions can get severe COVID-19 or suffer from long-term health complications after recovering from COVID-19. To find COVID-19 vaccines for children, parents and caregivers can talk to a doctor, nurse, pharmacist, call the local health department or clinic, or visit vaccines.gov.

Note to Readers: Parents and caregivers can learn more about COVID-19 vaccines for children by visiting 6 Things to Know about COVID-19 Vaccination for Children.


What's New
COVID-19 Community Levels


As of July 7, 2022, there are 666 (20.7%) counties, districts, or territories with a high COVID-19 Community Level, 1,218 (37.8%) counties with a medium Community Level, and 1,331 (41.3%) counties with a low Community Level. Compared to last week, this represents an increase (+1.3 percentage points) in the number of high-level counties, an increase (+2.4 percentage points) in the number of medium-level counties, and a corresponding decrease (−3.7 percentage points) in the number of low-level counties. 49 out of 52 jurisdictions* had high- or medium-level counties this week. Rhode Island, New Hampshire, and Washington, D.C., are the only jurisdictions to have all counties at low Community Levels.

To check your COVID-19 Community Level, visit COVID Data Tracker. To learn which prevention measures are recommended based on your COVID-19 Community Level, visit COVID-19 Community Level and COVID-19 Prevention.

*Includes the 50 states, the District of Columbia, and Puerto Rico.

U.S. COVID-19 Community Levels by County

View Larger
Community-Level-2-06102022.jpg

COVID-19 Community Levels
Reported Cases


As of July 6, 2022, the current 7-day moving average of daily new cases (106,549) decreased 3.9% compared with the previous 7-day moving average (110,875). A total of 88,056,795 COVID-19 cases have been reported in the United States as of July 6, 2022.

Variant Proportions

CDC Nowcast projections* for the week ending July 2, 2022, estimate that the combined national proportion of lineages designated as Omicron will continue to be 100% with the predominant Omicron lineage being BA.5, projected at 53.6% (95% PI 49.5-57.6%).

There are several lineages of Omicron, and within each are multiple sublineages. The national proportion of BA.2.12.1 is projected to be 27.2% (95% PI 24.23-30.3%). BA.4 is projected to be 16.5% (95% PI 13.9-19.4%) and BA.2 is projected to be 2.8% (95% PI 2.4-3.3%). See COVID DataTracker for current data.

88,056,795
Total Cases Reported

106,549
Current 7-Day Average**

110,875
Prior 7-Day Average

-3.9%
Change in 7-Day Average since Prior Week

*The median time from specimen collection to sequence data reporting is about 3 weeks. As a result, weighted estimates for the most recent few weeks may be unstable or unavailable. CDC’s Nowcast is a data projection tool that helps fill this gap by generating timely estimates of variant proportions for variants that are circulating in the United States. View Nowcast estimates on CDC’s COVID Data Tracker website on the Variant Proportions page.

**Historical cases are excluded from daily new cases and 7-day average calculations until they are incorporated into the dataset for the applicable date. Of 536,361 historical cases reported retroactively, 2,698 were reported in the current week and none were reported in the prior week.


Daily Trends in COVID-19 Cases in the United States Reported to CDC
red-line.jpg

7-Day moving average

View Larger
More Case Data
Vaccinations


The U.S. COVID-19 Vaccination Program began December 14, 2020. As of July 6, 2022, 597.7 million vaccine doses have been administered in the United States. Overall, about 260.3 million people, or 78.4% of the total U.S. population, have received at least one dose of vaccine. About 222.5 million people, or 67.0% of the total U.S. population, have been fully vaccinated.* Of those fully vaccinated, about 106.6 million people have received a booster dose,** but 50.1% of the total booster-eligible population has not yet received a booster dose.

CDC’s COVID Data Tracker displays vaccination trends by age group, race/ethnicity, and urban/rural status. To see trends by age group and race/ethnicity, visit the tab. To see trends by urban/rural status, visit the COVID-19 Vaccination Equity tab.

597,655,035
Vaccine Doses Administered

260,327,743
People who received at least one dose

222,455,652
People who are fully vaccinated*

78.4%
Percentage of the U.S. population that has received at least one dose

67.0%
Percentage of the U.S. population that has been fully vaccinated*

+0.1
Percentage point increase from last week

+0.1
Percentage point change from last week

*Represents the number of people who have received the second dose in a two-dose COVID-19 vaccine series (such as the Pfizer-BioNTech or Moderna vaccines) or one dose of the single-shot Johnson & Johnson’s Janssen vaccine.

**Represents the number of people who are fully vaccinated and have received another dose of COVID-19 vaccine since August 13, 2021. This includes people who received their first additional dose or booster dose.

Daily Change in the Total Number of Administered COVID-19 Vaccine Doses Reported to CDC by the Date of CDC Report, United States
red-line.jpg

7-Day moving average

View Larger
More Vaccination Data
Hospitalizations

New Hospital Admissions


The current 7-day daily average for June 29–July 5, 2022, was 5,080. This is a 3.1% increase from the prior 7-day average (4,930) from June 22–28, 2022.

4,906,251
Total New Admissions

5,080
Current 7-Day Average

4,930
Prior 7-Day Average

+3.1%
Change in 7-Day Average

The start of consistent reporting of hospital admissions data was August 1, 2020.

Daily Trends in Number of New COVID-19 Hospital Admissions in the United States

View Larger
New admissions are pulled from a 10 am EDT snapshot of the HHS Unified Hospital Data – Analytic Dataset. Due to potential reporting delays, data from the most recent 7 days, as noted in the figure above with the grey bar, should be interpreted with caution. Small shifts in historic data may also occur due to changes in the Centers for Medicare & Medicaid Services (CMS) Provider of Services file, which is used to identify the cohort of included hospitals.

More Hospital Data
COVID-NET: Hospitalization Rates by Vaccination Status in Adults Ages ≥65 Years


CDC’s Coronavirus Disease 2019-Associated Hospitalization Surveillance Network (COVID-NET) shows that overall rates of COVID-19-associated hospitalizations have increased since the week ending April 2, 2022. Notably, rates among adults ages 65 years and older have seen a sharp increase, from 6.7 per 100,000 population on April 2, to 25.1 per 100,000 population on June 18. Among this group, adults ages 85 and older have had the largest increase in hospitalization rates in this same time period, increasing from 14.8 per 100,000 population on April 2 to 61.7 per 100,000 population on June 18.

Rates of COVID-19-Associated Hospitalizations among Adults Ages ≥65 Years


View Larger


The Coronavirus Disease 2019 (COVID-19)-Associate­­d Hospitalization Surveillance Network (COVID-NET) is an additional source for hospitalization data collected through a network of more than 250 acute-care hospitals in 14 states (representing ~10% of the U.S. population). Detailed data on patient demographics, including race/ethnicity, underlying medical conditions, medical interventions, and clinical outcomes, are collected using a standardized case reporting form.
More COVID-NET Data
Deaths


The current 7-day moving average of new deaths (273) has decreased 20.9% compared with the previous 7-day moving average (345). As of July 6, 2022, a total of 1,015,070 COVID-19 deaths have been reported in the United States.

1,015,070
Total Deaths Reported

273
Current 7-Day Average*

345
Prior 7-Day Average

-20.9%
Change in 7-Day Average Since Prior Week

*Historical deaths are excluded from the daily new deaths and 7-day average calculations until they are incorporated into the dataset by their applicable date. Of 21,756 historical deaths reported retroactively, none were reported in the current week; and 41 were reported in the prior week.

Daily Trends in Number of COVID-19 Deaths in the United States Reported to CDC
red-line.jpg

7-Day moving average

View Larger
More Death Data
Testing


The percentage of COVID-19 NAATs (nucleic acid amplification tests)* that are positive (percent positivity) is increasing in comparison to the previous week. The 7-day average of percent positivity from NAATs is now 17.5%. The 7-day average number of tests reported for June 24–30, 2022, was 414,614, down 22.4% from 534,464 for the prior 7 days.

916,128,298
Total Tests Reported

414,614
7-Day Average Tests Reported

17.5%
7-Day Average % Positivity

15.4%
Previous 7-Day Average % Positivity

+2.12
Percentage point change in 7-Day Average % Positivity since Prior Week

*Test for SARS-CoV-2, the virus that causes COVID-19

COVID-19 NAAT Laboratory Test 7-day Percent Positivity by State/Territory

View Larger
More Testing DataWastewater Surveillance


COVID Data Tracker’s tab tracks levels, changes, and detections of SARS-CoV-2* viral RNA in wastewater at over 1,000 testing sites across the country.

Currently, most of the country is reporting moderate to high SARS-CoV-2 levels in wastewater. Around 38% of sites are currently seeing some of the highest levels for those sites since December 1, 2021. About half of all sites reporting wastewater data are experiencing a decrease in SARS-CoV-2 levels, and about half are reporting an increase. It’s important to note that even a small increase when levels are low can appear like a dramatic increase in the percent change.

For more information on how to use wastewater data visit CDC’s website.

*The virus that causes COVID-19

SARS-CoV-2 Levels in Wastewater by Site

View Larger
Wastewater-2-06102022.jpg


0% means levels are the lowest they have been at the site; 100% means levels are the highest they have been at the site.

https://www.cdc.gov/coronavirus/2019-ncov/covid-data/covidview/index.html
 
covid-tracker-header-lrg.jpg

Print
Subscribe to the Weekly Review


Interpretive Summary for July 15, 2022
Act Now. Get Boosted.


In March 2022, CDC recommended a second COVID-19 booster for adults ages 50 years and older and people ages 12 years and older who have weakened immune systems. So far, only about 28% of adults ages 50 years and older with a first booster dose have received a second booster dose. This means that millions of people are now six or seven months past their first booster and could be more vulnerable to BA.4 and BA.5, the newest lineages of Omicron.

Data suggest that BA.4 and BA.5 spread more easily than previous Omicron lineages. They’ve been on the rise for weeks, and BA.5 has become the predominant lineage in the United States (see A Closer Look). So more people—even those who might have protection from past infection or vaccination—have gotten COVID-19, and COVID-19-associated hospitalization rates and death rates have risen among older adults.

The good news is that a new CDC study found that second boosters can restore vaccine protection against hospitalization that might have dropped over time. New surveillance data have also shown that second boosters provide additional protection against death from COVID-19 in people ages 50 years and older (see A Closer Look).

Act now to protect yourself and others around you.
Note to Readers: Not sure if you should get tested? CDC’s Viral Testing Tool can help you decide if you should get tested and what your test results mean. To find out if you are eligible for a second COVID-19 booster, use CDC’s Booster Tool.
A Closer Look

What's New
COVID-19 Community Levels


As of July 14, 2022, there are 1,141 (35.4%) counties, districts, or territories with a high COVID-19 Community Level, 1,275 (39.6%) counties with a medium Community Level, and 804 (25.0%) counties with a low Community Level. Compared with last week, this represents an increase (+14.8 percentage points) in the number of high-level counties, an increase (+1.8 percentage points) in the number of medium-level counties, and a corresponding decrease (−16.4 percentage points) in the number of low-level counties. 50 out of 52 jurisdictions* had high- or medium-level counties this week. Rhode Island and Maine are the only jurisdictions to have all counties at low Community Levels.

To check your COVID-19 Community Level, visit COVID Data Tracker. To learn which prevention measures are recommended based on your COVID-19 Community Level, visit COVID-19 Community Level and COVID-19 Prevention.

*Includes the 50 states, the District of Columbia, and Puerto Rico.

U.S. COVID-19 Community Levels by County

View Larger
Community-Level-2-06102022.jpg

COVID-19 Community Levels
Reported Cases


As of July 13, 2022, the current 7-day moving average of daily new cases (124,048) increased 15.7% compared with the previous 7-day moving average (107,174). A total of 88,932,987 COVID-19 cases have been reported in the United States as of July 13, 2022.

Variant Proportions

CDC Nowcast projections* for the week ending July 9, 2022, estimate that the combined national proportion of lineages designated as Omicron will continue to be 100% with the predominant Omicron lineage being BA.5, projected at 65.0% (95% PI 62.2-67.7%).

There are several lineages of Omicron and within each are multiple sublineages. The national proportion of BA.2.12.1 is projected to be 17.3% (95% PI 15.7-19.0%), BA.4 is projected to be 16.3% (95% PI 14.5-18.3%), and BA.2 is projected to be 1.4% (95% PI 1.3-1.6%). See COVID Data Tracker for current data.

88,932,987
Total Cases Reported

124,048
Current 7-Day Average**

107,174
Prior 7-Day Average

15.7%
Change in 7-Day Average since Prior Week

*The median time from specimen collection to sequence data reporting is about 3 weeks. As a result, weighted estimates for the most recent few weeks may be unstable or unavailable. CDC’s Nowcast is a data projection tool that helps fill this gap by generating timely estimates of variant proportions for variants that are circulating in the United States. View Nowcast estimates on CDC’s COVID Data Tracker website on the Variant Proportions page.

**Historical cases are excluded from daily new cases and 7-day average calculations until they are incorporated into the dataset for the applicable date. Of 536,361 historical cases reported retroactively, 2,698 were reported in the current week and none were reported in the prior week.

Daily Trends in COVID-19 Cases in the United States Reported to CDC
red-line.jpg

7-Day moving average

View Larger
More Case Data
Vaccinations


The U.S. COVID-19 Vaccination Program began December 14, 2020. As of July 13, 2022, 599.3 million vaccine doses have been administered in the United States. Overall, about 260.7 million people, or 78.5% of the total U.S. population, have received at least one dose of vaccine. About 222.7 million people, or 67.1% of the total U.S. population, have been fully vaccinated.* Of those fully vaccinated, about 107.0 million people have received a booster dose,** but 50.2% of the total booster-eligible population has not yet received a booster dose.

CDC’s COVID Data Tracker displays vaccination trends by age group, race/ethnicity, and urban/rural status. To see trends by age group and race/ethnicity, visit the Vaccination Demographic Trends tab. To see trends by urban/rural status, visit the COVID-19 Vaccination Equity tab.

599,289,113
Vaccine Doses Administered

260,728,030
People who received at least one dose

222,682,315
People who are fully vaccinated*

78.5%
Percentage of the U.S. population that has received at least one dose

67.1%
Percentage of the U.S. population that has been fully vaccinated*

+0.1
Percentage point increase from last week

+0.1
Percentage point change from last week

*Represents the number of people who have received the second dose in a two-dose COVID-19 vaccine series (such as the Pfizer-BioNTech or Moderna vaccines) or one dose of the single-shot Johnson & Johnson’s Janssen vaccine.

**Represents the number of people who are fully vaccinated and have received another dose of COVID-19 vaccine since August 13, 2021. This includes people who received their first additional dose or booster dose.

Daily Change in the Total Number of Administered COVID-19 Vaccine Doses Reported to CDC by the Date of CDC Report, United States
red-line.jpg

7-Day moving average

View Larger
More Vaccination Data
Hospitalizations

New Hospital Admissions


The current 7-day daily average for July 6–12, 2022, was 5,851. This is a 14.4% increase from the prior 7-day average (5,115) from June 29–July 5, 2022.

4,947,473
Total New Admissions

5,851
Current 7-Day Average

5,115
Prior 7-Day Average

+14.4%
Change in 7-Day Average

The start of consistent reporting of hospital admissions data was August 1, 2020.

Daily Trends in Number of New COVID-19 Hospital Admissions in the United States

View Larger
New admissions are pulled from a 10 am EDT snapshot of the HHS Unified Hospital Data – Analytic Dataset. Due to potential reporting delays, data from the most recent 7 days, as noted in the figure above with the grey bar, should be interpreted with caution. Small shifts in historic data may also occur due to changes in the Centers for Medicare & Medicaid Services (CMS) Provider of Services file, which is used to identify the cohort of included hospitals.

More Hospital Data
COVID-NET: Hospitalization Rates among Adults Ages ≥65 Years


CDC’s Coronavirus Disease 2019-Associated Hospitalization Surveillance Network (COVID-NET) shows that overall rates of COVID-19-associated hospitalizations have increased since the week ending April 2, 2022. Notably, rates among adults ages 65 years and older have seen a sharp increase, from 6.7 per 100,000 population on April 2, to 26.2 per 100,000 population on May 14. These rates have remained elevated and relatively unchanged in recent weeks, ranging from 25.8 to 28.9 per 100,000 between May 14 and June 25.

Hospitalization Rates among Adults Ages ≥65 Years


View Larger


The Coronavirus Disease 2019 (COVID-19)-Associate­­d Hospitalization Surveillance Network (COVID-NET) is an additional source for hospitalization data collected through a network of more than 250 acute-care hospitals in 14 states (representing ~10% of the U.S. population). Detailed data on patient demographics, including race/ethnicity, underlying medical conditions, medical interventions, and clinical outcomes, are collected using a standardized case reporting form.
More COVID-NET Data
Deaths


The current 7-day moving average of new deaths (352) has increased 12.6% compared with the previous 7-day moving average (312). As of July 13, 2022, a total of 1,018,035 COVID-19 deaths have been reported in the United States.

1,018,035
Total Deaths Reported

352
Current 7-Day Average*

312
Prior 7-Day Average

12.6%
Change in 7-Day Average Since Prior Week

**Historical deaths are excluded from the daily new deaths and 7-day average calculations until they are incorporated into the dataset by their applicable date. Of 21,756 historical deaths reported retroactively, none were reported in the current week; and none were reported in the prior week.

Daily Trends in Number of COVID-19 Deaths in the United States Reported to CDC
red-line.jpg

7-Day moving average

View Larger
More Death Data
Testing


The percentage of COVID-19 NAATs (nucleic acid amplification tests)* that are positive (percent positivity) is increasing in comparison to the previous week. The 7-day average of percent positivity from NAATs is now 17.5%. The 7-day average number of tests reported for July 1–7, 2022, was 520,155, down 2.4% from 533,202 for the prior 7 days.

921,423,930
Total Tests Reported

520,155
7-Day Average Tests Reported

17.5%
7-Day Average % Positivity

17.3%
Previous 7-Day Average % Positivity

+0.19
Percentage point change in 7-Day Average % Positivity since Prior Week

*Test for SARS-CoV-2, the virus that causes COVID-19

COVID-19 NAAT Laboratory Test 7-day Percent Positivity by State/Territory

View Larger
More Testing DataWastewater Surveillance


COVID Data Tracker’s Wastewater Surveillance tab tracks levels, changes, and detections of SARS-CoV-2* viral RNA in wastewater at over 1,000 testing sites across the country.

Currently, most of the country is reporting moderate to high SARS-CoV-2 levels in wastewater. Around 42% of sites are currently seeing some of the highest levels for those sites since December 1, 2021. About 36% of all sites reporting wastewater data are experiencing a decrease in SARS-CoV-2 levels, and about 54% are reporting an increase. It’s important to note that even a small increase when levels are low can appear like a dramatic increase in the percent change.

For more information on how to use wastewater data visit CDC’s website

*The virus that causes COVID-19

SARS-CoV-2 Levels in Wastewater by Site

View Larger


0% means levels are the lowest they have been at the site; 100% means levels are the highest they have been at the site.
More Wastewater Data
Top of PageA Closer Look


Learn More about BA.4 and BA.5 and Recent Booster Data

Viruses like SARS-CoV-2, which is the virus that causes COVID-19, continuously evolve as they spread. As SARS-CoV-2 genomes change, scientists classify groups of similar genomes into lineages and sublineages. Particularly important lineages and their descendant lineages are often called “variants” and named after Greek letters, like Omicron. CDC uses genomic surveillance to track and learn more about the SARS-CoV-2 lineages circulating in the United States.

In recent weeks, CDC has monitored increases in the BA.4 and BA.5 lineages of Omicron. As of the week ending July 9, 2022, BA.4 and BA.5 represent an estimated 16.3% and 65.0% respectively, of the SARS-CoV-2 variants currently circulating in the United States. Data suggest that these lineages could be more transmissible than previous Omicron sublineages. However, there is no evidence currently available to suggest that BA.4 and BA.5 cause more severe disease than other variants or Omicron lineages. CDC is continuing to assess the impact that BA.4 and BA.5 have on public health.

CDC uses case data, rates of COVID-19 hospitalizations, and healthcare capacity in communities to estimate the burden of COVID-19 on local healthcare systems. COVID-19 Community Levels currently indicate that the impact of COVID-19 is increasing in many areas of the United States.


*Includes booster doses and additional doses in immunocompromised people, which cannot be distinguished in the data.
View Larger
A combination of factors—including changes in the virus and waning protection as individuals get further away from their last immunity-inducing event (vaccination or infection)—can lead to less protection against infection, severe disease, or even death from COVID-19. However, a new CDC study found that first and second COVID-19 vaccine boosters significantly increased protection against COVID-19-associated hospitalization in people of eligible ages. Additionally, CDC surveillance data show that adults ages 50 years and older with two boosters had 4 times lower risk of dying from COVID-19, compared to people who received one booster. People with two boosters also had 29 times lower risk of dying from COVID-19 than people who are unvaccinated. The key takeaway from these findings is simple: Staying up to date on vaccines by getting boosted as soon as you’re eligible is critical to maintaining individual protection against COVID-19.

As the virus changes, we can expect some new lineages to cause more cases and COVID-19 community levels to change. In these periods, such as we are seeing right now, it is important to monitor your local COVID-19 Community Levels, stay up to date with vaccines, and take appropriate precautions to protect yourself and others.

https://www.cdc.gov/coronavirus/2019-ncov/covid-data/covidview/index.html
 
covid-tracker-header-lrg.jpg

Print
Subscribe to the Weekly Review


Interpretive Summary for July 22, 2022

View LargerCases Rising: Get Boosted


This week, COVID-19 cases, deaths, and hospitalizations are on the rise in the United States, driving COVID-19 Community Levels up to medium or high in 75% of counties. Omicron BA.5 is the predominant variant, causing an estimated 78% of cases. BA.5 has fueled the rapid rise in cases since June, suggesting that it spreads more easily than previous Omicron lineages.

According to CDC’s COVID Data Tracker, only about 34% of people who are eligible for a COVID-19 booster and about 29% of people ages 50 years and older who are eligible for a second booster have gotten one. Booster vaccination rates vary widely across the United States. In the Northeast and parts of the Midwest, 50% to 70% of eligible people have gotten a first booster in almost every county. Unfortunately, much of the Southeast and Southwest are in the 30% to 40% range. This means millions of people are not fully protected because they are not up to date on their COVID-19 vaccines. Both the rise in cases and the gradual decrease in vaccine protection since your last shot make it an especially important time to get up to date on COVID-19 vaccines.

Our communities are safest when we work together to protect everyone. If you live in an area with low vaccine coverage, you can help by encouraging others to get up to date on their COVID-19 vaccines. You can use the following resources to:

What's New
COVID-19 Community Levels


As of July 21, 2022, there are 1,350 (41.9%) counties, districts, or territories with a high COVID-19 Community Level, 1,212 (37.6%) counties with a medium Community Level, and 658 (20.4%) counties with a low Community Level. Compared with last week, this represents an increase (+6.5 percentage points) in the number of high-level counties, a decrease (−2.0) percentage points) in the number of medium-level counties, and a corresponding decrease (−4.5) percentage points) in the number of low-level counties. 50 out of 52 jurisdictions* had high- or medium-level counties this week. Rhode Island and Maine are the only jurisdictions to have all counties at low Community Levels.

To check your COVID-19 Community Level, visit COVID Data Tracker. To learn which prevention measures are recommended based on your COVID-19 Community Level, visit COVID-19 Community Level and COVID-19 Prevention.

*Includes the 50 states, the District of Columbia, and Puerto Rico.

U.S. COVID-19 Community Levels by County

View Larger
Community-Level-2-06102022.jpg

COVID-19 Community Levels
Reported Cases


As of July 20, 2022, the current 7-day moving average of daily new cases (125,827) increased 0.5% compared with the previous 7-day moving average (125,185). A total of 89,824,190 COVID-19 cases have been reported in the United States as of July 20, 2022.

Variant Proportions

CDC Nowcast projections* for the week ending July 16, 2022, estimate that the combined national proportion of lineages designated as Omicron will continue to be 100% with the predominant Omicron lineage being BA.5, projected at 77.9% (95% PI 75.8-79.9%).

There are several lineages of Omicron and within each are multiple sublineages. The national proportion of BA.4 is projected to be 12.8% (95% PI 11.3-14.4%), BA.2.12.1 is projected to be 8.6% (95% PI 7.8-9.5%), and BA.2 is projected to be 0.6% (95% PI 0.6-0.7%). See COVID Data Tracker for current data.

89,824,190
Total Cases Reported

125,827
Current 7-Day Average**

125,185
Prior 7-Day Average


0.5%
Change in 7-Day Average since Prior Week

*The median time from specimen collection to sequence data reporting is about 3 weeks. As a result, weighted estimates for the most recent few weeks may be unstable or unavailable. CDC’s Nowcast is a data projection tool that helps fill this gap by generating timely estimates of variant proportions for variants that are circulating in the United States. View Nowcast estimates on CDC’s COVID Data Tracker website on the Variant Proportions page.

**Historical cases are excluded from daily new cases and 7-day average calculations until they are incorporated into the dataset for the applicable date. Of 536,352 historical cases reported retroactively, none were reported in the current week and none were reported in the prior week.


Daily Trends in COVID-19 Cases in the United States Reported to CDC
red-line.jpg

7-Day moving average

View Larger
More Case Data
Vaccinations


The U.S. COVID-19 Vaccination Program began December 14, 2020. As of July 20, 2022, 601.5 million vaccine doses have been administered in the United States. Overall, about 261.2 million people, or 78.7% of the total U.S. population, have received at least one dose of vaccine. About 223.0 million people, or 67.2% of the total U.S. population, have been fully vaccinated.* Of those fully vaccinated, about 107.5 million people have received a booster dose,** but 50.2% of the total booster-eligible population has not yet received a booster dose.

CDC’s COVID Data Tracker displays vaccination trends by age group, race/ethnicity, and urban/rural status. To see trends by age group and race/ethnicity, visit the Vaccination Demographic Trends tab. To see trends by urban/rural status, visit the COVID-19 Vaccination Equity tab.

601,497,801
Vaccine Doses Administered

261,204,035
People who received at least one dose

222,950,194
People who are fully vaccinated*

78.7%
Percentage of the U.S. population that has received at least one dose

67.2%
Percentage of the U.S. population that has been fully vaccinated*

+0.2
Percentage point increase from last week

+0.1
Percentage point change from last week

*Represents the number of people who have received the second dose in a two-dose COVID-19 vaccine series (such as the Pfizer-BioNTech or Moderna vaccines) or one dose of the single-shot Johnson & Johnson’s Janssen vaccine.

**Represents the number of people who are fully vaccinated and have received another dose of COVID-19 vaccine since August 13, 2021. This includes people who received their first additional dose or booster dose.

Daily Change in the Total Number of Administered COVID-19 Vaccine Doses Reported to CDC by the Date of CDC Report, United States
red-line.jpg

7-Day moving average

View Larger
More Vaccination Data
Hospitalizations

New Hospital Admissions


The current 7-day daily average for July 13–19, 2022, was 6,180. This is a 4.7% increase from the prior 7-day average (5,902) from July 6–12, 2022.

4,991,074
Total New Admissions

6,180
Current 7-Day Average

5,902
Prior 7-Day Average

+4.7%
Change in 7-Day Average

The start of consistent reporting of hospital admissions data was August 1, 2020.

Daily Trends in Number of New COVID-19 Hospital Admissions in the United States

View Larger
New admissions are pulled from a 10 am EDT snapshot of the HHS Unified Hospital Data – Analytic Dataset. Due to potential reporting delays, data from the most recent 7 days, as noted in the figure above with the grey bar, should be interpreted with caution. Small shifts in historic data may also occur due to changes in the Centers for Medicare & Medicaid Services (CMS) Provider of Services file, which is used to identify the cohort of included hospitals.

More Hospital Data
COVID-NET: Trends in Hospitalizations among Adults Ages ≥65 Years


CDC’s Coronavirus Disease 2019-Associated Hospitalization Surveillance Network (COVID-NET) shows that since the start of the pandemic, adults ages 65 years and older have often accounted for the largest percentage of COVID-19-associated hospitalizations. Beginning in April 2022, the proportion of cases in older adults began to increase. From April 7 through July 16, 2022, adults ages 65 years and older have accounted for more than half of all COVID-19-associated hospitalizations, peaking at 57.2% of all hospitalizations for the week ending May 7.

Trends in COVID-19-Associated Hospitalizations among Adults Ages ≥65 Years


View Larger


The Coronavirus Disease 2019 (COVID-19)-Associate­­d Hospitalization Surveillance Network (COVID-NET) is an additional source for hospitalization data collected through a network of more than 250 acute-care hospitals in 14 states (representing ~10% of the U.S. population). Detailed data on patient demographics, including race/ethnicity, underlying medical conditions, medical interventions, and clinical outcomes, are collected using a standardized case reporting form.
More COVID-NET Data
Deaths


The current 7-day moving average of new deaths (348) has decreased 9.5% compared with the previous 7-day moving average (384). As of July 20, 2022, a total of 1,021,048 COVID-19 deaths have been reported in the United States.

1,021,048
Total Deaths Reported

348
Current 7-Day Average*

384
Prior 7-Day Average

-9.5%
Change in 7-Day Average Since Prior Week

*Historical deaths are excluded from the daily new deaths and 7-day average calculations until they are incorporated into the dataset by their applicable date. Of 21,756 historical deaths reported retroactively, none were reported in the current week; and none were reported in the prior week.

Daily Trends in Number of COVID-19 Deaths in the United States Reported to CDC
red-line.jpg

7-Day moving average

View Larger
More Death Data
Testing


The percentage of COVID-19 NAATs (nucleic acid amplification tests)* that are positive (percent positivity) is decreasing in comparison to the previous week. The 7-day average of percent positivity from NAATs is now 17.3%. The 7-day average number of tests reported for July 8–14, 2022, was 553,132, up 4.0% from 532,000 for the prior 7 days.

925,534,224
Total Tests Reported

553,132
7-Day Average Tests Reported

17.3%
7-Day Average % Positivity

17.6%
Previous 7-Day Average % Positivity

-0.30
Percentage point change in 7-Day Average % Positivity since Prior Week

*Test for SARS-CoV-2, the virus that causes COVID-19

COVID-19 NAAT Laboratory Test 7-day Percent Positivity by State/Territory

View Larger
More Testing DataWastewater Surveillance


COVID Data Tracker’s Wastewater Surveillance tab tracks levels, changes, and detections of SARS-CoV-2* viral RNA in wastewater at over 1,000 testing sites across the country.

Currently, most of the country is reporting moderate to high SARS-CoV-2 levels in wastewater. Around 49% of sites are currently seeing some of the highest levels for those sites since December 1, 2021. About 48% of all sites reporting wastewater data are experiencing a decrease in SARS-CoV-2 levels, and about 43% are reporting an increase. It’s important to note that even a small increase when levels are low can appear like a dramatic increase in the percent change.

For more information on how to use wastewater data visit CDC’s website.

*The virus that causes COVID-19

SARS-CoV-2 Levels in Wastewater by Site

View Larger
Wastewater-2-06102022.jpg


0% means levels are the lowest they have been at the site; 100% means levels are the highest they have been at the site.

https://www.cdc.gov/coronavirus/2019-ncov/covid-data/covidview/index.html
 
covid-tracker-header-lrg.jpg

Print
Subscribe to the Weekly Review


Interpretive Summary for July 29, 2022
Intro.jpg

View LargerProtect Those Who Protect Us


Nearly two and a half years into the COVID-19 pandemic, cases and hospitalizations have been on the rise, driven by the BA.5 lineage of the Omicron variant. More than a million people in the United States have died from COVID-19, and almost 90 million cases have been reported. The pandemic has taken a tremendous toll on healthcare providers and public health workers, who are dealing with crisis levels of stress and burnout.

A recent CDC survey found that nearly half of U.S. public health workers reported symptoms of at least one mental health condition. Symptoms of post-traumatic stress disorder (PTSD), anxiety, and depression were highest (28%), followed by suicidal thoughts (8%). These symptoms were most common among those who worked more than 60 hours a week or spent most of their time working on COVID-19 response activities. Mental health symptoms were less common in workers who were able to take time off or whose employers increased mental health resources.

These findings highlight the need for public health organizations to protect the mental health of their employees. The federal government is investing billions of dollars in training, research, educational campaigns, and other resources to promote mental well-being in the nation’s public health workforce. The workers who have shouldered the staggering burden of this pandemic deserve all our support.

If you’re a public health worker who needs immediate mental health support, call 988 for the the National Suicide Prevention Lifeline or use the lifeline chat to connect with a trained crisis counselor. If you know someone who works in public health, learn to recognize the signs of someone who may benefit from support. CDC has resources to help you and others.


What's New
COVID-19 Community Levels


As of July 28, 2022, there are 1,474 (45.8%) counties, districts, or territories with a high COVID-19 Community Level, 1,144 (35.5%) counties with a medium Community Level, and 602 (18.7%) counties with a low Community Level. Compared with last week, this represents a moderate increase (+3.9 percentage points) in the number of high-level counties, and a small decrease (−2.11 percentage points) in the number of medium-level counties and also a small decrease (−1.74 percentage points) in the number of low-level counties. 49 out of 52 jurisdictions* had high- or medium-level counties this week. Rhode Island, New Hampshire, and the District of Columbia are the only jurisdictions to have all counties at low Community Levels.

To check your COVID-19 Community Level, visit COVID Data Tracker. To learn which prevention measures are recommended based on your COVID-19 Community Level, visit COVID-19 Community Level and COVID-19 Prevention.

*Includes the 50 states, the District of Columbia, and U.S. territories.

U.S. COVID-19 Community Levels by County

View Larger
Community-Level-2-06102022.jpg

COVID-19 Community Levels
Reported Cases


As of July 27, 2022, the current 7-day moving average of daily new cases (126,272) decreased 0.9% compared with the previous 7-day moving average (127,478). A total of 90,749,469 COVID-19 cases have been reported in the United States as of July 27, 2022.

Variant Proportions
CDC Nowcast projections* for the week ending July 23, 2022, estimate that the combined national proportion of lineages designated as Omicron will continue to be 100% with the predominant Omicron lineage being BA.5, projected at 81.9% (95% PI 79.9-83.8%).

There are several lineages of Omicron and within each are multiple sublineages. The national proportion of BA.4 is projected to be 12.9% (95% PI 11.2-14.7%), BA.2.12.1 is projected to be 5.0% (95% PI 4.5-5.4%), and BA.2 is projected to be 0.3% (95% PI 0.2-0.3%). See COVID Data Tracker for current data.

90,749,469
Total Cases Reported

126,272
Current 7-Day Average**

127,478
Prior 7-Day Average


-0.9%
Change in 7-Day Average since Prior Week

*The median time from specimen collection to sequence data reporting is about 3 weeks. As a result, weighted estimates for the most recent few weeks may be unstable or unavailable. CDC’s Nowcast is a data projection tool that helps fill this gap by generating timely estimates of variant proportions for variants that are circulating in the United States. View Nowcast estimates on CDC’s COVID Data Tracker website on the Variant Proportions page.

**Historical cases are excluded from daily new cases and 7-day average calculations until they are incorporated into the dataset for the applicable date. Of 560,662 historical cases reported retroactively, 24,310 were reported in the current week and none were reported in the prior week.


Daily Trends in COVID-19 Cases in the United States Reported to CDC
red-line.jpg

7-Day moving average

View Larger
More Case Data
Vaccinations


The U.S. COVID-19 Vaccination Program began December 14, 2020. As of July 27, 2022, 603.7 million vaccine doses have been administered in the United States. Overall, about 261.7 million people, or 78.8% of the total U.S. population, have received at least one dose of vaccine. About 223.2 million people, or 67.2% of the total U.S. population, have been fully vaccinated.* Of those fully vaccinated, about 107.9 million people have received a booster dose,** but 50.1% of the total booster-eligible population has not yet received a booster dose.

CDC’s COVID Data Tracker displays vaccination trends by age group, race/ethnicity, and urban/rural status. To see trends by age group and race/ethnicity, visit the Vaccination Demographic Trends tab. To see trends by urban/rural status, visit the COVID-19 Vaccination Equity tab.

603,693,871
Vaccine Doses Administered

261,654,261
People who received at least one dose

223,245,563
People who are fully vaccinated*

78.8%
Percentage of the U.S. population that has received at least one dose

67.2%
Percentage of the U.S. population that has been fully vaccinated*

+0.1
Percentage point increase from last week

+0.0
Percentage point change from last week

*Represents the number of people who have received the second dose in a two-dose COVID-19 vaccine series (such as the Pfizer-BioNTech or Moderna vaccines) or one dose of the single-shot Johnson & Johnson’s Janssen vaccine.

**Represents the number of people who are fully vaccinated and have received another dose of COVID-19 vaccine since August 13, 2021. This includes people who received their first additional dose or booster dose.

Daily Change in the Total Number of Administered COVID-19 Vaccine Doses Reported to CDC by the Date of CDC Report, United States
red-line.jpg

7-Day moving average
Vaccinations-072922.jpg

View Larger
More Vaccination Data
Hospitalizations

New Hospital Admissions


The current 7-day daily average for July 20–26, 2022, was 6,340. This is a 1.7% increase from the prior 7-day average (6,231) from July 13–19, 2022.

5,035,837
Total New Admissions

6,340
Current 7-Day Average

6,231
Prior 7-Day Average

+1.7%
Change in 7-Day Average

The start of consistent reporting of hospital admissions data was August 1, 2020.

Daily Trends in Number of New COVID-19 Hospital Admissions in the United States

View Larger
New admissions are pulled from a 10 am EDT snapshot of the HHS Unified Hospital Data – Analytic Dataset. Due to potential reporting delays, data from the most recent 7 days, as noted in the figure above with the grey bar, should be interpreted with caution. Small shifts in historic data may also occur due to changes in the Centers for Medicare & Medicaid Services (CMS) Provider of Services file, which is used to identify the cohort of included hospitals.

More Hospital Data
COVID-NET: Trends in Hospitalizations among Adults Ages ≥65 Years


CDC’s Coronavirus Disease 2019-Associated Hospitalization Surveillance Network (COVID-NET) shows that for the week ending July 9, the rate of COVID-19-associated hospitalizations (per 100,000 population) for children ages 6 months and younger, who are not eligible for vaccination, is 15.3, a rate 7 times as high as the rate of 2.0 for the week ending April 9. While the weekly rate of hospitalizations for all age groups have increased since April, the rates for children ages 6 months and younger are highest among all pediatric age groups.

Trends in COVID-19-Associated Hospitalizations among Adults Ages ≥65 Years


View Larger


The Coronavirus Disease 2019 (COVID-19)-Associate­­d Hospitalization Surveillance Network (COVID-NET) is an additional source for hospitalization data collected through a network of more than 250 acute-care hospitals in 14 states (representing ~10% of the U.S. population). Detailed data on patient demographics, including race/ethnicity, underlying medical conditions, medical interventions, and clinical outcomes, are collected using a standardized case reporting form.
More COVID-NET Data
Deaths


The current 7-day moving average of new deaths (364) has decreased 4.8% compared with the previous 7-day moving average (382). As of July 27, 2022, a total of 1,023,991 COVID-19 deaths have been reported in the United States.

1,023,991
Total Deaths Reported

364
Current 7-Day Average*

382
Prior 7-Day Average

-4.8%
Change in 7-Day Average Since Prior Week

*Historical deaths are excluded from the daily new deaths and 7-day average calculations until they are incorporated into the dataset by their applicable date. Of 21,756 historical deaths reported retroactively, none were reported in the current week; and none were reported in the prior week.

Daily Trends in Number of COVID-19 Deaths in the United States Reported to CDC
red-line.jpg

7-Day moving average

View Larger
More Death Data
Testing


The percentage of COVID-19 NAATs (nucleic acid amplification tests)* that are positive (percent positivity) is increasing in comparison to the previous week. The 7-day average of percent positivity from NAATs is now 18.0%. The 7-day average number of tests reported for July 15–21, 2022, was 494,590, down 12.7% from 566,247 for the prior 7 days.

929,349,291
Total Tests Reported

494,590
7-Day Average Tests Reported

18.0%
7-Day Average % Positivity

17.5%
Previous 7-Day Average % Positivity

+0.49
Percentage point change in 7-Day Average % Positivity since Prior Week

*Test for SARS-CoV-2, the virus that causes COVID-19

COVID-19 NAAT Laboratory Test 7-day Percent Positivity by State/Territory

View Larger
More Testing DataWastewater Surveillance


COVID Data Tracker’s Wastewater Surveillance tab tracks levels, changes, and detections of SARS-CoV-2* viral RNA in wastewater at over 1,000 testing sites across the country.

Currently, most of the country is reporting moderate to high SARS-CoV-2 levels in wastewater. Around 53% of sites are currently seeing some of the highest levels for those sites since December 1, 2021. About 40% of all sites reporting wastewater data are experiencing a decrease in SARS-CoV-2 levels, and about 49% are reporting an increase. It’s important to note that even a small increase when levels are low can appear like a dramatic increase in the percent change.

For more information on how to use wastewater data visit CDC’s website.

*The virus that causes COVID-19

SARS-CoV-2 Levels in Wastewater by Site

View Larger
Wastewater-2-06102022.jpg


0% means levels are the lowest they have been at the site; 100% means levels are the highest they have been at the site.
More Wastewater Data

https://www.cdc.gov/coronavirus/2019-ncov/covid-data/covidview/index.html
 
covid-tracker-header-lrg.jpg

Print
Subscribe to the Weekly Review


Interpretive Summary for August 5, 2022
Intro-080522.jpg

View LargerHelp is Here


Last week’s COVID Data Tracker Weekly Review focused on the mental health concerns of public health workers during the COVID-19 pandemic. Many people have been struggling for the past two years, whether it be from illness, deaths of loved ones, economic hardship, disrupted education, or any of the many stressors that the pandemic has introduced to the world. Unfortunately, children and adolescents are no exception. Pre-pandemic data showed significant increases in mental health symptoms among U.S. high school students during the decade before COVID-19, and an April 2022 CDC report found that this crisis has continued during the pandemic.

According to the report, more than a third of high school students reported poor mental health during the pandemic, and almost half said they had felt persistently sad or hopeless during the past year. Students who didn’t feel close to anyone at school had higher rates of poor mental health, and the same held true for students who hadn’t been virtually connected to others during the pandemic.

However, there are many resources available to help children and their families start a conversation and help navigate through a mental health struggle. CDC’s How Right Now online guide can help kids identify how they’re feeling at any given moment and points them to resources for handling emotions like fear, grief, anger, and sadness. It has links to advice, hotlines, and support groups. There’s also a section with ideas for practicing gratitude, which is a great way to reduce stress and boost your physical and emotional well-being.

If you or your teen need immediate mental health support, call 988 for the National Suicide Prevention Lifeline or use the lifeline chat to connect with a trained crisis counselor.


What's New
COVID-19 Community Levels


As of August 4, 2022, there are 1,343 (41.7%) counties, districts, or territories with a high COVID-19 Community Level, 1,252 (38.9%) counties with a medium Community Level, and 625 (19.4%) counties with a low Community Level. Compared with last week, this represents a moderate decrease (−4.09 percentage points) in the number of high-level counties, a moderate increase (+3.38 percentage points) in the number of medium-level counties, and a small increase (+0.71 percentage points) in the number of low-level counties. Overall, 50 out of 52 jurisdictions* had high- or medium-level counties this week. Maine and New Hampshire are the only jurisdictions to have all counties at low Community Levels.

To check your COVID-19 Community Level, visit COVID Data Tracker. To learn which prevention measures are recommended based on your COVID-19 Community Level, visit COVID-19 Community Level and COVID-19 Prevention.

*Includes the 50 states, the District of Columbia, and U.S. territories.

U.S. COVID-19 Community Levels by County

View Larger
Community-Level-2-06102022.jpg

COVID-19 Community Levels
Reported Cases


As of August 3, 2022, the current 7-day moving average of daily new cases (117,351) decreased 7.3% compared with the previous 7-day moving average (126,537). A total of 91,676,264 COVID-19 cases have been reported in the United States as of August 3, 2022.

Variant Proportions

CDC Nowcast projections* for the week ending July 30, 2022, estimate that the combined national proportion of lineages designated as Omicron will continue to be 100% with the predominant Omicron lineage being BA.5, projected at 85.5% (95% PI 83.8-87.0%).

There are several lineages of Omicron and within each are multiple sublineages. The national proportion of BA.4 is projected to be 7.7% (95% PI 7.0-8.5%), BA.4.6 is projected to be 4.1% (95% PI 3.2-5.4%), BA.2.12.1 is projected to be 2.6% (95% PI 2.4-2.8%), and BA.2 is projected to be 0.1% (95% PI 0.1-0.1%). See COVID Data Tracker for current data.

91,676,264
Total Cases Reported

117,351
Current 7-Day Average**

126,537
Prior 7-Day Average


-7.3%
Change in 7-Day Average since Prior Week

*The median time from specimen collection to sequence data reporting is about 3 weeks. As a result, weighted estimates for the most recent few weeks may be unstable or unavailable. CDC’s Nowcast is a data projection tool that helps fill this gap by generating timely estimates of variant proportions for variants that are circulating in the United States. View Nowcast estimates on CDC’s COVID Data Tracker website on the Variant Proportions page.

**Historical cases are excluded from daily new cases and 7-day average calculations until they are incorporated into the dataset for the applicable date. Of 652,812 historical cases reported retroactively, 92,150 were reported in the current week and 24,310 were reported in the prior week.


Daily Trends in COVID-19 Cases in the United States Reported to CDC
red-line.jpg

7-Day moving average

View Larger
More Case Data
Vaccinations


The U.S. COVID-19 Vaccination Program began December 14, 2020. As of August 3, 2022, 604.2 million vaccine doses have been administered in the United States. Overall, about 261.6 million people, or 78.8% of the total U.S. population, have received at least one dose of vaccine. About 223.0 million people, or 67.2% of the total U.S. population, have been fully vaccinated.* Of those fully vaccinated, about 107.5 million people have received a booster dose,** but 50.0% of the total booster-eligible population has not yet received a booster dose.

CDC’s COVID Data Tracker displays vaccination trends by age group, race/ethnicity, and urban/rural status. To see trends by age group and race/ethnicity, visit the Vaccination Demographic Trends tab. To see trends by urban/rural status, visit the COVID-19 Vaccination Equity tab.

604,235,972
Vaccine Doses Administered

261,591,248
People who received at least one dose

223,035,566
People who are fully vaccinated*

78.8%
Percentage of the U.S. population that has received at least one dose

67.2%
Percentage of the U.S. population that has been fully vaccinated*

+0.0
Percentage point increase from last week

+0.0
Percentage point change from last week

*Represents the number of people who have received the second dose in a two-dose COVID-19 vaccine series (such as the Pfizer-BioNTech, Moderna, or Novavax vaccines) or one dose of the single-shot Johnson & Johnson’s Janssen vaccine.

**Represents the number of people who are fully vaccinated and have received another dose of COVID-19 vaccine since August 13, 2021. This includes people who received their first additional dose or booster dose.

Daily Change in the Total Number of Administered COVID-19 Vaccine Doses Reported to CDC by the Date of CDC Report, United States
red-line.jpg

7-Day moving average

View Larger
More Vaccination Data
Hospitalizations

New Hospital Admissions


The current 7-day daily average for July 27–August 2, 2022, was 6,112. This is a 4.4% decrease from the prior 7-day average (6,396) from July 20–26, 2022.

5,078,893
Total New Admissions

6,112
Current 7-Day Average

6,396
Prior 7-Day Average

-4.4%
Change in 7-Day Average

The start of consistent reporting of hospital admissions data was August 1, 2020.

Daily Trends in Number of New COVID-19 Hospital Admissions in the United States

View Larger
New admissions are pulled from a 10 am EDT snapshot of the HHS Unified Hospital Data – Analytic Dataset. Due to potential reporting delays, data from the most recent 7 days, as noted in the figure above with the grey bar, should be interpreted with caution. Small shifts in historic data may also occur due to changes in the Centers for Medicare & Medicaid Services (CMS) Provider of Services file, which is used to identify the cohort of included hospitals.

More Hospital Data
COVID-NET: Trends in COVID-19-Associated Hospitalizations among Children Ages 6 Months and Younger


CDC’s Coronavirus Disease 2019-Associated Hospitalization Surveillance Network (COVID-NET) shows that for the week ending July 16, the rate of COVID-19-associated hospitalizations (per 100,000 population) for children ages 6 months and younger, who are not eligible for vaccination, is 26.0, more than 10 times the rate of 2.0 for the week ending April 9. While the weekly rate of hospitalizations for all age groups have increased since April, the rates for children ages 6 months and younger are highest among all pediatric age groups.

Trends in COVID-19-Associated Hospitalizations among Adults Ages ≥65 Years


View Larger


The Coronavirus Disease 2019 (COVID-19)-Associate­­d Hospitalization Surveillance Network (COVID-NET) is an additional source for hospitalization data collected through a network of more than 250 acute-care hospitals in 14 states (representing ~10% of the U.S. population). Detailed data on patient demographics, including race/ethnicity, underlying medical conditions, medical interventions, and clinical outcomes, are collected using a standardized case reporting form.
More COVID-NET Data
Deaths


The current 7-day moving average of new deaths (378) has decreased 4.9% compared with the previous 7-day moving average (397). As of August 3, 2022, a total of 1,027,370 COVID-19 deaths have been reported in the United States.

1,027,370
Total Deaths Reported

378
Current 7-Day Average*

397
Prior 7-Day Average

-4.9%
Change in 7-Day Average Since Prior Week

*Historical deaths are excluded from the daily new deaths and 7-day average calculations until they are incorporated into the dataset by their applicable date. Of 21,756 historical deaths reported retroactively, none were reported in the current week; and none were reported in the prior week.

Daily Trends in Number of COVID-19 Deaths in the United States Reported to CDC
red-line.jpg

7-Day moving average

View Larger
More Death Data
Testing


The percentage of COVID-19 NAATs (nucleic acid amplification tests)* that are positive is decreasing in comparison to the previous week. The 7-day average of percent positivity from NAATs is now 18.1%. The 7-day average number of tests reported for July 22–28, 2022, was 500,250, down 11.4% from 564,487 for the prior 7 days.

933,467,627
Total Tests Reported

500,250
7-Day Average Tests Reported

18.1%
7-Day Average % Positivity

18.5%
Previous 7-Day Average % Positivity

-0.47
Percentage point change in 7-Day Average % Positivity since Prior Week

*Test for SARS-CoV-2, the virus that causes COVID-19

COVID-19 NAAT Laboratory Test 7-day Percent Positivity by State/Territory

View Larger
More Testing DataWastewater Surveillance


COVID Data Tracker’s Wastewater Surveillance tab tracks levels, changes, and detections of SARS-CoV-2* viral RNA in wastewater at over 1,000 testing sites across the country.

Currently, most of the country is reporting moderate to high SARS-CoV-2 levels in wastewater. About half of sites reporting wastewater data are currently seeing some of the highest levels for those sites since December 1, 2021. About half of sites are experiencing a decrease in SARS-CoV-2 levels, and about 40% are reporting an increase. It’s important to note that even a small increase when levels are low can appear like a dramatic increase in the percent change.

For more information on how to use wastewater data visit CDC’s website.

*The virus that causes COVID-19

SARS-CoV-2 Levels in Wastewater by Site

View Larger
Wastewater-2-06102022.jpg


0% means levels are the lowest they have been at the site; 100% means levels are the highest they have been at the site.

https://www.cdc.gov/coronavirus/2019-ncov/covid-data/covidview/index.html
 
covid-tracker-header-lrg.jpg

Print
Subscribe to the Weekly Review


Interpretive Summary for August 12, 2022

View LargerCOVID-19 Vaccine Equity


COVID-19 has caused more than 1,030,000 deaths in the United States since the start of the pandemic and was the third leading cause of death in 2020 and 2021. Throughout the pandemic, people from racial and ethnic minority groups (Black, Hispanic/Latino, American Indian and Alaskan Native (AI/AN), and Native Hawaiian and Other Pacific Islander (NHOPI)) have been disproportionately affected by death from COVID-19 compared with White people. These inequities have decreased over time, but have not been eliminated.

CDC’s COVID Data Tracker shows that lower proportions of people who are Black, Hispanic/Latino, AI/AN, or NHOPI have received a second booster dose than White and Asian people. There are many factors that create challenges to vaccination access and acceptance, often disproportionately affecting racial and ethnic minority groups. Factors include gaps in education, income and wealth; job access and working conditions; racism and other forms of discrimination; unequal healthcare access and quality; transportation and neighborhood conditions; and lack of trust as a result of past medical racism. Efforts to maintain sufficient up-to-date vaccination must respond to community needs.

COVID-19 vaccines available in the United States are effective at protecting people—especially those who are boosted—from getting seriously ill, being hospitalized, and even dying. Because COVID-19 vaccines are readily available, the nation is closer than ever to ending the COVID-19 pandemic in the United States. Yet challenges remain in ensuring all people have fair and just access to COVID-19 vaccination. CDC is committed to ongoing work to promote vaccine equity. Learn more.


What's New
COVID-19 Community Levels


As of August 11, 2022, there are 1,275 (39.6%) counties, districts, or territories with a high COVID-19 Community Level, 1,309 (40.7%) counties with a medium Community Level, and 636 (19.8%) counties with a low Community Level. Compared with last week, this represents a small decrease (−2.1 percentage points) in the number of high-level counties, a small increase (+1.8 percentage points) in the number of medium-level counties, and a marginal increase (+0.3 percentage points) in the number of low-level counties. Overall, 51 out of 52 jurisdictions* had high- or medium-level counties this week. Nevada is the only jurisdiction to have all counties at low Community Levels.

To check your COVID-19 Community Level, visit COVID Data Tracker. To learn which prevention measures are recommended based on your COVID-19 Community Level, visit COVID-19 Community Level and COVID-19 Prevention.

*Includes the 50 states, the District of Columbia, and U.S. territories.

U.S. COVID-19 Community Levels by County

View Larger
Community-Level-2-06102022.jpg

COVID-19 Community Levels
Reported Cases


As of August 10, 2022, the current 7-day moving average of daily new cases (103,614) decreased 13.8% compared with the previous 7-day moving average (120,151). A total of 92,426,945 COVID-19 cases have been reported in the United States as of August 10, 2022.

Variant Proportions

CDC Nowcast projections* for the week ending August 13, 2022, estimate that the combined national proportion of lineages designated as Omicron will continue to be 100% with the predominant Omicron lineage being BA.5, projected at 88.8% (95% PI 87.5-90.0%).**

There are several lineages of Omicron and within each are multiple sublineages. The national proportion of BA.4 is projected to be 5.3% (95% PI 4.9-5.7%), BA.4.6 is projected to be 5.1% (95% PI 4.1-6.4%), and BA.2.12.1 is projected to be 0.8% (95% PI 0.7-0.9%). See COVID Data Tracker for current data.

92,426,945
Total Cases Reported

103,614
Current 7-Day Average***

120,151
Prior 7-Day Average


-13.8%
Change in 7-Day Average since Prior Week

*The median time from specimen collection to sequence data reporting is about 3 weeks. As a result, weighted estimates for the most recent few weeks may be unstable or unavailable. CDC’s Nowcast is a data projection tool that helps fill this gap by generating timely estimates of variant proportions for variants that are circulating in the United States. View Nowcast estimates on CDC’s COVID Data Tracker website on the Variant Proportions page.

**Please note, there were two public variant proportions data updates this week on the COVID Data Tracker on Tuesday, 8/9/2022 and Friday, 8/12/2022. These data will update on Fridays going forward.


***Historical cases are excluded from daily new cases and 7-day average calculations until they are incorporated into the dataset for the applicable date. Of 653,836 historical cases reported retroactively, 1,024 were reported in the current week and 92,150 were reported in the prior week.

Daily Trends in COVID-19 Cases in the United States Reported to CDC
red-line.jpg

7-Day moving average

View Larger
More Case Data
Vaccinations


As of August 10, 2022, 606.2 million vaccine doses have been administered in the United States. Overall, about 262.0 million people, or 78.9% of the total U.S. population, have received at least one dose of vaccine. About 223.5 million people, or 67.3% of the total U.S. population, have been fully vaccinated.* Of those fully vaccinated, about 107.9 million people have received a booster dose,** but 50.0% of the total booster-eligible population has not yet received a booster dose.

CDC’s COVID Data Tracker also displays vaccination trends by age group and race/ethnicity, disability status, and urban/rural status.

606,162,842
Vaccine Doses Administered

261,981,618
People who received at least one dose

223,457,170
People who are fully vaccinated*

+0.1
Percentage point increase from last week

+0.1
Percentage point change from last week

*Represents the number of people who have received the second dose in a two-dose COVID-19 vaccine series (such as the Pfizer-BioNTech, Moderna, or Novavax vaccines) or one dose of the single-shot Johnson & Johnson’s Janssen vaccine.

**Represents the number of people who are fully vaccinated and have received another dose of COVID-19 vaccine since August 13, 2021. This includes people who received their first additional dose or booster dose.

Daily Change in the Total Number of Administered COVID-19 Vaccine Doses Reported to CDC by the Date of CDC Report, United States
red-line.jpg

7-Day moving average

View Larger
More Vaccination Data
Hospitalizations

New Hospital Admissions


The current 7-day daily average for August 3–9, 2022, was 6,003. This is a 2.6% decrease from the prior 7-day average (6,163) from July 27–August 2, 2022.

5,121,322
Total New Admissions

6,003
Current 7-Day Average

6,163
Prior 7-Day Average

-2.6%
Change in 7-Day Average

The start of consistent reporting of hospital admissions data was August 1, 2020.

Daily Trends in Number of New COVID-19 Hospital Admissions in the United States

View Larger
New admissions are pulled from a 10 am EDT snapshot of the HHS Unified Hospital Data – Analytic Dataset. Due to potential reporting delays, data from the most recent 7 days, as noted in the figure above with the grey bar, should be interpreted with caution. Small shifts in historic data may also occur due to changes in the Centers for Medicare & Medicaid Services (CMS) Provider of Services file, which is used to identify the cohort of included hospitals.

More Hospital Data
COVID-NET: Hospitalization Rates by Vaccination Status among Adults Ages ≥50 Years


CDC’s Coronavirus Disease 2019-Associated Hospitalization Surveillance Network (COVID-NET) shows that monthly rates of COVID-19-associated hospitalizations in June 2022 among adults ages 50 years and older were higher in unvaccinated adults compared to those who received a primary COVID-19 vaccination series plus two boosters or additional doses. Among adults ages 50–64 years, the COVID-19-associated hospitalization rate in June among unvaccinated adults was 3.6 times as high as the rate among those who received a primary series plus two boosters or additional doses. Among adults ages 65 years and older, the rate of COVID-19-associated hospitalizations among unvaccinated adults was 6.3 times as high as the rate among adults who received a primary series plus two boosters or additional doses.

Hospitalization Rates by Vaccination Status among Adults Ages ≥65 Years


View Larger


The Coronavirus Disease 2019 (COVID-19)-Associate­­d Hospitalization Surveillance Network (COVID-NET) is an additional source for hospitalization data collected through a network of more than 250 acute-care hospitals in 14 states (representing ~10% of the U.S. population). Detailed data on patient demographics, including race/ethnicity, underlying medical conditions, medical interventions, and clinical outcomes, are collected using a standardized case reporting form.
More COVID-NET Data
Deaths


The current 7-day moving average of new deaths (400) has decreased 6.7% compared with the previous 7-day moving average (429). As of August 10, 2022, a total of 1,030,777 COVID-19 deaths have been reported in the United States.

1,030,777
Total Deaths Reported

400
Current 7-Day Average*

429
Prior 7-Day Average

-6.7%
Change in 7-Day Average Since Prior Week

*Historical deaths are excluded from the daily new deaths and 7-day average calculations until they are incorporated into the dataset by their applicable date. Of 21,756 historical deaths reported retroactively, none were reported in the current week; and none were reported in the prior week.

Daily Trends in Number of COVID-19 Deaths in the United States Reported to CDC
red-line.jpg

7-Day moving average

View Larger
More Death Data
Testing


The percentage of COVID-19 NAATs (nucleic acid amplification tests)* that are positive (percent positivity) is decreasing in comparison to the previous week. The 7-day average of percent positivity from NAATs is now 16.8%. The 7-day average number of tests reported for July 29–August 4, 2022, was 547,772, up 3.0% from 531,591 for the prior 7 days.

936,519,725
Total Tests Reported

547,772
7-Day Average Tests Reported

16.8%
7-Day Average % Positivity

17.6%
Previous 7-Day Average % Positivity

-0.80
Percentage point change in 7-Day Average % Positivity since Prior Week

*Test for SARS-CoV-2, the virus that causes COVID-19

COVID-19 NAAT Laboratory Test 7-day Percent Positivity by State/Territory

View Larger
More Testing DataWastewater Surveillance


COVID Data Tracker’s Wastewater Surveillance tab tracks levels, changes, and detections of SARS-CoV-2* viral RNA in wastewater at over 1,000 testing sites across the country.

Currently, most of the country is reporting moderate to high SARS-CoV-2 levels in wastewater. About half of sites reporting wastewater data are currently seeing some of the highest levels for those sites since December 1, 2021. About half of sites are experiencing a decrease in SARS-CoV-2 levels, and about 41% are reporting an increase. It’s important to note that even a small increase when levels are low can appear like a dramatic increase in the percent change.

For more information on how to use wastewater data visit CDC’s website.

*The virus that causes COVID-19

SARS-CoV-2 Levels in Wastewater by Site

View Larger
Wastewater-2-06102022.jpg


0% means levels are the lowest they have been at the site; 100% means levels are the highest they have been at the site.
More Wastewater Data

https://www.cdc.gov/coronavirus/2019-ncov/covid-data/covidview/index.html
 
covid-tracker-header-lrg.jpg

Print
Subscribe to the Weekly Review


Interpretive Summary for August 19, 2022
Intro-08192022.jpg

View LargerOff to a Great Start


It’s back to school time again, and parents and caregivers across the country are concerned about keeping their kids safe in the changing COVID-19 landscape. Last week CDC released new COVID-19 guidance, including an update to recommendations for K-12 schools and Early Care and Education (ECE) programs. The new guidance helps schools protect students and staff, including people who are at increased risk.* Here are some ways to stay safe at school.
  • Stay home when you’re sick. Even if it isn’t COVID-19, staying home still lowers the risk of spreading infections to other people.
  • Get tested. Test immediately if you have COVID-19 symptoms. If you test positive, follow recommendations for isolation. If you were exposed to COVID-19 and do not have symptoms, wait at least 5 full days after your exposure before testing. If you test negative—and you used an at-home test—see FDA instructions on repeat testing.
  • Mask up. Staff and students should wear masks indoors if their COVID-19 Community Level is high, if they have been exposed to COVID-19, or if they are returning from isolation. To check your COVID-19 Community Level, visit COVID Data Tracker.
  • Practice good hand hygiene and respiratory etiquette. Students should learn proper handwashing and to cover coughs and sneezes.
  • Optimize ventilation, especially in places with high COVID-19 Community Levels. Effective ventilation and air filtration are important parts of COVID-19 prevention.
Schools are safer when students and staff are up to date on their vaccinations. All children ages 6 months and older are eligible for COVID-19 vaccines, and children 5 years and older are eligible for boosters. Children have been less affected by COVID-19 compared with adults, but they can get sick with COVID-19 and can spread it to others around them. Keeping all children healthy and safe is the key to getting this school year off to a great start.

Learn more about the new school guidance: Giving Every School the Tools to Prevent COVID-19 Spread and Stay Safely Open All Year Long.

*Some students might need additional protections in the classroom—including those who are immunocompromised, with complex medical conditions, or with certain disabilities that can put them at higher risk of severe outcomes from COVID-19. Learn more about actions you can take to protect yourself and others.


What's New
COVID-19 Community Levels


As of August 18, 2022, there are 1,091 (33.9%) counties, districts, or territories with a high COVID-19 Community Level, 1,324 (41.1%) counties with a medium Community Level, and 805 (25.0%) counties with a low Community Level. Compared with last week, this represents a moderate decrease (−5.7 percentage points) in the number of high-level counties, a marginal increase (+0.5 percentage points) in the number of medium-level counties, and a moderate increase (+5.2 percentage points) in the number of low-level counties. Overall, 49 out of 52 jurisdictions* had high- or medium-level counties this week. The District of Columbia, New Hampshire, and Nevada are the only jurisdictions to have all counties at low Community Levels.

To check your COVID-19 Community Level, visit COVID Data Tracker. To learn which prevention measures are recommended based on your COVID-19 Community Level, visit COVID-19 Community Level and COVID-19 Prevention.

*Includes the 50 states, the District of Columbia, and U.S. territories.

U.S. COVID-19 Community Levels by County

View Larger
Community-Level-2-06102022.jpg

COVID-19 Community Levels
Reported Cases


As of August 17, 2022, the current 7-day moving average of daily new cases (95,652) decreased 9.9% compared with the previous 7-day moving average (106,116). A total of 93,124,238 COVID-19 cases have been reported in the United States as of August 17, 2022.

Variant Proportions

CDC Nowcast projections* for the week ending August 20, 2022, estimate that the combined national proportion of lineages designated as Omicron will continue to be 100% with the predominant Omicron lineage being BA.5, projected at 88.9% (95% PI 87.6-90.1%).

There are several lineages of Omicron and within each are multiple sublineages. The national proportion of BA.4.6 is projected to be 6.3% (95% PI 5.2-7.6%), BA.4 is projected to be 4.3% (95% PI 4.0-4.7%), and BA.2.12.1 is projected to be 0.5% (95% PI 0.4-0.5%). See COVID Data Tracker for current data.

93,124,238
Total Cases Reported

95,652
Current 7-Day Average***

106,116
Prior 7-Day Average


-9.9%
Change in 7-Day Average since Prior Week

*CDC uses Nowcast projections to predict current variant proportions circulating in the United States. The median time from specimen collection to sequence data reporting is about 3 weeks. As a result, weighted estimates for the most recent few weeks may be unstable or unavailable. Starting August 12, these projections use the most recent three weeks rather than the most recent two weeks of data. These data are now being updated on Fridays instead of Tuesdays. View Nowcast estimates on CDC’s COVID Data Tracker website on the Variant Proportions page.

**Historical cases are excluded from daily new cases and 7-day average calculations until they are incorporated into the dataset for the applicable date. Of 652,811 historical cases reported retroactively, 11 were reported in the current week and none were reported in the prior week.


Daily Trends in COVID-19 Cases in the United States Reported to CDC
red-line.jpg

7-Day moving average

View Larger
More Case Data
Vaccinations

COVID-19 Vaccine Primary Series


As of August 17, 2022, 607.6 million vaccine doses have been administered in the United States. Overall, about 262.3 million people, or 79.0% of the total U.S. population, have received at least one dose of vaccine. About 223.7 million people, or 67.4% of the total U.S. population, have been fully vaccinated.*

607,588,353
Vaccine Doses Administered

262,323,837
People who received at least one dose

223,684,995
People who are fully vaccinated*

+0.1
Percentage point increase from last week

+0.1
Percentage point change from last week

*Represents the number of people who have received the second dose in a two-dose COVID-19 vaccine series (such as the Pfizer-BioNTech, Moderna, or Novavax vaccines) or one dose of the single-shot Johnson & Johnson’s Janssen vaccine.

Daily Change in the Total Number of Administered COVID-19 Vaccine Doses Reported to CDC by the Date of CDC Report, United States
red-line.jpg

7-Day moving average

View Larger
More Vaccination DataCOVID-19 Vaccine Boosters


Of those fully vaccinated, about 108.2 million people have received a booster dose,* but 50.0% of the total booster-eligible population has not yet received a booster dose. Booster dose eligibility varies by age and health condition. Learn more about who is eligible.

108,217,633
Booster Doses Administered

108,215,940
Population ≥ 5 Years of Age with a 1st booster dose*

21,431,103
Population ≥ 50 Years of Age with a 2nd booster dose**

48.4%
Percentage of the Population ≥ 5 Years of Age with a 1st booster dose

33.2%
Percentage of the Population ≥ 50 Years of Age with a 2nd booster dose

+0.2
Percentage point increase from last week

+1.2
Percentage point increase from last week

*Represents the number of people who are fully vaccinated and have received another dose of COVID-19 vaccine since August 13, 2021. This includes people who received their first additional dose or booster dose.

**Represents the number of people who are fully vaccinated and have received two subsequent doses of COVID-19 vaccine since August 13, 2021. This includes people who received two booster doses and people who received one additional dose and one booster dose.


COVID-19 Booster Dose Administration, United States
Booster-legend.png

View Larger

View Larger
More Vaccination Data
Hospitalizations

New Hospital Admissions


The current 7-day daily average for August 10–16, 2022, was 5,690. This is a 6.1% decrease from the prior 7-day average (6,059) from August 3–9, 2022.

5,161,555
Total New Admissions

5,690
Current 7-Day Average

6,059
Prior 7-Day Average

-6.1%
Change in 7-Day Average

The start of consistent reporting of hospital admissions data was August 1, 2020.

Daily Trends in Number of New COVID-19 Hospital Admissions in the United States

View Larger
New admissions are pulled from a 10 am EDT snapshot of the HHS Unified Hospital Data – Analytic Dataset. Due to potential reporting delays, data from the most recent 7 days, as noted in the figure above with the grey bar, should be interpreted with caution. Small shifts in historic data may also occur due to changes in the Centers for Medicare & Medicaid Services (CMS) Provider of Services file, which is used to identify the cohort of included hospitals.

More Hospital Data
COVID-NET: Hospitalization Rates by Vaccination Status among Adults Ages ≥65 Years


CDC’s Coronavirus Disease 2019-Associated Hospitalization Surveillance Network (COVID-NET) shows that overall rates of COVID-19-associated hospitalizations have increased since the week ending April 2, 2022. Notably, rates among adults ages 65 years and older have seen a sharp increase, from 6.4 per 100,000 population on April 2, to 31.9 per 100,000 population on July 23. Rates of COVID-19-associated hospitalizations among adults aged ≥65 years have remained elevated for more than two months, ranging from 25.3 to 31.9 per 100,000 between May 14 and July 23.

Hospitalization Rates by Vaccination Status among Adults Ages ≥65 Years


View Larger


The Coronavirus Disease 2019 (COVID-19)-Associate­­d Hospitalization Surveillance Network (COVID-NET) is an additional source for hospitalization data collected through a network of more than 250 acute-care hospitals in 14 states (representing ~10% of the U.S. population). Detailed data on patient demographics, including race/ethnicity, underlying medical conditions, medical interventions, and clinical outcomes, are collected using a standardized case reporting form.
More COVID-NET Data
Deaths


The current 7-day moving average of new deaths (394) has decreased 10.7% compared with the previous 7-day moving average (442). As of August 17, 2022, a total of 1,034,118 COVID-19 deaths have been reported in the United States.

1,034,118
Total Deaths Reported

394
Current 7-Day Average*

442
Prior 7-Day Average

-10.7%
Change in 7-Day Average Since Prior Week

*Historical deaths are excluded from the daily new deaths and 7-day average calculations until they are incorporated into the dataset by their applicable date. Of 21,756 historical deaths reported retroactively, none were reported in the current week; and none were reported in the prior week.

Daily Trends in Number of COVID-19 Deaths in the United States Reported to CDC
red-line.jpg

7-Day moving average

View Larger
More Death Data
Testing


The percentage of COVID-19 NAATs (nucleic acid amplification tests)* that are positive is decreasing in comparison to the previous week. The 7-day average of percent positivity from NAATs is now 15.5%. The 7-day average number of tests reported for August 5–11, 2022, was 518,263, down 8.4% from 565,926 for the prior 7 days.

941,299,259
Total Tests Reported

518,263
7-Day Average Tests Reported

15.5%
7-Day Average % Positivity

16.6%
Previous 7-Day Average % Positivity

-1.06
Percentage point change in 7-Day Average % Positivity since Prior Week

*Test for SARS-CoV-2, the virus that causes COVID-19

COVID-19 NAAT Laboratory Test 7-day Percent Positivity by State/Territory

View Larger
More Testing DataWastewater Surveillance


COVID Data Tracker’s Wastewater Surveillance tab tracks levels, changes, and detections of SARS-CoV-2* viral RNA in wastewater at over 1,000 testing sites across the country.

Currently, most of the country is reporting moderate to high SARS-CoV-2 levels in wastewater. About half of sites reporting wastewater data are currently seeing some of the highest levels for those sites since December 1, 2021. About half of sites are experiencing a decrease in SARS-CoV-2 levels, and about 40% are reporting an increase. It’s important to note that even a small increase when levels are low can appear like a dramatic increase in the percent change.

For more information on how to use wastewater data, visit CDC’s website.

*The virus that causes COVID-19

SARS-CoV-2 Levels in Wastewater by Site

View Larger
Wastewater-2-06102022.jpg


0% means levels are the lowest they have been at the site; 100% means levels are the highest they have been at the site.

https://www.cdc.gov/coronavirus/2019-ncov/covid-data/covidview/index.html
 
covid-tracker-header-lrg.jpg

Print
Subscribe to the Weekly Review


Interpretive Summary for August 26, 2022

View LargerStay Up to Date with Vaccines


COVID-19 cases, hospitalizations, and deaths are leveling off from their rise over the summer. We can help prevent these numbers from increasing again by staying up to date with COVID-19 vaccinations. The good news is that 77% of adults over age 18 years have received a primary series at this point. The not-so-good news is that only half of booster-eligible adults have gotten a booster, and only 34% of adults ages 50 years and older have gotten a second booster. Vaccine effectiveness can decrease over time, but boosters restore protection, including against serious illness.

COVID Data Tracker shows that in June 2022, people ages 50 years and older with two booster doses were 14 times less likely to die from COVID-19 than unvaccinated people of the same age and three times less likely to die than vaccinated people of the same age with at least one booster. Additionally, a new CDC study conducted between March and May 2022, during the Omicron BA.2 surge, found that COVID-19 hospitalization rates increased more among adults ages 65 years and older relative to those in younger adults. Among adults who were hospitalized, 95% had one or more underlying medical condition, and rates of COVID-19-associated hospitalizations were 3.4 times higher among unvaccinated adults than adults vaccinated with at least one booster or additional dose.

These findings highlight that older adults and those with underlying medical conditions, including those who have been vaccinated with only a primary series, might still be at higher risk of getting very sick from COVID-19. Everyone who is eligible should stay up to date with their COVID-19 vaccines, including getting their boosters. People at higher risk of severe illness should take additional measures, regardless of vaccination status, including talking to a provider about treatment options if they get COVID-19.

Note to Readers: CDC will not publish the COVID Data Tracker Weekly Review on Friday, September 2, 2022. The Weekly Review will resume publication on Friday, September 9, 2022. To find all the latest COVID-19 data, visit COVID Data Tracker.


What's New
COVID-19 Community Levels


As of August 25, 2022, there are 951 (29.5%) counties, districts, or territories with a high COVID-19 Community Level, 1,382 (42.9%) counties with a medium Community Level, and 887 (27.6%) counties with a low Community Level. Compared with last week, this represents a moderate decrease (−4.4 percentage points) in the number of high-level counties, a marginal increase (+1.8 percentage points) in the number of medium-level counties, and a moderate increase (+2.6 percentage points) in the number of low-level counties. Overall, 48 out of 52 jurisdictions* had high- or medium-level counties this week. The District of Columbia, Massachusetts, Nevada, and Rhode Island are the only jurisdictions to have all counties at low Community Levels.

To check your COVID-19 Community Level, visit COVID Data Tracker. To learn which prevention measures are recommended based on your COVID-19 Community Level, visit COVID-19 Community Level and COVID-19 Prevention.

*Includes the 50 states, the District of Columbia, and U.S. territories.

U.S. COVID-19 Community Levels by County

View Larger
Community-Level-2-06102022.jpg
COVID-19 Community Levels
Reported Cases


As of August 24, 2022, the current 7-day moving average of daily new cases (90,676) decreased 6.7% compared with the previous 7-day moving average (97,184). A total of 93,777,133 COVID-19 cases have been reported in the United States as of August 24, 2022

Variant Proportions

CDC Nowcast projections* for the week ending August 27, 2022, estimate that the combined national proportion of lineages designated as Omicron will continue to be 100% with the predominant Omicron lineage being BA.5, projected at 88.7% (95% PI 87.3-89.8%).

There are several lineages of Omicron and within each are multiple sublineages. The national proportion of BA.4.6 is projected to be 7.5% (95% PI 6.4-8.8%), BA.4 is projected to be 3.6% (95% PI 3.3-3.8%), and BA.2.12.1 is projected to be 0.2% (95% PI 0.2-0.3%). See COVID Data Tracker for current data.

93,777,133

Total Cases Reported

90,676

Current 7-Day Average**

97,184
Prior 7-Day Average


-6.7%
Change in 7-Day Average since Prior Week

*CDC uses Nowcast projections to predict current variant proportions circulating in the United States. The median time from specimen collection to sequence data reporting is about 3 weeks. As a result, weighted estimates for the most recent few weeks may be unstable or unavailable. Starting August 12, these projections use the most recent three weeks rather than the most recent two weeks of data. These data are now being updated on Fridays instead of Tuesdays. View Nowcast estimates on CDC’s COVID Data Tracker website on the Variant Proportions page.

**Historical cases are excluded from daily new cases and 7-day average calculations until they are incorporated into the dataset for the applicable date. Of 658,913 historical cases reported retroactively, 6,102 were reported in the current week and 11 were reported in the prior week.

Daily Trends in COVID-19 Cases in the United States Reported to CDC
red-line.jpg

7-Day moving average

View Larger
More Case Data
Vaccinations

COVID-19 Vaccine Primary Series


As of August 24, 2022, 608.9 million vaccine doses have been administered in the United States. Overall, about 262.6 million people, or 79.1% of the total U.S. population, have received at least one dose of vaccine. About 223.9 million people, or 67.4% of the total U.S. population, have been fully vaccinated.*

608,937,334

Vaccine Doses Administered

262,643,277
People who received at least one dose
(79.1% of the U.S. population)


223,914,723
People who are fully vaccinated*
(67.4% of the U.S. population)


+0.1
Percentage point increase from last week

+0.0
Percentage point change from last week

*Represents the number of people who have received the second dose in a two-dose COVID-19 vaccine series (such as the Pfizer-BioNTech, Moderna, or Novavax vaccines) or one dose of the single-shot Johnson & Johnson’s Janssen vaccine.

Daily Change in the Total Number of Administered COVID-19 Vaccine Doses Reported to CDC by the Date of Administration, United States
red-line.jpg

7-Day moving average

View Larger
More Vaccination DataCOVID-19 Vaccine Boosters


Of those fully vaccinated, about 108.5 million people have received a booster dose,* but 49.9% of the total booster-eligible population has not yet received a booster dose. Booster dose eligibility varies by age and health condition. Learn more about who is eligible.

108,540,822
Booster Doses Administered

108,539,031
Population ≥ 5 Years of Age with a 1st booster dose*

21,772,202
Population ≥ 50 Years of Age with a 2nd booster dose**

48.5%
Percentage of the Population ≥ 5 Years of Age with a 1st booster dose

33.7%
Percentage of the Population ≥ 50 Years of Age with a 2nd booster dose

+0.1
Percentage point increase from last week

+0.5
Percentage point increase from last week

*Represents the number of people who are fully vaccinated and have received another dose of COVID-19 vaccine since August 13, 2021. This includes people who received their first additional dose or booster dose.

**Represents the number of people who are fully vaccinated and have received two subsequent doses of COVID-19 vaccine since August 13, 2021. This includes people who received two booster doses and people who received one additional dose and one booster dose.


COVID-19 Booster Dose Administration, United States
Booster-1.jpg

View Larger

View Larger
More Vaccination Data
Hospitalizations

New Hospital Admissions


The current 7-day daily average for August 17–23, 2022, was 5,314. This is a 6.6% decrease from the prior 7-day average (5,687) from August 10–16, 2022.

5,198,924
Total New Admissions

5,314
Current 7-Day Average

5,687
Prior 7-Day Average

-6.6%
Change in 7-Day Average

The start of consistent reporting of hospital admissions data was August 1, 2020.

Daily Trends in Number of New COVID-19 Hospital Admissions in the United States

View Larger
New admissions are pulled from a 10 am EDT snapshot of the HHS Unified Hospital Data – Analytic Dataset. Due to potential reporting delays, data from the most recent 7 days, as noted in the figure above with the grey bar, should be interpreted with caution. Small shifts in historic data may also occur due to changes in the Centers for Medicare & Medicaid Services (CMS) Provider of Services file, which is used to identify the cohort of included hospitals.

More Hospital Data
COVID-NET: Hospitalization Rates by Vaccination Status among Adults Ages ≥65 Years


CDC’s Coronavirus Disease 2019-Associated Hospitalization Surveillance Network (COVID-NET) shows that overall rates of COVID-19-associated hospitalizations have increased since the week ending April 2, 2022. Notably, rates among adults ages 65 years and older have seen a sharp increase, from 6.4 per 100,000 population on April 2, to 31.5 per 100,000 population on August 6. Since April 9, rates of COVID-19-associated hospitalizations among adults ages 65 years and older have remained more than 3 times as high as rates in adults ages 50–64 years.

This new report using COVID-NET data gives more information on COVID-19-associated hospitalizations among adults ages 65 years and older during the Omicron BA.2 period.

Hospitalization Rates by Vaccination Status among Adults Ages ≥65 Years


View Larger


The Coronavirus Disease 2019 (COVID-19)-Associate­­d Hospitalization Surveillance Network (COVID-NET) is an additional source for hospitalization data collected through a network of more than 250 acute-care hospitals in 14 states (representing ~10% of the U.S. population). Detailed data on patient demographics, including race/ethnicity, underlying medical conditions, medical interventions, and clinical outcomes, are collected using a standardized case reporting form.
More COVID-NET Data
Deaths


The current 7-day moving average of new deaths (390) has decreased 11.6% compared with the previous 7-day moving average (441). As of August 24, 2022, a total of 1,037,381 COVID-19 deaths have been reported in the United States.

1,037,381
Total Deaths Reported

390
Current 7-Day Average*

441
Prior 7-Day Average

-11.6%
Change in 7-Day Average Since Prior Week

*Historical deaths are excluded from the daily new deaths and 7-day average calculations until they are incorporated into the dataset by their applicable date. Of 21,756 historical deaths reported retroactively, none were reported in the current week; and none were reported in the prior week.

Daily Trends in Number of COVID-19 Deaths in the United States Reported to CDC
red-line.jpg

7-Day moving average

View Larger
More Death Data
Testing


The percentage of COVID-19 NAATs (nucleic acid amplification tests)* that are positive is decreasing in comparison to the previous week. The 7-day average of percent positivity from NAATs is now 14.6%. The 7-day average number of tests reported for August 12–18, 2022, was 504,944, down 5.1% from 532,031 for the prior 7 days.

945,040,506
Total Tests Reported

504,944
7-Day Average Tests Reported

14.6%
7-Day Average % Positivity

15.4%
Previous 7-Day Average % Positivity

-.86
Percentage point change in 7-Day Average % Positivity since Prior Week

*Test for SARS-CoV-2, the virus that causes COVID-19

COVID-19 NAAT Laboratory Test 7-day Percent Positivity by State/Territory

View Larger
More Testing DataWastewater Surveillance


COVID Data Tracker’s Wastewater Surveillance tab tracks levels, changes, and detections of SARS-CoV-2* viral RNA in wastewater at over 1,000 testing sites across the country.

Currently, most of the country is reporting moderate to high SARS-CoV-2 levels in wastewater. About 39% of sites reporting wastewater data are currently seeing some of the highest levels for those sites since December 1, 2021. About half of sites are experiencing a decrease in SARS-CoV-2 levels, and about 40% are reporting an increase. It’s important to note that even a small increase when levels are low can appear like a dramatic increase in the percent change.

For more information on how to use wastewater data, visit CDC’s website.

*The virus that causes COVID-19

SARS-CoV-2 Levels in Wastewater by Site

View Larger
Wastewater-2-06102022.jpg


0% means levels are the lowest they have been at the site; 100% means levels are the highest they have been at the site.
More Wastewater Data

https://www.cdc.gov/coronavirus/2019-ncov/covid-data/covidview/index.html
 
Back
Top