• FluTrackers.com Inc. does not provide medical advice. Information on this web site is collected from various internet resources, and the FluTrackers board of directors makes no warranty to the safety, efficacy, correctness or completeness of the information posted on this site by any author or poster. The information collated here is for instructional and/or discussion purposes only and is NOT intended to diagnose or treat any disease, illness, or other medical condition. Every individual reader or poster should seek advice from their personal physician/healthcare practitioner before considering or using any interventions that are discussed on this website. By continuing to access this website you agree to consult your personal physican before using any interventions posted on this website, and you agree to hold harmless FluTrackers.com Inc., the board of directors, the members, and all authors and posters for any effects from use of any medication, supplement, vitamin or other substance, device, intervention, etc. mentioned in posts on this website, or other internet venues referenced in posts on this website.
  • We are not asking for any donations. Do not donate to any entity who says they are raising funds for us.

US - CDC: COVID Data Tracker Weekly Review 2021 - 2024 - For trend analysis only

covid-tracker-header-lrg.jpg

Print

Subscribe to the Weekly Review


Interpretive Summary for February 3, 2022
Early Detection


COVID-19 cases and hospitalizations are continuing to decline across the United States. As of February 2, 2022, cases are down 53.1% from their peak on January 15. However, community transmission is still high nationwide. According to CDC’s Nowcast projections for the week ending January 29, 2022, the proportion of the Omicron variant circulating in the United States is predicted to be greater than 99%.

Omicron is extremely contagious. The COVID-19 vaccines available in the United States are effective at protecting people from getting seriously ill, getting hospitalized, and even dying. Everyone in the United States ages 5 years and older is eligible to receive a COVID-19 vaccine. Everyone ages 12 years and older is eligible to receive a COVID-19 booster dose if enough time has passed since completion of their primary series. To find a vaccine provider near you, visit vaccines.gov.

Wastewater (sewage) surveillance is a promising tool for tracking the spread of SARS-CoV-2, the virus that causes COVID-19. Many people with COVID-19 shed the virus in their feces, so testing wastewater can help us find COVID-19 in communities. Wastewater testing has been successfully used as a method for detection of other diseases, such as polio. Wastewater surveillance results can provide an early warning of increasing COVID-19 cases and help communities prepare.

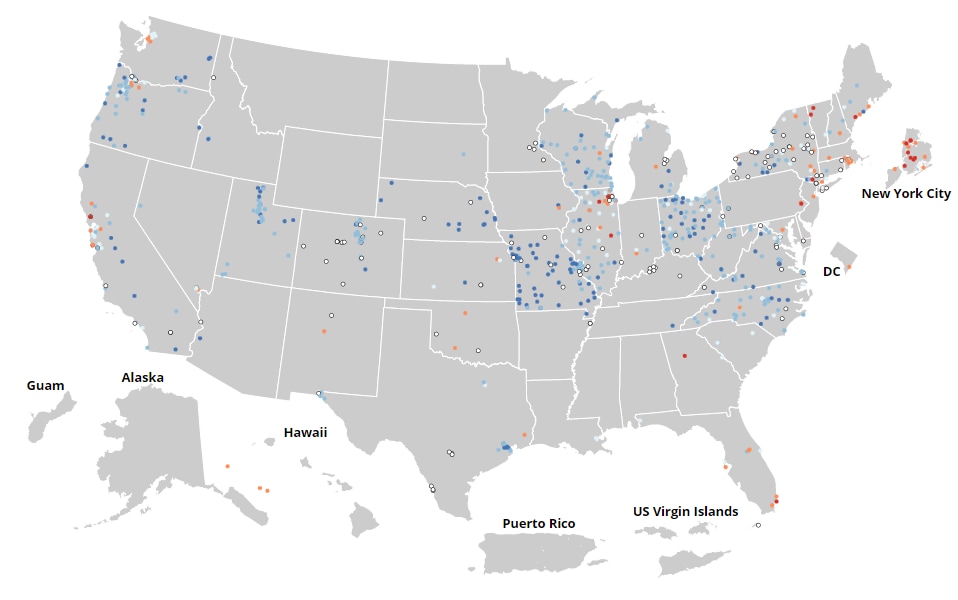
On February 3, 2022, COVID Data Tracker released a Wastewater Surveillance tab, which tracks SARS-CoV-2 levels in sewage at more than 400 testing sites across the country. This marks the first time CDC’s wastewater surveillance data is available for download. See “A Closer Look” below for more information about this method of data collection.

A Closer Look

What's New

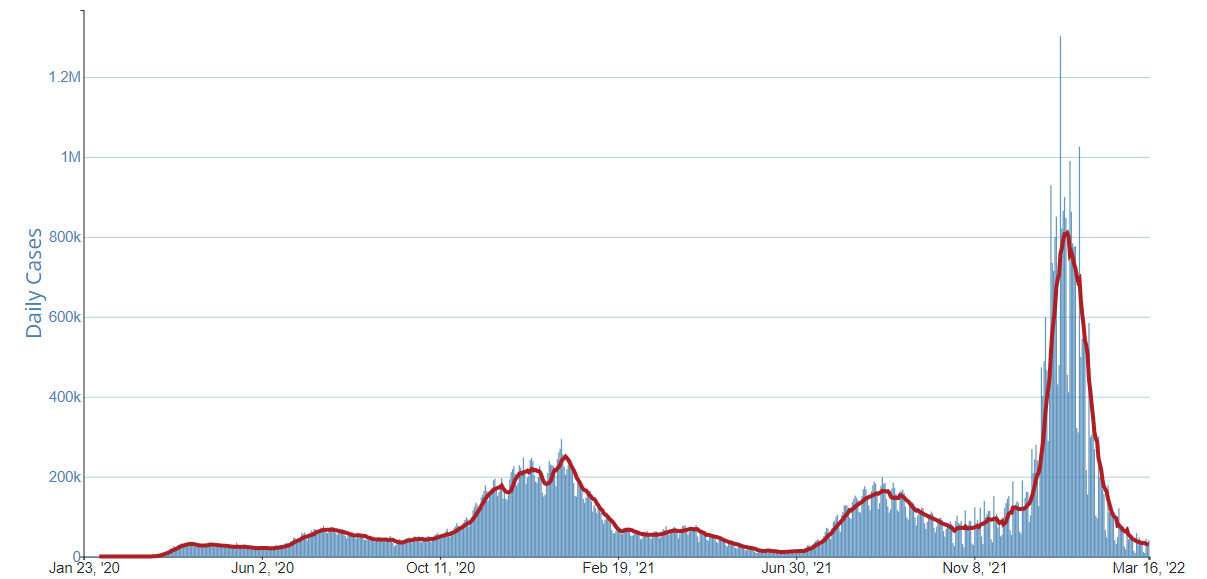
Reported Cases


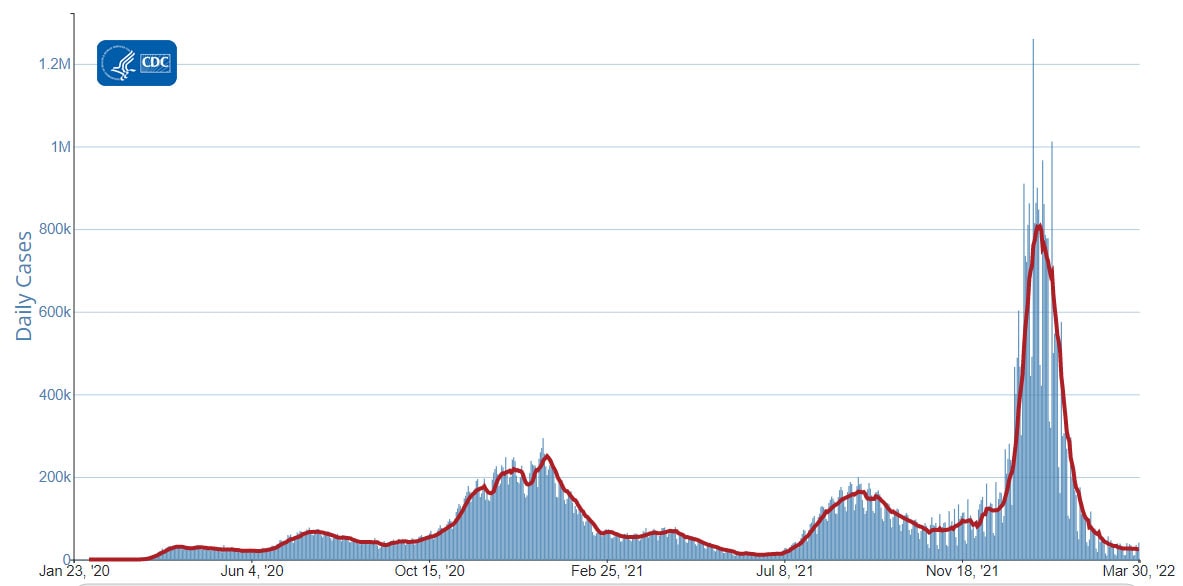
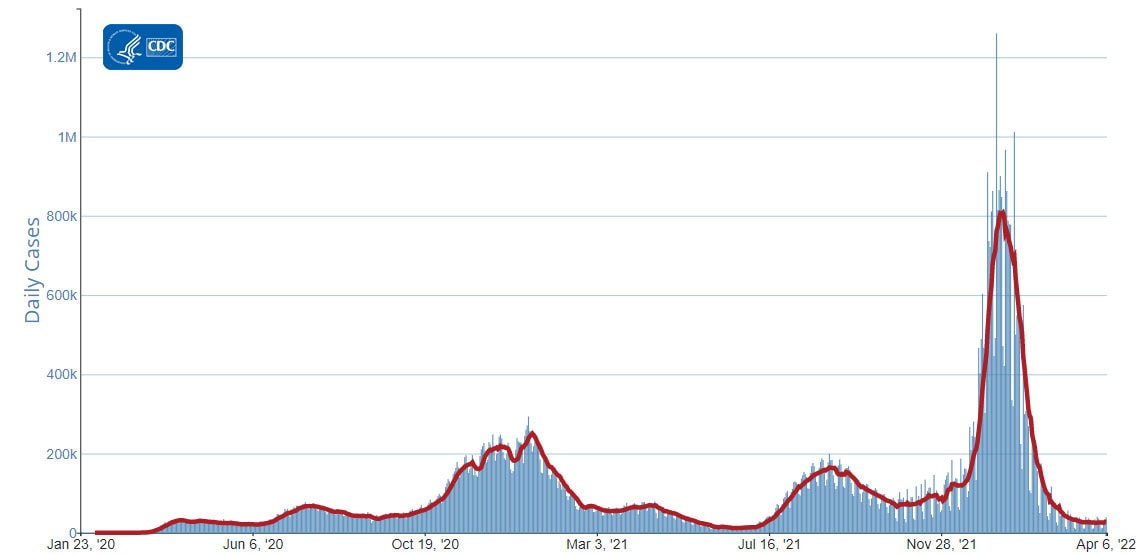
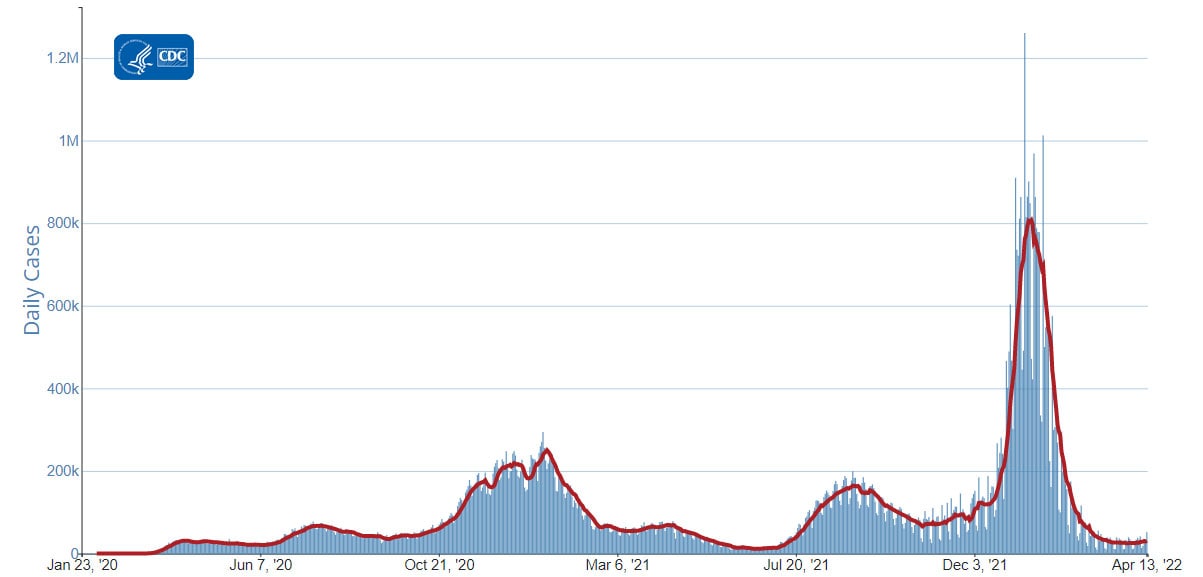
As of February 2, 2022, the current 7-day moving average of daily new cases (378,015) decreased 37.6% compared with the previous 7-day moving average (605,735). A total of 75,605,991 COVID-19 cases have been reported in the United States as of February 2, 2022.

Currently two variants, Omicron and Delta, are classified as Variants of Concern (VOC) in the United States. CDC Nowcast projections* for the week ending January 29, 2022, predict the national proportion of Omicron to be 99.9% (95% PI 99.9-100%) and Delta to be 0.1% (95% PI 0.0-0.1%). Omicron is predicted to be greater than 99% in all HHS regions.

There are four lineages designated as Omicron: B.1.1.529, BA.1, BA.2, and BA.3. Currently, the BA.1 lineage is predominant in the United States. CDC weighted estimates for the week ending January 15 indicate the proportion of BA.2 in the United States is less than 1%; however, the proportion of BA.2 has been steadily increasing. When the weighted estimate of BA.2 is greater than 1%, CDC NOWCAST projections will include an estimate for the proportion of BA.2 in the United States.

75,605,991
Total Cases Reported

378,015
Current 7-Day Average**

605,735
Prior 7-Day Average

-37.6%
Change in 7-Day Average since Prior Week

*The median time from specimen collection to sequence data reporting is about 3 weeks. As a result, weighted estimates for the most recent few weeks may be unstable or unavailable. CDC’s Nowcast is a data projection tool that helps fill this gap by generating timely estimates of variant proportions for variants that are circulating in the United States. View Nowcast estimates on CDC’s COVID Data Tracker website on the Variant Proportions page.

**Historical cases are excluded from daily new cases and 7-day average calculations until they are incorporated into the dataset for the applicable date. Of 399,385 historical cases reported retroactively, 136 were reported in the current week and none were reported in the prior week.

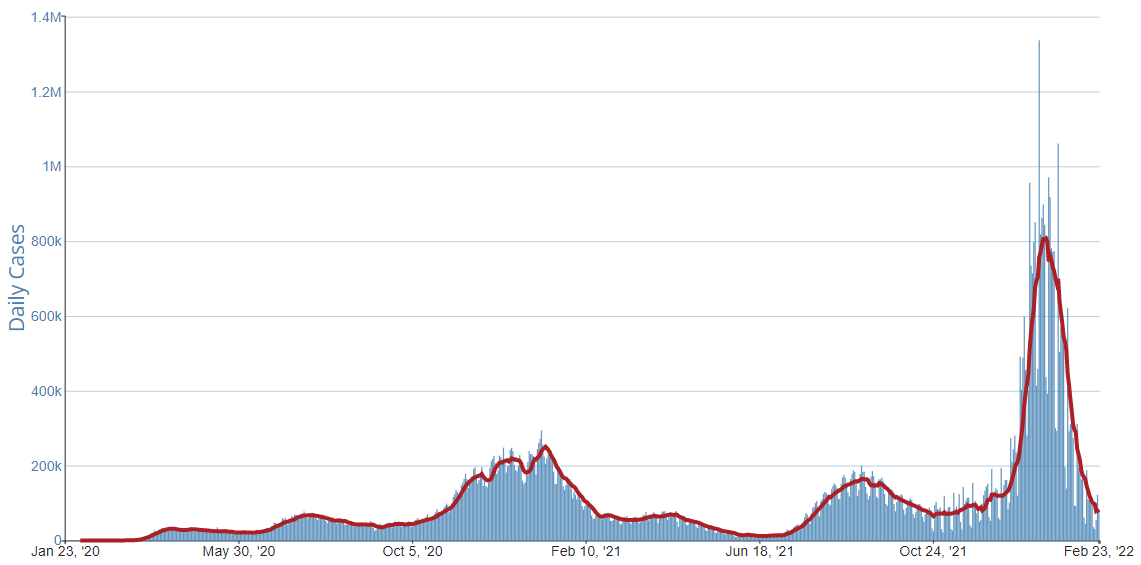
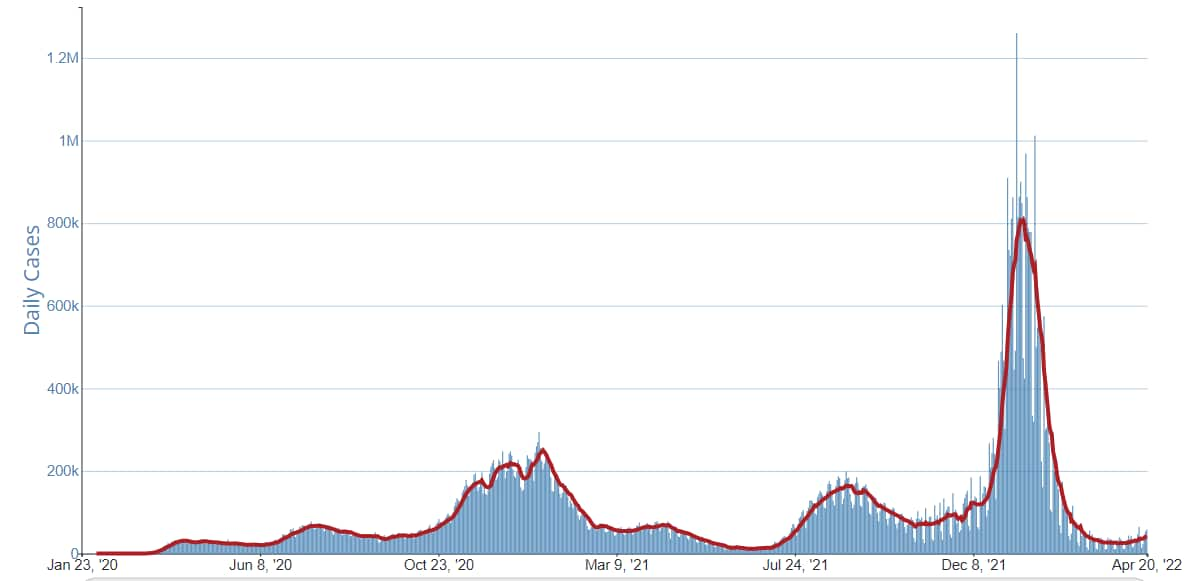
Daily Trends in COVID-19 Cases in the United States Reported to CDC
red-line.jpg

7-Day moving average

resize iconView Larger
More Case Data

Vaccinations


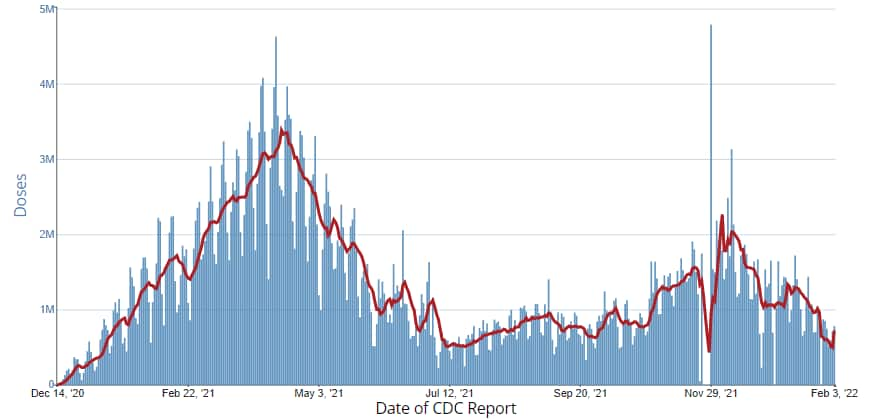
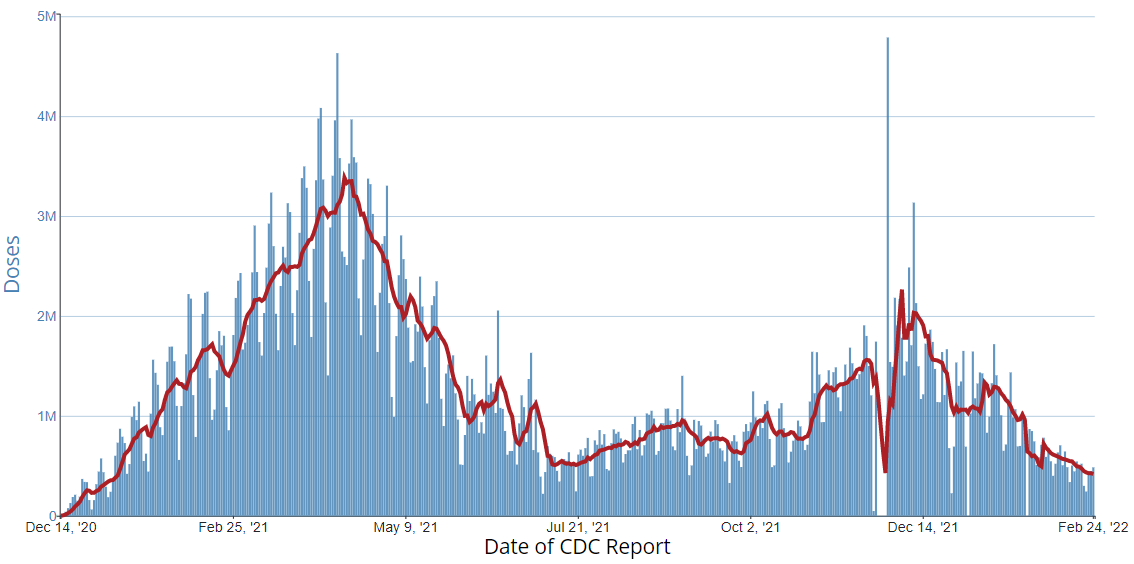
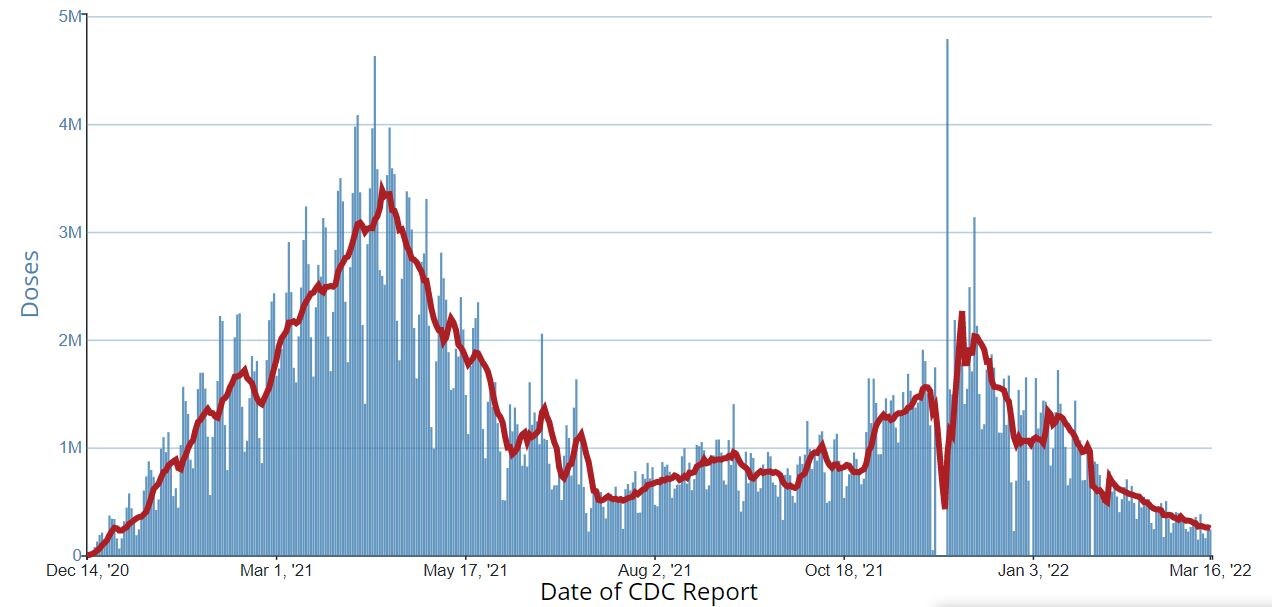
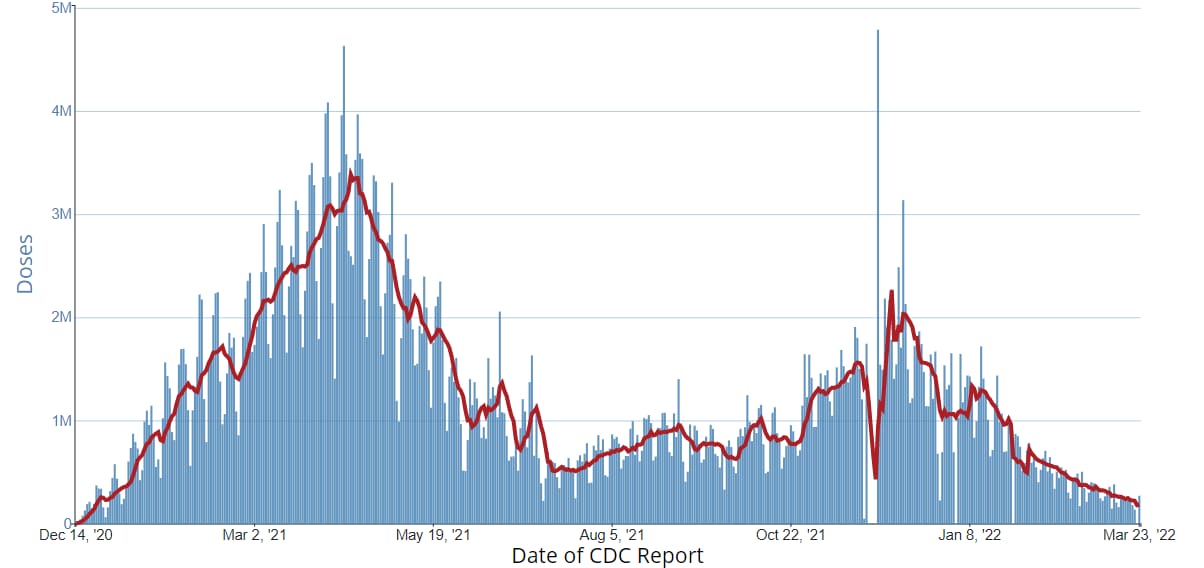
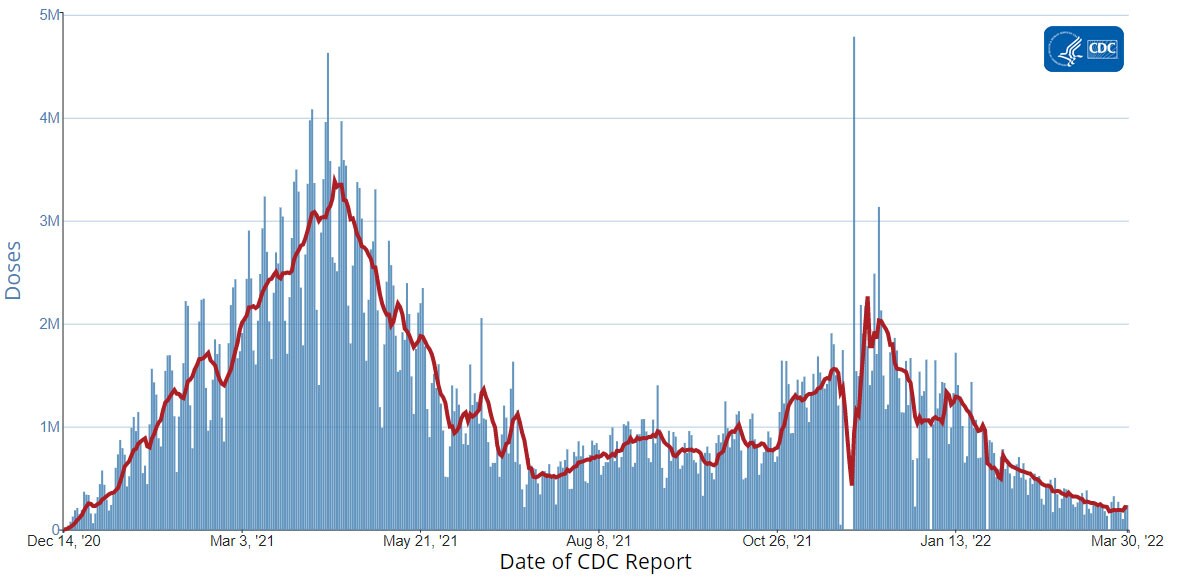
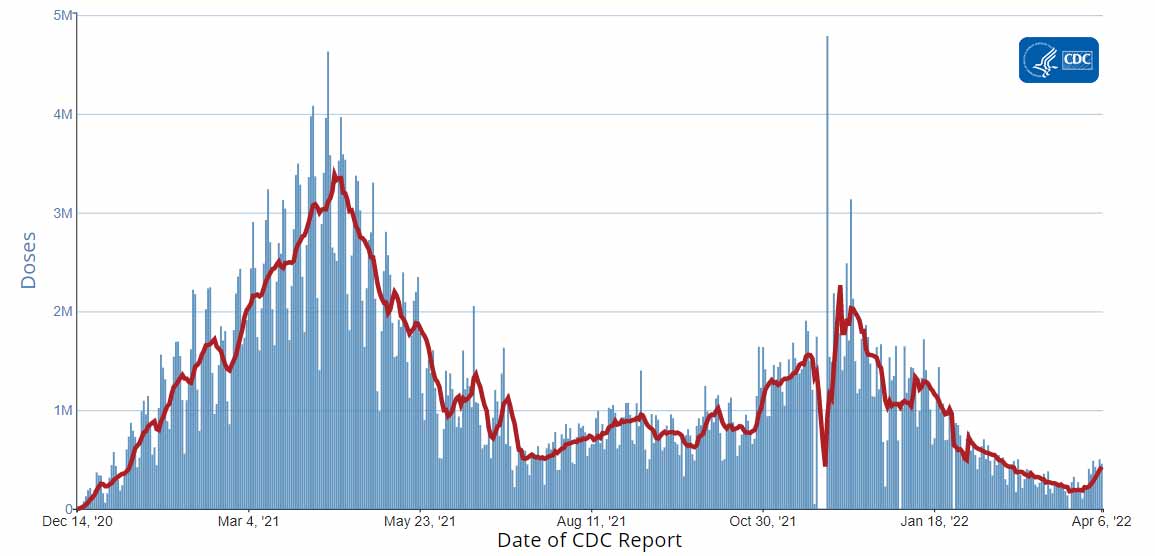
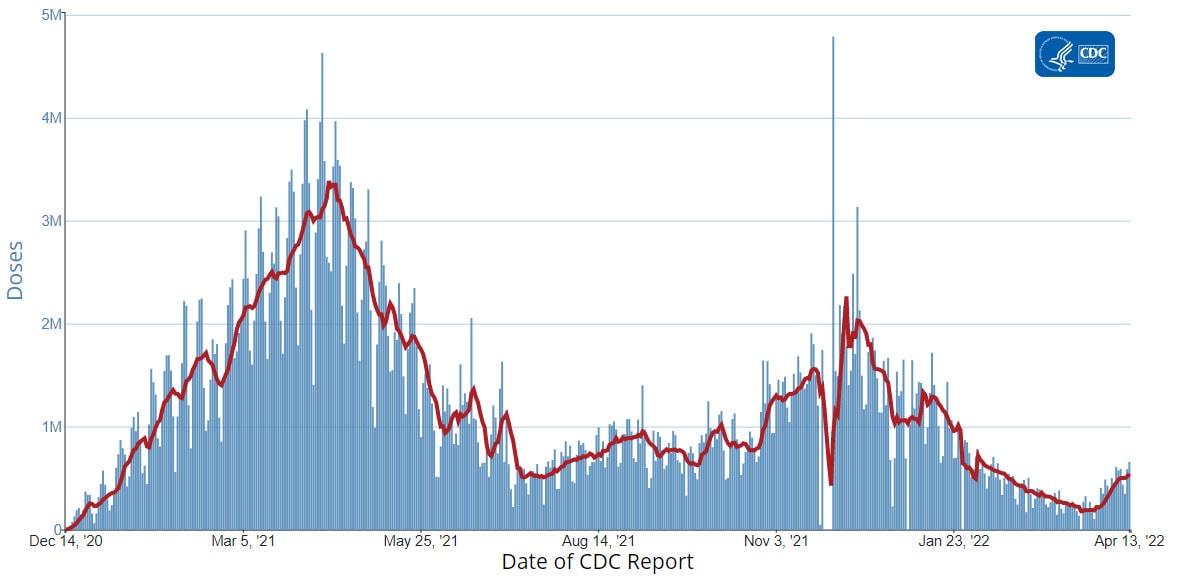
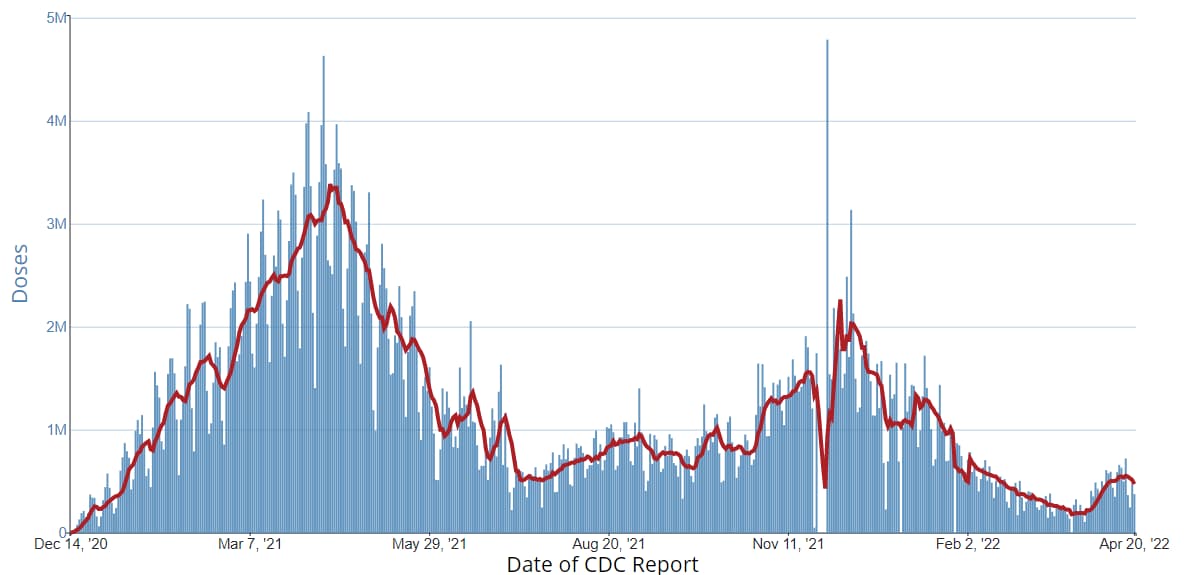
The U.S. COVID-19 Vaccination Program began December 14, 2020. As of February 3, 2022, 541.4 million vaccine doses have been administered in the United States. Overall, about 250.6 million people, or 75.5% of the total U.S. population, have received at least one dose of vaccine. About 212.3 million people, or 64.0% of the total U.S. population, have been fully vaccinated.* About 89.0 million additional or booster doses have been reported in people who have been fully vaccinated; however, 53.2% of the total booster-eligible population has not yet received a booster dose. As of February 3, 2022, the 7-day average number of administered vaccine doses reported (by date of CDC report) to CDC per day was 719,986, an 11.8% increase from the previous week.

CDC’s COVID Data Tracker Vaccination Demographic Trends tab shows vaccination trends by age group. As of February 3, 2022, 95.0% of people ages 65 years or older have received at least one dose of vaccine and 88.4% are fully vaccinated. For people ages 18 years or older, 87.1% have received at least one dose of vaccine and 74.2% are fully vaccinated. For people ages 12 years or older, 85.2% have received at least one dose of vaccine and 72.6% are fully vaccinated. For people ages 5 years or older, 80.2% have received at least one dose of vaccine and 68.0% are fully vaccinated.

541,410,847
Vaccine Doses Administered

250,593,665
People who received at least one dose

212,336,183
People who are fully vaccinated*

75.5%
Percentage of the U.S. population that has received at least one dose

64.0%
Percentage of the U.S. population that has been fully vaccinated*

+0.4
Percentage point increase from last week

+0.4
Percentage point increase from last week

*Represents the number of people who have received the second dose in a two-dose COVID-19 vaccine series (such as the Pfizer or Moderna vaccines) or one dose of the single-shot Johnson & Johnson’s Janssen vaccine.

Daily Change in the Total Number of Administered COVID-19 Vaccine Doses Reported to CDC by the Date of CDC Report, United States
red-line.jpg

7-Day moving average

resize iconView Larger
More Vaccination Data

Hospitalizations

New Hospital Admissions


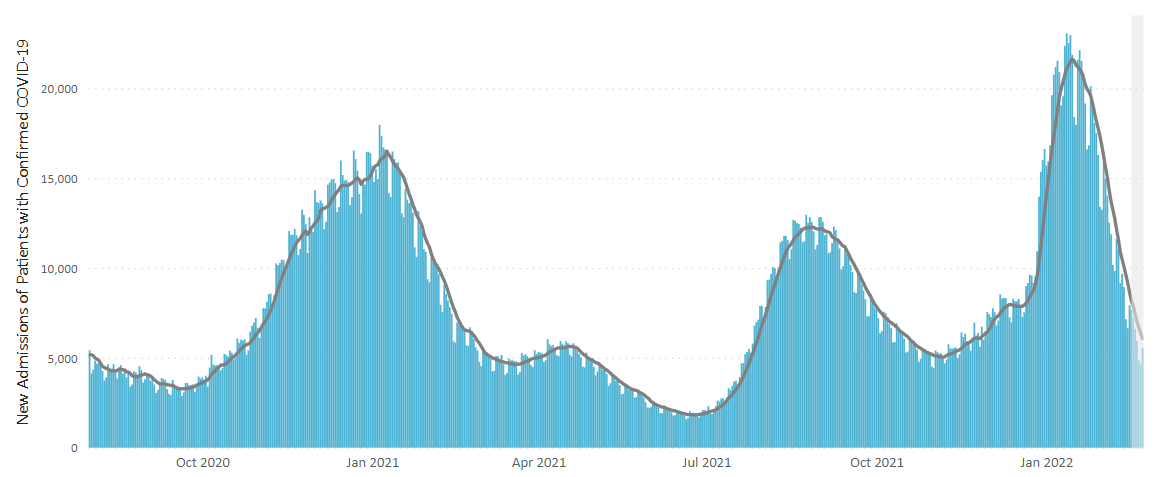
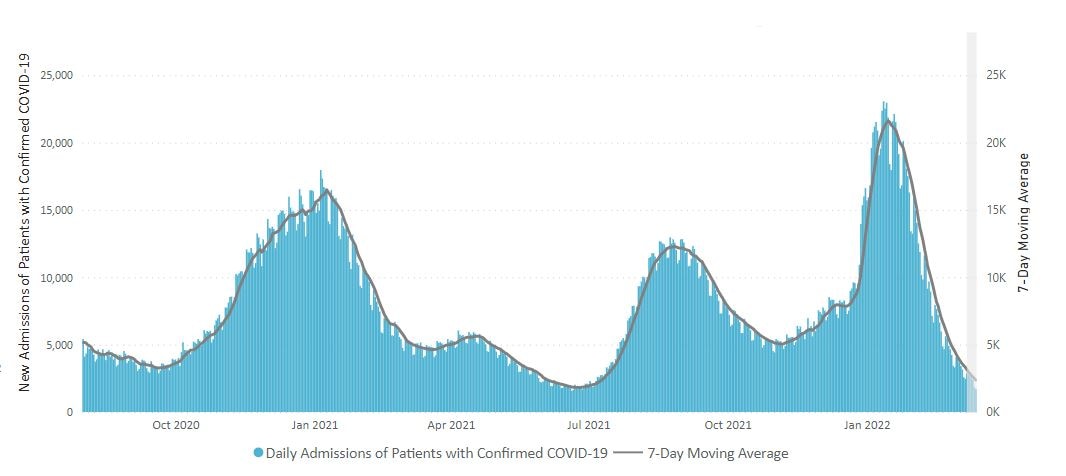
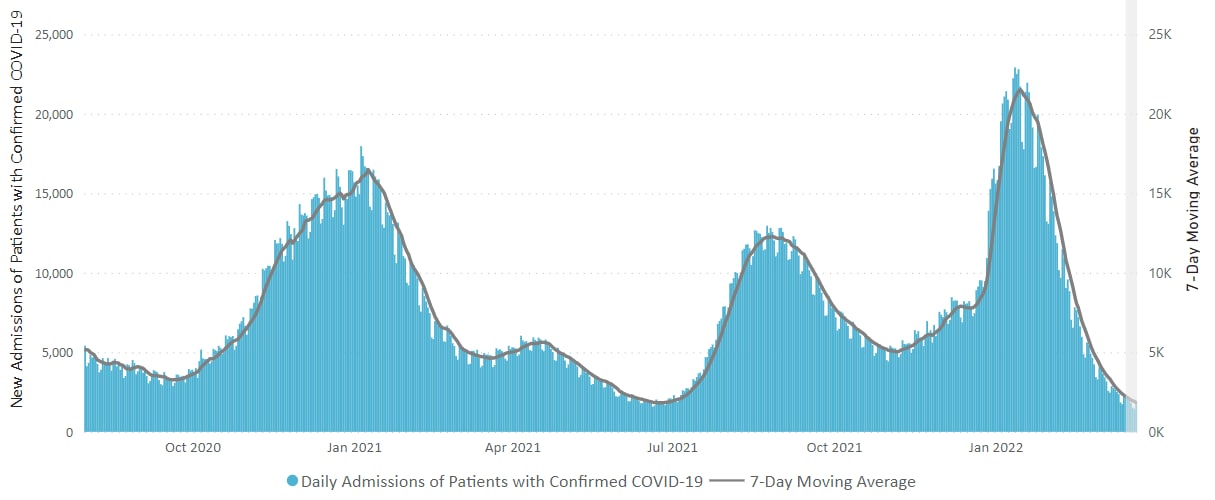
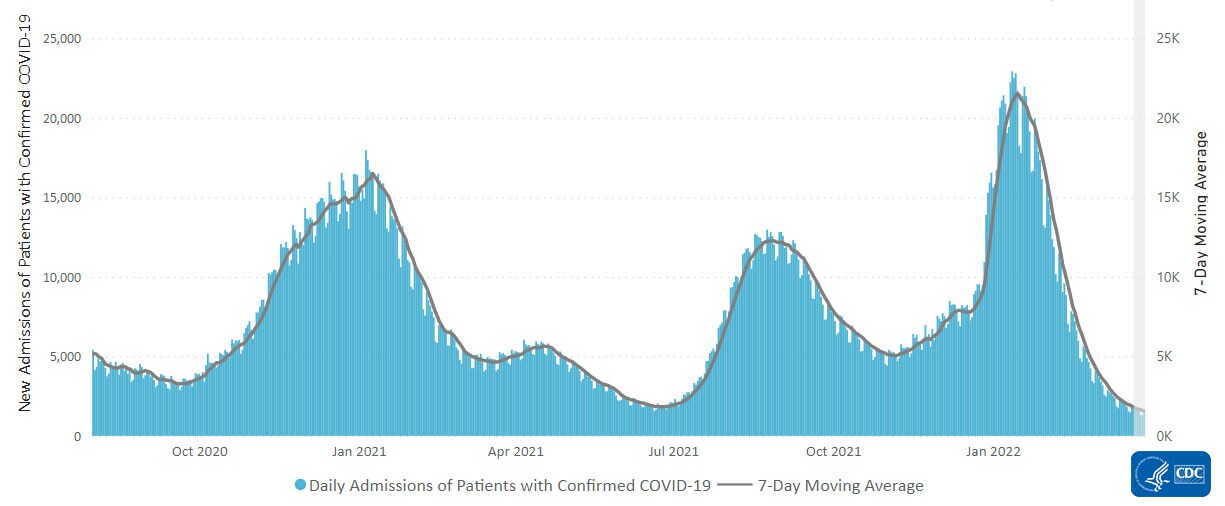
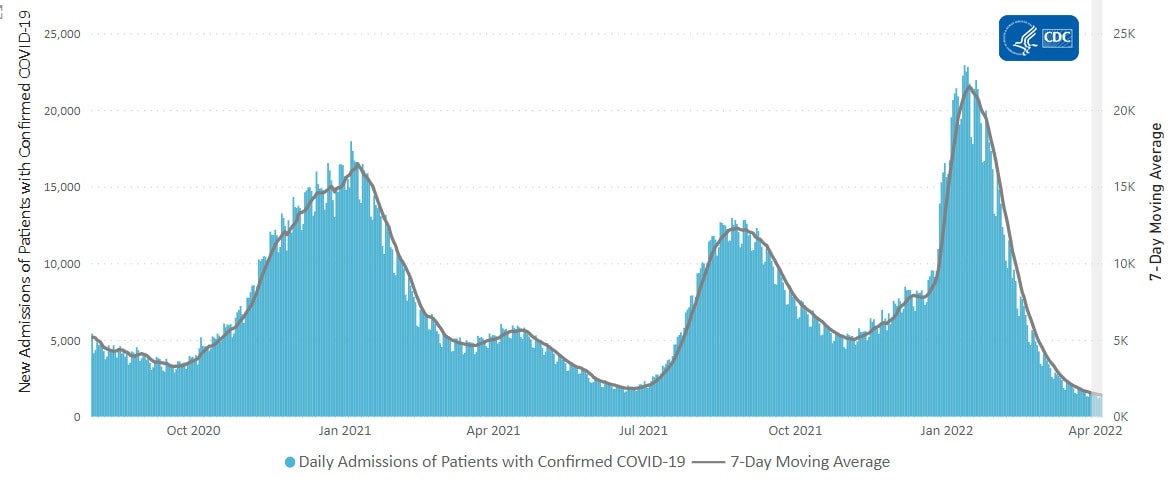
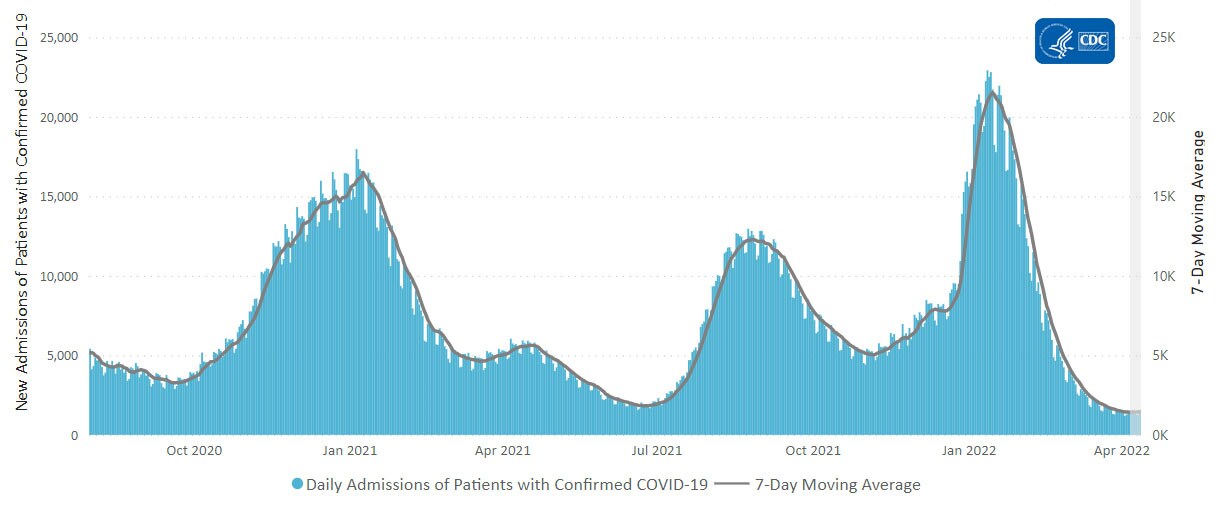
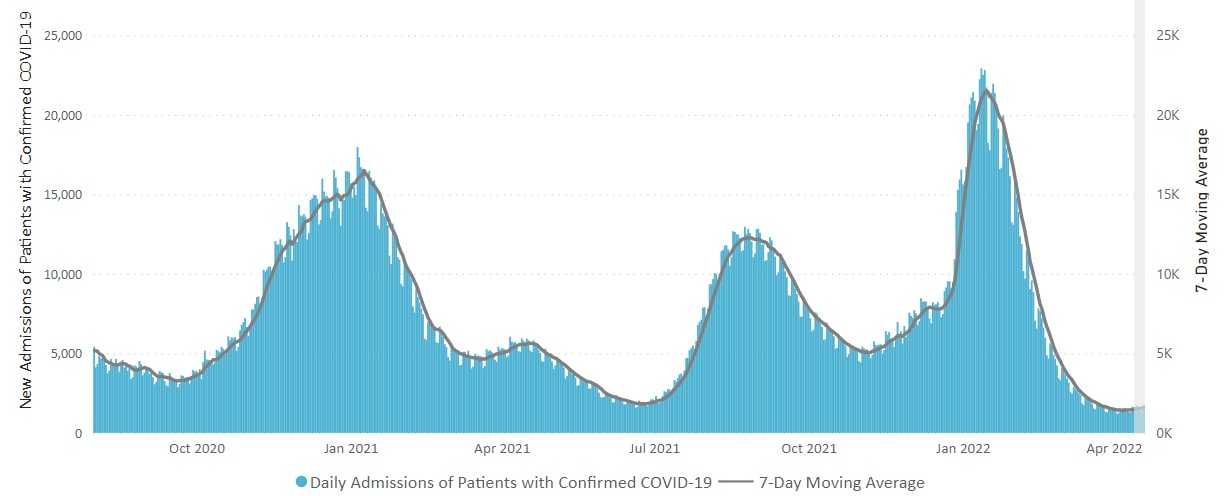
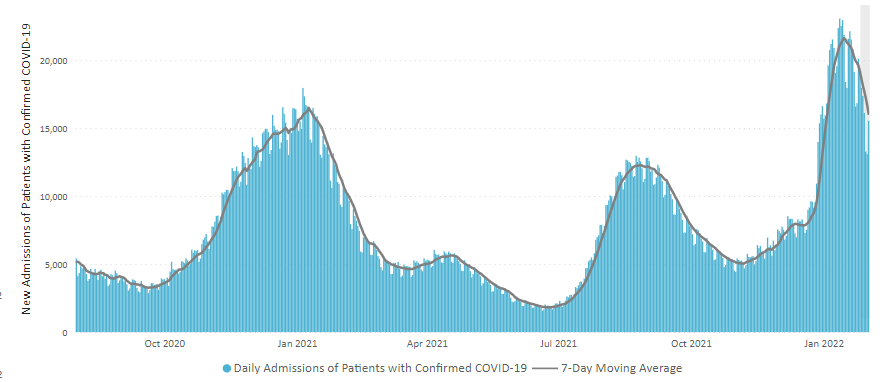
The current 7-day daily average for January 26–February 1, 2022, was 16,068. This is an 18.0% decrease from the prior 7-day average (19,593) from January 19–25, 2022.

4,317,927
Total New Admissions

16,068
Current 7-Day Average

19,593
Prior 7-Day Average

-18.0%
Change in 7-Day Average

The start of consistent reporting of hospital admissions data was August 1, 2020.

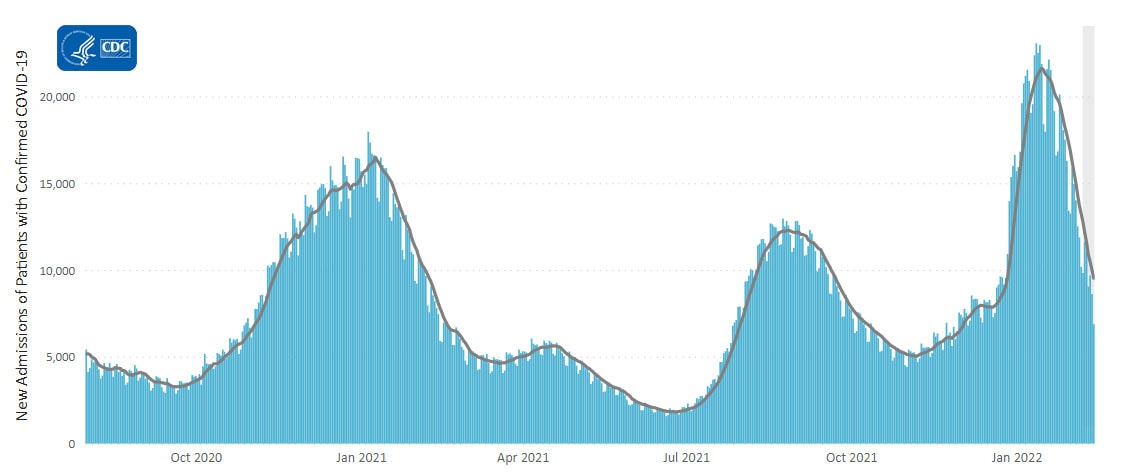
Daily Trends in Number of New COVID-19 Hospital Admissions in the United States
resize iconView Larger
New admissions are pulled from a 10 am EST snapshot of the HHS Unified Hospital Timeseries Dataset. Due to potential reporting delays, data from the most recent 7 days, as noted in the figure above with the grey bar, should be interpreted with caution. Small shifts in historic data may also occur due to changes in the Centers for Medicare and Medicaid Services (CMS) Provider of Services file, which is used to identify the cohort of included hospitals.

More Hospital Data

COVID-NET: Trends in Overall Weekly Hospitalization Rates


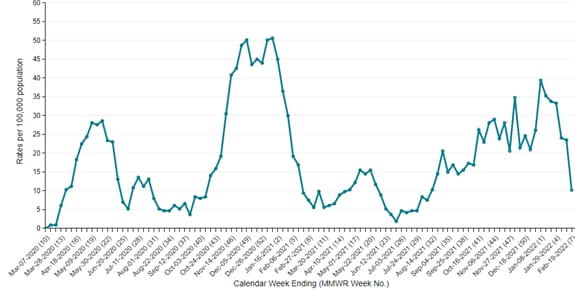
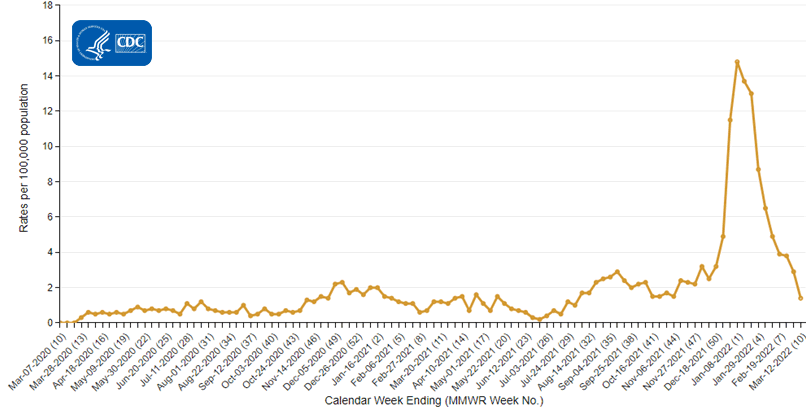
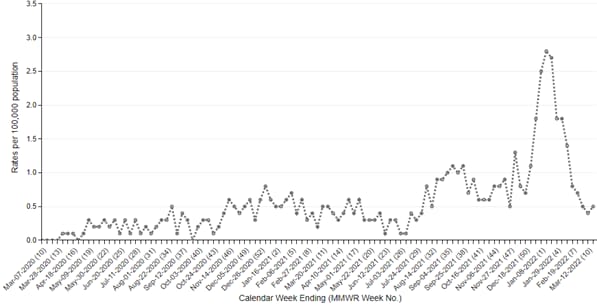
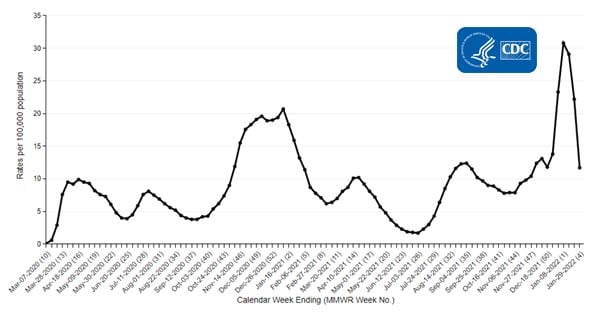
CDC’s Coronavirus Disease 2019-Associated Hospitalization Surveillance Network (COVID-NET) shows that the overall weekly rates of COVID-19-associated hospitalizations in January 2022 were the highest since the beginning of the pandemic. The previous overall peak weekly hospitalization rate for the pandemic was 20.7 per 100,000 population for the week ending January 9, 2021. For the week ending January 15, 2022, overall rates of COVID-19-associated hospitalizations were 29.1 per 100,000 population, which is 40% higher than the previous peak weekly rate.

Trends in Overall Weekly Hospitalization Rates

resize iconView Larger
The Coronavirus Disease 2019 (COVID-19)-Associate­­d Hospitalization Surveillance Network (COVID-NET) is an additional source for hospitalization data collected through a network of more than 250 acute-care hospitals in 14 states (representing ~10% of the U.S. population). Detailed data on patient demographics, including race/ethnicity, underlying medical conditions, medical interventions, and clinical outcomes, are collected with a standardized case reporting form.
More COVID-NET Data

Deaths


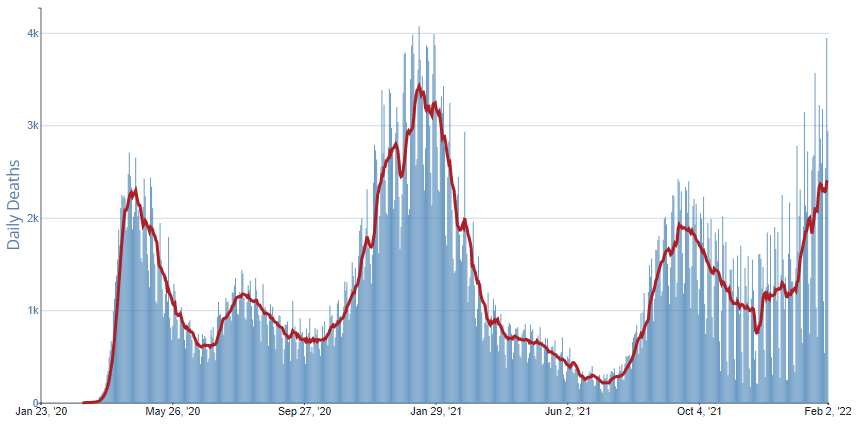
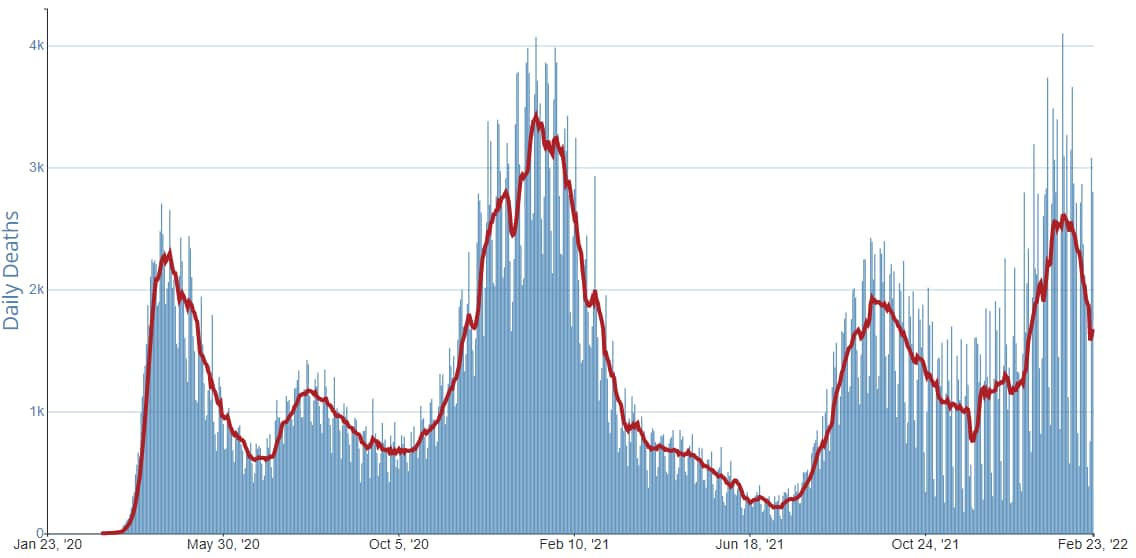
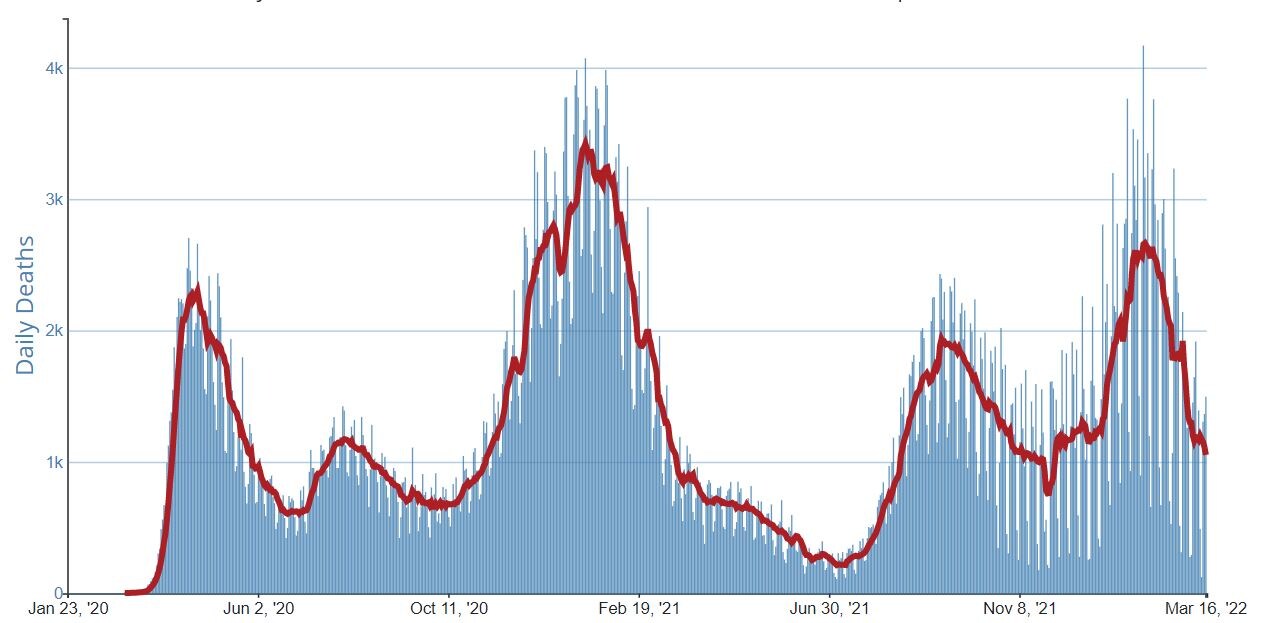
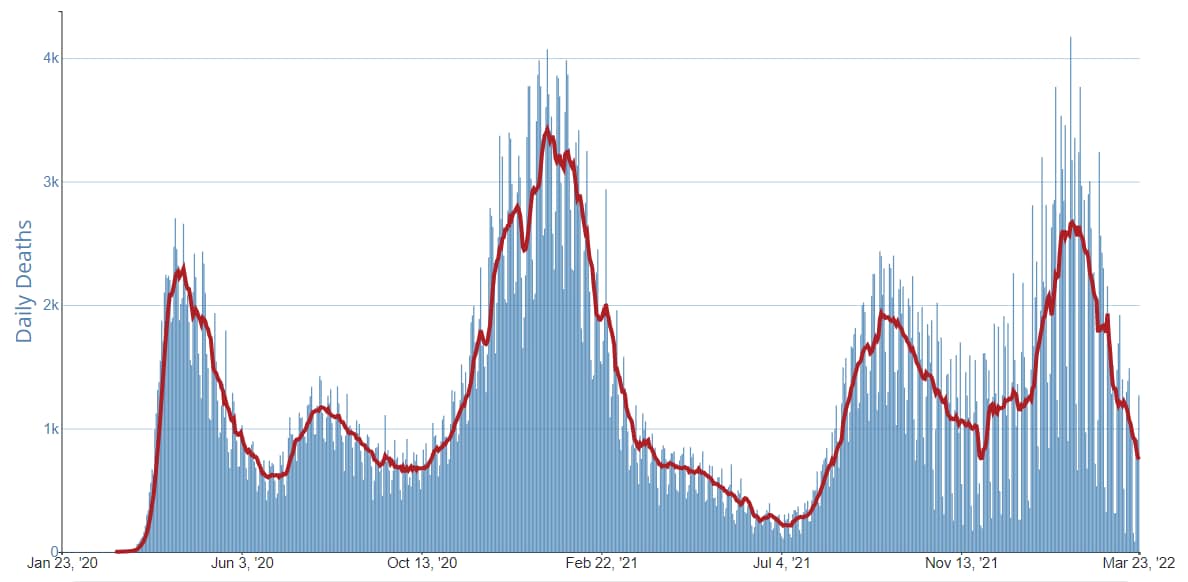
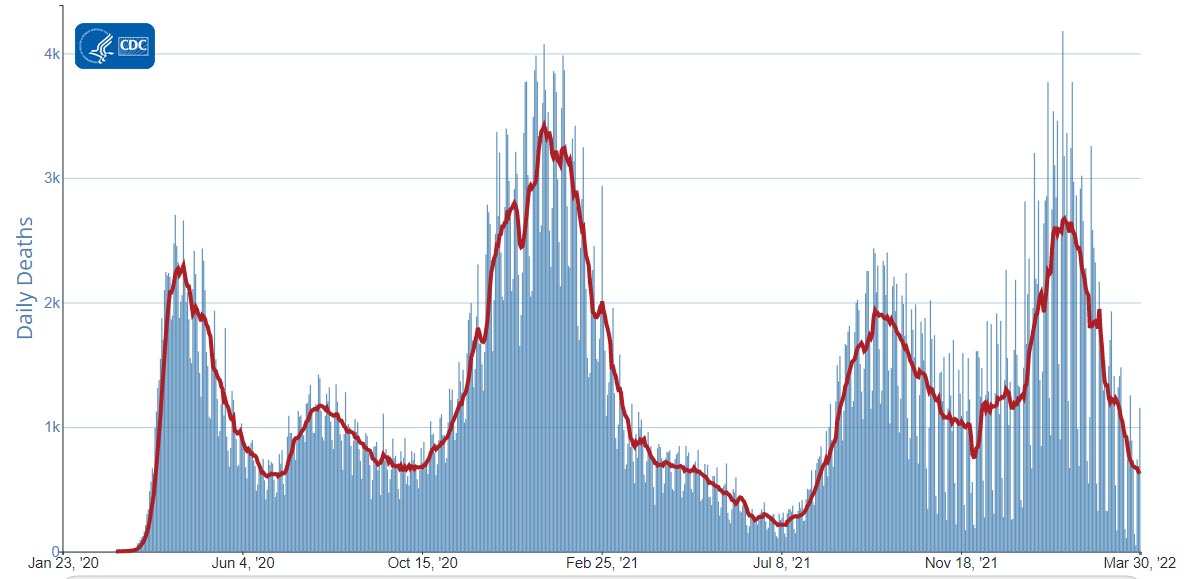
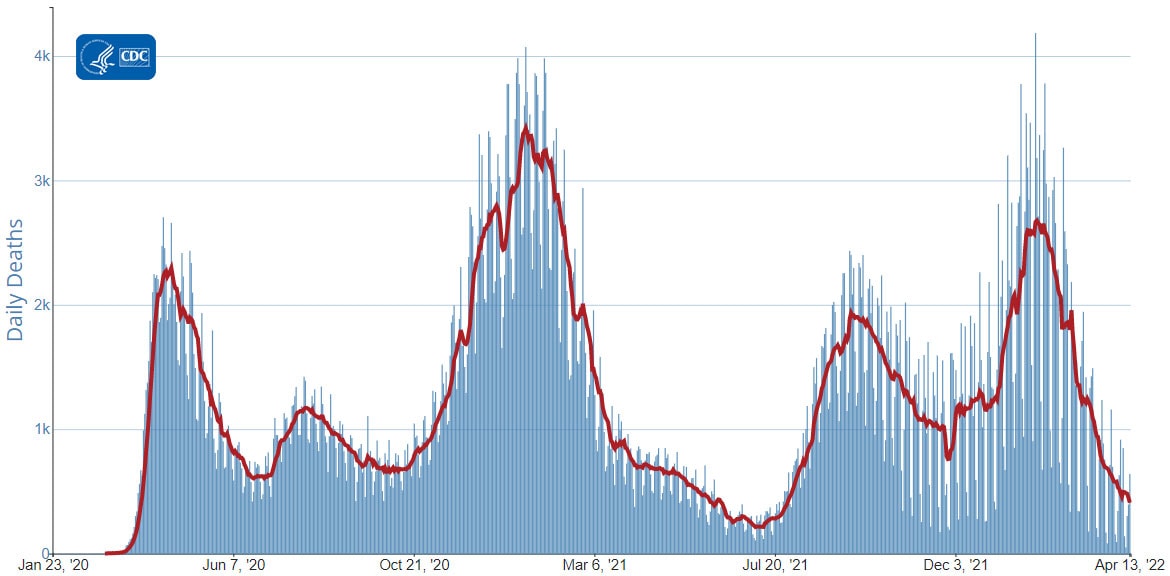
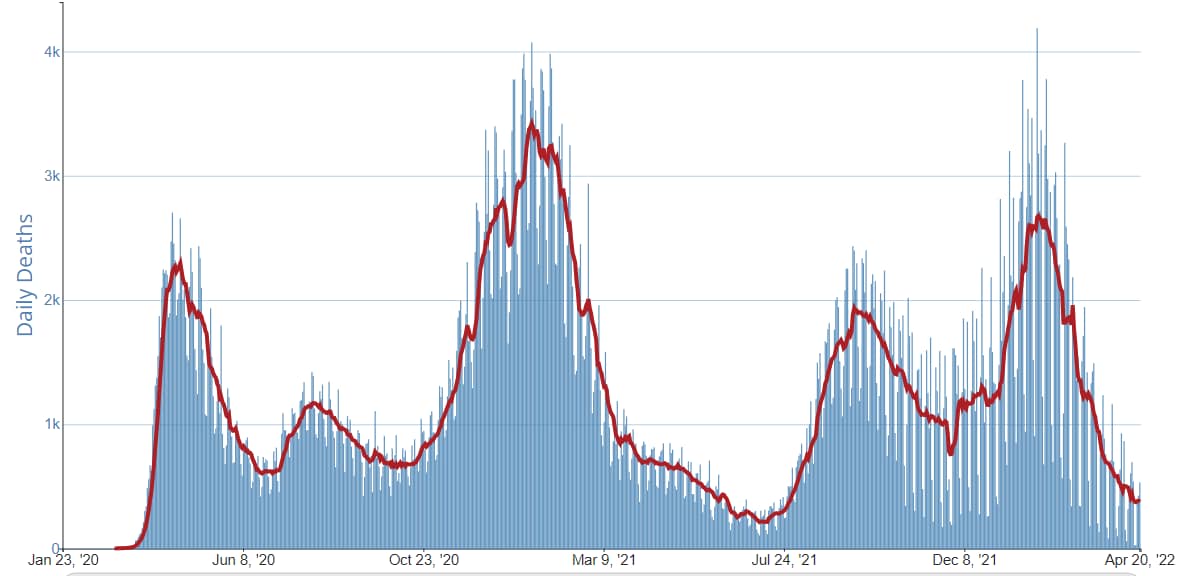
The current 7-day moving average of new deaths (2,404) has increased 1.6% compared with the previous 7-day moving average (2,366). As of February 2, 2022, a total of 892,442 COVID-19 deaths have been reported in the United States.

892,442
Total Deaths Reported

2,404
Current 7-Day Average*

2,366
Prior 7-Day Average

1.6%
Change in 7-Day Average Since Prior Week

*Historical deaths are excluded from the daily new deaths and 7-day average calculations until they are incorporated into the dataset by their applicable date. Of 20,520 historical deaths reported retroactively, 192 were reported in the current week; and 347 were reported in the prior week.

Daily Trends in Number of COVID-19 Deaths in the United States Reported to CDC
red-line.jpg

7-Day moving average

resize iconView Larger
More Death Data

Testing


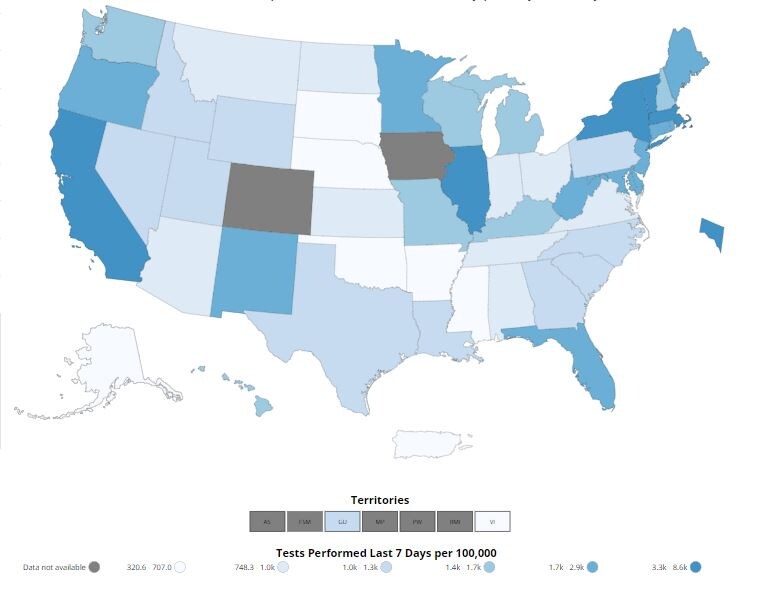
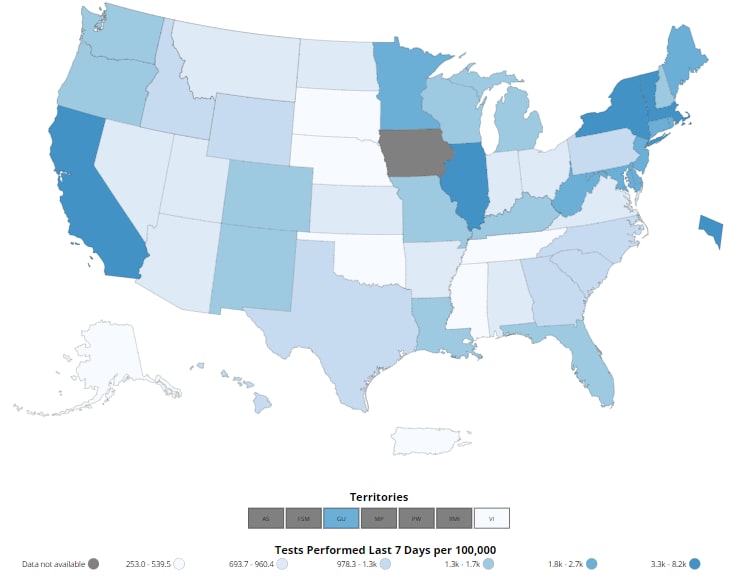
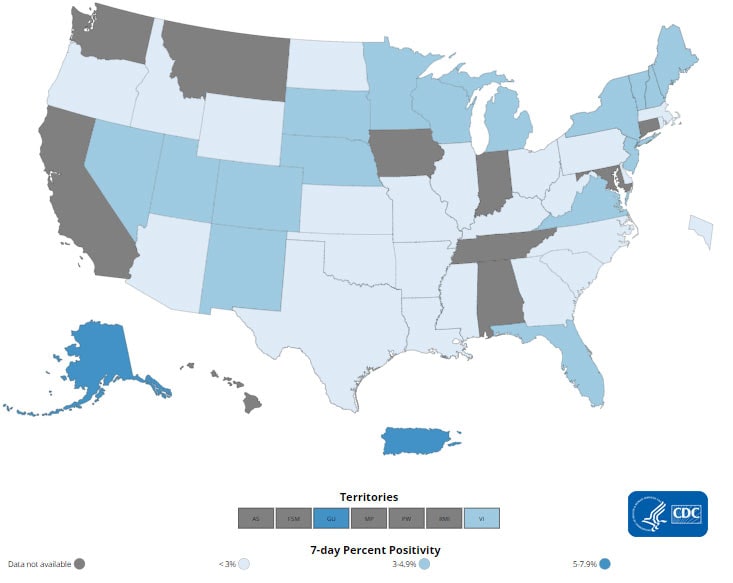
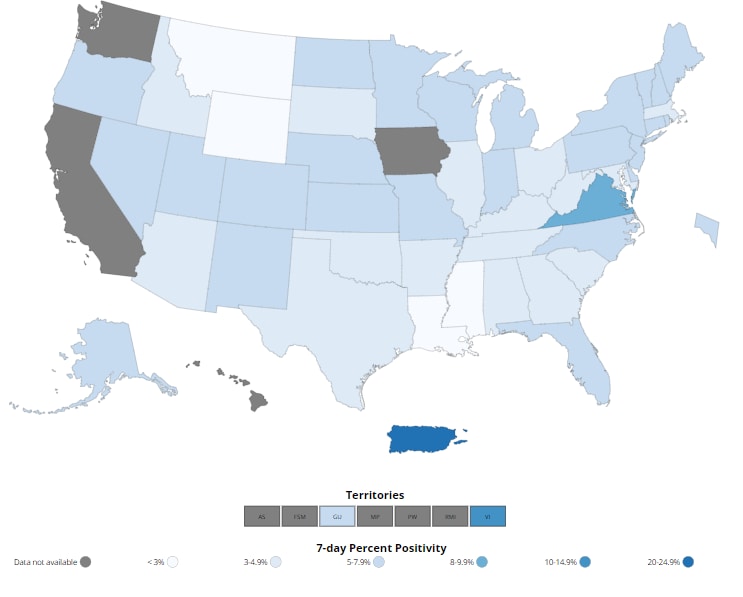
The percentage of COVID-19 NAATs (nucleic acid amplification tests)* that are positive (percent positivity) is decreasing in comparison to the previous week. The 7-day average of percent positivity from NAATs is now 18.7%. The 7-day average number of tests reported for January 21-27, 2022, was 1,720,394, down 22.5% from 2,221,284 for the prior 7 days.

785,540,430
Total Tests Reported

1,720,394
7-Day Average Tests Reported

18.7%
7-Day Average % Positivity

24.5%
Previous 7-Day Average % Positivity

-5.75
Percentage point change in 7-Day Average % Positivity since Prior Week

*Test for SARS-CoV-2, the virus that causes COVID-19

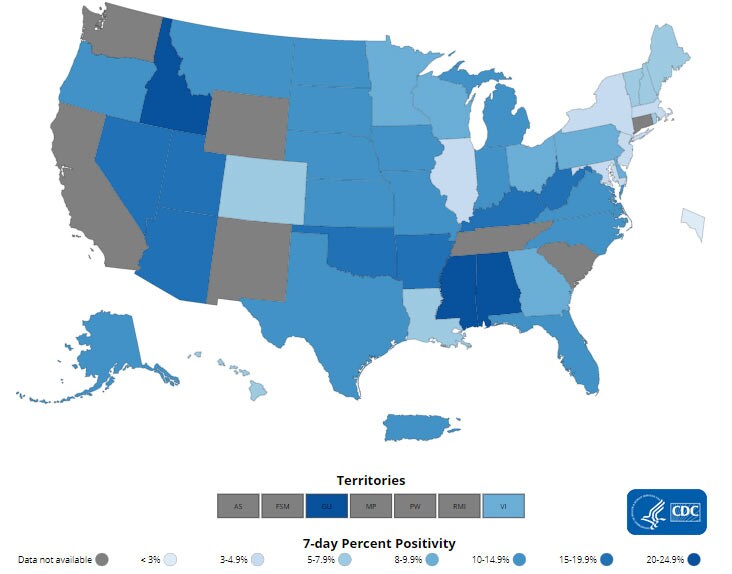
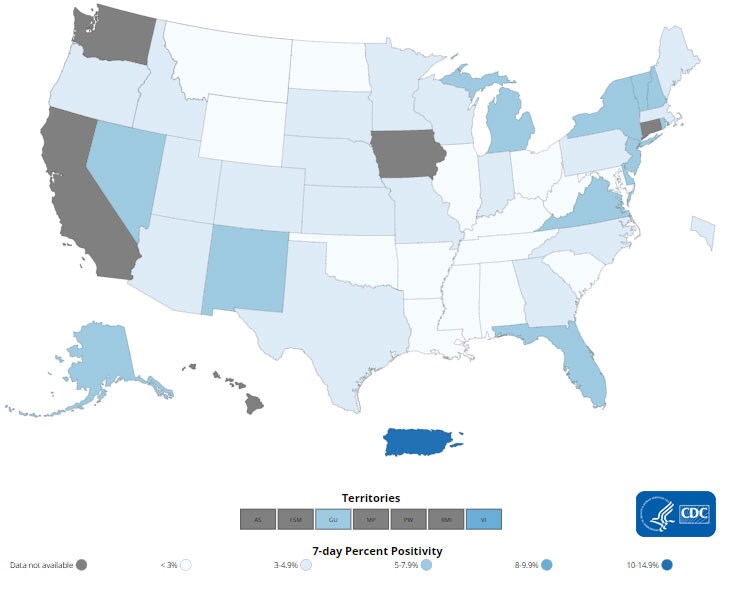
COVID-19 NAAT Laboratory Test 7-day Percent Positivity by State/Territory
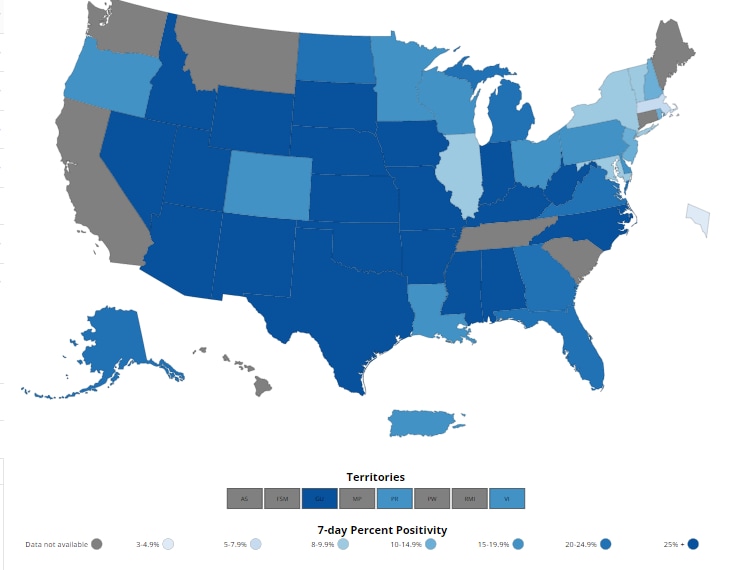
resize iconView Larger
More Testing Data
Top of PageA Closer Look


A Closer Look Section presents more detailed information for readers who want to learn more about current issues of interest.
Know More about Wastewater Surveillance
a-closer-look_02042022.jpg

resize iconView Larger
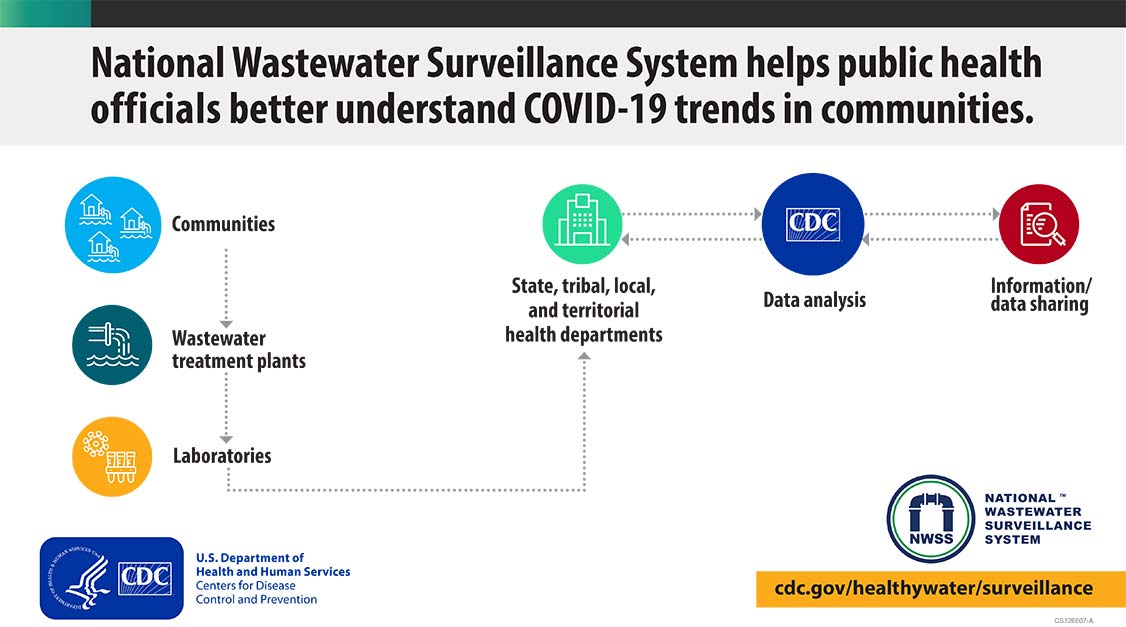
Estimates suggest as many as 80% of people with COVID-19 shed viral RNA in their feces, making wastewater and sewage systems an important avenue for enhancing ongoing COVID-19 surveillance efforts. In September 2020, CDC initiated the National Wastewater Surveillance System (NWSS) in response to the COVID-19 pandemic. While wastewater testing has been successfully used as a method for early detection of other diseases, such as polio, this is the first national surveillance system of its kind in the United States.

Wastewater, also referred to as sewage, includes water from household/building use, such as toilets, showers, and sinks, that can contain human fecal waste, as well as water from non-household sources, including rainwater or industrial use. Wastewater from a sewershed (community area served by a wastewater collection system) is collected for surveillance as it flows into a treatment plant. The samples collected are sent to environmental laboratories to test for SARS-CoV-2, the virus that causes COVID-19. The testing data are then submitted to participating health departments and provided to CDC through the NWSS DCIPHER portal. CDC analyzes the data in real time and reports results to the health department for use in their COVID-19 response.

Wastewater surveillance data capture the presence of both asymptomatic and symptomatic infections and are not affected by access to healthcare or availability of clinical testing. Data generated by NWSS can provide public health officials with a better understanding of COVID-19 trends in communities. Because increases of SARS-CoV-2 in wastewater generally occur 4–6 days before corresponding increases in clinical cases, wastewater surveillance can serve as an early-warning system for the emergence, or reemergence, of COVID-19 in a community. State and local health departments are using NWSS data to complement case- and symptom-based surveillance to inform public health decisions, such as where to allocate mobile testing and vaccination sites. Public health agencies have also used wastewater data to forecast changes in hospital utilization, providing additional time to mobilize resources in preparation for increasing cases.

While wastewater surveillance is a valuable tool, there are limitations that can impact the data. Interpretation of the results is limited in communities with transient populations, such as areas with high tourism. Additionally, the minimum number of individuals shedding SARS-CoV-2 into the system needed to detect a signal in wastewater is unknown, so wastewater surveillance cannot be used to determine whether a community is free from infections. For these reasons, wastewater surveillance is best used in conjunction with traditional case-based surveillance.

As of February 3, 2022, NWSS is tracking the presence of SARS-CoV-2 levels in wastewater at more than 400 testing sites across the country. NWSS participation is expected to grow as health departments and public health laboratories develop wastewater surveillance coordination, epidemiology, and laboratory capacity.

https://www.cdc.gov/coronavirus/2019-ncov/covid-data/covidview/index.html
 
covid-tracker-header-lrg.jpg

Print

Subscribe to the Weekly Review


Interpretive Summary for February 11, 2022
Boosters Work


resize iconView Larger
COVID-19 cases and hospitalizations in January 2022 were the highest since the beginning of the pandemic, fueled by the rapid spread of the Omicron variant. As of February 10, 2022, Omicron is still the predominant variant across the country.

A recent CDC study found that among people hospitalized with COVID-19, severe outcomes during the Omicron period appear lower than during previous high transmission periods. COVID-19 hospital stays were shorter, with fewer intensive care unit stays. Part of the reason for the lower severity is because of vaccination coverage and booster dose uptake among eligible people. COVID Data Tracker shows that as of February 10, 2022, about 213.4 million people, or 64.3% percent of the total U.S. population, have received a primary series of a COVID-19 vaccine.

However, only about half of those eligible to receive a booster dose have done so. Everyone ages 12 years and older should get a booster shot after they have completed their COVID-19 vaccine primary series. Omicron is extremely contagious, and even though overall severity is lower, the high volume of hospitalizations has strained the healthcare system. Being up to date with vaccination, in coordination with other key prevention strategies, is critical for preventing severe illness from COVID-19 and for reducing the likelihood of new variants from emerging. Find a vaccine provider and get your booster dose as soon as you can.


What's New

Reported Cases


As of February 9, 2022, the current 7-day moving average of daily new cases (215,418) decreased 42.8% compared with the previous 7-day moving average (376,855). A total of 77,179,255 COVID-19 cases have been reported in the United States as of February 9, 2022.

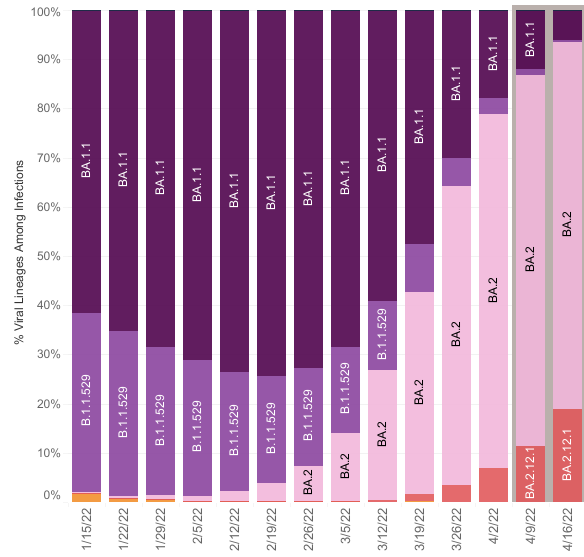
Currently two variants, Omicron and Delta, are classified as Variants of Concern (VOC) in the United States. CDC Nowcast projections* for the week ending February 5, 2022, estimate the national proportion of Omicron to be approximately 100%. There are four lineages designated as Omicron: B.1.1.529, BA.1, BA.2, and BA.3. COVID Data Tracker now shows the proportions of the B.1.1.529 lineage (includes BA.1 and BA.3) and the BA.2 lineage. The predominant Omicron lineage continues to be B.1.1.529 (BA.1 and BA.3), which is projected to be 96.4% (95% PI 93.2-98.2%); the BA.2 lineage is projected to be 3.6% (95% PI 1.8-6.8%). Delta is projected to decrease to 0.0% (95% PI 0.0-0.0%). Omicron is predicted to be nearly 100% in all HHS regions.

77,179,255
Total Cases Reported

215,418
Current 7-Day Average**

376,855
Prior 7-Day Average

-42.8%
Change in 7-Day Average since Prior Week

*The median time from specimen collection to sequence data reporting is about 3 weeks. As a result, weighted estimates for the most recent few weeks may be unstable or unavailable. CDC’s Nowcast is a data projection tool that helps fill this gap by generating timely estimates of variant proportions for variants that are circulating in the United States. View Nowcast estimates on CDC’s COVID Data Tracker website on the Variant Proportions page.

**Historical cases are excluded from daily new cases and 7-day average calculations until they are incorporated into the dataset for the applicable date. Of 423,466 historical cases reported retroactively, 24,081 were reported in the current week and 136 were reported in the prior week.

Daily Trends in COVID-19 Cases in the United States Reported to CDC
red-line.jpg

7-Day moving average

resize iconView Larger
More Case Data

Vaccinations


The U.S. COVID-19 Vaccination Program began December 14, 2020. As of February 10, 2022, 545.5 million vaccine doses have been administered in the United States. Overall, about 251.7 million people, or 75.8% of the total U.S. population, have received at least one dose of vaccine. About 213.4 million people, or 64.3% of the total U.S. population, have been fully vaccinated.* About 90.9 million additional or booster doses have been reported in people who have been fully vaccinated; however, 53.2% of the total booster-eligible population has not yet received a booster dose. As of February 10, 2022, the 7-day average number of administered vaccine doses reported (by date of CDC report) to CDC per day was 580,896, an 19.3% decrease from the previous week.

CDC’s COVID Data Tracker Vaccination Demographic Trends tab shows vaccination trends by age group. As of February 10, 2022, 95.0% of people ages 65 years or older have received at least one dose of vaccine and 88.5% are fully vaccinated. For people ages 18 years or older, 87.4% have received at least one dose of vaccine and 74.5% are fully vaccinated. For people ages 12 years or older, 85.5% have received at least one dose of vaccine and 72.9% are fully vaccinated. For people ages 5 years or older, 80.6% have received at least one dose of vaccine and 68.3% are fully vaccinated.

545,477,120
Vaccine Doses Administered

251,655,172
People who received at least one dose

213,430,434
People who are fully vaccinated*

75.8%
Percentage of the U.S. population that has received at least one dose

64.3%
Percentage of the U.S. population that has been fully vaccinated*

+0.3
Percentage point increase from last week

+0.3
Percentage point increase from last week

*Represents the number of people who have received the second dose in a two-dose COVID-19 vaccine series (such as the Pfizer or Moderna vaccines) or one dose of the single-shot Johnson & Johnson’s Janssen vaccine.

Daily Change in the Total Number of Administered COVID-19 Vaccine Doses Reported to CDC by the Date of CDC Report, United States
red-line.jpg

7-Day moving average

resize iconView Larger
More Vaccination Data

Hospitalizations

New Hospital Admissions


The current 7-day daily average for February 2–February 8, 2022, was 12,099. This is a 25.4% decrease from the prior 7-day average (16,212) from January 26–February 1, 2022.

4,403,630
Total New Admissions

12,099
Current 7-Day Average

16,212
Prior 7-Day Average

-25.4%
Change in 7-Day Average

The start of consistent reporting of hospital admissions data was August 1, 2020.

Daily Trends in Number of New COVID-19 Hospital Admissions in the United States

resize iconView Larger
New admissions are pulled from a 10 am EST snapshot of the HHS Unified Hospital Timeseries Dataset. Due to potential reporting delays, data from the most recent 7 days, as noted in the figure above with the grey bar, should be interpreted with caution. Small shifts in historic data may also occur due to changes in the Centers for Medicare and Medicaid Services (CMS) Provider of Services file, which is used to identify the cohort of included hospitals.

More Hospital Data

COVID-NET: Hospitalization Rates by Vaccination Booster Status in Adults


CDC’s Coronavirus Disease 2019-Associated Hospitalization Surveillance Network (COVID-NET) shows that rates of COVID-19-associated hospitalizations in December 2021 were noticeably higher in adults who were unvaccinated compared to adults who were fully vaccinated and received additional or booster doses of a COVID-19 vaccine. Among adults ages 50–64 years, the COVID-19-associated hospitalization rate in December among adults who were unvaccinated was 45 times higher than among those who were fully vaccinated and received an additional or booster dose. Among adults ages 65 years and older, compared to persons who were fully vaccinated and received an additional or booster dose, rates of COVID-19-associated hospitalizations were 51 times higher among adults who were unvaccinated.

Hospitalization Rates by Vaccination Booster Status in Adults Aged ≥65 Years


resize iconView Larger
The Coronavirus Disease 2019 (COVID-19)-Associate­­d Hospitalization Surveillance Network (COVID-NET) is an additional source for hospitalization data collected through a network of more than 250 acute-care hospitals in 14 states (representing ~10% of the U.S. population). Detailed data on patient demographics, including race/ethnicity, underlying medical conditions, medical interventions, and clinical outcomes, are collected with a standardized case reporting form.
More COVID-NET Data

Deaths


The current 7-day moving average of new deaths (2,313) has decreased 5.9% compared with the previous 7-day moving average (2,459). As of February 9, 2022, a total of 910,373 COVID-19 deaths have been reported in the United States.

910,373
Total Deaths Reported

2,313
Current 7-Day Average*

2,459
Prior 7-Day Average

-5.9%
Change in 7-Day Average Since Prior Week

*Historical deaths are excluded from the daily new deaths and 7-day average calculations until they are incorporated into the dataset by their applicable date. Of 20,520 historical deaths reported retroactively, none were reported in the current week; and 192 were reported in the prior week.

Daily Trends in Number of COVID-19 Deaths in the United States Reported to CDC
red-line.jpg

7-Day moving average

resize iconView Larger
More Death Data

Testing


The percentage of COVID-19 NAATs (nucleic acid amplification tests)* that are positive (percent positivity) is decreasing in comparison to the previous week. The 7-day average of percent positivity from NAATs is now 12.7%. The 7-day average number of tests reported for January 28 – February 3, 2022, was 1,392,546, down 21.0% from 1,762,138 for the prior 7 days.

795,303,990
Total Tests Reported

1,392,546
7-Day Average Tests Reported

12.7%
7-Day Average % Positivity

19.1%
Previous 7-Day Average % Positivity

-6.39
Percentage point change in 7-Day Average % Positivity since Prior Week

*Test for SARS-CoV-2, the virus that causes COVID-19

COVID-19 NAAT Laboratory Test 7-day Percent Positivity by State/Territory


Content source: National Center for Immunization and Respiratory Diseases

https://www.cdc.gov/coronavirus/2019-ncov/covid-data/covidview/index.html
 
covid-tracker-header-lrg.jpg

Print

Subscribe to the Weekly Review


Interpretive Summary for February 18, 2022
Take Care

people-masks.jpg

The past two years have been difficult for everyone, especially children. Beyond causing sickness, the pandemic has triggered uncertainty and loneliness, disrupted social and physical activities, and upended daily routines. Since the start of the pandemic, there have been more than 78 million COVID-19 cases, and more than 926,000 deaths reported in the United States. More than 140,000 children in the United States have lost parents and caregivers to COVID-19.

The findings of two new CDC studies suggest that the ongoing children’s mental health crisisexternal icon has gotten worse during the pandemic. Both studies examined pediatric emergency department (ED) visit data from 2019 through January 2022. One report indicates that, while pediatric ED visits decreased overall, the weekly number and proportion of ED visits increased for certain types of injuries, some chronic diseases, and behavioral health concerns. The other report shows that adolescent females may have experienced the largest overall increase in distress. During these years, the proportion of ED visits for eating disorders doubled and tic disorders more than tripled in this group. Adolescent females also visited the ED more often, for an increasingly wider variety of mental health conditions. Conditions such as these can be triggered by pandemic-related risk factors and made worse by pandemic-related reduced access to mental health care.

While prolonged time at home could increase familial support for some youth, it may have amplified challenges and stressors among other youth. These factors, as well as other pandemic-related stressors, could have created or added risk for mental health conditions and other behavioral health challenges. CDC supports efforts to promote the emotional well-being of children and adolescents by providing tools and resources to help increase access to children’s mental and behavioral health services, and aid families and communities in creating safe, stable, and nurturing environments that help children thrive.

CDC provides resources for adults, too—see Coping with Stress and Care for Yourself. Learning to cope with stress in a healthy way will help you, the people you care about, and those around you become more resilient.


What's New

Reported Cases


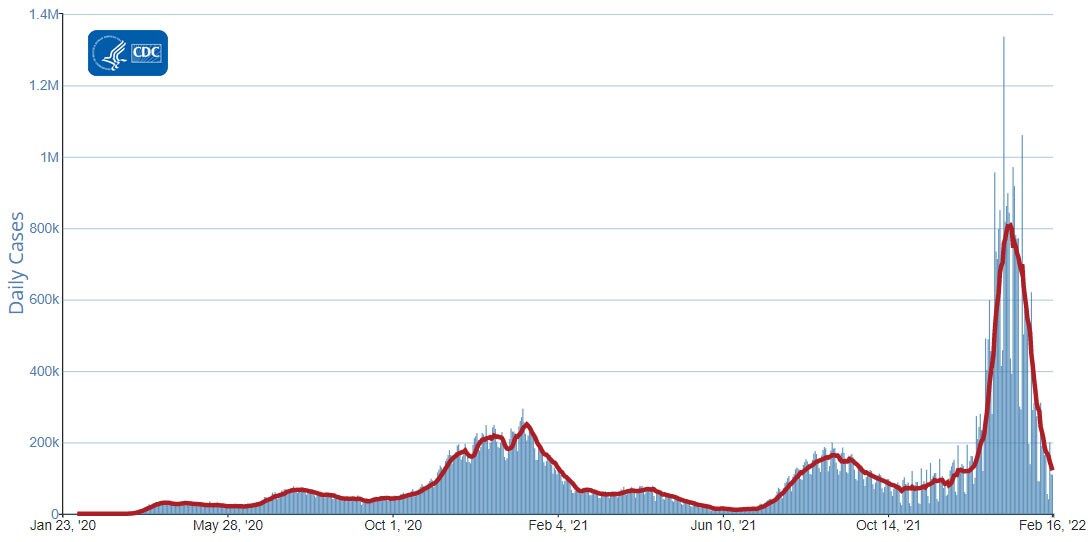
As of February 16, 2022, the current 7-day moving average of daily new cases (121,665) decreased 43.0% compared with the previous 7-day moving average (213,625). A total of 78,060,327 COVID-19 cases have been reported in the United States as of February 16, 2022.

Currently two variants, Omicron and Delta, are classified as Variants of Concern (VOC) in the United States. CDC Nowcast projections* for the week ending February 12, 2022, estimate the combined national proportion of lineages designated as Omicron to be 100%. There are five lineages designated as Omicron: B.1.1.529, BA.1, BA.1.1, BA.2, and BA.3. The COVID Data Tracker now shows the proportions of the B.1.1.529 lineage (includes BA.1 and BA.3), BA.1.1** lineage, and the BA.2 lineage. The predominant Omicron lineage in the United States is BA.1.1, which is descendent of the BA.1 lineage and is characterized by an additional substitution (R346K) in the spike protein. The national proportion of BA.1.1 is projected to be 73.2% (95% PI 69.0-77.1%). B.1.1.529 (BA.1 and BA.3) is projected to be 22.9% (95% PI 19.1-27.1%) and BA.2 is projected to be 3.9% (95% PI 2.8-5.3%). Delta is projected to continue to be 0.0% (95% PI 0.0-0.0%). Omicron is predicted to be 100% in all HHS regions.

78,060,327
Total Cases Reported

121,665
Current 7-Day Average***

213,625
Prior 7-Day Average

-43.0%
Change in 7-Day Average since Prior Week

*The median time from specimen collection to sequence data reporting is about 3 weeks. As a result, weighted estimates for the most recent few weeks may be unstable or unavailable. CDC’s Nowcast is a data projection tool that helps fill this gap by generating timely estimates of variant proportions for variants that are circulating in the United States. View Nowcast estimates on CDC’s COVID Data Tracker website on the Variant Proportions page.

**For national data, the proportion of BA.1.1 is shown separately. For regional data, the proportion of BA.1.1 is also aggregated with B.1.1.529.

***Historical cases are excluded from daily new cases and 7-day average calculations until they are incorporated into the dataset for the applicable date. Of 423,464 historical cases reported retroactively, 137 were reported in the current week and 24,081 were reported in the prior week.

Daily Trends in COVID-19 Cases in the United States Reported to CDC
red-line.jpg

7-Day moving average

resize iconView Larger
More Case Data

Vaccinations


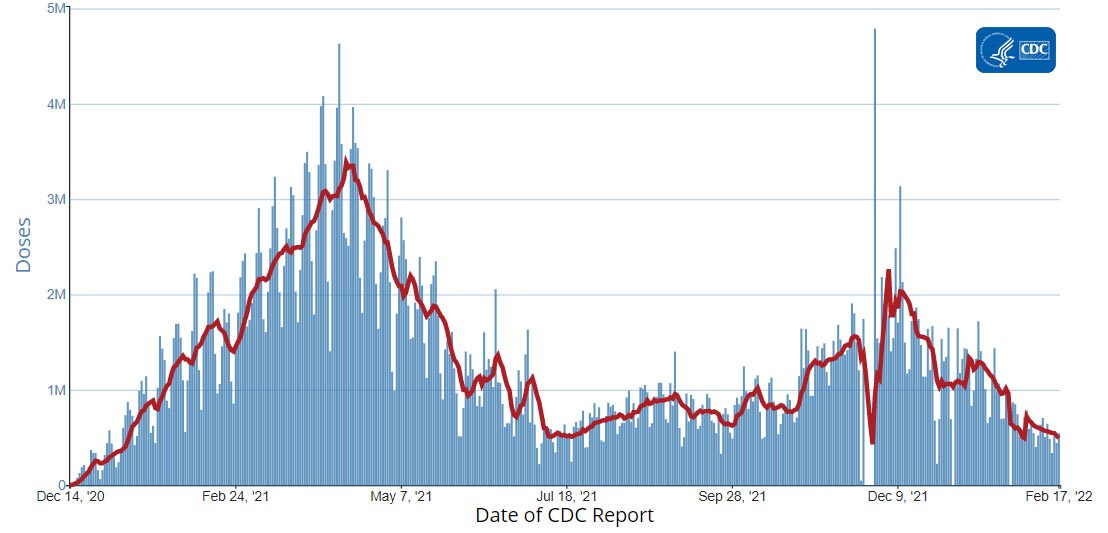
The U.S. COVID-19 Vaccination Program began December 14, 2020. As of February 16, 2022, 548.4 million vaccine doses have been administered in the United States. Overall, about 252.4 million people, or 76.0% of the total U.S. population, have received at least one dose of vaccine. About 214.2 million people, or 64.5% of the total U.S. population, have been fully vaccinated.* About 92.2 million additional or booster doses have been reported in people who have been fully vaccinated; however, 50.0% of the total booster-eligible population has not yet received a booster dose. As of February 16, 2022, the 7-day average number of administered vaccine doses reported (by date of CDC report) to CDC per day was 516,988, a 12.6% decrease from the previous week.

CDC’s COVID Data Tracker Vaccination Demographic Trends tab shows vaccination trends by age group and by race/ethnicity. As of February 16, 2022, 95.0% of people ages 65 years or older have received at least one dose of vaccine and 88.6% are fully vaccinated. For people ages 5 years or older, 80.8% have received at least one dose of vaccine and 68.6% are fully vaccinated.

As of February 16, 2022, of all race/ethnicity groups, the Asian Non-Hispanic population has the highest proportion that is fully vaccinated (59.6%) and the Black Non-Hispanic population has the lowest proportion that is fully vaccinated (40.3%). Of the fully vaccinated population, the Asian Non-Hispanic population has the highest proportion of additional/booster doses (64.5%) while the Hispanic/Latino population has the lowest proportion (37.6%).

548,391,614
Vaccine Doses Administered

252,400,057
People who received at least one dose

214,218,580
People who are fully vaccinated*

76.0%
Percentage of the U.S. population that has received at least one dose

64.5%
Percentage of the U.S. population that has been fully vaccinated*

+0.2
Percentage point increase from last week

+0.2
Percentage point increase from last week

*Represents the number of people who have received the second dose in a two-dose COVID-19 vaccine series (such as the Pfizer or Moderna vaccines) or one dose of the single-shot Johnson & Johnson’s Janssen vaccine.

Daily Change in the Total Number of Administered COVID-19 Vaccine Doses Reported to CDC by the Date of CDC Report, United States
red-line.jpg

7-Day moving average

resize iconView Larger
More Vaccination Data

Hospitalizations

New Hospital Admissions


The current 7-day daily average for February 9–February 15, 2022, was 8,642. This is a 28.8% decrease from the prior 7-day average (12,142) from February 2–February 8, 2022.

4,464,439
Total New Admissions

8,642
Current 7-Day Average

12,142
Prior 7-Day Average

-28.8%
Change in 7-Day Average

The start of consistent reporting of hospital admissions data was August 1, 2020.

Daily Trends in Number of New COVID-19 Hospital Admissions in the United States

resize iconView Larger
New admissions are pulled from a 10 am EST snapshot of the HHS Unified Hospital Timeseries Dataset. Due to potential reporting delays, data from the most recent 7 days, as noted in the figure above with the grey bar, should be interpreted with caution. Small shifts in historic data may also occur due to changes in the Centers for Medicare and Medicaid Services (CMS) Provider of Services file, which is used to identify the cohort of included hospitals.

More Hospital Data

COVID-NET: Trends in Hospitalization Rates among Children and Adolescents


CDC’s Coronavirus Disease 2019-Associated Hospitalization Surveillance Network (COVID-NET) shows that while the weekly rates of COVID-19-associated hospitalizations among children and adolescents are decreasing, they remain elevated. Weekly rates among children and adolescents ages 17 years and younger were 4.1 per 100,000 population for the week ending January 29, 2022. Rates of weekly COVID-19-associated hospitalizations among children and adolescents recently peaked at 6.9 per 100,000 population during the week ending January 8, 2022. This most recent peak was four times as high as the previous peak weekly rate of 1.8 per 100,000 observed for the week ending September 11, 2021. Among children and adolescents, rates are highest among children ages 4 years and younger who are not eligible for vaccination.

Additional information on COVID-19-associated hospitalizations among children and adolescents can be found in a new report using COVID-NET data here.

Trends in Hospitalization Rates among Children and Adolescents


resize iconView Larger
The Coronavirus Disease 2019 (COVID-19)-Associate­­d Hospitalization Surveillance Network (COVID-NET) is an additional source for hospitalization data collected through a network of more than 250 acute-care hospitals in 14 states (representing ~10% of the U.S. population). Detailed data on patient demographics, including race/ethnicity, underlying medical conditions, medical interventions, and clinical outcomes, are collected with a standardized case reporting form.
More COVID-NET Data

Deaths


The current 7-day moving average of new deaths (2,021) has decreased 14.5% compared with the previous 7-day moving average (2,363). As of February 16, 2022, a total of 926,497 COVID-19 deaths have been reported in the United States.

926,497
Total Deaths Reported

2,021
Current 7-Day Average*

2,363
Prior 7-Day Average

-14.5%
Change in 7-Day Average Since Prior Week

*Historical deaths are excluded from the daily new deaths and 7-day average calculations until they are incorporated into the dataset by their applicable date. Of 20,882 historical deaths reported retroactively, 362 were reported in the current week; and none were reported in the prior week.

Daily Trends in Number of COVID-19 Deaths in the United States Reported to CDC
red-line.jpg

7-Day moving average

resize iconView Larger
More Death Data

Testing


The percentage of COVID-19 NAATs (nucleic acid amplification tests)* that are positive (percent positivity) is decreasing in comparison to the previous week. The 7-day average of percent positivity from NAATs is now 8.4%. The 7-day average number of tests reported for February 4-10, 2022, was 1,234,960, down 14.8% from 1,449,539 for the prior 7 days.

804,440,450
Total Tests Reported

1,234,960
7-Day Average Tests Reported

8.4%
7-Day Average % Positivity

12.9%
Previous 7-Day Average % Positivity

-4.52
Percentage point change in 7-Day Average % Positivity since Prior Week

*Test for SARS-CoV-2, the virus that causes COVID-19

COVID-19 NAAT Laboratory Test 7-day Percent Positivity by State/Territory

resize iconView Larger
More Testing Data
Top of Page
Content source: National Center for Immunization and Respiratory Diseases


https://www.cdc.gov/coronavirus/2019-ncov/covid-data/covidview/index.html
 
Your COVID-19 Community Level


Print
covid-tracker-header-lrg.jpg

Subscribe to the Weekly Review


Interpretive Summary for February 25, 2022
Intro_02252022.png
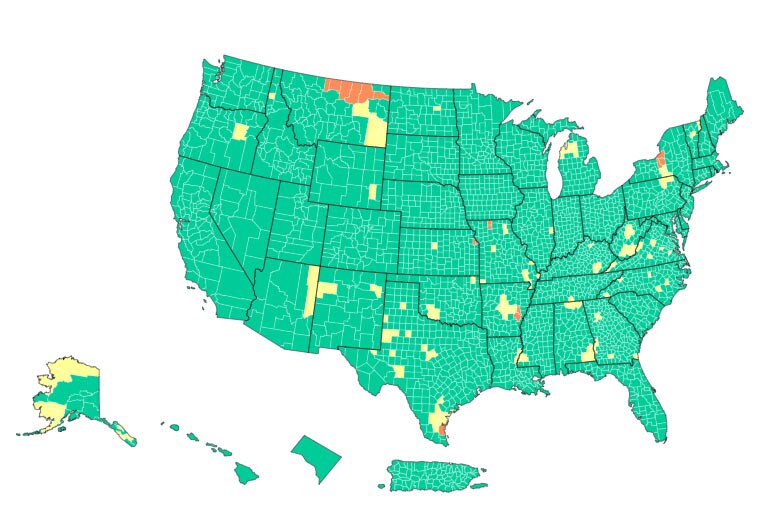
Your COVID-19 Community Level


CDC is updating the way it monitors COVID-19’s impact on our communities. Widespread availability of vaccines and testing, advances in treatments, and increasing levels of immunity in the population through vaccination or previous infection have moved the COVID-19 pandemic to a new phase. While we can’t prevent all cases of COVID-19, we can continue to limit the spread and protect those who are most at risk of severe illness.

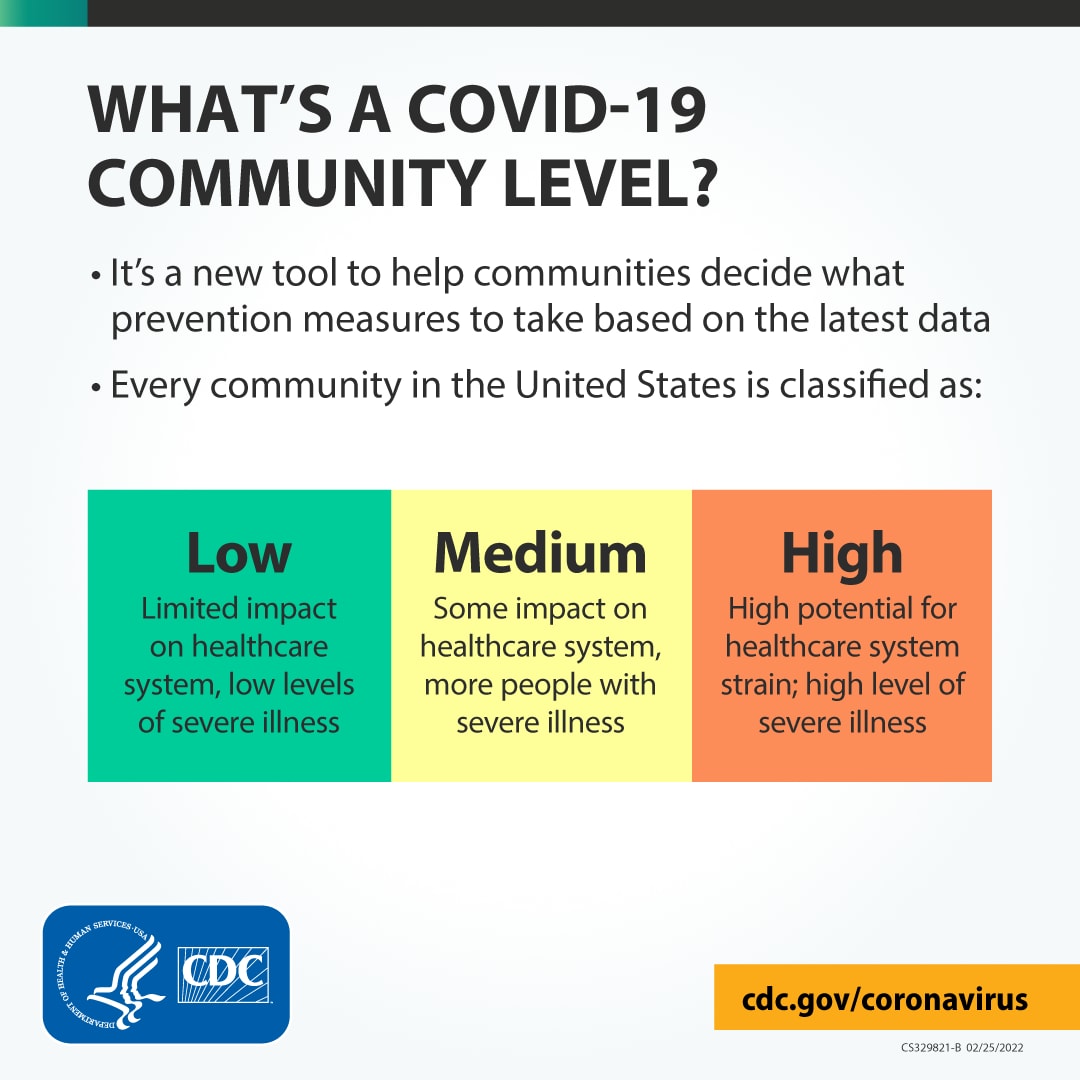
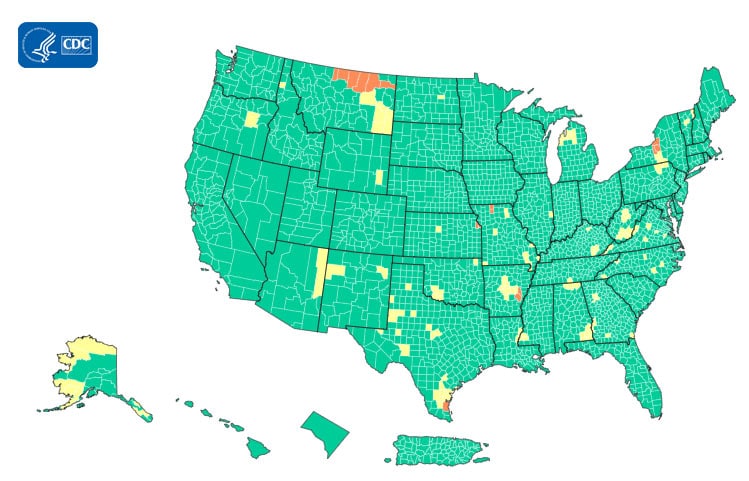
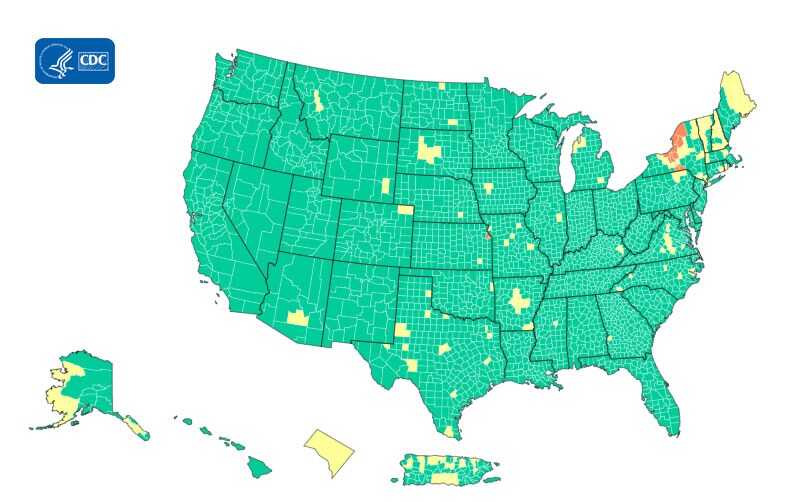
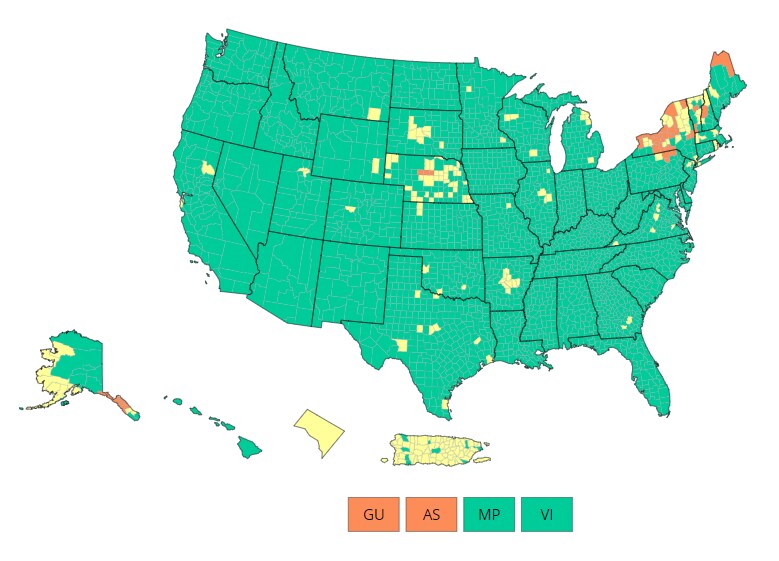
Given this new phase of the pandemic, CDC is launching a new tool to monitor COVID-19 Community Levels. Each county’s COVID-19 Community Level is ranked as low, medium, or high (find your county’s level). The COVID-19 Community Level map where you can find your county’s level will be updated regularly with new data. Your community’s level is determined by a combination of:
  • How many people with COVID-19 have been admitted into local hospitals in the last week
  • How many local hospital beds are filled with COVID-19 patients
  • How many new COVID-19 cases the county has had in the last week
CDC recommends certain prevention measures—such as wearing masks indoors—when COVID-19 Community Levels are high enough to strain the healthcare system and when needed to protect those at increased risk of severe illness. This allows people to take a break from masks and other measures when risk is low and reach for them again if things are getting worse. The community level metrics, which focus on the number of severe cases that require hospital care and use healthcare resources, and thus are a measure of more serious disease, provide a better picture of COVID-19’s impact on the health of individual people and communities. The COVID-19 Community Level metrics will help people and public health authorities decide which prevention measures to take.

Get vaccinated if you’re eligible (everyone 5 and older is eligible), wear a mask indoors in areas where the COVID-19 Community Level is high, increase ventilation in indoor spaces, and stay home when sick. If you aren’t up to date on your vaccinations, find a vaccine.


What's New

Reported Cases


As of February 23, 2022, the current 7-day moving average of daily new cases (75,208) decreased 37.7% compared with the previous 7-day moving average (120,761). A total of 78,595,529 COVID-19 cases have been reported in the United States as of February 23, 2022.

Currently two variants, Omicron and Delta, are classified as Variants of Concern (VOC) in the United States. CDC Nowcast projections* for the week ending February 19, 2022, estimate the combined national proportion of lineages designated as Omicron to be 100%. There are five lineages designated as Omicron: B.1.1.529, BA.1, BA.1.1, BA.2, and BA.3. COVID Data Tracker now shows the proportions of the B.1.1.529 lineage (includes BA.1 and BA.3), BA.1.1** lineage, and the BA.2 lineage. The predominant Omicron lineage in the United States is BA.1.1, which is descendent of the BA.1 lineage and is characterized by an additional substitution (R346K) in the spike protein. The national proportion of BA.1.1 is projected to be 75.6% (95% PI 71.1-79.7%). B.1.1.529 (BA.1 and BA.3) is projected to be 20.6% (95% PI 16.7-25.1%) and BA.2 is projected to be 3.8% (95% PI 3.0-4.8%). Delta is projected to continue to be 0.0% (95% PI 0.0-0.0%). Omicron is predicted to be 100% in all HHS regions.

78,595,529
Total Cases Reported

75,208
Current 7-Day Average***

120,761
Prior 7-Day Average

-37.7%
Change in 7-Day Average since Prior Week

*The median time from specimen collection to sequence data reporting is about 3 weeks. As a result, weighted estimates for the most recent few weeks may be unstable or unavailable. CDC’s Nowcast is a data projection tool that helps fill this gap by generating timely estimates of variant proportions for variants that are circulating in the United States. View Nowcast estimates on CDC’s COVID Data Tracker website on the Variant Proportions page.

**For national data, the proportion of BA.1.1 is shown separately. For regional data, the proportion of BA.1.1 is also aggregated with B.1.1.529.

***Historical cases are excluded from daily new cases and 7-day average calculations until they are incorporated into the dataset for the applicable date. Of 424,140 historical cases reported retroactively, 676 were reported in the current week and 137 were reported in the prior week.

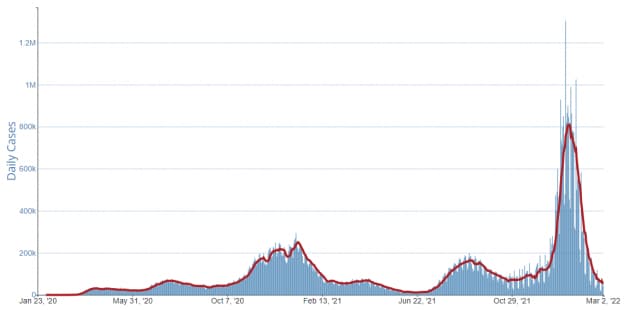
Daily Trends in COVID-19 Cases in the United States Reported to CDC
red-line.jpg

7-Day moving average

resize iconView Larger
More Case Data

Vaccinations


The U.S. COVID-19 Vaccination Program began December 14, 2020. As of February 23, 2022, 551.4 million vaccine doses have been administered in the United States. Overall, about 253.2 million people, or 76.3% of the total U.S. population, have received at least one dose of vaccine. About 215.1 million people, or 64.8% of the total U.S. population, have been fully vaccinated.* About 93.4 million additional or booster doses have been reported in people who have been fully vaccinated; however, 49.9% of the total booster-eligible population has not yet received a booster dose. As of February 23, 2022, the 7-day average number of administered vaccine doses reported (by date of CDC report) to CDC per day was 425,810, a 17.6% decrease from the previous week.

CDC’s COVID Data Tracker Vaccination Demographic Trends tab shows vaccination trends by age group and by race/ethnicity. As of February 24, 2022, 95.0% of people ages 65 years or older have received at least one dose of vaccine and 88.7% are fully vaccinated. For people ages 5-11 years, only 25.4% are fully vaccinated. For people ages 5 years or older, 81.1% have received at least one dose of vaccine and 68.9% are fully vaccinated. Of the fully vaccinated population, people ages 75 years or older have the highest proportion of additional/booster doses (68.3%) while people ages 12-17 have the lowest proportion (20.8%).

As of February 24, 2022, of all race/ethnicity groups, the Asian non-Hispanic population has the highest proportion that is fully vaccinated (59.8%) and the Black non-Hispanic population has the lowest proportion that is fully vaccinated (40.6%). Of the fully vaccinated population, the Asian non-Hispanic population has the highest proportion of additional/booster doses (65.4%) while the Hispanic/Latino population has the lowest proportion (38.5%).

COVID Data Tracker’s COVID-19 Vaccination Equity tab shows vaccination trends by urban/rural status. As of February 23, 2022, 48.5% of people in rural counties are fully vaccinated, while the range of vaccination coverage in the 5 urban/metro counties ranged from 52.3% (micropolitan) to 66.0% (large central metro).

551,372,287
Vaccine Doses Administered

253,179,401
People who received at least one dose

215,129,430
People who are fully vaccinated*

76.3%
Percentage of the U.S. population that has received at least one dose

64.8%
Percentage of the U.S. population that has been fully vaccinated*

+0.3
Percentage point increase from last week

+0.3
Percentage point increase from last week

*Represents the number of people who have received the second dose in a two-dose COVID-19 vaccine series (such as the Pfizer or Moderna vaccines) or one dose of the single-shot Johnson & Johnson’s Janssen vaccine.

Daily Change in the Total Number of Administered COVID-19 Vaccine Doses Reported to CDC by the Date of CDC Report, United States
red-line.jpg

7-Day moving average

resize iconView Larger
More Vaccination Data

Hospitalizations

New Hospital Admissions


The current 7-day daily average for February 16–February 22, 2022, is 6,060. This is a 29.9% decrease from the prior 7-day average (8,650) from February 9–February 15, 2022.

4,506,920
Total New Admissions

6,060
Current 7-Day Average

8,650
Prior 7-Day Average

-29.9%
Change in 7-Day Average

The start of consistent reporting of hospital admissions data was August 1, 2020.

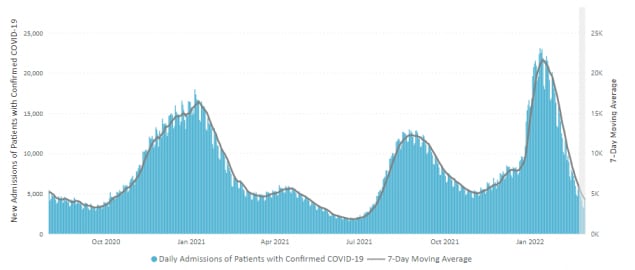
Daily Trends in Number of New COVID-19 Hospital Admissions in the United States

resize iconView Larger
New admissions are pulled from a 10 am EST snapshot of the HHS Unified Hospital Timeseries Dataset. Due to potential reporting delays, data from the most recent 7 days, as noted in the figure above with the grey bar, should be interpreted with caution. Small shifts in historic data may also occur due to changes in the Centers for Medicare and Medicaid Services (CMS) Provider of Services file, which is used to identify the cohort of included hospitals.

More Hospital Data

Recent Trends in Hospitalizations in Non-Hispanic American Indian and Alaska Native People


CDC’s Coronavirus Disease 2019-Associated Hospitalization Surveillance Network (COVID-NET) shows that since the start of the pandemic, people from racial and ethnic minority groups have been at increased risk for COVID-19-associated hospitalizations compared to non-Hispanic White persons.* For the week ending February 5, 2022, the rate of COVID-19-associated hospitalizations in non-Hispanic American Indian/Alaska Native people was 24.1 per 100,000 people. While hospitalization rates have decreased since their peak of 39.4 per 100,000 people for the week ending January 8, 2022, this weekly hospitalization rate is the highest among all racial and ethnic minority groups.

*It is important to note that these increases might be driven by a limited number of COVID-NET sites and might not be nationally representative.

Trends in Hospitalizations in Non-Hispanic American Indian and Alaska Native People


resize iconView Larger
The Coronavirus Disease 2019 (COVID-19)-Associate­­d Hospitalization Surveillance Network (COVID-NET) is an additional source for hospitalization data collected through a network of more than 250 acute-care hospitals in 14 states (representing ~10% of the U.S. population). Detailed data on patient demographics, including race/ethnicity, underlying medical conditions, medical interventions, and clinical outcomes, are collected with a standardized case reporting form.
More COVID-NET Data

Deaths


The current 7-day moving average of new deaths (1,674) has decreased 18.8% compared with the previous 7-day moving average (2,063). As of February 23, 2022, a total of 939,654 COVID-19 deaths have been reported in the United States.

939,654
Total Deaths Reported

1,674
Current 7-Day Average*

2,063
Prior 7-Day Average

-18.8%
Change in 7-Day Average Since Prior Week

*Historical deaths are excluded from the daily new deaths and 7-day average calculations until they are incorporated into the dataset by their applicable date. Of 20,882 historical deaths reported retroactively, none were reported in the current week; and 362 were reported in the prior week.

Daily Trends in Number of COVID-19 Deaths in the United States Reported to CDC
red-line.jpg

7-Day moving average

resize iconView Larger
More Death Data

Testing


The percentage of COVID-19 NAATs (nucleic acid amplification tests)* that are positive (percent positivity) is decreasing in comparison to the previous week. The 7-day average of percent positivity from NAATs is now 5.4%. The 7-day average number of tests reported for February 11-17, 2022, was 1,180,863, down 7.7% from 1,279,328 for the prior 7 days.

813,578,612
Total Tests Reported

1,180,863
7-Day Average Tests Reported

5.4%
7-Day Average % Positivity

8.3%
Previous 7-Day Average % Positivity

-2.98
Percentage point change in 7-Day Average % Positivity since Prior Week

*Test for SARS-CoV-2, the virus that causes COVID-19

COVID-19 NAAT Laboratory Test 7-day Percent Positivity by State/Territory

resize iconView Larger
More Testing Data
Top of Page
Content source: National Center for Immunization and Respiratory Diseases
 
covid-tracker-header-lrg.jpg

Print
Subscribe to the Weekly Review


Interpretive Summary for March 4, 2022
In Focus: COVID-19 Community Levels


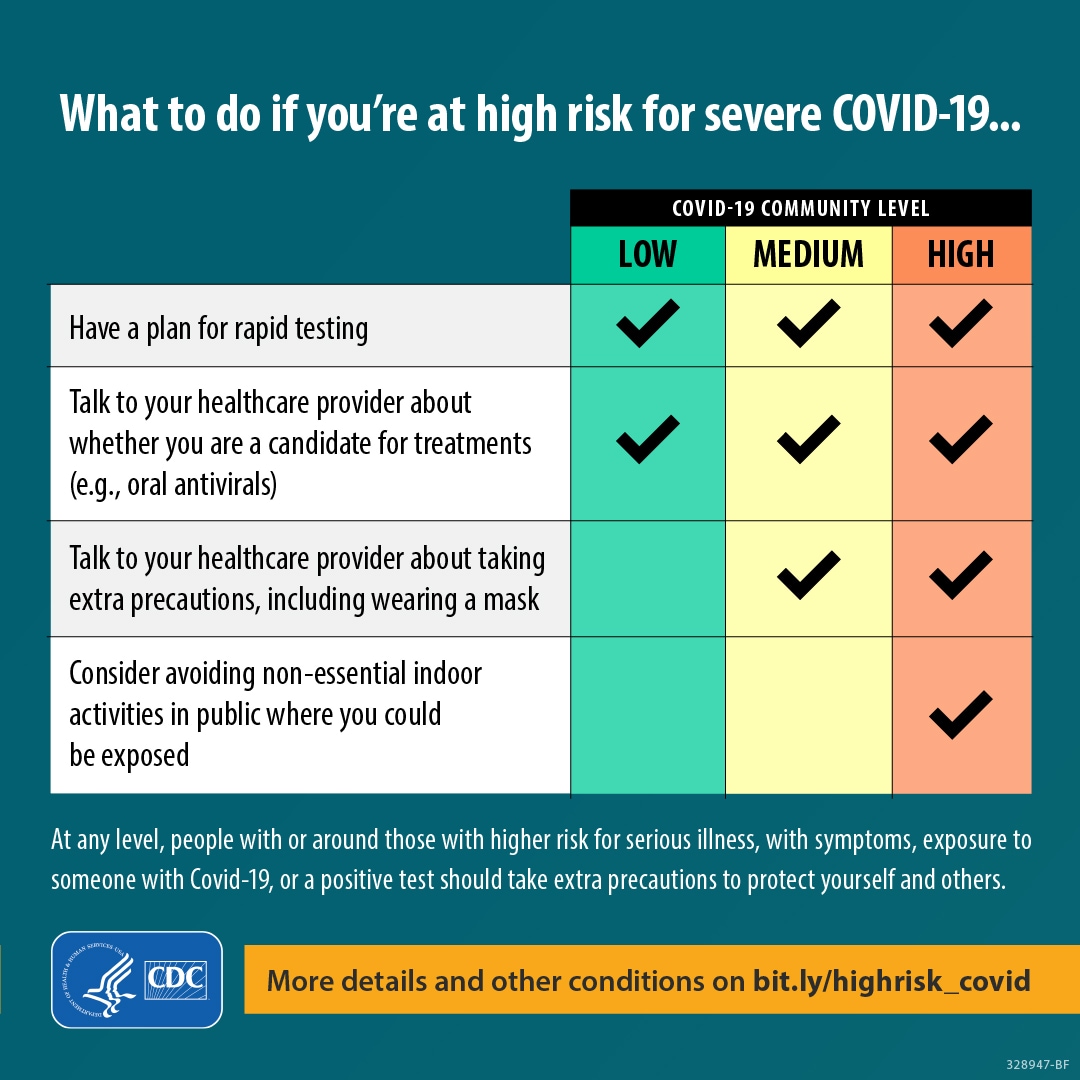
Last week CDC launched COVID-19 Community Levels, a new tool for helping people and communities decide on prevention steps based on the latest data. There are three levels (low, medium, high), which are determined by looking at hospital beds being used by patients with COVID-19, new hospital admissions among people with COVID-19, and the total number of new COVID-19 cases in your area. It’s easy to check your county’s level on CDC’s website and find out what actions you should take.


  • If you are at high risk for severe illness, talk to your healthcare provider about whether you need to wear a mask and take other precautions
  • Stay up to date with COVID-19 vaccines
  • Get tested if you have symptoms

  • Wear a mask indoors in public
  • Stay up to date with COVID-19 vaccines
  • Get tested if you have symptoms
  • Additional precautions may be needed for people at high risk for severe illness

[TD="width: 15%"] Low [/TD]
[TD="width: 15%"] Medium [/TD]
[TD="width: 15%"] High [/TD]

[TD="bgcolor: #ececec, colspan: 3"]People may choose to mask at any time. People with symptoms, a positive test, or exposure to someone with COVID-19 should wear a mask.[/TD]
The whole community can be safe only when we all take steps to protect each other, even when the COVID-19 Community Level is low or medium. No matter what your COVID-19 Community Level, layered prevention strategies can help limit severe disease and reduce the potential for strain on the healthcare system. Proven prevention steps include staying up to date on vaccines, getting tested if you have symptoms, and wearing a mask when you’re around someone at increased risk for severe COVID-19. For more information on the science behind the levels and how CDC measures them, see our A Closer Look section.


What's New

Reported Cases


As of March 2, 2022, the current 7-day moving average of daily new cases (53,017) decreased 28.5% compared with the previous 7-day moving average (74,143). A total of 78,977,146 COVID-19 cases have been reported in the United States as of March 2, 2022.

Currently two variants, Omicron and Delta, are classified as Variants of Concern (VOC) in the United States. CDC Nowcast projections* for the week ending February 26, 2022, estimate the combined national proportion of lineages designated as Omicron to be 100%. There are five lineages designated as Omicron: B.1.1.529, BA.1, BA.1.1, BA.2, and BA.3. COVID Data Tracker now shows the proportions of the B.1.1.529 lineage (includes BA.1 and BA.3), BA.1.1** lineage, and the BA.2 lineage. The predominant Omicron lineage in the United States is BA.1.1, which is descendent of the BA.1 lineage and is characterized by an additional substitution (R346K) in the spike protein. The national proportion of BA.1.1 is projected to be 74.6% (95% PI 70.3-78.4%). B.1.1.529 (BA.1 and BA.3) is projected to be 17.2% (95% PI 14.1-20.8%) and BA.2 is projected to be 8.3% (95% PI 6.3-10.7%). Delta is projected to continue to be 0.0% (95% PI 0.0-0.0%). Omicron is predicted to be 100% in all HHS regions.

78,977,146
Total Cases Reported

53,017
Current 7-Day Average**

74,143
Prior 7-Day Average

-28.5%
Change in 7-Day Average since Prior Week

*The median time from specimen collection to sequence data reporting is about 3 weeks. As a result, weighted estimates for the most recent few weeks may be unstable or unavailable. CDC’s Nowcast is a data projection tool that helps fill this gap by generating timely estimates of variant proportions for variants that are circulating in the United States. View Nowcast estimates on CDC’s COVID Data Tracker website on the Variant Proportions page.

**For national data, the proportion of BA.1.1 is shown separately. For regional data, the proportion of BA.1.1 is also aggregated with B.1.1.529.

***Historical cases are excluded from daily new cases and 7-day average calculations until they are incorporated into the dataset for the applicable date. Of 451,214 historical cases reported retroactively, 27,211 were reported in the current week and 676 were reported in the prior week.


Daily Trends in COVID-19 Cases in the United States Reported to CDC
red-line.jpg

7-Day moving average

resize iconView Larger
More Case Data

Vaccinations


The U.S. COVID-19 Vaccination Program began December 14, 2020. As of March 2, 2022, 553.8 million vaccine doses have been administered in the United States. Overall, about 253.8 million people, or 76.4% of the total U.S. population, have received at least one dose of vaccine. About 215.8 million people, or 65.0% of the total U.S. population, have been fully vaccinated.* About 94.6 million additional or booster doses have been reported in people who have been fully vaccinated; however, 49.9% of the total booster-eligible population has not yet received a booster dose. As of March 2, 2022, the 7-day average number of administered vaccine doses reported (by date of CDC report) to CDC per day was 168,660, a 46.9% decrease from the previous week.

CDC’s COVID Data Tracker Vaccination Demographic Trends tab shows vaccination trends by age group and by race/ethnicity. As of March 2, 2022, 95.0% of people ages 65 years or older have received at least one dose of vaccine and 88.8% are fully vaccinated. For people ages 5-11 years, only 26.0% are fully vaccinated. For people ages 5 years or older, 81.2% have received at least one dose of vaccine and 69.1% are fully vaccinated. Of the fully vaccinated population, people ages 75 years or older have the highest proportion of additional/booster doses (68.6%) while people ages 12-17 have the lowest proportion (21.4%).

As of March 2, 2022, of all race/ethnicity groups, the Asian non-Hispanic population has the highest proportion that is fully vaccinated (59.9%) and the Black non-Hispanic population has the lowest proportion that is fully vaccinated (40.8%). Of the fully vaccinated population, the Asian non-Hispanic population has the highest proportion of additional/booster doses (66.0%) while the Hispanic/Latino population has the lowest proportion (39.1%).

COVID Data Tracker’s COVID-19 Vaccination Equity tab shows vaccination trends by urban/rural status. As of March 2, 2022, 48.6% of people in rural counties are fully vaccinated, while the range of vaccination coverage in the 4 urban/metro counties ranged from 53.9% (small metro) to 66.2% (large central metro).

553,778,476
Vaccine Doses Administered

253,752,684
People who received at least one dose

215,775,839
People who are fully vaccinated*

76.4%
Percentage of the U.S. population that has received at least one dose

65.0%
Percentage of the U.S. population that has been fully vaccinated*

+0.1
Percentage point increase from last week

+0.2
Percentage point increase from last week

*Represents the number of people who have received the second dose in a two-dose COVID-19 vaccine series (such as the Pfizer or Moderna vaccines) or one dose of the single-shot Johnson & Johnson’s Janssen vaccine.

Daily Change in the Total Number of Administered COVID-19 Vaccine Doses Reported to CDC by the Date of CDC Report, United States
red-line.jpg

7-Day moving average

resize iconView Larger
More Vaccination Data

Hospitalizations

New Hospital Admissions


The current 7-day daily average for February 23-March 1, 2022, was 4,243. This is a 30.3% decrease from the prior 7-day average (6,089) from February 16-February 22, 2022.

4,536,834
Total New Admissions

4,243
Current 7-Day Average

6,089
Prior 7-Day Average

-30.3%
Change in 7-Day Average

The start of consistent reporting of hospital admissions data was August 1, 2020.

Daily Trends in Number of New COVID-19 Hospital Admissions in the United States

resize iconView Larger
New admissions are pulled from a 10 am EST snapshot of the HHS Unified Hospital Timeseries Dataset. Due to potential reporting delays, data from the most recent 7 days, as noted in the figure above with the grey bar, should be interpreted with caution. Small shifts in historic data may also occur due to changes in the Centers for Medicare and Medicaid Services (CMS) Provider of Services file, which is used to identify the cohort of included hospitals.

More Hospital Data

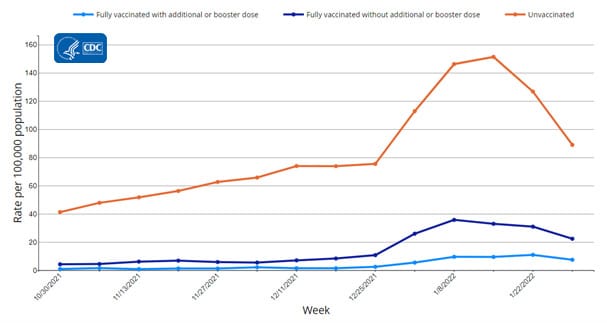
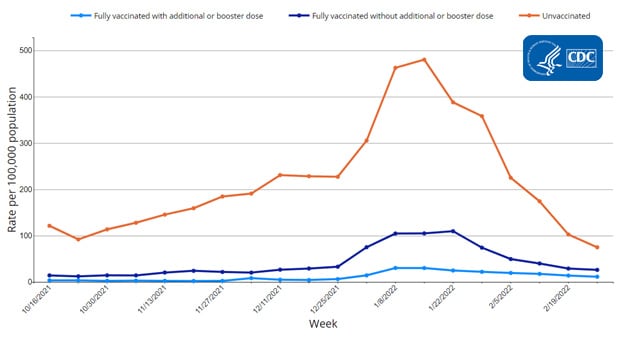
Hospitalization Rates by Vaccination Status in Adults


CDC’s Coronavirus Disease 2019-Associated Hospitalization Surveillance Network (COVID-NET) shows that rates of COVID-19-associated hospitalizations in January 2022 remained higher in unvaccinated adults compared to fully vaccinated adults who have received additional or booster doses of a COVID-19 vaccine. Among adults ages 18 years and older, the COVID-19-associated hospitalization rate in January among unvaccinated persons was 9 times as high as the rate among fully vaccinated adults who received an additional or booster dose. Compared with adults who received additional or booster doses, rates of COVID-19-associated hospitalization remain higher among unvaccinated adults, regardless of age group.

Age-Adjusted Rates of COVID-19-Associated Hospitalizations among Adults Ages ≥18 Years, by Vaccination Status


resize iconView Larger
The Coronavirus Disease 2019 (COVID-19)-Associate­­d Hospitalization Surveillance Network (COVID-NET) is an additional source for hospitalization data collected through a network of more than 250 acute-care hospitals in 14 states (representing ~10% of the U.S. population). Detailed data on patient demographics, including race/ethnicity, underlying medical conditions, medical interventions, and clinical outcomes, are collected with a standardized case reporting form.
More COVID-NET Data

Deaths


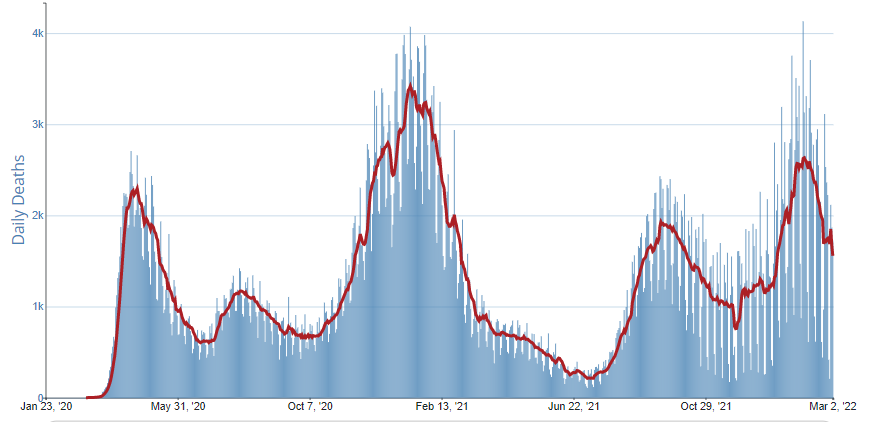
The current 7-day moving average of new deaths (1,559) has decreased 8.9% compared with the previous 7-day moving average (1,712). As of March 2, 2022, a total of 952,223 COVID-19 deaths have been reported in the United States.

952,223
Total Deaths Reported

1,559
Current 7-Day Average*

1,712
Prior 7-Day Average

-8.9%
Change in 7-Day Average Since Prior Week

*Historical deaths are excluded from the daily new deaths and 7-day average calculations until they are incorporated into the dataset by their applicable date. Of 20,882 historical deaths reported retroactively, none were reported in the current week; and none were reported in the prior week.

Daily Trends in Number of COVID-19 Deaths in the United States Reported to CDC
red-line.jpg

7-Day moving average

resize iconView Larger
More Death Data

Testing


The percentage of COVID-19 NAATs (nucleic acid amplification tests)* that are positive (percent positivity) is decreasing in comparison to the previous week. The 7-day average of percent positivity from NAATs is now 3.8%. The 7-day average number of tests reported for February 18-24, 2022, was 1,008,290, down 15.7% from 1,195,808 for the prior 7 days.

821,443,122
Total Tests Reported

1,008,290
7-Day Average Tests Reported

3.8%
7-Day Average % Positivity

5.5%
Previous 7-Day Average % Positivity

-1.65
Percentage point change in 7-Day Average % Positivity since Prior Week

*Test for SARS-CoV-2, the virus that causes COVID-19

COVID-19 NAAT Laboratory Test 7-day Percent Positivity by State/Territory

resize iconView Larger
More Testing Data
Top of PageA Closer Look


This section presents more detailed information for readers who want to learn more about current issues of interest.
Understanding the COVID-19 Community Levels


At this point in the pandemic, the United States has high rates of vaccine and infection-induced immunity in the population, as well as availability of effective therapeutics, testing, and well-fitting masks/respirators. These tools, which have been developed and distributed over the past two years, mean that we can minimize medically significant disease and prevent excessive strain on the healthcare sector even while SARS-CoV-2 virus continues to circulate. CDC has introduced the COVID-19 Community Levels to monitor the impact of COVID-19 on communities. While we do not know how the spread of SARS-CoV-2 virus might change in the future (e.g., from the emergence of a new variant), the COVID-19 Community Levels will inform how prevention measures could be used to minimize the impact of COVID-19 on health and society.

The COVID-19 Community Levels considers three measurements that provide a better picture than the previously used Community Transmission metric of the current impact of COVID-19 while also serving as clear predictors of how the situation could change:
  • New COVID-19 hospital admissions per 100,000 population in the last 7 days, which reflects the amount of severe COVID-19 disease within the community
  • Percent of staffed inpatient beds occupied by patients with confirmed COVID-19 (7-day average), an indicator of local healthcare system usage and remaining capacity to care for patients with other medically important health issues
  • New COVID-19 cases per 100,000 population in the last 7 days, a signal of anticipated healthcare strain. An increase over a threshold of 200 cases per 100,000 population may forecast increases in new hospitalizations or inpatient beds occupied by COVID-19 patients and helps communities to implement prevention strategies accordingly.
These three measures were chosen because they 1) monitor severe illness and healthcare strain caused from COVID-19, 2) are available for all counties across the country, from data reported at the county level or allocated to the county level from Health Services Areas (HSAs), and 3) are reported frequently enough to inform decisions about recommended prevention strategies in a timely manner. The data used to inform the COVID-19 Community Levels indicators are available through the U.S. Department of Health and Human Services Unified Hospital Data Surveillance System (UHDSS), which monitors national and local trends in healthcare system stress, capacity, and community disease levels for approximately 6,000 hospitals in the United States. Case incidence rate is determined from aggregate counts of COVID-19 cases reported by state and territorial jurisdictions to the CDC.

The thresholds for each COVID-19 Community Level were selected after a series of analyses examining the performance of different thresholds and combinations of thresholds to predict serious health outcomes. They were then validated through discussion with and inputs from local and state health officials and experts from hospital and healthcare systems. These thresholds are designed to signal the need for additional precautions in time for them to make a difference and allow communities to scale back those precautions when the Community Level is low. Our analyses showed that the COVID-19 Community Levels provide a sizeable improvement over community transmission levels in identifying regions that will experience severe outcomes—including ICU admissions and deaths—in the weeks ahead. Additional details about the methods for setting and evaluating the COVID-19 Community Levels are available here.

Health officials and individuals can use the COVID-19 Community Levels to inform decisions about community prevention strategies and individual behaviors. Individuals should also make personal decisions based on whether they are at high risk for severe disease. Exploring ways to promote these prevention strategies and provide equitable access to vaccines and other resources in our communities will protect the health and safety of everyone.

Top of Page
Content source: National Center for Immunization and Respiratory Diseases

https://www.cdc.gov/coronavirus/2019-ncov/covid-data/covidview/index.html
 
covid-tracker-header-lrg.jpg

Print
Subscribe to the Weekly Review


Interpretive Summary for March 11, 2022
Protect Those at Risk


resize iconView Larger
At this point in the pandemic, many people are at much lower risk of severe illness, hospitalization, and death from COVID-19. Vaccination and testing levels are high, treatments are more advanced and widely available, and the population has increased immunity through vaccination or previous infection. While low community risk is welcome news, we know that low risk does not mean no risk. Some people and places are still at high risk for serious illness, and they face challenging decisions.

Who is most likely to become very sick or die from COVID-19? Your chances increase with age and underlying medical conditions like cancer, diabetes, heart conditions, dementia, and obesity, particularly if you’re not up to date on vaccinations. People with weakened immune systems,* some disabilities, some mental health conditions, and some chronic diseases are also at higher risk. A lot of people might not know they’re at risk for severe illness—review the list to find out if you could be.

COVID-19 Community Levels can help people protect themselves and navigate this new phase of the pandemic. If you are at high risk, make sure you’re up to date on your COVID-19 vaccines and wear a well-fitting mask indoors in areas with medium or high COVID-19 Community Levels. If someone you visit with is at high risk, take a rapid test right before a visit. Staying outside is always safest, but if the visit is indoors, make sure the ventilation is good and consider wearing a well-fitting mask. People at high risk, and the whole community, can be safe only when we all protect each other.

*People who are moderately or severely immunocompromised have specific COVID-19 vaccine recommendations for the primary series and booster dose due to their different immune response following COVID-19 vaccination. For more information, visit CDC’s website.

Note to Readers: COVID-19 Community Levels do not apply in healthcare settings, such as hospitals and nursing homes. Instead, healthcare settings should continue to use community transmission rates and follow CDC’s infection prevention and control recommendations for healthcare workers.


What's New

Reported Cases


As of March 9, 2022, the current 7-day moving average of daily new cases (37,147) decreased 28.8% compared with the previous 7-day moving average (52,156). A total of 79,248,406 COVID-19 cases have been reported in the United States as of March 9, 2022.

Currently two variants, Omicron and Delta, are classified as Variants of Concern (VOC) in the United States. CDC Nowcast projections* for the week ending February 26, 2022, estimate the combined national proportion of lineages designated as Omicron to be 100%. There are five lineages designated as Omicron: B.1.1.529, BA.1, BA.1.1, BA.2, and BA.3. COVID Data Tracker now shows the proportions of the B.1.1.529 lineage (includes BA.1 and BA.3), BA.1.1** lineage, and the BA.2 lineage. The predominant Omicron lineage in the United States is BA.1.1, which is descendent of the BA.1 lineage and is characterized by an additional substitution (R346K) in the spike protein. The national proportion of BA.1.1 is projected to be 73.7% (95% PI 70.1-77.0%). B.1.1.529 (BA.1 and BA.3) is projected to be 14.7% (95% PI 12.4-17.4%) and BA.2 is projected to be 11.6% (95% PI 9.8-13.6%). Delta is projected to continue to be 0.0% (95% PI 0.0-0.0%). Omicron is predicted to be 100% in all HHS regions.

79,486,762
Total Cases Reported

30,040
Current 7-Day Average**

36,010
Prior 7-Day Average

-16.6%
Change in 7-Day Average since Prior Week

*The median time from specimen collection to sequence data reporting is about 3 weeks. As a result, weighted estimates for the most recent few weeks may be unstable or unavailable. CDC’s Nowcast is a data projection tool that helps fill this gap by generating timely estimates of variant proportions for variants that are circulating in the United States. View Nowcast estimates on CDC’s COVID Data Tracker website on the Variant Proportions page.

**For national data, the proportion of BA.1.1 is shown separately. For regional data, the proportion of BA.1.1 is also aggregated with B.1.1.529.

***Historical cases are excluded from daily new cases and 7-day average calculations until they are incorporated into the dataset for the applicable date. Of 457,051 historical cases reported retroactively, 5,837 were reported in the current week and 27,211 were reported in the prior week.


Daily Trends in COVID-19 Cases in the United States Reported to CDC
red-line.jpg

7-Day moving average

resize iconView Larger
More Case Data

Vaccinations


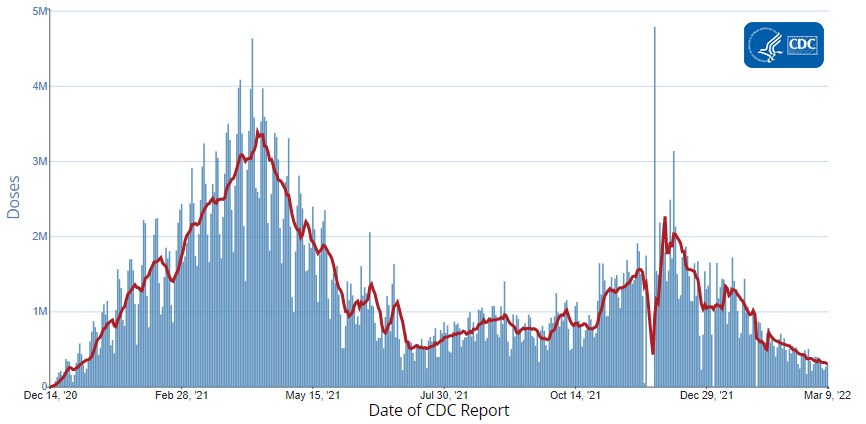
The U.S. COVID-19 Vaccination Program began December 14, 2020. As of March 9, 2022, 555.9 million vaccine doses have been administered in the United States. Overall, about 254.3 million people, or 76.6% of the total U.S. population, have received at least one dose of vaccine. About 216.4 million people, or 65.2% of the total U.S. population, have been fully vaccinated.* About 95.5 million additional or booster doses have been reported in people who have been fully vaccinated; however, 49.9% of the total booster-eligible population has not yet received a booster dose. As of March 9, 2022, the 7-day average number of administered vaccine doses reported (by date of CDC report) to CDC per day was 302,787, a 11.9% decrease from the previous week.

CDC’s COVID Data Tracker Vaccination Demographic Trends tab shows vaccination trends by age group and by race/ethnicity. As of March 9, 2022, 95.0% of people ages 65 years or older have received at least one dose of vaccine and 88.8% are fully vaccinated. For people ages 5–11 years, only 26.5% are fully vaccinated. For people ages 5 years or older, 81.4% have received at least one dose of vaccine and 69.3% are fully vaccinated. Of the fully vaccinated population, people ages 75 years or older have the highest proportion of additional/booster doses (68.9%) while people ages 12–17 have the lowest proportion (22.0%).

As of March 9, 2022, of all race/ethnicity groups, the Asian non-Hispanic population has the highest proportion that is fully vaccinated (60.1%), and the Black non-Hispanic population has the lowest proportion that is fully vaccinated (41.0%). Of the fully vaccinated population, the Asian non-Hispanic population has the highest proportion of additional/booster doses (66.5%), while the Hispanic/Latino population has the lowest proportion (39.7%).

COVID Data Tracker’s COVID-19 Vaccination Equity tab shows vaccination trends by urban/rural status. As of March 9, 2022, 48.7% of people in rural counties are fully vaccinated, while the range of vaccination coverage in the 4 urban/metro counties ranged from 52.6% (micropolitan) to 66.4% (large central metro).


557,644,629
Vaccine Doses Administered

254,750,626
People who received at least one dose

216,829,829
People who are fully vaccinated*

76.7%
Percentage of the U.S. population that has received at least one dose

65.3%
Percentage of the U.S. population that has been fully vaccinated*

+0.1
Percentage point increase from last week

+0.1
Percentage point increase from last week

*Represents the number of people who have received the second dose in a two-dose COVID-19 vaccine series (such as the Pfizer or Moderna vaccines) or one dose of the single-shot Johnson & Johnson’s Janssen vaccine.

Daily Change in the Total Number of Administered COVID-19 Vaccine Doses Reported to CDC by the Date of CDC Report, United States
red-line.jpg

7-Day moving average

resize iconView Larger
More Vaccination Data

Hospitalizations

New Hospital Admissions


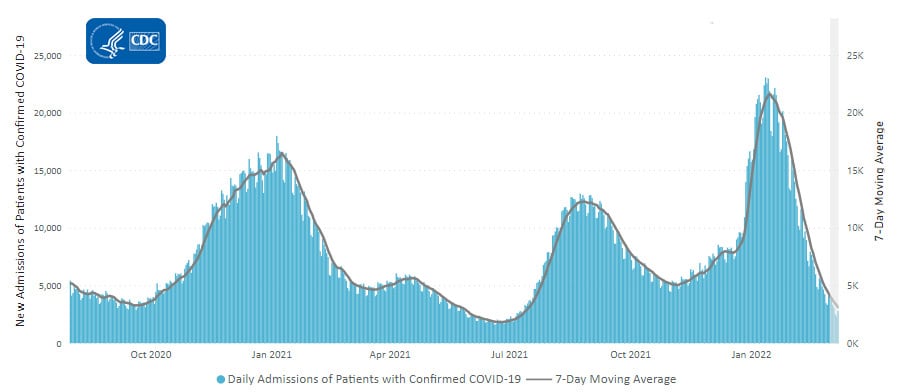
The current 7-day daily average for March 2–8, 2022, was 3,113. This is a 27.5% decrease from the prior 7-day average (4,293) from February 23–March 1, 2022.

4,575,344
Total New Admissions

2,298
Current 7-Day Average

3,157
Prior 7-Day Average

-27.2%
Change in 7-Day Average

The start of consistent reporting of hospital admissions data was August 1, 2020.

Daily Trends in Number of New COVID-19 Hospital Admissions in the United States

resize iconView Larger
New admissions are pulled from a 10 am EST snapshot of the HHS Unified Hospital Timeseries Dataset. Due to potential reporting delays, data from the most recent 7 days, as noted in the figure above with the grey bar, should be interpreted with caution. Small shifts in historic data may also occur due to changes in the Centers for Medicare and Medicaid Services (CMS) Provider of Services file, which is used to identify the cohort of included hospitals.

More Hospital Data

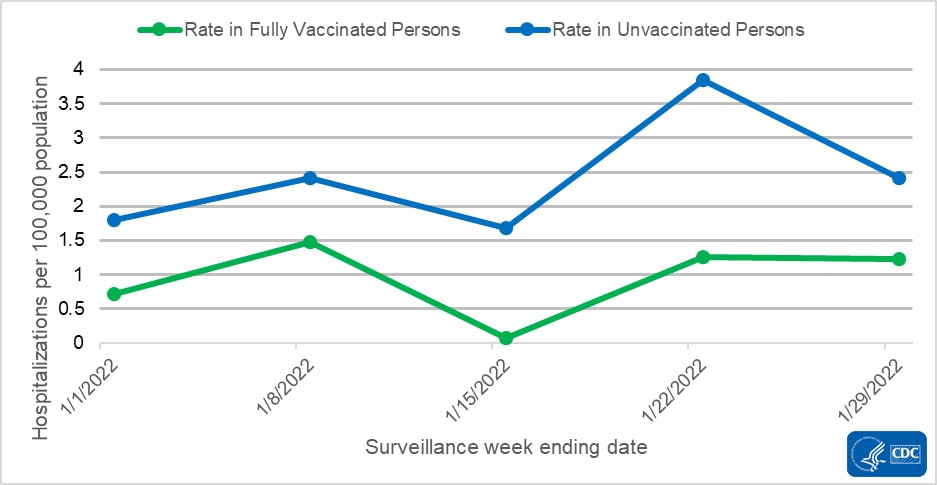
Hospitalization Rates by Vaccination Status in Adults


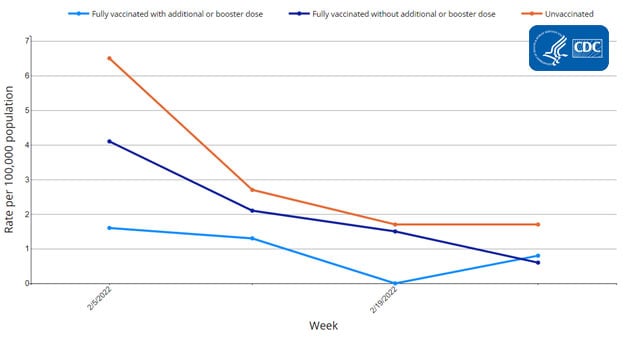
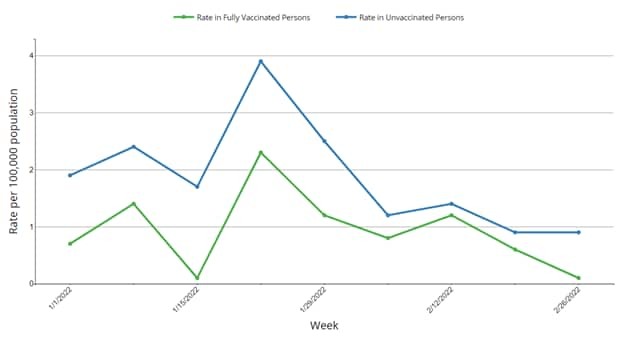
CDC’s Coronavirus Disease 2019-Associated Hospitalization Surveillance Network (COVID-NET) shows that the monthly rate of COVID-19-associated hospitalizations in January 2022 among children ages 5–11 years was 3 times as high in unvaccinated children compared to children who are fully vaccinated with a primary vaccine series.

Weekly Rates of COVID-19-Associated Hospitalization among Children Ages 5–11 Years, by Vaccination Status


resize iconView Larger
The Coronavirus Disease 2019 (COVID-19)-Associate­­d Hospitalization Surveillance Network (COVID-NET) is an additional source for hospitalization data collected through a network of more than 250 acute-care hospitals in 14 states (representing ~10% of the U.S. population). Detailed data on patient demographics, including race/ethnicity, underlying medical conditions, medical interventions, and clinical outcomes, are collected with a standardized case reporting form.
More COVID-NET Data

Deaths


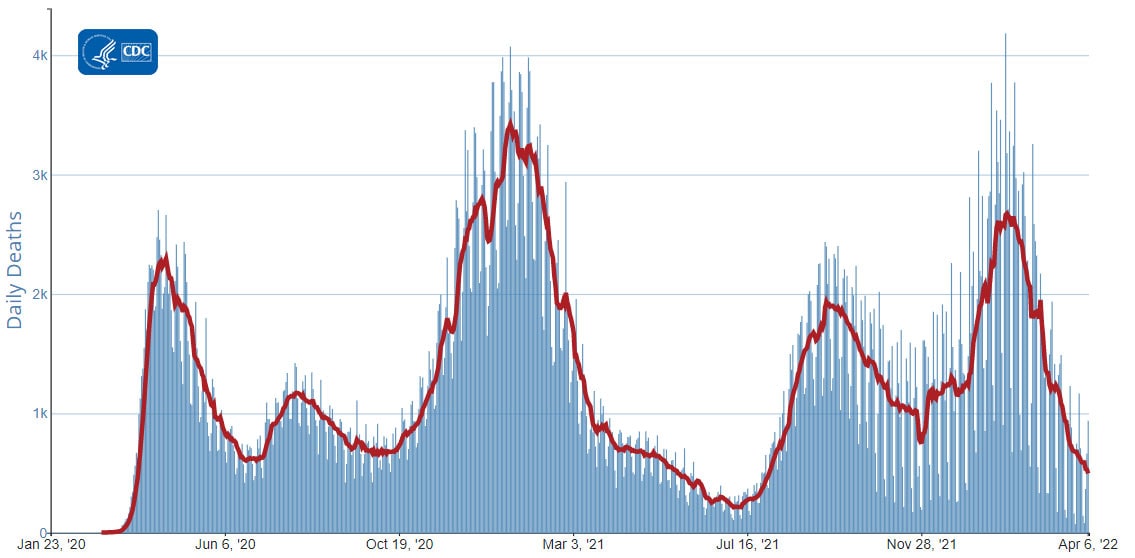
The current 7-day moving average of new deaths (1,180) has decreased 25.0% compared with the previous 7-day moving average (1,572). As of March 9, 2022, a total of 961,620 COVID-19 deaths have been reported in the United States.

965,575
Total Deaths Reported

1,052
Current 7-Day Average*

1,188
Prior 7-Day Average

-11.4%
Change in 7-Day Average Since Prior Week

*Historical deaths are excluded from the daily new deaths and 7-day average calculations until they are incorporated into the dataset by their applicable date. Of 20,882 historical deaths reported retroactively, none were reported in the current week; and none were reported in the prior week.

Daily Trends in Number of COVID-19 Deaths in the United States Reported to CDC
red-line.jpg

7-Day moving average

resize iconView Larger
More Death Data

Testing


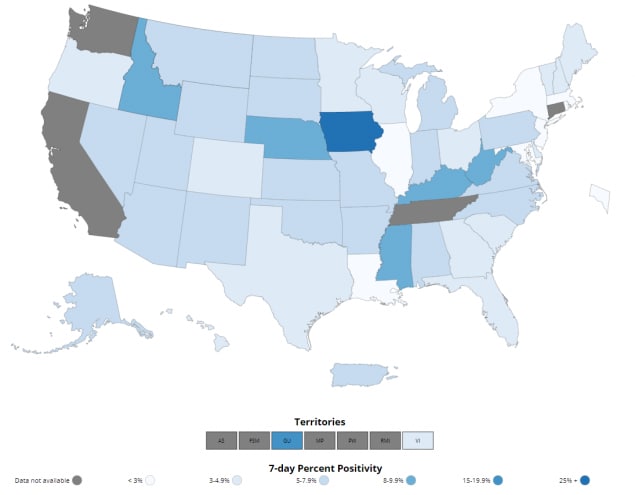
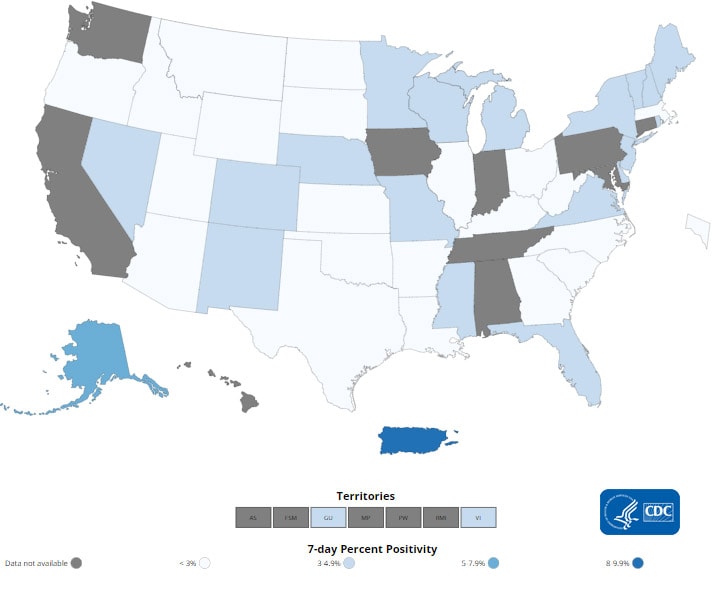
The percentage of COVID-19 NAATs (nucleic acid amplification tests)* that are positive (percent positivity) is decreasing in comparison to the previous week. The 7-day average of percent positivity from NAATs is now 2.8%. The 7-day average number of tests reported for February 25– March 3, 2022, was 948,207 down 7.0 % from 1,019,890 for the prior 7 days.

834,241,390
Total Tests Reported

858,144
7-Day Average Tests Reported

2.2%
7-Day Average % Positivity

2.8%
Previous 7-Day Average % Positivity

-0.59
Percentage point change in 7-Day Average % Positivity since Prior Week

*Test for SARS-CoV-2, the virus that causes COVID-19

COVID-19 NAAT Laboratory Test 7-day Percent Positivity by State/Territory
 
covid-tracker-header-lrg.jpg
wAAACH5BAEKAAAALAAAAAABAAEAAAICRAEAOw==

Print
Subscribe to the Weekly Review


Interpretive Summary for March 18, 2022
Boosted is Best

​external icon
resize iconView Larger
COVID-19 cases, hospitalizations, and deaths all continue to decrease in the United States. According to CDC’s COVID Data Tracker, as of March 16, 2022, 76.7% of the total U.S. population has received at least one dose of a COVID-19 vaccine, and 65.3% has completed their primary series. However, only about half of the booster-eligible population has received a booster dose and is considered up to date on their COVID-19 vaccines.

Two new studies show the effectiveness of COVID-19 vaccines and boosters across periods of three variants of concern (Alpha, Delta, and Omicron). CDC released a study today showing that, among adults hospitalized with COVID-19 during the Delta and Omicron waves, those who received two or three doses of the Pfizer-BioNTech or Moderna vaccine had 90–95% less risk of dying or needing a ventilator compared with adults who were not vaccinated. Protection was highest in adults who received a third COVID-19 vaccine dose. A study published in the British Medical Journalexternal icon found that vaccines gave a high level of protection against hospitalization for all variants, but not as much for Omicron among adults who received only a primary series. However, boosters increased protection against Omicron. The study also showed that hospital patients who were vaccinated had much lower disease severity than patients who were not vaccinated.

These studies emphasize the importance of staying up to date with vaccinations—they are our best protection against severe COVID-19 illness. Vaccination is also the safest way to reduce the chance that new variants will emerge. Find a vaccine provider and get your booster dose as soon as you can.*

*People who are moderately or severely immunocompromised have specific COVID-19 vaccine recommendations for the primary series and booster dose due to their different immune response following COVID-19 vaccination. For more information, visit CDC’s website.


What's New

Reported Cases


As of March 16, 2022, the current 7-day moving average of daily new cases (30,040) decreased 16.6% compared with the previous 7-day moving average (36,010). A total of 79,486,762 COVID-19 cases have been reported in the United States as of March 16, 2022.

Currently two variants, Omicron and Delta, are classified as Variants of Concern (VOC) in the United States. CDC Nowcast projections* for the week ending March 12, 2022, estimate the combined national proportion of lineages designated as Omicron to be 100%. There are five lineages designated as Omicron: B.1.1.529, BA.1, BA.1.1, BA.2, and BA.3. COVID Data Tracker shows the proportions of the B.1.1.529 lineage (includes BA.1 and BA.3), the BA.1.1** lineage, and the BA.2 lineage. The predominant Omicron lineage in the United States is BA.1.1. The national proportion of BA.1.1 is projected to be 66.1% (95% PI 60.6-71.1%). B.1.1.529 (BA.1 and BA.3) is projected to be 10.8% (95% PI 9.1-12.8%) and BA.2 is projected to be 23.1% (95% PI 18.6-28.3%). Delta is projected to continue to be 0.0% (95% PI 0.0-0.0%). Omicron is predicted to be 100% in all HHS regions.

79,486,762
Total Cases Reported

30,040
Current 7-Day Average**

36,010
Prior 7-Day Average

-16.6%
Change in 7-Day Average since Prior Week

*The median time from specimen collection to sequence data reporting is about 3 weeks. As a result, weighted estimates for the most recent few weeks may be unstable or unavailable. CDC’s Nowcast is a data projection tool that helps fill this gap by generating timely estimates of variant proportions for variants that are circulating in the United States. View Nowcast estimates on CDC’s COVID Data Tracker website on the Variant Proportions page.

**For national data, the proportion of BA.1.1 is shown separately. For regional data, the proportion of BA.1.1 is also aggregated with B.1.1.529.

***Historical cases are excluded from daily new cases and 7-day average calculations until they are incorporated into the dataset for the applicable date. Of 482,816 historical cases reported retroactively, 23,220 were reported in the current week and 8,517 were reported in the prior week.

Daily Trends in COVID-19 Cases in the United States Reported to CDC
red-line.jpg
wAAACH5BAEKAAAALAAAAAABAAEAAAICRAEAOw==

7-Day moving average
Cases_031822.PNG
wAAACH5BAEKAAAALAAAAAABAAEAAAICRAEAOw==

resize iconView Larger
More Case Data

Vaccinations


The U.S. COVID-19 Vaccination Program began December 14, 2020. As of March 16, 2022, 557.6 million vaccine doses have been administered in the United States. Overall, about 254.8 million people, or 76.7% of the total U.S. population, have received at least one dose of vaccine. About 216.8 million people, or 65.3% of the total U.S. population, have been fully vaccinated.* About 96.2 million additional or booster doses have been reported in people who have been fully vaccinated; however, 49.9% of the total booster-eligible population has not yet received a booster dose. As of March 16, 2022, the 7-day average number of administered vaccine doses reported (by date of CDC report) to CDC per day was 249,521, a 17.6% decrease from the previous week.

CDC’s COVID Data Tracker Vaccination Demographic Trends tab shows vaccination trends by age group and by race/ethnicity. As of March 16, 2022, 95.0% of people ages 65 years or older have received at least one dose of vaccine and 88.9% are fully vaccinated. For people ages 5–11 years, only 26.9% are fully vaccinated. For people ages 5 years or older, 81.6% have received at least one dose of vaccine and 69.4% are fully vaccinated. Of the fully vaccinated population, people ages 75 years or older have the highest proportion of additional/booster doses (69.1%) while people ages 12–17 have the lowest proportion (22.5%).

As of March 16, 2022, of all race/ethnicity groups, the Asian non-Hispanic population has the highest proportion that is fully vaccinated (60.2%), and the Black non-Hispanic population has the lowest proportion that is fully vaccinated (41.1%). Of the fully vaccinated population, the Asian non-Hispanic population has the highest proportion of additional/booster doses (66.9%), while the Hispanic/Latino population has the lowest proportion (40.1%).

COVID Data Tracker’s COVID-19 Vaccination Equity tab shows vaccination trends by urban/rural status. As of March 16, 2022, 48.8% of people in rural counties are fully vaccinated, while the range of vaccination coverage in the 4 urban/metro counties ranged from 52.7% (micropolitan) to 66.6% (large central metro).

557,644,629
Vaccine Doses Administered

254,750,626
People who received at least one dose

216,829,829
People who are fully vaccinated*

76.7%
Percentage of the U.S. population that has received at least one dose

65.3%
Percentage of the U.S. population that has been fully vaccinated*

+0.1
Percentage point increase from last week

+0.1
Percentage point increase from last week

*Represents the number of people who have received the second dose in a two-dose COVID-19 vaccine series (such as the Pfizer-BioNTech or Moderna vaccines) or one dose of the single-shot Johnson & Johnson’s Janssen vaccine.

Daily Change in the Total Number of Administered COVID-19 Vaccine Doses Reported to CDC by the Date of CDC Report, United States
red-line.jpg
wAAACH5BAEKAAAALAAAAAABAAEAAAICRAEAOw==

7-Day moving average
vaccinations_03182022.jpg
wAAACH5BAEKAAAALAAAAAABAAEAAAICRAEAOw==

resize iconView Larger
More Vaccination Data

Hospitalizations

New Hospital Admissions


The current 7-day daily average for March 9–15, 2022, was 2,298. This is a 27.2% decrease from the prior 7-day average (3,157) from March 2–8, 2022.

4,575,344
Total New Admissions

2,298
Current 7-Day Average

3,157
Prior 7-Day Average

-27.2%
Change in 7-Day Average

The start of consistent reporting of hospital admissions data was August 1, 2020.

Daily Trends in Number of New COVID-19 Hospital Admissions in the United States
hospitalizations_03182022.jpg
wAAACH5BAEKAAAALAAAAAABAAEAAAICRAEAOw==

resize iconView Larger
New admissions are pulled from a 10 am EDT snapshot of the HHS Unified Hospital Timeseries Dataset. Due to potential reporting delays, data from the most recent 7 days, as noted in the figure above with the grey bar, should be interpreted with caution. Small shifts in historic data may also occur due to changes in the Centers for Medicare and Medicaid Services (CMS) Provider of Services file, which is used to identify the cohort of included hospitals.

More Hospital Data

COVID-NET: Trends in Hospitalization Rates in Children Ages 4 Years and Younger


CDC’s Coronavirus Disease 2019-Associated Hospitalization Surveillance Network (COVID-NET) shows that for the week ending February 26, 2022, the rate of COVID-19-associated hospitalizations for children ages 4 years and younger, who are not eligible for vaccination, is 3.8 per 100,000. The weekly rate of hospitalizations in this group has decreased from its peak of 14.8 in early January 2022. However, these rates remain elevated compared to rates observed in this age group before the start of the period of Omicron variant predominance in late December 2021.

Additional clinical and demographic information for COVID-19-associated hospitalizations among children ages 4 years and younger can be found in a new report using COVID-NET data here.

Weekly Rates of COVID-19-Associated Hospitalization among Children Ages 4 Years and Younger

COVID-NET_03172022.png
wAAACH5BAEKAAAALAAAAAABAAEAAAICRAEAOw==

resize iconView Larger
The Coronavirus Disease 2019 (COVID-19)-Associate­­d Hospitalization Surveillance Network (COVID-NET) is an additional source for hospitalization data collected through a network of more than 250 acute-care hospitals in 14 states (representing ~10% of the U.S. population). Detailed data on patient demographics, including race/ethnicity, underlying medical conditions, medical interventions, and clinical outcomes, are collected with a standardized case reporting form.
More COVID-NET Data

Deaths


The current 7-day moving average of new deaths (1,052) has decreased 11.4% compared with the previous 7-day moving average (1,188). As of March 16, 2022, a total of 965,575 COVID-19 deaths have been reported in the United States.

965,575
Total Deaths Reported

1,052
Current 7-Day Average*

1,188
Prior 7-Day Average

-11.4%
Change in 7-Day Average Since Prior Week

*Historical deaths are excluded from the daily new deaths and 7-day average calculations until they are incorporated into the dataset by their applicable date. Of 20,882 historical deaths reported retroactively, none were reported in the current week; and none were reported in the prior week.

Daily Trends in Number of COVID-19 Deaths in the United States Reported to CDC
red-line.jpg
wAAACH5BAEKAAAALAAAAAABAAEAAAICRAEAOw==

7-Day moving average
deaths_03182022.jpg
wAAACH5BAEKAAAALAAAAAABAAEAAAICRAEAOw==

resize iconView Larger
More Death Data

Testing


The percentage of COVID-19 NAATs (nucleic acid amplification tests)* that are positive (percent positivity) is decreasing in comparison to the previous week. The 7-day average of percent positivity from NAATs is now 2.2%. The 7-day average number of tests reported for March 4–10, 2022, was 858,144 down 11.2% from 966,600 for the prior 7 days.

834,241,390
Total Tests Reported

858,144
7-Day Average Tests Reported

2.2%
7-Day Average % Positivity

2.8%
Previous 7-Day Average % Positivity

-0.59
Percentage point change in 7-Day Average % Positivity since Prior Week

*Test for SARS-CoV-2, the virus that causes COVID-19

COVID-19 NAAT Laboratory Test 7-day Percent Positivity by State/Territory
testing_03182022.jpg
wAAACH5BAEKAAAALAAAAAABAAEAAAICRAEAOw==


https://www.cdc.gov/coronavirus/2019-ncov/covid-data/covidview/index.html
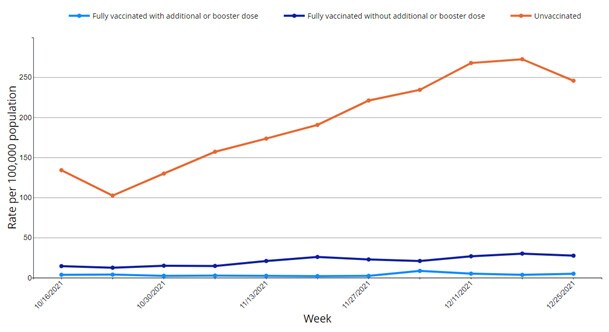
 
covid-tracker-header-lrg.jpg

Print
Subscribe to the Weekly Review


Interpretive Summary for March 25, 2022
Signals in Sewage


resize iconView Larger
In February, CDC’s COVID Data Tracker released a Wastewater Surveillance tab, which tracks changes and detections of SARS-CoV-2 viral RNA levels at more than 600 testing sites across the country. Because many people with COVID-19 shed the virus in their feces, wastewater testing can help us monitor COVID-19 in communities. Virus levels in wastewater usually increase four to six days before clinical cases increase, so surveillance results can help communities act quickly to prevent the spread of COVID-19.

Currently, virus levels in wastewater are relatively low across the country. More than half of all sites reporting wastewater data are experiencing a decrease in SARS-CoV-2 levels, but some have reported a modest uptick. These upticks may reflect minor increases from very low levels to levels that are still low. It’s important to note that even a small increase when levels are very low can appear like a dramatic increase in the percent change. However, there is a possibility that some communities might start to see an increase in COVID-19 cases. This could happen for a variety of reasons, like waning immunity, new circulating strains, and eased prevention strategies.

Right now, it’s too early to know if we’ll see a corresponding increase in reported cases across the country. Wastewater data are meant to be used with other COVID-19 surveillance data. CDC encourages local public health officials to watch for sustained increasing levels of the virus in wastewater, and to use wastewater surveillance data with other kinds of data to inform their decisions. CDC continues to encourage people to use COVID-19 Community Levels to find out what actions they should take to protect themselves and others. The whole community can be safe only when we all take steps to protect each other.


What's New

Reported Cases


As of March 23, 2022, the current 7-day moving average of daily new cases (27,134) decreased 5.4% compared with the previous 7-day moving average (28,695). A total of 79,696,994 COVID-19 cases have been reported in the United States as of March 23, 2022.

CDC Nowcast projections* for the week ending March 19, 2022, estimate the combined national proportion of lineages designated as Omicron to be 100%. There are five lineages designated as Omicron: B.1.1.529, BA.1, BA.1.1, BA.2, and BA.3. COVID Data Tracker shows the proportions of the B.1.1.529 lineage (includes BA.1 and BA.3), the BA.1.1** lineage, and the BA.2 lineage. The predominant Omicron lineage in the United States is BA.1.1. The national proportion of BA.1.1 is projected to be 57.3% (95% PI 51.8-62.6%). B.1.1.529 (BA.1 and BA.3) is projected to be 7.9% (95% PI 6.6-9.3%) and BA.2 is projected to be 34.9% (95% PI 29.6-40.4). Omicron is predicted to be 100% in all HHS regions.

79,696,994
Total Cases Reported

27,134
Current 7-Day Average**

28,695
Prior 7-Day Average

-5.4%
Change in 7-Day Average since Prior Week

*The median time from specimen collection to sequence data reporting is about 3 weeks. As a result, weighted estimates for the most recent few weeks may be unstable or unavailable. CDC’s Nowcast is a data projection tool that helps fill this gap by generating timely estimates of variant proportions for variants that are circulating in the United States. View Nowcast estimates on CDC’s COVID Data Tracker website on the Variant Proportions page.

**For national data, the proportion of BA.1.1 is shown separately. For regional data, the proportion of BA.1.1 is also aggregated with B.1.1.529.

***Historical cases are excluded from daily new cases and 7-day average calculations until they are incorporated into the dataset for the applicable date. Of 486,183 historical cases reported retroactively, 10,468 were reported in the current week and 22,904 were reported in the prior week.

Daily Trends in COVID-19 Cases in the United States Reported to CDC
red-line.jpg

7-Day moving average

resize iconView Larger
More Case Data

Vaccinations


The U.S. COVID-19 Vaccination Program began December 14, 2020. As of March 23, 2022, 558.9 million vaccine doses have been administered in the United States. Overall, about 255.0 million people, or 76.8% of the total U.S. population, have received at least one dose of vaccine. About 217.2 million people, or 65.4% of the total U.S. population, have been fully vaccinated.* About 96.9 million additional or booster doses have been reported in people who have been fully vaccinated; however, 49.8% of the total booster-eligible population has not yet received a booster dose. As of March 23, 2022, the 7-day average number of administered vaccine doses reported (by date of CDC report) to CDC per day was 181,945, a 27.1% decrease from the previous week.

CDC’s COVID Data Tracker displays vaccination trends by age group, race/ethnicity, and urban/rural status. To see trends by age group and race/ethnicity, visit the Vaccination Demographic Trends tab. To see trends by urban/rural status, visit the COVID-19 Vaccination Equity tab.

558,918,245
Vaccine Doses Administered

255,001,325
People who received at least one dose

217,184,868
People who are fully vaccinated*

76.8%
Percentage of the U.S. population that has received at least one dose

65.4%
Percentage of the U.S. population that has been fully vaccinated*

+0.1
Percentage point increase from last week

+0.1
Percentage point increase from last week

*Represents the number of people who have received the second dose in a two-dose COVID-19 vaccine series (such as the Pfizer-BioNTech or Moderna vaccines) or one dose of the single-shot Johnson & Johnson’s Janssen vaccine.

Daily Change in the Total Number of Administered COVID-19 Vaccine Doses Reported to CDC by the Date of CDC Report, United States
red-line.jpg

7-Day moving average

resize iconView Larger
More Vaccination Data

Hospitalizations

New Hospital Admissions


The current 7-day daily average for March 16–21, 2022, was 1,827. This is a 21.0% decrease from the prior 7-day average (2,313) from March 9–15, 2022.

4,580,996
Total New Admissions

1,827
Current 7-Day Average

2,313
Prior 7-Day Average

-21.0%
Change in 7-Day Average

The start of consistent reporting of hospital admissions data was August 1, 2020.

Daily Trends in Number of New COVID-19 Hospital Admissions in the United States

resize iconView Larger
New admissions are pulled from a 10 am EDT snapshot of the HHS Unified Hospital Data – Analytic Dataset. Due to potential reporting delays, data from the most recent 7 days, as noted in the figure above with the grey bar, should be interpreted with caution. Small shifts in historic data may also occur due to changes in the Centers for Medicare & Medicaid Services (CMS) Provider of Services file, which is used to identify the cohort of included hospitals.

More Hospital Data

COVID-NET: Trends in Hospitalization Rates in Children Ages 5–11 Years


CDC’s Coronavirus Disease 2019-Associated Hospitalization Surveillance Network (COVID-NET) shows that for the week ending March 5, the rate of COVID-19-associated hospitalizations for children ages 5–11 years is 0.5 per 100,000 children. The weekly rate of hospitalizations in this group has decreased from its peak of 2.8 per 100,000 children for the week ending January 15, 2022. However, this weekly rate remains elevated compared to the rates observed in this age group before the start of the period of Delta variant predominance in July 2021.

Weekly Rates of COVID-19-Associated Hospitalization among Children Ages 5–11 Years


resize iconView Larger
The Coronavirus Disease 2019 (COVID-19)-Associate­­d Hospitalization Surveillance Network (COVID-NET) is an additional source for hospitalization data collected through a network of more than 250 acute-care hospitals in 14 states (representing ~10% of the U.S. population). Detailed data on patient demographics, including race/ethnicity, underlying medical conditions, medical interventions, and clinical outcomes, are collected with a standardized case reporting form.
More COVID-NET Data

Deaths


The current 7-day moving average of new deaths (749) has decreased 29.5% compared with the previous 7-day moving average (1,063). As of March 23, 2022, a total of 972,550 COVID-19 deaths have been reported in the United States.*

972,550*
Total Deaths Reported

749
Current 7-Day Average*

1,063
Prior 7-Day Average

-29.5%
Change in 7-Day Average Since Prior Week

*CDC constantly reviews our COVID-19 data to ensure its accuracy. An adjustment was made to COVID Data Tracker’s mortality data on March 14 because CDC’s algorithm was misclassifying deaths that were not COVID-19-related. That algorithm has since been corrected.

It’s important to note that there are two sets of COVID-19 death data that CDC displays publicly, one through COVID Data Tracker and another through our National Center for Health Statistics (NCHS). Death data on the COVID Data Tracker are real-time and subject to change. NCHS’s National Vital Statistics System is the most complete source of death data, including COVID-19 deaths, as they have a robust and rigorous process for reviewing death certificates in determining the official cause of death. More information about NCHS mortality data can be found here: Understanding the Numbers: Provisional Death Counts and COVID-19 (cdc.gov)pdf icon.

**Historical deaths are excluded from the daily new deaths and 7-day average calculations until they are incorporated into the dataset by their applicable date. Of 20,744 historical deaths reported retroactively, none were reported in the current week; and none were reported in the prior week.

Daily Trends in Number of COVID-19 Deaths in the United States Reported to CDC
red-line.jpg

7-Day moving average

resize iconView Larger
More Death Data

Testing


The percentage of COVID-19 NAATs (nucleic acid amplification tests)* that are positive (percent positivity) is stable in comparison to the previous week. The 7-day average of percent positivity from NAATs is now 2.2%. The 7-day average number of tests reported for March 11–17, 2022, was 870,175, down 0.4% from 873,940 for the prior 7 days.

840,793,567
Total Tests Reported

870,175
7-Day Average Tests Reported

2.2%
7-Day Average % Positivity

2.2%
Previous 7-Day Average % Positivity

-0.02
Percentage point change in 7-Day Average % Positivity since Prior Week

*Test for SARS-CoV-2, the virus that causes COVID-19

COVID-19 NAAT Laboratory Test 7-day Percent Positivity by State/Territory


https://www.cdc.gov/coronavirus/2019-ncov/covid-data/covidview/index.html
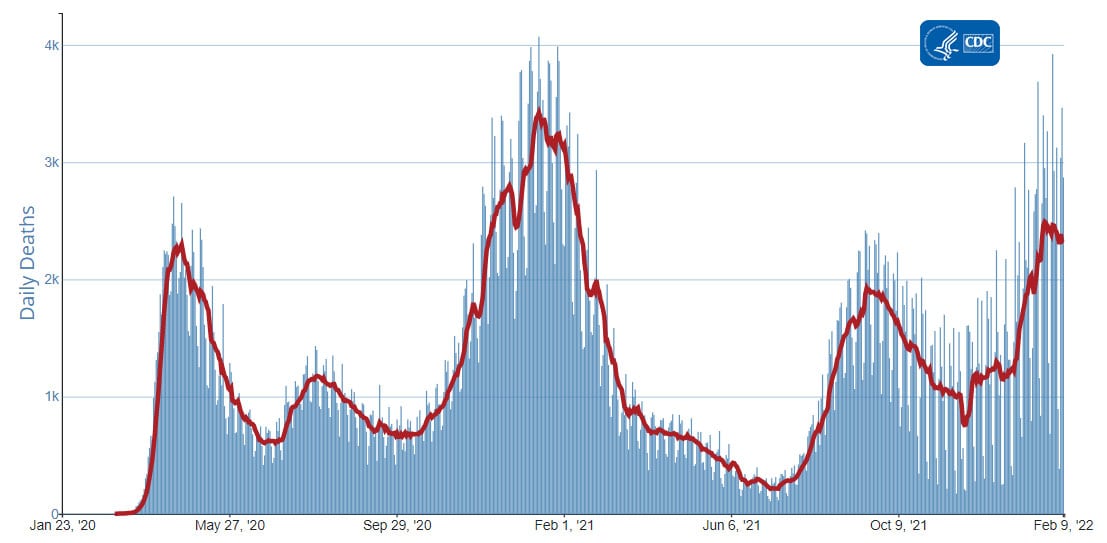
 
covid-tracker-header-lrg.jpg

Print
Subscribe to the Weekly Review


Interpretive Summary for April 1, 2022
Added Protection


resize iconView Larger
As the country emerges from the Omicron surge—and we experience low COVID-19 Community levels in most parts of the country—CDC has updated its COVID-19 vaccination guidance to give some people the option to get a second mRNA COVID-19 booster dose (Pfizer-BioNTech or Moderna). You can now receive a second booster dose if you:
COVID-19 vaccines continue to offer high levels of protection against severe disease, hospitalization, and death—especially for people who are boosted. During the recent Omicron surge, people who were boosted were 21 times less likely to die from COVID-19 compared to those who were unvaccinated, and 7 times less likely to be hospitalized. If you’re interested in getting a second booster, find a vaccine now.

*A recent CDC study found that adults who received the J&J/Janssen COVID-19 vaccine as both their primary dose and booster dose had lower levels of protection against COVID-19-associated hospitalizations, as well as emergency department and urgent care visits, during Omicron compared to adults who received an mRNA COVID-19 vaccine booster dose. As such, they may benefit from an mRNA COVID-19 vaccine booster dose and are now eligible to receive one.


What's New

COVID-19 Community Levels


On February 25, 2022, CDC updated the way it monitors COVID-19’s impact on our communities. Widespread availability of vaccines and testing, advances in treatments, and increasing levels of immunity in the population through vaccination or previous infection have moved the COVID-19 pandemic to a new phase. While we can’t prevent all cases of COVID-19, we can continue to limit the spread and protect those who are most at risk of severe illness.

Currently, there are 19 (0.59%) counties with a high COVID-19 Community Level, 146 (4.53%) counties with a medium Community Level, and 3,059 (94.88%) counties with a low Community Level. This represents a slight (−0.84%) decrease in the number of high-level counties, a moderate (−2.73%) decrease in the number of medium-level counties, and a corresponding (+3.57%) increase in the number of low-level counties. Twenty-seven (48.21%) of 56 jurisdictions had no high- or medium-level counties this week.

To check your COVID-19 community level, visit COVID Data Tracker.

U.S. COVID-19 Community Levels by County

resize iconView Larger
COVID19-Community-Levels_2_04012022.jpg

COVID-19 Community Levels

Reported Cases


As of March 30, 2022, the current 7-day moving average of daily new cases (25,732) decreased 3.0% compared with the previous 7-day moving average (26,518). A total of 79,904,464 COVID-19 cases have been reported in the United States as of March 30, 2022.

CDC Nowcast projections* for the week ending March 26, 2022, estimate the combined national proportion of lineages designated as Omicron to be 100%. There are five lineages designated as Omicron: B.1.1.529, BA.1, BA.1.1, BA.2, and BA.3. COVID Data Tracker shows the proportions of the B.1.1.529 lineage (includes BA.1 and BA.3), the BA.1.1** lineage, and the BA.2 lineage. The predominant Omicron lineage in the United States is BA.2. The national proportion of BA.2 is projected to be 54.9% (95% PI 50.8-59.1%). BA.1.1 is projected to be 40.4% (95% PI 36.4-44.5%) and B.1.1.529 (BA.1 and BA.3) is projected to be 4.7% (95% PI 3.9-5.7%). Omicron is predicted to be 100% in all HHS regions.

79,904,464
Total Cases Reported

25,732
Current 7-Day Average**

26,518
Prior 7-Day Average

-3.0%
Change in 7-Day Average since Prior Week

*The median time from specimen collection to sequence data reporting is about 3 weeks. As a result, weighted estimates for the most recent few weeks may be unstable or unavailable. CDC’s Nowcast is a data projection tool that helps fill this gap by generating timely estimates of variant proportions for variants that are circulating in the United States. View Nowcast estimates on CDC’s COVID Data Tracker website on the Variant Proportions page.

**For national data, the proportion of BA.1.1 is shown separately. For regional data, the proportion of BA.1.1 is also aggregated with B.1.1.529.

***Historical cases are excluded from daily new cases and 7-day average calculations until they are incorporated into the dataset for the applicable date. Of 504,648 historical cases reported retroactively, 18,610 were reported in the current week and 10,468 were reported in the prior week.

Daily Trends in COVID-19 Cases in the United States Reported to CDC
red-line.jpg

7-Day moving average

resize iconView Larger
More Case Data

Vaccinations


The U.S. COVID-19 Vaccination Program began December 14, 2020. As of March 30, 2022, 560.4 million vaccine doses have been administered in the United States. Overall, about 255.4 million people, or 76.9% of the total U.S. population, have received at least one dose of vaccine. About 217.6 million people, or 65.5% of the total U.S. population, have been fully vaccinated.* About 97.5 million additional or booster doses have been reported in people who have been fully vaccinated; however, 49.8% of the total booster-eligible population has not yet received a booster dose. As of March 30, 2022, the 7-day average number of administered vaccine doses reported (by date of CDC report) to CDC per day was 214,405, a 17.8% increase from the previous week.

CDC’s COVID Data Tracker displays vaccination trends by age group, race/ethnicity, and urban/rural status. To see trends by age group and race/ethnicity, visit the Vaccination Demographic Trends tab. To see trends by urban/rural status, visit the COVID-19 Vaccination Equity tab.

560,419,082
Vaccine Doses Administered

255,428,475
People who received at least one dose

217,556,439
People who are fully vaccinated*

76.9%
Percentage of the U.S. population that has received at least one dose

65.5%
Percentage of the U.S. population that has been fully vaccinated*

+0.1
Percentage point increase from last week

+0.1
Percentage point increase from last week

*Represents the number of people who have received the second dose in a two-dose COVID-19 vaccine series (such as the Pfizer-BioNTech or Moderna vaccines) or one dose of the single-shot Johnson & Johnson’s Janssen vaccine.

Daily Change in the Total Number of Administered COVID-19 Vaccine Doses Reported to CDC by the Date of CDC Report, United States
red-line.jpg

7-Day moving average

resize iconView Larger
More Vaccination Data

Hospitalizations

New Hospital Admissions


The current 7-day daily average for March 23–29, 2022, was 1,564. This is a 15.8% decrease from the prior 7-day average (1,858) from March 16–22, 2022.

4,592,164
Total New Admissions

1,564
Current 7-Day Average

1,858
Prior 7-Day Average

-15.8%
Change in 7-Day Average

The start of consistent reporting of hospital admissions data was August 1, 2020.

Daily Trends in Number of New COVID-19 Hospital Admissions in the United States

resize iconView Larger
New admissions are pulled from a 10 am EDT snapshot of the HHS Unified Hospital Data – Analytic Dataset. Due to potential reporting delays, data from the most recent 7 days, as noted in the figure above with the grey bar, should be interpreted with caution. Small shifts in historic data may also occur due to changes in the Centers for Medicare & Medicaid Services (CMS) Provider of Services file, which is used to identify the cohort of included hospitals.

More Hospital Data

COVID-NET: Hospitalization Rates by Vaccination Status in Adults Ages ≥50 Years


CDC’s Coronavirus Disease 2019-Associated Hospitalization Surveillance Network (COVID-NET) shows that rates of COVID-19-associated hospitalizations in February 2022 were higher in unvaccinated adults compared to adults who received a primary vaccination series plus a booster or additional dose of a COVID-19 vaccine. In February, among adults ages 50–64 years, the COVID-19-associated hospitalization rate among unvaccinated people was 7 times higher than among those who received a booster or additional dose. Among adults ages 65 years and older, the COVID-19-associated hospitalization rate among unvaccinated people was 9 times higher than among those who received a booster or additional dose.

Rates of COVID-19-Associated Hospitalizations by Vaccination Status in Adults Ages ≥65 Years, October 2021–February 2022

COVIDNET_04012022.jpg

resize iconView Larger
The Coronavirus Disease 2019 (COVID-19)-Associate­­d Hospitalization Surveillance Network (COVID-NET) is an additional source for hospitalization data collected through a network of more than 250 acute-care hospitals in 14 states (representing ~10% of the U.S. population). Detailed data on patient demographics, including race/ethnicity, underlying medical conditions, medical interventions, and clinical outcomes, are collected with a standardized case reporting form.
More COVID-NET Data

Deaths


The current 7-day moving average of new deaths (627) has decreased 14.4% compared with the previous 7-day moving average (732). As of March 30, 2022, a total of 977,495 COVID-19 deaths have been reported in the United States.

977,495
Total Deaths Reported

627
Current 7-Day Average*

732
Prior 7-Day Average

-14.4%
Change in 7-Day Average Since Prior Week

*Historical deaths are excluded from the daily new deaths and 7-day average calculations until they are incorporated into the dataset by their applicable date. Of 20,744 historical deaths reported retroactively, none were reported in the current week; and none were reported in the prior week.

Daily Trends in Number of COVID-19 Deaths in the United States Reported to CDC
red-line.jpg

7-Day moving average

resize iconView Larger
More Death Data

Testing


The percentage of COVID-19 NAATs (nucleic acid amplification tests)* that are positive (percent positivity) is increasing in comparison to the previous week. The 7-day average of percent positivity from NAATs is now 2.4%. The 7-day average number of tests reported for March 18-24, 2022, was 828,775, down 5.9% from 880,869 for the prior 7 days.

847,101,104
Total Tests Reported

828,775
7-Day Average Tests Reported

2.4%
7-Day Average % Positivity

2.2%
Previous 7-Day Average % Positivity

+0.23
Percentage point change in 7-Day Average % Positivity since Prior Week

*Test for SARS-CoV-2, the virus that causes COVID-19

COVID-19 NAAT Laboratory Test 7-day Percent Positivity by State/Territory


https://www.cdc.gov/coronavirus/2019-ncov/covid-data/covidview/
 
covid-tracker-header-lrg.jpg

Print
Subscribe to the Weekly Review


Interpretive Summary for April 8, 2022
Vaccines Protect Children


resize iconView Larger
The United States has made tremendous progress in the fight against COVID-19. Cases, hospitalizations, and deaths continue to decline across the country, and millions of people are at much lower risk of getting very sick from COVID-19.

As of April 6, 2022, 22.8 million children and adolescents ages 5–17 years have received their primary series of a COVID-19 vaccine and are considered fully vaccinated. Approximately 23.7% of fully vaccinated adolescents ages 12–17 years have also received a booster dose, which provides the best protection against severe COVID-19.* Recent studies show that vaccination continues to protect children and adolescents against emergency department/urgent care visits, hospitalizations, and death associated with the Omicron variant.

But vaccination rates remain low among children ages 5–11 years, leaving them more vulnerable to serious disease. Cases, hospitalizations, and deaths are decreasing right now, but there is still ongoing community transmission. While children have a lower risk for severe COVID-19 compared to older adults, they can still get it, spread the virus to others, and become seriously ill—and there is no way to tell in advance which child will get a mild or severe case.

COVID-19 vaccines have undergone—and continue to undergo—the most intensive safety monitoring in U.S. history, and adverse events are rare. Vaccinating children is the single best way to protect them from severe illness associated with COVID-19. Find a vaccine provider near you at vaccines.gov.

*People ages 12 years and older who are moderately or severely immunocompromised have specific COVID-19 vaccine recommendations, including recommendations for a booster dose. Learn more about COVID-19 vaccine recommendations for people who are moderately or severely immunocompromised.


What's New

COVID-19 Community Levels


On February 25, 2022, CDC updated the way it monitors COVID-19’s impact on our communities. Widespread availability of vaccines and testing, advances in treatments, and increasing levels of immunity in the population through vaccination or previous infection have moved the COVID-19 pandemic to a new phase. While we can’t prevent all cases of COVID-19, we can continue to limit the spread and protect those who are most at risk of severe illness.

Currently, there are 18 (0.56%) counties with a high COVID-19 Community Level, 122 (3.79%) counties with a medium Community Level, and 3,080 (95.65%) counties with a low Community Level. This represents a very slight (0.16%) increase in the number of high-level counties, a small (−0.75%) decrease in the number of medium-level counties, and a corresponding (+0.59%) increase in the number of low-level counties. Twenty-one (40.38%) of 52 jurisdictions had no high- or medium-level counties this week.

To check your COVID-19 community level, visit COVID Data Tracker.

U.S. COVID-19 Community Levels by County

resize iconView Larger
COVID19-Community-Levels_2_04012022.jpg

COVID-19 Community Levels

Reported Cases


As of April 6, 2022, the current 7-day moving average of daily new cases (26,596) increased 4.9% compared with the previous 7-day moving average (25,363). A total of 80,111,065 COVID-19 cases have been reported in the United States as of April 6, 2022.

CDC Nowcast projections* for the week ending April 2, 2022, estimate the combined national proportion of lineages designated as Omicron to be 100%. There are five lineages designated as Omicron: B.1.1.529, BA.1, BA.1.1, BA.2, and BA.3. COVID Data Tracker shows the proportions of the B.1.1.529 lineage (includes BA.1 and BA.3), the BA.1.1** lineage, and the BA.2 lineage. The predominant Omicron lineage in the United States is BA.2. The national proportion of BA.2 is projected to be 72.2% (95% PI 68.1-75.9%). BA.1.1 is projected to be 25.3% (95% PI 21.9-29.1%) and B.1.1.529 (BA.1 and BA.3) is projected to be 2.5% (95% PI 2.0-3.2%). Omicron is predicted to be 100% in all HHS regions.

80,111,065
Total Cases Reported

26,596
Current 7-Day Average**

25,363
Prior 7-Day Average

4.9%
Change in 7-Day Average since Prior Week

*The median time from specimen collection to sequence data reporting is about 3 weeks. As a result, weighted estimates for the most recent few weeks may be unstable or unavailable. CDC’s Nowcast is a data projection tool that helps fill this gap by generating timely estimates of variant proportions for variants that are circulating in the United States. View Nowcast estimates on CDC’s COVID Data Tracker website on the Variant Proportions page.

**For national data, the proportion of BA.1.1 is shown separately. For regional data, the proportion of BA.1.1 is also aggregated with B.1.1.529.

***Historical cases are excluded from daily new cases and 7-day average calculations until they are incorporated into the dataset for the applicable date. Of 517,338 historical cases reported retroactively, 12,690 were reported in the current week and 18,610 were reported in the prior week.

Daily Trends in COVID-19 Cases in the United States Reported to CDC
red-line.jpg

7-Day moving average

resize iconView Larger
More Case Data

Vaccinations


The U.S. COVID-19 Vaccination Program began December 14, 2020. As of April 6, 2022, 563.4 million vaccine doses have been administered in the United States. Overall, about 255.9 million people, or 77.1% of the total U.S. population, have received at least one dose of vaccine. About 218.0 million people, or 65.7% of the total U.S. population, have been fully vaccinated.* Of those fully vaccinated, about 98.3 million people have received a booster dose,** but 49.7% of the total booster-eligible population has not yet received a booster dose. As of April 6, 2022, the 7-day average number of administered vaccine doses reported (by date of CDC report) to CDC per day was 424,670, a 98.1% increase from the previous week.

CDC’s COVID Data Tracker displays vaccination trends by age group, race/ethnicity, and urban/rural status. To see trends by age group and race/ethnicity, visit the Vaccination Demographic Trends tab. To see trends by urban/rural status, visit the COVID-19 Vaccination Equity tab.

563,391,773
Vaccine Doses Administered

255,873,739
People who received at least one dose

218,043,500
People who are fully vaccinated*

77.1%
Percentage of the U.S. population that has received at least one dose

65.7%
Percentage of the U.S. population that has been fully vaccinated*

+0.2
Percentage point increase from last week

+0.2
Percentage point increase from last week

*Represents the number of people who have received the second dose in a two-dose COVID-19 vaccine series (such as the Pfizer-BioNTech or Moderna vaccines) or one dose of the single-shot Johnson & Johnson’s Janssen vaccine.

**Represents the number of people who are fully vaccinated and have received another dose of COVID-19 vaccine since August 13, 2021. This includes people who received their first additional dose or booster dose.

Daily Change in the Total Number of Administered COVID-19 Vaccine Doses Reported to CDC by the Date of CDC Report, United States
red-line.jpg

7-Day moving average

resize iconView Larger
More Vaccination Data

Hospitalizations

New Hospital Admissions


The current 7-day daily average for March 30–April 5, 2022, was 1,406. This is a 10.3% decrease from the prior 7-day average (1,567) from March 23–29, 2022.

4,602,171
Total New Admissions

1,406
Current 7-Day Average

1,567
Prior 7-Day Average

-10.3%
Change in 7-Day Average

The start of consistent reporting of hospital admissions data was August 1, 2020.

Daily Trends in Number of New COVID-19 Hospital Admissions in the United States

resize iconView Larger
New admissions are pulled from a 10 am EDT snapshot of the HHS Unified Hospital Data – Analytic Dataset. Due to potential reporting delays, data from the most recent 7 days, as noted in the figure above with the grey bar, should be interpreted with caution. Small shifts in historic data may also occur due to changes in the Centers for Medicare & Medicaid Services (CMS) Provider of Services file, which is used to identify the cohort of included hospitals.

More Hospital Data

COVID-NET: Hospitalization Rates by Vaccination Status in Adolescents Ages 12–17 Years


CDC’s Coronavirus Disease 2019-Associated Hospitalization Surveillance Network (COVID-NET) shows that rates of COVID-19-associated hospitalizations in February 2022 were 2.2 times as high among unvaccinated adolescents ages 12–17 years compared to adolescents who received a primary vaccination series plus a booster or additional dose of COVID-19 vaccine.*

*Compared to older age groups, adolescents ages 12–17 years have very low rates of hospitalization for any vaccination status. As a result, hospitalization rates by vaccination status for this age group might have more week-to-week variability due to small sample sizes.

Rates of COVID-19-Associated Hospitalizations by Vaccination Status in Adolescents Ages 12–17 Years, February 2022


resize iconView Larger
The Coronavirus Disease 2019 (COVID-19)-Associated Hospitalization Surveillance Network (COVID-NET) is an additional source for hospitalization data collected through a network of more than 250 acute-care hospitals in 14 states (representing ~10% of the U.S. population). Detailed data on patient demographics, including race/ethnicity, underlying medical conditions, medical interventions, and clinical outcomes, are collected using a standardized case reporting form.
More COVID-NET Data

Deaths


The current 7-day moving average of new deaths (497) has decreased 22.1% compared with the previous 7-day moving average (638). As of April 6, 2022, a total of 981,197 COVID-19 deaths have been reported in the United States.

981,197
Total Deaths Reported

497
Current 7-Day Average*

638
Prior 7-Day Average

-22.1%
Change in 7-Day Average Since Prior Week

*Historical deaths are excluded from the daily new deaths and 7-day average calculations until they are incorporated into the dataset by their applicable date. Of 20,744 historical deaths reported retroactively, none were reported in the current week; and none were reported in the prior week.

Daily Trends in Number of COVID-19 Deaths in the United States Reported to CDC
red-line.jpg

7-Day moving average

resize iconView Larger
More Death Data

Testing


The percentage of COVID-19 NAATs (nucleic acid amplification tests)* that are positive (percent positivity) is increasing in comparison to the previous week. The 7-day average of percent positivity from NAATs is now 3.1%. The 7-day average number of tests reported for March 25-31, 2022, was 716,261, down 14.6% from 839,037 for the prior 7 days.

852,074,657
Total Tests Reported

716,261
7-Day Average Tests Reported

3.1%
7-Day Average % Positivity

2.4%
Previous 7-Day Average % Positivity

+0.69
Percentage point change in 7-Day Average % Positivity since Prior Week

*Test for SARS-CoV-2, the virus that causes COVID-19

COVID-19 NAAT Laboratory Test 7-day Percent Positivity by State/Territory

resize iconView Larger
More Testing Data
Top of Page
Content source: National Center for Immunization and Respiratory Diseases (NCIRD), Division of Viral Diseases

https://www.cdc.gov/coronavirus/2019-ncov/covid-data/covidview/
 
covid-tracker-header-lrg.jpg

Print
Subscribe to the Weekly Review


Interpretive Summary for April 15, 2022
Get a Jump on Spring


resize iconView Larger
Throughout the COVID-19 pandemic, many people have delayed or avoided medical care, including routine, urgent, and emergency care. If it’s something you’ve neglected, it’s time to jump back in—consider putting “get a checkup” on top of your to-do list, especially if you’re at risk for heart disease. Regular checkups provide the opportunity to prevent, screen for, and manage chronic conditions, and to get routine vaccinations.

Nearly one million people in the United States have died from COVID-19. People who have heart conditions are more likely to get very sick from COVID-19, and cardiovascular disease is still the leading cause of death in the country. Deaths from cardiovascular diseaseexternal icon have increased during the pandemic.

In addition to seeing your healthcare provider, explore ways to improve and maintain heart health, today and every day. Consider eating a healthy diet, being active, getting enough sleep, avoiding tobacco and excessive drinking, and learning to cope with stress in a healthy way. Simple activities like deep breathing, physical activity, and safely connecting with family, friends, and neighbors can also improve your general well-being and outlook on life. And as always, we encourage everyone to stay up to date on their COVID-19 vaccinations.

*People ages 12 years and older who are moderately or severely immunocompromised have specific COVID-19 vaccine recommendations, including recommendations for a booster dose. Learn more about COVID-19 vaccine recommendations for people who are moderately or severely immunocompromised.


What's New

COVID-19 Community Levels


On February 25, 2022, CDC updated the way it monitors COVID-19’s impact on our communities. Widespread availability of vaccines and testing, advances in treatments, and increasing levels of immunity in the population through vaccination or previous infection have moved the COVID-19 pandemic to a new phase. While we can’t prevent all cases of COVID-19, we can continue to limit the spread and protect those who are most at risk of severe illness.

Currently, there are 14 (0.43%) counties, districts, or territories with a high COVID-19 Community Level, 175 (5.43%) counties with a medium Community Level, and 3,035 (94.14%) counties with a low Community Level. This represents a very slight (−0.19%) decrease in the number of high-level counties, a small (+1.55%) increase in the number of medium-level counties, and a corresponding (−1.36%) decrease in the number of low-level counties. Twenty-two (39.28%) of 56 jurisdictions had no high- or medium-level counties this week.

To check your COVID-19 community level, visit COVID Data Tracker.

U.S. COVID-19 Community Levels by County

resize iconView Larger
COVID19-Community-Levels_2_04012022.jpg

COVID-19 Community Levels

Reported Cases


As of April 13, 2022, the current 7-day moving average of daily new cases (31,391) increased 19.1% compared with the previous 7-day moving average (26,357). A total of 80,341,159 COVID-19 cases have been reported in the United States as of April 13, 2022.

CDC Nowcast projections* for the week ending April 9, 2022, estimate the combined national proportion of lineages designated as Omicron to be 100%. There are five lineages designated as Omicron: B.1.1.529, BA.1, BA.1.1, BA.2, and BA.3. COVID Data Tracker shows the proportions of the B.1.1.529 lineage (includes BA.1 and BA.3), the BA.1.1** lineage, and the BA.2 lineage. The predominant Omicron lineage in the United States is BA.2. The national proportion of BA.2 is projected to be 85.9% (95% PI 83.6-87.8%). BA.1.1 is projected to be 13.1% (95% PI 11.3-15.2%) and B.1.1.529 (BA.1 and BA.3) is projected to be 1.0% (95% PI 0.8-1.3%). Omicron is predicted to be 100% in all HHS regions.

80,341,159
Total Cases Reported

31,391
Current 7-Day Average***

26,357
Prior 7-Day Average

19.1%
Change in 7-Day Average since Prior Week

*The median time from specimen collection to sequence data reporting is about 3 weeks. As a result, weighted estimates for the most recent few weeks may be unstable or unavailable. CDC’s Nowcast is a data projection tool that helps fill this gap by generating timely estimates of variant proportions for variants that are circulating in the United States. View Nowcast estimates on CDC’s COVID Data Tracker website on the Variant Proportions page.

**For national data, the proportion of BA.1.1 is shown separately. For regional data, the proportion of BA.1.1 is also aggregated with B.1.1.529.

***Historical cases are excluded from daily new cases and 7-day average calculations until they are incorporated into the dataset for the applicable date. Of 521,394 historical cases reported retroactively, 4,203 were reported in the current week and 12,690 were reported in the prior week.

Daily Trends in COVID-19 Cases in the United States Reported to CDC
red-line.jpg

7-Day moving average

resize iconView Larger
More Case Data

Vaccinations


The U.S. COVID-19 Vaccination Program began December 14, 2020. As of April 13, 2022, 567.2 million vaccine doses have been administered in the United States. Overall, about 256.5 million people, or 77.3% of the total U.S. population, have received at least one dose of vaccine. About 218.6 million people, or 65.8% of the total U.S. population, have been fully vaccinated.* Of those fully vaccinated, about 99.0 million people have received a booster dose,** but 49.6% of the total booster-eligible population has not yet received a booster dose. As of April 13, 2022, the 7-day average number of administered vaccine doses reported (by date of CDC report) to CDC per day was 542,444, a 27.7% increase from the previous week.

CDC’s COVID Data Tracker displays vaccination trends by age group, race/ethnicity, and urban/rural status. To see trends by age group and race/ethnicity, visit the Vaccination Demographic Trends tab. To see trends by urban/rural status, visit the COVID-19 Vaccination Equity tab.

567,188,881
Vaccine Doses Administered

256,489,187
People who received at least one dose

218,622,907
People who are fully vaccinated*

77.3%
Percentage of the U.S. population that has received at least one dose

65.8%
Percentage of the U.S. population that has been fully vaccinated*

+0.2
Percentage point increase from last week

+0.1
Percentage point increase from last week

*Represents the number of people who have received the second dose in a two-dose COVID-19 vaccine series (such as the Pfizer-BioNTech or Moderna vaccines) or one dose of the single-shot Johnson & Johnson’s Janssen vaccine.

**Represents the number of people who are fully vaccinated and have received another dose of COVID-19 vaccine since August 13, 2021. This includes people who received their first additional dose or booster dose.

Daily Change in the Total Number of Administered COVID-19 Vaccine Doses Reported to CDC by the Date of CDC Report, United States
red-line.jpg

7-Day moving average

resize iconView Larger
More Vaccination Data

Hospitalizations

New Hospital Admissions


The current 7-day daily average for April 6–April 12, 2022, was 1,446. This is a 1.3% increase from the prior 7-day average (1,427) from March 29–April 4, 2022.

4,612,454
Total New Admissions

1,446
Current 7-Day Average

1,427
Prior 7-Day Average

+1.3%
Change in 7-Day Average

The start of consistent reporting of hospital admissions data was August 1, 2020.

Daily Trends in Number of New COVID-19 Hospital Admissions in the United States

resize iconView Larger
New admissions are pulled from a 10 am EDT snapshot of the HHS Unified Hospital Data – Analytic Dataset. Due to potential reporting delays, data from the most recent 7 days, as noted in the figure above with the grey bar, should be interpreted with caution. Small shifts in historic data may also occur due to changes in the Centers for Medicare & Medicaid Services (CMS) Provider of Services file, which is used to identify the cohort of included hospitals.

More Hospital Data

COVID-NET: Hospitalization Rates by Vaccination Status in Children Ages 5–11 Years


CDC’s Coronavirus Disease 2019-Associated Hospitalization Surveillance Network (COVID-NET) shows that rates of COVID-19-associated hospitalizations in February 2022 were 2 times as high among unvaccinated children ages 5–11 years compared to adolescents who received a COVID-19 primary vaccination series.*

*Compared to older age groups, children ages 5–11 years have very low rates of hospitalization for any vaccination status. As a result, hospitalization rates by vaccination status for this age group might have more week-to-week variability due to small sample sizes.

Rates of COVID-19-Associated Hospitalizations by Vaccination Status in Children Ages 5–11 Years, January–February 2022


resize iconView Larger
The Coronavirus Disease 2019 (COVID-19)-Associated Hospitalization Surveillance Network (COVID-NET) is an additional source for hospitalization data collected through a network of more than 250 acute-care hospitals in 14 states (representing ~10% of the U.S. population). Detailed data on patient demographics, including race/ethnicity, underlying medical conditions, medical interventions, and clinical outcomes, are collected using a standardized case reporting form.
More COVID-NET Data

Deaths


The current 7-day moving average of new deaths (409) has decreased 15.7% compared with the previous 7-day moving average (486). As of April 13, 2022, a total of 984,744 COVID-19 deaths have been reported in the United States.

984,744
Total Deaths Reported

409
Current 7-Day Average*

486
Prior 7-Day Average

-15.7%
Change in 7-Day Average Since Prior Week

*Historical deaths are excluded from the daily new deaths and 7-day average calculations until they are incorporated into the dataset by their applicable date. Of 21,064 historical deaths reported retroactively, 320 were reported in the current week; and none were reported in the prior week.

Daily Trends in Number of COVID-19 Deaths in the United States Reported to CDC
red-line.jpg

7-Day moving average

resize iconView Larger
More Death Data

Testing


The percentage of COVID-19 NAATs (nucleic acid amplification tests)* that are positive (percent positivity) is increasing in comparison to the previous week. The 7-day average of percent positivity from NAATs is now 4.1%. The 7-day average number of tests reported for April 1-7, 2022 was 684,558, down 14.6% from 801,485 for the prior 7 days.

857,920,235
Total Tests Reported

684,558
7-Day Average Tests Reported

4.1%
7-Day Average % Positivity

2.8%
Previous 7-Day Average % Positivity

+1.28
Percentage point change in 7-Day Average % Positivity since Prior Week

*Test for SARS-CoV-2, the virus that causes COVID-19

COVID-19 NAAT Laboratory Test 7-day Percent Positivity by State/Territory

resize iconView Larger
More Testing Data
Top of Page
Content source: National Center for Immunization and Respiratory Diseases (NCIRD), Division of Viral Diseases

https://www.cdc.gov/coronavirus/2019-ncov/covid-data/covidview/index.html
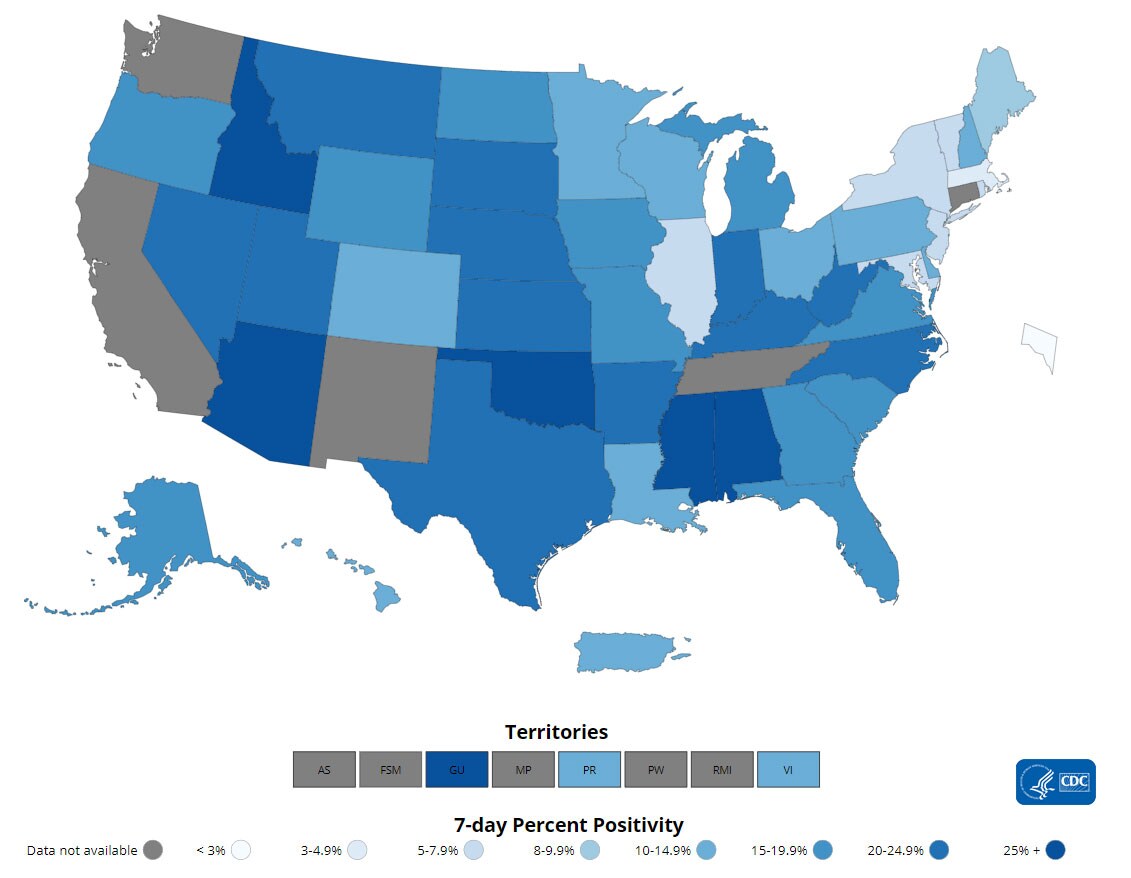
 
covid-tracker-header-lrg.jpg

Print
Subscribe to the Weekly Review


Interpretive Summary for April 22, 2022
Unpacking Variants


resize iconView Larger
Throughout the pandemic, the United States has experienced waves of different variants of SARS-CoV-2, the virus that causes COVID-19. SARS-CoV-2 is constantly changing, and new variants of the virus are expected to occur. In early 2021, the Alpha variant emerged, followed by the Delta variant later that summer. In late 2021 and throughout early 2022, the Omicron variant swept across the country and continues to be the predominant variant circulating in the United States.

In recent weeks, BA.2.12.1, an Omicron sublineage (sometimes called a “subvariant”), has emerged and is increasing in prevalence in parts of the country. Some early evidence suggests BA.2.12.1 is increasing in variant proportion faster than other Omicron sublineages. CDC is working to better understand BA.2.12.1, how it spreads, and how well existing treatments and vaccines for COVID-19 work against it.

As the virus continues to evolve, we expect to see new variants (and their many different lineages and sublineages) emerge and disappear as they compete against each other and other circulating viruses. CDC scientists closely monitor trends in variant proportions and evaluate the public health impact. While new variants may cause increases in cases, especially in localized areas, it is important to remember that we have all the tools needed to prevent COVID-19. CDC’s COVID-19 Community Levels tool can help communities and people make decisions about prevention strategies. Find your COVID-19 Community Level.

Did you know? Variants are made up of multiple lineages (or closely related groups of variants) and sublineages. Each of these variants starts with a parent lineage (for example, BA.1.1.529 for Omicron) followed by descendant lineages, which can all be arranged like a family tree. As the virus spreads, genetic mutations can accumulate and change the characteristics of the virus. Even though most mutations do not affect the characteristics of the virus, genomic surveillance systems detect and track mutations, regardless of whether they pose public health threats. To see variant proportion data, visit COVID Data Tracker.


What's New

COVID-19 Community Levels


On February 25, 2022, CDC updated the way it monitors COVID-19’s impact on our communities. Widespread availability of vaccines and testing, advances in treatments, and increasing levels of immunity in the population through vaccination or previous infection have moved the COVID-19 pandemic to a new phase. While we can’t prevent all cases of COVID-19, we can continue to limit the spread and protect those who are most at risk of severe illness.

Currently, there are 39 (1.21%) counties, districts, or territories with a high COVID-19 Community Level, 231 (7.17%) counties with a medium Community Level, and 2,954 (91.63%) counties with a low Community Level. This represents a slight (0.78%) increase in the number of high-level counties, a small (+1.67%) increase in the number of medium-level counties, and a corresponding (−2.45%) decrease in the number of low-level counties. Twenty-five (44.64%) of 56 jurisdictions had no high- or medium-level counties this week.

To check your COVID-19 community level, visit COVID Data Tracker.

U.S. COVID-19 Community Levels by County

resize iconView Larger
COVID19-Community-Levels_2_04012022.jpg

COVID-19 Community Levels

Reported Cases


As of April 20, 2022, the current 7-day moving average of daily new cases (42,605) increased 35.3% compared with the previous 7-day moving average (31,495). A total of 80,648,481 COVID-19 cases have been reported in the United States as of April 20, 2022.

CDC Nowcast projections* for the week ending April 16, 2022, estimate the combined national proportion of lineages designated as Omicron to be 100%. There are several lineages of Omicron (B.1.1.529, BA.1, BA.2, BA.3, BA.4 and BA.5), and each one has multiple sublineages. COVID Data Tracker shows the proportions of Omicron lineages grouped as follows: the B.1.1.529 lineage (includes BA.1, BA.3, BA.4 and BA.5), the BA.1.1** lineage, the BA.2 lineage, and the BA.2.12.1 lineage. The predominant Omicron lineage in the United States is BA.2. The national proportion of BA.2 is projected to be 74.4% (95% PI 68.3-79.7%). The national proportion of BA.2.12.1 is projected to be 19.0% (95% PI 13.4-26.0%). BA.1.1 is projected to be 6.1% (95% PI 5.1-7.3%) and B.1.1.529 (BA.1, BA.3, BA.4 and BA.5) is projected to be 0.5% (95% PI 0.3-0.6%). Omicron is predicted to be 100% in all HHS regions.

80,648,481
Total Cases Reported

42,605
Current 7-Day Average**

31,495
Prior 7-Day Average

35.3%
Change in 7-Day Average since Prior Week

*The median time from specimen collection to sequence data reporting is about 3 weeks. As a result, weighted estimates for the most recent few weeks may be unstable or unavailable. CDC’s Nowcast is a data projection tool that helps fill this gap by generating timely estimates of variant proportions for variants that are circulating in the United States. View Nowcast estimates on CDC’s COVID Data Tracker website on the Variant Proportions page.

**For national data, the proportion of BA.1.1 is shown separately. For regional data, the proportion of BA.1.1 is also aggregated with B.1.1.529.

***Historical cases are excluded from daily new cases and 7-day average calculations until they are incorporated into the dataset for the applicable date. Of 516,953 historical cases reported retroactively, 559 were reported in the current week and 4,203 were reported in the prior week.


Daily Trends in COVID-19 Cases in the United States Reported to CDC
red-line.jpg

7-Day moving average

resize iconView Larger
More Case Data

Vaccinations


The U.S. COVID-19 Vaccination Program began December 14, 2020. As of April 20, 2022, 570.5 million vaccine doses have been administered in the United States. Overall, about 256.9 million people, or 77.4% of the total U.S. population, have received at least one dose of vaccine. About 219.0 million people, or 66.0% of the total U.S. population, have been fully vaccinated.* Of those fully vaccinated, about 99.7 million people have received a booster dose,** but 49.6% of the total booster-eligible population has not yet received a booster dose. As of April 20, 2022, the 7-day average number of administered vaccine doses reported (by date of CDC report) to CDC per day was 470,903, a 13.2% decrease from the previous week.

CDC’s COVID Data Tracker displays vaccination trends by age group, race/ethnicity, and urban/rural status. To see trends by age group and race/ethnicity, visit the Vaccination Demographic Trends tab. To see trends by urban/rural status, visit the COVID-19 Vaccination Equity tab.

570,485,199
Vaccine Doses Administered

256,935,026
People who received at least one dose

219,047,079
People who are fully vaccinated*

77.4%
Percentage of the U.S. population that has received at least one dose

66.0%
Percentage of the U.S. population that has been fully vaccinated*

+0.1
Percentage point increase from last week

+0.2
Percentage point increase from last week

*Represents the number of people who have received the second dose in a two-dose COVID-19 vaccine series (such as the Pfizer-BioNTech or Moderna vaccines) or one dose of the single-shot Johnson & Johnson’s Janssen vaccine.

**Represents the number of people who are fully vaccinated and have received another dose of COVID-19 vaccine since August 13, 2021. This includes people who received their first additional dose or booster dose.

Daily Change in the Total Number of Administered COVID-19 Vaccine Doses Reported to CDC by the Date of CDC Report, United States
red-line.jpg

7-Day moving average

resize iconView Larger
More Vaccination Data

Hospitalizations

New Hospital Admissions


The current 7-day daily average for April 13–19, 2022, was 1,582. This is an 8.2% increase from the prior 7-day average (1,463) from April 6–12, 2022.

4,623,627
Total New Admissions

1,582
Current 7-Day Average

1,463
Prior 7-Day Average

+8.2%
Change in 7-Day Average

The start of consistent reporting of hospital admissions data was August 1, 2020.

Daily Trends in Number of New COVID-19 Hospital Admissions in the United States

resize iconView Larger
New admissions are pulled from a 10 am EDT snapshot of the HHS Unified Hospital Data – Analytic Dataset. Due to potential reporting delays, data from the most recent 7 days, as noted in the figure above with the grey bar, should be interpreted with caution. Small shifts in historic data may also occur due to changes in the Centers for Medicare & Medicaid Services (CMS) Provider of Services file, which is used to identify the cohort of included hospitals.

More Hospital Data

COVID-NET: Hospitalization Rates by Vaccination Status in Children Ages 5–11 Years


CDC’s Coronavirus Disease 2019-Associated Hospitalization Surveillance Network (COVID-NET) shows that rates of COVID-19-associated hospitalizations in February 2022 were 2 times as high among unvaccinated children ages 5–11 years compared to adolescents who received a COVID-19 primary vaccination series.*

Additional information on COVID-19-associated hospitalizations among children ages 5–11 years can be found in a new report using COVID-NET data here.

*Compared to older age groups, children ages 5–11 years have very low rates of hospitalization for any vaccination status. As a result, hospitalization rates by vaccination status for this age group might have more week-to-week variability due to small sample sizes.

Rates of COVID-19-Associated Hospitalizations by Vaccination Status in Children Ages 5–11 Years, January–February 2022


resize iconView Larger
The Coronavirus Disease 2019 (COVID-19)-Associated Hospitalization Surveillance Network (COVID-NET) is an additional source for hospitalization data collected through a network of more than 250 acute-care hospitals in 14 states (representing ~10% of the U.S. population). Detailed data on patient demographics, including race/ethnicity, underlying medical conditions, medical interventions, and clinical outcomes, are collected using a standardized case reporting form.
More COVID-NET Data

Deaths


The current 7-day moving average of new deaths (376) has decreased 9.4% compared with the previous 7-day moving average (415). As of April 20, 2022, a total of 987,601 COVID-19 deaths have been reported in the United States.

987,601
Total Deaths Reported

376
Current 7-Day Average*

415
Prior 7-Day Average

-9.4%
Change in 7-Day Average Since Prior Week

*Historical deaths are excluded from the daily new deaths and 7-day average calculations until they are incorporated into the dataset by their applicable date. Of 21,064 historical deaths reported retroactively, 320 were reported in the current week; and none were reported in the prior week.

Daily Trends in Number of COVID-19 Deaths in the United States Reported to CDC
red-line.jpg

7-Day moving average

resize iconView Larger
More Death Data

Testing


The percentage of COVID-19 NAATs (nucleic acid amplification tests)* that are positive (percent positivity) is increasing in comparison to the previous week. The 7-day average of percent positivity from NAATs is now 5.3%. The 7-day average number of tests reported for April 8-14, 2022 was 727,146, down 6.7% from 779,004 for the prior 7 days.

863,827,004
Total Tests Reported

727,146
7-Day Average Tests Reported

5.3%
7-Day Average % Positivity

3.7%
Previous 7-Day Average % Positivity

+1.58
Percentage point change in 7-Day Average % Positivity since Prior Week

*Test for SARS-CoV-2, the virus that causes COVID-19

COVID-19 NAAT Laboratory Test 7-day Percent Positivity by State/Territory

resize iconView Larger
More Testing DataWastewater Surveillance


In February, CDC’s COVID Data Tracker released a Wastewater Surveillance tab, which tracks levels, changes, and detections of SARS-CoV-2 viral RNA in wastewater at more than 800 testing sites across the country. Because many people with COVID-19 shed the virus in their feces, wastewater testing can help us monitor COVID-19 in communities. Wastewater surveillance can provide an early warning of increasing COVID-19 cases and help communities prepare.

Currently, virus levels in wastewater are relatively low across the country. However, more than half of all sites reporting wastewater data are experiencing a modest increase in SARS-CoV-2 levels. These increases often reflect minor changes from very low levels to levels that are still low. It’s important to note that even a small increase when levels are low can appear like a dramatic increase in the percent change.

SARS-CoV-2 Levels in Wastewater by Site

resize iconView Larger
COVID19-Community-Levels_2_04012022.jpg

0% means levels are the lowest they have been at the site; 100% means levels are the highest they have been at the site.
More Wastewater Data
Top of Page
Content source: National Center for Immunization and Respiratory Diseases (NCIRD), Division of Viral Diseases

https://www.cdc.gov/coronavirus/2019-ncov/covid-data/covidview/index.html

 
Back
Top