• FluTrackers.com Inc. does not provide medical advice. Information on this web site is collected from various internet resources, and the FluTrackers board of directors makes no warranty to the safety, efficacy, correctness or completeness of the information posted on this site by any author or poster. The information collated here is for instructional and/or discussion purposes only and is NOT intended to diagnose or treat any disease, illness, or other medical condition. Every individual reader or poster should seek advice from their personal physician/healthcare practitioner before considering or using any interventions that are discussed on this website. By continuing to access this website you agree to consult your personal physican before using any interventions posted on this website, and you agree to hold harmless FluTrackers.com Inc., the board of directors, the members, and all authors and posters for any effects from use of any medication, supplement, vitamin or other substance, device, intervention, etc. mentioned in posts on this website, or other internet venues referenced in posts on this website.
  • We are not asking for any donations. Do not donate to any entity who says they are raising funds for us.

US - CDC: COVID Data Tracker Weekly Review 2021 - 2024 - For trend analysis only

sharon sanders

Editor-in-Chief & President
Thread for 2020/2021 here.


New cold and flu season 2021/2022



covid-tracker-header-lrg.jpg
COVID Data Tracker Weekly Review


Print
Subscribe to the Weekly Review


Interpretive Summary for October 1, 2021
Three Point Shot


resize iconView Larger


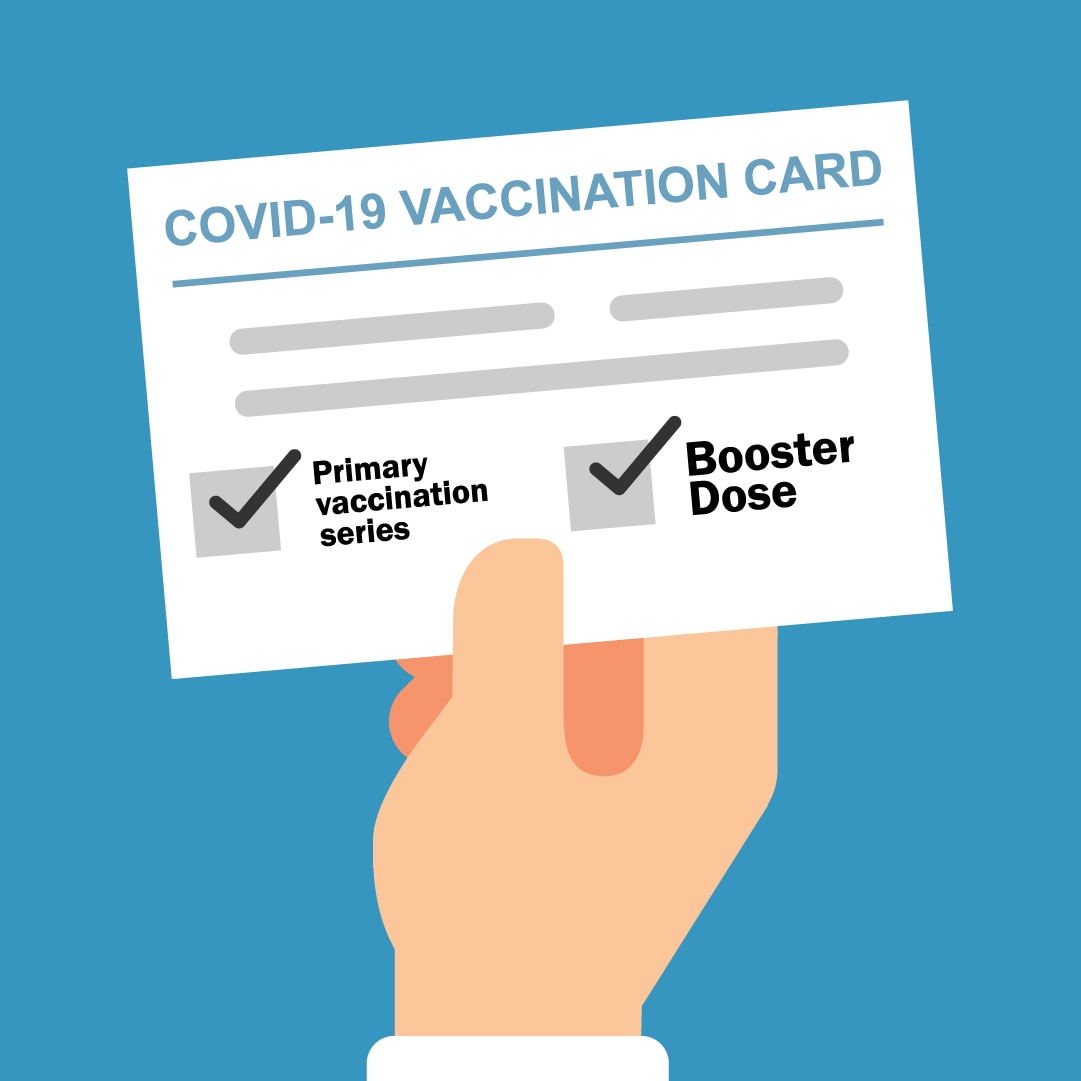
Last week the U.S. Food and Drug Administrationexternal icon (FDA) issued an emergency use authorization (EUA) for a single booster shot* of the Pfizer-BioNTech COVID-19 vaccine. Certain populations are now eligible to receive a booster shot of the Pfizer-BioNTech vaccine at least 6 months after receiving their second Pfizer-BioNTech shot. These populations include people ages 65 years and older, people ages 18 years and older who have underlying medical conditions, and people ages 18 years and older who live or work in high-risk settings.

The COVID-19 vaccines approved and authorized in the United States continue to be effective at reducing the risk of severe disease, hospitalization, and death. COVID-19 vaccination can also reduce the spread of disease overall and help protect the people around you. However, recent data show that protection against asymptomatic, mild, and moderate disease may decrease over time. The reduced protection may be due to both decreasing immunity over time and the highly contagious Delta variant.

COVID-19 vaccination, along with layered prevention strategies, continues to be our best defense against severe disease. People who are unvaccinated remain the most vulnerable to COVID-19. To end this pandemic, it is critical that all people get vaccinated as soon as they are eligible. To find a vaccine provider near you, visit Vaccines.gov or your state or local public health department website. Talk to your healthcare provider if you have questions about whether a Pfizer-BioNTech COVID-19 booster shot is appropriate for you.

*Booster shots are doses of U.S. approved or authorized vaccines that are given when protection from initial vaccination is likely to have decreased over time.

Note to readers: CDC’s COVID Data Tracker recently released a COVID-19 Vaccine Effectiveness page, which allows users to view COVID-19 vaccine effectiveness at protecting against hospitalization and infection.


Reported Cases


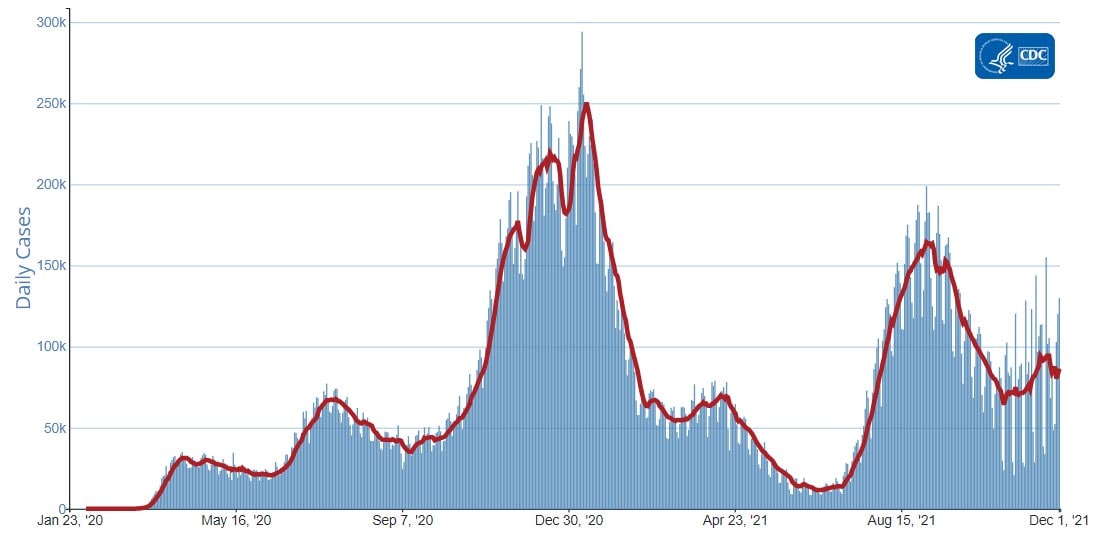
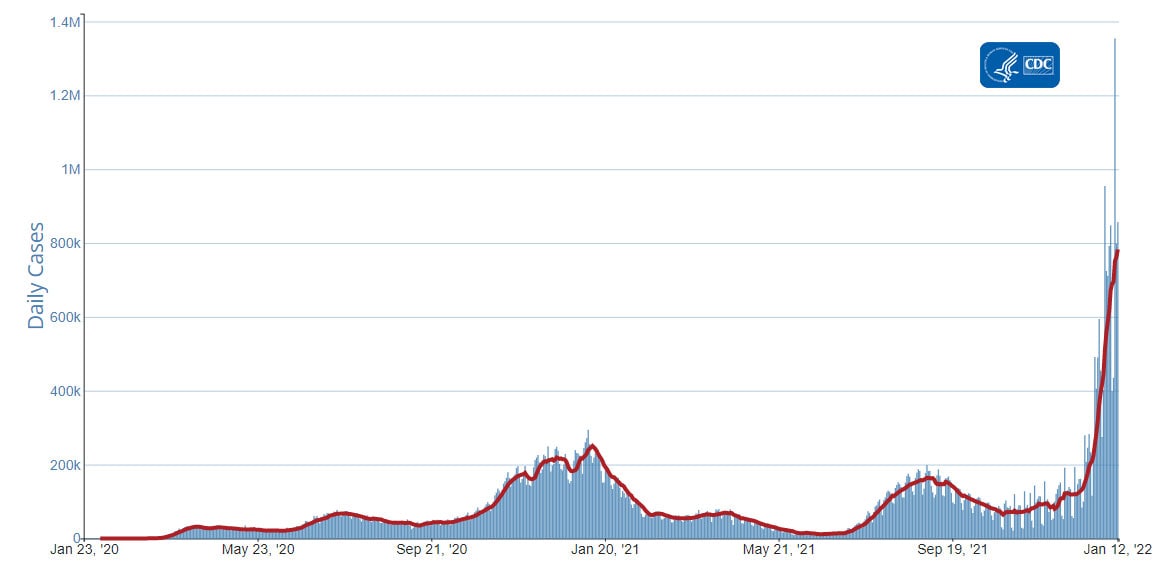
The current 7-day moving average of daily new cases (106,395) decreased 13.3% compared with the previous 7-day moving average (122,659). A total of 43,289,203 COVID-19 cases have been reported as of September 29, 2021.

43,289,203
Total Cases Reported

106,395
Current 7-Day Average*

122,659
Prior 7-Day Average

-13.3%
Change in 7-Day Average since Prior Week

*Historical cases are excluded from daily new cases and 7-day average calculations until they are incorporated into the dataset for the applicable date. Of 106,512 historical cases reported retroactively, 6,168 were reported in the current week and 2,835 were reported in the prior week.

Daily Trends in COVID-19 Cases in the United States Reported to CDC
red-line.jpg

7-Day moving average

resize iconView Larger
More Case Data


SARS-CoV-2 Variants


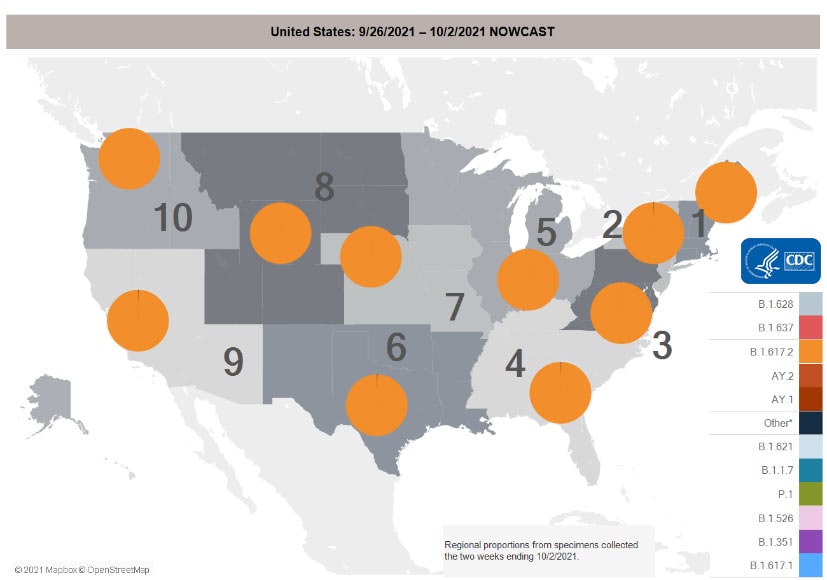
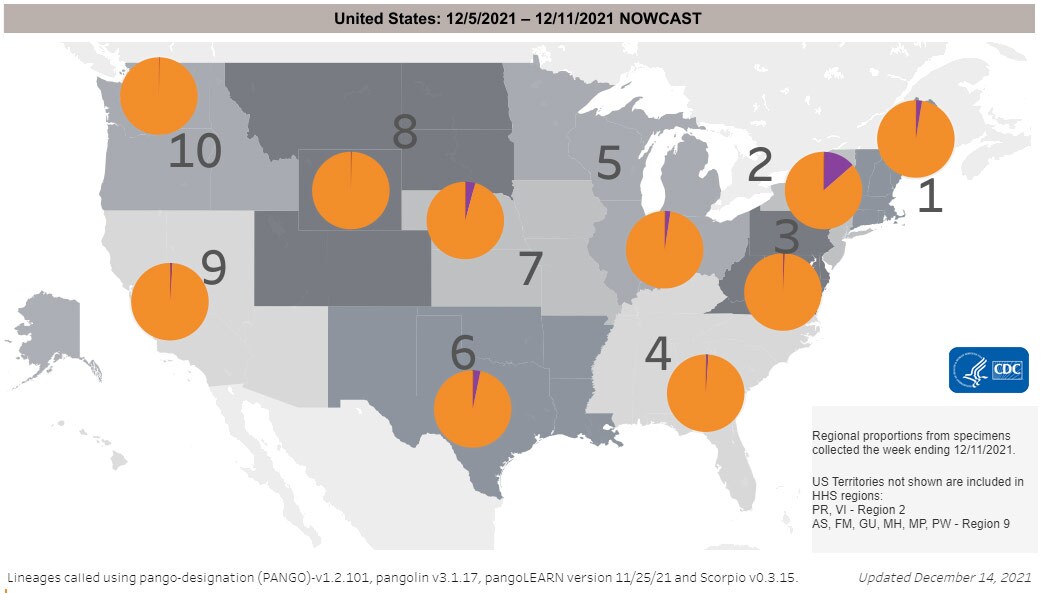
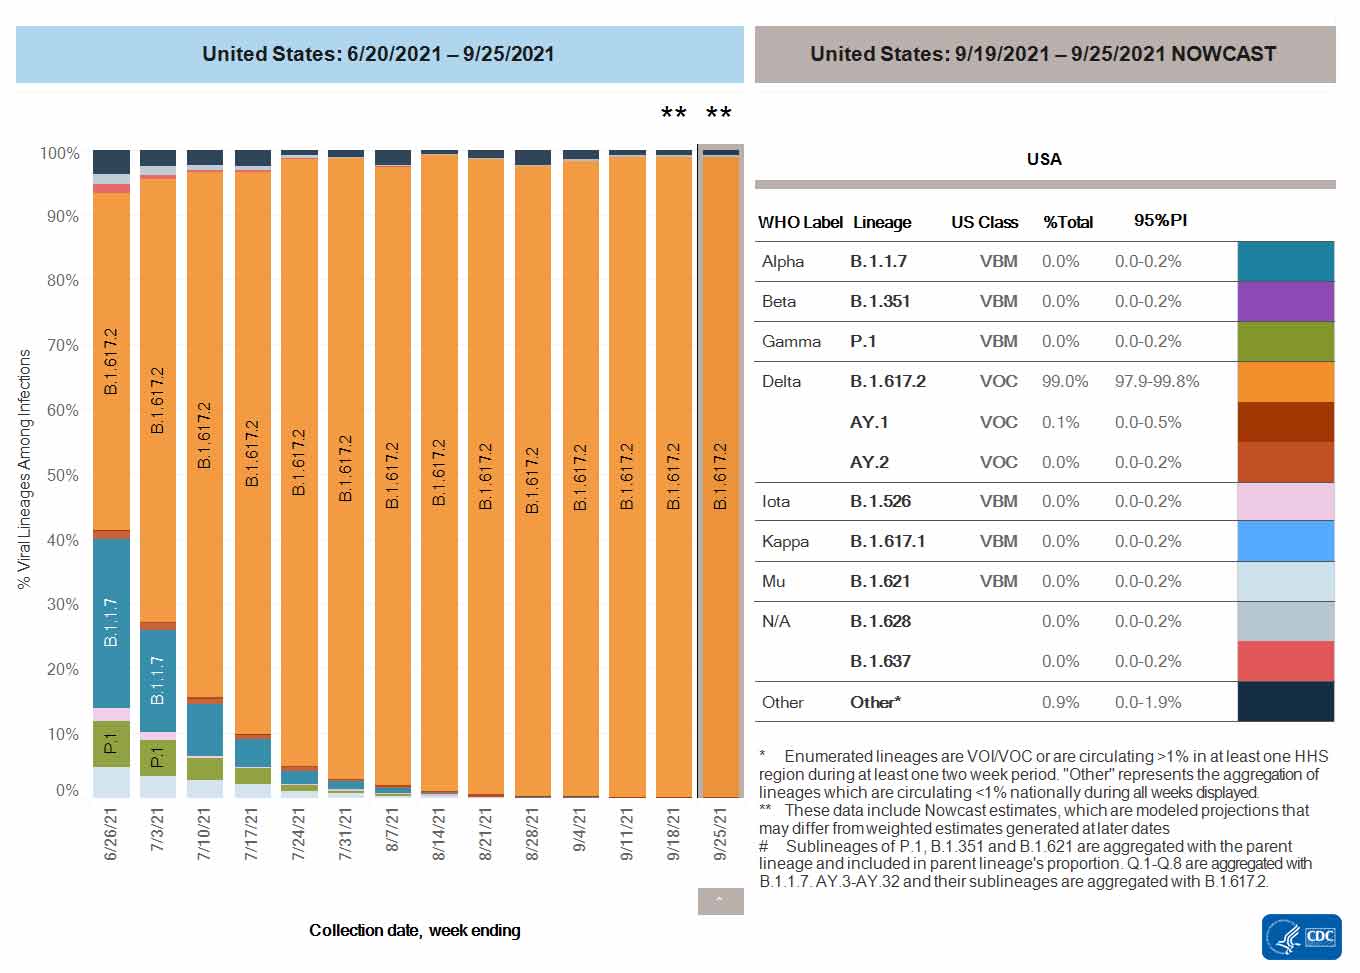
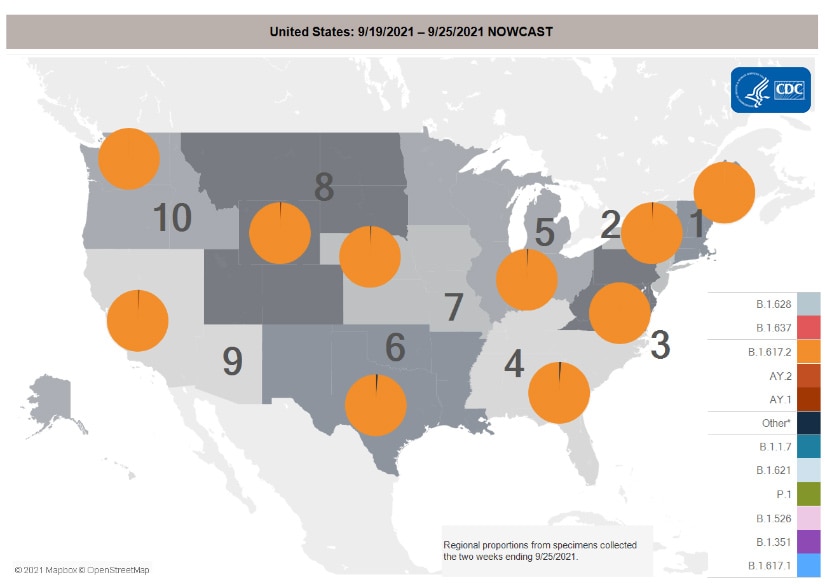
Currently, the Delta variant is the only variant classified as a Variant of Concern (VOC) in the United States. There are no variants classified as a Variant of Interest (VOI) and there are 10 variants classified as Variants Being Monitored (VBM). VBM do not pose a significant and imminent risk to public health in the United States due to their very low prevalence, which is currently estimated to be less than 0.1%.

Nowcast projections* for the week ending September 25, 2021, estimate the national proportion of cases attributed to the Delta variant to be greater than 99%. Nowcast estimates indicate that Delta will continue to be the predominant variant circulating in all 10 U.S. Department of Health and Human Services (HHS) regions, circulating at greater than 98%.

*The median time from specimen collection to sequence data reporting is about 3 weeks. As a result, weighted estimates for the most recent few weeks may be unstable or unavailable. CDC’s Nowcast is a data projection tool that helps fill this gap by generating timely estimates of variant proportions for variants that are circulating in the United States. View Nowcast estimates on CDC’s COVID Data Tracker website on the Variant Proportions page.

SARS-CoV-2 Variants Circulating in the United States
resize iconView Larger
resize iconView Larger
More Variants Data


Testing


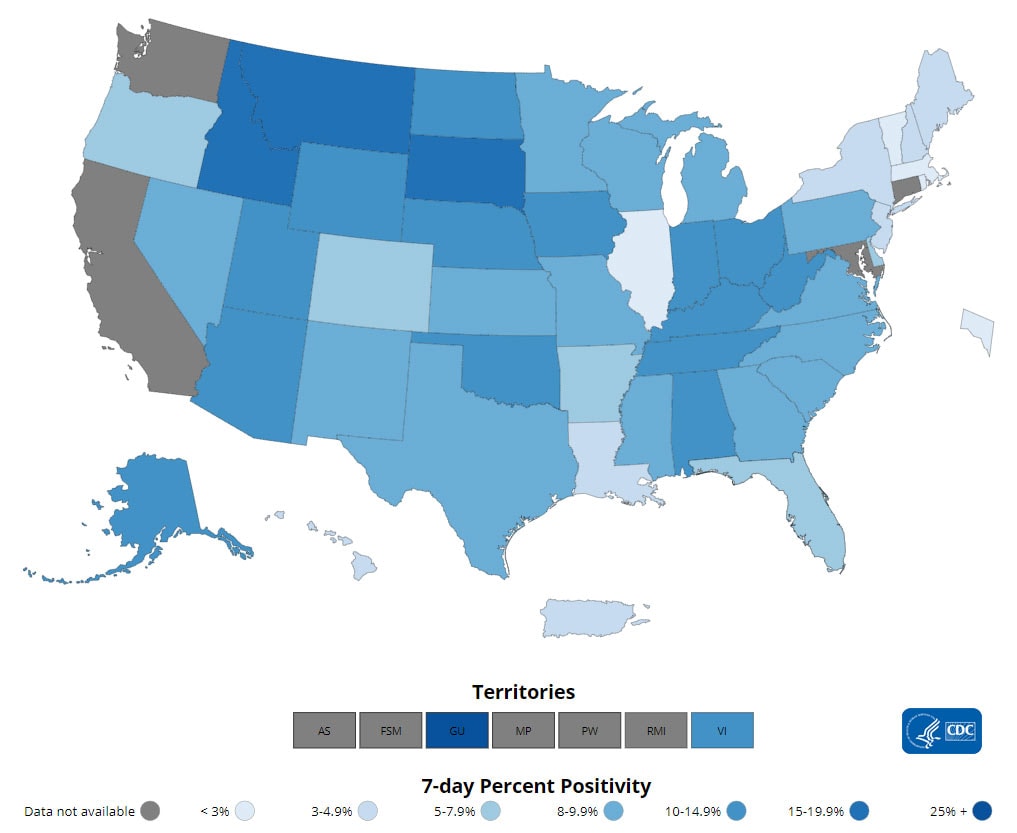
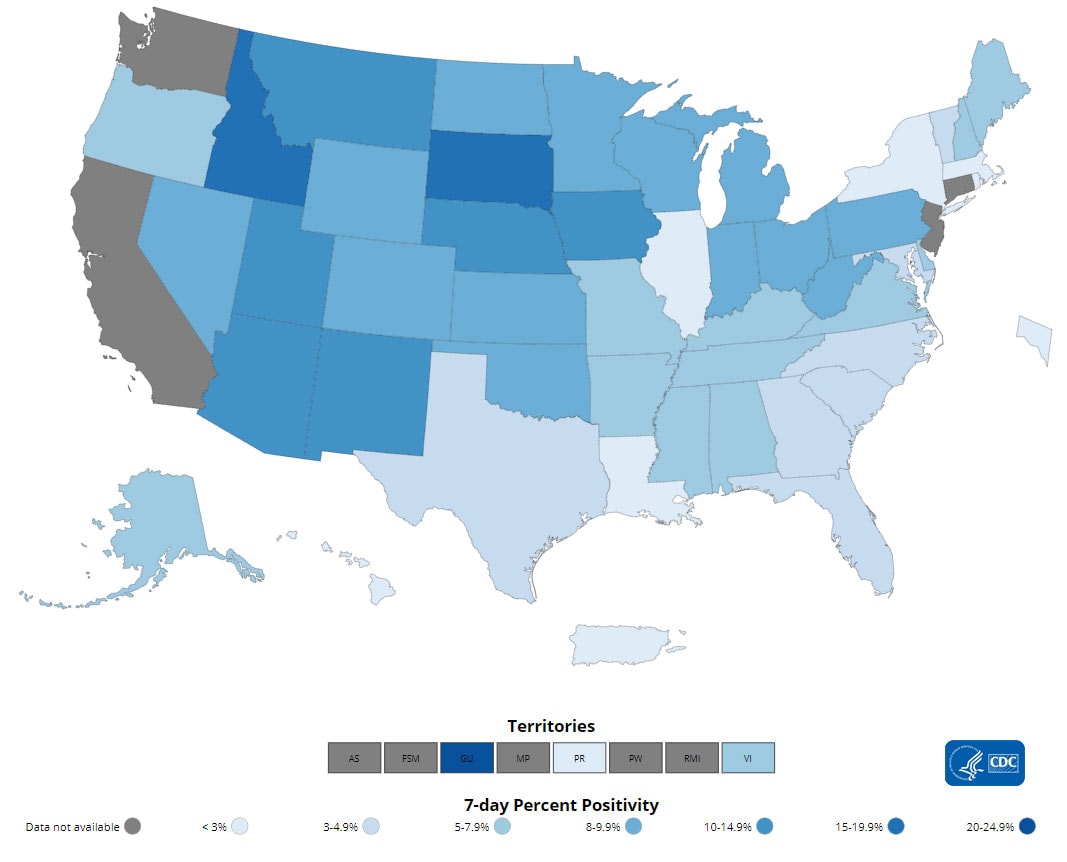
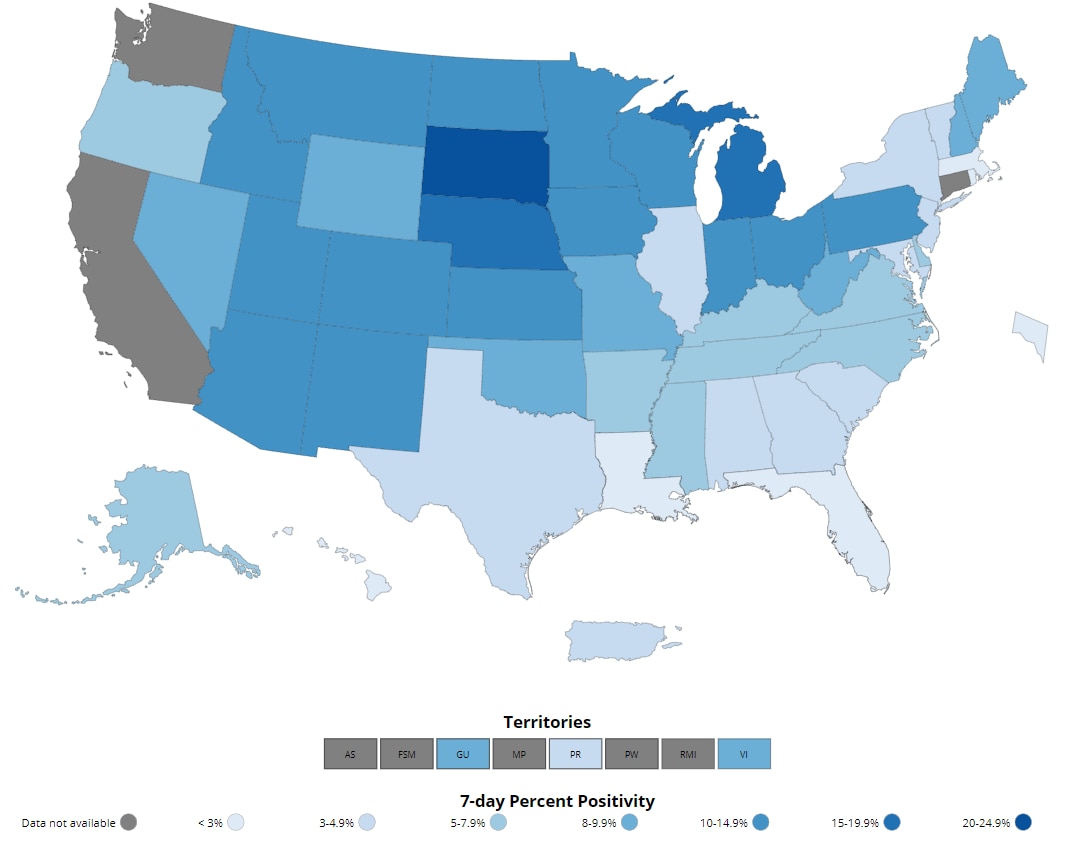
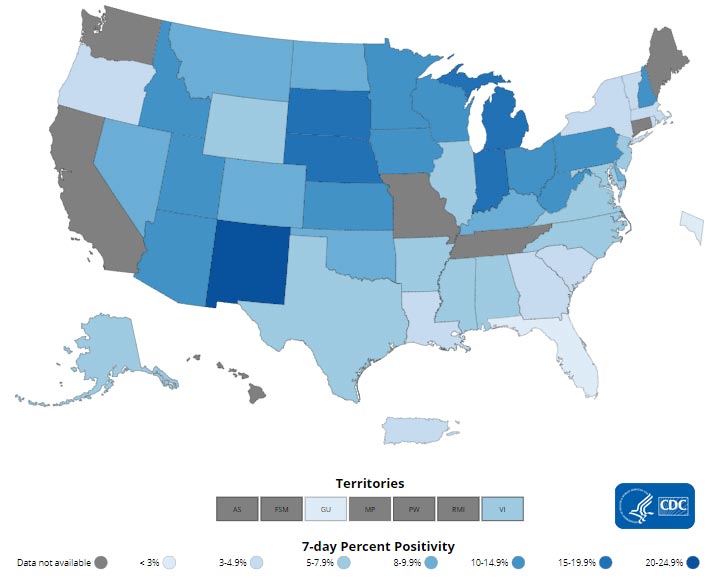
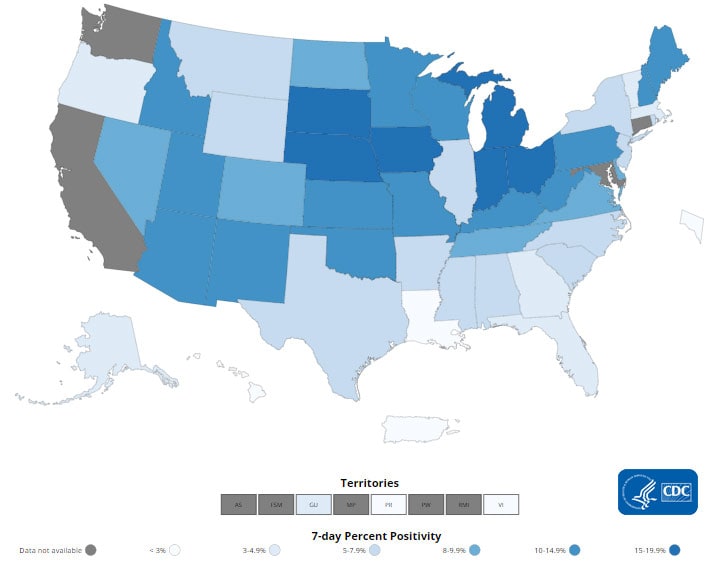
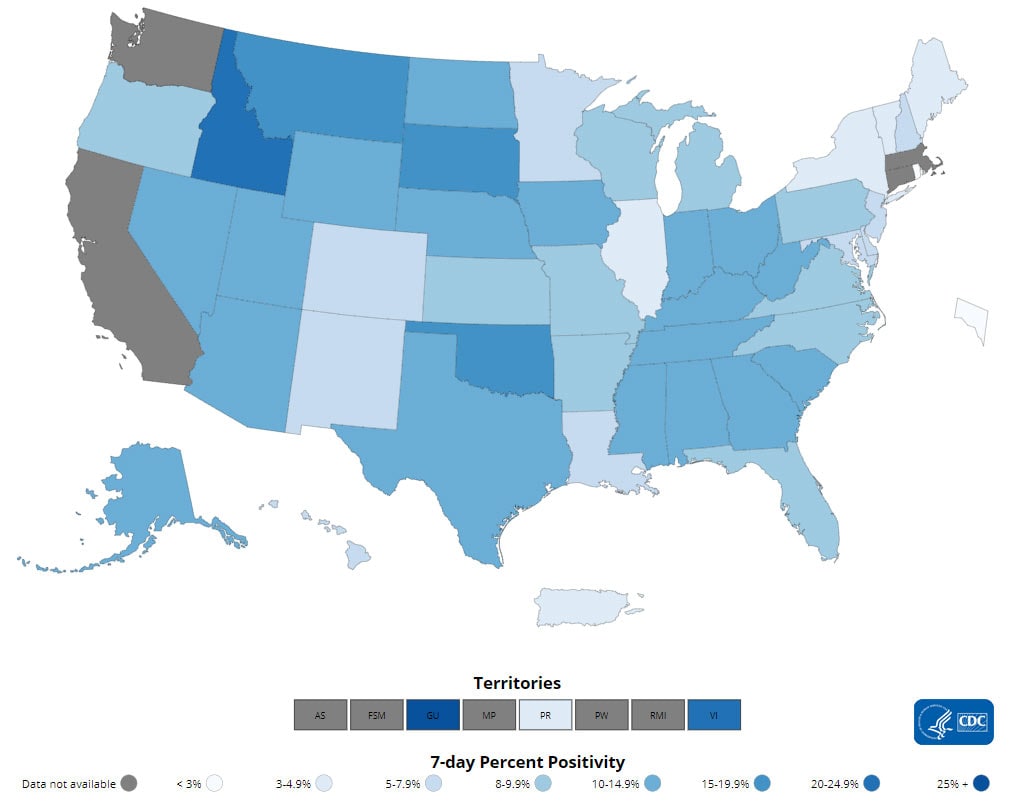
The percentage of COVID-19 NAATs (nucleic acid amplification tests)* that are positive (percent positivity) has decreased from the previous week. The 7-day average of percent positivity from NAATs is now 6.6%. The 7-day average number of tests reported for September 17 – September 23, 2021, was 1,600,474, down 5.4% from 1,690,941 for the prior 7 days.

575,728,015
Total Tests Reported

1,600,474
7-Day Average Tests Reported

6.6%
7-Day Average % Positivity

7.4%
Previous 7-Day Average % Positivity

-11.1%
Change in 7-Day Average % Positivity since Prior Week

*Test for SARS-CoV-2, the virus that causes COVID-19

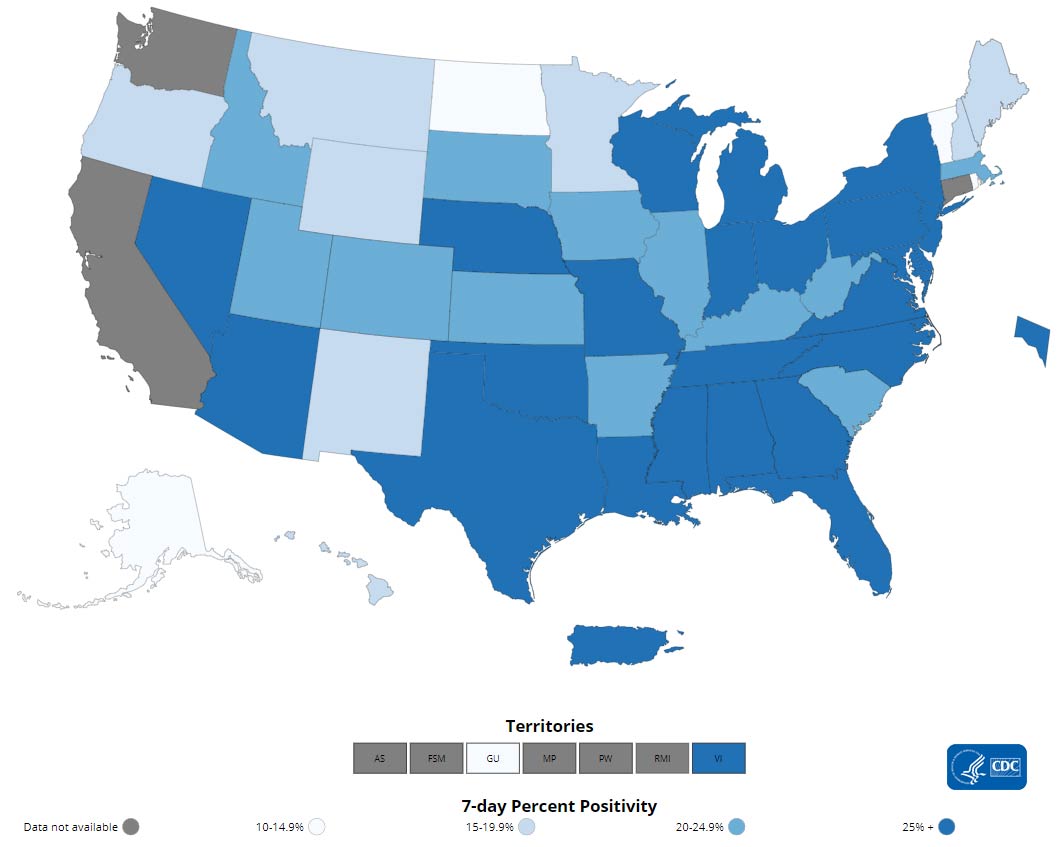
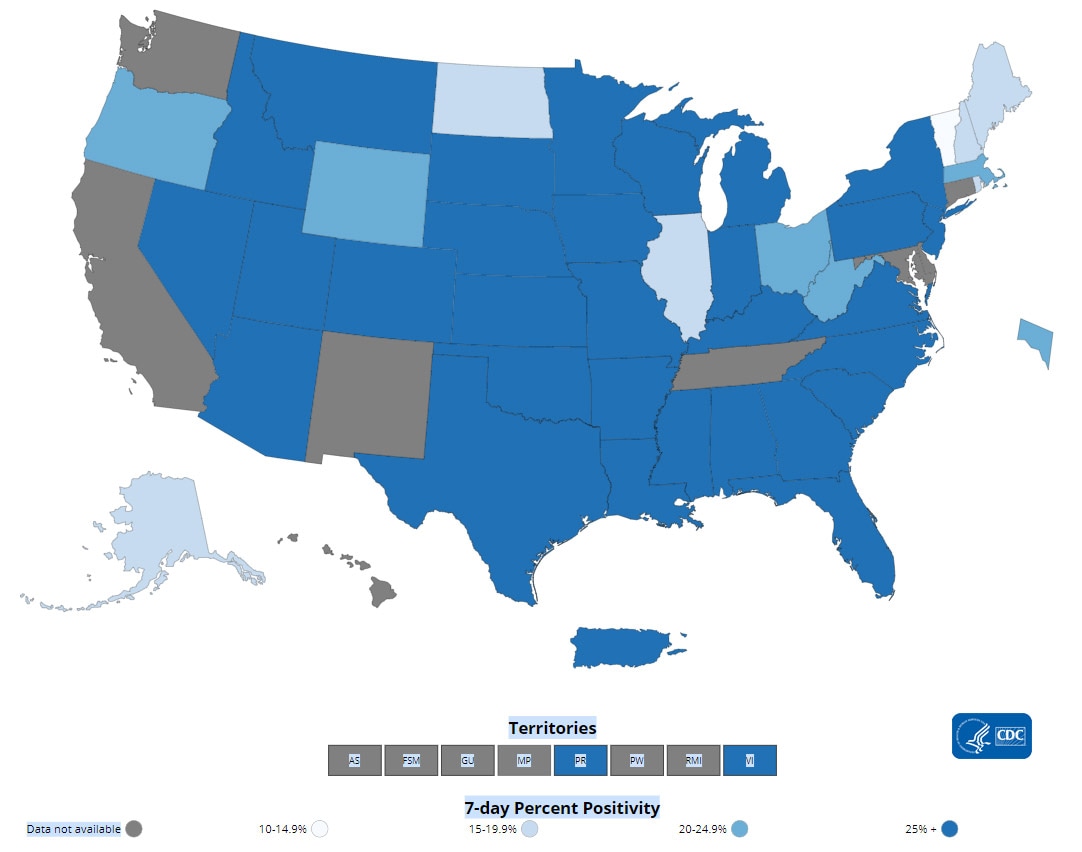
COVID-19 NAAT Laboratory Test 7-day Percent Positivity by State/Territory
resize iconView Larger
More Testing Data


Vaccinations


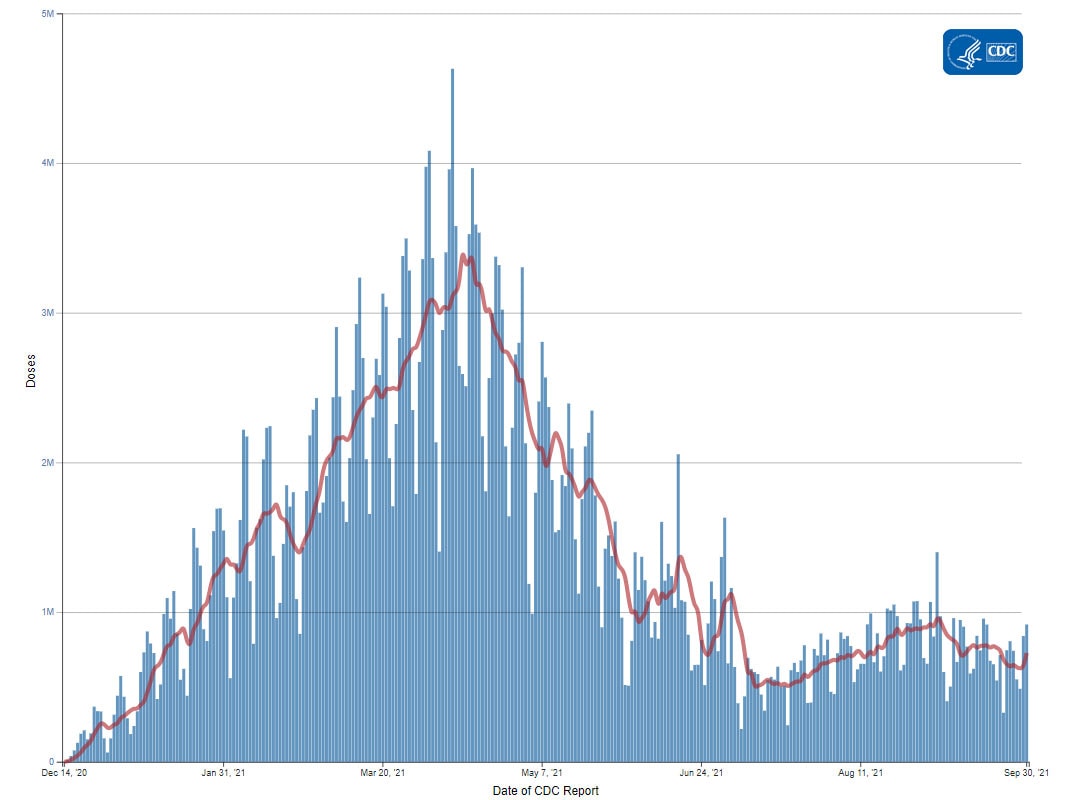
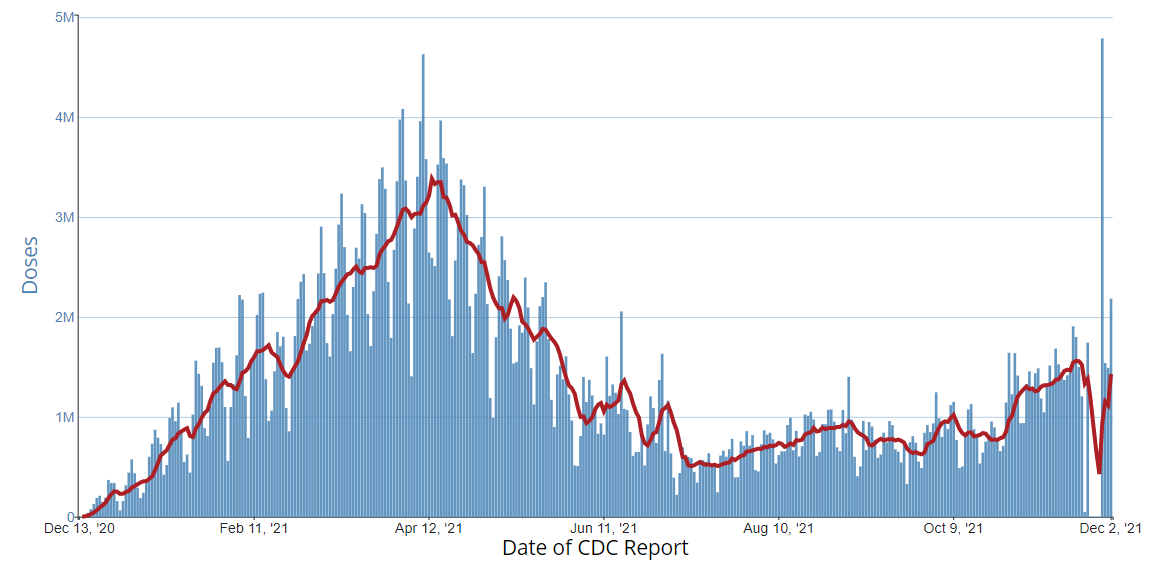
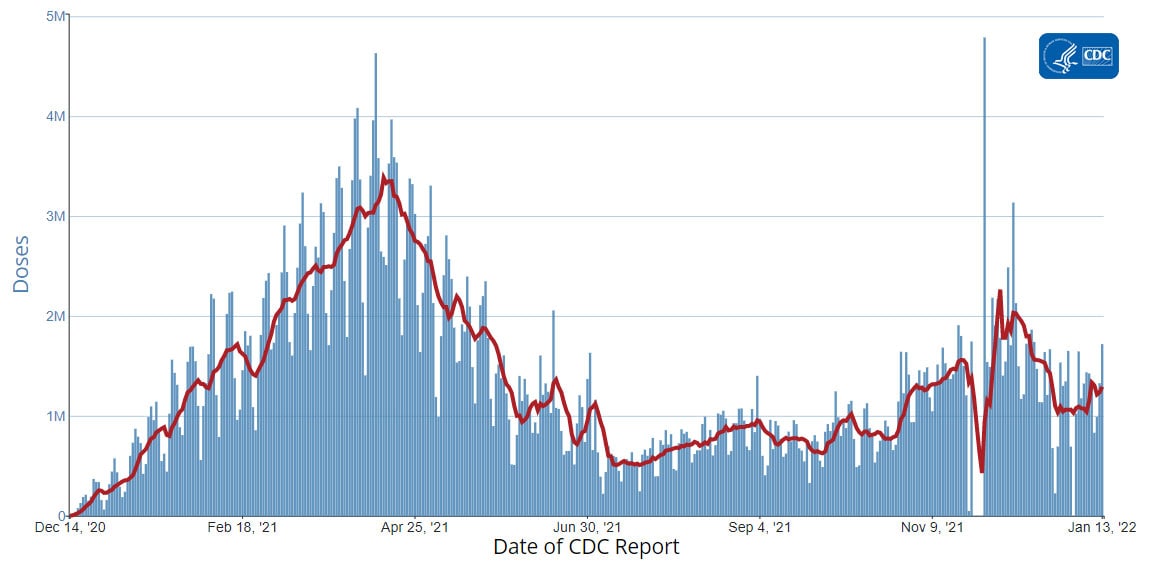
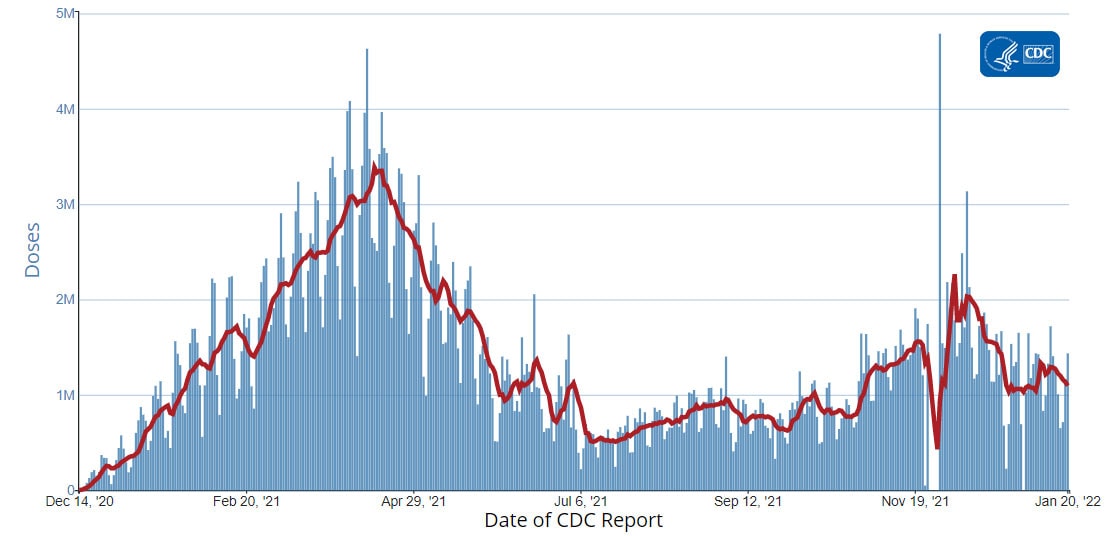
The U.S. COVID-19 Vaccination Program began December 14, 2020. As of September 30, 2021, 392.9 million vaccine doses have been administered. Overall, about 214.3 million people, or 64.6% of the total U.S. population, have received at least one dose of vaccine. About 184.6 million people, or 55.6% of the total U.S. population, have been fully vaccinated.* As of September 30, 2021, the 7-day average number of administered vaccine doses reported (by date of CDC report) to CDC per day was 726,899, a 6.4% increase from the previous week.

CDC’s COVID Data Tracker Vaccination Demographic Trends tab shows vaccination trends by age group. As of September 30, 2021, 93.8% of people ages 65 years or older have received at least one dose of vaccine and 83.3% are fully vaccinated. More than three-quarters (77.3%) of people ages 18 years or older have received at least one dose of vaccine and 66.9% are fully vaccinated. For people ages 12 years or older, 75.5% have received at least one dose of vaccine and 65.1% are fully vaccinated.

392,909,995
Vaccines Administered

214,332,261
People who received at least one dose

184,601,450
People who are fully vaccinated*

64.6%
Percentage of the US population that has received at least one dose

55.6%
Percentage of the US population that has been fully vaccinated*

+0.6
Percentage point increase from last week

+0.6
Percentage point increase from last week

*Represents the number of people who have received the second dose in a two-dose COVID-19 vaccine series (such as the Pfizer or Moderna vaccines) or one dose of the single-shot Johnson & Johnson’s Janssen vaccine.

Daily Change in the Total Number of Administered COVID-19 Vaccine Doses Reported to CDC by the Date of CDC Report, United States
red-line.jpg

7-Day moving average

resize iconView Larger
More Vaccination Data


Hospitalizations

New Hospital Admissions


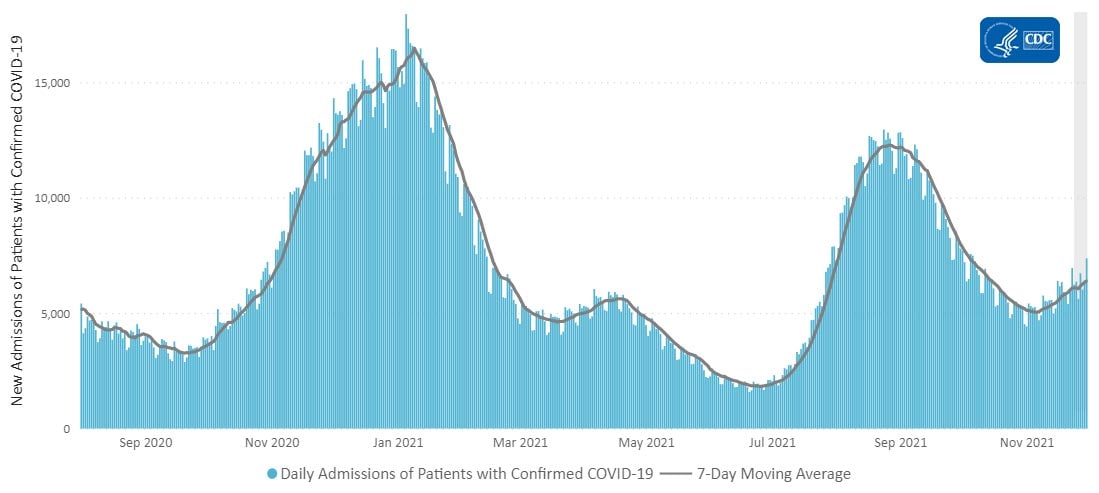
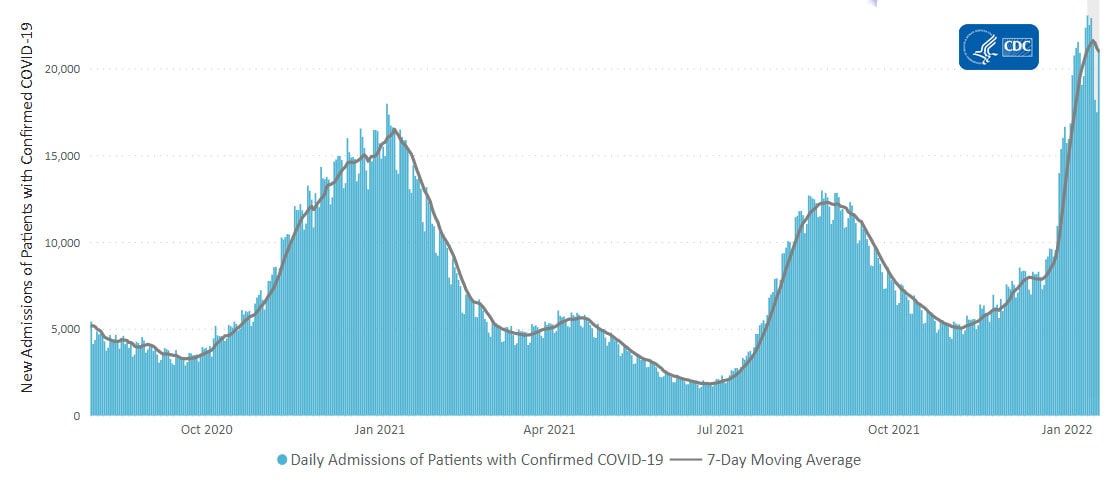
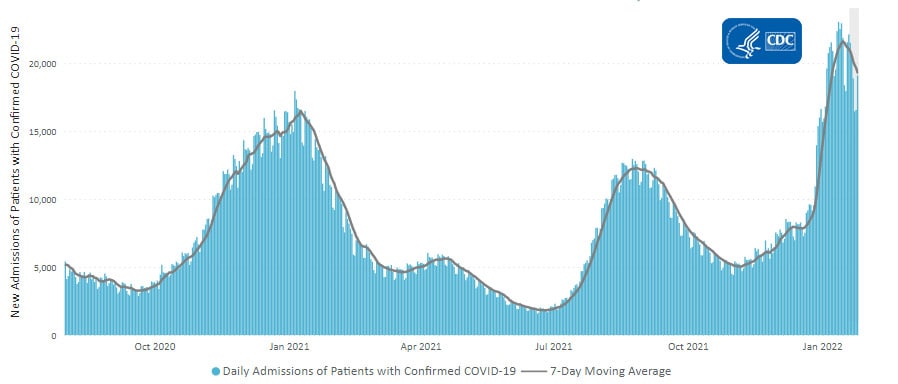
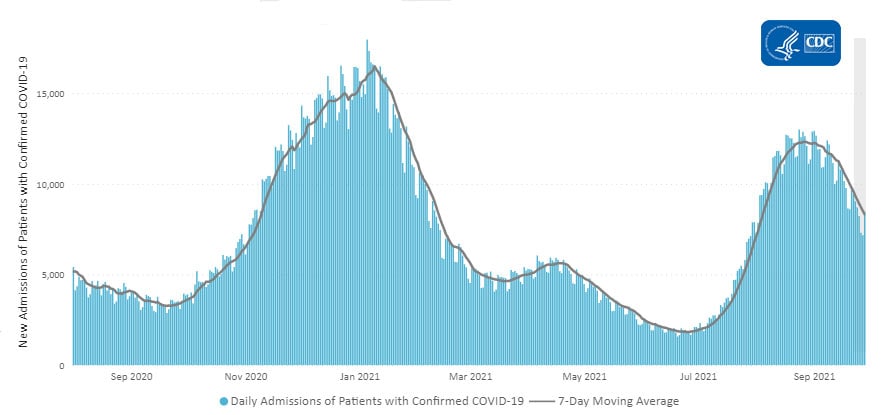
The current 7-day daily average for September 22–September 28, 2021, was 8,321. This is a 14.9% decrease from the prior 7-day average (9,782) from September 15–September 21, 2021.

3,047,033
Total New Admissions

8,321
Current 7-Day Average

9,782
Prior 7-Day Average

-14.9%
Change in 7-Day Average

The start of consistent reporting of hospital admissions data was August 1, 2020.

Daily Trends in Number of New COVID-19 Hospital Admissions in the United States
resize iconView Larger
New admissions are pulled from a 10 am EST snapshot of the HHS Unified Hospital Timeseries Dataset. Due to potential reporting delays, data from the most recent 7 days, as noted in the figure above with the grey bar, should be interpreted with caution. Small shifts in historic data may also occur due to changes in the Centers for Medicare and Medicaid Services (CMS) Provider of Services file, which is used to identify the cohort of included hospitals.

More Hospital Data


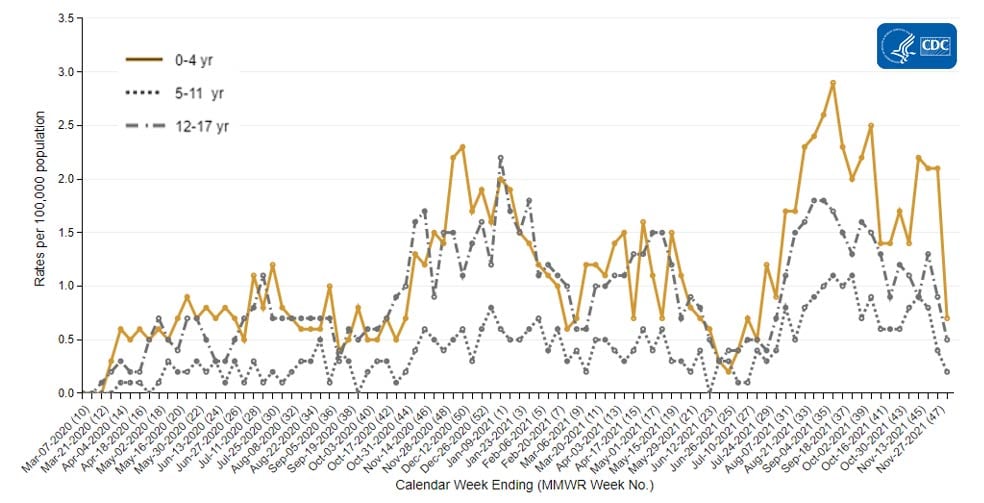
COVID-NET: Trends in Hospitalization Rates in Children Ages 4 Years and Younger Not Eligible for Vaccination


CDC’s Coronavirus Disease 2019-Associated Hospitalization Surveillance Network (COVID-NET) shows that hospitalization rates are still increasing in children. Recent weekly rates of COVID-19-associated hospitalizations for these children have steadily increased since the end of June 2021. For the week ending September 11, 2021, weekly rates of COVID-19-associated hospitalization in children ages 4 years and younger are 3.3 per 100,000. These recent rates are the highest seen for this age group during the pandemic. Unlike adults, children younger than 12 years of age are not yet eligible for any of the available COVID-19 vaccines.

Trends in Hospitalization Rates in Children Ages 4 Years and Younger Not Eligible for Vaccination


resize iconView Larger
The Coronavirus Disease 2019 (COVID-19)-Associate­­d Hospitalization Surveillance Network (COVID-NET) is an additional source for hospitalization data collected through a network of more than 250 acute-care hospitals in 14 states (representing ~10% of the U.S. population). Detailed data on patient demographics, including race/ethnicity, underlying medical conditions, medical interventions, and clinical outcomes, are standardized case reporting form.
More COVID-NET Data

Deaths


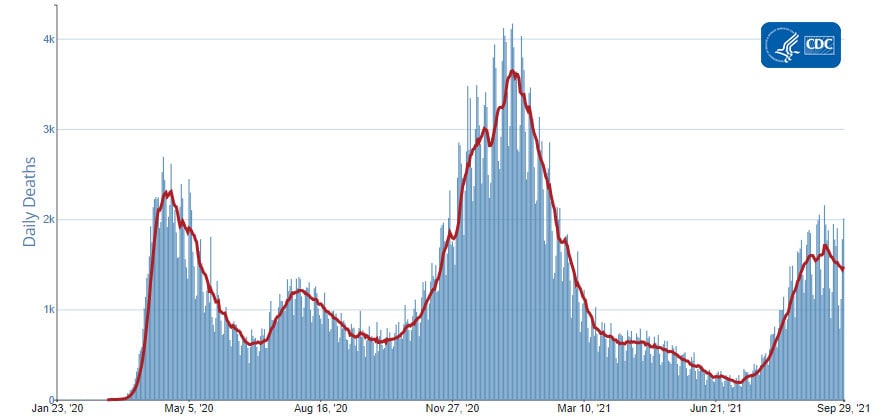
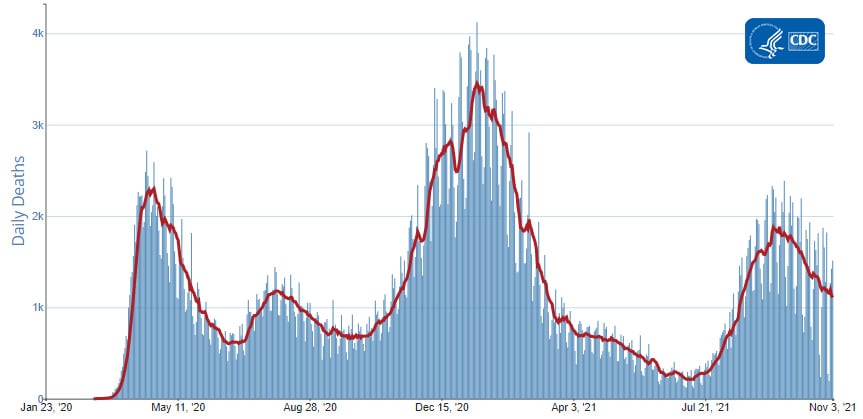
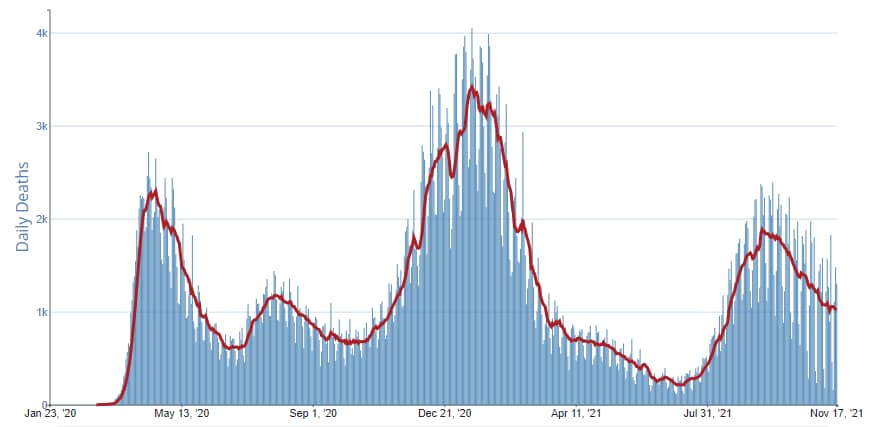
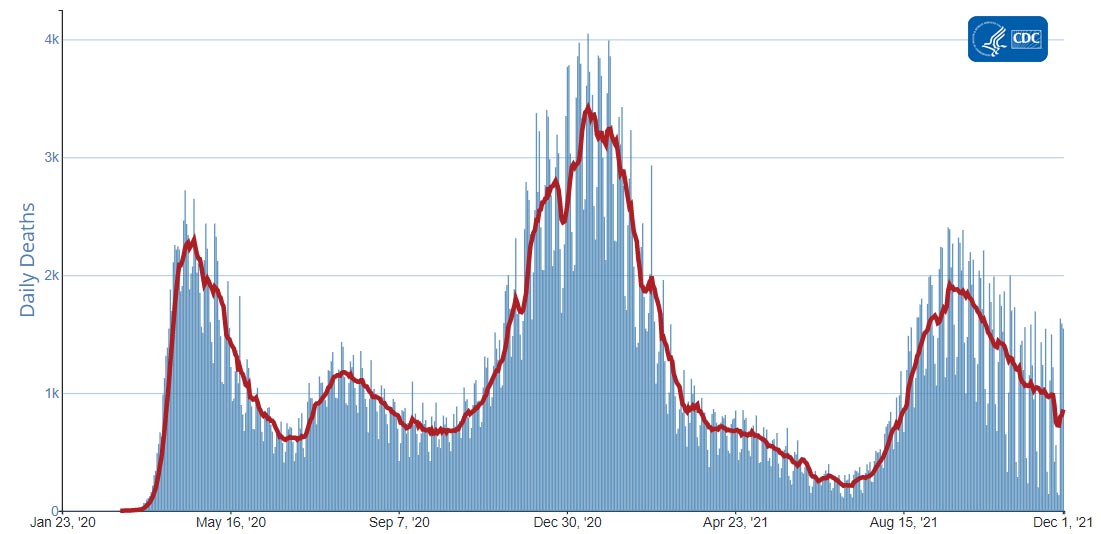
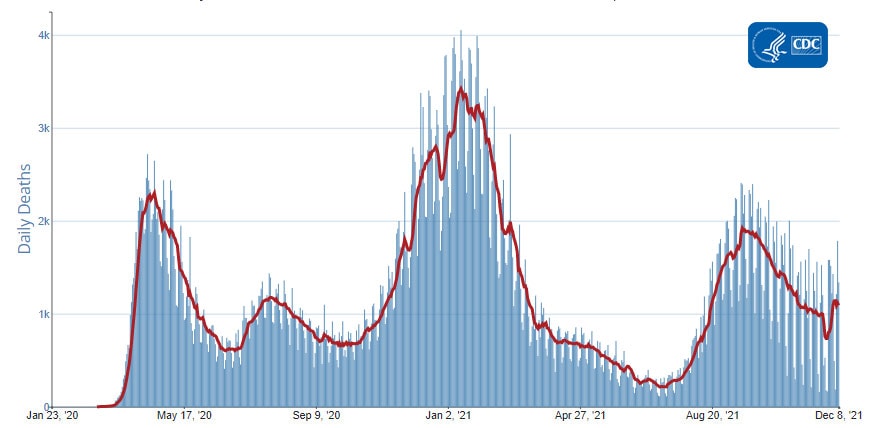
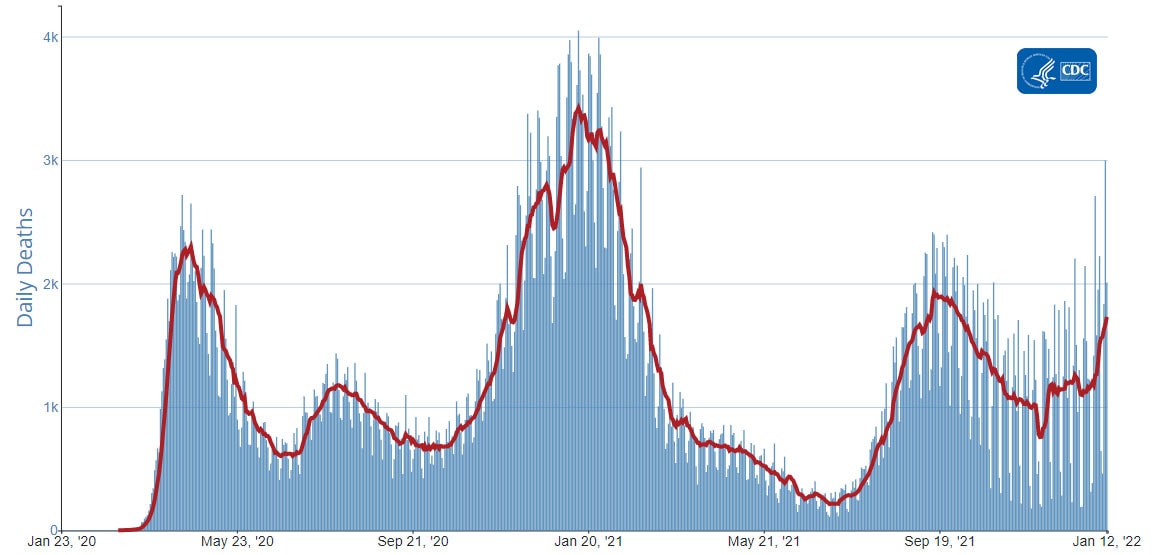
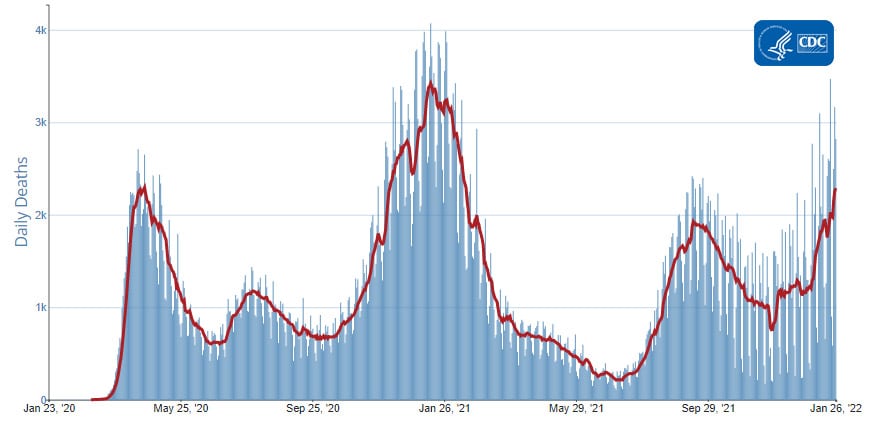
The current 7-day moving average of new deaths (1,476) has decreased 3.3% compared with the previous 7-day moving average (1,527). As of September 29, 2021, a total of 694,701 COVID-19 deaths have been reported in the United States.

694,701
Total Deaths Reported

1,476
Current 7-Day Average*

1,527
Prior 7-Day Average

-3.3%
Change in 7-Day Average Since Prior Week

*Historical deaths are excluded from the daily new deaths and 7-day average calculations until they are incorporated into the dataset by their applicable date. Of 8,566 historical deaths reported retroactively, 631 were reported in the current week; and 226 were reported in the prior week.

Daily Trends in Number of COVID-19 Deaths in the United States Reported to CDC
red-line.jpg

7-Day moving average

resize iconView Larger
More Death Data


Recent CDC COVID-19 Publications
  1. Safety Monitoring of an Additional Dose of COVID-19 Vaccine — United States, August 12–September 19, 2021
  2. Disparities in COVID-19 Vaccination Status, Intent, and Perceived Access for Noninstitutionalized Adults, by Disability Status — National Immunization Survey Adult COVID Module, United States, May 30–June 26, 2021
Recent COVID Data Tracker Updates
  • A new Vaccine Effectiveness tab shows vaccine effectiveness against hospitalizations and infections
  • The Vaccinations in the US tab now displays the number and percent of booster doses by certain age groupings (Total, 18+, 50+, and 65+), and the number of people with a booster dose by vaccine type
  • The COVID Data Tracker homepage stats bar now shows the percent of the 12+ population with at least one dose of a COVID-19 vaccine
https://www.cdc.gov/coronavirus/2019-ncov/covid-data/covidview/index.html
 
covid-tracker-header-lrg.jpg
COVID Data Tracker Weekly Review


Print
Subscribe to the Weekly Review


Interpretive Summary for October 8, 2021
Health Equity and Disability


resize iconView Larger
COVID-19 cases, hospitalizations, and deaths are once again declining in many parts of the country. Sadly, the United States reached a grim milestone this week, surpassing 700,000 total deaths from COVID-19. Studies have shown that COVID-19 does not affect all population groups equally. Some people with disabilities might be more likely to get infected or have severe outcomes from COVID-19 because of underlying medical conditions, group living settings, or systemic health and social inequities.

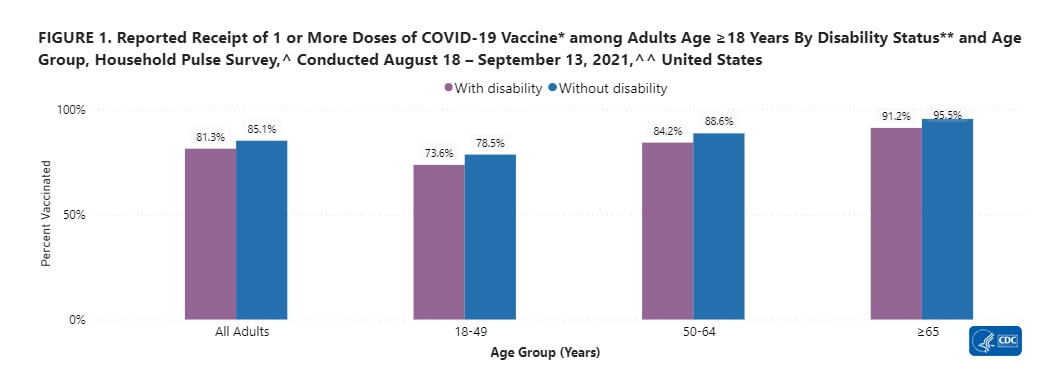
It is important that all people, including people with disabilities and people who provide support to people with disabilities, get a COVID-19 vaccine. Many people with disabilities face significant challenges accessing COVID-19 vaccination services and may need support. A recent analysis of CDC survey data shows that some adults with a disability* were more likely to report difficulty getting a COVID-19 vaccine compared to adults without a disability. Despite disparities related to COVID-19 vaccine access, adults with a disability are less likely to report being hesitant about vaccination compared to adults without a disability.

People with disabilities need health care and health programs for the same reasons anyone else does—to stay well and active. Good health is important to be able to work, learn, and be engaged within a community. CDC has resources to support people with disabilities and those who care for them. CDC’s Toolkit for People with Disabilities includes guides for increasing disabled persons’ access to vaccinations along with COVID-19 FAQs. To find a vaccine provider near you, visit Vaccines.gov or your state or local public health department website.

*In assessing COVID-19 vaccination status for this analysis, CDC asked “Do you have serious difficulty seeing, hearing, walking, remembering, making decisions, or communicating?” Respondents who answered “yes” were considered to have a disability, and those who answered “no” were categorized as having no disability.

Note to readers: CDC’s COVID Data Tracker’s Health Equity Data page catalogs current health equity-related data on the COVID Data Tracker that align with populations and place-based focus groups identified in the CDC COVID-19 Response Health Equity Strategy pdf icon[86 KB, 5 Pages]. On this page, users can find data on COVID-19 vaccination among people with disabilities, underlying medical conditions, COVID-19 vaccination equity, and more.


Reported Cases


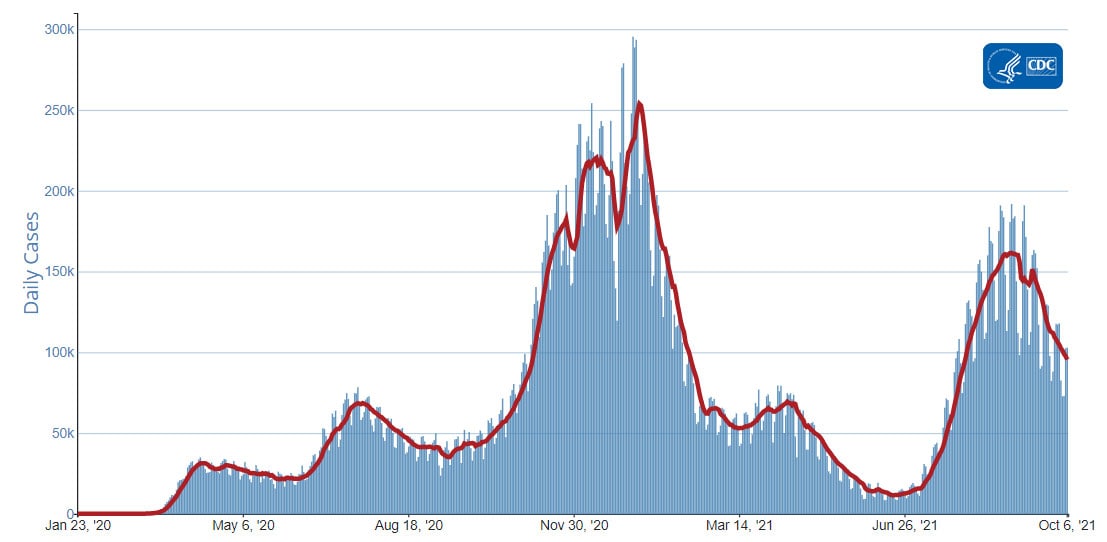
The current 7-day moving average of daily new cases (95,448) decreased 11.6% compared with the previous 7-day moving average (107,953). A total of 43,997,504 COVID-19 cases have been reported as of October 6, 2021.

43,997,504
Total Cases Reported

95,448
Current 7-Day Average*

107,953
Prior 7-Day Average

-11.6%
Change in 7-Day Average since Prior Week

*Historical cases are excluded from daily new cases and 7-day average calculations until they are incorporated into the dataset for the applicable date. Of 120,872 historical cases reported retroactively, 14,358 were reported in the current week and 6,168 were reported in the prior week.

Daily Trends in COVID-19 Cases in the United States Reported to CDC
red-line.jpg

7-Day moving average

resize iconView Larger
More Case Data


SARS-CoV-2 Variants


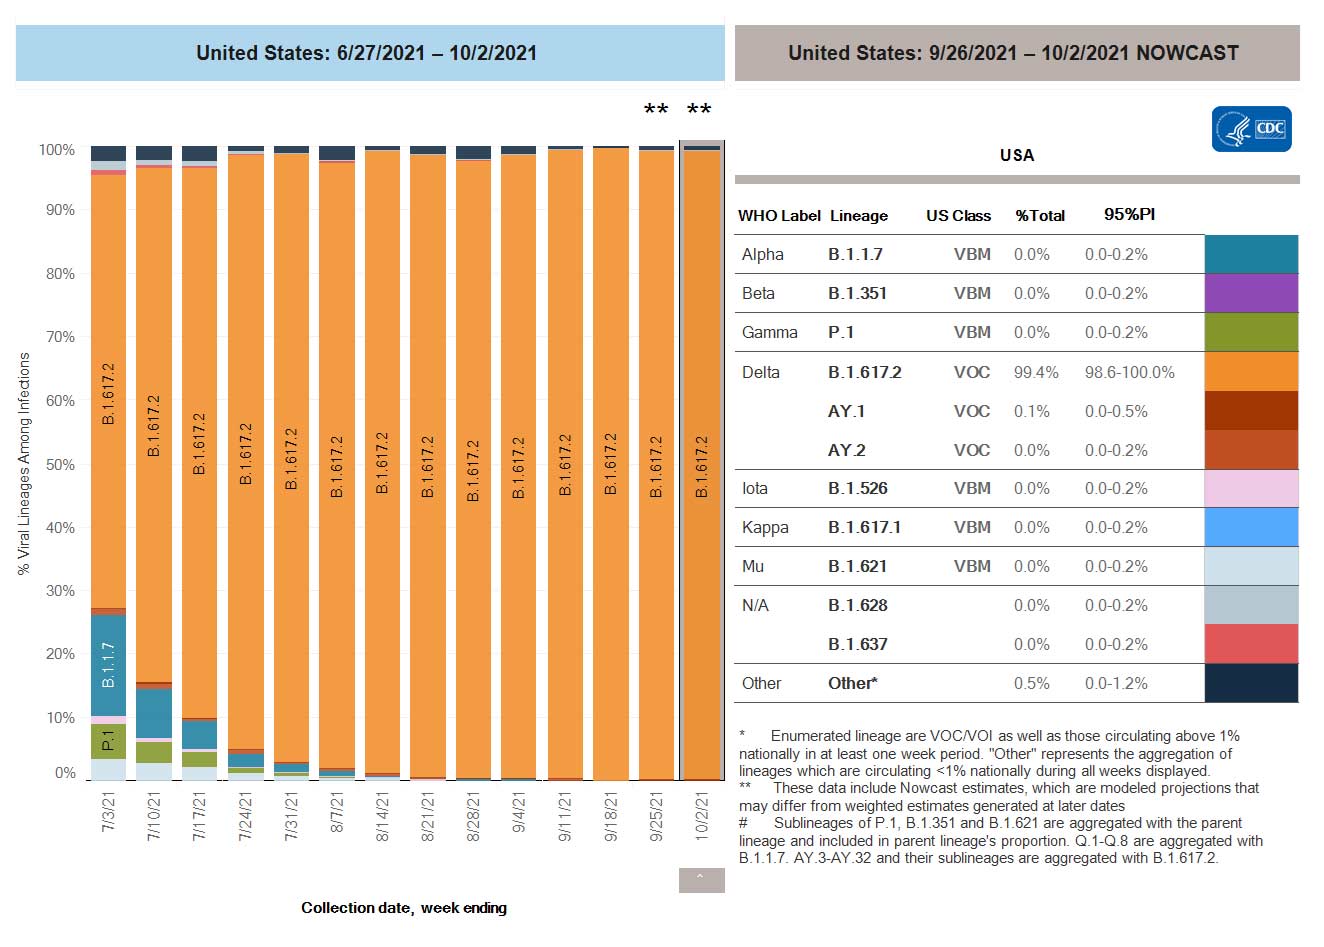
Currently, the Delta variant is the only variant classified as a Variant of Concern (VOC) in the United States. There are no variants classified as a Variant of Interest (VOI) and there are 10 variants classified as Variants Being Monitored (VBM). VBM do not pose a significant and imminent risk to public health in the United States due to their very low prevalence, which is currently estimated to be less than 0.1%.

Nowcast projections* for the week ending October 2, 2021, estimate the national proportion of the Delta variant to be greater than 99%. Nowcast estimates indicate that Delta will continue to be the predominant variant circulating in all 10 U.S. Department of Health and Human Services (HHS) regions, circulating at greater than 99%.

*The median time from specimen collection to sequence data reporting is about 3 weeks. As a result, weighted estimates for the most recent few weeks may be unstable or unavailable. CDC’s Nowcast is a data projection tool that helps fill this gap by generating timely estimates of variant proportions for variants that are circulating in the United States. View Nowcast estimates on CDC’s COVID Data Tracker website on the Variant Proportions page.

SARS-CoV-2 Variants Circulating in the United States

resize iconView Larger

resize iconView Larger
More Variants Data


Testing


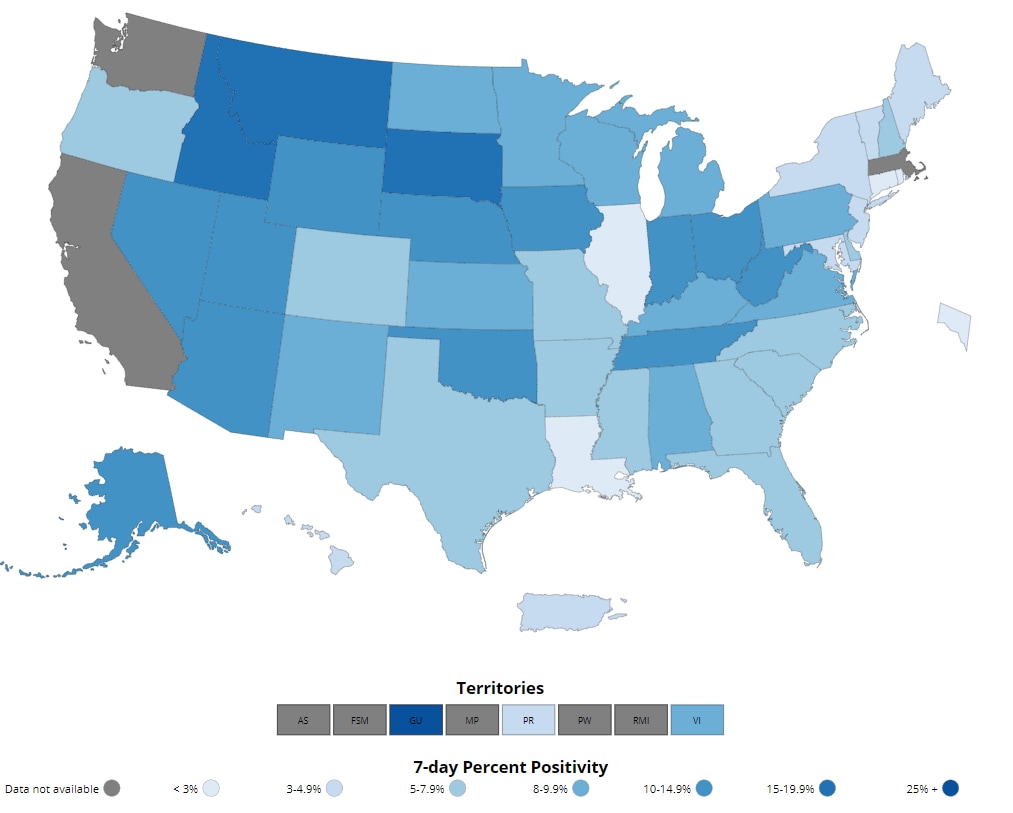
The percentage of COVID-19 NAATs (nucleic acid amplification tests)* that are positive (percent positivity) has decreased from the previous week. The 7-day average of percent positivity from NAATs is now 6.1%. The 7-day average number of tests reported for September 24 – September 30, 2021, was 1,536,250, down 6.0% from 1,634,837 for the prior 7 days.

586,818,195
Total Tests Reported

1,536,250
7-Day Average Tests Reported

6.1%
7-Day Average % Positivity

6.5%
Previous 7-Day Average % Positivity

-5.9%
Change in 7-Day Average % Positivity since Prior Week

*Test for SARS-CoV-2, the virus that causes COVID-19

COVID-19 NAAT Laboratory Test 7-day Percent Positivity by State/Territory

resize iconView Larger
More Testing Data


Vaccinations


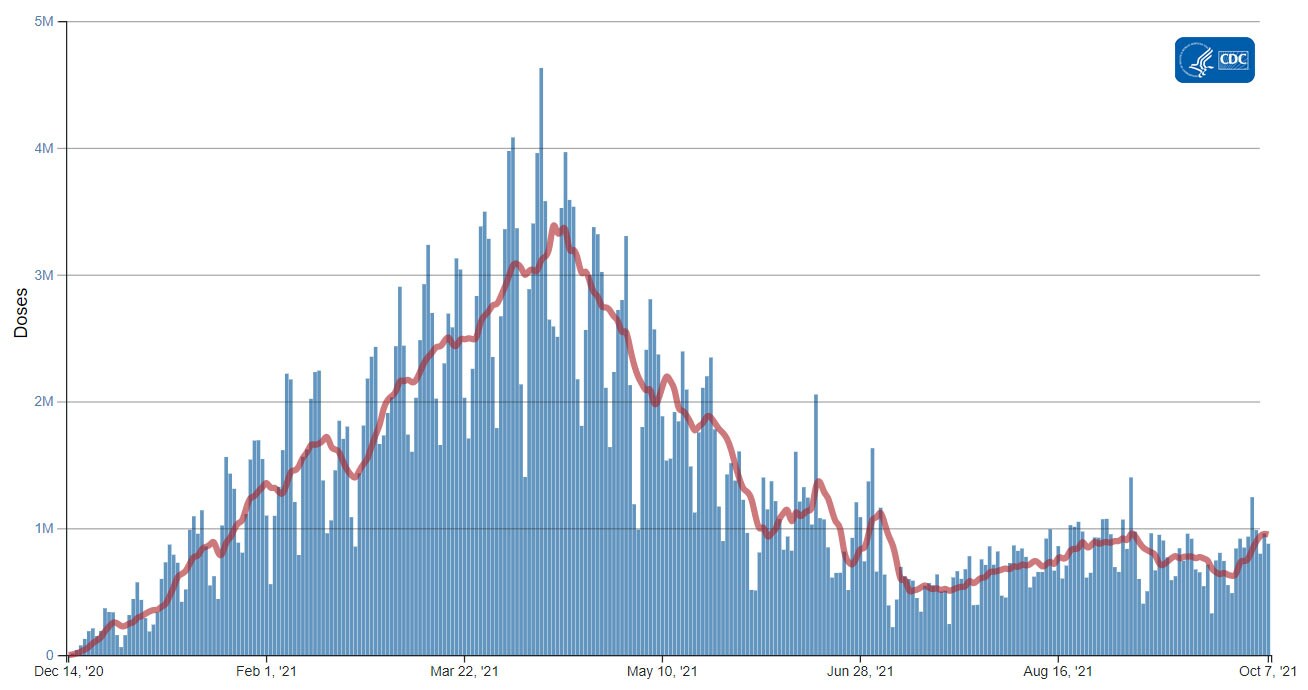
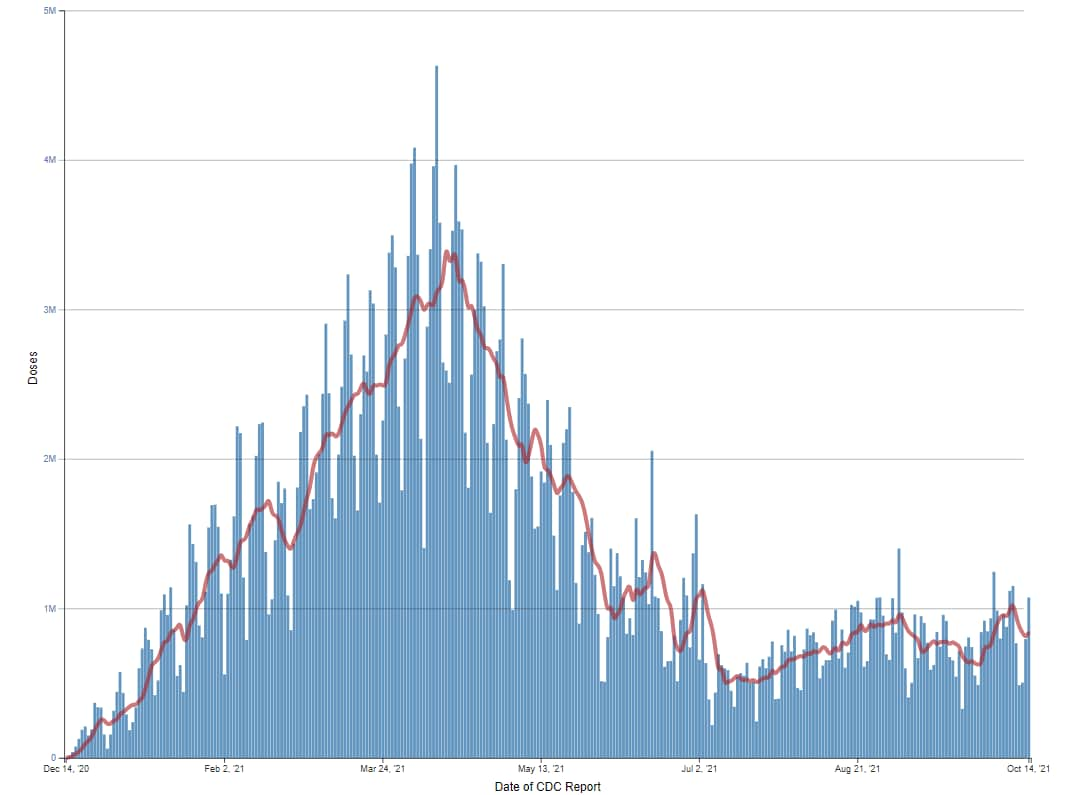
The U.S. COVID-19 Vaccination Program began December 14, 2020. As of October 7, 2021, 399.6 million vaccine doses have been administered. Overall, about 216.3 million people, or 65.1% of the total U.S. population, have received at least one dose of vaccine. About 186.6 million people, or 56.2% of the total U.S. population, have been fully vaccinated.* About 6.4 million additional/booster doses in fully vaccinated people have been reported. As of October 7, 2021, the 7-day average number of administered vaccine doses reported (by date of CDC report) to CDC per day was 948,921, a 30.5% increase from the previous week.

CDC’s COVID Data Tracker Vaccination Demographic Trends tab shows vaccination trends by age group. As of October 7, 2021, 94.7% of people ages 65 years or older have received at least one dose of vaccine and 83.8% are fully vaccinated. More than three-quarters (78%) of people ages 18 years or older have received at least one dose of vaccine and 67.6% are fully vaccinated. For people ages 12 years or older, 76.2% have received at least one dose of vaccine and 65.8% are fully vaccinated.

399,552,444
Vaccines Administered

216,268,034
People who received at least one dose

186,618,184
People who are fully vaccinated*

65.1%
Percentage of the US population that has received at least one dose

56.2%
Percentage of the US population that has been fully vaccinated*

+0.5
Percentage point increase from last week

+0.6
Percentage point increase from last week

*Represents the number of people who have received the second dose in a two-dose COVID-19 vaccine series (such as the Pfizer or Moderna vaccines) or one dose of the single-shot Johnson & Johnson’s Janssen vaccine.

Daily Change in the Total Number of Administered COVID-19 Vaccine Doses Reported to CDC by the Date of CDC Report, United States
red-line.jpg

7-Day moving average

resize iconView Larger
More Vaccination Data


Hospitalizations

New Hospital Admissions


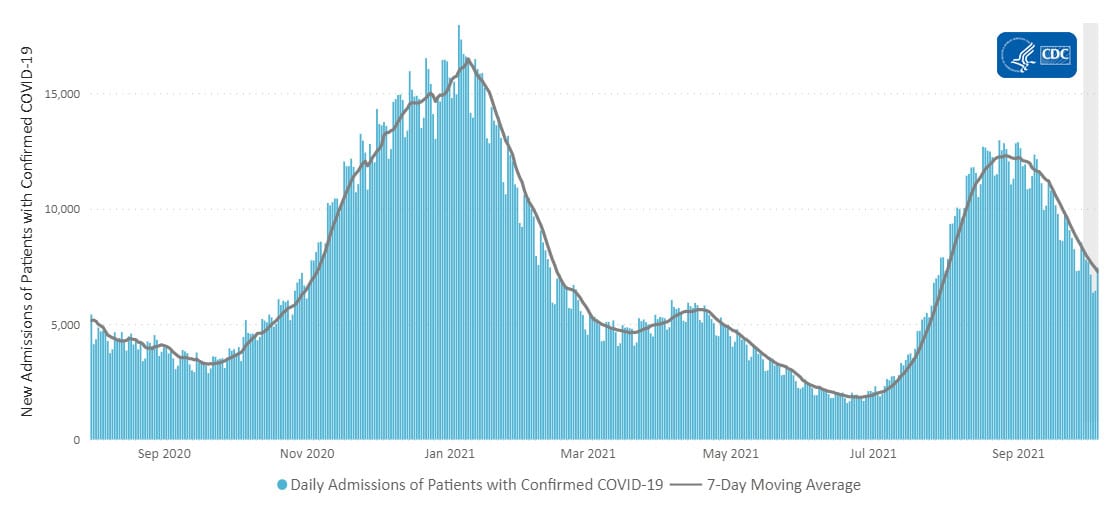
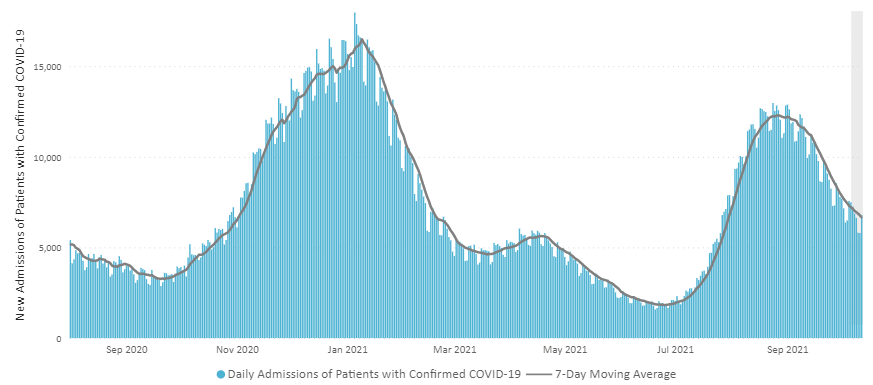
The current 7-day daily average for September 29–October 5, 2021, was 7,440. This is a 13.2% decrease from the prior 7-day average (8,378) from September 22–September 28, 2021.

3,096,659
Total New Admissions

7,440
Current 7-Day Average

8,378
Prior 7-Day Average

-13.2%
Change in 7-Day Average

The start of consistent reporting of hospital admissions data was August 1, 2020.

Daily Trends in Number of New COVID-19 Hospital Admissions in the United States

resize iconView Larger
New admissions are pulled from a 10 am EST snapshot of the HHS Unified Hospital Timeseries Dataset. Due to potential reporting delays, data from the most recent 7 days, as noted in the figure above with the grey bar, should be interpreted with caution. Small shifts in historic data may also occur due to changes in the Centers for Medicare and Medicaid Services (CMS) Provider of Services file, which is used to identify the cohort of included hospitals.

More Hospital Data


COVID-NET: Trends in Hospitalization Rates in Adults


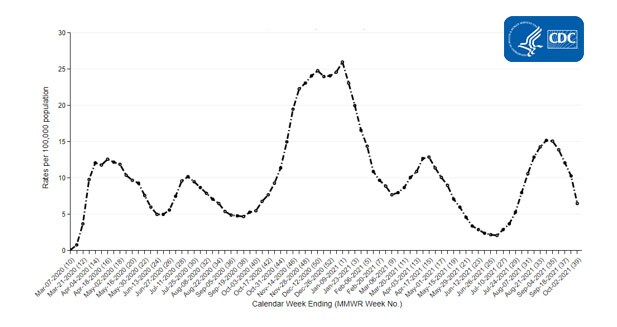
CDC’s Coronavirus Disease 2019-Associated Hospitalization Surveillance Network (COVID-NET) shows that rates of COVID-19-associated hospitalizations in adults ages 18 years and older have been declining in recent weeks. Rates of COVID-19-associated hospitalizations for adults peaked at 15.2 per 100,000 people in late August. Since then, preliminary data show that rates of COVID-19-associated hospitalizations in this group have fallen to 12.1 per 100,000 for the week ending September 18, 2021.

Trends in Hospitalization Rates in Adults


resize iconView Larger
The Coronavirus Disease 2019 (COVID-19)-Associate­­d Hospitalization Surveillance Network (COVID-NET) is an additional source for hospitalization data collected through a network of more than 250 acute-care hospitals in 14 states (representing ~10% of the U.S. population). Detailed data on patient demographics, including race/ethnicity, underlying medical conditions, medical interventions, and clinical outcomes, are standardized case reporting form.
More COVID-NET Data

Deaths


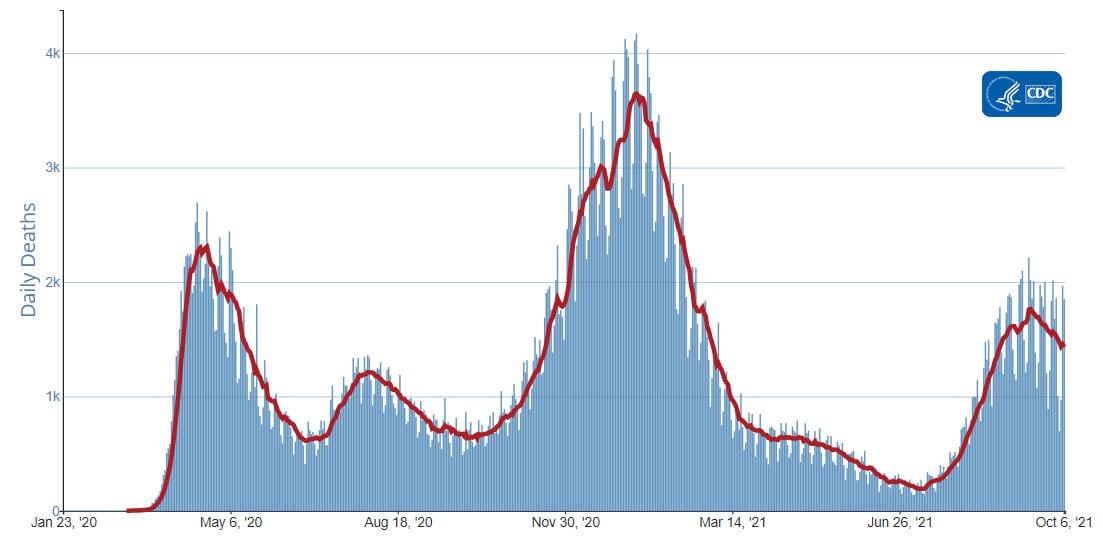
The current 7-day moving average of new deaths (1,431) has decreased 8.4% compared with the previous 7-day moving average (1,563). As of October 6, 2021, a total of 707,065 COVID-19 deaths have been reported in the United States.

707,065
Total Deaths Reported

1,431
Current 7-Day Average*

1,563
Prior 7-Day Average

-8.4%
Change in 7-Day Average Since Prior Week

*Historical deaths are excluded from the daily new deaths and 7-day average calculations until they are incorporated into the dataset by their applicable date. Of 8,784 historical deaths reported retroactively, 216 were reported in the current week; and 631 were reported in the prior week.

Daily Trends in Number of COVID-19 Deaths in the United States Reported to CDC
red-line.jpg

7-Day moving average

resize iconView Larger
More Death Data


Recent CDC COVID-19 Publications
  1. National and State Trends in Anxiety and Depression Severity Scores Among Adults During the COVID-19 Pandemic — United States, 2020–2021
  2. Multicomponent Strategies to Prevent SARS-CoV-2 Transmission — Nine Overnight Youth Summer Camps, United States, June–August 2021
  3. COVID-19 Outbreaks at Youth Summer Camps — Louisiana, June–July 2021
  4. Disparities in COVID-19 Vaccination Status, Intent, and Perceived Access for Noninstitutionalized Adults, by Disability Status — National Immunization Survey Adult COVID Module, United States, May 30–June 26, 2021
  5. Distribution of SARS-CoV-2 Variants in a Large Integrated Health Care System — California, March–July 2021
Recent COVID Data Tracker Updates
  • COVID-19 vaccine booster dose data is now available for download on the Vaccinations in the US tab
  • A new Vaccine Effectiveness tab shows vaccine effectiveness against hospitalizations and infections
  • The Vaccinations in the US tab now displays the number and percent of booster doses by certain age groupings (Total, 18+, 50+, and 65+), and the number of people with a booster dose by vaccine type
  • The COVID Data Tracker homepage stats bar now shows the percent of the 12+ population with at least one dose of a COVID-19 vaccine
https://www.cdc.gov/coronavirus/2019-ncov/covid-data/covidview/index.html
 
covid-tracker-header-lrg.jpg
COVID Data Tracker Weekly Review


Print
Subscribe to the Weekly Review


Interpretive Summary for October 15, 2021
Healthy Futures


resize iconView Larger
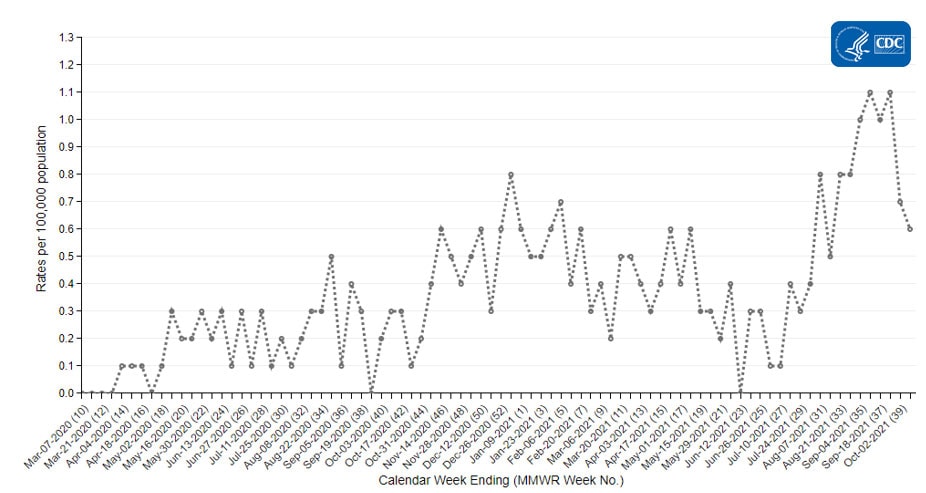
Fewer cases of COVID-19 have been reported in children (ages 0-17 years) compared with adults.[SUP]1-3[/SUP] Rates of COVID-19-associated hospitalizations are also lower in children of all ages compared to adults, but some children develop acute COVID-19 symptoms requiring hospitalization.[SUP]4[/SUP] All eligible people, including adolescents ages 12-17 years, should get vaccinated to help stop the pandemic. Everyone in the United States 12 years and older is eligible to receive a COVID-19 vaccine, yet vaccination coverage among adolescents is lower than in older groups.[SUP]5[/SUP]

Children with underlying medical conditions, including obesity, are at increased risk for severe COVID-19 illness* compared to children without underlying medical conditions. Children diagnosed with obesity may experience worse outcomes from COVID-19.[SUP]6[/SUP] A recent CDC study looking at body mass index (BMI) suggests that many children and adolescents gained weight faster during the COVID-19 pandemic than before the pandemic.** This was especially true among children and adolescents who had overweight or obesity before the pandemic.[SUP]7[/SUP]

In addition to the steps everyone should take to slow the spread of COVID-19, people can help protect themselves and their families by eating a healthy diet, being active, getting enough sleep, and learning to cope with stress in a healthy way. Parents and caregivers can further protect their children by maintaining well-child visits and recommended vaccines, including COVID-19 vaccines for children ages 12 years and older. If you have questions about childhood vaccines, talk with your child’s pediatrician or healthcare provider. To find a vaccine provider near you, visit vaccines.gov or your state or local public health department website.

*Severe illness means that the person with COVID-19 requires hospitalization, intensive care, or a ventilator to help them breathe.
**Body mass index (BMI) is a measurement that takes into account a person’s weight relative to their height. Although children are expected to have increases in BMI as they grow, rapid increases can raise concern over too much weight for health. The rate of BMI change tells us how much BMI changes over a specific time period. This study looked at monthly changes in the rate of BMI at two time periods —before the COVID-19 pandemic (January 2018-February 2020) and during the pandemic (March-November 2020). This study involved a cohort of 432,302 children and adolescents between the ages of 2-19 years.

Note to readers: CDC’s MMWR is excited to announce the release of two new web pages. MMWR’s updated COVID-19 Reports web page features a user-friendly experience, including the latest on COVID-19 vaccine safety and effectiveness, as well as links to MMWR’s Featured Report, MMWR podcasts, and MMWR graphics pages. And MMWR’s COVID-19 Graphics web page allows you to find all of MMWR’s COVID-19 graphics housed in one location. You can also click the report link under each image to read the full MMWR report.


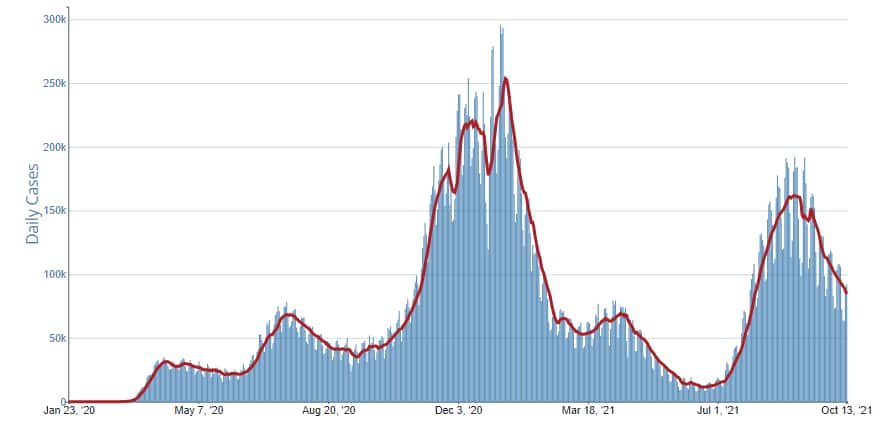
Reported Cases


The current 7-day moving average of daily new cases (84,555) decreased 12.5% compared with the previous 7-day moving average (96,666). A total of 44,615,528 COVID-19 cases have been reported as of October 13, 2021.

44,615,528
Total Cases Reported

84,555
Current 7-Day Average*

96,666
Prior 7-Day Average

-12.5%
Change in 7-Day Average since Prior Week

*Historical cases are excluded from daily new cases and 7-day average calculations until they are incorporated into the dataset for the applicable date. Of 124,485 historical cases reported retroactively, 3,611 were reported in the current week and 14,358 were reported in the prior week.

Daily Trends in COVID-19 Cases in the United States Reported to CDC
red-line.jpg

7-Day moving average

resize iconView Larger
More Case Data


SARS-CoV-2 Variants


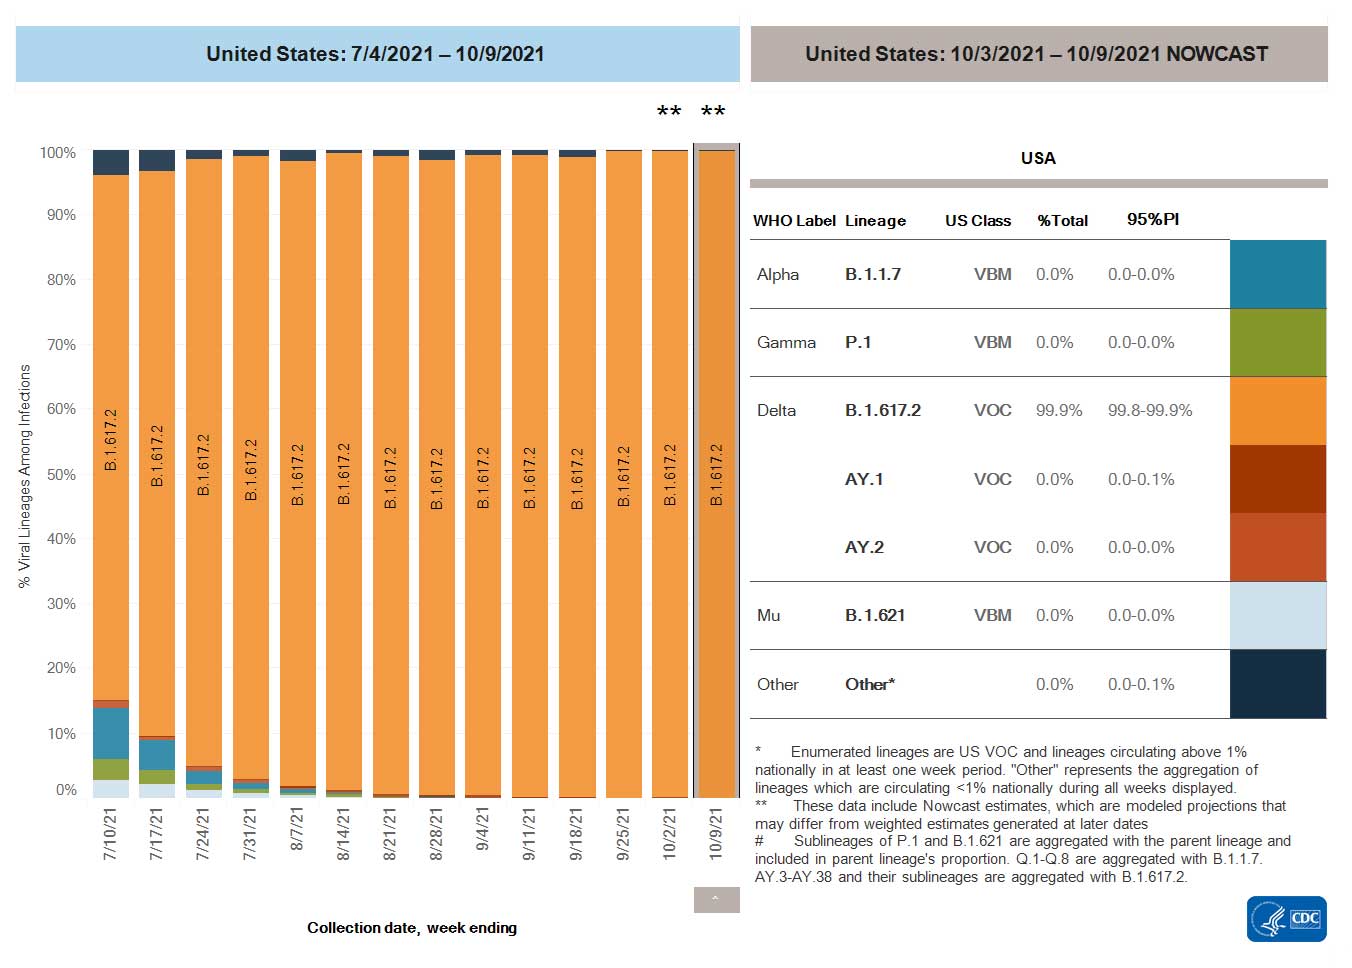
Currently, the Delta variant is the only variant classified as a Variant of Concern (VOC) in the United States. There are no variants classified as a Variant of Interest (VOI) and there are ten variants classified as Variants Being Monitored (VBM). VBM do not pose a significant and imminent risk to public health in the United States due to their very low prevalence, which is currently estimated to be less than 0.1%.

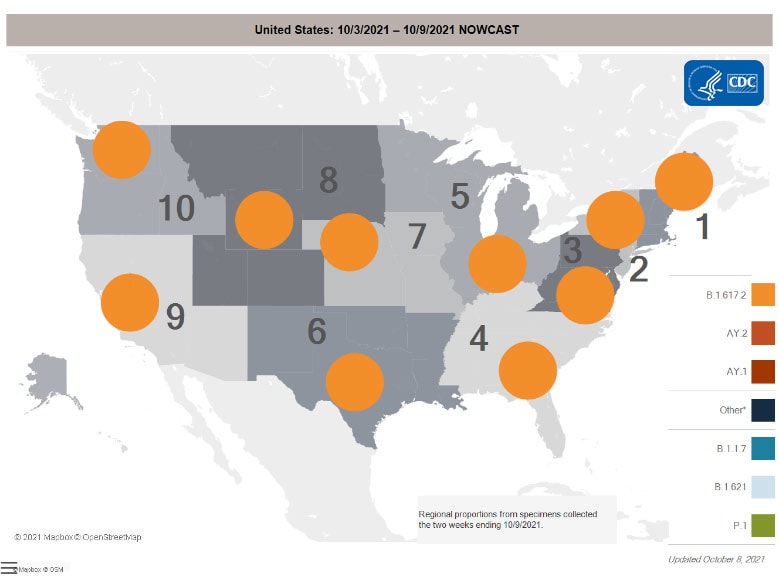
Nowcast projections* for the week ending October 9, 2021, estimate the national proportion of the Delta variant to be greater than 99%. Nowcast estimates indicate that Delta will continue to be the predominant variant circulating in all 10 U.S. Department of Health and Human Services (HHS) regions, circulating at greater than 99%.

*The median time from specimen collection to sequence data reporting is about 3 weeks. As a result, weighted estimates for the most recent few weeks may be unstable or unavailable. CDC’s Nowcast is a data projection tool that helps fill this gap by generating timely estimates of variant proportions for variants that are circulating in the United States. View Nowcast estimates on CDC’s COVID Data Tracker website on the Variant Proportions page.

SARS-CoV-2 Variants Circulating in the United States

resize iconView Larger

resize iconView Larger
More Variants Data


Testing


The percentage of COVID-19 NAATs (nucleic acid amplification tests)* that are positive (percent positivity) has decreased from the previous week. The 7-day average of percent positivity from NAATs is now 5.7%. The 7-day average number of tests reported for October 1 – October 7, 2021, was 1,488,436, down 5.4% from 1,573,011 for the prior 7 days.

597,258,741
Total Tests Reported

1,488,436
7-Day Average Tests Reported

5.7%
7-Day Average % Positivity

6.0%
Previous 7-Day Average % Positivity

-4.1%
Change in 7-Day Average % Positivity since Prior Week

*Test for SARS-CoV-2, the virus that causes COVID-19

COVID-19 NAAT Laboratory Test 7-day Percent Positivity by State/Territory

resize iconView Larger
More Testing Data


Vaccinations


The U.S. COVID-19 Vaccination Program began December 14, 2020. As of October 14, 2021, 405.4 million vaccine doses have been administered. Overall, about 218 million people, or 65.6% of the total U.S. population, have received at least one dose of vaccine. About 188.3 million people, or 56.7% of the total U.S. population, have been fully vaccinated.* About 9.3 million additional/booster doses in fully vaccinated people have been reported. As of October 14, 2021, the 7-day average number of administered vaccine doses reported (by date of CDC report) to CDC per day was 841,731, a 11.3% decrease from the previous week.

CDC’s COVID Data Tracker Vaccination Demographic Trends tab shows vaccination trends by age group. As of October 14, 2021, 95.4% of people ages 65 years or older have received at least one dose of vaccine and 84.2% are fully vaccinated. More than three-quarters (78.6%) of people ages 18 years or older have received at least one dose of vaccine and 68.1% are fully vaccinated. For people ages 12 years or older, 76.8% have received at least one dose of vaccine and 66.4% are fully vaccinated.

405,444,558
Vaccines Administered

217,953,275
People who received at least one dose

188,281,747
People who are fully vaccinated*

65.6%
Percentage of the US population that has received at least one dose

56.7%
Percentage of the US population that has been fully vaccinated*

+0.5
Percentage point increase from last week

+0.5
Percentage point increase from last week

*Represents the number of people who have received the second dose in a two-dose COVID-19 vaccine series (such as the Pfizer or Moderna vaccines) or one dose of the single-shot Johnson & Johnson’s Janssen vaccine.

Daily Change in the Total Number of Administered COVID-19 Vaccine Doses Reported to CDC by the Date of CDC Report, United States
red-line.jpg

7-Day moving average

resize iconView Larger
More Vaccination Data


Hospitalizations

New Hospital Admissions


The current 7-day daily average for October 6–October 12, 2021, was 6,659. This is an 8.8% decrease from the prior 7-day average (7,303) from September 29–October 5, 2021.

3,143,513
Total New Admissions

6,659
Current 7-Day Average

7,303
Prior 7-Day Average

-8.8%
Change in 7-Day Average

The start of consistent reporting of hospital admissions data was August 1, 2020.

Daily Trends in Number of New COVID-19 Hospital Admissions in the United States

resize iconView Larger
New admissions are pulled from a 10 am EST snapshot of the HHS Unified Hospital Timeseries Dataset. Due to potential reporting delays, data from the most recent 7 days, as noted in the figure above with the grey bar, should be interpreted with caution. Small shifts in historic data may also occur due to changes in the Centers for Medicare and Medicaid Services (CMS) Provider of Services file, which is used to identify the cohort of included hospitals.

More Hospital Data


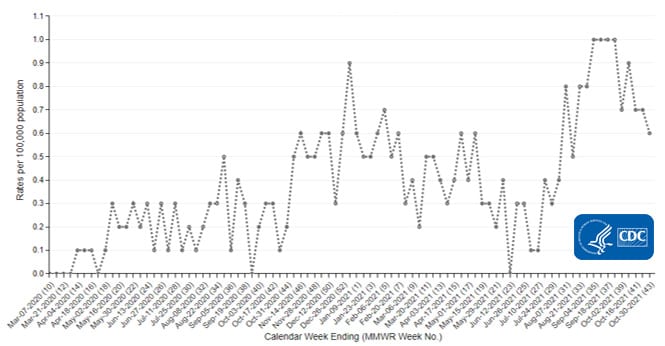
COVID-NET: Trends in Hospitalization Rates in Children Ages 5–11 Years Not Eligible for Vaccination


CDC’s Coronavirus Disease 2019-Associated Hospitalization Surveillance Network (COVID-NET) shows that rates of COVID-19-associated hospitalizations remain elevated in children ages 5–11 years and younger. Recent weekly rates of COVID-19-associated hospitalizations for these children are the highest they have ever been. Rates in children ages 5–11 years are 1.1 per 100,000 for the week ending September 25, 2021. Children 12 years and younger are not yet eligible for any of the available COVID-19 vaccines.

Trends in Hospitalization Rates in Children Ages 5–11 Years Not Eligible for Vaccination


resize iconView Larger
The Coronavirus Disease 2019 (COVID-19)-Associate­­d Hospitalization Surveillance Network (COVID-NET) is an additional source for hospitalization data collected through a network of more than 250 acute-care hospitals in 14 states (representing ~10% of the U.S. population). Detailed data on patient demographics, including race/ethnicity, underlying medical conditions, medical interventions, and clinical outcomes, are standardized case reporting form.
More COVID-NET Data

Deaths


The current 7-day moving average of new deaths (1,241) has decreased 13.4% compared with the previous 7-day moving average (1,434). As of October 13, 2021, a total of 718,681 COVID-19 deaths have been reported in the United States.

718,681
Total Deaths Reported

1,241
Current 7-Day Average*

1,434
Prior 7-Day Average

-13.4%
Change in 7-Day Average Since Prior Week

*Historical deaths are excluded from the daily new deaths and 7-day average calculations until they are incorporated into the dataset by their applicable date. Of 9,266 historical deaths reported retroactively, 469 were reported in the current week; and 220 were reported in the prior week.

Daily Trends in Number of COVID-19 Deaths in the United States Reported to CDC
red-line.jpg

7-Day moving average

resize iconView Larger
More Death Data


References
  1. CDC. COVID Data Tracker: Demographic Trends of COVID-19 cases and deaths in the US reported to CDC. Atlanta, GA: US Department of Health and Human Services, CDC; 2021. https://covid.cdc.gov/covid-data-tracker/#demographics.
  2. Stokes EK, Zambrano LD, Anderson KN, et al. Coronavirus Disease 2019 Case Surveillance – United States, January 22-May 30, 2020. MMWR. 2020;69:759-765. doi:10.15585/mmwr.mm6924e2.
  3. Williams N, Radia T, Harman K, et al. COVID-19 Severe Acute Respiratory Syndrome Coronavirus 2 (SARS-CoV-2) Infection in Children and Adolescents: A Systematic Review of Critically Unwell Children and the Association With Underlying Comorbidities. Eur J Pediatr. 2020;10:1-9.doi:10.1007/s00431-020-03801-6external icon
  4. Kim L, Whitaker M, O’Halloran A, et al. Hospitalization Rates with Characteristics of Children Aged <18 Years Hospitalized with Laboratory-Confirmed COVID-19 ― COVID-Net, 14 States, March 1-July 25, 2020. MMWR Morb Mortal Wkly Rep 2020;69:1081 – 1099. doi: http://dx.doi.org/10.15585/mmwr.mm6932e
  5. CDC. COVID Data Tracker: Percent of People Receiving COVID-19 Vaccine by Age and Date Reported to CDC, United States. Atlanta, GA: US Department of Health and Human Services, CDC; 2021. https://covid.cdc.gov/covid-data-tra...raphics-trends.
  6. Kompaniyets L, Agathis NT, Nelson JM, et al. Underlying Medical Conditions Associated With Severe COVID-19 Illness Among Children. JAMA Netw Open. 2021;4(6):e2111182.doi:10.1001/jamanetworkopen.2021.11182external icon
  7. Lange SJ, Kompaniyets L, Freedman DS, et al. Longitudinal Trends in Body Mass Index Before and During the COVID-19 Pandemic Among Persons Aged 2-19 Years ― United States, 2018-2020. MMWR Morb Mortal Wkly rep 2021;70:1278-1283. doi: http://dx.doi.org/10.15585/mmwr.mm7037a3

Recent CDC COVID-19 Publications
  1. Distribution of SARS-CoV-2 Variants in a Large Integrated Health Care System — California, March–July 2021
  2. Multicomponent Strategies to Prevent SARS-CoV-2 Transmission — Nine Overnight Youth Summer Camps, United States, June–August 2021
  3. COVID-19 Outbreaks at Youth Summer Camps — Louisiana, June–July 2021
  4. National and State Trends in Anxiety and Depression Severity Scores Among Adults During the COVID-19 Pandemic — United States, 2020–2021
Recent COVID Data Tracker Updates
https://www.cdc.gov/coronavirus/2019-ncov/covid-data/covidview/index.html
 
covid-tracker-header-lrg.jpg
COVID Data Tracker Weekly Review


Print
Subscribe to the Weekly Review


Interpretive Summary for October 22, 2021
Prevention is the Best Defense


resize iconView Larger
COVID-19 cases, hospitalizations, and deaths continue to decline, while the number of people who have received at least one dose of a COVID-19 vaccine continues to increase. As of October 21, 2021, more than 189 million people in the United States (approximately 57% of the total U.S. population) are fully vaccinated against COVID-19. Everyone should get vaccinated against COVID-19 as soon as they are eligible, including people who have already had COVID-19.
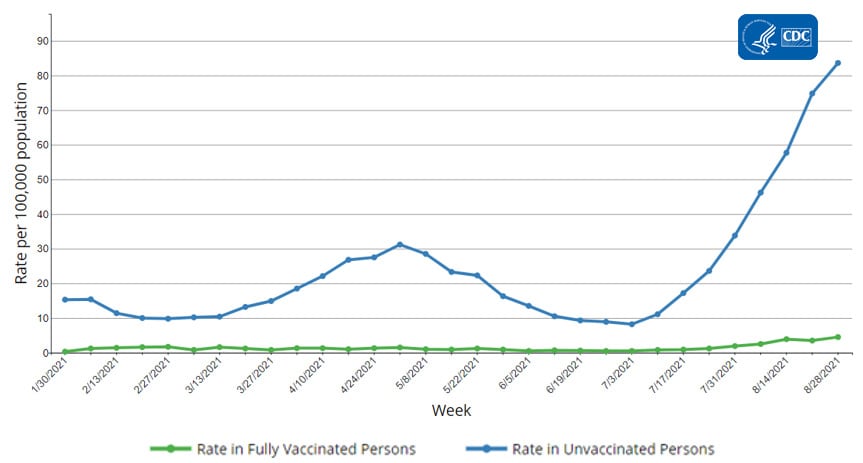
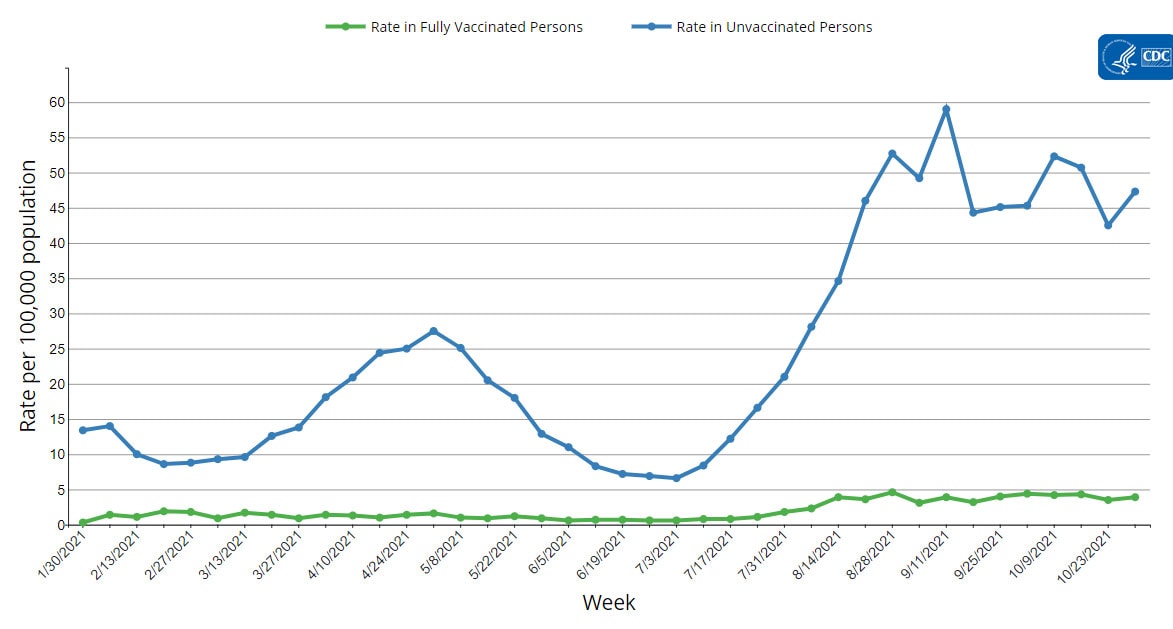
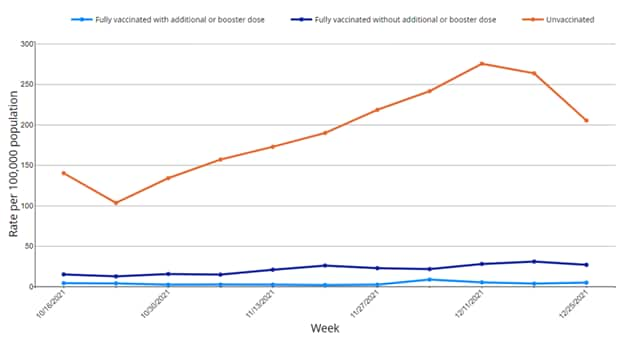
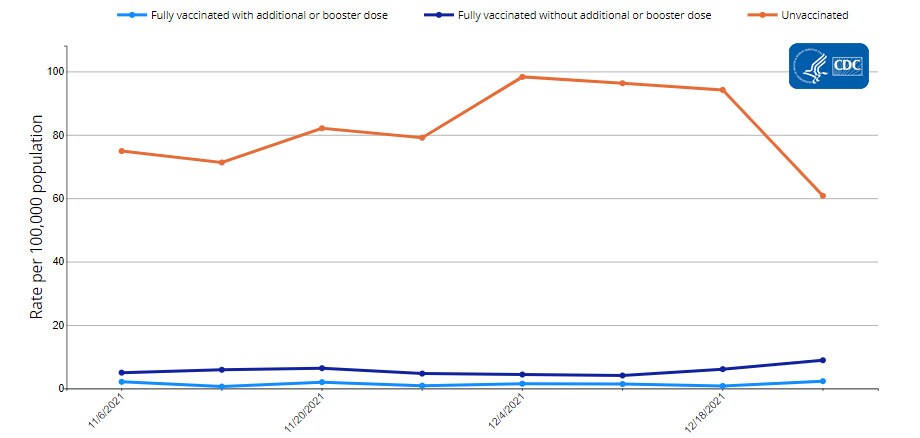
Studies show that the incidence of COVID-19 infection, hospitalization, and death is higher among people who are unvaccinated compared to people who are fully vaccinated. A new COVID Data Tracker page shows that in August 2021, people who were unvaccinated were 11 times more likely to die from COVID-19 than people who were fully vaccinated. A second new COVID Data Tracker page shows that people who were unvaccinated were 12 times more likely to be hospitalized with COVID-19 compared to people who were fully vaccinated.* Additionally, a recent CDC-supported evaluation found that two doses of Pfizer-BioNTech vaccine were 93% effective at preventing COVID-19 hospitalization in adolescents ages 12-18 years.

Getting vaccinated against COVID-19 helps protect people from getting sick with or severely ill from COVID-19. People who are unvaccinated remain the most vulnerable to COVID-19. COVID-19 vaccination, along with layered prevention strategies, continues to be our best defense against severe disease. Getting a COVID-19 vaccine is fast, easy, and free. To find a vaccine provider near you, visit vaccines.gov or your state or local public health department website.

*Preliminary analyses through August 2021 show that among adults 18 years of age and older, the age-adjusted hospitalization rate was 12 times higher in unvaccinated people than those who were vaccinated. Among adults between 18-49 years of age, the rate was 14 times higher. And among adults 65 years and older, the rate was 9 times higher.

Note to readers: COVID-19 vaccines are effective and are a critical tool to bring the pandemic under control. However, no vaccine is 100% effective at preventing illness and some “breakthrough infections” resulting in hospitalizations are expected among people who are fully vaccinated. Based on data from COVID-NET, of COVID-19-associated hospital admissions from January–August 2021, 7% were fully vaccinated; in August 2021, 21% were fully vaccinated. The proportion of patients hospitalized with COVID-19 who are fully vaccinated is expected to increase as more people get vaccinated even though these vaccines are highly effective against hospitalization and death.


Reported Cases


The current 7-day moving average of daily new cases (73,079) decreased 15.1% compared with the previous 7-day moving average (86,046). A total of 45,149,234 COVID-19 cases have been reported as of October 20, 2021.

45,149,234
Total Cases Reported

73,079
Current 7-Day Average*

86,046
Prior 7-Day Average

-15.1%
Change in 7-Day Average since Prior Week

*Historical cases are excluded from daily new cases and 7-day average calculations until they are incorporated into the dataset for the applicable date. Of 127,768 historical cases reported retroactively, 3,280 were reported in the current week and 3,611 were reported in the prior week.

Daily Trends in COVID-19 Cases in the United States Reported to CDC
red-line.jpg

7-Day moving average

resize iconView Larger
More Case Data


SARS-CoV-2 Variants


Currently, Delta is the only variant classified as a Variant of Concern (VOC) in the United States. Nowcast projections* for the week ending October 16, 2021, estimate the national and regional proportions of the Delta variant to be greater than 99%.

*The median time from specimen collection to sequence data reporting is about 3 weeks. As a result, weighted estimates for the most recent few weeks may be unstable or unavailable. CDC’s Nowcast is a data projection tool that helps fill this gap by generating timely estimates of variant proportions for variants that are circulating in the United States. View Nowcast estimates on CDC’s COVID Data Tracker website on the Variant Proportions page.

SARS-CoV-2 Variants Circulating in the United States

resize iconView Larger
More Variants Data


Vaccinations


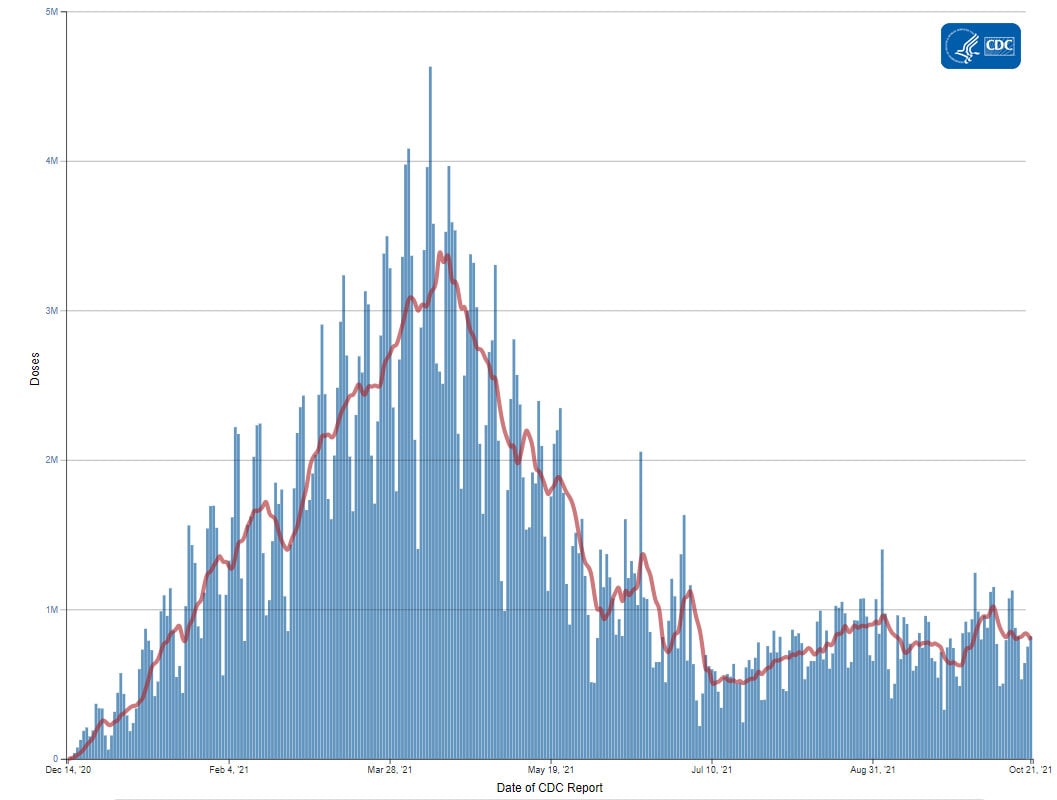
The U.S. COVID-19 Vaccination Program began December 14, 2020. As of October 21, 2021, 411 million vaccine doses have been administered. Overall, about 219.6 million people, or 66.2% of the total U.S. population, have received at least one dose of vaccine. About 189.9 million people, or 57.2% of the total U.S. population, have been fully vaccinated.* About 11.6 million additional/booster doses in fully vaccinated people have been reported. As of October 21, 2021, the 7-day average number of administered vaccine doses reported (by date of CDC report) to CDC per day was 795,156, a 5.5% decrease from the previous week.

CDC’s COVID Data Tracker Vaccination Demographic Trends tab shows vaccination trends by age group. As of October 21, 2021, 96% of people ages 65 years or older have received at least one dose of vaccine and 84.5% are fully vaccinated. More than three-quarters (79.2%) of people ages 18 years or older have received at least one dose of vaccine and 68.7% are fully vaccinated. For people ages 12 years or older, 77.4% have received at least one dose of vaccine and 66.9% are fully vaccinated.

411,010,650
Vaccines Administered

219,624,445
People who received at least one dose

189,924,447
People who are fully vaccinated*

66.2%
Percentage of the US population that has received at least one dose

57.2%
Percentage of the US population that has been fully vaccinated*

+0.6
Percentage point increase from last week

+0.5
Percentage point increase from last week

*Represents the number of people who have received the second dose in a two-dose COVID-19 vaccine series (such as the Pfizer or Moderna vaccines) or one dose of the single-shot Johnson & Johnson’s Janssen vaccine.

Daily Change in the Total Number of Administered COVID-19 Vaccine Doses Reported to CDC by the Date of CDC Report, United States
red-line.jpg

7-Day moving average

resize iconView Larger
More Vaccination Data


Hospitalizations

New Hospital Admissions


The current 7-day daily average for October 13–October 19, 2021, was 6,004. This is an 10.3% decrease from the prior 7-day average (6,695) from October 6–October 12, 2021.

3,185,778
Total New Admissions

6,004
Current 7-Day Average

6,695
Prior 7-Day Average

-10.3%
Change in 7-Day Average

The start of consistent reporting of hospital admissions data was August 1, 2020.

Daily Trends in Number of New COVID-19 Hospital Admissions in the United States

resize iconView Larger
New admissions are pulled from a 10 am EST snapshot of the HHS Unified Hospital Timeseries Dataset. Due to potential reporting delays, data from the most recent 7 days, as noted in the figure above with the grey bar, should be interpreted with caution. Small shifts in historic data may also occur due to changes in the Centers for Medicare and Medicaid Services (CMS) Provider of Services file, which is used to identify the cohort of included hospitals.

More Hospital Data


COVID-NET: Hospitalization Rates by Vaccination Status in Adults


CDC’s Coronavirus Disease 2019-Associated Hospitalization Surveillance Network (COVID-NET) shows that through August 2021, rates of COVID-19-associated hospitalizations are higher in unvaccinated adults compared to fully vaccinated adults regardless of age. The age-adjusted COVID-19-associated hospitalization rate among adults ages 18 years and older was 12 times higher in unvaccinated people than in those who were vaccinated. Age-specific rates of COVID-19-associated hospitalizations are 14 times higher among unvaccinated adults ages 18-49 years, 15 times higher among unvaccinated adults ages 50–64 years, and 9 times higher among unvaccinated adults ages 65 years and older.

Hospitalization Rates by Vaccination Status in Adults


resize iconView Larger
The Coronavirus Disease 2019 (COVID-19)-Associate­­d Hospitalization Surveillance Network (COVID-NET) is an additional source for hospitalization data collected through a network of more than 250 acute-care hospitals in 14 states (representing ~10% of the U.S. population). Detailed data on patient demographics, including race/ethnicity, underlying medical conditions, medical interventions, and clinical outcomes, are standardized case reporting form.
More COVID-NET Data

Deaths


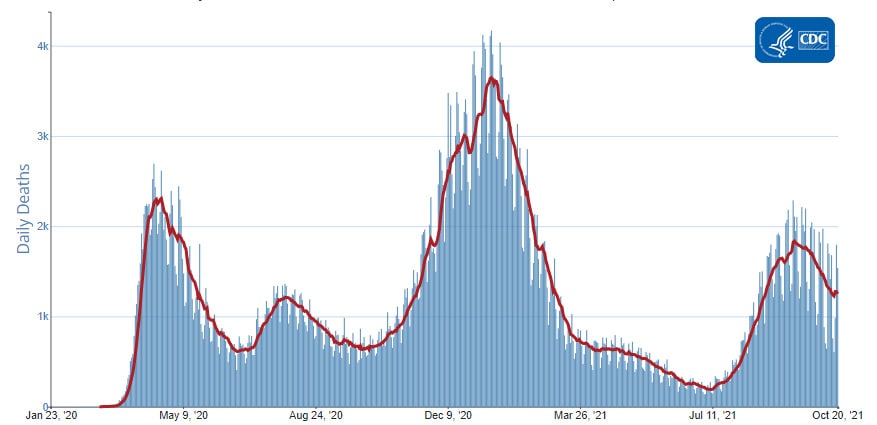
The current 7-day moving average of new deaths (1,253) has decreased 4.3% compared with the previous 7-day moving average (1,309). As of October 20, 2021, a total of 730,368 COVID-19 deaths have been reported in the United States.

730,368
Total Deaths Reported

1,253
Current 7-Day Average*

1,309
Prior 7-Day Average

-4.3%
Change in 7-Day Average Since Prior Week

*Historical deaths are excluded from the daily new deaths and 7-day average calculations until they are incorporated into the dataset by their applicable date. Of 10,471 historical deaths reported retroactively, 1,170 were reported in the current week; and 470 were reported in the prior week.

Daily Trends in Number of COVID-19 Deaths in the United States Reported to CDC
red-line.jpg

7-Day moving average

resize iconView Larger
More Death Data


Testing


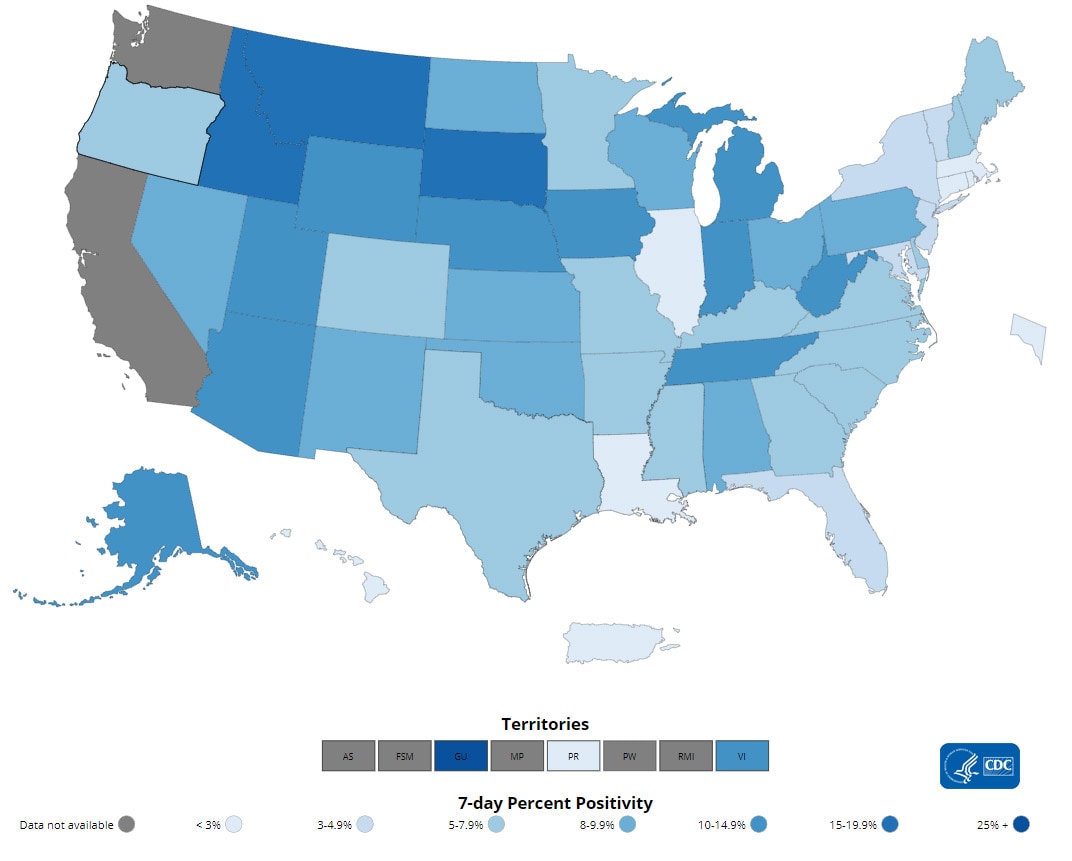
The percentage of COVID-19 NAATs (nucleic acid amplification tests)* that are positive (percent positivity) has decreased from the previous week. The 7-day average of percent positivity from NAATs is now 5.2%. The 7-day average number of tests reported for October 8–October 14, 2021, was 1,416,658, down 7.4% from 1,529,545 for the prior 7 days.

607,673,640
Total Tests Reported

1,416,658
7-Day Average Tests Reported

5.2%
7-Day Average % Positivity

5.6%
Previous 7-Day Average % Positivity

-6.6%
Change in 7-Day Average % Positivity since Prior Week

*Test for SARS-CoV-2, the virus that causes COVID-19

COVID-19 NAAT Laboratory Test 7-day Percent Positivity by State/Territory

resize iconView Larger
More Testing Data


What's New
https://www.cdc.gov/coronavirus/2019-ncov/covid-data/covidview/index.html
 
covid-tracker-header-lrg.jpg


Interpretive Summary for October 29, 2021
Give Me a Boost!


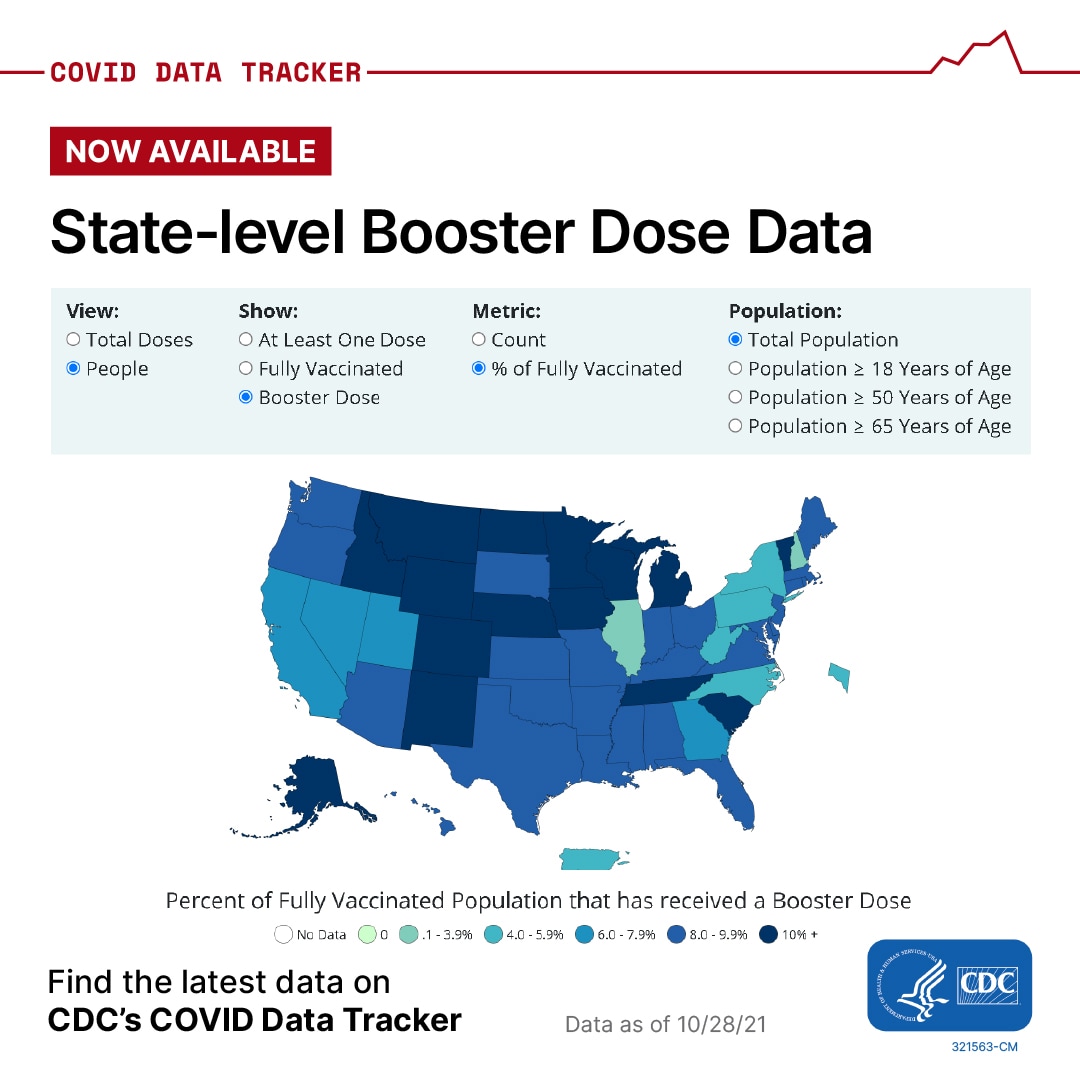
COVID-19 cases, hospitalizations, and deaths continue to decline, but many parts of the country are still experiencing high levels of community transmission. CDC’s COVID Data Tracker shows that, as of October 28, 2021, 221 million people in the United States have received at least one dose of a COVID-19 vaccine. 191 million people are fully vaccinated. More than 15 million people have received a COVID-19 vaccine booster dose.*

Last week, the U.S. Food and Drug Administration (FDA)external icon expanded the use of a COVID-19 vaccine booster dose for certain people. CDC now recommends that everyone 18 years and older who received the Johnson & Johnson/Janssen COVID-19 vaccine two or more months ago receive a booster dose. For people who received a Pfizer-BioNTech or Moderna COVID-19 vaccine, certain groups are now eligible for a booster dose at 6 months or more after their initial 2-dose series. This includes people ages 65 years and older, and people ages 18 years and older who live in long-term care settings, have underlying medical conditions, or live or work in high-risk settings.
Vaccination remains the best way to protect yourself. CDC’s COVID Data Tracker shows that in August 2021, people who were unvaccinated were 11 times more likely to die from COVID-19 than people who were fully vaccinated. People who were unvaccinated were 12 times more likely to be hospitalized with COVID-19 compared to people who were fully vaccinated. Everyone should get vaccinated against COVID-19 as soon as they are eligible, including people who have already had COVID-19. To find a vaccine provider near you, visit vaccines.gov or your state or local public health department website.

*The count of people who received a booster dose includes anyone who is fully vaccinated who has received another dose of COVID-19 vaccine since August 13, 2021. This includes people who received booster doses and people who received additional doses.

Note to readers: People who are eligible for a COVID-19 vaccine booster dose may choose which vaccine they receive as a booster dose. Some people may prefer the vaccine type that they originally received, and others may prefer to get a different booster. CDC’s recommendations now allow for this type of mix and match dosing for booster shots


Reported Cases


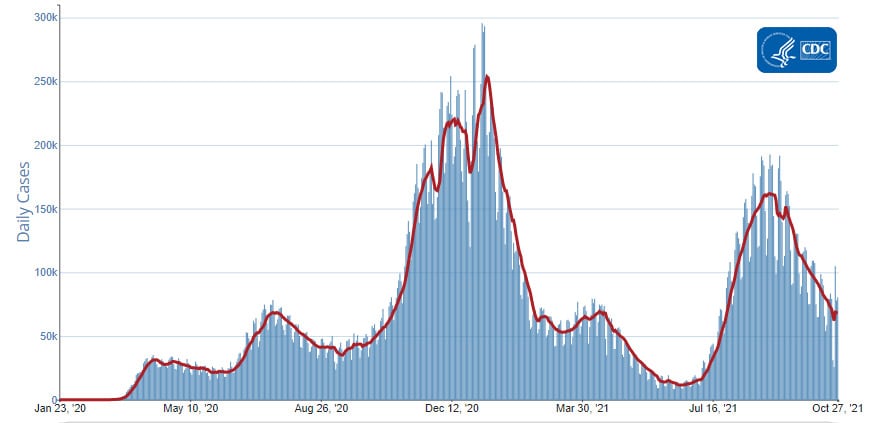
The current 7-day moving average of daily new cases (68,793) decreased 7.4% compared with the previous 7-day moving average (74,290). A total of 45,655,635 COVID-19 cases have been reported as of October 27, 2021.

45,655,635
Total Cases Reported

68,793
Current 7-Day Average*

74,290
Prior 7-Day Average

-7.4%
Change in 7-Day Average since Prior Week

*Historical cases are excluded from daily new cases and 7-day average calculations until they are incorporated into the dataset for the applicable date. Of 129,743 historical cases reported retroactively, 2,004 were reported in the current week and 3,280 were reported in the prior week.

Daily Trends in COVID-19 Cases in the United States Reported to CDC
red-line.jpg

7-Day moving average

resize iconView Larger
More Case Data

SARS-CoV-2 Variants


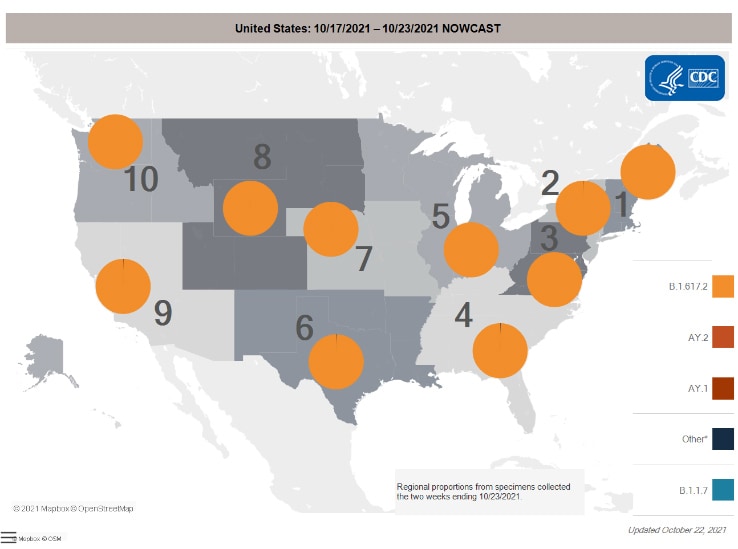
Currently, Delta is the only variant classified as a Variant of Concern (VOC) in the United States. Nowcast projections* for the week ending October 23, 2021, estimate the national and regional proportions of the Delta variant to be greater than 99%.

*The median time from specimen collection to sequence data reporting is about 3 weeks. As a result, weighted estimates for the most recent few weeks may be unstable or unavailable. CDC’s Nowcast is a data projection tool that helps fill this gap by generating timely estimates of variant proportions for variants that are circulating in the United States. View Nowcast estimates on CDC’s COVID Data Tracker website on the Variant Proportions page.

SARS-CoV-2 Variants Circulating in the United States

resize iconView Larger
More Variants Data

Vaccinations


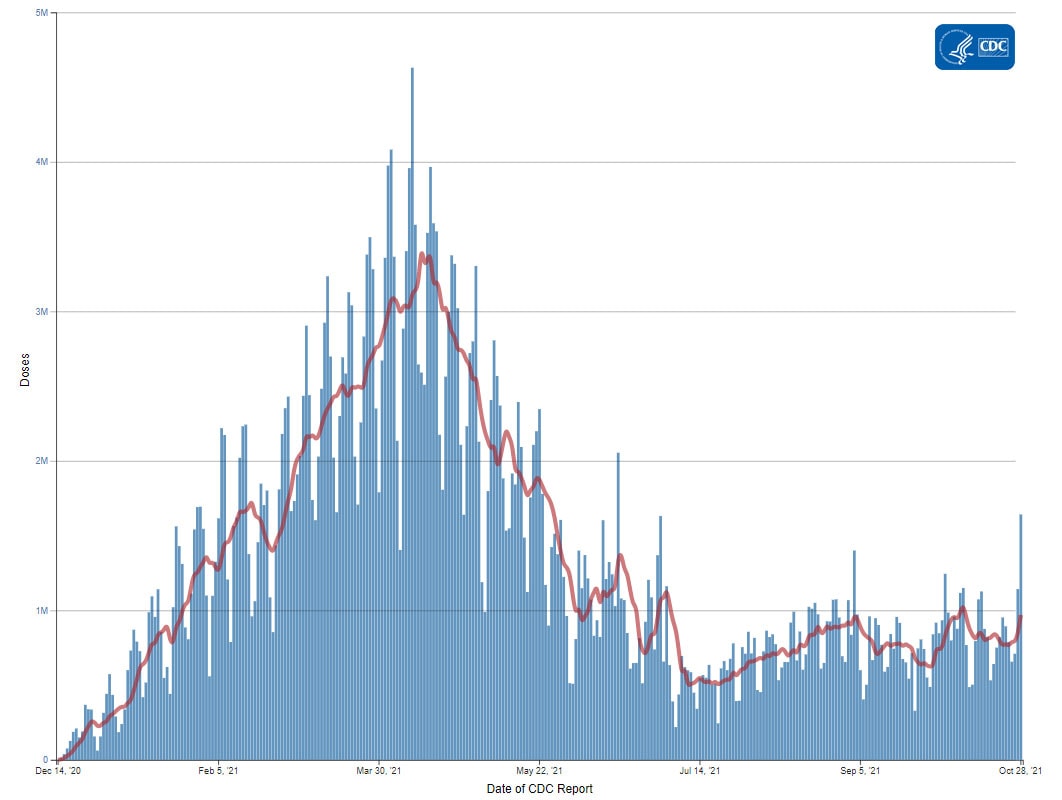
The U.S. COVID-19 Vaccination Program began December 14, 2020. As of October 28, 2021, 417.8 million vaccine doses have been administered. Overall, about 221.3 million people, or 66.7% of the total U.S. population, have received at least one dose of vaccine. About 191.2 million people, or 57.6% of the total U.S. population, have been fully vaccinated.* About 15.4 million additional/booster doses in fully vaccinated people have been reported. As of October 28, 2021, the 7-day average number of administered vaccine doses reported (by date of CDC report) to CDC per day was 969,270, a 21.9% increase from the previous week.

CDC’s COVID Data Tracker Vaccination Demographic Trends tab shows vaccination trends by age group. As of October 28, 2021, 96.9% of people ages 65 years or older have received at least one dose of vaccine and 84.9% are fully vaccinated. More than three-quarters (79.8%) of people ages 18 years or older have received at least one dose of vaccine and 69.2% are fully vaccinated. For people ages 12 years or older, 78% have received at least one dose of vaccine and 67.4% are fully vaccinated.

417,795,537
Vaccines Administered

221,348,530
People who received at least one dose

191,242,432
People who are fully vaccinated*

66.7%
Percentage of the US population that has received at least one dose

57.6%
Percentage of the US population that has been fully vaccinated*

+0.5
Percentage point increase from last week

+0.4
Percentage point increase from last week

*Represents the number of people who have received the second dose in a two-dose COVID-19 vaccine series (such as the Pfizer or Moderna vaccines) or one dose of the single-shot Johnson & Johnson’s Janssen vaccine.

Daily Change in the Total Number of Administered COVID-19 Vaccine Doses Reported to CDC by the Date of CDC Report, United States
red-line.jpg

7-Day moving average

resize iconView Larger
More Vaccination Data

Hospitalizations

New Hospital Admissions


The current 7-day daily average for October 20–October 26, 2021, was 5,404. This is an 10.5% decrease from the prior 7-day average (6,037) from October 13–October 19, 2021.

3,223,806
Total New Admissions

5,404
Current 7-Day Average

6,037
Prior 7-Day Average

-10.5%
Change in 7-Day Average

The start of consistent reporting of hospital admissions data was August 1, 2020.

Daily Trends in Number of New COVID-19 Hospital Admissions in the United States

resize iconView Larger
New admissions are pulled from a 10 am EST snapshot of the HHS Unified Hospital Timeseries Dataset. Due to potential reporting delays, data from the most recent 7 days, as noted in the figure above with the grey bar, should be interpreted with caution. Small shifts in historic data may also occur due to changes in the Centers for Medicare and Medicaid Services (CMS) Provider of Services file, which is used to identify the cohort of included hospitals.

More Hospital Data

COVID-NET: Trends in Hospitalizations of Non-Hispanic Black People


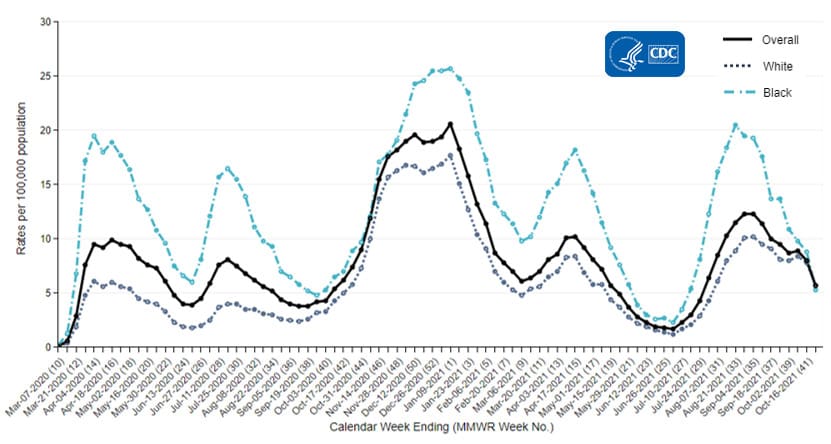
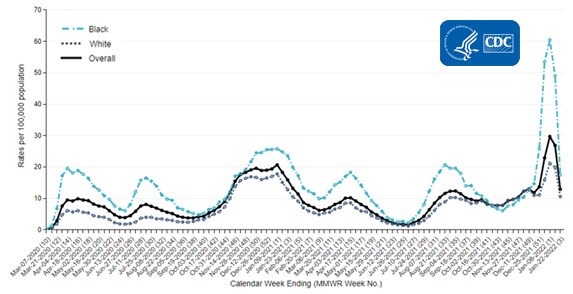
CDC’s Coronavirus Disease 2019-Associated Hospitalization Surveillance Network (COVID-NET) shows that since the start of the pandemic, people from racial and ethnic minority groups have experienced disproportionately higher rates of COVID-19-associated hospitalizations compared to non-Hispanic White people. While rates of hospitalizations have started to decrease in all racial and ethnic groups, the hospitalization rate for non-Hispanic Black people remains higher than other groups. For the week ending October 9, 2021, preliminary data not adjusted for age show rates of COVID-19-associated hospitalizations in non-Hispanic Black people were 9.8 per 100,000 population—17% higher than rates in non-Hispanic White people (8.4 per 100,000).

*Additional information on racial and ethnic disparities in rates of COVID-19-associated hospitalizations can be found in a new report using COVID-NET data hereexternal icon.

Trends in Hospitalizations of Non-Hispanic Black People


resize iconView Larger
The Coronavirus Disease 2019 (COVID-19)-Associate­­d Hospitalization Surveillance Network (COVID-NET) is an additional source for hospitalization data collected through a network of more than 250 acute-care hospitals in 14 states (representing ~10% of the U.S. population). Detailed data on patient demographics, including race/ethnicity, underlying medical conditions, medical interventions, and clinical outcomes, are standardized case reporting form.
More COVID-NET Data

Deaths


The current 7-day moving average of new deaths (1,129) has decreased 9.4% compared with the previous 7-day moving average (1,247). As of October 27, 2021, a total of 740,348 COVID-19 deaths have been reported in the United States.

740,348
Total Deaths Reported

1,129
Current 7-Day Average*

1,247
Prior 7-Day Average

-9.4%
Change in 7-Day Average Since Prior Week

*Historical deaths are excluded from the daily new deaths and 7-day average calculations until they are incorporated into the dataset by their applicable date. Of 10,687 historical deaths reported retroactively, 224 were reported in the current week; and 1,170 were reported in the prior week.

Daily Trends in Number of COVID-19 Deaths in the United States Reported to CDC
red-line.jpg

7-Day moving average

resize iconView Larger
More Death Data

Testing


The percentage of COVID-19 NAATs (nucleic acid amplification tests)* that are positive (percent positivity) has decreased from the previous week. The 7-day average of percent positivity from NAATs is now 4.9%. The 7-day average number of tests reported for October 15 –October 21, 2021, was 1,425,495, down 1.3% from 1,444,590 for the prior 7 days.

618,049,268
Total Tests Reported

1,425,495
7-Day Average Tests Reported

4.9%
7-Day Average % Positivity

5.1%
Previous 7-Day Average % Positivity

-4.1%
Change in 7-Day Average % Positivity since Prior Week

*Test for SARS-CoV-2, the virus that causes COVID-19

COVID-19 NAAT Laboratory Test 7-day Percent Positivity by State/Territory

resize iconView Larger
More Testing Data

What's New
https://www.cdc.gov/coronavirus/2019...iew/index.html
 
covid-tracker-header-lrg.jpg

Print

Subscribe to the Weekly Review


Interpretive Summary for November 5, 2021
This is Their Shot


Last week, the U.S. Food and Drug Administration (FDA)external icon authorized the use of the Pfizer-BioNTech COVID-19 vaccine for children ages 5 through 11 years. CDC now recommends that children ages 5 through 11 get a COVID-19 vaccine. There are approximately 28 million children in this age group in the United States, with nearly 2 million cases of COVID-19 since the start of the pandemic. While fewer COVID-19 cases and hospitalizations have been reported in children compared with adults, children can be hospitalized or die from the virus.

Vaccinating children ages 5 through 11 is critical to preventing infections and possible severe disease. The COVID-19 vaccines being used in the United States are safe and effective. They have undergone – and will continue to undergo – the most intensive safety monitoring in U.S. history. The Pfizer-BioNTech COVID-19 vaccine for children is different than the vaccine that is given to adolescents and adults.* Children ages 5 through 11 will still require two doses three weeks apart to be considered fully vaccinated. Children may have some side effects from COVID-19 vaccination, which are normal signs that their body is building protection.

The Pfizer COVID-19 vaccine is over 90% effective at preventing COVID-19 in children ages 5 to 11 years. Getting your child vaccinated can help protect them against COVID-19, as well as reduce disruptions to in-person learning and activities by helping to reduce the spread of COVID-19. Vaccines can also help keep your child from getting seriously sick even if they do get COVID-19. If you have questions about COVID-19 vaccines in children, talk with your child’s pediatrician or healthcare provider.

*Children 5 through 11 years old will receive a separate vaccine formulation of the Pfizer-BioNTech COVID-19 vaccine that has one-third the dose given to adolescents and adults, and they will receive the vaccine with a smaller needle.

Note to readers: Starting the week of November 8th, vaccines will be available at pediatricians’ offices, pharmacies, Federally Qualified Health Centers, and more. To find vaccine near you, visit vaccines.gov; text your ZIP code to 438829 (GETVAX); or call 1-800-232-0233.


What's New

Reported Cases


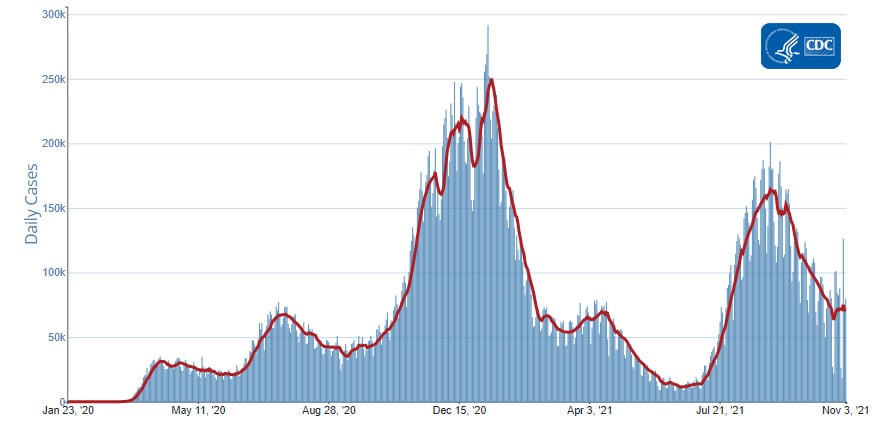
The current 7-day moving average of daily new cases (70,431) decreased 1.4% compared with the previous 7-day moving average (71,450). A total of 46,180,190 COVID-19 cases have been reported as of November 3, 2021.

46,180,190
Total Cases Reported

70,431
Current 7-Day Average*

71,450
Prior 7-Day Average

-1.4%
Change in 7-Day Average since Prior Week

*Historical cases are excluded from daily new cases and 7-day average calculations until they are incorporated into the dataset for the applicable date. Of 316,487 historical cases reported retroactively, 31,407 were reported in the current week and 2,004 were reported in the prior week.

Daily Trends in COVID-19 Cases in the United States Reported to CDC
red-line.jpg

7-Day moving average

resize iconView Larger
More Case Data

SARS-CoV-2 Variants


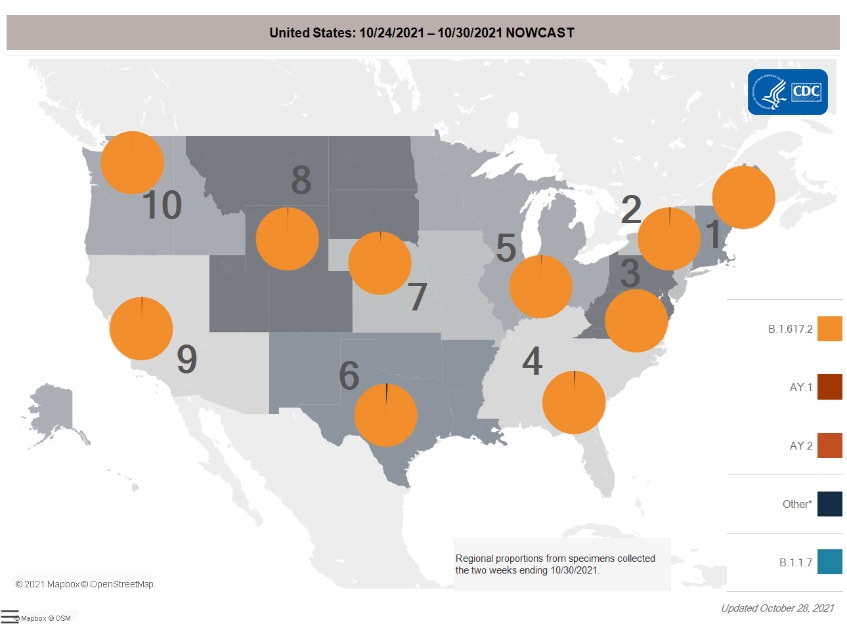
Currently, Delta is the only variant classified as a Variant of Concern (VOC) in the United States. Nowcast projections* for the week ending October 30, 2021, estimate the national and regional proportions of the Delta variant to be greater than 99%.

*The median time from specimen collection to sequence data reporting is about 3 weeks. As a result, weighted estimates for the most recent few weeks may be unstable or unavailable. CDC’s Nowcast is a data projection tool that helps fill this gap by generating timely estimates of variant proportions for variants that are circulating in the United States. View Nowcast estimates on CDC’s COVID Data Tracker website on Variant Proportions page.

SARS-CoV-2 Variants Circulating in the United States

resize iconView Larger
More Variants Data

Vaccinations


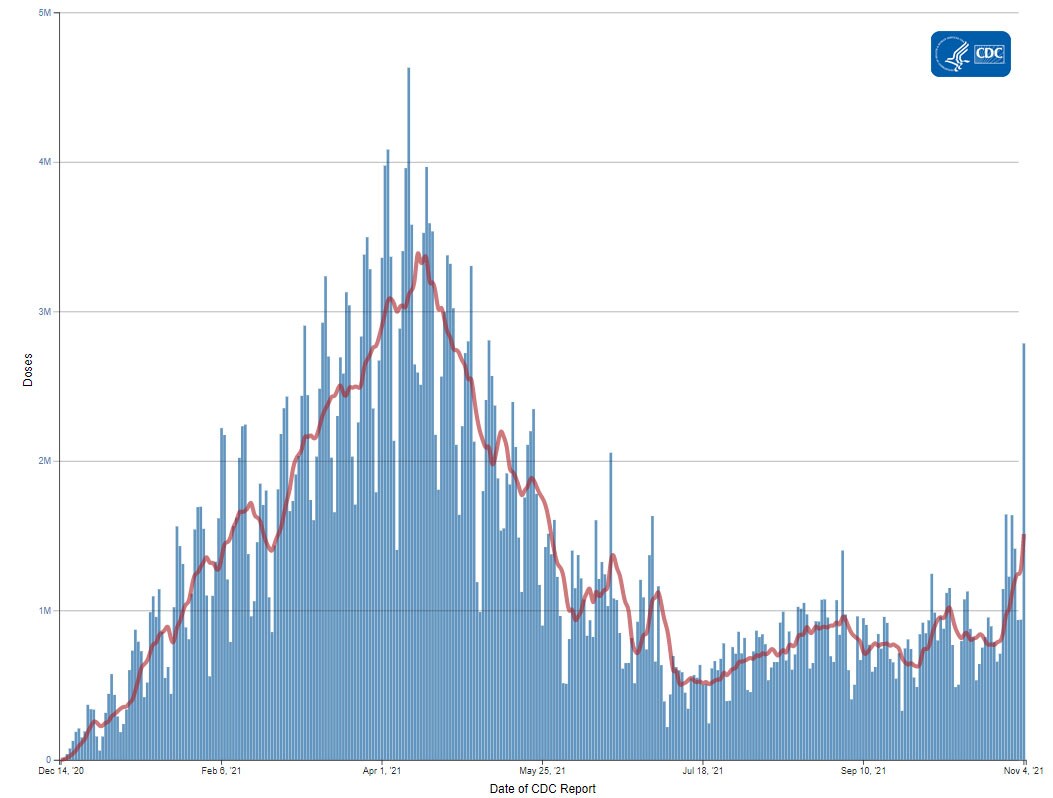
The U.S. COVID-19 Vaccination Program began December 14, 2020. As of November 4, 2021, 426.7 million vaccine doses have been administered. Overall, about 222.6 million people, or 67% of the total U.S. population, have received at least one dose of vaccine. About 193.2 million people, or 58.2% of the total U.S. population, have been fully vaccinated.* About 21.5 million additional/booster doses in fully vaccinated people have been reported. As of November 4, 2021, the 7-day average number of administered vaccine doses reported (by date of CDC report) to CDC per day was 1,510,524, a 55.8% increase from the previous week.

CDC’s COVID Data Tracker Vaccination Demographic Trends tab shows vaccination trends by age group. As of November 4, 2021, 97.8% of people ages 65 years or older have received at least one dose of vaccine and 85.6% are fully vaccinated. More than three-quarters (80.3%) of people ages 18 years or older have received at least one dose of vaccine and 69.9% are fully vaccinated. For people ages 12 years or older, 78.4% have received at least one dose of vaccine and 68.1% are fully vaccinated.

426,728,092
Vaccines Administered

222,591,394
People who received at least one dose

193,227,813
People who are fully vaccinated*

67.0%
Percentage of the US population that has received at least one dose

58.2%
Percentage of the US population that has been fully vaccinated*

+0.3
Percentage point increase from last week

+0.6
Percentage point increase from last week

*Represents the number of people who have received the second dose in a two-dose COVID-19 vaccine series (such as the Pfizer or Moderna vaccines) or one dose of the single-shot Johnson & Johnson’s Janssen vaccine.

Daily Change in the Total Number of Administered COVID-19 Vaccine Doses Reported to CDC by the Date of CDC Report, United States
red-line.jpg

7-Day moving average

resize iconView Larger
More Vaccination Data

Hospitalizations

New Hospital Admissions


The current 7-day daily average for October 27–November 2, 2021, was 5,075. This is a 6.7% decrease from the prior 7-day average (5,441) from October 20–October 26, 2021.

3,257,025
Total New Admissions

5,075
Current 7-Day Average

5,441
Prior 7-Day Average

-6.7%
Change in 7-Day Average

The start of consistent reporting of hospital admissions data was August 1, 2020.

Daily Trends in Number of New COVID-19 Hospital Admissions in the United States

resize iconView Larger
New admissions are pulled from a 10 am EST snapshot of the HHS Unified Hospital Timeseries Dataset. Due to potential reporting delays, data from the most recent 7 days, as noted in the figure above with the grey bar, should be interpreted with caution. Small shifts in historic data may also occur due to changes in the Centers for Medicare and Medicaid Services (CMS) Provider of Services file, which is used to identify the cohort of included hospitals.

More Hospital Data

COVID-NET: Hospitalization Rates among Children Ages 5–11 Years


CDC’s Coronavirus Disease 2019-Associated Hospitalization Surveillance Network (COVID-NET) shows that while rates of COVID-19-associated hospitalizations have started to decrease, rates remain elevated in children ages 5–11 years. Recent weekly rates of COVID-19-associated hospitalizations for these children are 0.7 per 100,000 for the week ending October 16, 2021. This rate is lower than the peak rate of 1.0 per 100,000 for the week ending September 25, 2021, but still higher than other times during the pandemic.

Information on risk factors for severe outcomes in COVID-19-associated hospitalizations among children can be found in a new report using COVID-NET data hereexternal icon.

Hospitalization Rates among Children Ages 5–11 Years


resize iconView Larger
The Coronavirus Disease 2019 (COVID-19)-Associate­­d Hospitalization Surveillance Network (COVID-NET) is an additional source for hospitalization data collected through a network of more than 250 acute-care hospitals in 14 states (representing ~10% of the U.S. population). Detailed data on patient demographics, including race/ethnicity, underlying medical conditions, medical interventions, and clinical outcomes, are standardized case reporting form.
More COVID-NET Data

Deaths


The current 7-day moving average of new deaths (1,110) has decreased 8.8% compared with the previous 7-day moving average (1,217). As of November 3, 2021, a total of 747,970 COVID-19 deaths have been reported in the United States.

747,970
Total Deaths Reported

1,110
Current 7-Day Average*

1,217
Prior 7-Day Average

-8.8%
Change in 7-Day Average Since Prior Week

*Historical deaths are excluded from the daily new deaths and 7-day average calculations until they are incorporated into the dataset by their applicable date. Of 10,624 historical deaths reported retroactively, 211 were reported in the current week; 224 were reported in the prior week.

Daily Trends in Number of COVID-19 Deaths in the United States Reported to CDC
red-line.jpg

7-Day moving average

resize iconView Larger
More Death Data

Testing


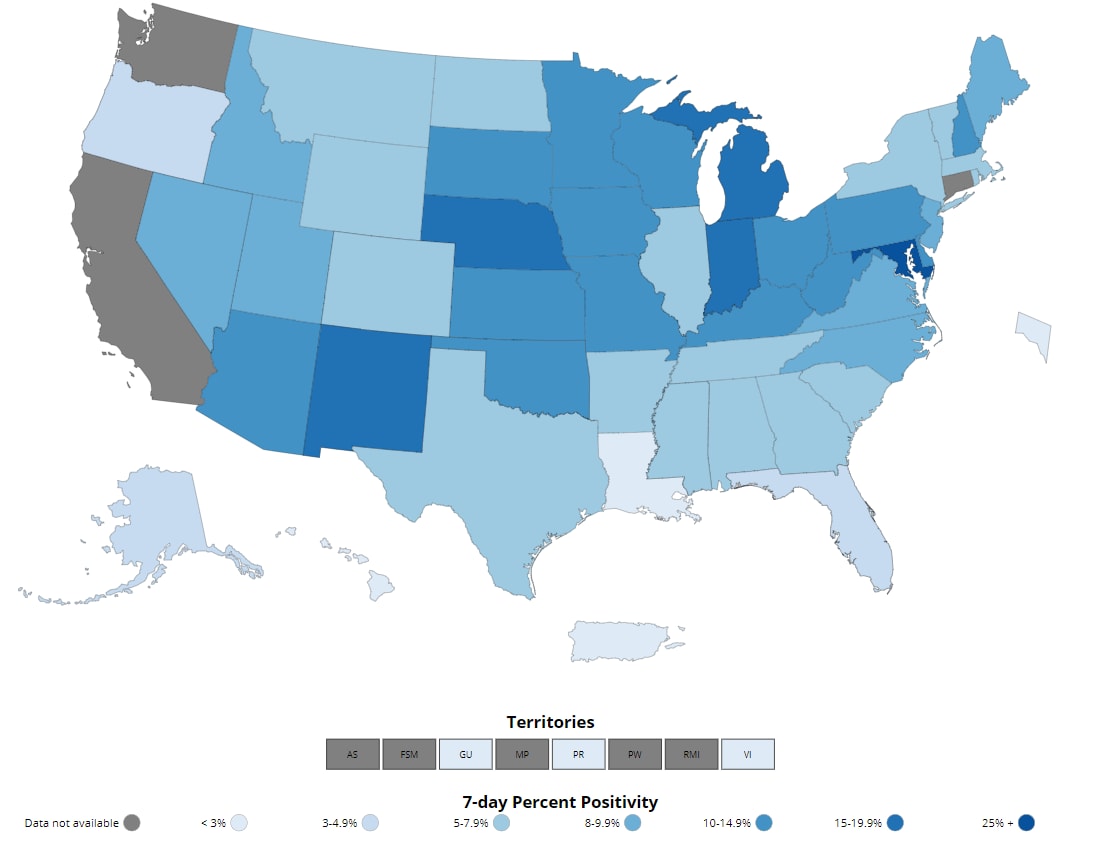
The percentage of COVID-19 NAATs (nucleic acid amplification tests)* that are positive (percent positivity) has decreased from the previous week. The 7-day average of percent positivity from NAATs is now 5.0%. The 7-day average number of tests reported for October 22 – October 28, 2021, was 1,337,270, down 7.4% from 1,444,515 for the prior 7 days.

627,030,456
Total Tests Reported

1,337,270
7-Day Average Tests Reported

5.0%
7-Day Average % Positivity

4.8%
Previous 7-Day Average % Positivity

+3.1%
Change in 7-Day Average % Positivity since Prior Week

*Test for SARS-CoV-2, the virus that causes COVID-19

COVID-19 NAAT Laboratory Test 7-day Percent Positivity by State/Territory


https://www.cdc.gov/coronavirus/2019-ncov/covid-data/covidview/index.html
 
covid-tracker-header-lrg.jpg

Print

Subscribe to the Weekly Review


Interpretive Summary for November 19, 2021
Protecting Our Future


COVID-19 tends to be milder in children compared with adults, but it can make children very sick and lead to hospitalization or even death. To further protect children, those ages 5 years and older are now eligible to get an age-appropriate dose of Pfizer-BioNTech COVID-19 vaccine. Vaccinating children is also a crucial step toward stopping the spread of the virus that causes COVID-19 and ending the pandemic.

This week CDC’s COVID Data Tracker shows that rates of COVID-19 hospitalizations remain high in children between the ages of 5 through 11 years. A recent studyexternal icon of more than 2,000 children under 18 years found that nearly 1 in 3 children hospitalized with COVID-19 were admitted to the intensive care unit or put on a ventilator. Although children with underlying medical conditions are at increased risk for more severe illness from COVID-19, almost half (45%) of the hospitalized children in this study had no known underlying medical conditions. These results show that children can be severely affected by COVID-19.

Widespread vaccination for COVID-19 remains a critical tool to best protect everyone, especially those at highest risk, from severe illness and death. CDC recommends everyone ages 5 years and older get a COVID-19 vaccine to help protect against COVID-19. Vaccinating children ages 5 years and older can help keep them in school and safely participate in sports, playdates, and other group activities. Vaccinating children can also help protect family members, including siblings who are not eligible for vaccination and family members who may be at increased risk of getting very sick if they are infected. COVID-19 vaccines for children ages 5 through 11 years are now available at pediatricians’ offices, pharmacies, Federally Qualified Health Centers, and more. To find a vaccination site near you, visit vaccines.gov; text your ZIP code to 438829 (GETVAX); or call 1-800-232-0233. If you have questions about COVID-19 vaccines in children, talk with your child’s pediatrician or healthcare provider.

Note to readers: In observance of the Thanksgiving holiday, CDC will not publish the COVID Data Tracker Weekly Review on Friday, November 26, 2021. The Weekly Review will resume publication on Friday, December 3, 2021.


What's New

Reported Cases


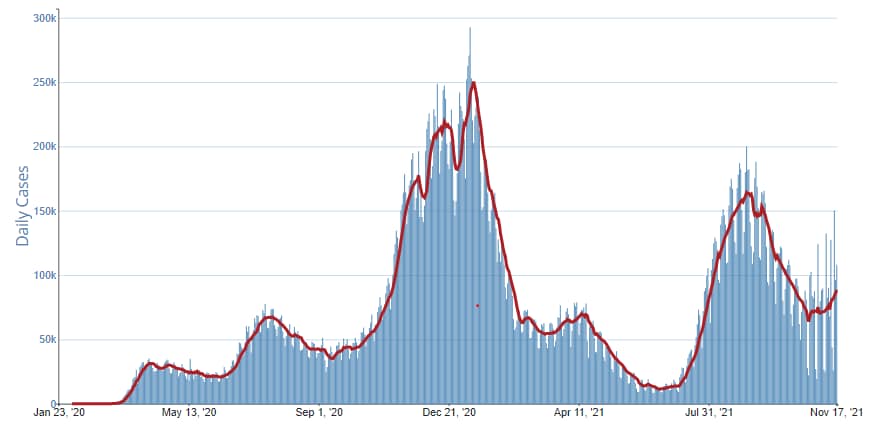
The current 7-day moving average of daily new cases (88,482) increased 16.1% compared with the previous 7-day moving average (76,223). A total of 47,352,367 COVID-19 cases have been reported as of November 17, 2021.

Currently, Delta is the only variant classified as a Variant of Concern (VOC) in the United States. Nowcast projections* for the week ending November 13, 2021, estimate the national and regional proportions of Delta to be greater than 99%. CDC continues to monitor variants and additional information may be provided in future editions based on current trends. For more information on variant proportions, visit COVID Data Tracker.

47,352,367
Total Cases Reported

88,482
Current 7-Day Average**

76,223
Prior 7-Day Average

+16.1%
Change in 7-Day Average since Prior Week

*The median time from specimen collection to sequence data reporting is about 3 weeks. As a result, weighted estimates for the most recent few weeks may be unstable or unavailable. CDC’s Nowcast is a data projection tool that helps fill this gap by generating timely estimates of variant proportions for variants that are circulating in the United States. View Nowcast estimates on CDC’s COVID Data Tracker website on the Variant Proportions page.

**Historical cases are excluded from daily new cases and 7-day average calculations until they are incorporated into the dataset for the applicable date. Of 335,974 historical cases reported retroactively, 16,290 were reported in the current week and 3,197 were reported in the prior week.

Daily Trends in COVID-19 Cases in the United States Reported to CDC
red-line.jpg

7-Day moving average

resize iconView Larger
More Case Data

Vaccinations


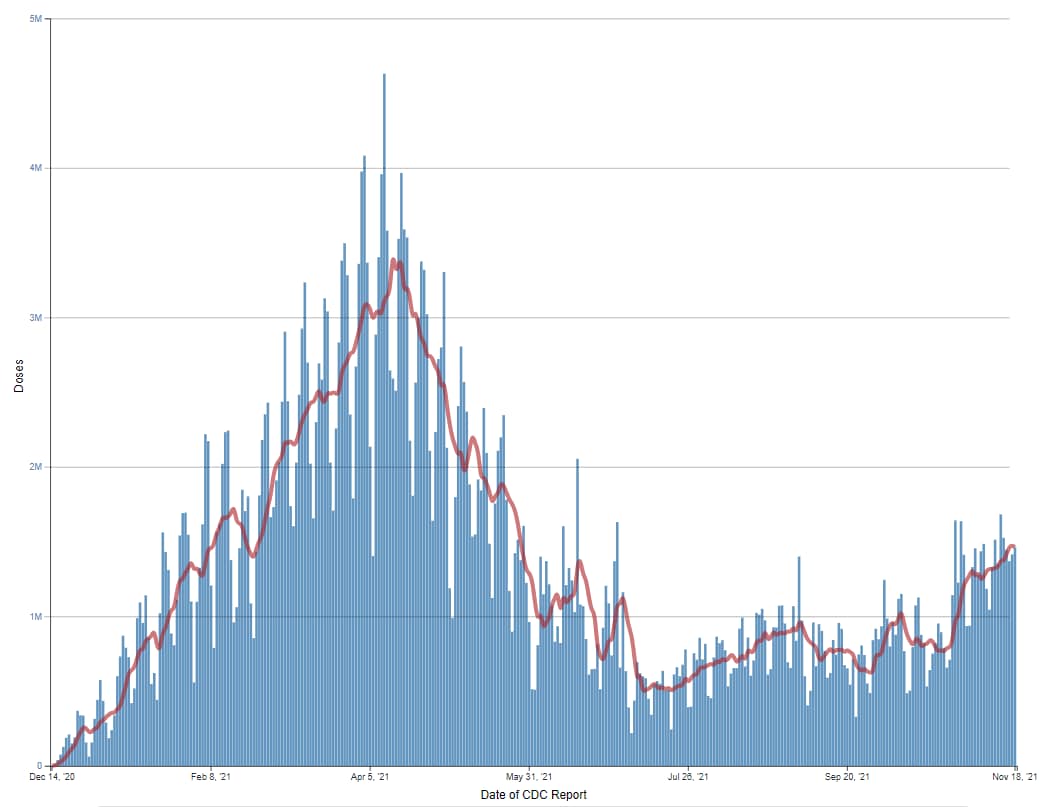
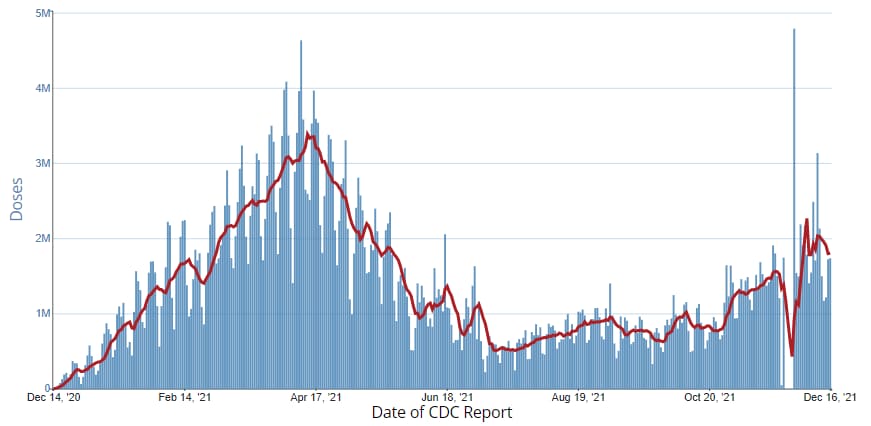
The U.S. COVID-19 Vaccination Program began December 14, 2020. As of November 17, 2021, 444.8 million vaccine doses have been administered. Overall, about 228.2 million people, or 68.7% of the total U.S. population, have received at least one dose of vaccine. About 195.6 million people, or 58.9% of the total U.S. population, have been fully vaccinated.* About 31.5 million additional/booster doses in fully vaccinated people have been reported. As of November 17, 2021, the 7-day average number of administered vaccine doses reported (by date of CDC report) to CDC per day was 1,471,757, a 11.8% increase from the previous week.

CDC’s COVID Data Tracker Vaccination Demographic Trends tab shows vaccination trends by age group. As of November 17, 2021, 99.5% of people ages 65 years or older have received at least one dose of vaccine and 86.2% are fully vaccinated. More than three-quarters (81.7%) of people ages 18 years or older have received at least one dose of vaccine and 70.7% are fully vaccinated. For people ages 12 years or older, 79.8% have received at least one dose of vaccine and 68.9% are fully vaccinated. For people ages 5 years or older, 73.1% have received at least one dose of vaccine and 62.6% are fully vaccinated.

444,789,186
Vaccines Administered

228,175,638
People who received at least one dose

195,612,365
People who are fully vaccinated*

68.7%
Percentage of the US population that has received at least one dose

58.9%
Percentage of the US population that has been fully vaccinated*

+1.0
Percentage point increase from last week

+0.4
Percentage point increase from last week

*Represents the number of people who have received the second dose in a two-dose COVID-19 vaccine series (such as the Pfizer or Moderna vaccines) or one dose of the single-shot Johnson & Johnson’s Janssen vaccine.

Daily Change in the Total Number of Administered COVID-19 Vaccine Doses Reported to CDC by the Date of CDC Report, United States
red-line.jpg

7-Day moving average

resize iconView Larger
More Vaccination Data

Hospitalizations

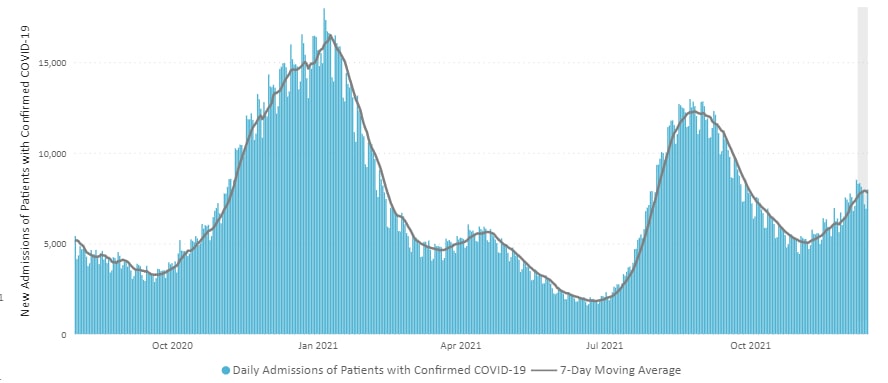
New Hospital Admissions


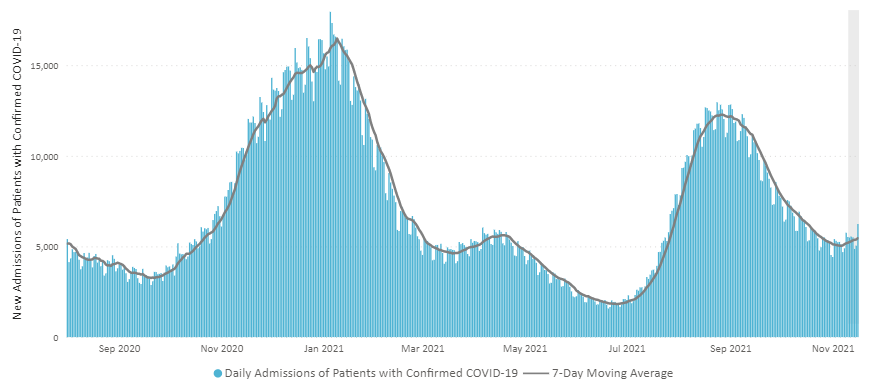
The current 7-day daily average for November 10–November 16, 2021, was 5,456. This is a 5.4% increase from the prior 7-day average (5,176) from November 3–November 9, 2021.

3,334,715
Total New Admissions

5,456
Current 7-Day Average

5,176
Prior 7-Day Average

+5.4%
Change in 7-Day Average

The start of consistent reporting of hospital admissions data was August 1, 2020.

Daily Trends in Number of New COVID-19 Hospital Admissions in the United States

resize iconView Larger
New admissions are pulled from a 10 am EST snapshot of the HHS Unified Hospital Timeseries Dataset. Due to potential reporting delays, data from the most recent 7 days, as noted in the figure above with the grey bar, should be interpreted with caution. Small shifts in historic data may also occur due to changes in the Centers for Medicare and Medicaid Services (CMS) Provider of Services file, which is used to identify the cohort of included hospitals.

More Hospital Data

COVID-NET: Children and Adolescents Hospitalized with COVID-19 with Underlying Conditions


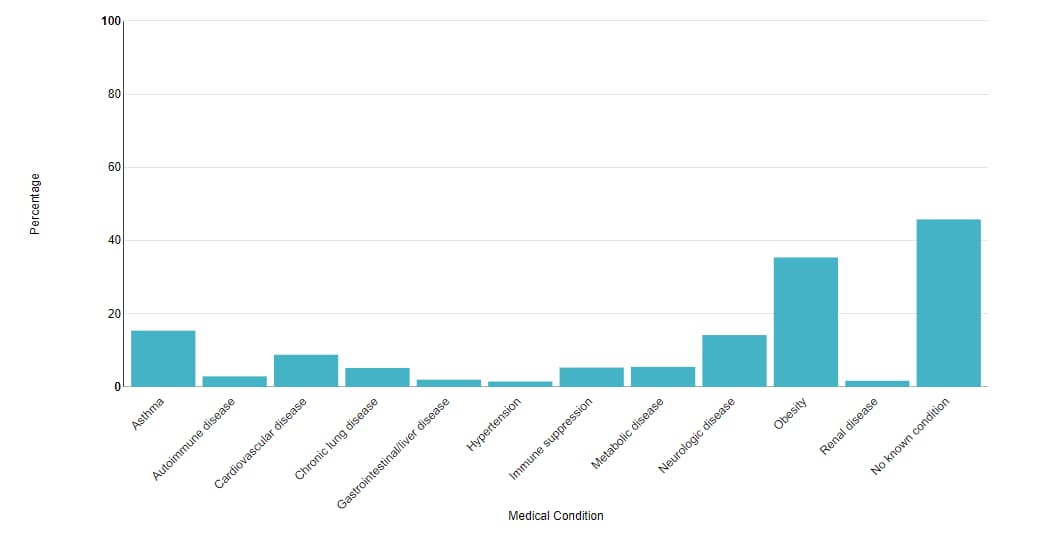
CDC’s Coronavirus Disease 2019-Associated Hospitalization Surveillance Network (COVID-NET) shows that having certain medical conditions can increase the risk of becoming severely ill due to COVID-19. Data from March 1, 2020 through September 30, 2021, show that 54% of children and adolescents ages 17 years and younger with a laboratory-confirmed COVID-19-associated hospitalization have at least one underlying medical condition. Among children with a COVID-19-associated hospitalization, the most common underlying medical conditions include obesity (36%), asthma (15%), neurologic disease (14%), and cardiovascular disease (9%).

Information on risk factors for severe outcomes in COVID-19-associated hospitalizations among children can be found in a new report using COVID-NET data hereexternal icon.

Information on COVID-19 and underlying medical conditions can be found on CDC’s website.

Children and Adolescents Hospitalized with COVID-19 with Underlying Conditions


resize iconView Larger
The Coronavirus Disease 2019 (COVID-19)-Associate­­d Hospitalization Surveillance Network (COVID-NET) is an additional source for hospitalization data collected through a network of more than 250 acute-care hospitals in 14 states (representing ~10% of the U.S. population). Detailed data on patient demographics, including race/ethnicity, underlying medical conditions, medical interventions, and clinical outcomes, are standardized case reporting form.
More COVID-NET Data

Deaths


The current 7-day moving average of new deaths (1,032) has decreased 2.4% compared with the previous 7-day moving average (1,058). As of November 17, 2021, a total of 764,473 COVID-19 deaths have been reported in the United States.

764,473
Total Deaths Reported

1,032
Current 7-Day Average*

1,058
Prior 7-Day Average

-2.4%
Change in 7-Day Average Since Prior Week

*Historical deaths are excluded from the daily new deaths and 7-day average calculations until they are incorporated into the dataset by their applicable date. Of 11,279 historical deaths reported retroactively, 271 were reported in the current week; and 167 were reported in the prior week.

Daily Trends in Number of COVID-19 Deaths in the United States Reported to CDC
red-line.jpg

7-Day moving average

resize iconView Larger
More Death Data

Testing


The percentage of COVID-19 NAATs (nucleic acid amplification tests)* that are positive (percent positivity) has increased from the previous week. The 7-day average of percent positivity from NAATs is now 6.0%. The 7-day average number of tests reported for November 5 – November 11, 2021, was 1,396,881, up 4.0% from 1,342,728 for the prior 7 days.

647,335,547
Total Tests Reported

1,396,881
7-Day Average Tests Reported

6.0%
7-Day Average % Positivity

5.1%
Previous 7-Day Average % Positivity

+0.93
Percentage point change in 7-Day Average % Positivity since Prior Week

*Test for SARS-CoV-2, the virus that causes COVID-19

COVID-19 NAAT Laboratory Test 7-day Percent Positivity by State/Territory


https://www.cdc.gov/coronavirus/2019-ncov/covid-data/covidview/index.html
 
covid-tracker-header-lrg.jpg

Print

Subscribe to the Weekly Review


Interpretive Summary for December 3, 2021
Baby Talk


As of December 2, 2021, more than 234 million people in the United States have received at least one dose of a COVID-19 vaccine. However, vaccination among pregnant people remains low. CDC’s COVID Data Tracker shows that as of November 27, 2021, the proportion of fully vaccinated pregnant people has increased to 35%, but most pregnant people remain unprotected against COVID-19. CDC recommends that people who are pregnant, breastfeeding, trying to get pregnant now, or who might become pregnant in the future, get vaccinated against COVID-19. CDC also recommends that fully vaccinated pregnant people 18 years and older receive a COVID-19 booster dose.

People who are pregnant or were recently pregnant are at increased risk for severe illness from COVID-19, including ICU admission, ventilator use, and death. A recent studyexternal icon found that for pregnant people with COVID-19 after Delta became predominant, the risk of ICU admission was 66% higher than before Delta became predominant. The risk of needing a ventilator or special equipment to breathe was 63% higher, and the risk of death was more than 2 times higher than in the pre-Delta period.* A second study found that compared with people without a COVID-19 diagnosis at delivery, pregnant people with a COVID-19 diagnosis at delivery had nearly twice the risk of having a stillbirth.** After Delta become predominant, women with COVID-19 during pregnancy had 4 times the risk of having a stillbirth.

Getting a COVID-19 vaccine can prevent severe illness, death, and pregnancy complications related to COVID-19. CDC data show that COVID-19 vaccines are safe for people who are pregnant, including those early in pregnancy. Additionally, there is currently no evidence that any vaccines, including COVID-19 vaccines, cause fertility problems in women or men. Many people have become pregnant after receiving a COVID-19 vaccine, including some who got vaccinated during COVID-19 vaccine clinical trials. If you have questions about getting vaccinated, talk with your healthcare provider. To find a vaccine provider near you, visit vaccines.gov; text your ZIP code to 438829 (GETVAX); or call 1-800-232-0233.

*The risk for severe illness also increased for non-pregnant women of reproductive age (15─44 years) with COVID-19 during the Delta period, compared with the pre-Delta period.

**COVID-19 diagnosis may have represented a current or past infection.

Note to readers: CDC’s COVID Data Tracker now features a Pregnancy Data page which catalogs all pregnancy-related data available on COVID Data Tracker and provides links to resource on COVID-19 in pregnancy. Resources and tools are available to help people who are pregnant, breastfeeding, and new parents caring for infants protect their health.


What's New

Reported Cases


The current 7-day moving average of daily new cases (86,413) decreased 8.5% compared with the previous 7-day moving average (94,393). A total of 48,628,787 COVID-19 cases have been reported as of December 1, 2021.

On November 26, 2021, the World Health Organization (WHO) classified a new variant, B.1.1.529, as a Variant of Concern (VOC) and named it Omicron. On November 30, 2021, the United States also classified it as a VOC. On December 1, 2021, CDC announced that the first confirmed case of Omicron variant had been detected in the United States. Additional suspected cases of Omicron are being investigated. Despite the detection of Omicron, Delta remains the predominant strain in the United States. Nowcast projections* for the week ending November 27, 2021, estimate the national and regional proportions of Delta to be greater than 99%.

CDC has been actively monitoring and preparing for this variant and will continue to work with other U.S. and global public health and industry partners to learn more. For more information on variant proportions, visit COVID Data Tracker.

48,628,787
Total Cases Reported

86,413
Current 7-Day Average**

94,393
Prior 7-Day Average

-8.5%
Change in 7-Day Average since Prior Week

* The median time from specimen collection to sequence data reporting is about 3 weeks. As a result, weighted estimates for the most recent few weeks may be unstable or unavailable. CDC’s Nowcast is a data projection tool that helps fill this gap by generating timely estimates of variant proportions for variants that are circulating in the United States. View Nowcast estimates on CDC’s COVID Data Tracker website on the Variant Proportions page.

** Historical cases are excluded from daily new cases and 7-day average calculations until they are incorporated into the dataset for the applicable date. Of 348,267 historical cases reported retroactively, 574 were reported in the current week and 11,899 were reported in the prior week.

Daily Trends in COVID-19 Cases in the United States Reported to CDC
red-line.jpg

7-Day moving average

resize iconView Larger
More Case Data

Vaccinations


The U.S. COVID-19 Vaccination Program began December 14, 2020. As of December 2, 2021, 464.4 million vaccine doses have been administered. Overall, about 234.3 million people, or 70.6% of the total U.S. population, have received at least one dose of vaccine. About 197.8 million people, or 59.6% of the total U.S. population, have been fully vaccinated.* About 43.0 million additional/booster doses in fully vaccinated people have been reported. As of December 2, 2021, the 7-day average number of administered vaccine doses reported (by date of CDC report) to CDC per day was 1,428,263, a 22.0% increase from the previous week.

CDC’s COVID Data Tracker Vaccination Demographic Trends tab shows vaccination trends by age group. As of December 2, 2021, 99.9% of people ages 65 years or older have received at least one dose of vaccine and 86.4% are fully vaccinated. More than three-quarters (83.0%) of people ages 18 years or older have received at least one dose of vaccine and 71.3% are fully vaccinated. For people ages 12 years or older, 81.0% have received at least one dose of vaccine and 69.5% are fully vaccinated. For people ages 5 years or older, 75.0% have received at least one dose of vaccine and 63.4% are fully vaccinated.

464,445,580
Vaccines Administered

234,269,053
People who received at least one dose

197,838,728
People who are fully vaccinated*

70.6%
Percentage of the US population that has received at least one dose

59.6%
Percentage of the US population that has been fully vaccinated*

+0.9
Percentage point increase from last week

+0.5
Percentage point increase from last week

*Represents the number of people who have received the second dose in a two-dose COVID-19 vaccine series (such as the Pfizer or Moderna vaccines) or one dose of the single-shot Johnson & Johnson’s Janssen vaccine.

Daily Change in the Total Number of Administered COVID-19 Vaccine Doses Reported to CDC by the Date of CDC Report, United States
red-line.jpg

7-Day moving average

resize iconView Larger
More Vaccination Data

Hospitalizations

New Hospital Admissions


The current 7-day daily average for November 24–November 30, 2021, was 6,386. This is a 5.0% increase from the prior 7-day average (6,082) from November 17–November 23, 2021.

3,419,480
Total New Admissions

6,386
Current 7-Day Average

6,082
Prior 7-Day Average

+5.0%
Change in 7-Day Average

The start of consistent reporting of hospital admissions data was August 1, 2020.

Daily Trends in Number of New COVID-19 Hospital Admissions in the United States

resize iconView Larger
New admissions are pulled from a 10 am EST snapshot of the HHS Unified Hospital Timeseries Dataset. Due to potential reporting delays, data from the most recent 7 days, as noted in the figure above with the grey bar, should be interpreted with caution. Small shifts in historic data may also occur due to changes in the Centers for Medicare and Medicaid Services (CMS) Provider of Services file, which is used to identify the cohort of included hospitals.

More Hospital Data

COVID-NET: Hospitalizations in Non-Hispanic American Indian and Alaska Native People


CDC’s Coronavirus Disease 2019-Associated Hospitalization Surveillance Network (COVID-NET) shows that since the start of the pandemic, people from racial and ethnic minority groups have been at increased risk for COVID-19-associated hospitalizations compared to non-Hispanic White people. For the week ending November 13, 2021, the rate of COVID-19-associated hospitalizations in non-Hispanic American Indian/Alaska Native people was 23 per 100,000 people. This is the highest hospitalization rate among all racial and ethnic minority groups and represents a substantial increase over the past three months.*

* It is important to note that these increases might be driven by a limited number of COVID-NET sites and might not be nationally representative.

Hospitalizations in Non-Hispanic American Indian and Alaska Native People


resize iconView Larger
The Coronavirus Disease 2019 (COVID-19)-Associate­­d Hospitalization Surveillance Network (COVID-NET) is an additional source for hospitalization data collected through a network of more than 250 acute-care hospitals in 14 states (representing ~10% of the U.S. population). Detailed data on patient demographics, including race/ethnicity, underlying medical conditions, medical interventions, and clinical outcomes, are standardized case reporting form.
More COVID-NET Data

Deaths


The current 7-day moving average of new deaths (860) has decreased 12.6% compared with the previous 7-day moving average (983). As of December 1, 2021, a total of 781,963 COVID-19 deaths have been reported in the United States.

781,963
Total Deaths Reported

860
Current 7-Day Average*

983
Prior 7-Day Average

-12.6%
Change in 7-Day Average Since Prior Week

* Historical deaths are excluded from the daily new deaths and 7-day average calculations until they are incorporated into the dataset by their applicable date. Of 14,561 historical deaths reported retroactively, 230 were reported in the current week; and 3,052 were reported in the prior week.

Daily Trends in Number of COVID-19 Deaths in the United States Reported to CDC
red-line.jpg

7-Day moving average

resize iconView Larger
More Death Data

Testing


The percentage of COVID-19 NAATs (nucleic acid amplification tests)* that are positive (percent positivity) has increased from the previous week. The 7-day average of percent positivity from NAATs is now 7.8%. The 7-day average number of tests reported for November 19 – November 25, 2021, was 1,188,742, down 17.6% from 1,441,869 for the prior 7 days.

665,853,403
Total Tests Reported

1,188,742
7-Day Average Tests Reported

7.8%
7-Day Average % Positivity

6.2%
Previous 7-Day Average % Positivity

+1.57
Percentage point change in 7-Day Average % Positivity since Prior Week

*Test for SARS-CoV-2, the virus that causes COVID-19

COVID-19 NAAT Laboratory Test 7-day Percent Positivity by State/Territory


https://www.cdc.gov/coronavirus/2019-ncov/covid-data/covidview/
 
covid-tracker-header-lrg.jpg

Print

Subscribe to the Weekly Review


Interpretive Summary for December 10, 2021
Get Boosted!


On November 26, 2021, the World Health Organizationexternal icon (WHO) classified a new variant, B.1.1.529, as a Variant of Concern (VOC) and named it Omicron. On November 30, 2021, the United States also classified it as a VOC. On December 1, 2021, CDC announced that the first confirmed case of the Omicron variant had been detected in the United States. As of December 9, 2021, 23 states have announced cases of the Omicron variant.

A new CDC report summarizes what’s known about initial cases of COVID-19 infection with the Omicron variant in the United States and prevention strategies to slow the spread. While Omicron viruses have been detected, the Delta variant still currently accounts for over 99.9% of all circulating SARS-CoV-2 viruses in the United States.COVID-19 vaccination, along with consistent use of prevention strategies, remains the best tool we have to protect people from COVID-19, slow transmission, and reduce the likelihood of new variants emerging. CDC recommends that:
As the weather gets colder and people gather indoors, getting a COVID-19 vaccine or booster dose can help protect you, the people around you, and the people you love. To find a COVID-19 vaccine provider near you, visit vaccines.gov or your state or local public health department website.

*Immunocompromised people have special considerations for vaccination, including additional primary dose and booster dose recommendations following the primary series. For more information, visit CDC’s website.

Note to readers: Self-testing (also known as home or over-the-counter testing) is another way to prevent the spread of COVID-19. You can self-test before an indoor gathering with people who don’t live in your household, regardless of your vaccination status or if you have symptoms.

Get a Closer Look at CDC’s COVID-19 Data

What's New

Reported Cases


The current 7-day moving average of daily new cases (118,515) increased 37.3% compared with the previous 7-day moving average (86,315). A total of 49,458,520 COVID-19 cases have been reported in the United States as of December 8, 2021.

Currently two variants, Omicron and Delta, are classified as Variants of Concern (VOC) in the United States. CDC’s COVID Data Tracker shows that the Omicron variant currently accounts for less than 0.1% of variants circulating in the United States. Delta remains the predominant variant in the United States. Nowcast projections* for the week ending December 4, 2021, estimate the national and regional proportions of Delta to be greater than 99%.

CDC has been actively monitoring and preparing for the Omicron variant and will continue to work with other U.S. and global public health and industry partners to learn more. For more information on variant proportions, visit COVID Data Tracker.

49,458,520
Total Cases Reported

118,515
Current 7-Day Average**

86,315
Prior 7-Day Average

+37.3%
Change in 7-Day Average since Prior Week

* The median time from specimen collection to sequence data reporting is about 3 weeks. As a result, weighted estimates for the most recent few weeks may be unstable or unavailable. CDC’s Nowcast is a data projection tool that helps fill this gap by generating timely estimates of variant proportions for variants that are circulating in the United States. View Nowcast estimates on CDC’s COVID Data Tracker website on the Variant Proportions page.

** Historical cases are excluded from daily new cases and 7-day average calculations until they are incorporated into the dataset for the applicable date. Of 348,270 historical cases reported retroactively, 126 were reported in the current week and 574 were reported in the prior week.

Daily Trends in COVID-19 Cases in the United States Reported to CDC
red-line.jpg

7-Day moving average

resize iconView Larger
More Case Data

Vaccinations


The U.S. COVID-19 Vaccination Program began December 14, 2020. As of December 9, 2021, 477.4 million vaccine doses have been administered. Overall, about 237.5 million people, or 71.5% of the total U.S. population, have received at least one dose of vaccine. About 200.7 million people, or 60.5% of the total U.S. population, have been fully vaccinated.* About 49.9 million additional/booster doses in fully vaccinated people have been reported. As of December 9, 2021, the 7-day average number of administered vaccine doses reported (by date of CDC report) to CDC per day was 1,855,455, a 29.9% increase from the previous week.

CDC’s COVID Data Tracker Vaccination Demographic Trends tab shows vaccination trends by age group. As of December 9, 2021, 95.0% of people ages 65 years or older have received at least one dose of vaccine and 87.0% are fully vaccinated. More than three-quarters (83.9%) of people ages 18 years or older have received at least one dose of vaccine and 71.8% are fully vaccinated. For people ages 12 years or older, 81.9% have received at least one dose of vaccine and 70.1% are fully vaccinated. For people ages 5 years or older, 76.0% have received at least one dose of vaccine and 64.3% are fully vaccinated.

477,433,765
Vaccines Administered

237,468,725
People who received at least one dose

200,717,387
People who are fully vaccinated*

71.5%
Percentage of the U.S. population that has received at least one dose

60.5%
Percentage of the U.S. population that has been fully vaccinated*

+0.9
Percentage point increase from last week

+0.9
Percentage point increase from last week

*Represents the number of people who have received the second dose in a two-dose COVID-19 vaccine series (such as the Pfizer or Moderna vaccines) or one dose of the single-shot Johnson & Johnson’s Janssen vaccine.

Daily Change in the Total Number of Administered COVID-19 Vaccine Doses Reported to CDC by the Date of CDC Report, United States
red-line.jpg

7-Day moving average

resize iconView Larger
More Vaccination Data

Hospitalizations

New Hospital Admissions


The current 7-day daily average for December 1–December 7, 2021, was 7,441. This is a 15.9% increase from the prior 7-day average (6,419) from November 24–November 30, 2021.

3,471,816
Total New Admissions

7,441
Current 7-Day Average

6,419
Prior 7-Day Average

+15.9%
Change in 7-Day Average

The start of consistent reporting of hospital admissions data was August 1, 2020.

Daily Trends in Number of New COVID-19 Hospital Admissions in the United States

resize iconView Larger
New admissions are pulled from a 10 am EST snapshot of the HHS Unified Hospital Timeseries Dataset. Due to potential reporting delays, data from the most recent 7 days, as noted in the figure above with the grey bar, should be interpreted with caution. Small shifts in historic data may also occur due to changes in the Centers for Medicare and Medicaid Services (CMS) Provider of Services file, which is used to identify the cohort of included hospitals.

More Hospital Data

COVID-NET: Hospitalization Rates by Vaccination Status in Adults


CDC’s Coronavirus Disease 2019-Associated Hospitalization Surveillance Network (COVID-NET) shows that through October 2021, rates of COVID-19-associated hospitalizations are higher in unvaccinated adults compared to fully vaccinated adults regardless of age. The age-adjusted COVID-19-associated hospitalization rate among adults ages 18 years and older was 8 times higher in unvaccinated people than those who were vaccinated. Age-specific rates of COVID-19-associated hospitalizations are 13 times higher among unvaccinated adults ages 18-49 years, 11 times higher among unvaccinated adults ages 50–64 years, and 6 times higher among unvaccinated adults ages 65 years and older.

Hospitalization Rates by Vaccination Status in Adults


resize iconView Larger
The Coronavirus Disease 2019 (COVID-19)-Associate­­d Hospitalization Surveillance Network (COVID-NET) is an additional source for hospitalization data collected through a network of more than 250 acute-care hospitals in 14 states (representing ~10% of the U.S. population). Detailed data on patient demographics, including race/ethnicity, underlying medical conditions, medical interventions, and clinical outcomes, are standardized case reporting form.
More COVID-NET Data

Deaths


The current 7-day moving average of new deaths (1,092) has increased 27.8% compared with the previous 7-day moving average (854). As of December 8, 2021, a total of 790,766 COVID-19 deaths have been reported in the United States.

790,766
Total Deaths Reported

1,092
Current 7-Day Average*

854
Prior 7-Day Average

+27.8%
Change in 7-Day Average Since Prior Week

* Historical deaths are excluded from the daily new deaths and 7-day average calculations until they are incorporated into the dataset by their applicable date. Of 14,968 historical deaths reported retroactively, 407 were reported in the current week; and 230 were reported in the prior week.

Daily Trends in Number of COVID-19 Deaths in the United States Reported to CDC
red-line.jpg

7-Day moving average

resize iconView Larger
More Death Data

Testing


The percentage of COVID-19 NAATs (nucleic acid amplification tests)* that are positive (percent positivity) is stable in comparison to the previous week. The 7-day average of percent positivity from NAATs is now 7.5%. The 7-day average number of tests reported for November 26 – December 2, 2021, was 1,328,837, up 7.8% from 1,232,562 for the prior 7 days.

676,981,002
Total Tests Reported

1,328,837
7-Day Average Tests Reported

7.5%
7-Day Average % Positivity

7.5%
Previous 7-Day Average % Positivity

+0.06
Percentage point change in 7-Day Average % Positivity since Prior Week

*Test for SARS-CoV-2, the virus that causes COVID-19

COVID-19 NAAT Laboratory Test 7-day Percent Positivity by State/Territory

resize iconView Larger
More Testing DataA Closer Look


A Closer Look Section presents more detailed information for readers who want to learn more about current issues of interest.
State of the Pandemic – Fall 2021


In the United States, the SARS-CoV-2 pandemic has produced 5 waves of new cases. The peaks of those waves were on April 9, 2020 (34,893 cases), July 17, 2020 (78,252 cases), January 6, 2021 (295,378 cases), April 7, 2021 (79,302 cases), and September 1, 2021 (192,211 cases). The first peak likely under-represented the true case incidence because the availability and use of testing was limited at that early point in the pandemic. The third peak, in January 2021, was the highest. The recent fifth peak, in September 2021, was more than 100,000 cases lower than the January 2021 peak. Although the burden of severe illness was high with large numbers of hospitalizations and deaths in the most recent wave, both were much lower than in the third wave. Population immunity levels, both from vaccination and from previous infection, likely limited the impact of the virus during the fifth wave.

Nationally, surveillance indicators tracking levels of SARS-CoV-2 circulation and associated illnesses, hospital admissions, and deaths began declining in early September 2021, and continued into October 2021. As the weather began to get colder and people started to spend more time indoors, we started to see an increase in cases and hospitalizations in November 2021. On December 8, 2021, the current 7-day moving average of new cases nationwide was 118,515, up 37.3% from the previous week. The 7-day average of new hospital admissions was 7,441, up 15.9% from the previous week. The 7-day moving average of new deaths nationwide was 1,092, up 27.8% from the previous week.

As of December 9, 2021, over 237 million people (71.5% of the US population) have been fully vaccinated. Older adults have the highest vaccination rates of any age group: 87.0% of people ages 65 years or older are fully vaccinated. As of December 9, 2021, 17.9% of people ages 5 through 11 years old have received at least one dose of vaccine and 7.0% of people ages 5 through 11 years old are fully vaccinated. CDC recommends that people with compromised immune systems receive an additional dose of an mRNA COVID-19 vaccine.

For people who received a primary series of an mRNA COVID-19 vaccine, booster doses are recommended at least six months after completing the primary series for everyone ages 18 years and older. Everyone ages 18 years and older who received the Johnson & Johnson/Janssen vaccine should get a booster shot at least two months after receiving the primary shot. On December 9, 2021, the U.S. Food and Drug Administration authorized the use of a single booster dose for adolescents ages 16 and 17 years at least six months after completion of a primary series with the Pfizer-BioNTech COVID-19 vaccine. That same day, CDC strengthened its booster dose recommendations and now encourages everyone 16 years and older to receive a booster dose. At this time, only the Pfizer-BioNTech COVID-19 vaccine is authorized and recommended for adolescents ages 16 and 17 years. Since August 2021, over 49.9 million fully vaccinated people have received a booster dose; 26.9% of those ages 18 years or older and 49.1% of those ages 65 years or older who are fully vaccinated have received a booster dose.

A new SARS-CoV-2 variant, named Omicron by the World Health Organization, was classified on November 30, 2021, as a Variant of Concern by the U.S. government SARS-CoV-2 Interagency Group. The first U.S. case of the Omicron variant was confirmed on December 1, 2021, and has now been detected in a number of states. CDC is working with state and local public health officials to monitor the spread of the new variant. CDC is also working with its public health partners to determine how easily the variant is transmitted, the severity of disease caused by the variant, and how well vaccines and therapeutics will work against the variant. However, the emergence of this variant and the fact that the Delta variant continues to be the most dominant variant present in the United States, reinforces the need for people to get vaccinated and for those fully vaccinated to receive boosters.

As the country approaches the winter—typically the high season for respiratory viruses like SARS-CoV-2 and influenza — there are many unknowns. Continuing to monitor case rates and the burden of COVID-19 illnesses and hospitalizations will be key to responding quickly and effectively in the coming months to limit illness and keep our health systems functioning for all people. COVID-19 vaccination is crucial to controlling the pandemic as it provides substantial protection against infection, hospitalization, and death. As we approach the holiday season, a time when gatherings of friends and families are common, it is important to maintain prevention measures and ensure protection of those most vulnerable.


https://www.cdc.gov/coronavirus/2019-ncov/covid-data/covidview/
 
covid-tracker-header-lrg.jpg


Interpretive

Summary for December 17, 2021

Safe and Happy Holidays


The United States recently surpassed 50 million COVID-19 cases and 800,000 deaths since the start of the pandemic. This week also marks the first anniversary of the first COVID-19 vaccination in the United States. In recent weeks, COVID-19 cases and hospitalizations have increased, with many parts of the country experiencing substantial or high levels of community transmission. These increases and the recent emergence of the Omicron variant highlight the importance of prevention strategies to help people stay safe and reduce the spread of the virus that causes COVID-19.

Although we are still learning about Omicron, we’ve been fighting COVID-19 since last year and have the tools to end the pandemic. The United States saw the highest peak in COVID-19 cases in January 2021, following the 2020 holiday season. But this year, we have the most important protection of all: vaccination. As people start to travel and gather this year, COVID-19 vaccination, along with other important prevention strategies, continues to be our best defense against severe disease.
Holiday traditions are important for many people. Using proven prevention strategies, we can enjoy safer holidays, travel, and protect our own health as well as the health of our family and friends.

Note to readers: CDC will not publish the COVID Data Tracker Weekly Review on Friday, December 24, 2021, and Friday, December 31, 2021. The Weekly Review will resume publication on Friday, January 7, 2022.

Get a Closer Look at CDC’s COVID-19 Data

What's New

Reported Cases


The current 7-day moving average of daily new cases (122,297) increased 1.5% compared with the previous 7-day moving average (120,445). A total of 50,479,372 COVID-19 cases have been reported in the United States as of December 15, 2021.

Currently two variants, Omicron and Delta, are classified as Variants of Concern (VOC) in the United States. CDC’s COVID Data Tracker shows that the proportion of the Omicron variant circulating in the United States is predicted to increase from last week. Delta remains the predominant variant in the United States. Nowcast projections* for the week ending December 11, 2021, predict the national proportion of Omicron to be 2.9% and Delta to be 96.7%. The proportion of Omicron is predicted to be higher than the national proportion in HHS regions 2 and 7. The proportions of Delta are predicted to be greater than 86% in all HHS regions.

CDC has been actively monitoring and preparing for the Omicron variant and will continue to work with other U.S. and global public health and industry partners to learn more. For more information on variant proportions, visit COVID Data Tracker.

50,479,372
Total Cases Reported

122,297
Current 7-Day Average**

120,445
Prior 7-Day Average

+1.5%
Change in 7-Day Average since Prior Week

*The median time from specimen collection to sequence data reporting is about 3 weeks. As a result, weighted estimates for the most recent few weeks may be unstable or unavailable. CDC’s Nowcast is a data projection tool that helps fill this gap by generating timely estimates of variant proportions for variants that are circulating in the United States. View Nowcast estimates on CDC’s COVID Data Tracker website on the Variant Proportions page.

**Historical cases are excluded from daily new cases and 7-day average calculations until they are incorporated into the dataset for the applicable date. Of 353,023 historical cases reported retroactively, 4,753 were reported in the current week and 126 were reported in the prior week.

Daily Trends in COVID-19 Cases in the United States Reported to CDC
red-line.jpg

7-Day moving average

resize iconView Larger
More Case Data

Vaccinations


The U.S. COVID-19 Vaccination Program began December 14, 2020. As of December 16, 2021, 490.0 million vaccine doses have been administered. Overall, about 240.3 million people, or 72.4% of the total U.S. population, have received at least one dose of vaccine. About 203.2 million people, or 61.2% of the total U.S. population, have been fully vaccinated.* About 57.1 million additional/booster doses in fully vaccinated people have been reported. As of December 16, 2021, the 7-day average number of administered vaccine doses reported (by date of CDC report) to CDC per day was 1,799,583, a 3.0% decrease from the previous week.

CDC’s COVID Data Tracker Vaccination Demographic Trends tab shows vaccination trends by age group. As of December 16, 2021, 95.0% of people ages 65 years or older have received at least one dose of vaccine and 87.3% are fully vaccinated. More than three-quarters (84.7%) of people ages 18 years or older have received at least one dose of vaccine and 72.3% are fully vaccinated. For people ages 12 years or older, 82.7% have received at least one dose of vaccine and 70.5% are fully vaccinated. For people ages 5 years or older, 76.9% have received at least one dose of vaccine and 65.1% are fully vaccinated.

490,030,849
Vaccines Administered

240,321,022
People who received at least one dose

203,159,327
People who are fully vaccinated*

72.4%
Percentage of the U.S. population that has received at least one dose

61.2%
Percentage of the U.S. population that has been fully vaccinated*

+0.9
Percentage point increase from last week

+0.7
Percentage point increase from last week

*Represents the number of people who have received the second dose in a two-dose COVID-19 vaccine series (such as the Pfizer or Moderna vaccines) or one dose of the single-shot Johnson & Johnson’s Janssen vaccine.

Daily Change in the Total Number of Administered COVID-19 Vaccine Doses Reported to CDC by the Date of CDC Report, United States
red-line.jpg

7-Day moving average

resize iconView Larger
More Vaccination Data

Hospitalizations

New Hospital Admissions


The current 7-day daily average for December 8–December 14, 2021, was 7,814. This is a 4.4% increase from the prior 7-day average (7,482) from December 1 –December 7, 2021.

3,529,651
Total New Admissions

7,814
Current 7-Day Average

7,482
Prior 7-Day Average

+4.4%
Change in 7-Day Average

The start of consistent reporting of hospital admissions data was August 1, 2020.

Daily Trends in Number of New COVID-19 Hospital Admissions in the United States

resize iconView Larger
New admissions are pulled from a 10 am EST snapshot of the HHS Unified Hospital Timeseries Dataset. Due to potential reporting delays, data from the most recent 7 days, as noted in the figure above with the grey bar, should be interpreted with caution. Small shifts in historic data may also occur due to changes in the Centers for Medicare and Medicaid Services (CMS) Provider of Services file, which is used to identify the cohort of included hospitals.

More Hospital Data

COVID-NET: Hospitalization Rates in Children Ages 4 Years and Younger


CDC’s Coronavirus Disease 2019-Associated Hospitalization Surveillance Network (COVID-NET) shows that hospitalization rates remain elevated in young children. For the week ending November 27, the weekly rate of COVID-19-associated hospitalizations for children ages 4 years and younger is 1.9 per 100,000. The rate of hospitalization in this age group is higher than rates seen for both older children ages 5–11 years (0.4 per 100,000) and adolescents ages 12–17 years (0.9 per 100,000). Unlike older children and adolescents, children ages 4 years and younger are not yet eligible for any of the available COVID-19 vaccines.

Hospitalization Rates in Children Ages 4 Years and Younger


resize iconView Larger
The Coronavirus Disease 2019 (COVID-19)-Associate­­d Hospitalization Surveillance Network (COVID-NET) is an additional source for hospitalization data collected through a network of more than 250 acute-care hospitals in 14 states (representing ~10% of the U.S. population). Detailed data on patient demographics, including race/ethnicity, underlying medical conditions, medical interventions, and clinical outcomes, are standardized case reporting form.
More COVID-NET Data

Deaths


The current 7-day moving average of new deaths (1,180) has increased 8.2% compared with the previous 7-day moving average (1,090). As of December 15, 2021, a total of 800,939 COVID-19 deaths have been reported in the United States.

800,939
Total Deaths Reported

1,180
Current 7-Day Average*

1,090
Prior 7-Day Average

+8.2%
Change in 7-Day Average Since Prior Week

*Historical deaths are excluded from the daily new deaths and 7-day average calculations until they are incorporated into the dataset by their applicable date. Of 15,386 historical deaths reported retroactively, 418 were reported in the current week; and 407 were reported in the prior week.

Daily Trends in Number of COVID-19 Deaths in the United States Reported to CDC
red-line.jpg

7-Day moving average

resize iconView Larger
More Death Data

Testing


The percentage of COVID-19 NAATs (nucleic acid amplification tests)* that are positive (percent positivity) is decreasing in comparison to the previous week. The 7-day average of percent positivity from NAATs is now 7.2%. The 7-day average number of tests reported for December 3–December 9, 2021, was 1,526,543 up 12.6% from 1,355,909 for the prior 7 days.

687,953,775
Total Tests Reported

1,526,543
7-Day Average Tests Reported

7.2%
7-Day Average % Positivity

7.4%
Previous 7-Day Average % Positivity

-0.13
Percentage point change in 7-Day Average % Positivity since Prior Week

*Test for SARS-CoV-2, the virus that causes COVID-19

COVID-19 NAAT Laboratory Test 7-day Percent Positivity by State/Territory

resize iconView Larger
More Testing DataA Closer Look


A Closer Look Section presents more detailed information for readers who want to learn more about current issues of interest.
Know More about the Omicron Variant


On November 24, 2021, a new variant of SARS-CoV-2, B.1.1.529, was reported to the World Health Organizationexternal icon (WHO). This new variant was first detected in specimens collected on November 11, 2021, in Botswana and on November 14, 2021, in South Africa. On November 26, 2021, WHO named the variant Omicron and classified it as a Variant of Concern (VOC). Four days later, on November 30, the U.S. government SARS-CoV-2 Interagency Group also designated Omicron as a VOC. On December 1, 2021, the first confirmed U.S. case of Omicron was identified in California. As of December 15, 2021, 70 countries have verified SARS-CoV-2 infections caused by the Omicron variant.

CDC has been working with state and local public health officials to monitor the spread of Omicron in the United States. Multiple states have now detected Omicron cases. On December 10, 2021, CDC released an MMWR article summarizing characteristics of the first infections in the United States with the Omicron variant, along with prevention strategies to slow the spread.

In the United States, CDC uses genomic surveillance to track variants of SARS-CoV-2. CDC’s national genomic surveillance can detect a variant that is circulating at 0.1% frequency with 99% statistical confidence. There is a two- to three-week lag between sample collection for SARS-CoV-2 testing to producing and analyzing sequence data, so it is likely that more U.S. infections with Omicron from late November will be detected over the coming days. To provide more timely estimates of variant proportions while more recent specimens are being processed, CDC also provides “Nowcast” data. Nowcast is a model that estimates more recent proportions of circulating variants and enables timely public health action. CDC’s genomic surveillance system will continuously monitor the proportion of infections from Omicron and other variants.

The Omicron variant contains more changes in the spike protein than have been observed in other variants, including 15 in the receptor binding domain (RBD). (The spike protein is the primary target of vaccine-induced immunity.) There are also changes and deletions in other regions of the genome. Based on preliminary laboratory data, significant reductions in neutralizing activity of sera from vaccinated or previously infected individuals against Omicron have been reported. Based on data from other variants with significantly fewer changes in the RBD, the expectation is that the Omicron variant will remain susceptible to some monoclonal antibody treatments, while others may have less potency.

Scientists around the world are working quickly to learn more about the Omicron variant and better understand how easily it might be spread, how severe illness is with this variant, and how effective diagnostic tests, vaccines, and therapeutics are for this variant. Preliminary information from South Africaexternal icon indicates that there are no unusual symptoms associated with Omicron variant infection, and as with other variants, some patients are asymptomatic. CDC will be prioritizing multiple studies to better understand the Omicron variant.

We expect current vaccines to protect against severe illness, hospitalizations, and deaths from infection with the Omicron variant. However, Omicron might cause more breakthrough infections than prior variants, though information on the extent of vaccine protection against infection is not yet available.

It is important to remember that despite the increased attention of Omicron, Delta continues to be the main variant circulating in the United States. For the week ending December 11, 2021, the Delta variant accounted for 96.7% of circulating SARS-CoV-2 variants and Omicron accounted for 2.9% of circulating SARS-CoV-2 variants. The recent emergence of Omicron and the fact that Delta is still the dominant strain further emphasize the importance of getting a primary vaccination series and, if eligible, a booster.

https://www.cdc.gov/coronavirus/2019-ncov/covid-data/covidview/
 
covid-tracker-header-lrg.jpg

Print

Subscribe to the Weekly Review


Interpretive Summary for January 7, 2022
Resolve to be Safe


COVID-19 cases continue to increase rapidly across the United States. This surge is driven by the Omicron variant, which CDC’s Nowcast model projects may account for approximately 95% of cases. On January 5, 705,264 new cases were reported, more than doubling the January 2021 peak. The entire country is now experiencing high levels of community transmission. Hospitalizations are also on the rise. While early data suggest Omicron infections might be less severe than those of other variants, the increases in cases and hospitalizations are expected to stress the healthcare system in the coming weeks.

Given what we currently know about COVID-19 and the Omicron variant, CDC recently updated its quarantine and isolation recommendations for the public.* If you come into close contact with someone with COVID-19, you should quarantine if you are in one of the following groups:
If you have confirmed or suspected COVID-19, regardless of your vaccination status, stay home and isolate from other people for at least 5 full days. Wear a well-fitting mask when around others at home and in public for an additional 5 days. Testing may be used to help determine when to end your isolation period. For information about when and how to test, visit CDC’s website.

Vaccination remains the best way to protect yourself from COVID-19 and reduce its impact on our communities. Everyone should get vaccinated and boosted as soon as they are eligible, including people who have already had COVID-19. Find a vaccine.

*CDC’s updated recommendations reflect the impact to society, the latest science on disease severity, and when and for how long a person is maximally infectious. CDC will continue to evaluate these recommendations as more data become available.

Note to readers: You quarantine when you might have been exposed to the virus and may or may not have been infected. You isolate when you have been infected with the virus, even if you don’t have symptoms. When counting days for isolation, day 0 is the first day of symptoms. If you are asymptomatic, day 0 is the day of your positive viral test. For more information, visit CDC’s website.


Get a Closer Look at CDC’s COVID-19 Data


What's New

Reported Cases


As of January 5, 2022, the current 7-day moving average of daily new cases (586,391) increased 85.7% compared with the previous 7-day moving average (315,851). A total of 57,898,239 COVID-19 cases have been reported in the United States as of January 5, 2022.

Currently two variants, Omicron and Delta, are classified as Variants of Concern (VOC) in the United States. CDC’s COVID Data Tracker shows that the proportion of the Omicron variant circulating in the United States is predicted to increase from the week ending December 25, 2021 and is the predominant variant in the United States. Nowcast projections* for the week ending January 1, 2022, predict the national proportion of Omicron to be 95.4% (95% PI 92.9-97%) and Delta to be 4.6% (95% PI 2.9-7%). Omicron is predicted to be greater than 75% in all HHS regions.

57,898,239
Total Cases Reported

586,391
Current 7-Day Average**

315,851
Prior 7-Day Average

+85.7%
Change in 7-Day Average since Prior Week

*The median time from specimen collection to sequence data reporting is about 3 weeks. As a result, weighted estimates for the most recent few weeks may be unstable or unavailable. CDC’s Nowcast is a data projection tool that helps fill this gap by generating timely estimates of variant proportions for variants that are circulating in the United States. View Nowcast estimates on CDC’s COVID Data Tracker website on the Variant Proportions page.

**Historical cases are excluded from daily new cases and 7-day average calculations until they are incorporated into the dataset for the applicable date. Of 352,811 historical cases reported retroactively, 134 were reported in the current week and 621 were reported in the prior week.

Daily Trends in COVID-19 Cases in the United States Reported to CDC
red-line.jpg

7-Day moving average

resize iconView Larger
More Case Data

Vaccinations


The U.S. COVID-19 Vaccination Program began December 14, 2020. As of January 5, 2022, 513.8 million vaccine doses have been administered in the United States. Overall, about 245.3 million people, or 73.9% of the total U.S. population, have received at least one dose of vaccine. About 206.8 million people, or 62.3% of the total U.S. population, have been fully vaccinated.* About 72.3 million additional/booster doses in fully vaccinated people have been reported. As of January 5, 2022, the 7-day average number of administered vaccine doses reported (by date of CDC report) to CDC per day was 1,075,148, a 3.1% increase from the previous week.

CDC’s COVID Data Tracker Vaccination Demographic Trends tab shows vaccination trends by age group. As of January 5, 2022, 95.0% of people ages 65 years or older have received at least one dose of vaccine and 87.7% are fully vaccinated. For people ages 18 years or older, 85.9% have received at least one dose of vaccine and 73.0% are fully vaccinated. For people ages 12 years or older, 84.0% have received at least one dose of vaccine and 71.3% are fully vaccinated. For people ages 5 years or older, 78.5% have received at least one dose of vaccine and 66.2% are fully vaccinated.

513,839,973
Vaccines Administered

245,278,020
People who received at least one dose

206,797,799
People who are fully vaccinated*

73.9%
Percentage of the U.S. population that has received at least one dose

62.3%
Percentage of the U.S. population that has been fully vaccinated*

+0.7
Percentage point increase from last week

+0.4
Percentage point increase from last week

*Represents the number of people who have received the second dose in a two-dose COVID-19 vaccine series (such as the Pfizer or Moderna vaccines) or one dose of the single-shot Johnson & Johnson’s Janssen vaccine.

Daily Change in the Total Number of Administered COVID-19 Vaccine Doses Reported to CDC by the Date of CDC Report, United States
red-line.jpg

7-Day moving average

resize iconView Larger
More Vaccination Data

Hospitalizations

New Hospital Admissions


The current 7-day daily average for December 28, 2021–January 4, 2022, was 16,458. This is a 60.2% increase from the prior 7-day average (10,271) from December 21–December 27, 2021.

3,773,704
Total New Admissions

16,458
Current 7-Day Average

10,271
Prior 7-Day Average

+60.2%
Change in 7-Day Average

The start of consistent reporting of hospital admissions data was August 1, 2020.

Daily Trends in Number of New COVID-19 Hospital Admissions in the United States

resize iconView Larger
New admissions are pulled from a 10 am EST snapshot of the HHS Unified Hospital Timeseries Dataset. Due to potential reporting delays, data from the most recent 7 days, as noted in the figure above with the grey bar, should be interpreted with caution. Small shifts in historic data may also occur due to changes in the Centers for Medicare and Medicaid Services (CMS) Provider of Services file, which is used to identify the cohort of included hospitals.

More Hospital Data

COVID-NET: Hospitalization Rates in Children Ages 4 Years and Younger


CDC’s Coronavirus Disease 2019-Associated Hospitalization Surveillance Network (COVID-NET) shows that hospitalization rates remain elevated in young children. For the week ending December 18, the weekly rate of COVID-19-associated hospitalizations for children ages 4 years and younger is 2.5 per 100,000. The rate of hospitalization in this age group is higher than rates seen for both older children ages 5–11 years (0.5 per 100,000) and adolescents ages 12–17 years (1.5 per 100,000). Unlike older children and adolescents, children ages 4 years and younger are not yet eligible for any of the available COVID-19 vaccines.

Hospitalization Rates in Children Ages 4 Years and Younger


resize iconView Larger
The Coronavirus Disease 2019 (COVID-19)-Associate­­d Hospitalization Surveillance Network (COVID-NET) is an additional source for hospitalization data collected through a network of more than 250 acute-care hospitals in 14 states (representing ~10% of the U.S. population). Detailed data on patient demographics, including race/ethnicity, underlying medical conditions, medical interventions, and clinical outcomes, are standardized case reporting form.
More COVID-NET Data

Deaths


The current 7-day moving average of new deaths (1,246) has increased 14.4% compared with the previous 7-day moving average (1,089). As of January 6, 2022, a total of 829,740 COVID-19 deaths have been reported in the United States.

829,740
Total Deaths Reported

1,246
Current 7-Day Average*

1,089
Prior 7-Day Average

+14.4%
Change in 7-Day Average Since Prior Week

*Historical deaths are excluded from the daily new deaths and 7-day average calculations until they are incorporated into the dataset by their applicable date. Of 19,432 historical deaths reported retroactively, 337 were reported in the current week; and 3,136 were reported in the prior week.

Daily Trends in Number of COVID-19 Deaths in the United States Reported to CDC
red-line.jpg

7-Day moving average

resize iconView Larger
More Death Data

Testing


The percentage of COVID-19 NAATs (nucleic acid amplification tests)* that are positive (percent positivity) is increasing in comparison to the previous week. The 7-day average of percent positivity from NAATs is now 27.2%. The 7-day average number of tests reported for December 24 – December 30, 2021, was 1,652,836, down 9.1% from 1,818,038 for the prior 7 days.

725,247,503
Total Tests Reported

1,652,836
7-Day Average Tests Reported

27.2%
7-Day Average % Positivity

17.9%
Previous 7-Day Average % Positivity

+9.32
Percentage point change in 7-Day Average % Positivity since Prior Week

*Test for SARS-CoV-2, the virus that causes COVID-19

COVID-19 NAAT Laboratory Test 7-day Percent Positivity by State/Territory

resize iconView Larger
More Testing DataA Closer Look


A Closer Look Section presents more detailed information for readers who want to learn more about current issues of interest.
A Closer Look: Update on the Omicron Variant


Since identifying the first case of the Omicron variant in the United States on December 1, 2021, CDC has been working with state, tribal, local, and territorial public health officials to monitor the spread of Omicron in the United States. On December 10, 2021, CDC released an MMWR article summarizing characteristics of the first Omicron infections in the country. CDC has also identified a rapid increase in infections consistent with what has been observed in other countries. Increases in infections are most likely due to a combination of two factors: increased transmissibility and immune evasion (the ability of the variant to evade immunity conferred by past infection or vaccination). Though the precise contribution of each of the two factors remains unknown, a substantial degree of immune evasion is likely as has been demonstrated in early in vitro studies.

CDC uses genomic surveillance to track variants of SARS-CoV-2 in the United States. CDC’s national genomic surveillance can detect a variant that is circulating at 0.1% frequency with 99% statistical confidence. Current-week estimates of variant proportions are provided by CDC’s Nowcast modeling data, enabling timely public health action while specimens are undergoing the two- to three-week sequencing and analysis process. As of the week ending December 25, 2021, Nowcast estimated that Omicron accounted for 95.4% of circulating SARS-CoV-2 strains while Delta accounted for 4.6% of circulating strains.

The clinical severity profile of Omicron infection will strongly influence its impact on U.S. hospitalizations and deaths. A study from South Africaexternal icon demonstrates that in the first four weeks of the Omicron variant wave there were lower rates of hospitalization compared to the first four weeks of the Beta- or Delta-dominated waves in Gauteng Province. There was also less severe illness reported for those that were admitted. A study conducted in Canadaexternal icon found that the risk of hospitalization was 54% lower for Omicron cases compared with Delta cases.

Even if the proportion of infections associated with severe outcomes is lower than with previous variants, the absolute numbers of people with severe outcomes could be substantial given the rapid increase in the number of infections over the past three weeks. In addition, demand for ambulatory care and supportive care for treatment of mild cases could also stress the healthcare system. Geographical differences in the predominance of the Omicron variant versus ongoing Delta variant infections and the rising burden of illness caused by other respiratory pathogens, such as influenza, may stress healthcare systems regionally to various degrees. On December 23, 2021, CDC issued updated guidance to enhance protection for healthcare personnel, patients, and visitors to address concerns about potential impacts on the healthcare system given a surge of SARS-CoV-2 infections. On January 4, 2022, CDC also issued updated guidance on quarantine and isolation for the public.

Some studies have demonstrated the importance of booster doses in protecting against infection with Omicron, and a lower effectiveness of the primary series of vaccines alone. Current CDC recommendations for vaccines and booster shots are expected to protect against severe illness, hospitalizations, and deaths from infection with the Omicron variant. Therapeutics, including monoclonal antibody treatments and antivirals, are also available for preventing and treating COVID-19 in specific at-risk populations. These therapeutics differ in efficacy, route of administration, risk profile, and whether they are authorized by the U.S Food and Drug Administrationexternal icon for adults only or adults and certain pediatric populations. Some therapeutics are in relatively short supply, but availability is expected to increase in the coming months. Current recommendations were summarized in a CDC Health Alert Network Health Advisory, Using Therapeutics to Prevent and Treat COVID-19, published December 31, 2021.

Scientists around the world, including researchers at CDC, are working quickly to learn more about the Omicron variant. The recent emergence of Omicron and the fact that Delta is still a circulating variant further emphasize the importance of getting a primary vaccination series and, if eligible, a booster and continuing prevention measures.

https://www.cdc.gov/coronavirus/2019-ncov/covid-data/covidview/index.html
 
covid-tracker-header-lrg.jpg

Print

Subscribe to the Weekly Review


Interpretive Summary for January 14, 2022
Keep Kids Safe


The Coronavirus Disease 2019 (COVID-19)-Associated Hospitalization Surveillance Network (COVID-NET) hospitalization data are preliminary and subject to change as more data become available. In particular, case counts and rates for recent hospital admissions are subject to lag, and the weeks most likely affected are indicated by the gray box. Lag for COVID-NET case identification and reporting might increase around holidays or during periods of increased hospital utilization. As data are received each week, prior case counts and rates are updated accordingly.

COVID-19 cases, hospitalizations, and deaths continued to rise in the first week of January. Community transmission remains high throughout the United States. These trends are driven by the Omicron variant, which now accounts for approximately 98% of cases in the country.

COVID-19 tends to be milder in children compared with adults, but CDC’s COVID-NET shows that pediatric hospitalizations with or for COVID-19 are now at their highest rate since the start of the pandemic. Most of these hospitalizations are because of COVID-19, although some are children who were admitted for other causes but tested positive for COVID-19 when they were admitted or during their hospital stay. The highest hospitalization rates among all children are in those ages newborn to 4 years, who are not yet eligible for vaccination. Omicron does not appear to cause more severe disease in children than other variants of the virus, and overall rates of pediatric hospitalizations are still lower than in any adult age group. But because of the rapid spread of COVID-19 cases across the country, we anticipate that these numbers will continue to increase in the coming weeks.

We know how to keep kids safe—even those who are too young to be vaccinated. Parents, guardians, and people who care for and are around young children can protect them by wearing well-fitting masks and getting vaccinated and boosted. CDC recommends everyone ages 5 years and older get a COVID-19 vaccine to help protect against COVID-19. Fully vaccinated people ages 12 years and older should get a COVID-19 booster shot. To find a vaccination site near you, visit vaccines.gov, text your ZIP code to 438829 (GETVAX), or call 1-800-232-0233. If you have questions about COVID-19 vaccines in children, talk with your child’s pediatrician or healthcare provider.


What's New

Reported Cases


As of January 12, 2022, the current 7-day moving average of daily new cases (782,766) increased 33.2% compared with the previous 7-day moving average (587,723). A total of 63,397,935 COVID-19 cases have been reported in the United States as of January 12, 2022.

Currently two variants, Omicron and Delta, are classified as Variants of Concern (VOC) in the United States. CDC Nowcast projections* for the week ending January 8, 2022, predict the national proportion of Omicron to be 98.3% (95% PI 96.9-99.1%) and Delta to be 1.7% (95% PI 0.9-3.0%). Omicron is predicted to be greater than 90% in all HHS regions.

63,397,935
Total Cases Reported

782,766
Current 7-Day Average**

587,723
Prior 7-Day Average

+33.2%
Change in 7-Day Average since Prior Week

*The median time from specimen collection to sequence data reporting is about 3 weeks. As a result, weighted estimates for the most recent few weeks may be unstable or unavailable. CDC’s Nowcast is a data projection tool that helps fill this gap by generating timely estimates of variant proportions for variants that are circulating in the United States. View Nowcast estimates on CDC’s COVID Data Tracker website on the Variant Proportions page.

**Historical cases are excluded from daily new cases and 7-day average calculations until they are incorporated into the dataset for the applicable date. Of 352,811 historical cases reported retroactively, none were reported in the current week and 134 were reported in the prior week.


Daily Trends in COVID-19 Cases in the United States Reported to CDC
red-line.jpg

7-Day moving average

resize iconView Larger
More Case Data

Vaccinations


The U.S. COVID-19 Vaccination Program began December 14, 2020. As of January 13, 2022, 524.2 million vaccine doses have been administered in the United States. Overall, about 248.0 million people, or 74.7% of the total U.S. population, have received at least one dose of vaccine. About 208.6 million people, or 62.8% of the total U.S. population, have been fully vaccinated.* About 78.1 million additional/booster doses in fully vaccinated people have been reported. As of January 13, 2022, the 7-day average number of administered vaccine doses reported (by date of CDC report) to CDC per day was 1,291,013, a 20.4% increase from the previous week.

CDC’s COVID Data Tracker Vaccination Demographic Trends tab shows vaccination trends by age group. As of January 13, 2022, 95.0% of people ages 65 years or older have received at least one dose of vaccine and 87.9% are fully vaccinated. For people ages 18 years or older, 86.7% have received at least one dose of vaccine and 73.4% are fully vaccinated. For people ages 12 years or older, 84.7% have received at least one dose of vaccine and 71.7% are fully vaccinated. For people ages 5 years or older, 79.4% have received at least one dose of vaccine and 66.8% are fully vaccinated.

524,199,956
Vaccines Administered

247,987,225
People who received at least one dose

208,564,894
People who are fully vaccinated*

74.7%
Percentage of the U.S. population that has received at least one dose

62.8%
Percentage of the U.S. population that has been fully vaccinated*

+0.8
Percentage point increase from last week

+0.5
Percentage point increase from last week

*Represents the number of people who have received the second dose in a two-dose COVID-19 vaccine series (such as the Pfizer or Moderna vaccines) or one dose of the single-shot Johnson & Johnson’s Janssen vaccine.

Daily Change in the Total Number of Administered COVID-19 Vaccine Doses Reported to CDC by the Date of CDC Report, United States
red-line.jpg

7-Day moving average

resize iconView Larger
More Vaccination Data

Hospitalizations

New Hospital Admissions


The current 7-day daily average for January 5, 2022–January 11, 2022, was 20,637. This is a 24.5% increase from the prior 7-day average (16,571) from December 29, 2021–January 4, 2022.

3,919,141
Total New Admissions


20,637
Current 7-Day Average

16,571
Prior 7-Day Average

+24.5%
Change in 7-Day Average

The start of consistent reporting of hospital admissions data was August 1, 2020.

Daily Trends in Number of New COVID-19 Hospital Admissions in the United States

resize iconView Larger
New admissions are pulled from a 10 am EST snapshot of the HHS Unified Hospital Timeseries Dataset. Due to potential reporting delays, data from the most recent 7 days, as noted in the figure above with the grey bar, should be interpreted with caution. Small shifts in historic data may also occur due to changes in the Centers for Medicare and Medicaid Services (CMS) Provider of Services file, which is used to identify the cohort of included hospitals.

More Hospital Data

COVID-NET: Hospitalization Rates in Children Ages 4 Years and Younger


CDC’s Coronavirus Disease 2019-Associated Hospitalization Surveillance Network (COVID-NET) shows that hospitalization rates continue to rise in young children. For the week ending December 25, the weekly rate of COVID-19-associated hospitalizations for children ages 4 years and younger is 4.5 per 100,000. The rate of hospitalization in this age group is higher than rates seen for both older children ages 5–11 years (1.1 per 100,000) and adolescents ages 12–17 years (2.6 per 100,000). Unlike older children and adolescents, children ages 4 years and younger are not yet eligible for any of the available COVID-19 vaccines.

Hospitalization Rates in Children Ages 4 Years and Younger


resize iconView Larger
The Coronavirus Disease 2019 (COVID-19)-Associate­­d Hospitalization Surveillance Network (COVID-NET) is an additional source for hospitalization data collected through a network of more than 250 acute-care hospitals in 14 states (representing ~10% of the U.S. population). Detailed data on patient demographics, including race/ethnicity, underlying medical conditions, medical interventions, and clinical outcomes, are standardized case reporting form.
More COVID-NET Data

Deaths


The current 7-day moving average of new deaths (1,729) has increased 36.8% compared with the previous 7-day moving average (1,264). As of January 12, 2022, a total of 842,873 COVID-19 deaths have been reported in the United States.

842,873
Total Deaths Reported

1,729
Current 7-Day Average*

1,264
Prior 7-Day Average

+36.8%
Change in 7-Day Average Since Prior Week

*Historical deaths are excluded from the daily new deaths and 7-day average calculations until they are incorporated into the dataset by their applicable date. Of 19,850 historical deaths reported retroactively, 418 were reported in the current week; and 337 were reported in the prior week.

Daily Trends in Number of COVID-19 Deaths in the United States Reported to CDC
red-line.jpg

7-Day moving average

resize iconView Larger
More Death Data

Testing


The percentage of COVID-19 NAATs (nucleic acid amplification tests)* that are positive (percent positivity) is increasing in comparison to the previous week. The 7-day average of percent positivity from NAATs is now 28.6%. The 7-day average number of tests reported for December 31, 2021 – January 6, 2022, was 2,147,177, up 25.6% from 1,709,893 for the prior 7 days.

742,767,508
Total Tests Reported

2,147,177
7-Day Average Tests Reported

28.6%
7-Day Average % Positivity

27.8%
Previous 7-Day Average % Positivity

+0.75
Percentage point change in 7-Day Average % Positivity since Prior Week

*Test for SARS-CoV-2, the virus that causes COVID-19

COVID-19 NAAT Laboratory Test 7-day Percent Positivity by State/Territory

resize iconView Larger
More Testing Data

https://www.cdc.gov/coronavirus/2019-ncov/covid-data/covidview/index.html
 
covid-tracker-header-lrg.jpg

Print

Subscribe to the Weekly Review


Interpretive Summary for January 21, 2022
Are You Up to Date?


resize iconView Larger
COVID-19 cases, hospitalizations, and deaths continue to increase, driven by the Omicron variant. CDC’s COVID Data Tracker shows that, as of January 20, 2022, more than 209 million people have received their primary series* of a COVID-19 vaccine and are considered fully vaccinated. More than 82 million people are up to date on their vaccines, which means they have received all recommended COVID-19 vaccines, including boosters.
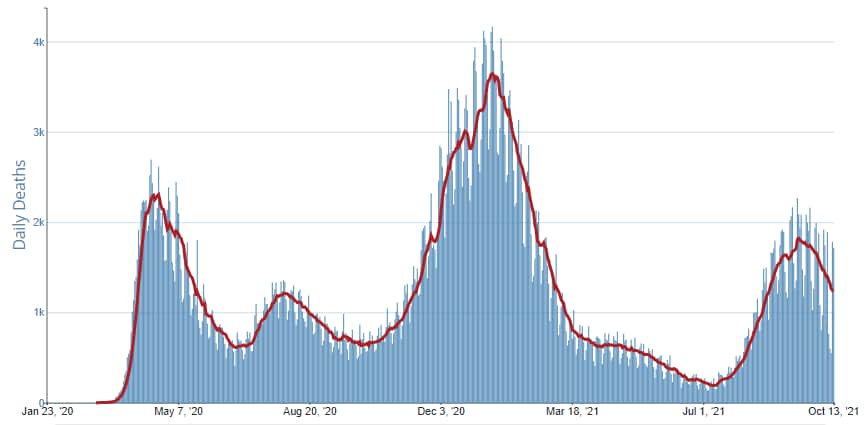
Three reports released this week highlight the importance of getting vaccinated and boosted to protect against severe COVID-19 associated with the Delta and Omicron variants.[SUP]1,2,3[/SUP] COVID Data Tracker shows that, as of January 20, 2022, 53.2% of booster-eligible people in the United States have not received their booster dose. That represents a total of 86 million people. CDC recommends everyone ages 5 years and older get their primary series of a COVID-19 vaccine and receive a booster dose when eligible. Find a vaccine and get your booster dose as soon as you can.
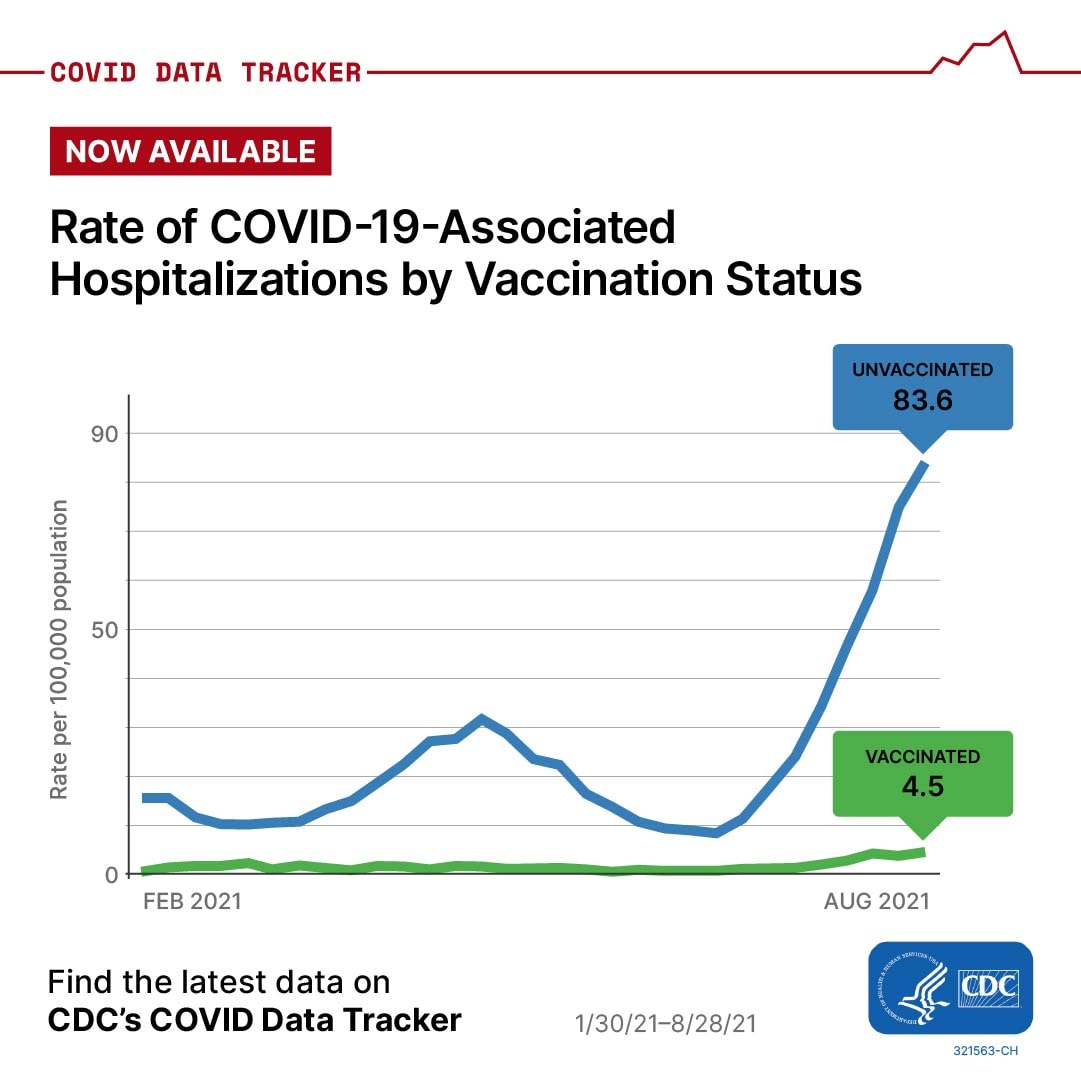
Masking is another crucial way to protect yourself and others. Last week, CDC updated its mask recommendations to show that well-fitting NIOSH-approved respirators (including N95s) offer the most protection against COVID-19. Any mask is always better than none, but whatever mask you choose should fit well and be comfortable enough to wear correctly and consistently. Learn how to get the best protection from your mask by visiting CDC’s Improve How Your Mask Protects You page.

*Primary series completion is defined as receipt of 2 vaccine doses for someone who received a Pfizer-BioNTech or Moderna COVID-19 vaccine, or receipt of 1 dose for someone who received a Janssen/Johnson & Johnson COVID-19 vaccine.


What's New

Reported Cases


As of January 19, 2022, the current 7-day moving average of daily new cases (744,616) decreased 5.0% compared with the previous 7-day moving average (783,922). A total of 68,671,563 COVID-19 cases have been reported in the United States as of January 19, 2022.

Currently two variants, Omicron and Delta, are classified as Variants of Concern (VOC) in the United States. CDC Nowcast projections* for the week ending January 15, 2022, predict the national proportion of Omicron to be 99.5% (95% PI 99.3-99.7%) and Delta to be 0.5% (95% PI 0.3-0.7%). Omicron is predicted to be greater than 96% in all HHS regions.

68,671,563
Total Cases Reported

744,616
Current 7-Day Average**

783,922
Prior 7-Day Average

-5.0%
Change in 7-Day Average since Prior Week

*The median time from specimen collection to sequence data reporting is about 3 weeks. As a result, weighted estimates for the most recent few weeks may be unstable or unavailable. CDC’s Nowcast is a data projection tool that helps fill this gap by generating timely estimates of variant proportions for variants that are circulating in the United States. View Nowcast estimates on CDC’s COVID Data Tracker website on the Variant Proportions page.

**Historical cases are excluded from daily new cases and 7-day average calculations until they are incorporated into the dataset for the applicable date. Of 410,175 historical cases reported retroactively, 57,497 were reported in the current week and none were reported in the prior week.

Daily Trends in COVID-19 Cases in the United States Reported to CDC
red-line.jpg

7-Day moving average

resize iconView Larger
More Case Data

Vaccinations


The U.S. COVID-19 Vaccination Program began December 14, 2020. As of January 20, 2022, 531.9 million vaccine doses have been administered in the United States. Overall, about 250.0 million people, or 75.3% of the total U.S. population, have received at least one dose of vaccine. About 209.8 million people, or 63.2% of the total U.S. population, have been fully vaccinated.* About 82.5 million additional or booster doses in fully vaccinated people have been reported; however, 53.2% of the total booster-eligible population has not yet received a booster dose. As of January 20, 2022, the 7-day average number of administered vaccine doses reported (by date of CDC report) to CDC per day was 1,094,988, a 15.2% decrease from the previous week.

CDC’s COVID Data Tracker Vaccination Demographic Trends tab shows vaccination trends by age group. As of January 20, 2022, 95.0% of people ages 65 years or older have received at least one dose of vaccine and 88.1% are fully vaccinated. For people ages 18 years or older, 87.2% have received at least one dose of vaccine and 73.7% are fully vaccinated. For people ages 12 years or older, 85.3% have received at least one dose of vaccine and 72.1% are fully vaccinated. For people ages 5 years or older, 80.1% have received at least one dose of vaccine and 67.2% are fully vaccinated.

531,864,871
Vaccines Administered

250,028,635
People who received at least one dose

209,842,610
People who are fully vaccinated*

75.3%
Percentage of the U.S. population that has received at least one dose

63.2%
Percentage of the U.S. population that has been fully vaccinated*

+0.8
Percentage point increase from last week

+0.5
Percentage point increase from last week

*Represents the number of people who have received the second dose in a two-dose COVID-19 vaccine series (such as the Pfizer or Moderna vaccines) or one dose of the single-shot Johnson & Johnson’s Janssen vaccine.

Daily Change in the Total Number of Administered COVID-19 Vaccine Doses Reported to CDC by the Date of CDC Report, United States
red-line.jpg

7-Day moving average

resize iconView Larger
More Vaccination Data

Hospitalizations

New Hospital Admissions


The current 7-day daily average for January 12–18, 2022, was 20,990. This is a 1.1% increase from the prior 7-day average (20,757) from January 5–11, 2022.

4,066,990
Total New Admissions


20,990
Current 7-Day Average

20,757
Prior 7-Day Average

+1.1%
Change in 7-Day Average

The start of consistent reporting of hospital admissions data was August 1, 2020.

Daily Trends in Number of New COVID-19 Hospital Admissions in the United States

resize iconView Larger
New admissions are pulled from a 10 am EST snapshot of the HHS Unified Hospital Timeseries Dataset. Due to potential reporting delays, data from the most recent 7 days, as noted in the figure above with the grey bar, should be interpreted with caution. Small shifts in historic data may also occur due to changes in the Centers for Medicare and Medicaid Services (CMS) Provider of Services file, which is used to identify the cohort of included hospitals.

More Hospital Data

COVID-NET: Hospitalization Rates by Vaccination Status in Adults


CDC’s Coronavirus Disease 2019-Associated Hospitalization Surveillance Network (COVID-NET) shows that rates of COVID-19-associated hospitalizations in December 2021 were markedly higher in unvaccinated adults compared to fully vaccinated adults who have received additional or booster doses of a COVID-19 vaccine. Among adults ages 50–64 years, the COVID-19-associated hospitalization rate in December among unvaccinated persons was 44 times higher than among those who were fully vaccinated and received an additional or booster dose. Among adults ages 65 years and older, compared to persons who were fully vaccinated and received an additional or booster dose, rates of COVID-19-associated hospitalizations were 49 times higher among unvaccinated adults.

Hospitalization Rates by Vaccination Status in Adults


resize iconView Larger
The Coronavirus Disease 2019 (COVID-19)-Associate­­d Hospitalization Surveillance Network (COVID-NET) is an additional source for hospitalization data collected through a network of more than 250 acute-care hospitals in 14 states (representing ~10% of the U.S. population). Detailed data on patient demographics, including race/ethnicity, underlying medical conditions, medical interventions, and clinical outcomes, are collected with a standardized case reporting form.
More COVID-NET Data

Deaths


The current 7-day moving average of new deaths (1,749) has decreased 0.3% compared with the previous 7-day moving average (1,754). As of January 19, 2022, a total of 856,288 COVID-19 deaths have been reported in the United States.

856,288
Total Deaths Reported

1,749
Current 7-Day Average*

1,754
Prior 7-Day Average

-0.3%
Change in 7-Day Average Since Prior Week

*Historical deaths are excluded from the daily new deaths and 7-day average calculations until they are incorporated into the dataset by their applicable date. Of 19,981 historical deaths reported retroactively, 548 were reported in the current week; and 418 were reported in the prior week.

Daily Trends in Number of COVID-19 Deaths in the United States Reported to CDC
red-line.jpg

7-Day moving average

resize iconView Larger
More Death Data

Testing


The percentage of COVID-19 NAATs (nucleic acid amplification tests)* that are positive (percent positivity) is decreasing in comparison to the previous week. The 7-day average of percent positivity from NAATs is now 27.2%. The 7-day average number of tests reported for January 7 – January 13, 2022, was 2,176,938, down 1.4% from 2,207,754 for the prior 7 days.

756,536,186
Total Tests Reported

2,176,938
7-Day Average Tests Reported

27.2%
7-Day Average % Positivity

28.9%
Previous 7-Day Average % Positivity

-1.73
Percentage point change in 7-Day Average % Positivity since Prior Week

*Test for SARS-CoV-2, the virus that causes COVID-19

COVID-19 NAAT Laboratory Test 7-day Percent Positivity by State/Territory

resize iconView Larger
More Testing Data
References
  1. Effectiveness of a Third Dose of mRNA Vaccines Against COVID-19–Associated Emergency Department and Urgent Care Encounters and Hospitalizations Among Adults During Periods of Delta and Omicron Variant Predominance — VISION Network, 10 States, August 2021–January 2022
  2. COVID-19 Incidence and Death Rates Among Unvaccinated and Fully Vaccinated Adults with and Without Booster Doses During Periods of Delta and Omicron Variant Emergence — 25 U.S. Jurisdictions, April 4–December 25, 2021
  3. Association between three doses of mRNA COVID-19 vaccine and symptomatic infection caused by the SARS-CoV-2 Omicron and Delta variants, JAMAexternal icon
https://www.cdc.gov/coronavirus/2019-ncov/covid-data/covidview/index.html
 
covid-tracker-header-lrg.jpg

Print

Subscribe to the Weekly Review


Interpretive Summary for January 28, 2022
Stay Up to Date


Hospitalization rates per 100,000 population for fully vaccinated and boosted, fully vaccinated without booster and unvaccinated


resize iconView Larger
COVID-19 cases and hospitalizations are starting to decline across the United States. However, deaths are still rising, and community transmission is still high nationwide. As of January 27, 2022, more than 211 million people in the United States have received a primary series of a COVID-19 vaccine and are considered fully vaccinated. More than 86 million people are up to date with their COVID-19 vaccines, which means they have received all recommended COVID-19 vaccine doses, including boosters.

Two new CDC reports show that people who are up to date with their COVID-19 vaccines have the highest amount of protection against both the Delta and Omicron variants.[SUP]1,2 [/SUP]One report found that, compared to up-to-date adults, unvaccinated adults had five times the risk of infection and more than 50 times the risk of COVID-19-associated death. A second report found that a third dose (either an additional primary dose or booster dose) of an mRNA COVID-19 vaccine (Pfizer-BioNTech or Moderna) was highly effective at preventing emergency and urgent care visits and hospitalizations related to COVID-19. COVID-19 cases and hospitalizations are starting to decline across the United States. However, deaths are still rising, and community transmission is still high nationwide. As of January 27, 2022, more than 211 million people in the United States have received a primary series of a COVID-19 vaccine and are considered fully vaccinated.
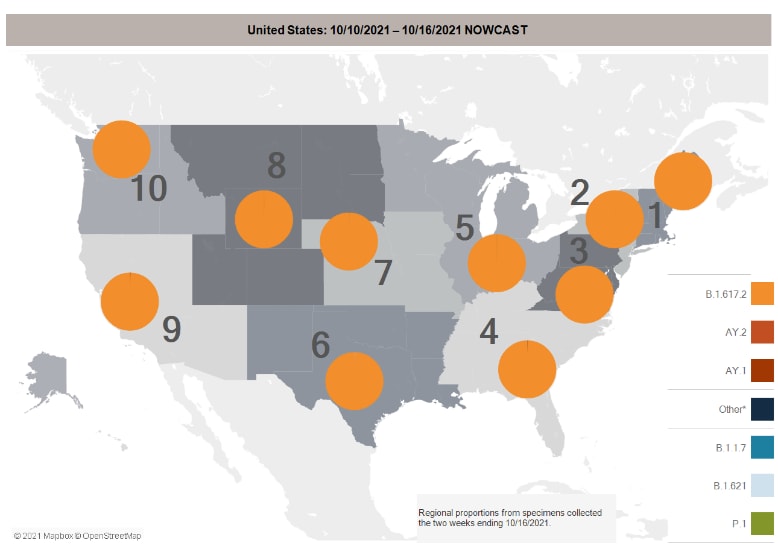
The U.S. COVID-19 Vaccination Program began December 14, 2020. As of January 27, 2022, 536.4 million vaccine doses have been administered in the United States. Overall, about 249.3 million people, or 75.1% of the total U.S. population, have received at least one dose of vaccine. About 211.2 million people, or 63.6% of the total U.S. population, have been fully vaccinated.* About 86.5 million additional or booster doses have been reported in people who have been fully vaccinated; however, 51.8% of the total booster-eligible population has not yet received a booster dose. As of January 27, 2022, the 7-day average number of administered vaccine doses reported (by date of CDC report) to CDC per day was 643,725, a 41.2% decrease from the previous week.


What's New

Reported Cases


As of January 26, 2022, the current 7-day moving average of daily new cases (596,860) decreased 19.9% compared with the previous 7-day moving average (744,806). A total of 72,874,041 COVID-19 cases have been reported in the United States as of January 26, 2022.

Currently two variants, Omicron and Delta, are classified as Variants of Concern (VOC) in the United States. CDC Nowcast projections* for the week ending January 22, 2022, predict the national proportion of Omicron to be 99.9% (95% PI 99.8-99.9%) and Delta to be 0.1% (95% PI 0.1-0.2%). Omicron is predicted to be greater than 99% in all HHS regions.

72,874,041
Total Cases Reported

596,860
Current 7-Day Average**

744,806
Prior 7-Day Average

-19.9%
Change in 7-Day Average since Prior Week

*The median time from specimen collection to sequence data reporting is about 3 weeks. As a result, weighted estimates for the most recent few weeks may be unstable or unavailable. CDC’s Nowcast is a data projection tool that helps fill this gap by generating timely estimates of variant proportions for variants that are circulating in the United States. View Nowcast estimates on CDC’s COVID Data Tracker website on the Variant Proportions page.

**Historical cases are excluded from daily new cases and 7-day average calculations until they are incorporated into the dataset for the applicable date. Of 399,384 historical cases reported retroactively, none were reported in the current week and 46,706 were reported in the prior week.


Daily Trends in COVID-19 Cases in the United States Reported to CDC
red-line.jpg

7-Day moving average

resize iconView Larger
More Case Data

Vaccinations


The U.S. COVID-19 Vaccination Program began December 14, 2020. As of January 27, 2022, 536.4 million vaccine doses have been administered in the United States. Overall, about 249.3 million people, or 75.1% of the total U.S. population, have received at least one dose of vaccine. About 211.2 million people, or 63.6% of the total U.S. population, have been fully vaccinated.* About 86.5 million additional or booster doses have been reported in people who have been fully vaccinated; however, 51.8% of the total booster-eligible population has not yet received a booster dose. As of January 27, 2022, the 7-day average number of administered vaccine doses reported (by date of CDC report) to CDC per day was 643,725, a 41.2% decrease from the previous week.

CDC’s COVID Data Tracker Vaccination Demographic Trends tab shows vaccination trends by age group. As of January 27, 2022, 95.0% of people ages 65 years or older have received at least one dose of vaccine and 88.3% are fully vaccinated. For people ages 18 years or older, 86.7% have received at least one dose of vaccine and 74.0% are fully vaccinated. For people ages 12 years or older, 84.9% have received at least one dose of vaccine and 72.4% are fully vaccinated. For people ages 5 years or older, 79.8% have received at least one dose of vaccine and 67.6% are fully vaccinated.

536,370,947
Vaccine Doses Administered

249,267,851
People who received at least one dose

211,162,083
People who are fully vaccinated*

75.1%
Percentage of the U.S. population that has received at least one dose

63.6%
Percentage of the U.S. population that has been fully vaccinated*

-0.2
Percentage point increase from last week

+0.4
Percentage point increase from last week

*Represents the number of people who have received the second dose in a two-dose COVID-19 vaccine series (such as the Pfizer or Moderna vaccines) or one dose of the single-shot Johnson & Johnson’s Janssen vaccine.
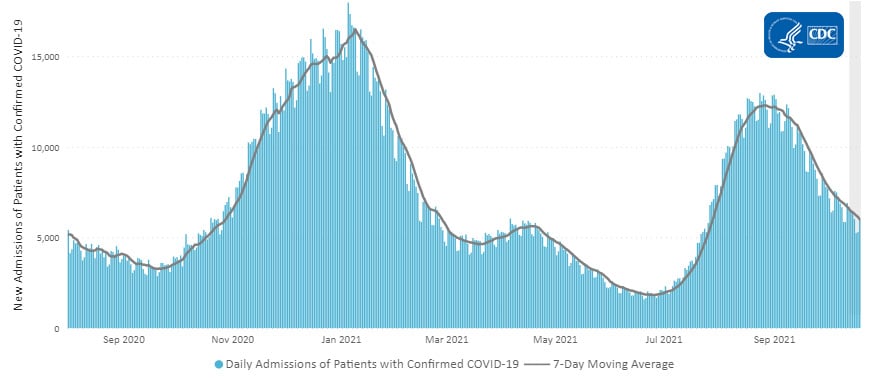
Daily Change in the Total Number of Administered COVID-19 Vaccine Doses Reported to CDC by the Date of CDC Report, United States
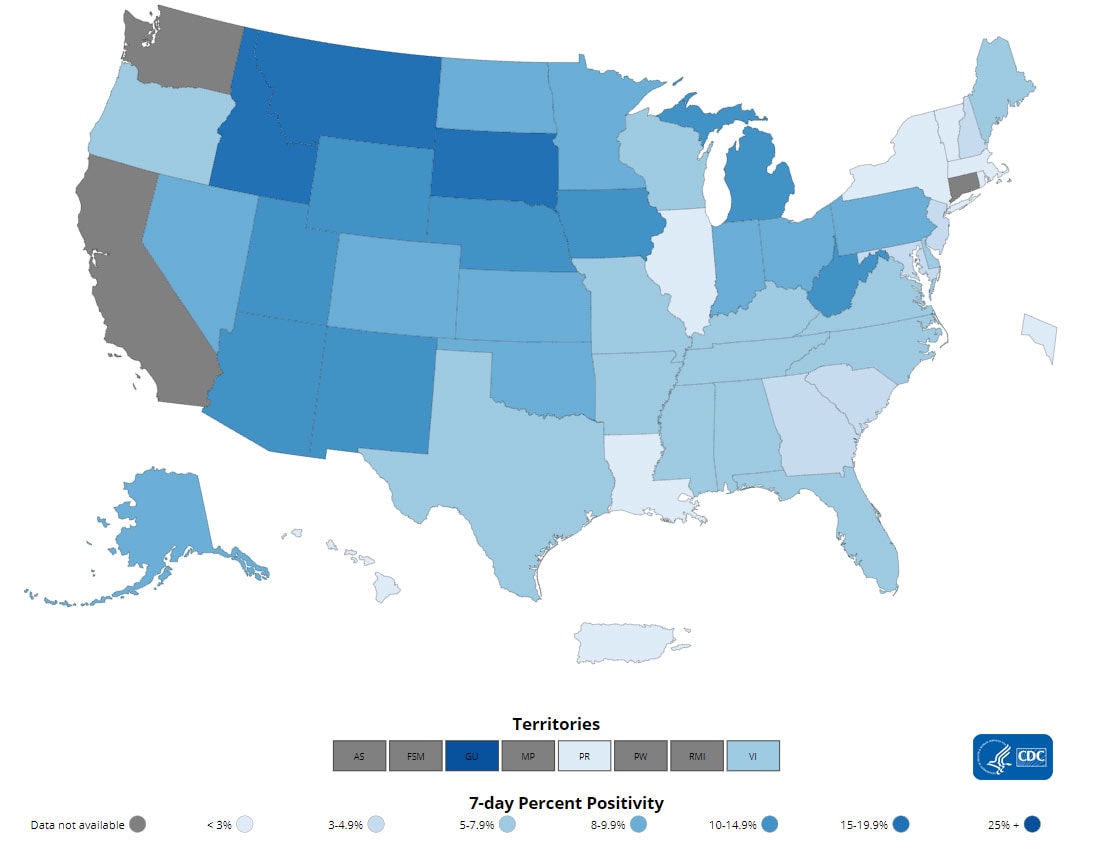
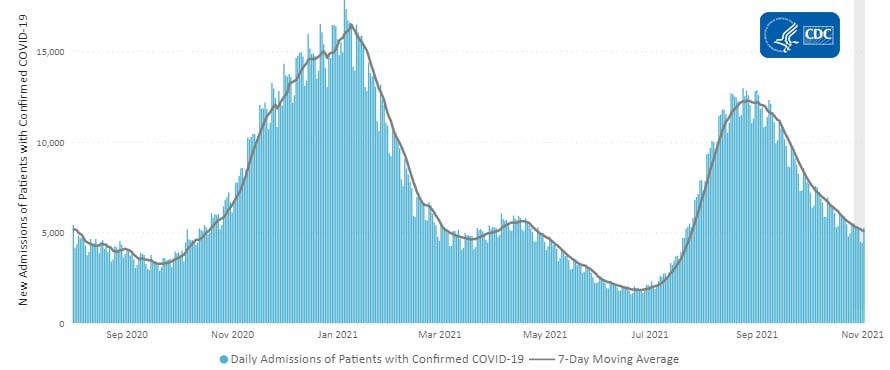
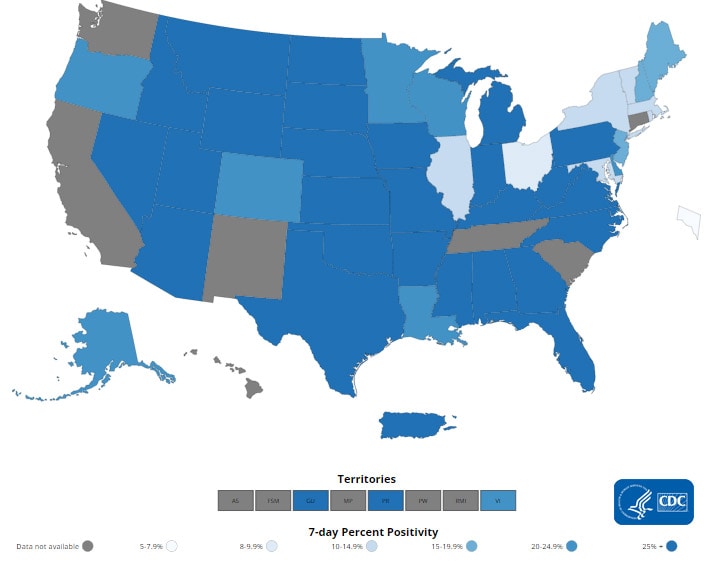
red-line.jpg

7-Day moving average

resize iconView Larger
More Vaccination Data

Hospitalizations

New Hospital Admissions


The current 7-day daily average for January 19–25, 2022, was 19,315. This is an 8.8% decrease from the prior 7-day average (21,169) from January 12–18, 2022.

4,203,448
Total New Admissions


19,315
Current 7-Day Average

21,169
Prior 7-Day Average

-8.8%
Change in 7-Day Average

The start of consistent reporting of hospital admissions data was August 1, 2020.

Daily Trends in Number of New COVID-19 Hospital Admissions in the United States

resize iconView Larger
New admissions are pulled from a 10 am EST snapshot of the HHS Unified Hospital Timeseries Dataset. Due to potential reporting delays, data from the most recent 7 days, as noted in the figure above with the grey bar, should be interpreted with caution. Small shifts in historic data may also occur due to changes in the Centers for Medicare and Medicaid Services (CMS) Provider of Services file, which is used to identify the cohort of included hospitals.

More Hospital Data

COVID-NET: Trends in Hospitalizations among Non-Hispanic Black People


CDC’s Coronavirus Disease 2019-Associated Hospitalization Surveillance Network (COVID-NET) shows that since the start of the pandemic, people from racial and ethnic minority groups have experienced disproportionately higher rates of COVID-19-associated hospitalizations compared to non-Hispanic White people. Beginning in mid-December, the weekly COVID-19-associated hospitalization rates for non-Hispanic Black people have risen sharply, especially when compared to other groups. For the week ending January 8, 2021, preliminary data not adjusted for age show rates of COVID-19-associated hospitalizations in non-Hispanic Black people were 60.5 per 100,000 population—more than twice as high as the overall weekly rate of hospitalization (29.7 per 100,000 population) and almost 3 times as high as rates among non-Hispanic White people (21.2 per 100,000 population).

Hospitalization Rates among Select Race and Ethnicity Groups


resize iconView Larger
The Coronavirus Disease 2019 (COVID-19)-Associate­­d Hospitalization Surveillance Network (COVID-NET) is an additional source for hospitalization data collected through a network of more than 250 acute-care hospitals in 14 states (representing ~10% of the U.S. population). Detailed data on patient demographics, including race/ethnicity, underlying medical conditions, medical interventions, and clinical outcomes, are collected with a standardized case reporting form.
More COVID-NET Data

Deaths


The current 7-day moving average of new deaths (2,288) has increased 25.1% compared with the previous 7-day moving average (1,829). As of January 26, 2022, a total of 873,957 COVID-19 deaths have been reported in the United States.

873,957
Total Deaths Reported

2,288
Current 7-Day Average*

1,829
Prior 7-Day Average

25.1%
Change in 7-Day Average Since Prior Week

*Historical deaths are excluded from the daily new deaths and 7-day average calculations until they are incorporated into the dataset by their applicable date. Of 19,981 historical deaths reported retroactively, 548 were reported in the current week; and 418 were reported in the prior week.

Daily Trends in Number of COVID-19 Deaths in the United States Reported to CDC
red-line.jpg

7-Day moving average

resize iconView Larger
More Death Data

Testing


The percentage of COVID-19 NAATs (nucleic acid amplification tests)* that are positive (percent positivity) is decreasing in comparison to the previous week. The 7-day average of percent positivity from NAATs is now 23.9%. The 7-day average number of tests reported for January 14-20, 2022, was 2,187,066, down 8.2% from 2,382,767 for the prior 7 days.

774,202,680
Total Tests Reported

2,187,066
7-Day Average Tests Reported

23.9%
7-Day Average % Positivity

26.9%
Previous 7-Day Average % Positivity

-3.02
Percentage point change in 7-Day Average % Positivity since Prior Week

*Test for SARS-CoV-2, the virus that causes COVID-19

COVID-19 NAAT Laboratory Test 7-day Percent Positivity by State/Territory

resize iconView Larger
More Testing Data
References
  1. Effectiveness of a Third Dose of mRNA Vaccines Against COVID-19–Associated Emergency Department and Urgent Care Encounters and Hospitalizations Among Adults During Periods of Delta and Omicron Variant Predominance — VISION Network, 10 States, August 2021–January 2022
  2. COVID-19 Incidence and Death Rates Among Unvaccinated and Fully Vaccinated Adults with and Without Booster Doses During Periods of Delta and Omicron Variant Emergence — 25 U.S. Jurisdictions, April 4–December 25, 2021
https://www.cdc.gov/coronavirus/2019-ncov/covid-data/covidview/index.html
 
Back
Top