sharon sanders
Editor-in-Chief & President
[FONT="] [h=3]2015-2016 Influenza Season Week 11 ending March 19, 2016[/h] All data are preliminary and may change as more reports are received.
[h=3]Synopsis:[/h] During week 11 (March 13-19, 2016), influenza activity decreased slightly, but remained elevated in the United States.
? Elevated means the % of visits for ILI is at or above the national or region-specific baseline
§ Includes all 50 states, New York City, the District of Columbia and Puerto Rico
? National data are for current week; regional data are for the most recent three weeks
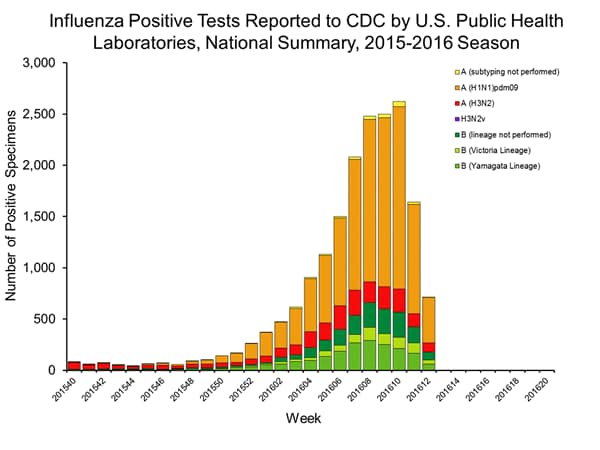
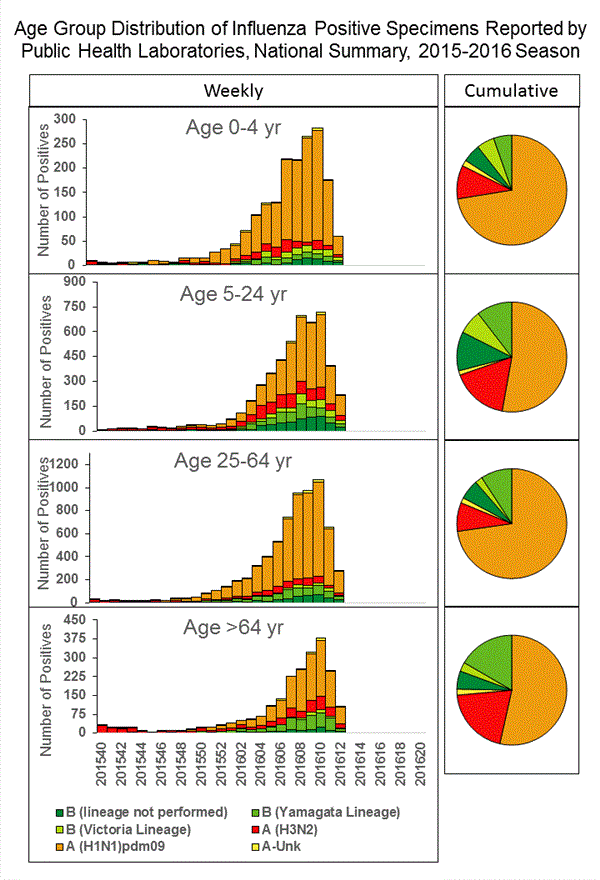
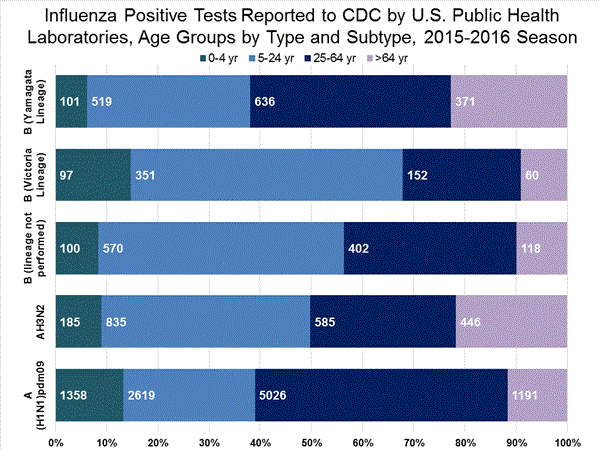
[h=2]U.S. Virologic Surveillance:[/h] WHO and NREVSS collaborating laboratories, which include both public health and clinical laboratories located in all 50 states, Puerto Rico, and the District of Columbia, report to CDC the total number of respiratory specimens tested for influenza and the number positive for influenza by virus type. In addition, public health laboratories also report the influenza A subtype (H1 or H3) and influenza B lineage information of the viruses they test and the age or age group of the persons from whom the specimens were collected.
Additional data are available at http://gis.cdc.gov/grasp/fluview/fluportaldashboard.html.
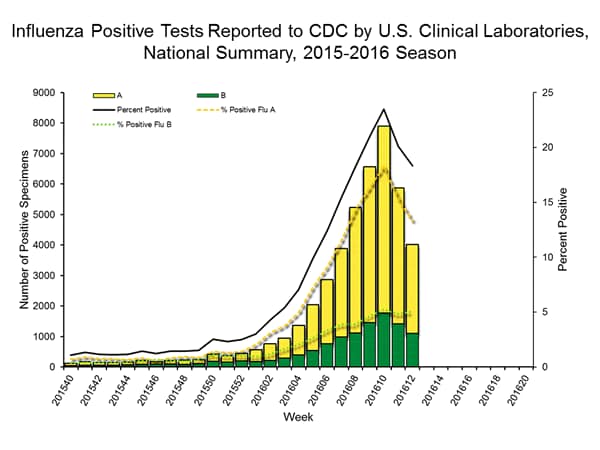
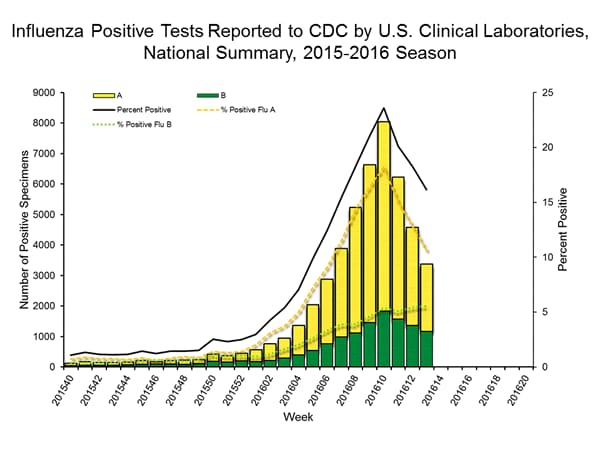
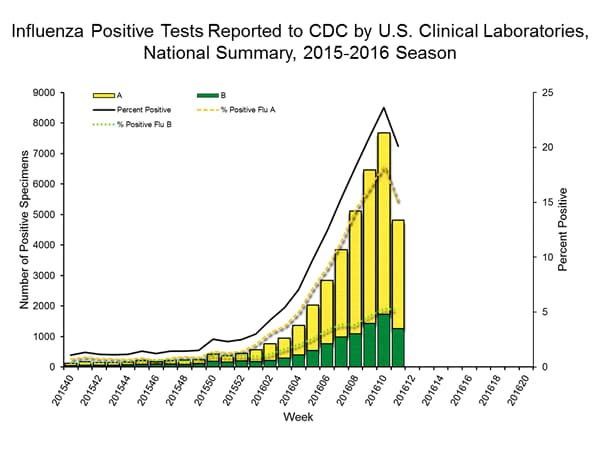
The results of tests performed by clinical laboratories during the current week are summarized below.
[TABLE="class: table table-bordered table-condensed opt-in"]
[TR]
[TD="width: 200"] [/TD]
Week 11 Data Cumulative since
October 4, 2015 (Week 40) [/TR]
[TR]
No. of specimens tested [TD]23,946[/TD]
[TD]448,331[/TD]
[/TR]
[TR]
No. of positive specimens (%) [TD]4,816 (20.1%)[/TD]
[TD]39,486 (8.8%)[/TD]
[/TR]
[TR]
Positive specimens by type [TD] [/TD]
[TD] [/TD]
[/TR]
[TR]
Influenza A [TD]3,557 (73.9%)[/TD]
[TD]29,354 (74.3%)[/TD]
[/TR]
[TR]
Influenza B [TD]1,259 (26.1%)[/TD]
[TD]10,132 (25.7%)[/TD]
[/TR]
[/TABLE]
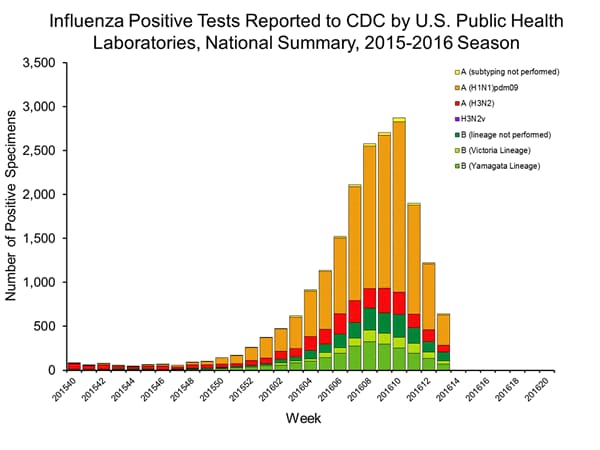
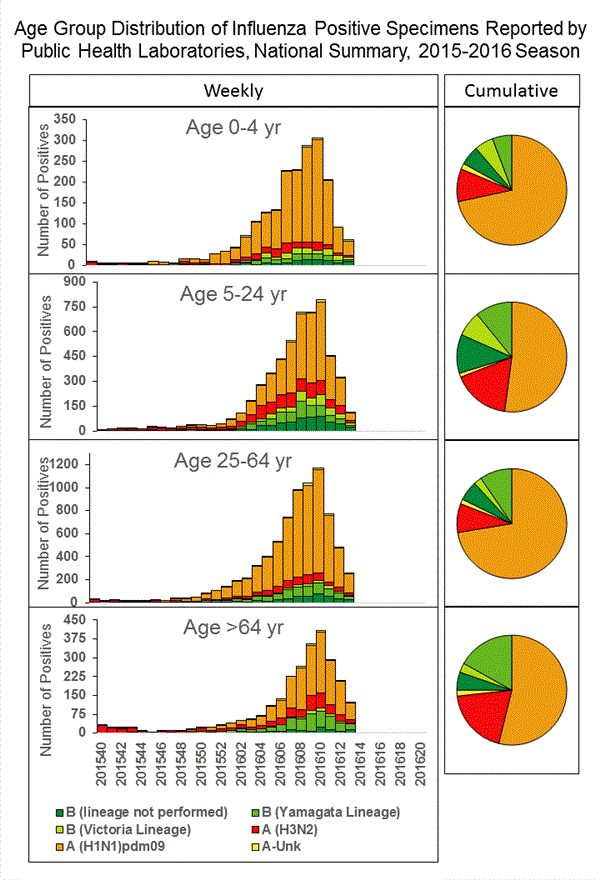
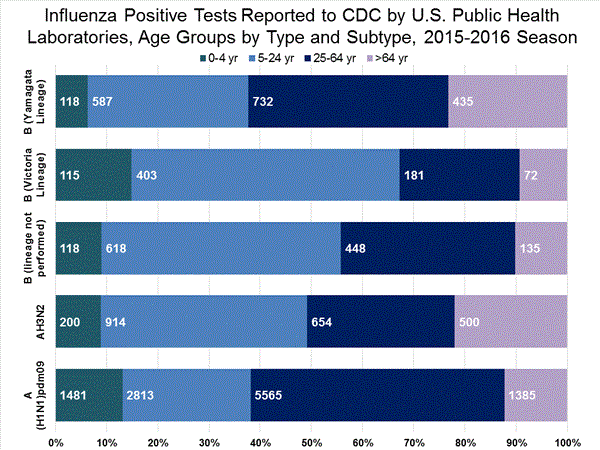
View National and Regional Level Graphs and Data | View Chart Data | View Full Screen | View PowerPoint Presentation The results of tests performed by public health laboratories, as well as the age group distribution of influenza positive tests, during the current week are summarized below.
[TABLE="class: table table-bordered table-condensed opt-in"]
[TR]
[TD="width: 228"] [/TD]
Week 11 Data Cumulative since October 4, 2015 (Week 40) [/TR]
[TR]
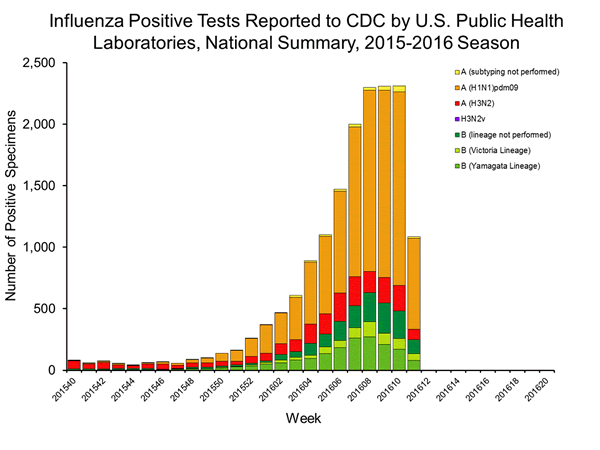
No. of specimens tested [TD]1,848[/TD]
[TD]48,156[/TD]
[/TR]
[TR]
No. of positive specimens* [TD]1,086[/TD]
[TD]16,175[/TD]
[/TR]
[TR]
Positive specimens by type/subtype [TD] [/TD]
[TD] [/TD]
[/TR]
[TR]
Influenza A [TD]839 (77.3%)[/TD]
[TD]12,193 (75.4%)[/TD]
[/TR]
[TR]
A(H1N1)pdm09 [TD]739 (88.1%)[/TD]
[TD]9,748 (79.9%)[/TD]
[/TR]
[TR]
H3 [TD]85 (10.1%)[/TD]
[TD]2,211 (18.1%)[/TD]
[/TR]
[TR]
Subtyping not performed [TD]15 (1.8%)[/TD]
[TD]234 (1.9%)[/TD]
[/TR]
[TR]
Influenza B [TD]247 (22.7%)[/TD]
[TD]3,982 (24.6%)[/TD]
[/TR]
[TR]
Yamagata lineage [TD]78 (31.6%)[/TD]
[TD]1,726 (43.3%)[/TD]
[/TR]
[TR]
Victoria lineage [TD]56 (22.7%)[/TD]
[TD]676 (17.0%)[/TD]
[/TR]
[TR]
Lineage not performed [TD]113 (45.7%)[/TD]
[TD]1,580 (39.7%)[/TD]
[/TR]
[/TABLE]
*The percent of specimens testing positive for influenza is not reported because public health laboratories often receive samples that have already tested positive for influenza at a clinical laboratory and therefore percent positive would not be a valid indicator of influenza activity. Additional information is available at http://www.cdc.gov/flu/weekly/overview.htm.
View National and Regional Level Graphs and Data | View Chart Data | View Full Screen | View PowerPoint Presentation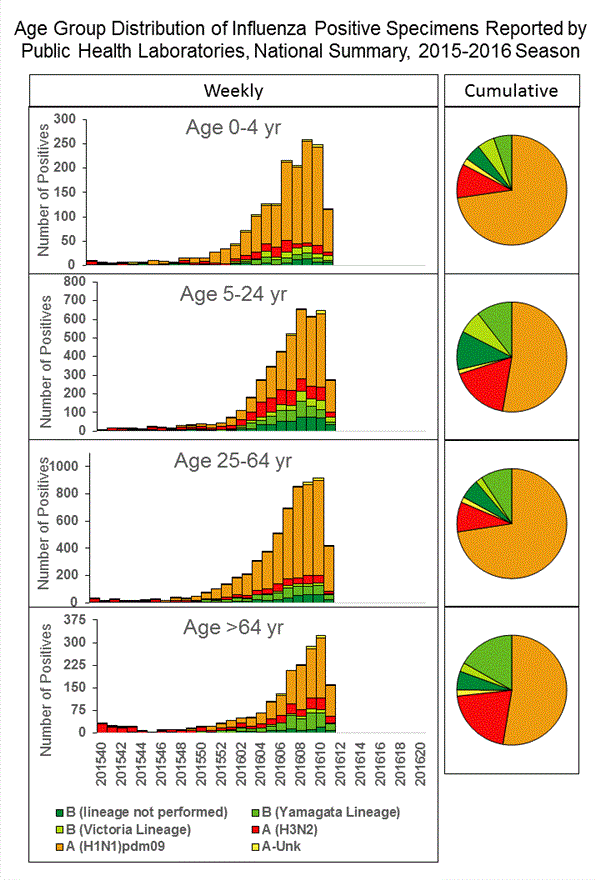
View Chart Data | View Full Screen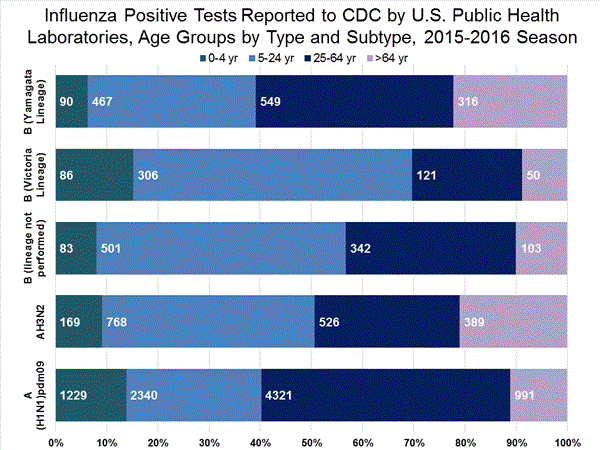
View Chart Data |View Full Screen [h=2]Influenza Virus Characterization:[/h] CDC characterizes influenza viruses through one or more tests including genome sequencing, hemagglutination inhibition (HI) and/or neutralization assays. These data are used to compare how similar currently circulating influenza viruses are to the reference viruses used for developing influenza vaccines, and to monitor for changes in circulating influenza viruses. Historically, HI data have been used most commonly to assess the similarity between reference viruses and circulating viruses to suggest how well the vaccine may work until such time as vaccine effectiveness estimates are available. During the 2014–2015 season and to date, however, a portion of influenza A (H3N2) viruses do not yield sufficient hemagglutination titers for antigenic characterization by HI. For many of these viruses, CDC performs genetic characterization to determine the genetic group identity of those viruses. In this way, antigenic properties of these viruses can be inferred from viruses within the same genetic group that have been characterized antigenically.
CDC has characterized 1,229 influenza viruses [507 A (H1N1)pdm09, 324 A (H3N2), and 398 influenza B viruses] collected by U.S. laboratories since October 1, 2015.
Influenza A Virus [831]
High levels of resistance to the adamantanes (amantadine and rimantadine) persist among influenza A(H1N1)pdm09 and influenza A (H3N2) viruses (the adamantanes are not effective against influenza B viruses). Therefore, data from adamantane resistance testing are not presented below.
[TABLE="class: table, align: center, border: 0, cellpadding: 3, cellspacing: 0"]
[h=3]Neuraminidase Inhibitor Resistance Testing Results on Samples Collected Since October 1, 2015[/h] [/TABLE]
[TABLE="class: table table-bordered opt-in"]
[TR]
[TD] [/TD]
Oseltamivir
Zanamivir
Peramivir
[/TR]
[TR]
[TD] [/TD]
Virus Samples tested
Resistant Viruses, Number (%)
Virus Samples tested
Resistant Viruses, Number (%)
Virus Samples tested
Resistant Viruses, Number (%)
[/TR]
[TR]
Influenza A(H1N1)pdm09
[TD] 922
[/TD]
[TD] 5 (0.5)
[/TD]
[TD] 501
[/TD]
[TD] 0 (0.0)
[/TD]
[TD] 922
[/TD]
[TD] 5 (0.5)
[/TD]
[/TR]
[TR]
Influenza A (H3N2)
[TD] 387
[/TD]
[TD] 0 (0.0)
[/TD]
[TD] 387
[/TD]
[TD] 0 (0.0)
[/TD]
[TD] 358
[/TD]
[TD] 0 (0.0)
[/TD]
[/TR]
[TR]
Influenza B
[TD] 463
[/TD]
[TD] 0 (0.0)
[/TD]
[TD] 463
[/TD]
[TD] 0 (0.0)
[/TD]
[TD] 463
[/TD]
[TD] 0 (0.0)
[/TD]
[/TR]
[/TABLE]
The majority of recently circulating influenza viruses are susceptible to the neuraminidase inhibitor antiviral medications, oseltamivir, zanamivir, and peramivir; however, rare sporadic instances of oseltamivir-resistant and peramivir-resistant influenza A (H1N1)pdm09 viruses and oseltamivir-resistant influenza A (H3N2) viruses have been detected worldwide. Antiviral treatment as early as possible is recommended for patients with confirmed or suspected influenza who have severe, complicated, or progressive illness; who require hospitalization; or who are at high risk. for serious influenza-related complications. Additional information on recommendations for treatment and chemoprophylaxis of influenza virus infection with antiviral agents is available athttp://www.cdc.gov/flu/antivirals/index.htm.
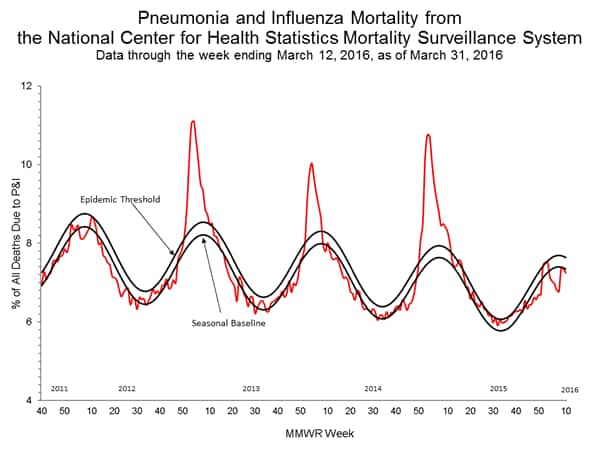
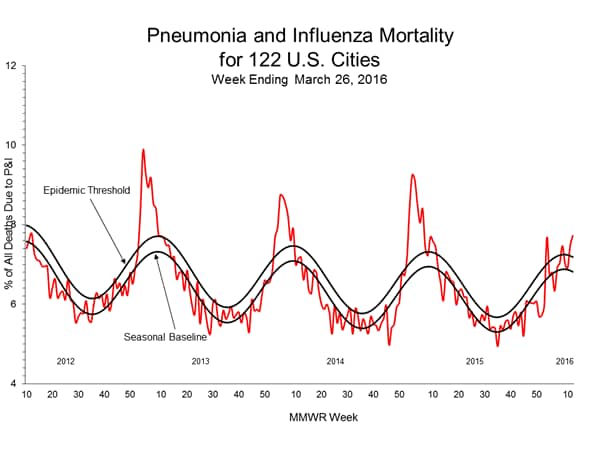
[h=2]Pneumonia and Influenza (P&I) Mortality Surveillance:[/h] Rapid tracking of pneumonia and influenza-associated deaths is done through two systems, the National Center for Health Statistics (NCHS) Mortality Surveillance System and the 122 Cities Mortality Reporting System. NCHS mortality surveillance data are presented by the week the death occurred and P&I percentages are released two weeks after the week of death to allow for collection of enough data to produce a stable P&I percentage. Users of the data should not expect the two systems to produce the same percentages, and the percent P&I deaths from each system should be compared to the corresponding system-specific baselines and thresholds.
NCHS Mortality Surveillance Data:
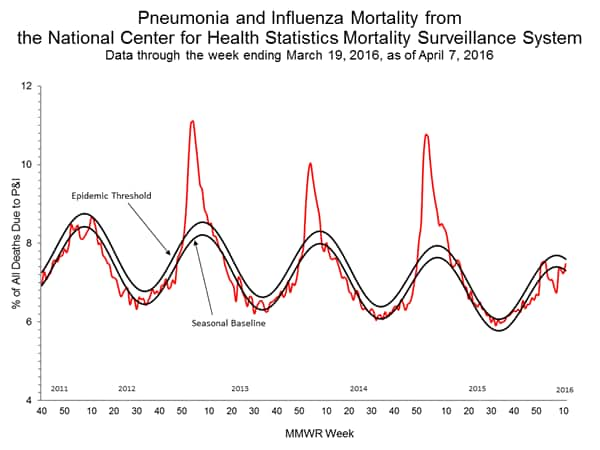
Based on NCHS mortality surveillance data available on March 24, 2016, 7.4% of the deaths occurring during the week ending March 5, 2016 (week 9) were due to P&I. This percentage is below the epidemic threshold of 7.7% for week 9.
Region and state-specific data are available at http://www.cdc.gov/flu/weekly/nchs.htm.
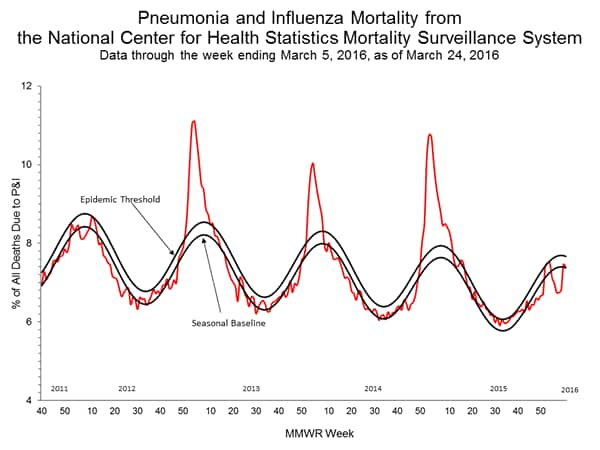
View Regional and State Level Data | View Chart Data | View Full Screen | View PowerPoint Presentation 122 Cities Mortality Reporting System:
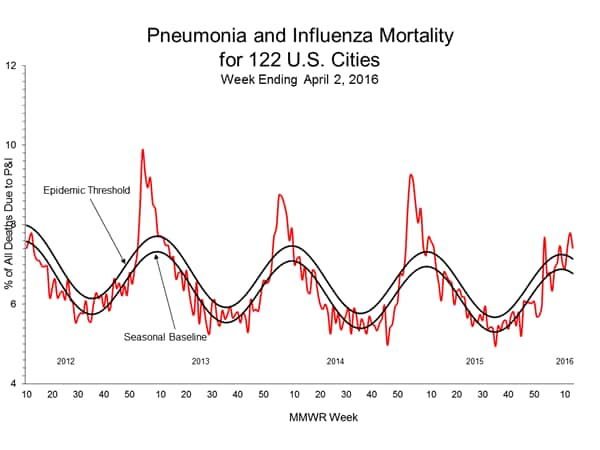
During week 11, 7.3% of all deaths reported through the 122 Cities Mortality Reporting System were due to P&I. This percentage was above the epidemic threshold of 7.2% for week 11.
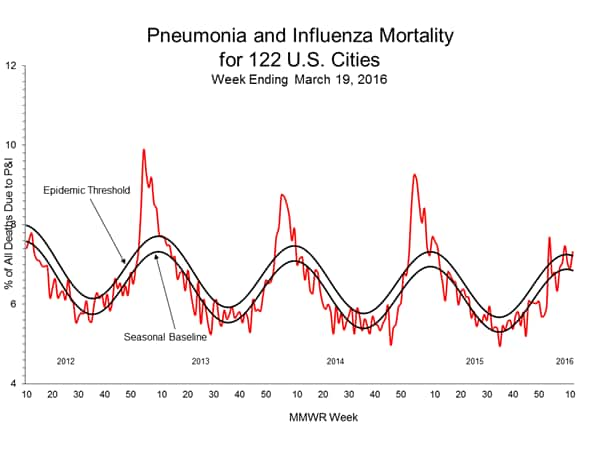
View Full Screen | View PowerPoint Presentation
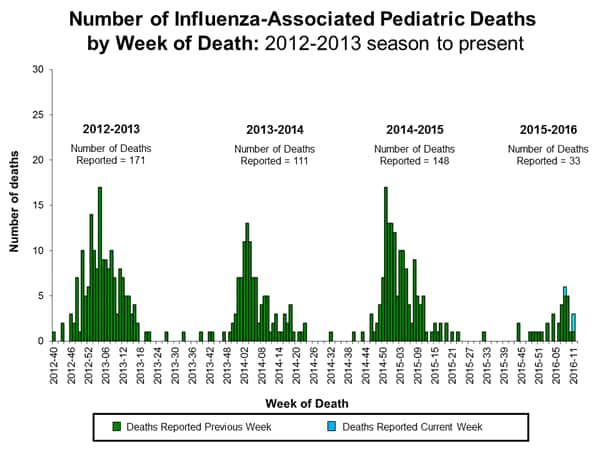
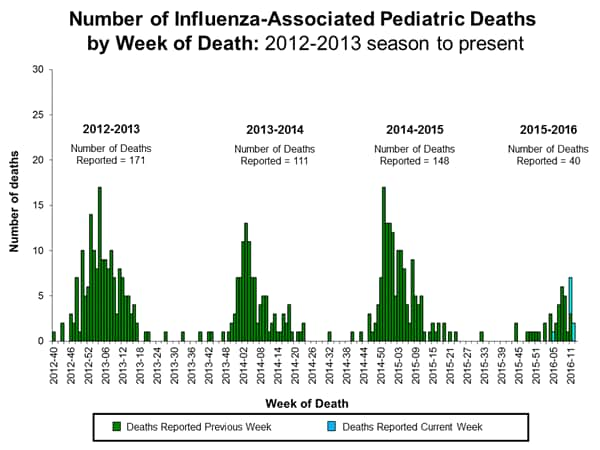
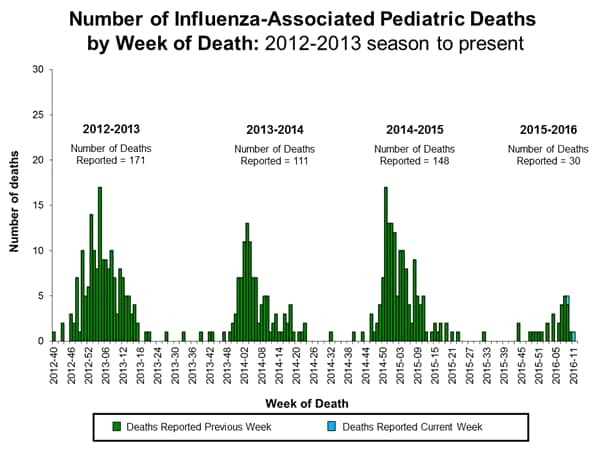
[h=2]Influenza-Associated Pediatric Mortality:[/h] Two influenza-associated pediatric deaths were reported to CDC during week 11. One death was associated with an influenza A (H3) virus and occurred during week 11 (the week ending March 19, 2016) and one death was associated with an influenza A (H1N1)pdm09 virus and occurred during week 9 (the week ending March 5, 2016).
A total of 30 influenza-associated pediatric deaths have been reported during the 2015-2016 season from Puerto Rico [1], Chicago [1], and 15 states (Arizona [3], California [5], Florida [4], Illinois [1], Indiana [2], Louisiana [1], Michigan [1], Minnesota [3], Mississippi [1], Nebraska [1], Nevada [2], New York [1], Tennessee [1], Texas [1], and Washington [1]).
Additional data can be found at: http://gis.cdc.gov/GRASP/Fluview/PedFluDeath.html.
View Interactive Application | View Full Screen | View PowerPoint Presentation
[h=2]Influenza-Associated Hospitalizations:[/h] The Influenza Hospitalization Surveillance Network (FluSurv-NET) conducts population-based surveillance for laboratory-confirmed influenza-related hospitalizations in children younger than 18 years of age (since the 2003-2004 influenza season) and adults (since the 2005-2006 influenza season).
The FluSurv-NET covers more than 70 counties in the 10 Emerging Infections Program (EIP) states (CA, CO, CT, GA, MD, MN, NM, NY, OR, and TN) and additional Influenza Hospitalization Surveillance Project (IHSP) states. The IHSP began during the 2009-2010 season to enhance surveillance during the 2009 H1N1 pandemic. IHSP sites included IA, ID, MI, OK and SD during the 2009-2010 season; ID, MI, OH, OK, RI, and UT during the 2010-2011 season; MI, OH, RI, and UT during the 2011-2012 season; IA, MI, OH, RI, and UT during the 2012-2013 season; and MI, OH, and UT during the 2013-2014, 2014-15 and 2015-16 seasons.
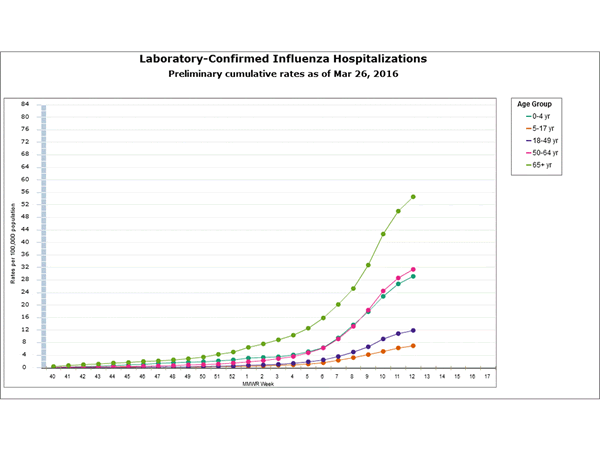
Data gathered are used to estimate age-specific hospitalization rates on a weekly basis, and describe characteristics of persons hospitalized with severe influenza illness. The rates provided are likely to be an underestimate as influenza-related hospitalizations can be missed, either because testing is not performed, or because cases may be attributed to other causes of pneumonia or other common influenza-related complications.
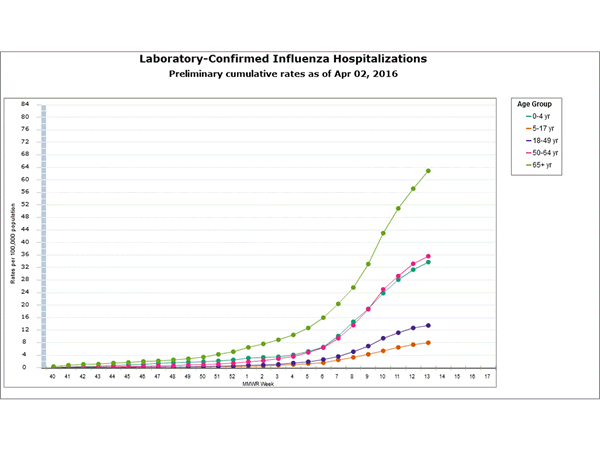
Between October 1, 2015 and March 19, 2016, 5,023 laboratory-confirmed influenza-associated hospitalizations were reported. The overall hospitalization rate was 18.2 per 100,000 population. The highest rate of hospitalization was among adults aged ≥65 years (46.1 per 100,000 population), followed adults aged 50-64 (26.9 per 100,000 population) and children aged 0-4 years (25.6 per 100,000 population). Among all hospitalizations, 4,007 (79.8%) were associated with influenza A, 966 (19.2%) with influenza B, 29 (0.6%) with influenza A and B co-infection, and 21 (0.4%) had no virus type information. Among those with influenza A subtype information, 1,146 (89.9%) were A(H1N1)pdm09 and 128 (10.1%) were A(H3N2) virus.
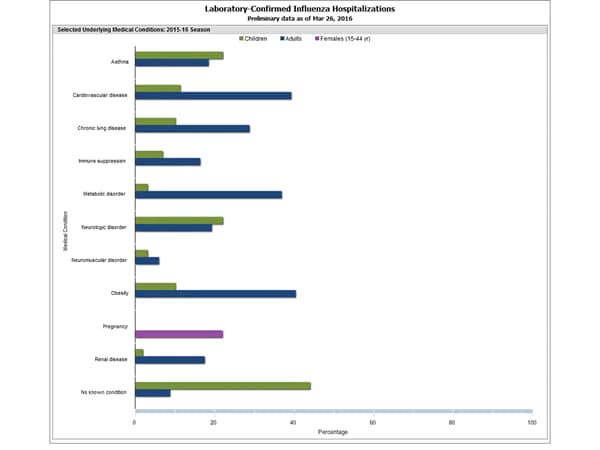
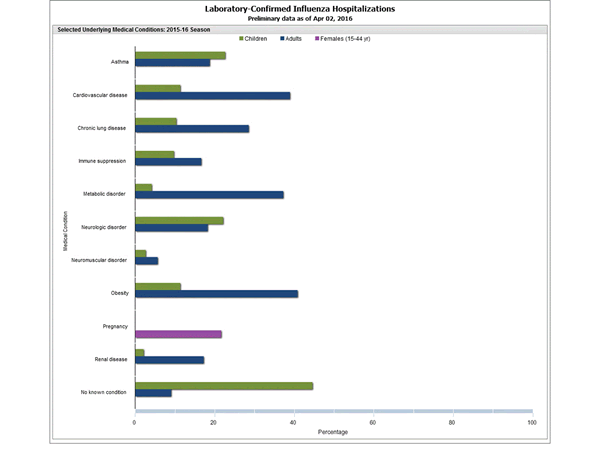
Clinical findings are preliminary and based on 945 (18.8%) cases with complete medical chart abstraction. The majority (91.3%) of hospitalized adults had at least one reported underlying medical condition; the most commonly reported were obesity, cardiovascular disease, metabolic disorders and chronic lung disease. There were 148 hospitalized children with complete medical chart abstraction; 85 (57.4%) had at least one underlying medical condition. The most commonly reported underlying medical conditions among pediatric patients were asthma and neurologic disorders. Among the 95 hospitalized women of childbearing age (15-44 years), 22 (23.2%) were pregnant.
Additional FluSurv-NET data can be found at: http://gis.cdc.gov/GRASP/Fluview/FluHospRates.html and http://gis.cdc.gov/grasp/fluview/FluHospChars.html.
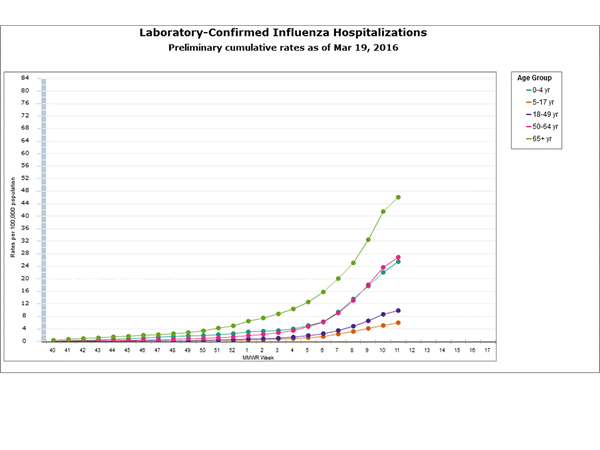
[SIZE=1.5]Data from the Influenza Hospitalization Surveillance Network (FluSurv-NET), a population-based surveillance for influenza related hospitalizations in children and adults in 13 U.S. states. Cumulative incidence rates are calculated using the National Center for Health Statistics’ (NCHS) population estimates for the counties included in the surveillance catchment area.[/SIZE]
View Interactive Application | View Full Screen | View PowerPoint Presentation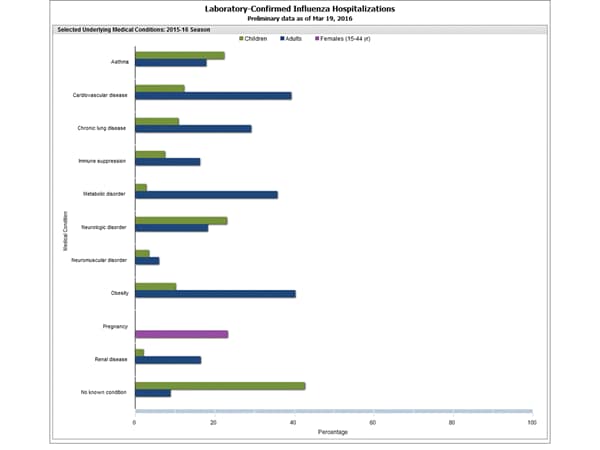
[SIZE=1.5]FluSurv-NET data are preliminary and displayed as they become available. Therefore, figures are based on varying denominators as some variables represent information that may require more time to be collected. Data are refreshed and updated weekly. Asthma includes a medical diagnosis of asthma or reactive airway disease; Cardiovascular diseases include conditions such as coronary heart disease, cardiac valve disorders, congestive heart failure, and pulmonary hypertension; does not include isolated hypertension; Chronic lung diseases include conditions such as chronic obstructive pulmonary disease, bronchiolitis obliterans, chronic aspiration pneumonia, and interstitial lung disease; Immune suppression includes conditions such as immunoglobulin deficiency, leukemia, lymphoma, HIV/AIDS, and individuals taking immunosuppressive medications; Metabolic disorders include conditions such as diabetes mellitus; Neurologic diseases include conditions such as seizure disorders, cerebral palsy, and cognitive dysfunction; Neuromuscular diseases include conditions such as multiple sclerosis and muscular dystrophy; Obesity was assigned if indicated in patient's medical chart or if body mass index (BMI) >30 kg/m2; Pregnancy percentage calculated using number of influenza-positive females aged between 15 and 44 years of age as the denominator; Renal diseases include conditions such as acute or chronic renal failure, nephrotic syndrome, glomerulonephritis, and impaired creatinine clearance; No known condition indicates that the person did not have any known high risk medical condition indicated in medical chart at the time of hospitalization.[/SIZE]
View Interactive Application | View Full Screen | View PowerPoint Presentation
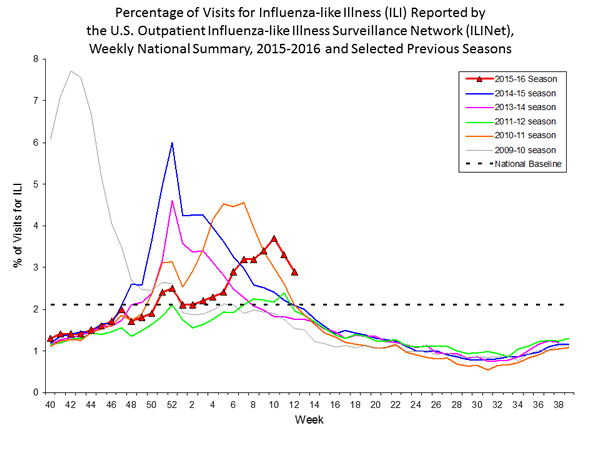
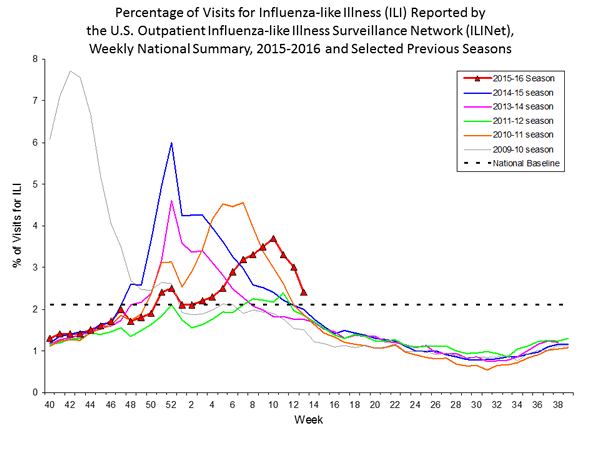
[h=2]Outpatient Illness Surveillance:[/h] Nationwide during week 11, 3.2% of patient visits reported through the U.S. Outpatient Influenza-like Illness Surveillance Network (ILINet) were due to influenza-like illness (ILI). This percentage is above the national baseline of 2.1%. (ILI is defined as fever (temperature of 100°F [37.8°C] or greater) and cough and/or sore throat.)
The increase in the percentage of patient visits for ILI in weeks 51 and 52 (the weeks ending December 26, 2015 and January 2, 2016) may be influenced in part by a reduction in routine healthcare visits during the holidays, as has occurred in previous seasons.
Additional data are available at http://gis.cdc.gov/grasp/fluview/fluportaldashboard.html.
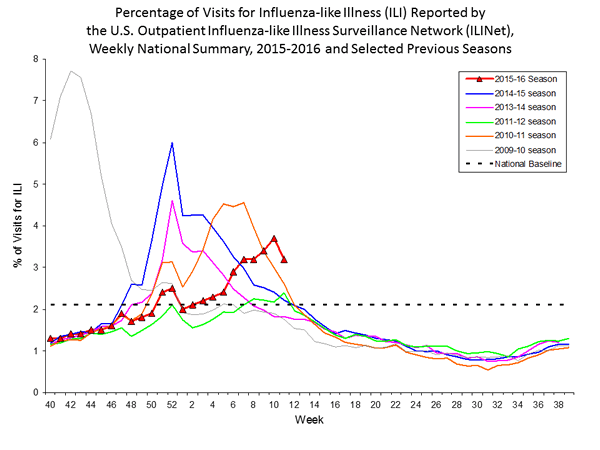
View National and Regional Level Graphs and Data | View Chart Data | View Full Screen | View PowerPoint Presentation On a regional level, the percentage of outpatient visits for ILI ranged from 1.5% to 5.1% during week 11. All 10 regions reported a proportion of outpatient visits for ILI at or above their region-specific baseline levels.
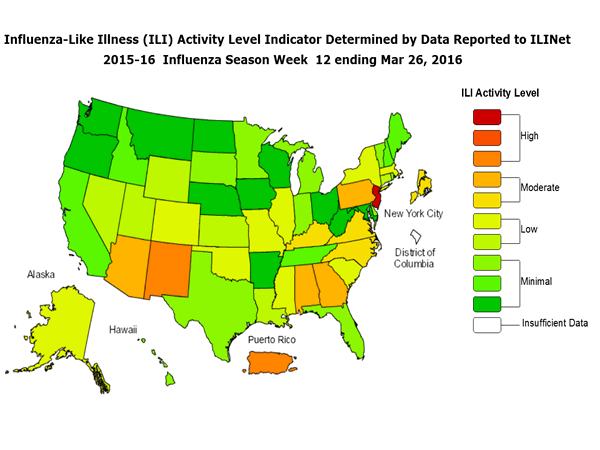
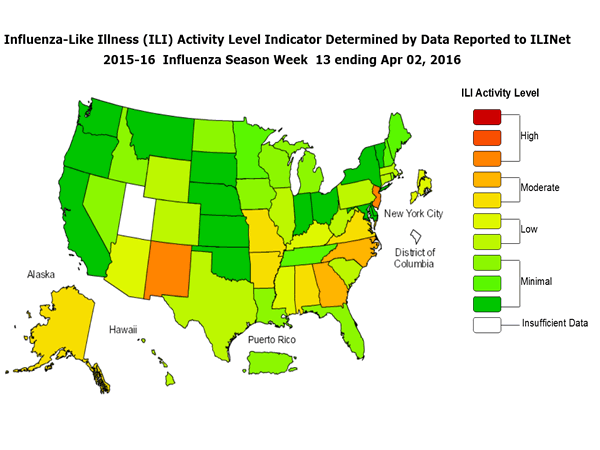
[h=2]ILINet State Activity Indicator Map:[/h] Data collected in ILINet are used to produce a measure of ILI activity* by state. Activity levels are based on the percent of outpatient visits in a state due to ILI and are compared to the average percent of ILI visits that occur during weeks with little or no influenza virus circulation. Activity levels range from minimal, which would correspond to ILI activity from outpatient clinics being below, or only slightly above, the average, to high, which would correspond to ILI activity from outpatient clinics being much higher than average.
During week 11, the following ILI activity levels were calculated:
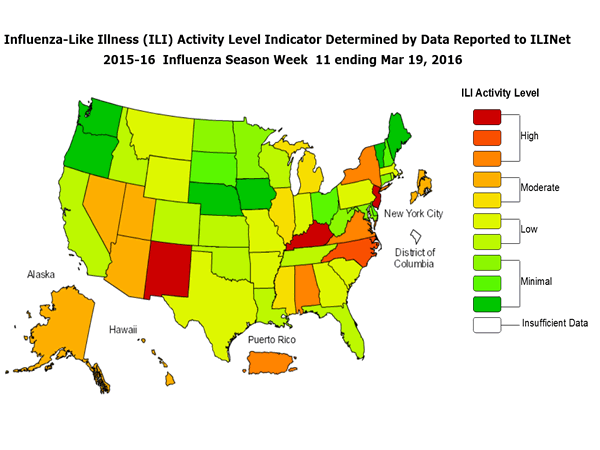
Data collected in ILINet may disproportionally represent certain populations within a state, and therefore, may not accurately depict the full picture of influenza activity for the whole state.
Data displayed in this map are based on data collected in ILINet, whereas the State and Territorial flu activity map is based on reports from state and territorial epidemiologists. The data presented in this map is preliminary and may change as more data are received.
Differences in the data presented here by CDC and independently by some state health departments likely represent differing levels of data completeness with data presented by the state likely being the more complete.
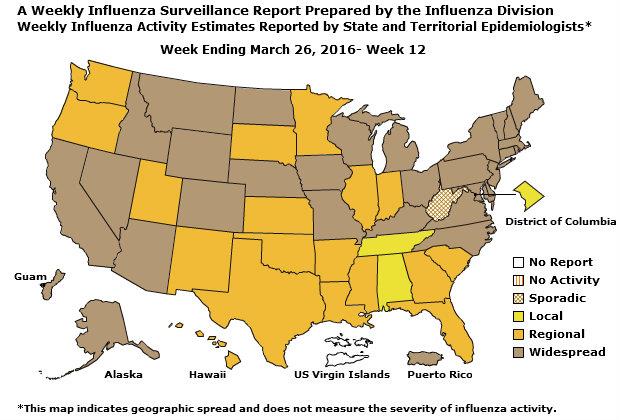
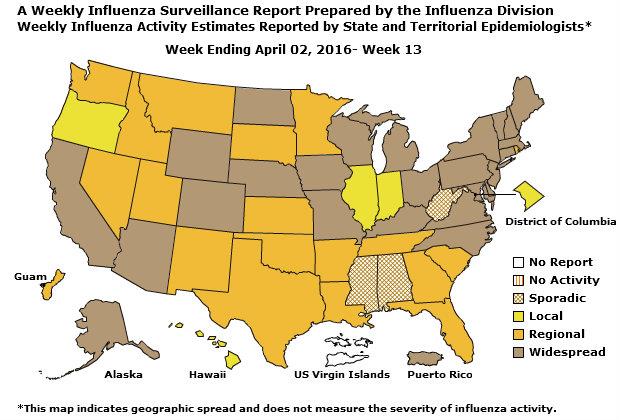
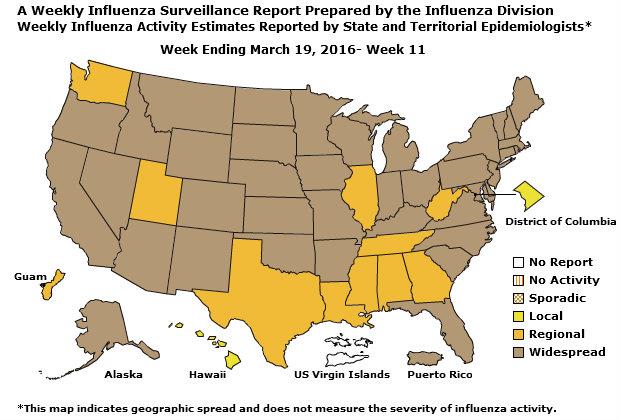
[h=2]Geographic Spread of Influenza as Assessed by State and Territorial Epidemiologists[/h] The influenza activity reported by state and territorial epidemiologists indicates geographic spread of influenza viruses, but does not measure the severity of influenza activity.
During week 11, the following influenza activity was reported:
[/FONT]
[FONT="] [/FONT]
[h=2]Additional National and International Influenza Surveillance Information[/h] [FONT="]FluView Interactive: FluView includes enhanced web-based interactive applications that can provide dynamic visuals of the influenza data collected and analyzed by CDC. These FluView Interactive applications allow people to create customized, visual interpretations of influenza data, as well as make comparisons across flu seasons, regions, age groups and a variety of other demographics. To access these tools, visit http://www.cdc.gov/flu/weekly/fluviewinteractive.htm.[/FONT]
[FONT="]U.S. State and local influenza surveillance: Click on a jurisdiction below to access the latest local influenza information.[/FONT]
[FONT="] [/FONT]
[TD="width: 139"] Alabama
[/TD]
[TD="width: 139"] Alaska
[/TD]
[TD="width: 139"] Arizona
[/TD]
[TD="width: 139"] Arkansas
[/TD]
[TD="width: 139"] California
[/TD]
[TD="width: 139"] Colorado
[/TD]
[TD="width: 139"] Connecticut
[/TD]
[TD="width: 139"] Delaware
[/TD]
[TD="width: 139"] District of Columbia
[/TD]
[TD="width: 139"] Florida
[/TD]
[TD="width: 139"] Georgia
[/TD]
[TD="width: 139"] Hawaii
[/TD]
[TD="width: 139"] Idaho
[/TD]
[TD="width: 139"] Illinois
[/TD]
[TD="width: 139"] Indiana
[/TD]
[TD="width: 139"] Iowa
[/TD]
[TD="width: 139"] Kansas
[/TD]
[TD="width: 139"] Kentucky
[/TD]
[TD="width: 139"] Louisiana
[/TD]
[TD="width: 139"] Maine
[/TD]
[TD="width: 139"] Maryland
[/TD]
[TD="width: 139"] Massachusetts
[/TD]
[TD="width: 139"] Michigan
[/TD]
[TD="width: 139"] Minnesota
[/TD]
[TD="width: 139"] Mississippi
[/TD]
[TD="width: 139"] Missouri
[/TD]
[TD="width: 139"] Montana
[/TD]
[TD="width: 139"] Nebraska
[/TD]
[TD="width: 139"] Nevada
[/TD]
[TD="width: 139"] New Hampshire
[/TD]
[TD="width: 139"] New Jersey
[/TD]
[TD="width: 139"] New Mexico
[/TD]
[TD="width: 139"] New York
[/TD]
[TD="width: 139"] North Carolina
[/TD]
[TD="width: 139"] North Dakota
[/TD]
[TD="width: 139"] Ohio
[/TD]
[TD="width: 139"] Oklahoma
[/TD]
[TD="width: 139"] Oregon
[/TD]
[TD="width: 139"] Pennsylvania
[/TD]
[TD="width: 139"] Rhode Island
[/TD]
[TD="width: 139"] South Carolina
[/TD]
[TD="width: 139"] South Dakota
[/TD]
[TD="width: 139"] Tennessee
[/TD]
[TD="width: 139"] Texas
[/TD]
[TD="width: 139"] Utah
[/TD]
[TD="width: 139"] Vermont
[/TD]
[TD="width: 139"] Virginia
[/TD]
[TD="width: 139"] Washington
[/TD]
[TD="width: 139"] West Virginia
[/TD]
[TD="width: 139"] Wisconsin
[/TD]
[TD="width: 139"] Wyoming
[/TD]
[TD="width: 139"] New York City
[/TD]
[TD="width: 139"] Virgin Islands
[/TD]
[TD="width: 139"] Puerto Rico
[/TD]
[TD="width: 139"] [/TD]
[FONT="]World Health Organization: Additional influenza surveillance information from participating WHO member nations is available through FluNet and the Global Epidemiology Reports.[/FONT]
[FONT="]WHO Collaborating Centers for Influenza located in Australia, China, Japan, the United Kingdom, and the United States (CDC in Atlanta, Georgia).[/FONT]
[FONT="]Europe: For the most recent influenza surveillance information from Europe, please see WHO/Europe and the European Centre for Disease Prevention and Control at http://www.flunewseurope.org/[/FONT]
[FONT="]Public Health Agency of Canada: The most up-to-date influenza information from Canada is available at http://www.phac-aspc.gc.ca/fluwatch/[/FONT]
[FONT="]Public Health England: The most up-to-date influenza information from the United Kingdom is available at https://www.gov.uk/government/statistics/weekly-national-flu-reports[/FONT]
[FONT="] [/FONT]
[FONT="] [/FONT]
Any links provided to non-Federal organizations are provided solely as a service to our users. These links do not constitute an endorsement of these organizations or their programs by CDC or the Federal Government, and none should be inferred. CDC is not responsible for the content of the individual organization web pages found at these links. [FONT="] [/FONT]
[FONT="]An overview of the CDC influenza surveillance system, including methodology and detailed descriptions of each data component, is available at: http://www.cdc.gov/flu/weekly/overview.htm.
[/FONT]
http://www.cdc.gov/flu/weekly/weeklyarchives2015-2016/Week11.htm
[h=3]Synopsis:[/h] During week 11 (March 13-19, 2016), influenza activity decreased slightly, but remained elevated in the United States.
- Viral Surveillance: The most frequently identified influenza virus type reported by public health laboratories during week 11 was influenza A, with influenza A (H1N1)pdm09 viruses predominating. The percentage of respiratory specimens testing positive for influenza in clinical laboratories decreased.
- Pneumonia and Influenza Mortality: The proportion of deaths attributed to pneumonia and influenza (P&I) was below the system-specific epidemic threshold in the NCHS Mortality Surveillance System and above the system-specific epidemic threshold in the 122 Cities Mortality Reporting System.
- Influenza-associated Pediatric Deaths: Two influenza-associated pediatric deaths were reported.
- Influenza-associated Hospitalizations: A cumulative rate for the season of 18.2 laboratory-confirmed influenza-associated hospitalizations per 100,000 population was reported.
- Outpatient Illness Surveillance: The proportion of outpatient visits for influenza-like illness (ILI) was 3.2%, which is above the national baseline of 2.1%. All 10 regions reported ILI at or above region-specific baseline levels. Puerto Rico and seven states experienced high ILI activity; New York City and eight states experienced moderate ILI activity; 20 states experienced low ILI activity; 15 states experienced minimal ILI activity; and the District of Columbia had insufficient data.
- Geographic Spread of Influenza: The geographic spread of influenza in Puerto Rico and 39 states was reported as widespread; Guam and 10 states reported regional activity; the District of Columbia and one state reported local activity; and the U.S. Virgin Islands did not report.
[TABLE="class: table table-bordered opt-in"]
[TR]
HHS Surveillance Regions* Data for current week Data cumulative since October 4, 2015 (week 40) [/TR]
[TR]
Out-patient ILI[SUP]?[/SUP] Number of jurisdictions experiencing high or moderate ILI activity[SUP]?[/SUP] % respiratory specimens positive for flu in clinical laboratories[SUP]?[/SUP] A(H1N1)pdm09 A (H3) A (Subtyping not Performed) B Victoria lineage B Yamagata lineage B lineage not performed Pediatric Deaths [/TR]
[TR]
Influenza test results from public health laboratories only [/TR]
[TR]
Nation [TD]Elevated[/TD]
[TD]17 of 53[/TD]
[TD]20.1%[/TD]
[TD]9,748[/TD]
[TD]2,211[/TD]
[TD]234[/TD]
[TD]676[/TD]
[TD]1,726[/TD]
[TD]1,580[/TD]
[TD]30[/TD]
[/TR]
[TR]
Region 1 [TD]Elevated[/TD]
[TD]0 of 6[/TD]
[TD]23.7%[/TD]
[TD]408[/TD]
[TD]40[/TD]
[TD]3[/TD]
[TD]43[/TD]
[TD]20[/TD]
[TD]62[/TD]
[TD]0[/TD]
[/TR]
[TR]
Region 2 [TD]Elevated[/TD]
[TD]4 of 4[/TD]
[TD]29.6%[/TD]
[TD]697[/TD]
[TD]142[/TD]
[TD]5[/TD]
[TD]55[/TD]
[TD]17[/TD]
[TD]61[/TD]
[TD]2[/TD]
[/TR]
[TR]
Region 3 [TD]Elevated[/TD]
[TD]1 of 6[/TD]
[TD]20.0%[/TD]
[TD]1,504[/TD]
[TD]82[/TD]
[TD]28[/TD]
[TD]103[/TD]
[TD]131[/TD]
[TD]58[/TD]
[TD]0[/TD]
[/TR]
[TR]
Region 4 [TD]Elevated[/TD]
[TD]4 of 8[/TD]
[TD]20.7%[/TD]
[TD]832[/TD]
[TD]188[/TD]
[TD]35[/TD]
[TD]32[/TD]
[TD]23[/TD]
[TD]239[/TD]
[TD]6[/TD]
[/TR]
[TR]
Region 5 [TD]Elevated[/TD]
[TD]2 of 6[/TD]
[TD]23.2%[/TD]
[TD]1,857[/TD]
[TD]181[/TD]
[TD]60[/TD]
[TD]73[/TD]
[TD]113[/TD]
[TD]25[/TD]
[TD]8[/TD]
[/TR]
[TR]
Region 6 [TD]Elevated[/TD]
[TD]1 of 5[/TD]
[TD]17.7%[/TD]
[TD]301[/TD]
[TD]232[/TD]
[TD]40[/TD]
[TD]27[/TD]
[TD]35[/TD]
[TD]136[/TD]
[TD]2[/TD]
[/TR]
[TR]
Region 7 [TD]Elevated[/TD]
[TD]0 of 4[/TD]
[TD]11.0%[/TD]
[TD]338[/TD]
[TD]46[/TD]
[TD]10[/TD]
[TD]20[/TD]
[TD]70[/TD]
[TD]15[/TD]
[TD]1[/TD]
[/TR]
[TR]
Region 8 [TD]Elevated[/TD]
[TD]1 of 6[/TD]
[TD]20.6%[/TD]
[TD]1,379[/TD]
[TD]223[/TD]
[TD]4[/TD]
[TD]64[/TD]
[TD]377[/TD]
[TD]58[/TD]
[TD]0[/TD]
[/TR]
[TR]
Region 9 [TD]Elevated[/TD]
[TD]3 of 4[/TD]
[TD]19.3%[/TD]
[TD]1,772[/TD]
[TD]965[/TD]
[TD]41[/TD]
[TD]209[/TD]
[TD]624[/TD]
[TD]681[/TD]
[TD]10[/TD]
[/TR]
[TR]
Region 10 [TD]Elevated[/TD]
[TD]1 of 4[/TD]
[TD]22.2%[/TD]
[TD]660[/TD]
[TD]112[/TD]
[TD]8[/TD]
[TD]50[/TD]
[TD]316[/TD]
[TD]245[/TD]
[TD]1[/TD]
[/TR]
[/TABLE]
*HHS regions (Region 1 CT, ME, MA, NH, RI, VT; Region 2: NJ, NY, Puerto Rico, US Virgin Islands; Region 3: DE, DC, MD, PA, VA, WV; Region 4: AL, FL, GA, KY, MS, NC, SC, TN; Region 5: IL, IN, MI, MN, OH, WI; Region 6: AR, LA, NM, OK, TX; Region 7: IA, KS, MO, NE; Region 8: CO, MT, ND, SD, UT, WY; Region 9: AZ, CA, Guam, HI, NV; and Region 10: AK, ID, OR, WA). [TR]
HHS Surveillance Regions* Data for current week Data cumulative since October 4, 2015 (week 40) [/TR]
[TR]
Out-patient ILI[SUP]?[/SUP] Number of jurisdictions experiencing high or moderate ILI activity[SUP]?[/SUP] % respiratory specimens positive for flu in clinical laboratories[SUP]?[/SUP] A(H1N1)pdm09 A (H3) A (Subtyping not Performed) B Victoria lineage B Yamagata lineage B lineage not performed Pediatric Deaths [/TR]
[TR]
Influenza test results from public health laboratories only [/TR]
[TR]
Nation [TD]Elevated[/TD]
[TD]17 of 53[/TD]
[TD]20.1%[/TD]
[TD]9,748[/TD]
[TD]2,211[/TD]
[TD]234[/TD]
[TD]676[/TD]
[TD]1,726[/TD]
[TD]1,580[/TD]
[TD]30[/TD]
[/TR]
[TR]
Region 1 [TD]Elevated[/TD]
[TD]0 of 6[/TD]
[TD]23.7%[/TD]
[TD]408[/TD]
[TD]40[/TD]
[TD]3[/TD]
[TD]43[/TD]
[TD]20[/TD]
[TD]62[/TD]
[TD]0[/TD]
[/TR]
[TR]
Region 2 [TD]Elevated[/TD]
[TD]4 of 4[/TD]
[TD]29.6%[/TD]
[TD]697[/TD]
[TD]142[/TD]
[TD]5[/TD]
[TD]55[/TD]
[TD]17[/TD]
[TD]61[/TD]
[TD]2[/TD]
[/TR]
[TR]
Region 3 [TD]Elevated[/TD]
[TD]1 of 6[/TD]
[TD]20.0%[/TD]
[TD]1,504[/TD]
[TD]82[/TD]
[TD]28[/TD]
[TD]103[/TD]
[TD]131[/TD]
[TD]58[/TD]
[TD]0[/TD]
[/TR]
[TR]
Region 4 [TD]Elevated[/TD]
[TD]4 of 8[/TD]
[TD]20.7%[/TD]
[TD]832[/TD]
[TD]188[/TD]
[TD]35[/TD]
[TD]32[/TD]
[TD]23[/TD]
[TD]239[/TD]
[TD]6[/TD]
[/TR]
[TR]
Region 5 [TD]Elevated[/TD]
[TD]2 of 6[/TD]
[TD]23.2%[/TD]
[TD]1,857[/TD]
[TD]181[/TD]
[TD]60[/TD]
[TD]73[/TD]
[TD]113[/TD]
[TD]25[/TD]
[TD]8[/TD]
[/TR]
[TR]
Region 6 [TD]Elevated[/TD]
[TD]1 of 5[/TD]
[TD]17.7%[/TD]
[TD]301[/TD]
[TD]232[/TD]
[TD]40[/TD]
[TD]27[/TD]
[TD]35[/TD]
[TD]136[/TD]
[TD]2[/TD]
[/TR]
[TR]
Region 7 [TD]Elevated[/TD]
[TD]0 of 4[/TD]
[TD]11.0%[/TD]
[TD]338[/TD]
[TD]46[/TD]
[TD]10[/TD]
[TD]20[/TD]
[TD]70[/TD]
[TD]15[/TD]
[TD]1[/TD]
[/TR]
[TR]
Region 8 [TD]Elevated[/TD]
[TD]1 of 6[/TD]
[TD]20.6%[/TD]
[TD]1,379[/TD]
[TD]223[/TD]
[TD]4[/TD]
[TD]64[/TD]
[TD]377[/TD]
[TD]58[/TD]
[TD]0[/TD]
[/TR]
[TR]
Region 9 [TD]Elevated[/TD]
[TD]3 of 4[/TD]
[TD]19.3%[/TD]
[TD]1,772[/TD]
[TD]965[/TD]
[TD]41[/TD]
[TD]209[/TD]
[TD]624[/TD]
[TD]681[/TD]
[TD]10[/TD]
[/TR]
[TR]
Region 10 [TD]Elevated[/TD]
[TD]1 of 4[/TD]
[TD]22.2%[/TD]
[TD]660[/TD]
[TD]112[/TD]
[TD]8[/TD]
[TD]50[/TD]
[TD]316[/TD]
[TD]245[/TD]
[TD]1[/TD]
[/TR]
[/TABLE]
? Elevated means the % of visits for ILI is at or above the national or region-specific baseline
§ Includes all 50 states, New York City, the District of Columbia and Puerto Rico
? National data are for current week; regional data are for the most recent three weeks
[h=2]U.S. Virologic Surveillance:[/h] WHO and NREVSS collaborating laboratories, which include both public health and clinical laboratories located in all 50 states, Puerto Rico, and the District of Columbia, report to CDC the total number of respiratory specimens tested for influenza and the number positive for influenza by virus type. In addition, public health laboratories also report the influenza A subtype (H1 or H3) and influenza B lineage information of the viruses they test and the age or age group of the persons from whom the specimens were collected.
Additional data are available at http://gis.cdc.gov/grasp/fluview/fluportaldashboard.html.
The results of tests performed by clinical laboratories during the current week are summarized below.
[TABLE="class: table table-bordered table-condensed opt-in"]
[TR]
[TD="width: 200"] [/TD]
Week 11 Data Cumulative since
October 4, 2015 (Week 40) [/TR]
[TR]
No. of specimens tested [TD]23,946[/TD]
[TD]448,331[/TD]
[/TR]
[TR]
No. of positive specimens (%) [TD]4,816 (20.1%)[/TD]
[TD]39,486 (8.8%)[/TD]
[/TR]
[TR]
Positive specimens by type [TD] [/TD]
[TD] [/TD]
[/TR]
[TR]
Influenza A [TD]3,557 (73.9%)[/TD]
[TD]29,354 (74.3%)[/TD]
[/TR]
[TR]
Influenza B [TD]1,259 (26.1%)[/TD]
[TD]10,132 (25.7%)[/TD]
[/TR]
[/TABLE]
View National and Regional Level Graphs and Data | View Chart Data | View Full Screen | View PowerPoint Presentation The results of tests performed by public health laboratories, as well as the age group distribution of influenza positive tests, during the current week are summarized below.
[TABLE="class: table table-bordered table-condensed opt-in"]
[TR]
[TD="width: 228"] [/TD]
Week 11 Data Cumulative since October 4, 2015 (Week 40) [/TR]
[TR]
No. of specimens tested [TD]1,848[/TD]
[TD]48,156[/TD]
[/TR]
[TR]
No. of positive specimens* [TD]1,086[/TD]
[TD]16,175[/TD]
[/TR]
[TR]
Positive specimens by type/subtype [TD] [/TD]
[TD] [/TD]
[/TR]
[TR]
Influenza A [TD]839 (77.3%)[/TD]
[TD]12,193 (75.4%)[/TD]
[/TR]
[TR]
A(H1N1)pdm09 [TD]739 (88.1%)[/TD]
[TD]9,748 (79.9%)[/TD]
[/TR]
[TR]
H3 [TD]85 (10.1%)[/TD]
[TD]2,211 (18.1%)[/TD]
[/TR]
[TR]
Subtyping not performed [TD]15 (1.8%)[/TD]
[TD]234 (1.9%)[/TD]
[/TR]
[TR]
Influenza B [TD]247 (22.7%)[/TD]
[TD]3,982 (24.6%)[/TD]
[/TR]
[TR]
Yamagata lineage [TD]78 (31.6%)[/TD]
[TD]1,726 (43.3%)[/TD]
[/TR]
[TR]
Victoria lineage [TD]56 (22.7%)[/TD]
[TD]676 (17.0%)[/TD]
[/TR]
[TR]
Lineage not performed [TD]113 (45.7%)[/TD]
[TD]1,580 (39.7%)[/TD]
[/TR]
[/TABLE]
*The percent of specimens testing positive for influenza is not reported because public health laboratories often receive samples that have already tested positive for influenza at a clinical laboratory and therefore percent positive would not be a valid indicator of influenza activity. Additional information is available at http://www.cdc.gov/flu/weekly/overview.htm.
View National and Regional Level Graphs and Data | View Chart Data | View Full Screen | View PowerPoint Presentation
View Chart Data | View Full Screen
View Chart Data |View Full Screen [h=2]Influenza Virus Characterization:[/h] CDC characterizes influenza viruses through one or more tests including genome sequencing, hemagglutination inhibition (HI) and/or neutralization assays. These data are used to compare how similar currently circulating influenza viruses are to the reference viruses used for developing influenza vaccines, and to monitor for changes in circulating influenza viruses. Historically, HI data have been used most commonly to assess the similarity between reference viruses and circulating viruses to suggest how well the vaccine may work until such time as vaccine effectiveness estimates are available. During the 2014–2015 season and to date, however, a portion of influenza A (H3N2) viruses do not yield sufficient hemagglutination titers for antigenic characterization by HI. For many of these viruses, CDC performs genetic characterization to determine the genetic group identity of those viruses. In this way, antigenic properties of these viruses can be inferred from viruses within the same genetic group that have been characterized antigenically.
CDC has characterized 1,229 influenza viruses [507 A (H1N1)pdm09, 324 A (H3N2), and 398 influenza B viruses] collected by U.S. laboratories since October 1, 2015.
Influenza A Virus [831]
- A (H1N1)pdm09 [507]: All 507 (100%) influenza A (H1N1)pdm09 viruses were antigenically characterized as A/California/7/2009-like, the influenza A (H1N1) component of the 2015-2016 Northern Hemisphere vaccine.
- A (H3N2) [324]: All 324 influenza A (H3N2) viruses were genetically sequenced and all viruses belonged to genetic groups for which a majority of viruses antigenically characterized were similar to the cell-propagated A/Switzerland/9715293/2013, the influenza A (H3N2) reference virus representing the 2015-2016 Northern Hemisphere vaccine component.
- A subset of 139 influenza A (H3N2) viruses also were antigenically characterized; 131 of 139 (94.2%) H3N2 viruses were A/Switzerland/9715293/2013-like by HI testing or neutralization testing.
- Yamagata Lineage [239]: All 239 (100%) influenza B/Yamagata-lineage viruses were antigenically characterized as B/Phuket/3073/2013-like, which is included as an influenza B component of the 2015-2016 Northern Hemisphere trivalent and quadrivalent influenza vaccines.
- Victoria Lineage [159]: 155 of 159 (97.5%) influenza B/Victoria-lineage viruses were antigenically characterized as B/Brisbane/60/2008-like, which is included as an influenza B component of the 2015-2016 Northern Hemisphere quadrivalent influenza vaccines.
High levels of resistance to the adamantanes (amantadine and rimantadine) persist among influenza A(H1N1)pdm09 and influenza A (H3N2) viruses (the adamantanes are not effective against influenza B viruses). Therefore, data from adamantane resistance testing are not presented below.
[TABLE="class: table, align: center, border: 0, cellpadding: 3, cellspacing: 0"]
[h=3]Neuraminidase Inhibitor Resistance Testing Results on Samples Collected Since October 1, 2015[/h] [/TABLE]
[TABLE="class: table table-bordered opt-in"]
[TR]
[TD] [/TD]
Oseltamivir
Zanamivir
Peramivir
[/TR]
[TR]
[TD] [/TD]
Virus Samples tested
Resistant Viruses, Number (%)
Virus Samples tested
Resistant Viruses, Number (%)
Virus Samples tested
Resistant Viruses, Number (%)
[/TR]
[TR]
Influenza A(H1N1)pdm09
[TD] 922
[/TD]
[TD] 5 (0.5)
[/TD]
[TD] 501
[/TD]
[TD] 0 (0.0)
[/TD]
[TD] 922
[/TD]
[TD] 5 (0.5)
[/TD]
[/TR]
[TR]
Influenza A (H3N2)
[TD] 387
[/TD]
[TD] 0 (0.0)
[/TD]
[TD] 387
[/TD]
[TD] 0 (0.0)
[/TD]
[TD] 358
[/TD]
[TD] 0 (0.0)
[/TD]
[/TR]
[TR]
Influenza B
[TD] 463
[/TD]
[TD] 0 (0.0)
[/TD]
[TD] 463
[/TD]
[TD] 0 (0.0)
[/TD]
[TD] 463
[/TD]
[TD] 0 (0.0)
[/TD]
[/TR]
[/TABLE]
The majority of recently circulating influenza viruses are susceptible to the neuraminidase inhibitor antiviral medications, oseltamivir, zanamivir, and peramivir; however, rare sporadic instances of oseltamivir-resistant and peramivir-resistant influenza A (H1N1)pdm09 viruses and oseltamivir-resistant influenza A (H3N2) viruses have been detected worldwide. Antiviral treatment as early as possible is recommended for patients with confirmed or suspected influenza who have severe, complicated, or progressive illness; who require hospitalization; or who are at high risk. for serious influenza-related complications. Additional information on recommendations for treatment and chemoprophylaxis of influenza virus infection with antiviral agents is available athttp://www.cdc.gov/flu/antivirals/index.htm.
[h=2]Pneumonia and Influenza (P&I) Mortality Surveillance:[/h] Rapid tracking of pneumonia and influenza-associated deaths is done through two systems, the National Center for Health Statistics (NCHS) Mortality Surveillance System and the 122 Cities Mortality Reporting System. NCHS mortality surveillance data are presented by the week the death occurred and P&I percentages are released two weeks after the week of death to allow for collection of enough data to produce a stable P&I percentage. Users of the data should not expect the two systems to produce the same percentages, and the percent P&I deaths from each system should be compared to the corresponding system-specific baselines and thresholds.
NCHS Mortality Surveillance Data:
Based on NCHS mortality surveillance data available on March 24, 2016, 7.4% of the deaths occurring during the week ending March 5, 2016 (week 9) were due to P&I. This percentage is below the epidemic threshold of 7.7% for week 9.
Region and state-specific data are available at http://www.cdc.gov/flu/weekly/nchs.htm.
View Regional and State Level Data | View Chart Data | View Full Screen | View PowerPoint Presentation 122 Cities Mortality Reporting System:
During week 11, 7.3% of all deaths reported through the 122 Cities Mortality Reporting System were due to P&I. This percentage was above the epidemic threshold of 7.2% for week 11.
View Full Screen | View PowerPoint Presentation
[h=2]Influenza-Associated Pediatric Mortality:[/h] Two influenza-associated pediatric deaths were reported to CDC during week 11. One death was associated with an influenza A (H3) virus and occurred during week 11 (the week ending March 19, 2016) and one death was associated with an influenza A (H1N1)pdm09 virus and occurred during week 9 (the week ending March 5, 2016).
A total of 30 influenza-associated pediatric deaths have been reported during the 2015-2016 season from Puerto Rico [1], Chicago [1], and 15 states (Arizona [3], California [5], Florida [4], Illinois [1], Indiana [2], Louisiana [1], Michigan [1], Minnesota [3], Mississippi [1], Nebraska [1], Nevada [2], New York [1], Tennessee [1], Texas [1], and Washington [1]).
Additional data can be found at: http://gis.cdc.gov/GRASP/Fluview/PedFluDeath.html.
View Interactive Application | View Full Screen | View PowerPoint Presentation
[h=2]Influenza-Associated Hospitalizations:[/h] The Influenza Hospitalization Surveillance Network (FluSurv-NET) conducts population-based surveillance for laboratory-confirmed influenza-related hospitalizations in children younger than 18 years of age (since the 2003-2004 influenza season) and adults (since the 2005-2006 influenza season).
The FluSurv-NET covers more than 70 counties in the 10 Emerging Infections Program (EIP) states (CA, CO, CT, GA, MD, MN, NM, NY, OR, and TN) and additional Influenza Hospitalization Surveillance Project (IHSP) states. The IHSP began during the 2009-2010 season to enhance surveillance during the 2009 H1N1 pandemic. IHSP sites included IA, ID, MI, OK and SD during the 2009-2010 season; ID, MI, OH, OK, RI, and UT during the 2010-2011 season; MI, OH, RI, and UT during the 2011-2012 season; IA, MI, OH, RI, and UT during the 2012-2013 season; and MI, OH, and UT during the 2013-2014, 2014-15 and 2015-16 seasons.
Data gathered are used to estimate age-specific hospitalization rates on a weekly basis, and describe characteristics of persons hospitalized with severe influenza illness. The rates provided are likely to be an underestimate as influenza-related hospitalizations can be missed, either because testing is not performed, or because cases may be attributed to other causes of pneumonia or other common influenza-related complications.
Between October 1, 2015 and March 19, 2016, 5,023 laboratory-confirmed influenza-associated hospitalizations were reported. The overall hospitalization rate was 18.2 per 100,000 population. The highest rate of hospitalization was among adults aged ≥65 years (46.1 per 100,000 population), followed adults aged 50-64 (26.9 per 100,000 population) and children aged 0-4 years (25.6 per 100,000 population). Among all hospitalizations, 4,007 (79.8%) were associated with influenza A, 966 (19.2%) with influenza B, 29 (0.6%) with influenza A and B co-infection, and 21 (0.4%) had no virus type information. Among those with influenza A subtype information, 1,146 (89.9%) were A(H1N1)pdm09 and 128 (10.1%) were A(H3N2) virus.
Clinical findings are preliminary and based on 945 (18.8%) cases with complete medical chart abstraction. The majority (91.3%) of hospitalized adults had at least one reported underlying medical condition; the most commonly reported were obesity, cardiovascular disease, metabolic disorders and chronic lung disease. There were 148 hospitalized children with complete medical chart abstraction; 85 (57.4%) had at least one underlying medical condition. The most commonly reported underlying medical conditions among pediatric patients were asthma and neurologic disorders. Among the 95 hospitalized women of childbearing age (15-44 years), 22 (23.2%) were pregnant.
Additional FluSurv-NET data can be found at: http://gis.cdc.gov/GRASP/Fluview/FluHospRates.html and http://gis.cdc.gov/grasp/fluview/FluHospChars.html.
[SIZE=1.5]Data from the Influenza Hospitalization Surveillance Network (FluSurv-NET), a population-based surveillance for influenza related hospitalizations in children and adults in 13 U.S. states. Cumulative incidence rates are calculated using the National Center for Health Statistics’ (NCHS) population estimates for the counties included in the surveillance catchment area.[/SIZE]
View Interactive Application | View Full Screen | View PowerPoint Presentation
[SIZE=1.5]FluSurv-NET data are preliminary and displayed as they become available. Therefore, figures are based on varying denominators as some variables represent information that may require more time to be collected. Data are refreshed and updated weekly. Asthma includes a medical diagnosis of asthma or reactive airway disease; Cardiovascular diseases include conditions such as coronary heart disease, cardiac valve disorders, congestive heart failure, and pulmonary hypertension; does not include isolated hypertension; Chronic lung diseases include conditions such as chronic obstructive pulmonary disease, bronchiolitis obliterans, chronic aspiration pneumonia, and interstitial lung disease; Immune suppression includes conditions such as immunoglobulin deficiency, leukemia, lymphoma, HIV/AIDS, and individuals taking immunosuppressive medications; Metabolic disorders include conditions such as diabetes mellitus; Neurologic diseases include conditions such as seizure disorders, cerebral palsy, and cognitive dysfunction; Neuromuscular diseases include conditions such as multiple sclerosis and muscular dystrophy; Obesity was assigned if indicated in patient's medical chart or if body mass index (BMI) >30 kg/m2; Pregnancy percentage calculated using number of influenza-positive females aged between 15 and 44 years of age as the denominator; Renal diseases include conditions such as acute or chronic renal failure, nephrotic syndrome, glomerulonephritis, and impaired creatinine clearance; No known condition indicates that the person did not have any known high risk medical condition indicated in medical chart at the time of hospitalization.[/SIZE]
View Interactive Application | View Full Screen | View PowerPoint Presentation
[h=2]Outpatient Illness Surveillance:[/h] Nationwide during week 11, 3.2% of patient visits reported through the U.S. Outpatient Influenza-like Illness Surveillance Network (ILINet) were due to influenza-like illness (ILI). This percentage is above the national baseline of 2.1%. (ILI is defined as fever (temperature of 100°F [37.8°C] or greater) and cough and/or sore throat.)
The increase in the percentage of patient visits for ILI in weeks 51 and 52 (the weeks ending December 26, 2015 and January 2, 2016) may be influenced in part by a reduction in routine healthcare visits during the holidays, as has occurred in previous seasons.
Additional data are available at http://gis.cdc.gov/grasp/fluview/fluportaldashboard.html.
View National and Regional Level Graphs and Data | View Chart Data | View Full Screen | View PowerPoint Presentation On a regional level, the percentage of outpatient visits for ILI ranged from 1.5% to 5.1% during week 11. All 10 regions reported a proportion of outpatient visits for ILI at or above their region-specific baseline levels.
[h=2]ILINet State Activity Indicator Map:[/h] Data collected in ILINet are used to produce a measure of ILI activity* by state. Activity levels are based on the percent of outpatient visits in a state due to ILI and are compared to the average percent of ILI visits that occur during weeks with little or no influenza virus circulation. Activity levels range from minimal, which would correspond to ILI activity from outpatient clinics being below, or only slightly above, the average, to high, which would correspond to ILI activity from outpatient clinics being much higher than average.
During week 11, the following ILI activity levels were calculated:
- Puerto Rico and seven states (Alabama, Kentucky, New Jersey, New Mexico, New York, North Carolina, and Virginia) experienced high ILI activity.
- New York City and eight states (Alaska, Arizona, Hawaii, Illinois, Michigan, Mississippi, Nevada, and Utah) experienced moderate ILI activity.
- 20 states (Arkansas, California, Colorado, Florida, Georgia, Idaho, Indiana, Kansas, Louisiana, Massachusetts, Missouri, Montana, Oklahoma, Pennsylvania, Rhode Island, South Carolina, Tennessee, Texas, Wisconsin, and Wyoming) experienced low ILI activity.
- 15 states (Connecticut, Delaware, Iowa, Maine, Maryland, Minnesota, Nebraska, New Hampshire, North Dakota, Ohio, Oregon, South Dakota, Vermont, Washington, and West Virginia) experienced minimal ILI activity.
- Data were insufficient to calculate an ILI activity level from the District of Columbia.
Click on map to launch interactive tool
*This map uses the proportion of outpatient visits to health care providers for ILI to measure the ILI activity level within a state. It does not, however, measure the extent of geographic spread of flu within a state. Therefore, outbreaks occurring in a single city could cause the state to display high activity levels.Data collected in ILINet may disproportionally represent certain populations within a state, and therefore, may not accurately depict the full picture of influenza activity for the whole state.
Data displayed in this map are based on data collected in ILINet, whereas the State and Territorial flu activity map is based on reports from state and territorial epidemiologists. The data presented in this map is preliminary and may change as more data are received.
Differences in the data presented here by CDC and independently by some state health departments likely represent differing levels of data completeness with data presented by the state likely being the more complete.
[h=2]Geographic Spread of Influenza as Assessed by State and Territorial Epidemiologists[/h] The influenza activity reported by state and territorial epidemiologists indicates geographic spread of influenza viruses, but does not measure the severity of influenza activity.
During week 11, the following influenza activity was reported:
- Widespread influenza activity was reported by Puerto Rico and 39 states (Alaska, Arizona, Arkansas, California, Colorado, Connecticut, Delaware, Florida, Idaho, Indiana, Iowa, Kansas, Kentucky, Maine, Maryland, Massachusetts, Michigan, Minnesota, Missouri, Montana, Nebraska, Nevada, New Hampshire, New Jersey, New Mexico, New York, North Carolina, North Dakota, Ohio, Oklahoma, Oregon, Pennsylvania, Rhode Island, South Carolina, South Dakota, Vermont, Virginia, Wisconsin, and Wyoming).
- Regional influenza activity was reported by Guam and 10 states (Alabama, Georgia, Illinois, Louisiana, Mississippi, Tennessee, Texas, Utah, Washington, and West Virginia).
- Local influenza activity was reported by the District of Columbia and one state (Hawaii).
- The U.S. Virgin Islands did not report.
[/FONT]
[FONT="]View Full Screen[/FONT]
[FONT="] [/FONT]
[h=2]Additional National and International Influenza Surveillance Information[/h] [FONT="]FluView Interactive: FluView includes enhanced web-based interactive applications that can provide dynamic visuals of the influenza data collected and analyzed by CDC. These FluView Interactive applications allow people to create customized, visual interpretations of influenza data, as well as make comparisons across flu seasons, regions, age groups and a variety of other demographics. To access these tools, visit http://www.cdc.gov/flu/weekly/fluviewinteractive.htm.[/FONT]
[FONT="]U.S. State and local influenza surveillance: Click on a jurisdiction below to access the latest local influenza information.[/FONT]
[FONT="] [/FONT]
[TD="width: 139"] Alabama
[/TD]
[TD="width: 139"] Alaska
[/TD]
[TD="width: 139"] Arizona
[/TD]
[TD="width: 139"] Arkansas
[/TD]
[TD="width: 139"] California
[/TD]
[TD="width: 139"] Colorado
[/TD]
[TD="width: 139"] Connecticut
[/TD]
[TD="width: 139"] Delaware
[/TD]
[TD="width: 139"] District of Columbia
[/TD]
[TD="width: 139"] Florida
[/TD]
[TD="width: 139"] Georgia
[/TD]
[TD="width: 139"] Hawaii
[/TD]
[TD="width: 139"] Idaho
[/TD]
[TD="width: 139"] Illinois
[/TD]
[TD="width: 139"] Indiana
[/TD]
[TD="width: 139"] Iowa
[/TD]
[TD="width: 139"] Kansas
[/TD]
[TD="width: 139"] Kentucky
[/TD]
[TD="width: 139"] Louisiana
[/TD]
[TD="width: 139"] Maine
[/TD]
[TD="width: 139"] Maryland
[/TD]
[TD="width: 139"] Massachusetts
[/TD]
[TD="width: 139"] Michigan
[/TD]
[TD="width: 139"] Minnesota
[/TD]
[TD="width: 139"] Mississippi
[/TD]
[TD="width: 139"] Missouri
[/TD]
[TD="width: 139"] Montana
[/TD]
[TD="width: 139"] Nebraska
[/TD]
[TD="width: 139"] Nevada
[/TD]
[TD="width: 139"] New Hampshire
[/TD]
[TD="width: 139"] New Jersey
[/TD]
[TD="width: 139"] New Mexico
[/TD]
[TD="width: 139"] New York
[/TD]
[TD="width: 139"] North Carolina
[/TD]
[TD="width: 139"] North Dakota
[/TD]
[TD="width: 139"] Ohio
[/TD]
[TD="width: 139"] Oklahoma
[/TD]
[TD="width: 139"] Oregon
[/TD]
[TD="width: 139"] Pennsylvania
[/TD]
[TD="width: 139"] Rhode Island
[/TD]
[TD="width: 139"] South Carolina
[/TD]
[TD="width: 139"] South Dakota
[/TD]
[TD="width: 139"] Tennessee
[/TD]
[TD="width: 139"] Texas
[/TD]
[TD="width: 139"] Utah
[/TD]
[TD="width: 139"] Vermont
[/TD]
[TD="width: 139"] Virginia
[/TD]
[TD="width: 139"] Washington
[/TD]
[TD="width: 139"] West Virginia
[/TD]
[TD="width: 139"] Wisconsin
[/TD]
[TD="width: 139"] Wyoming
[/TD]
[TD="width: 139"] New York City
[/TD]
[TD="width: 139"] Virgin Islands
[/TD]
[TD="width: 139"] Puerto Rico
[/TD]
[TD="width: 139"] [/TD]
[FONT="]World Health Organization: Additional influenza surveillance information from participating WHO member nations is available through FluNet and the Global Epidemiology Reports.[/FONT]
[FONT="]WHO Collaborating Centers for Influenza located in Australia, China, Japan, the United Kingdom, and the United States (CDC in Atlanta, Georgia).[/FONT]
[FONT="]Europe: For the most recent influenza surveillance information from Europe, please see WHO/Europe and the European Centre for Disease Prevention and Control at http://www.flunewseurope.org/[/FONT]
[FONT="]Public Health Agency of Canada: The most up-to-date influenza information from Canada is available at http://www.phac-aspc.gc.ca/fluwatch/[/FONT]
[FONT="]Public Health England: The most up-to-date influenza information from the United Kingdom is available at https://www.gov.uk/government/statistics/weekly-national-flu-reports[/FONT]
[FONT="] [/FONT]
[FONT="] [/FONT]
Any links provided to non-Federal organizations are provided solely as a service to our users. These links do not constitute an endorsement of these organizations or their programs by CDC or the Federal Government, and none should be inferred. CDC is not responsible for the content of the individual organization web pages found at these links. [FONT="] [/FONT]
[FONT="]An overview of the CDC influenza surveillance system, including methodology and detailed descriptions of each data component, is available at: http://www.cdc.gov/flu/weekly/overview.htm.
[/FONT]
http://www.cdc.gov/flu/weekly/weeklyarchives2015-2016/Week11.htm