Commonground
Senior Moderator
They began to post on August 1st for the Autumn migration.
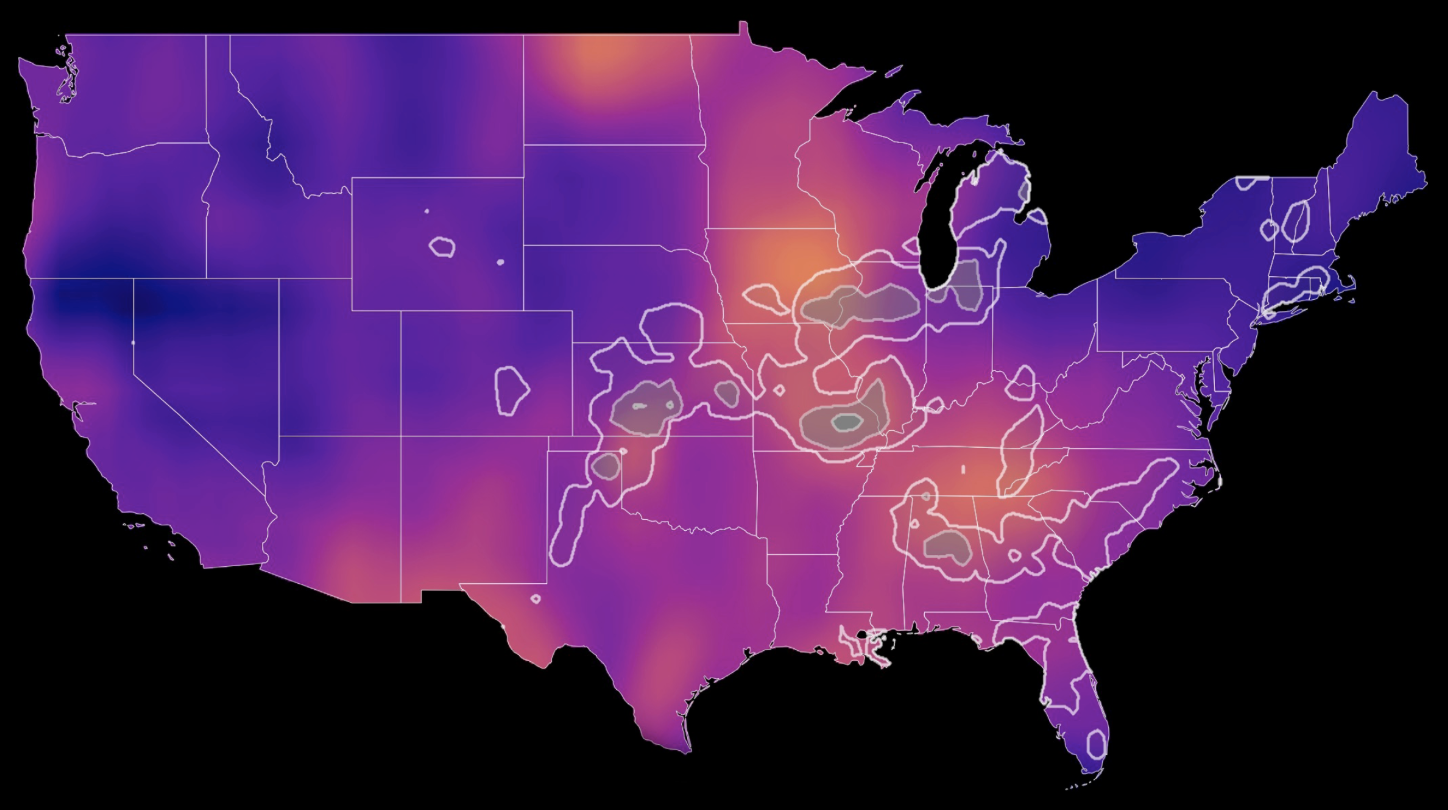
Real-time analysis maps show intensities of actual nocturnal bird migration as detected by the US weather surveillance radar network between local sunset to sunrise. All graphics are relative to the Eastern time zone. When present, the red line moving east to west represents the timing of local sunset, the yellow line represents the timing of local sunrise. Areas with lighter colors experienced more intense bird migration. Orange arrows show directions to which birds flew. Green dots represent radar locations for which data are available; red dots represent radar locations with no data available. Note that many radars in mountainous areas (e.g. the Rockies) have obstructions that restrict radar coverage, providing the appearance of no migration where migration may be occurring.
Brighter colors indicates a higher migration traffic rate (MTR) expressed in units birds/km/hour. The migration traffic rate indicates the number of birds per hour that fly across a one kilometer line transect on the earth’s surface oriented perpendicular to the direction of movement of the birds.
Cornell Lab of Ornithology currently produces these maps. Support for this research came from NASA, Edward W. Rose Postdoctoral Fellowship, and Amazon Web Services. The BirdCast project was created by grants from the National Science Foundation and supported by additional grants from Leon Levy Foundation.

https://birdcast.info/migration-tools/live-migration-maps/
Real-time analysis maps show intensities of actual nocturnal bird migration as detected by the US weather surveillance radar network between local sunset to sunrise. All graphics are relative to the Eastern time zone. When present, the red line moving east to west represents the timing of local sunset, the yellow line represents the timing of local sunrise. Areas with lighter colors experienced more intense bird migration. Orange arrows show directions to which birds flew. Green dots represent radar locations for which data are available; red dots represent radar locations with no data available. Note that many radars in mountainous areas (e.g. the Rockies) have obstructions that restrict radar coverage, providing the appearance of no migration where migration may be occurring.
Brighter colors indicates a higher migration traffic rate (MTR) expressed in units birds/km/hour. The migration traffic rate indicates the number of birds per hour that fly across a one kilometer line transect on the earth’s surface oriented perpendicular to the direction of movement of the birds.
Cornell Lab of Ornithology currently produces these maps. Support for this research came from NASA, Edward W. Rose Postdoctoral Fellowship, and Amazon Web Services. The BirdCast project was created by grants from the National Science Foundation and supported by additional grants from Leon Levy Foundation.
https://birdcast.info/migration-tools/live-migration-maps/