• FluTrackers.com Inc. does not provide medical advice. Information on this web site is collected from various internet resources, and the FluTrackers board of directors makes no warranty to the safety, efficacy, correctness or completeness of the information posted on this site by any author or poster. The information collated here is for instructional and/or discussion purposes only and is NOT intended to diagnose or treat any disease, illness, or other medical condition. Every individual reader or poster should seek advice from their personal physician/healthcare practitioner before considering or using any interventions that are discussed on this website. By continuing to access this website you agree to consult your personal physican before using any interventions posted on this website, and you agree to hold harmless FluTrackers.com Inc., the board of directors, the members, and all authors and posters for any effects from use of any medication, supplement, vitamin or other substance, device, intervention, etc. mentioned in posts on this website, or other internet venues referenced in posts on this website.
  • We are not asking for any donations. Do not donate to any entity who says they are raising funds for us.

Tracking the World Wide Age Distribution of Swine Flu

Re: Tracking the World Wide Age Distribution of Swine Flu

Thanks Anne for posting the link.

Most important quote in the article:

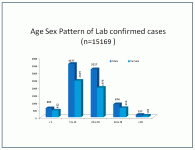
Our data suggest that severe disease and mortality in the current<sup> </sup>outbreak is concentrated in relatively healthy adolescents and<sup> </sup>adults between the ages of 10 and 60 years, a pattern reminiscent<sup> </sup>of the W-shaped curve previously seen only during the 1918 H1N1<sup> </sup>Spanish pandemic.<sup></sup>
 
Re: Tracking the World Wide Age Distribution of Swine Flu

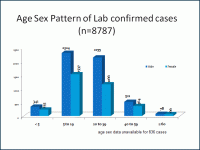
From India;

big_age.gif

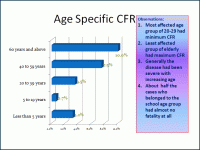
cfr.gif

http://mohfw-h1n1.nic.in/Epidemiological.html
 
Re: Tracking the World Wide Age Distribution of Swine Flu

Am I reading this wrong? But it seems the India data is directly opposite than the data from North America.
 
Re: Tracking the World Wide Age Distribution of Swine Flu

Top graph shows whose getting infected, (mostly 5-40)

Bottom graph shows cfr for those groups. Old and young still the most vulnerable. I think that's similar to the US.
 
Re: Tracking the World Wide Age Distribution of Swine Flu

Swine Flu Deaths Take 90% of Toll Among Young People (Update3)


By Pat Wechsler and Tom Randall
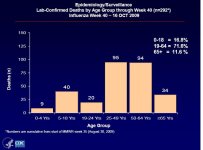
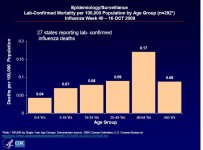
Oct. 20 (Bloomberg) -- Almost 90 percent of 292 deaths related to swine flu in the U.S. since Sept. 1 were in people younger than age 65, contrary to the pattern for seasonal flu, the U.S. Centers for Disease Control and Prevention reported.
In a typical season, the majority of deaths are among people older than 80, Anne Schuchat, head of the National Center for Immunization and Respiratory Diseases at the Atlanta-based CDC, said today in a conference call.
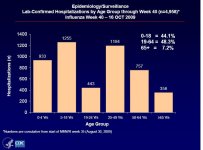
Almost 5,000 people in 27 states covered by the report have been hospitalized with laboratory-confirmed H1N1 influenza since Sept. 1, and more than 53 percent are younger than 25, Schuchat said.
?This is a young person?s disease,? Schuchat said. The number of deaths among younger Americans ?is really, really different from what happens with the seasonal flu. It is tragic for the family and hard for us in public health to see.?......


http://www.bloomberg.com/apps/news?pid=20601110&sid=a6hqMT775kY8
 
Re: Tracking the World Wide Age Distribution of Swine Flu

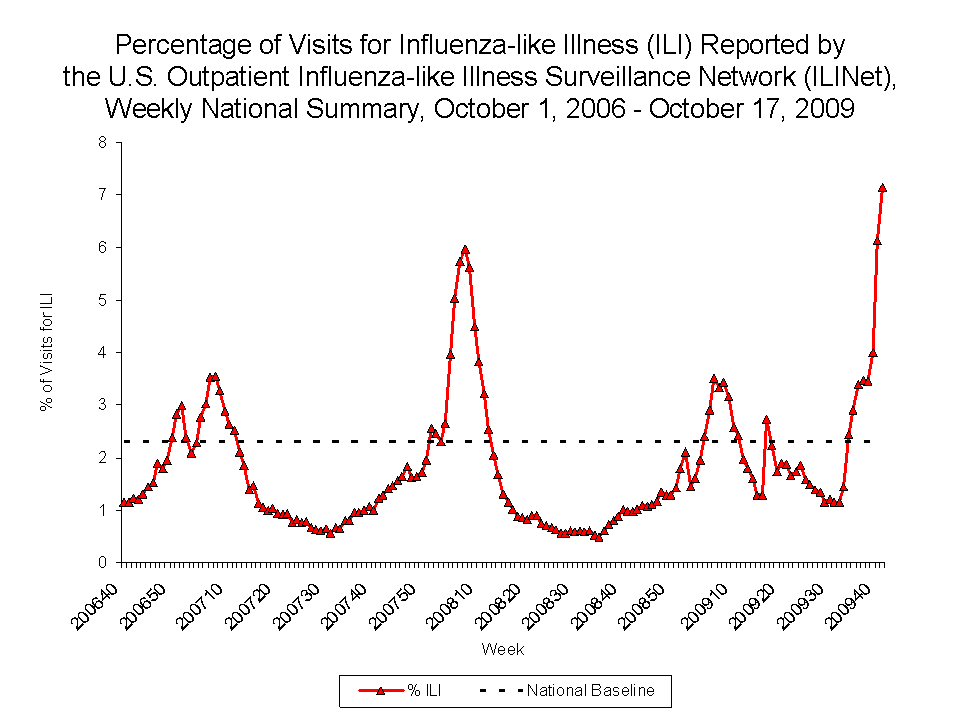
Strangely, when you look at the % of ILI sorted by age group, from the ever changing (retroactively) CDC data, the % is constant, except for the 0-4 and 5-24 year old age groups. What's more, it predicts new waves by about a week earlier than the CDC and Google Flu Trends...

CDCWaveYear48.png

Public domain, if you can make a buck off it, give some to the poor.
 
Re: Tracking the World Wide Age Distribution of Swine Flu

Thanks, Rick and welcome! :tiphat: I don't think that the CDC is puposely trying to upset you. ;)
"All data are preliminary and may change as more reports are received."

That 5-24 group certainly seems to be the leading intensity indicator. School kids, college kids. Large numbers in small spaces.
 
Re: Tracking the World Wide Age Distribution of Swine Flu

Hi RoRo,

Well, my experience in business is that if it's uncertain whether it's incompetence or evil intent, it always turns out to be incompetence.

But in the case of the CDC, after following this for months, I'm convinced it's both. The data is deliberately obscured and made difficult to access. For instance, as the Fall Wave started to ramp up, they had this amateurish graph any 10 year old kid these days could do a better job of, but at least not deliberatelly deceptive...
picILI40.GIF

Then, realizing it really looks bad to ramp up like that compared to previous years, the next week they come out with this dead fish...
picILI41.GIF

As an expert on such things, it's deliberately designed in all ways to be deceptive. You can no longer compare it to previous years, it's no longer obvious that something unusual is going on. Plus, the horizontal scale is so compressed with the dates slanted, that it can't be read. And the icing on the cake, even though the original was done by someone that seems incapable of using modern software like Excel, it is also deliberately distorted. A crappy Gif like that will never be clear, but you have to go to extra steps to make it that much worse than the original. Compare the vertical scales, for instance. And the horizontal scale has gone through an extra step of distortion.

I'd bet the ranch the person producing it was told to hide the fact it was ramping up, to prevent panic etc., and followed orders every way they could think of with their limited knowledge of the subject.
 
Re: Tracking the World Wide Age Distribution of Swine Flu

The "% Between 5 and 24" Model doesn't just predict Waves a week before everything else, it give us a measure of what percentage of ILI is from a Wave/Pandemic Wave.

What it's saying, is that the Fall Wave has ended, with a low level of the 2009 Pandemic still out there. It's not just the ILI background noise. Google Flu Trends will tick up, particularly during the week as it flops up and down. And it looks like the algorithm accents change to try to win the prediction race with the CDC. Over a dozen states were up last week, in the US, as the curve started to bottom out, but now 100% are down. Google would have told you last week that it was going back up, while the "% Between 5 and 24" Model strongly predicted otherwise.

CDCWaveYear48.png

Public domain, if you can make a buck off it, give some to the poor.
 
Re: Tracking the World Wide Age Distribution of Swine Flu

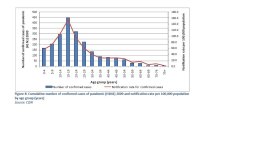
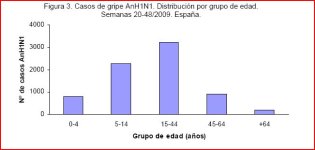
From Spain.
Acumulated sentinel cases from #20 week to #48 week:

attachment.php
 

Attachments

  • Grupos etarios hasta sem_48.JPG
    Grupos etarios hasta sem_48.JPG
    32.5 KB · Views: 2
Re: Tracking the World Wide Age Distribution of Swine Flu

Most recent data on fatalities from India indicating a slight shift towards the 40-60 age group.
Age Distribution:
0-9: 57 (10.9%)
10-19:36 (6.9%)
20-29:155 (29.5%)
30-39:117 (22.3%)
40-49:90 (17.1%)
50-59:47 (9.0%)
60-69:20 (3.8%)
70-79:3 (0.6%)
Unk: 183
(Average: 31.2; Median: 30; Range 1 month to 71 years).

compared to Nov 28th
Age Distribution:
0-9: 51 (11.0%)
10-19:32 (6.9%)
20-29:143 (30.8%)
30-39:105 (22.6%)
40-49:75 (16.2%)
50-59:36 (7.8%)
60-69:19 (4.1%)
70-79:3 (0.7%)
Unk: 113
(Average: 30.9; Median: 30; Range 1 month to 71 years).
 
Back
Top