
Laidback Al
Well-known member
Supramap is a web application for integrating genetic, evolutionary, geospatial, and temporal data.
Main page: http://supramap.osu.edu/sm/supramap/home
The Supramap project: Linking pathogen genomes with geography to fight emergent infections diseases
From data sharing to shared analytical capabilities. Genome Informatics of Influenza A
Evolution of genomes, host shifts, and geographic spread of SARS-CoV and related coronaviruses
Genomic Analysis and Geographic Visualization of the Spread of Avian Influenza (H5N1)
Evolution of drug resistance in multiple distinct lineages of H5N1 avian influenza
Main page: http://supramap.osu.edu/sm/supramap/home
A video of the method is presented at this link: http://supramap.osu.edu/sm/supramap/aboutSupramap is a completely new method of generating and sharing knowledge about evolution and biogeography.
A supramap gives people a quick and easy way to integrate genotypic and phenotypic data in a geospatial context. When viewed in a virtual globe (e.g. Google Earth or NASA WorldWind), the user has an interactive map of the spread of various lineages of organisms (e.g. strains of pathogens) over the earth.
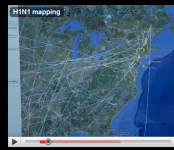
See the H1N1 supramap demonstration video below, or the publications page for SARS and Avian Influenza. (Dowloading maps does not require registration.)
Create your own maps by starting with simple and free registration.
The Supramap project has resulted in several publications:
Video Transcript
This interactive map shows the spread of the avian flu virus over the past decade.
We created an evolutionary tree of the virus' mutations, and used the program Google Earth to project that tree onto the globe.
The lines show where different strains of the virus mutated, and where they spread.
The idea is to help predict where the next outbreak of the virus is likely to occur.
We chose different colors and symbols to indicate the different animal hosts that carry the virus and where they live.
Birds, humans and other mammals, and insects that carried the virus and where they live.
The Supramap project: Linking pathogen genomes with geography to fight emergent infections diseases
From data sharing to shared analytical capabilities. Genome Informatics of Influenza A
Evolution of genomes, host shifts, and geographic spread of SARS-CoV and related coronaviruses
Genomic Analysis and Geographic Visualization of the Spread of Avian Influenza (H5N1)
Evolution of drug resistance in multiple distinct lineages of H5N1 avian influenza
How to run Supramap
Upon registration, the user should create a project, click on the project name, and upload data files in the interface provided. All files are plain text format. Be sure to use Unix line breaks. BBEdit and Text Pad are good editors to make compliant files. Extensions don't matter but might help you to organize your files. The files that Supramap can read include:
Sequence Files (Genetic Data)
A sequence file is presented in FASTA format (.fas). The file contains sequence data (e.g. nucleotides or amino acids) labeled with taxon names. The sequence data can be prealinged or raw unaligned data. One file can be used for each locus and multiple files can be used. Missing data is tolerated if multiple files are used. See POY documentation for details on how to manage missing data.
Example:
>NC_001608
gaagaatattaacattgacattgagacttgtcagtctgttaatattcttgaagagatgg
>EU051644
aggcaaattcaagtacatgcagagcaaggactgatacaatatccaacagcttggcaatc
>EU051642
aggcaaattcaagtacatgcagagcaaggactgatacaatatccaacagcttggcaatc</pre> The first taxon in the file will be considered the outgroup. The outgroup will be used to root the tree. The choice of the outgroup taxon is up to the user. In the case of temporal series of isolates of pathogens the outgroup is of often the oldest isolate. In natural sciences, the outgroup is often selected because it is outside of the set of interest, termed the ingroup. If the outgroup is related to but not a member of the ingroup then these two groups share a more ancient common ancestor than that shared by the ingroup. Rooting on an ancestor more ancient than the ancestor of the ingroup provides a baseline from which the branching pattern and polarities of changes within the ingroup can be elucidated. . . .