• FluTrackers.com Inc. does not provide medical advice. Information on this web site is collected from various internet resources, and the FluTrackers board of directors makes no warranty to the safety, efficacy, correctness or completeness of the information posted on this site by any author or poster. The information collated here is for instructional and/or discussion purposes only and is NOT intended to diagnose or treat any disease, illness, or other medical condition. Every individual reader or poster should seek advice from their personal physician/healthcare practitioner before considering or using any interventions that are discussed on this website. By continuing to access this website you agree to consult your personal physican before using any interventions posted on this website, and you agree to hold harmless FluTrackers.com Inc., the board of directors, the members, and all authors and posters for any effects from use of any medication, supplement, vitamin or other substance, device, intervention, etc. mentioned in posts on this website, or other internet venues referenced in posts on this website.
  • We are not asking for any donations. Do not donate to any entity who says they are raising funds for us.

South Africa Influenza Surveillance 2015

Ronan Kelly

Retired 2020
Link to 2014 thread: https://flutrackers.com/forum/forum...-africa-ab/165046-south-africa-influenza-2014

Influenza surveillance report - South Africa
Report compiled 20 May 2015


Influenza surveillance programmes

The data presented in this report are generated from influenza surveillance programmes: the Influenza-like illness (ILI) at primary health clinics and Viral Watch (VW) sites, Severe Acute Respiratory Illness (SARI) and the respiratory consultations and hospitalisations surveillance system.

ILI surveillance at primary health care clinics was started in 2012 at 2 clinics in two provinces, 4 additional clinics were added in 2013.
The Viral Watch (VW) is a sentinel influenza surveillance programme started in 1984 in Gauteng and expanded from 2005 onward to include all 9 provinces in South Africa. The majority (90%) of the sentinel sites are general practitioners. Respiratory specimens (throat, nasal swabs or nasopharyngeal aspirates) are collected from patients of all ages meeting the ILI case definition, which is an acute respiratory illness with a measured temperature of ≥ 38 ˚C, or a history of fever, and cough, with onset within the past 10 days prior to consultation.

The Severe Acute Respiratory Illness (SARI) surveillance program is a prospective sentinel hospital-based surveillance program. It was established in 2009 and is currently conducted at 4 sentinel sites (public hospitals) in 3 provinces of South Africa. Hospitalised patients meeting the surveillance case definition of acute respiratory illness are prospectively enrolled. Clinical and epidemiologic data are collected using standardised questionnaires. Information on in-hospital management and outcome is collected. Upper respiratory tract samples (oropharyngeal and nasopharyngeal swabs in cases ≥5 years old or nasopharyngeal aspirate in cases < 5 years of age) are tested for the presence of influenza and other respiratory viruses using RT-PCR.

The respiratory consultations and hospitalisations surveillance system collects anonymous influenza- and pneumonia-associated outpatient consultations and hospitalisations data from one private hospital group in 7 provinces (Gauteng, North West, Free State, Mpumalanga, Eastern and Western Cape and KwaZulu-Natal). These data on the number of consultations and hospitalisations are compared to the influenza season as described by the Viral Watch and SARI programmes.
...


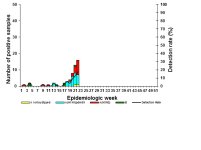
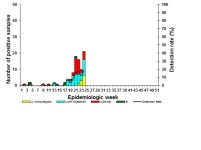
Severe acute respiratory illness (SARI) surveillance


Reporting period: 01/01/2015 to 10/05/2015 Results until end of epidemiologic week 19 (2015)
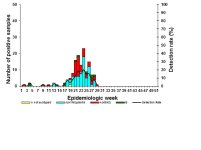
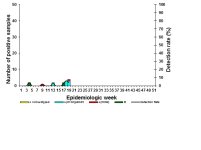
SA1.jpg
Specimens from patients hospitalised with severe acute respiratory infections at 5 sentinel sites in 4 provinces
[TABLE="align: center, border: 1, cellpadding: 0, cellspacing: 0, width: 550, height: 18"]
[TR]
[TD="colspan: 7"]
Table 1. Cumulative number of identified influenza types and subtypes and total number of samples collected by hospital[/TD]
[/TR]
[TR]
[TD]Clinic[/TD]
[TD]A not typed [/TD]
[TD]A (H1N1) pdm09[/TD]
[TD]A (H3N2)[/TD]
[TD]B[/TD]
[TD]Total samples[/TD]
[/TR]
[TR]
[TD]Edendale Gateway Clinics (KZ)[/TD]
[TD]1[/TD]
[TD]5[/TD]
[TD]3[/TD]
[TD]6[/TD]
[TD]232[/TD]
[/TR]
[TR]
[TD]Joubert Clinic (NW)[/TD]
[TD] [/TD]
[TD] [/TD]
[TD]1[/TD]
[TD] [/TD]
[TD]105[/TD]
[/TR]
[TR]
[TD]Total:[/TD]
[TD] [/TD]
[TD]1[/TD]
[TD]4[/TD]
[TD]6[/TD]
[TD]337[/TD]
[/TR]
[TR]
[TD="colspan: 7"]KwaZulu Natal (KZ), North West (NW)[/TD]
[/TR]
[/TABLE]

[h=2]Influenza-like illness (ILI) surveillance (Viral Watch)[/h] [TABLE="align: center, border: 1, cellpadding: 0, cellspacing: 0, width: 520, height: 18"]
[TR]
[TD]Reporting period:[/TD]
[TD]01/01/2015[/TD]
[TD]to[/TD]
[TD]10/05/2015[/TD]
[TD] [/TD]
[TD]Results until end of epidemiologic week 2009:[/TD]
[TD]19 (2015)
[/TD]
[/TR]
[/TABLE]
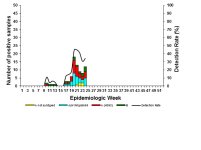
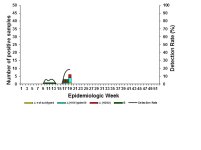
SA2.jpg
*Specimens from patients with Influenza-like illnesses at 223 sentinel sites in 9 provinces
**Detection rate calculated on specimens tested at NICD only, not shown before onset of season
[TABLE="border: 1, cellpadding: 0, cellspacing: 0, width: 550, height: 18"]
[TR]
[TD="colspan: 7"]Table 2. Cumulative number of influenza type and subtype and total number of samples collected by province[/TD]
[/TR]
[TR]
[TD]Province[/TD]
[TD]B[/TD]
[TD]A not subtyped[/TD]
[TD]A(H1N1)pdm09[/TD]
[TD]A (H3N2)[/TD]
[TD]Total samples[/TD]
[/TR]
[TR]
[TD]Eastern Cape[/TD]
[TD]0[/TD]
[TD]0[/TD]
[TD]3[/TD]
[TD]2[/TD]
[TD]20[/TD]
[/TR]
[TR]
[TD]Free State[/TD]
[TD]0[/TD]
[TD]0[/TD]
[TD]2[/TD]
[TD]0[/TD]
[TD]8[/TD]
[/TR]
[TR]
[TD]Gauteng[/TD]
[TD]1[/TD]
[TD]0[/TD]
[TD]1[/TD]
[TD]3[/TD]
[TD]46[/TD]
[/TR]
[TR]
[TD]KwaZulu-Natal[/TD]
[TD]0[/TD]
[TD]0[/TD]
[TD]0[/TD]
[TD]0[/TD]
[TD]0[/TD]
[/TR]
[TR]
[TD]Limpopo[/TD]
[TD]0[/TD]
[TD]0[/TD]
[TD] [/TD]
[TD] [/TD]
[TD]2[/TD]
[/TR]
[TR]
[TD]Mpumalanga[/TD]
[TD]1[/TD]
[TD]0[/TD]
[TD]0[/TD]
[TD]0[/TD]
[TD]7[/TD]
[/TR]
[TR]
[TD]Northern Cape[/TD]
[TD]0[/TD]
[TD]0[/TD]
[TD]0[/TD]
[TD]0[/TD]
[TD]15[/TD]
[/TR]
[TR]
[TD]North West[/TD]
[TD]0[/TD]
[TD]0[/TD]
[TD]0[/TD]
[TD]0[/TD]
[TD]0[/TD]
[/TR]
[TR]
[TD]Western Cape[/TD]
[TD]2[/TD]
[TD]1[/TD]
[TD]19[/TD]
[TD]2[/TD]
[TD]72[/TD]
[/TR]
[TR]
[TD]Total:[/TD]
[TD]4[/TD]
[TD]1[/TD]
[TD]25[/TD]
[TD]8[/TD]
[TD]170[/TD]
[/TR]
[/TABLE]
[h=2][/h] [TABLE="border: 1, cellpadding: 0, cellspacing: 0, width: 520, height: 18"]
[TR]
[TD]Reporting period:[/TD]
[TD]01/01/2015[/TD]
[TD]to[/TD]
[TD]10/05/2015[/TD]
[TD] [/TD]
[TD]Results until end of epidemiologic week[/TD]
[TD]19 (2015)[/TD]
[/TR]
[/TABLE]

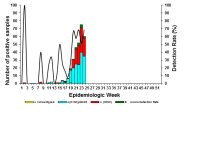
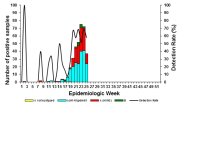
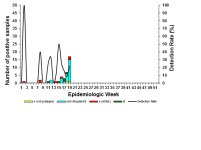
Figure 3. Number of private hospital outpatient consultations* with a discharge diagnosis of pneumonia and influenza (P&I) and viral isolates**
SA3.jpg
* Hospital outpatient data from weekly reports of consultations to the Netcare hospital group. Discharge diagnosis is according to International Statistical Classification of Diseases and Related Health Problems coding/ICD by clinicians and does not represent laboratory confirmation of aetiology
** Influenza positive specimens from the Viral Watch surveillance programme
[TABLE="align: center, border: 1, cellpadding: 0, cellspacing: 0, width: 550, height: 18"]
[TR]
[TD="colspan: 7"]
Table 3. Cumulative number of identified influenza types and subtypes and total number of samples collected by hospital[/TD]
[/TR]
[TR]
[TD]Clinic[/TD]
[TD]A not subtyped [/TD]
[TD]A (H1N1) pdm09[/TD]
[TD]A (H3N2)[/TD]
[TD]B[/TD]
[TD]Total samples[/TD]
[/TR]
[TR]
[TD]Edendale (KZ)[/TD]
[TD]0[/TD]
[TD]3[/TD]
[TD]0[/TD]
[TD]1[/TD]
[TD]148[/TD]
[/TR]
[TR]
[TD]Helen Joseph-Rahima Moosa (GP)[/TD]
[TD] [/TD]
[TD]4[/TD]
[TD]0[/TD]
[TD]0[/TD]
[TD]452[/TD]
[/TR]
[TR]
[TD]Klerksdorp-Tshepong (NW)[/TD]
[TD]0[/TD]
[TD]0[/TD]
[TD]1[/TD]
[TD]2[/TD]
[TD]252[/TD]
[/TR]
[TR]
[TD]Mapulaneng (MP)[/TD]
[TD] [/TD]
[TD]0[/TD]
[TD]1[/TD]
[TD]1[/TD]
[TD]75[/TD]
[/TR]
[TR]
[TD]Matiwane (MP)[/TD]
[TD]0[/TD]
[TD]0[/TD]
[TD]0[/TD]
[TD]0[/TD]
[TD]30[/TD]
[/TR]
[TR]
[TD]Red Cross (WC)[/TD]
[TD]0[/TD]
[TD]1[/TD]
[TD]0[/TD]
[TD]0[/TD]
[TD]69[/TD]
[/TR]
[TR]
[TD]Total:[/TD]
[TD]0[/TD]
[TD]8[/TD]
[TD]2[/TD]
[TD]4[/TD]
[TD]1026[/TD]
[/TR]
[TR]
[TD="colspan: 7"]*Gauteng (GP), KwaZulu Natal (KZ), North West (NW), Mpumalanga (MP)[/TD]
[/TR]
[/TABLE]


...
http://www.nicd.ac.za/?page=seasonal_influenza&id=72
 
Surveillance

Influenza surveillance report - South Africa
Report compiled 09 June 2015
... [TABLE="align: center, border: 0, cellpadding: 0, cellspacing: 0, width: 550, height: 18"]
[TR]
[TD]

[/TD]
[/TR]
[TR]
[TD] [h=2]Severe acute respiratory illness (SARI) surveillance[/h] [TABLE="border: 1, cellpadding: 0, cellspacing: 0, width: 520"]
[TR]
[TD]Reporting period:[/TD]
[TD]01/01/2015[/TD]
[TD]to[/TD]
[TD]31/05/2015[/TD]
[TD] [/TD]
[TD]Results until end of epidemiologic week[/TD]
[TD]22 (2015)[/TD]
[/TR]
[/TABLE]

Figure 1. Number of positive samples* by influenza types and subtypes and detection rate by week[/TD]
[/TR]
[/TABLE]
SA1.jpg
*Specimens from patients hospitalised with severe acute respiratory infections at 5 sentinel sites in 4 provinces
[TABLE="align: center, border: 1, cellpadding: 0, cellspacing: 0, width: 550, height: 18"]
[TR]
[TD="colspan: 7"]
Table 1. Cumulative number of identified influenza types and subtypes and total number of samples collected by hospital[/TD]
[/TR]
[TR]
[TD]Clinic[/TD]
[TD]A not typed [/TD]
[TD]A (H1N1) pdm09[/TD]
[TD]A (H3N2)[/TD]
[TD]B[/TD]
[TD]Total samples[/TD]
[/TR]
[TR]
[TD]Edendale Gateway Clinics (KZ)[/TD]
[TD]5[/TD]
[TD]17[/TD]
[TD]4[/TD]
[TD]9[/TD]
[TD]271[/TD]
[/TR]
[TR]
[TD]Joubert Clinic (NW)[/TD]
[TD] [/TD]
[TD] [/TD]
[TD]12[/TD]
[TD] [/TD]
[TD]146[/TD]
[/TR]
[TR]
[TD]Total:[/TD]
[TD]5[/TD]
[TD]17[/TD]
[TD]16[/TD]
[TD]9[/TD]
[TD]417[/TD]
[/TR]
[TR]
[TD="colspan: 7"]KwaZulu Natal (KZ), North West (NW)[/TD]
[/TR]
[/TABLE]

[h=2]Influenza-like illness (ILI) surveillance (Viral Watch)[/h] [TABLE="align: center, border: 1, cellpadding: 0, cellspacing: 0, width: 520, height: 18"]
[TR]
[TD]Reporting period:[/TD]
[TD]01/01/2015[/TD]
[TD]to[/TD]
[TD]31/05/2015[/TD]
[TD] [/TD]
[TD]Results until end of epidemiologic week 2009:[/TD]
[TD]22 (2015)[/TD]
[/TR]
[/TABLE]


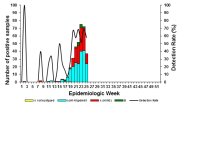
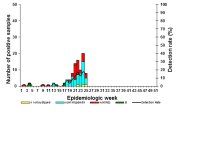
Figure 2. Number of positive samples* by influenza types and subtypes and detection rate** by week
SA2.jpg
*Specimens from patients with Influenza-like illnesses at 223 sentinel sites in 9 provinces
**Detection rate calculated on specimens tested at NICD only, not shown before onset of season
[TABLE="border: 1, cellpadding: 0, cellspacing: 0, width: 550, height: 18"]
[TR]
[TD="colspan: 7"]Table 2. Cumulative number of influenza type and subtype and total number of samples collected by province[/TD]
[/TR]
[TR]
[TD]Province[/TD]
[TD]B[/TD]
[TD]A not subtyped[/TD]
[TD]A(H1N1)pdm09[/TD]
[TD]A (H3N2)[/TD]
[TD]Total samples[/TD]
[/TR]
[TR]
[TD]Eastern Cape[/TD]
[TD]0[/TD]
[TD]0[/TD]
[TD]14[/TD]
[TD]11[/TD]
[TD]43[/TD]
[/TR]
[TR]
[TD]Free State[/TD]
[TD]0[/TD]
[TD]0[/TD]
[TD]4[/TD]
[TD]0[/TD]
[TD]11[/TD]
[/TR]
[TR]
[TD]Gauteng[/TD]
[TD]1[/TD]
[TD]0[/TD]
[TD]21[/TD]
[TD]27[/TD]
[TD]124[/TD]
[/TR]
[TR]
[TD]KwaZulu-Natal[/TD]
[TD]0[/TD]
[TD]0[/TD]
[TD]0[/TD]
[TD]0[/TD]
[TD]6[/TD]
[/TR]
[TR]
[TD]Limpopo[/TD]
[TD]0[/TD]
[TD]0[/TD]
[TD] [/TD]
[TD]3[/TD]
[TD]16[/TD]
[/TR]
[TR]
[TD]Mpumalanga[/TD]
[TD]1[/TD]
[TD]0[/TD]
[TD]0[/TD]
[TD]0[/TD]
[TD]15[/TD]
[/TR]
[TR]
[TD]Northern Cape[/TD]
[TD]0[/TD]
[TD]0[/TD]
[TD]0[/TD]
[TD]0[/TD]
[TD]0[/TD]
[/TR]
[TR]
[TD]North West[/TD]
[TD]0[/TD]
[TD]0[/TD]
[TD]0[/TD]
[TD]0[/TD]
[TD]0[/TD]
[/TR]
[TR]
[TD]Western Cape[/TD]
[TD]2[/TD]
[TD]1[/TD]
[TD]56[/TD]
[TD]21[/TD]
[TD]153[/TD]
[/TR]
[TR]
[TD]Total:[/TD]
[TD]4[/TD]
[TD]1[/TD]
[TD]96[/TD]
[TD]62[/TD]
[TD]368[/TD]
[/TR]
[/TABLE]
[h=2][/h] [TABLE="border: 1, cellpadding: 0, cellspacing: 0, width: 520, height: 18"]
[TR]
[TD]Reporting period:[/TD]
[TD]01/01/2015[/TD]
[TD]to[/TD]
[TD]31/05/2015[/TD]
[TD] [/TD]
[TD]Results until end of epidemiologic week[/TD]
[TD]22 (2015)[/TD]
[/TR]
[/TABLE]

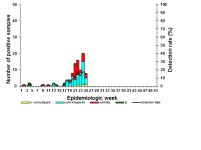
Figure 3. Number of private hospital outpatient consultations* with a discharge diagnosis of pneumonia and influenza (P&I) and viral isolates**
SA3.jpg
* Hospital outpatient data from weekly reports of consultations to the Netcare hospital group. Discharge diagnosis is according to International Statistical Classification of Diseases and Related Health Problems coding/ICD by clinicians and does not represent laboratory confirmation of aetiology
** Influenza positive specimens from the Viral Watch surveillance programme
[TABLE="align: center, border: 1, cellpadding: 0, cellspacing: 0, width: 550, height: 18"]
[TR]
[TD="colspan: 7"]
Table 3. Cumulative number of identified influenza types and subtypes and total number of samples collected by hospital[/TD]
[/TR]
[TR]
[TD]Clinic[/TD]
[TD]A not subtyped [/TD]
[TD]A (H1N1) pdm09[/TD]
[TD]A (H3N2)[/TD]
[TD]B[/TD]
[TD]Total samples[/TD]
[/TR]
[TR]
[TD]Edendale (KZ)[/TD]
[TD]0[/TD]
[TD]3[/TD]
[TD]0[/TD]
[TD]1[/TD]
[TD]148[/TD]
[/TR]
[TR]
[TD]Helen Joseph-Rahima Moosa (GP)[/TD]
[TD] [/TD]
[TD]4[/TD]
[TD]0[/TD]
[TD]0[/TD]
[TD]452[/TD]
[/TR]
[TR]
[TD]Klerksdorp-Tshepong (NW)[/TD]
[TD]0[/TD]
[TD]0[/TD]
[TD]1[/TD]
[TD]2[/TD]
[TD]252[/TD]
[/TR]
[TR]
[TD]Mapulaneng (MP)[/TD]
[TD] [/TD]
[TD]0[/TD]
[TD]1[/TD]
[TD]1[/TD]
[TD]75[/TD]
[/TR]
[TR]
[TD]Matiwane (MP)[/TD]
[TD]0[/TD]
[TD]0[/TD]
[TD]0[/TD]
[TD]0[/TD]
[TD]30[/TD]
[/TR]
[TR]
[TD]Red Cross (WC)[/TD]
[TD]0[/TD]
[TD]1[/TD]
[TD]0[/TD]
[TD]0[/TD]
[TD]69[/TD]
[/TR]
[TR]
[TD]Total:[/TD]
[TD]0[/TD]
[TD]8[/TD]
[TD]2[/TD]
[TD]4[/TD]
[TD]1026[/TD]
[/TR]
[TR]
[TD="colspan: 7"]*Gauteng (GP), KwaZulu Natal (KZ), North West (NW), Mpumalanga (MP)

[/TD]
[/TR]
[/TABLE]

...
http://www.nicd.ac.za/?page=seasonal_influenza&id=72
 
Influenza surveillance report - South Africa
Report compiled 25 June 2015
http://www.nicd.ac.za/?page=seasonal_influenza&id=72
... [TABLE="align: center, border: 0, cellpadding: 0, cellspacing: 0, width: 550, height: 18"]
[TR]
[TD]

[/TD]
[/TR]
[TR]
[TD] [h=2]Severe acute respiratory illness (SARI) surveillance[/h] [TABLE="border: 1, cellpadding: 0, cellspacing: 0, width: 520"]
[TR]
[TD]Reporting period:[/TD]
[TD]01/01/2015[/TD]
[TD]to[/TD]
[TD]14/06/2015[/TD]
[TD] [/TD]
[TD]Results until end of epidemiologic week[/TD]
[TD]24 (2015)[/TD]
[/TR]
[/TABLE]

Figure 1. Number of positive samples* by influenza types and subtypes and detection rate by week[/TD]
[/TR]
[/TABLE]
SA1.jpg
*Specimens from patients hospitalised with severe acute respiratory infections at 5 sentinel sites in 4 provinces
[TABLE="align: center, border: 1, cellpadding: 0, cellspacing: 0, width: 550, height: 18"]
[TR]
[TD="colspan: 7"]
Table 1. Cumulative number of identified influenza types and subtypes and total number of samples collected by hospital[/TD]
[/TR]
[TR]
[TD]Clinic[/TD]
[TD]A not typed [/TD]
[TD]A (H1N1) pdm09[/TD]
[TD]A (H3N2)[/TD]
[TD]B[/TD]
[TD]Total samples[/TD]
[/TR]
[TR]
[TD]Edendale Gateway Clinics (KZ)[/TD]
[TD]4[/TD]
[TD]28[/TD]
[TD]10[/TD]
[TD]15[/TD]
[TD]324[/TD]
[/TR]
[TR]
[TD]Joubert Clinic (NW)[/TD]
[TD]1[/TD]
[TD] [/TD]
[TD]19[/TD]
[TD] [/TD]
[TD]172[/TD]
[/TR]
[TR]
[TD]Total:[/TD]
[TD]5[/TD]
[TD]28[/TD]
[TD]29[/TD]
[TD]15[/TD]
[TD]496[/TD]
[/TR]
[TR]
[TD="colspan: 7"]KwaZulu Natal (KZ), North West (NW)[/TD]
[/TR]
[/TABLE]

[h=2]Influenza-like illness (ILI) surveillance (Viral Watch)[/h] [TABLE="align: center, border: 1, cellpadding: 0, cellspacing: 0, width: 520, height: 18"]
[TR]
[TD]Reporting period:[/TD]
[TD]01/01/2015[/TD]
[TD]to[/TD]
[TD]14/06/2015[/TD]
[TD] [/TD]
[TD]Results until end of epidemiologic week 2009:[/TD]
[TD]24 (2015)[/TD]
[/TR]
[/TABLE]


Figure 2. Number of positive samples* by influenza types and subtypes and detection rate** by week
SA2.jpg [TABLE="align: center, border: 0, cellpadding: 0, cellspacing: 0, width: 550, height: 18"]
[TR]
[TD]

[/TD]
[/TR]
[TR]
[TD] [h=2]Severe acute respiratory illness (SARI) surveillance[/h] [TABLE="border: 1, cellpadding: 0, cellspacing: 0, width: 520"]
[TR]
[TD]Reporting period:[/TD]
[TD]01/01/2015[/TD]
[TD]to[/TD]
[TD]14/06/2015[/TD]
[TD] [/TD]
[TD]Results until end of epidemiologic week[/TD]
[TD]24 (2015)[/TD]
[/TR]
[/TABLE]

Figure 1. Number of positive samples* by influenza types and subtypes and detection rate by week
Junejune1.jpg

*Specimens from patients hospitalised with severe acute respiratory infections at 5 sentinel sites in 4 provinces
[TABLE="align: center, border: 1, cellpadding: 0, cellspacing: 0, width: 550"]
[TR]
[TD="colspan: 7"]
Table 1. Cumulative number of identified influenza types and subtypes and total number of samples collected by hospital[/TD]
[/TR]
[TR]
[TD]Clinic[/TD]
[TD]A not typed [/TD]
[TD]A (H1N1) pdm09[/TD]
[TD]A (H3N2)[/TD]
[TD]B[/TD]
[TD]Total samples[/TD]
[/TR]
[TR]
[TD]Edendale Gateway Clinics (KZ)[/TD]
[TD]4[/TD]
[TD]28[/TD]
[TD]10[/TD]
[TD]15[/TD]
[TD]324[/TD]
[/TR]
[TR]
[TD]Joubert Clinic (NW)[/TD]
[TD]1[/TD]
[TD] [/TD]
[TD]19[/TD]
[TD] [/TD]
[TD]172[/TD]
[/TR]
[TR]
[TD]Total:[/TD]
[TD]5[/TD]
[TD]28[/TD]
[TD]29[/TD]
[TD]15[/TD]
[TD]496[/TD]
[/TR]
[TR]
[TD="colspan: 7"]KwaZulu Natal (KZ), North West (NW)[/TD]
[/TR]
[/TABLE]

[h=2]Influenza-like illness (ILI) surveillance (Viral Watch)[/h] [TABLE="align: center, border: 1, cellpadding: 0, cellspacing: 0, width: 520"]
[TR]
[TD]Reporting period:[/TD]
[TD]01/01/2015[/TD]
[TD]to[/TD]
[TD]14/06/2015[/TD]
[TD] [/TD]
[TD]Results until end of epidemiologic week 2009:[/TD]
[TD]24 (2015)[/TD]
[/TR]
[/TABLE]


Figure 2. Number of positive samples* by influenza types and subtypes and detection rate** by week

Junejune2.jpg
*Specimens from patients with Influenza-like illnesses at 223 sentinel sites in 9 provinces
**Detection rate calculated on specimens tested at NICD only, not shown before onset of season
[TABLE="border: 1, cellpadding: 0, cellspacing: 0, width: 550"]
[TR]
[TD="colspan: 7"]Table 2. Cumulative number of influenza type and subtype and total number of samples collected by province[/TD]
[/TR]
[TR]
[TD]Province[/TD]
[TD]B[/TD]
[TD]A not subtyped[/TD]
[TD]A(H1N1)pdm09[/TD]
[TD]A (H3N2)[/TD]
[TD]Total samples[/TD]
[/TR]
[TR]
[TD]Eastern Cape[/TD]
[TD]1[/TD]
[TD]0[/TD]
[TD]23[/TD]
[TD]18[/TD]
[TD]69[/TD]
[/TR]
[TR]
[TD]Free State[/TD]
[TD]0[/TD]
[TD]0[/TD]
[TD]5[/TD]
[TD]5[/TD]
[TD]29[/TD]
[/TR]
[TR]
[TD]Gauteng[/TD]
[TD]1[/TD]
[TD]0[/TD]
[TD]49[/TD]
[TD]54[/TD]
[TD]215[/TD]
[/TR]
[TR]
[TD]KwaZulu-Natal[/TD]
[TD]0[/TD]
[TD]0[/TD]
[TD]10[/TD]
[TD]2[/TD]
[TD]22[/TD]
[/TR]
[TR]
[TD]Limpopo[/TD]
[TD]0[/TD]
[TD]0[/TD]
[TD]6[/TD]
[TD]7[/TD]
[TD]32[/TD]
[/TR]
[TR]
[TD]Mpumalanga[/TD]
[TD]1[/TD]
[TD]0[/TD]
[TD]2[/TD]
[TD]0[/TD]
[TD]17[/TD]
[/TR]
[TR]
[TD]Northern Cape[/TD]
[TD]0[/TD]
[TD]0[/TD]
[TD]0[/TD]
[TD]0[/TD]
[TD]1[/TD]
[/TR]
[TR]
[TD]North West[/TD]
[TD]0[/TD]
[TD]0[/TD]
[TD]0[/TD]
[TD]1[/TD]
[TD]0[/TD]
[/TR]
[TR]
[TD]Western Cape[/TD]
[TD]2[/TD]
[TD]1[/TD]
[TD]79[/TD]
[TD]33[/TD]
[TD]200[/TD]
[/TR]
[TR]
[TD]Total:[/TD]
[TD]4[/TD]
[TD]1[/TD]
[TD]174[/TD]
[TD]120[/TD]
[TD]585[/TD]
[/TR]
[/TABLE]
[h=2][/h] [TABLE="border: 1, cellpadding: 0, cellspacing: 0, width: 520"]
[TR]
[TD]Reporting period:[/TD]
[TD]01/01/2015[/TD]
[TD]to[/TD]
[TD]14/06/2015[/TD]
[TD] [/TD]
[TD]Results until end of epidemiologic week[/TD]
[TD]24 (2015)[/TD]
[/TR]
[/TABLE]

Figure 3. Number of private hospital outpatient consultations* with a discharge diagnosis of pneumonia and influenza (P&I) and viral isolates**[/TD]
[/TR]
[/TABLE]


SA3.jpg
* Hospital outpatient data from weekly reports of consultations to the Netcare hospital group. Discharge diagnosis is according to International Statistical Classification of Diseases and Related Health Problems coding/ICD by clinicians and does not represent laboratory confirmation of aetiology
** Influenza positive specimens from the Viral Watch surveillance programme
[TABLE="align: center, border: 1, cellpadding: 0, cellspacing: 0, width: 550, height: 18"]
[TR]
[TD="colspan: 7"]
Table 3. Cumulative number of identified influenza types and subtypes and total number of samples collected by hospital[/TD]
[/TR]
[TR]
[TD]Clinic[/TD]
[TD]A not subtyped [/TD]
[TD]A (H1N1) pdm09[/TD]
[TD]A (H3N2)[/TD]
[TD]B[/TD]
[TD]Total samples[/TD]
[/TR]
[TR]
[TD]Edendale (KZ)[/TD]
[TD]3[/TD]
[TD]9[/TD]
[TD]2[/TD]
[TD]3[/TD]
[TD]228[/TD]
[/TR]
[TR]
[TD]Helen Joseph-Rahima Moosa (GP)[/TD]
[TD]6[/TD]
[TD]17[/TD]
[TD]8[/TD]
[TD]0[/TD]
[TD]661[/TD]
[/TR]
[TR]
[TD]Klerksdorp-Tshepong (NW)[/TD]
[TD]1[/TD]
[TD]6[/TD]
[TD]18[/TD]
[TD]2[/TD]
[TD]390[/TD]
[/TR]
[TR]
[TD]Mapulaneng (MP)[/TD]
[TD] [/TD]
[TD]2[/TD]
[TD]3[/TD]
[TD]1[/TD]
[TD]95[/TD]
[/TR]
[TR]
[TD]Matiwane (MP)[/TD]
[TD]0[/TD]
[TD]0[/TD]
[TD]0[/TD]
[TD]0[/TD]
[TD]47[/TD]
[/TR]
[TR]
[TD]Red Cross (WC)[/TD]
[TD]0[/TD]
[TD]9[/TD]
[TD]1[/TD]
[TD]0[/TD]
[TD]189[/TD]
[/TR]
[TR]
[TD]Total:[/TD]
[TD]10[/TD]
[TD]43[/TD]
[TD]32[/TD]
[TD]6[/TD]
[TD]1610[/TD]
[/TR]
[TR]
[TD="colspan: 7"]*Gauteng (GP), KwaZulu Natal (KZ), North West (NW), Mpumalanga (MP)[/TD]
[/TR]
[/TABLE]
...
 
Influenza surveillance report - South Africa
Report compiled 02 July 2015
http://www.nicd.ac.za/?page=seasonal_influenza&id=72
[h=2]Severe acute respiratory illness (SARI) surveillance[/h] [TABLE="border: 1, cellpadding: 0, cellspacing: 0, width: 520, height: 18"]
[TR]
[TD]Reporting period:[/TD]
[TD]01/01/2015[/TD]
[TD]to[/TD]
[TD]21/06/2015[/TD]
[TD] [/TD]
[TD]Results until end of epidemiologic week[/TD]
[TD]25 (2015)[/TD]
[/TR]
[/TABLE]

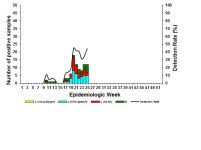
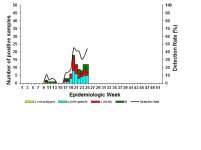
Figure 1. Number of positive samples* by influenza types and subtypes and detection rate by week

SA1.jpg [TABLE="align: center, border: 0, cellpadding: 0, cellspacing: 0, width: 550, height: 18"]
[TR]
[TD]

[/TD]
[/TR]
[TR]
[TD] [h=2]Severe acute respiratory illness (SARI) surveillance[/h] [TABLE="border: 1, cellpadding: 0, cellspacing: 0, width: 520"]
[TR]
[TD]Reporting period:[/TD]
[TD]01/01/2015[/TD]
[TD]to[/TD]
[TD]21/06/2015[/TD]
[TD] [/TD]
[TD]Results until end of epidemiologic week[/TD]
[TD]25 (2015)[/TD]
[/TR]
[/TABLE]

Figure 1. Number of positive samples* by influenza types and subtypes and detection rate by week
Fig1July.jpg

*Specimens from patients hospitalised with severe acute respiratory infections at 5 sentinel sites in 4 provinces
[TABLE="align: center, border: 1, cellpadding: 0, cellspacing: 0, width: 550"]
[TR]
[TD="colspan: 7"]
Table 1. Cumulative number of identified influenza types and subtypes and total number of samples collected by hospital[/TD]
[/TR]
[TR]
[TD]Clinic[/TD]
[TD]A not typed [/TD]
[TD]A (H1N1) pdm09[/TD]
[TD]A (H3N2)[/TD]
[TD]B[/TD]
[TD]Total samples[/TD]
[/TR]
[TR]
[TD]Edendale Gateway Clinics (KZ)[/TD]
[TD]0[/TD]
[TD]35[/TD]
[TD]11[/TD]
[TD]22[/TD]
[TD]346[/TD]
[/TR]
[TR]
[TD]Joubert Clinic (NW)[/TD]
[TD]0[/TD]
[TD]1[/TD]
[TD]19[/TD]
[TD] [/TD]
[TD]175[/TD]
[/TR]
[TR]
[TD]Total:[/TD]
[TD]0[/TD]
[TD]36[/TD]
[TD]30[/TD]
[TD]22[/TD]
[TD]521[/TD]
[/TR]
[TR]
[TD="colspan: 7"]KwaZulu Natal (KZ), North West (NW)[/TD]
[/TR]
[/TABLE]

[h=2]Influenza-like illness (ILI) surveillance (Viral Watch)[/h] [TABLE="align: center, border: 1, cellpadding: 0, cellspacing: 0, width: 520"]
[TR]
[TD]Reporting period:[/TD]
[TD]01/01/2015[/TD]
[TD]to[/TD]
[TD]21/06/2015[/TD]
[TD] [/TD]
[TD]Results until end of epidemiologic week 2009:[/TD]
[TD]25 (2015)[/TD]
[/TR]
[/TABLE]


Figure 2. Number of positive samples* by influenza types and subtypes and detection rate** by week
[/TD]
[/TR]
[/TABLE]

SA2.jpg
*Specimens from patients with Influenza-like illnesses at 223 sentinel sites in 9 provinces
**Detection rate calculated on specimens tested at NICD only, not shown before onset of season
[TABLE="border: 1, cellpadding: 0, cellspacing: 0, width: 550, height: 18"]
[TR]
[TD="colspan: 7"]Table 2. Cumulative number of influenza type and subtype and total number of samples collected by province[/TD]
[/TR]
[TR]
[TD]Province[/TD]
[TD]B[/TD]
[TD]A not subtyped[/TD]
[TD]A(H1N1)pdm09[/TD]
[TD]A (H3N2)[/TD]
[TD]Total samples[/TD]
[/TR]
[TR]
[TD]Eastern Cape[/TD]
[TD]1[/TD]
[TD]0[/TD]
[TD]26[/TD]
[TD]18[/TD]
[TD]74[/TD]
[/TR]
[TR]
[TD]Free State[/TD]
[TD]0[/TD]
[TD]0[/TD]
[TD]9[/TD]
[TD]6[/TD]
[TD]35[/TD]
[/TR]
[TR]
[TD]Gauteng[/TD]
[TD]4[/TD]
[TD]1[/TD]
[TD]60[/TD]
[TD]61[/TD]
[TD]246[/TD]
[/TR]
[TR]
[TD]KwaZulu-Natal[/TD]
[TD]0[/TD]
[TD]0[/TD]
[TD]0[/TD]
[TD]0[/TD]
[TD]0[/TD]
[/TR]
[TR]
[TD]Limpopo[/TD]
[TD]0[/TD]
[TD]0[/TD]
[TD]14[/TD]
[TD]3[/TD]
[TD]34[/TD]
[/TR]
[TR]
[TD]Mpumalanga[/TD]
[TD]2[/TD]
[TD]0[/TD]
[TD]8[/TD]
[TD]8[/TD]
[TD]37[/TD]
[/TR]
[TR]
[TD]Northern Cape[/TD]
[TD]0[/TD]
[TD]0[/TD]
[TD]2[/TD]
[TD]2[/TD]
[TD]20[/TD]
[/TR]
[TR]
[TD]North West[/TD]
[TD]0[/TD]
[TD]0[/TD]
[TD]0[/TD]
[TD]1[/TD]
[TD]1[/TD]
[/TR]
[TR]
[TD]Western Cape[/TD]
[TD]9[/TD]
[TD]1[/TD]
[TD]83[/TD]
[TD]36[/TD]
[TD]207[/TD]
[/TR]
[TR]
[TD]Total:[/TD]
[TD]16[/TD]
[TD]1[/TD]
[TD]202[/TD]
[TD]135[/TD]
[TD]654[/TD]
[/TR]
[/TABLE]
[h=2][/h] [TABLE="border: 1, cellpadding: 0, cellspacing: 0, width: 520, height: 18"]
[TR]
[TD]Reporting period:[/TD]
[TD]01/01/2015[/TD]
[TD]to[/TD]
[TD]14/06/2015[/TD]
[TD] [/TD]
[TD]Results until end of epidemiologic week[/TD]
[TD]24 (2015)[/TD]
[/TR]
[/TABLE]

Figure 3. Number of private hospital outpatient consultations* with a discharge diagnosis of pneumonia and influenza (P&I) and viral isolates**
SA3.jpg
...
 
Influenza surveillance report - South Africa
Report compiled 23 July 2015
http://www.nicd.ac.za/?page=seasonal_influenza&id=72
Severe acute respiratory illness (SARI) surveillance


Reporting period: 01/01/2015 to 12/07/2015 Results until end of epidemiologic week 28 (2015)
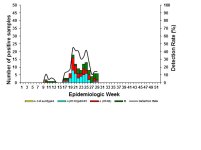
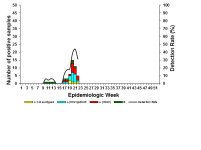
Figure 1. Number of positive samples* by influenza types and subtypes and detection rate by week SA1.jpg

*Specimens from patients hospitalised with severe acute respiratory infections at 5 sentinel sites in 4 provinces [TABLE="align: center, border: 1, cellpadding: 0, cellspacing: 0, width: 550, height: 18"]
[TR]
[TD="colspan: 7"]Table 1. Cumulative number of identified influenza types and subtypes and total number of samples collected by hospital[/TD]
[/TR]
[TR]
[TD]Clinic[/TD]
[TD]A not typed [/TD]
[TD]A (H1N1) pdm09[/TD]
[TD]A (H3N2)[/TD]
[TD]B[/TD]
[TD]Total samples[/TD]
[/TR]
[TR]
[TD]Edendale Gateway Clinics (KZ)[/TD]
[TD]0[/TD]
[TD]39[/TD]
[TD]15[/TD]
[TD]32[/TD]
[TD]420[/TD]
[/TR]
[TR]
[TD]Joubert Clinic (NW)[/TD]
[TD]0[/TD]
[TD]1[/TD]
[TD]20[/TD]
[TD] [/TD]
[TD]212[/TD]
[/TR]
[TR]
[TD]Total:[/TD]
[TD]0[/TD]
[TD]40[/TD]
[TD]35[/TD]
[TD]32[/TD]
[TD]632[/TD]
[/TR]
[TR]
[TD="colspan: 7"]KwaZulu Natal (KZ), North West (NW)[/TD]
[/TR]
[/TABLE]

Influenza-like illness (ILI) surveillance (Viral Watch)
[TABLE="align: center, border: 1, cellpadding: 0, cellspacing: 0, width: 520, height: 18"]
[TR]
[TD]Reporting period:[/TD]
[TD]01/01/2015[/TD]
[TD]to[/TD]
[TD]12/07/2015[/TD]
[TD] [/TD]
[TD]Results until end of epidemiologic week 2009:[/TD]
[TD]28 (2015)[/TD]
[/TR]
[/TABLE]


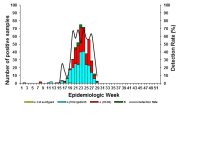
Figure 2. Number of positive samples* by influenza types and subtypes and detection rate** by week SA2.jpg

*Specimens from patients with Influenza-like illnesses at 223 sentinel sites in 9 provinces
**Detection rate calculated on specimens tested at NICD only, not shown before onset of season [TABLE="border: 1, cellpadding: 0, cellspacing: 0, width: 550, height: 18"]
[TR]
[TD="colspan: 7"]Table 2. Cumulative number of influenza type and subtype and total number of samples collected by province[/TD]
[/TR]
[TR]
[TD]Province[/TD]
[TD]B[/TD]
[TD]A not subtyped[/TD]
[TD]A(H1N1)pdm09[/TD]
[TD]A (H3N2)[/TD]
[TD]Total samples[/TD]
[/TR]
[TR]
[TD]Eastern Cape[/TD]
[TD]1[/TD]
[TD]0[/TD]
[TD]27[/TD]
[TD]18[/TD]
[TD]81[/TD]
[/TR]
[TR]
[TD]Free State[/TD]
[TD]0[/TD]
[TD]0[/TD]
[TD]13[/TD]
[TD]7[/TD]
[TD]43[/TD]
[/TR]
[TR]
[TD]Gauteng[/TD]
[TD]4[/TD]
[TD]1[/TD]
[TD]80[/TD]
[TD]83[/TD]
[TD]330[/TD]
[/TR]
[TR]
[TD]KwaZulu-Natal[/TD]
[TD]0[/TD]
[TD]0[/TD]
[TD]0[/TD]
[TD]0[/TD]
[TD]0[/TD]
[/TR]
[TR]
[TD]Limpopo[/TD]
[TD]0[/TD]
[TD]0[/TD]
[TD]22[/TD]
[TD]19[/TD]
[TD]68[/TD]
[/TR]
[TR]
[TD]Mpumalanga[/TD]
[TD]3[/TD]
[TD]0[/TD]
[TD]10[/TD]
[TD]12[/TD]
[TD]49[/TD]
[/TR]
[TR]
[TD]Northern Cape[/TD]
[TD]0[/TD]
[TD]0[/TD]
[TD]2[/TD]
[TD]3[/TD]
[TD]22[/TD]
[/TR]
[TR]
[TD]North West[/TD]
[TD]0[/TD]
[TD]0[/TD]
[TD]0[/TD]
[TD]1[/TD]
[TD]1[/TD]
[/TR]
[TR]
[TD]Western Cape[/TD]
[TD]11[/TD]
[TD]1[/TD]
[TD]92[/TD]
[TD]42[/TD]
[TD]238[/TD]
[/TR]
[TR]
[TD]Total:[/TD]
[TD]19[/TD]
[TD]1[/TD]
[TD]246[/TD]
[TD]185[/TD]
[TD]832[/TD]
[/TR]
[/TABLE]
[TABLE="border: 1, cellpadding: 0, cellspacing: 0, width: 520, height: 18"]
[TR]
[TD]Reporting period:[/TD]
[TD]01/01/2015[/TD]
[TD]to[/TD]
[TD]12/07/2015[/TD]
[TD] [/TD]
[TD]Results until end of epidemiologic week[/TD]
[TD]28 (2015)[/TD]
[/TR]
[/TABLE]

Figure 3. Number of private hospital outpatient consultations* with a discharge diagnosis of pneumonia and influenza (P&I) and viral isolates** SA3.jpg

* Hospital outpatient data from weekly reports of consultations to the Netcare hospital group. Discharge diagnosis is according to International Statistical Classification of Diseases and Related Health Problems coding/ICD by clinicians and does not represent laboratory confirmation of aetiology
** Influenza positive specimens from the Viral Watch surveillance programme [TABLE="align: center, border: 1, cellpadding: 0, cellspacing: 0, width: 550, height: 18"]
[TR]
[TD="colspan: 7"]Table 3. Cumulative number of identified influenza types and subtypes and total number of samples collected by hospital[/TD]
[/TR]
[TR]
[TD]Clinic[/TD]
[TD]A not subtyped [/TD]
[TD]A (H1N1) pdm09[/TD]
[TD]A (H3N2)[/TD]
[TD]B[/TD]
[TD]Total samples[/TD]
[/TR]
[TR]
[TD]Edendale (KZ)[/TD]
[TD]1[/TD]
[TD]11[/TD]
[TD]2[/TD]
[TD]3[/TD]
[TD]233[/TD]
[/TR]
[TR]
[TD]Helen Joseph-Rahima Moosa (GP)[/TD]
[TD]2[/TD]
[TD]24[/TD]
[TD]9[/TD]
[TD]0[/TD]
[TD]680[/TD]
[/TR]
[TR]
[TD]Klerksdorp-Tshepong (NW)[/TD]
[TD]0[/TD]
[TD]6[/TD]
[TD]18[/TD]
[TD]2[/TD]
[TD]403[/TD]
[/TR]
[TR]
[TD]Mapulaneng (MP)[/TD]
[TD] [/TD]
[TD]4[/TD]
[TD]3[/TD]
[TD]1[/TD]
[TD]98[/TD]
[/TR]
[TR]
[TD]Matiwane (MP)[/TD]
[TD]0[/TD]
[TD]0[/TD]
[TD]1[/TD]
[TD]0[/TD]
[TD]48[/TD]
[/TR]
[TR]
[TD]Red Cross (WC)[/TD]
[TD]0[/TD]
[TD]9[/TD]
[TD]1[/TD]
[TD]0[/TD]
[TD]201[/TD]
[/TR]
[TR]
[TD]Total:[/TD]
[TD]3[/TD]
[TD]54[/TD]
[TD]34[/TD]
[TD]6[/TD]
[TD]1663[/TD]
[/TR]
[TR]
[TD="colspan: 7"]*Gauteng (GP), KwaZulu Natal (KZ), North West (NW), Mpumalanga (MP)[/TD]
[/TR]
[/TABLE]
...
http://www.nicd.ac.za/?page=seasonal_influenza&id=72
 
Last edited:
Surveillance

Influenza surveillance report - South Africa
Report compiled 29 July 2015
http://www.nicd.ac.za/?page=seasonal_influenza&id=72
[TABLE="align: center, border: 0, cellpadding: 0, cellspacing: 0, width: 550, height: 18"]
[TR]
[TD]

[/TD]
[/TR]
[TR]
[TD] [h=2]Severe acute respiratory illness (SARI) surveillance[/h] [TABLE="border: 1, cellpadding: 0, cellspacing: 0, width: 520"]
[TR]
[TD]Reporting period:[/TD]
[TD]01/01/2015[/TD]
[TD]to[/TD]
[TD]19/07/2015[/TD]
[TD] [/TD]
[TD]Results until end of epidemiologic week[/TD]
[TD]29 (2015)[/TD]
[/TR]
[/TABLE]

Figure 1. Number of positive samples* by influenza types and subtypes and detection rate by week[/TD]
[/TR]
[/TABLE]


SA1.jpg
*Specimens from patients hospitalised with severe acute respiratory infections at 5 sentinel sites in 4 provinces
[TABLE="align: center, border: 1, cellpadding: 0, cellspacing: 0, width: 550, height: 18"]
[TR]
[TD="colspan: 7"]
Table 1. Cumulative number of identified influenza types and subtypes and total number of samples collected by hospital[/TD]
[/TR]
[TR]
[TD]Clinic[/TD]
[TD]A not typed [/TD]
[TD]A (H1N1) pdm09[/TD]
[TD]A (H3N2)[/TD]
[TD]B[/TD]
[TD]Total samples[/TD]
[/TR]
[TR]
[TD]Edendale Gateway Clinics (KZ)[/TD]
[TD]0[/TD]
[TD]40[/TD]
[TD]16[/TD]
[TD]36[/TD]
[TD]452[/TD]
[/TR]
[TR]
[TD]Joubert Clinic (NW)[/TD]
[TD]0[/TD]
[TD]1[/TD]
[TD]20[/TD]
[TD] [/TD]
[TD]226[/TD]
[/TR]
[TR]
[TD]Total:[/TD]
[TD]0[/TD]
[TD]41[/TD]
[TD]36[/TD]
[TD]36[/TD]
[TD]678[/TD]
[/TR]
[TR]
[TD="colspan: 7"]KwaZulu Natal (KZ), North West (NW)[/TD]
[/TR]
[/TABLE]

[h=2]Influenza-like illness (ILI) surveillance (Viral Watch)[/h] [TABLE="align: center, border: 1, cellpadding: 0, cellspacing: 0, width: 520, height: 18"]
[TR]
[TD]Reporting period:[/TD]
[TD]01/01/2015[/TD]
[TD]to[/TD]
[TD]19/07/2015[/TD]
[TD] [/TD]
[TD]Results until end of epidemiologic week 2009:[/TD]
[TD]29 (2015)[/TD]
[/TR]
[/TABLE]


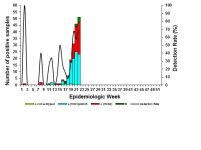
Figure 2. Number of positive samples* by influenza types and subtypes and detection rate** by week
SA2.jpg

*Specimens from patients with Influenza-like illnesses at 223 sentinel sites in 9 provinces
**Detection rate calculated on specimens tested at NICD only, not shown before onset of season
[TABLE="border: 1, cellpadding: 0, cellspacing: 0, width: 550, height: 18"]
[TR]
[TD="colspan: 7"]Table 2. Cumulative number of influenza type and subtype and total number of samples collected by province[/TD]
[/TR]
[TR]
[TD]Province[/TD]
[TD]B[/TD]
[TD]A not subtyped[/TD]
[TD]A(H1N1)pdm09[/TD]
[TD]A (H3N2)[/TD]
[TD]Total samples[/TD]
[/TR]
[TR]
[TD]Eastern Cape[/TD]
[TD]1[/TD]
[TD]0[/TD]
[TD]27[/TD]
[TD]18[/TD]
[TD]84[/TD]
[/TR]
[TR]
[TD]Free State[/TD]
[TD]0[/TD]
[TD]0[/TD]
[TD]13[/TD]
[TD]7[/TD]
[TD]44[/TD]
[/TR]
[TR]
[TD]Gauteng[/TD]
[TD]4[/TD]
[TD]1[/TD]
[TD]80[/TD]
[TD]84[/TD]
[TD]341[/TD]
[/TR]
[TR]
[TD]KwaZulu-Natal[/TD]
[TD]0[/TD]
[TD]0[/TD]
[TD]0[/TD]
[TD]0[/TD]
[TD]0[/TD]
[/TR]
[TR]
[TD]Limpopo[/TD]
[TD]0[/TD]
[TD]0[/TD]
[TD]22[/TD]
[TD]20[/TD]
[TD]72[/TD]
[/TR]
[TR]
[TD]Mpumalanga[/TD]
[TD]3[/TD]
[TD]0[/TD]
[TD]10[/TD]
[TD]12[/TD]
[TD]51[/TD]
[/TR]
[TR]
[TD]Northern Cape[/TD]
[TD]0[/TD]
[TD]0[/TD]
[TD]2[/TD]
[TD]3[/TD]
[TD]22[/TD]
[/TR]
[TR]
[TD]North West[/TD]
[TD]0[/TD]
[TD]0[/TD]
[TD]0[/TD]
[TD]1[/TD]
[TD]2[/TD]
[/TR]
[TR]
[TD]Western Cape[/TD]
[TD]12[/TD]
[TD]1[/TD]
[TD]92[/TD]
[TD]43[/TD]
[TD]242[/TD]
[/TR]
[TR]
[TD]Total:[/TD]
[TD]20[/TD]
[TD]1[/TD]
[TD]246[/TD]
[TD]188[/TD]
[TD]858[/TD]
[/TR]
[/TABLE]
[h=2][/h] [TABLE="border: 1, cellpadding: 0, cellspacing: 0, width: 520, height: 18"]
[TR]
[TD]Reporting period:[/TD]
[TD]01/01/2015[/TD]
[TD]to[/TD]
[TD]19/07/2015[/TD]
[TD] [/TD]
[TD]Results until end of epidemiologic week[/TD]
[TD]29 (2015)[/TD]
[/TR]
[/TABLE]

Figure 3. Number of private hospital outpatient consultations* with a discharge diagnosis of pneumonia and influenza (P&I) and viral isolates**
SA3.jpg

* Hospital outpatient data from weekly reports of consultations to the Netcare hospital group. Discharge diagnosis is according to International Statistical Classification of Diseases and Related Health Problems coding/ICD by clinicians and does not represent laboratory confirmation of aetiology
** Influenza positive specimens from the Viral Watch surveillance programme
[TABLE="align: center, border: 1, cellpadding: 0, cellspacing: 0, width: 550, height: 18"]
[TR]
[TD="colspan: 7"]
Table 3. Cumulative number of identified influenza types and subtypes and total number of samples collected by hospital[/TD]
[/TR]
[TR]
[TD]Clinic[/TD]
[TD]A not subtyped [/TD]
[TD]A (H1N1) pdm09[/TD]
[TD]A (H3N2)[/TD]
[TD]B[/TD]
[TD]Total samples[/TD]
[/TR]
[TR]
[TD]Edendale (KZ)[/TD]
[TD]1[/TD]
[TD]14[/TD]
[TD]3[/TD]
[TD]7[/TD]
[TD]317[/TD]
[/TR]
[TR]
[TD]Helen Joseph-Rahima Moosa (GP)[/TD]
[TD]0[/TD]
[TD]35[/TD]
[TD]15[/TD]
[TD]1[/TD]
[TD]832[/TD]
[/TR]
[TR]
[TD]Klerksdorp-Tshepong (NW)[/TD]
[TD]0[/TD]
[TD]6[/TD]
[TD]21[/TD]
[TD]2[/TD]
[TD]466[/TD]
[/TR]
[TR]
[TD]Mapulaneng (MP)[/TD]
[TD] [/TD]
[TD]7[/TD]
[TD]5[/TD]
[TD]1[/TD]
[TD]113[/TD]
[/TR]
[TR]
[TD]Matiwane (MP)[/TD]
[TD]0[/TD]
[TD]2[/TD]
[TD]4[/TD]
[TD]0[/TD]
[TD]61[/TD]
[/TR]
[TR]
[TD]Red Cross (WC)[/TD]
[TD]0[/TD]
[TD]12[/TD]
[TD]1[/TD]
[TD]0[/TD]
[TD]320[/TD]
[/TR]
[TR]
[TD]Total:[/TD]
[TD]1[/TD]
[TD]76[/TD]
[TD]49[/TD]
[TD]11[/TD]
[TD]2109[/TD]
[/TR]
[TR]
[TD="colspan: 7"]*Gauteng (GP), KwaZulu Natal (KZ), North West (NW), Mpumalanga (MP)
[/TD]
[/TR]
[/TABLE]

...
Intense flu season not to be sneezed at

August 9 2015 at 05:16pm
By Fatima Schroeder

INDEPENDENT NEWSPAPERS
The 2015 flu season has definitely been more intense than in previous years, says the National Institute for Communicable Diseases.
Cape Town - The 2015 flu season has definitely been more intense than in previous years, says the National Institute for Communicable Diseases (NICD), which noted more people seeking outpatient advice from their local doctors and increased hospital admissions this year.

Dr Cheryl Cohen, head of epidemiology at the NICD?s Centre for Respiratory Diseases and Meningitis, said it was difficult to monitor influenza, but that the severity of illnesses could be measured by the number of doctor/patient consultations and hospital admissions.

Often people who experienced flu-like symptoms did not bother visiting a doctor, but Cohen said the private general practitioner sector this year reported an increase in the number of patients presenting with these symptoms.

This, together with the increase in flu-related admissions at mainly public hospitals, indicated that the 2015 season, which started on May 10, was worse than previous years.
...
http://www.iol.co.za/news/south-afr...n-not-to-be-sneezed-at-1.1897529#.VcfqgyZVhBc
 
Back
Top