• FluTrackers.com Inc. does not provide medical advice. Information on this web site is collected from various internet resources, and the FluTrackers board of directors makes no warranty to the safety, efficacy, correctness or completeness of the information posted on this site by any author or poster. The information collated here is for instructional and/or discussion purposes only and is NOT intended to diagnose or treat any disease, illness, or other medical condition. Every individual reader or poster should seek advice from their personal physician/healthcare practitioner before considering or using any interventions that are discussed on this website. By continuing to access this website you agree to consult your personal physican before using any interventions posted on this website, and you agree to hold harmless FluTrackers.com Inc., the board of directors, the members, and all authors and posters for any effects from use of any medication, supplement, vitamin or other substance, device, intervention, etc. mentioned in posts on this website, or other internet venues referenced in posts on this website.
  • We are not asking for any donations. Do not donate to any entity who says they are raising funds for us.

South Africa: Influenza surveillance 2011 to Week 36

Ronan Kelly

Retired 2020
Influenza surveillance report-South Africa
Report Compiled on 04 April 2011

Reporting period: 01/01/2011 to 27/03/2011 Results until end of epidemiologic week 2011: 12

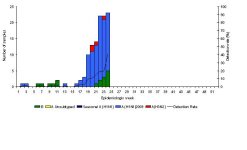
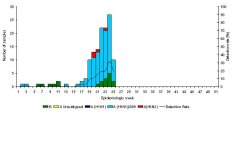
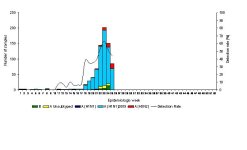
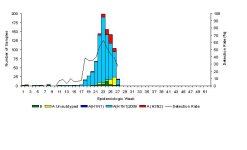
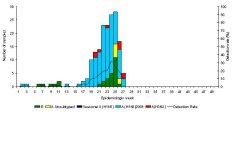
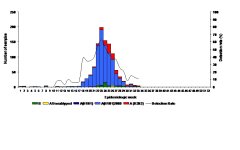
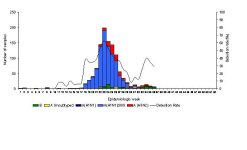
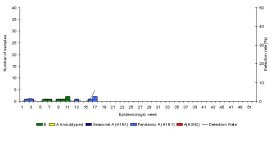
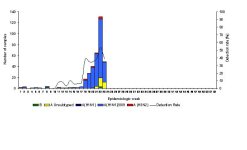
Figure 1. Number of positive samples* by influenza types and subtypes and detection rate by week
*Specimens from patients hospitalised with severe acute respiratory infections at 4 sentinel sites in 3 provinces
sari1.jpg

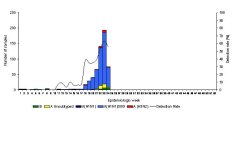
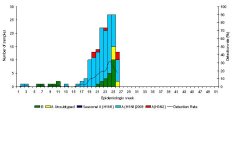
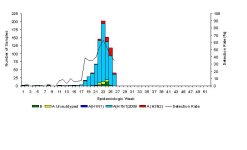
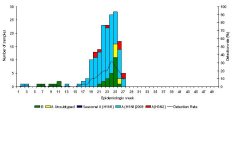
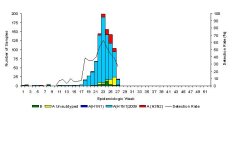
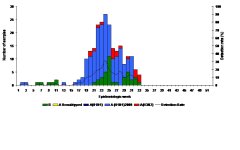
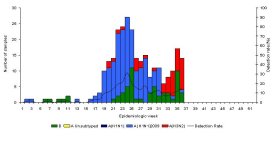
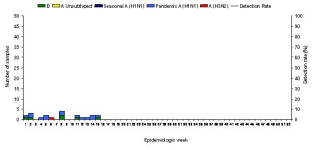
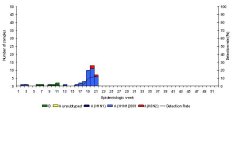
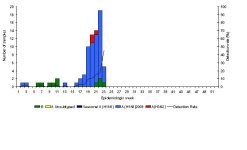
Figure 2. Number of positive samples* by influenza types and subtypes and detection rate** by week
*Specimens from patients with Influenza-like illnesses at 223 sentinel sites in 9 provinces
**Detection rate calculated on specimens tested at NICD only, not shown before onset of season
sari2.jpg

...

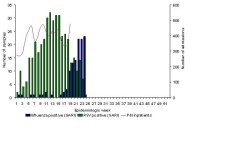
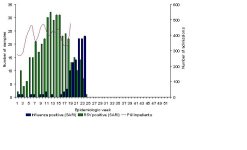
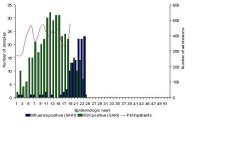
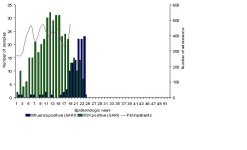
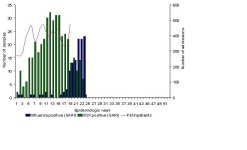
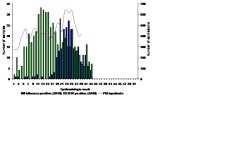
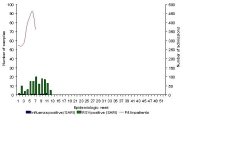
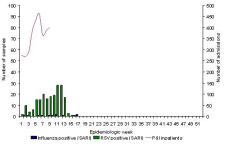
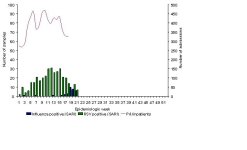
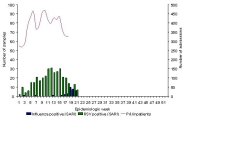
Figure 4. Number of private hospital admissions* with a discharge diagnosis of pneumonia and influenza (P&I) and viral isolates**
*Hospitalisation admission data from weekly reports of consultations to the Netcare hospital group. Discharge diagnosis is according to International Statistical Classification of diseases and Related Health Problems /ICD by clinicians and does not represent laboratory confirmation of aetiology
** Influenza positive specimens from the SARI surveillance programme
sari4.jpg


...

http://www.nicd.ac.za/?page=seasonal_influenza&id=72
 
Re: South Africa: Influenza surveillance 2011 Week 12

Re: South Africa: Influenza surveillance 2011 Week 12

Influenza surveillance report-South Africa
Report Compiled on 05 May 2011

Reporting period: 01/01/2011 to 29/04/2011 Results until end of epidemiologic week 2011: 17

Figure 1. Number of positive samples* by influenza types and subtypes and detection rate by week
*Specimens from patients hospitalised with severe acute respiratory infections at 4 sentinel sites in 3 provinces

Fig1.jpg

Table 1. Cumulative number of identified influenza types and subtypes and total number of samples collected by hospital
Hospital -- B -- A unsubtyped -- Seasonal A (H1N1) -- Pandemic A (H1N1) -- A (H3N2) -- Total samples
Chris Hani Baragwanath (GP) -- 1-- 0-- 0 --5 -- 879
Edendale (KZ) -- 0 --0-- 0 --1 -- 303
Klerksdorp-Tshepong (NW) -- 4 --0 --0 --0 -- 240
Mapulaneng (MP)-- 1 --0 --0 --0 -- 78
Matikwane (MP) -- 0-- 0-- 0 --0 -- 111
Total: -- 6-- 0 -- 0 -- 26?-- 1611
*Gauteng (GP), KwaZulu Natal (KZ), North West (NW), Mpumalanga (MP)

Figure 2. Number of positive samples* by influenza types and subtypes and detection rate** by week
*Specimens from patients with Influenza-like illnesses at 223 sentinel sites in 9 provinces
**Detection rate calculated on specimens tested at NICD only, not shown before onset of season

Fig 2.PNG

...

Figure 4. Number of private hospital admissions* with a discharge diagnosis of pneumonia and influenza (P&I) and viral isolates**
*Hospitalisation admission data from weekly reports of consultations to the Netcare hospital group. Discharge diagnosis is according to International Statistical Classification of diseases and Related Health Problems /ICD by clinicians and does not represent laboratory confirmation of aetiology
** Influenza positive specimens from the SARI surveillance programme

Fig 3.PNG

...

http://www.nicd.ac.za/?page=seasonal_influenza&id=72
 
Re: South Africa: Influenza surveillance 2011 to Week 17

Re: South Africa: Influenza surveillance 2011 to Week 17

Influenza surveillance report-South Africa
Report Compiled on 02 June 2011
Reporting period: 01/01/2011 to 27/05/2011 Results until end of epidemiologic week 2011: 21

Figure 1. Number of positive samples* by influenza types and subtypes and detection rate by week
*Specimens from patients hospitalised with severe acute respiratory infections at 4 sentinel sites in 3 provinces

figure1sari.jpg

Table 1. Cumulative number of identified influenza types and subtypes and total number of samples collected by hospital
Hospital -- B -- A unsubtyped -- Seasonal A (H1N1) -- Pandemic A (H1N1) -- A (H3N2) -- Total samples
Chris Hani Baragwanath (GP) -- 1 --0 --0 --29 -- 1125
Edendale (KZ) -- 0-- 0-- 0 --1 -- 351
Klerksdorp-Tshepong (NW) -- 4 --0 --0-- 4 -- 313
Mapulaneng (MP)-- 1 --0-- 0-- 1 -- 91
Matikwane (MP) -- 0-- 0-- 0-- 1 -- 142
Total: -- 6 --0 -- 0 -- 36 -- 2022
*Gauteng (GP), KwaZulu Natal (KZ), North West (NW), Mpumalanga (MP)


Figure 2. Number of positive samples* by influenza types and subtypes and detection rate** by week
*Specimens from patients with Influenza-like illnesses at 223 sentinel sites in 9 provinces
**Detection rate calculated on specimens tested at NICD only, not shown before onset of season

figure2sari.jpg

...

Figure 4. Number of private hospital admissions* with a discharge diagnosis of pneumonia and influenza (P&I) and viral isolates**
*Hospitalisation admission data from weekly reports of consultations to the Netcare hospital group. Discharge diagnosis is according to International Statistical Classification of diseases and Related Health Problems /ICD by clinicians and does not represent laboratory confirmation of aetiology
** Influenza positive specimens from the SARI surveillance programme

figure4sari.jpg

http://www.nicd.ac.za/?page=seasonal_influenza&id=72
 
Re: South Africa: Influenza surveillance 2011 to Week 21

Re: South Africa: Influenza surveillance 2011 to Week 21

Influenza surveillance report-South Africa
Report Compiled on 03 June 2011
Reporting period: 01/01/2011 to 03/06/2011 Results until end of epidemiologic week 2011: 22

Figure 1. Number of positive samples* by influenza types and subtypes and detection rate by week
*Specimens from patients hospitalised with severe acute respiratory infections at 4 sentinel sites in 3 provinces

figure1.jpg

Table 1. Cumulative number of identified influenza types and subtypes and total number of samples collected by hospital
Hospital -- B -- A unsubtyped -- Seasonal A (H1N1) -- Pandemic A (H1N1) -- A (H3N2) -- Total samples
Chris Hani Baragwanath (GP) -- 1 --0 --0 --29 -- 1125
Edendale (KZ) -- 0-- 0-- 0 --1 -- 351
Klerksdorp-Tshepong (NW) -- 4 --0 --0-- 4 -- 313
Mapulaneng (MP)-- 1 --0-- 0-- 1 -- 91
Matikwane (MP) -- 0-- 0-- 0-- 1 -- 142
Total: -- 6 --0 -- 0 -- 36 -- 2022
*Gauteng (GP), KwaZulu Natal (KZ), North West (NW), Mpumalanga (MP)


Figure 2. Number of positive samples* by influenza types and subtypes and detection rate** by week
*Specimens from patients with Influenza-like illnesses at 223 sentinel sites in 9 provinces
**Detection rate calculated on specimens tested at NICD only, not shown before onset of season

figure2.jpg


...

Figure 4. Number of private hospital admissions* with a discharge diagnosis of pneumonia and influenza (P&I) and viral isolates**
*Hospitalisation admission data from weekly reports of consultations to the Netcare hospital group. Discharge diagnosis is according to International Statistical Classification of diseases and Related Health Problems /ICD by clinicians and does not represent laboratory confirmation of aetiology
** Influenza positive specimens from the SARI surveillance programme

figure4.jpg

http://www.nicd.ac.za/?page=seasonal_influenza&id=72
 
Re: South Africa: Influenza surveillance 2011 to Week 22

Re: South Africa: Influenza surveillance 2011 to Week 22

Influenza surveillance report-South Africa
Report Compiled on 17 June 2011
Reporting period: 01/01/2011 to 10/06/2011 Results until end of epidemiologic week 2011: 23

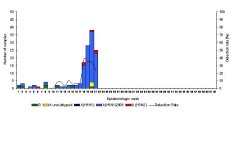
Figure 1. Number of positive samples* by influenza types and subtypes and detection rate by week
*Specimens from patients hospitalised with severe acute respiratory infections at 4 sentinel sites in 3 provinces

figure1.jpg

Table 1. Cumulative number of identified influenza types and subtypes and total number of samples collected by hospital
Hospital -- B -- A unsubtyped -- Seasonal A (H1N1) -- Pandemic A (H1N1) -- A (H3N2) -- Total samples
Chris Hani Baragwanath (GP) -- 2 --0 --0 --46 -- 0--1210
Edendale (KZ) -- 0-- 0-- 0 --2 -- 0 -- 356
Klerksdorp-Tshepong (NW) -- 5 --0 --0-- 10--0 -- 353
Mapulaneng (MP)-- 1 --0-- 0-- 3 --0-- 97
Matikwane (MP) -- 2-- 0-- 0-- 2 -- 0--160
Total: -- 10 --0 -- 0 -- 63 --0-- 2176
*Gauteng (GP), KwaZulu Natal (KZ), North West (NW), Mpumalanga (MP)


Figure 2. Number of positive samples* by influenza types and subtypes and detection rate** by week
*Specimens from patients with Influenza-like illnesses at 223 sentinel sites in 9 provinces
**Detection rate calculated on specimens tested at NICD only, not shown before onset of season

figure2.jpg

...

Figure 4. Number of private hospital admissions* with a discharge diagnosis of pneumonia and influenza (P&I) and viral isolates**
*Hospitalisation admission data from weekly reports of consultations to the Netcare hospital group. Discharge diagnosis is according to International Statistical Classification of diseases and Related Health Problems /ICD by clinicians and does not represent laboratory confirmation of aetiology
** Influenza positive specimens from the SARI surveillance programme

figure4.jpg

http://www.nicd.ac.za/?page=seasonal_influenza&id=72
 
Re: South Africa: Influenza surveillance 2011 to Week 23

Re: South Africa: Influenza surveillance 2011 to Week 23

Influenza surveillance report-South Africa
Report Compiled on 23 June 2011

...

Severe acute respiratory illness (SARI) surveillance
Reporting period: 01/01/2011 to 17/06/2011 Results until end of epidemiologic week 2011: 24

Figure 1. Number of positive samples* by influenza types and subtypes and detection rate by week
*Specimens from patients hospitalised with severe acute respiratory infections at 4 sentinel sites in 3 provinces

figure1.jpg


Table 1. Cumulative number of identified influenza types and subtypes and total number of samples collected by hospital
Hospital -- B -- A unsubtyped -- Seasonal A (H1N1) -- Pandemic A (H1N1) -- A (H3N2) -- Total samples
Chris Hani Baragwanath (GP) -- 2 --0 --0 --46 -- 0--1285
Edendale (KZ) -- 0-- 0-- 0 --2 -- 0 -- 383
Klerksdorp-Tshepong (NW) -- 5 --0 --0-- 10--0 -- 401
Mapulaneng (MP)-- 1 --0-- 0-- 3 --0-- 103
Matikwane (MP) -- 2-- 0-- 0-- 2 -- 0--167
Total: -- 10 --0 -- 0 -- 63 --0-- 2339
*Gauteng (GP), KwaZulu Natal (KZ), North West (NW), Mpumalanga (MP)


Influenza-like illness (ILI) surveillance (Viral Watch)

Figure 2. Number of positive samples* by influenza types and subtypes and detection rate** by week
*Specimens from patients with Influenza-like illnesses at 223 sentinel sites in 9 provinces
**Detection rate calculated on specimens tested at NICD only, not shown before onset of season

figure2.jpg

Table 2. Cumulative number of influenza type and subtype and total number of samples collected by province
Province -- B-- A unsubtyped --Seasonal A (H1N1) -- Pandemic A (H1N1) -- A (H3N2) -- Total samples
Eastern Cape -- 2 --0 --0 --29 --11 --87
Free State -- 1 --0 --0 --0 --21
Gauteng --12-- 0-- 0 --317-- 3 --839
KwaZulu-Natal -- 3 --0 --3 --1 --13
Limpopo -- 4 --0 --0 --93 --3 --246
Mpumalanga -- 0 --0 --25 --0 --67
Northern Cape --1-- 0 --0 --23-- 1 --68
North West --1 --0 --0 --6 --1 --16
Western Cape --2 --25 --0 --18 --1 --204
Total: --22 --29 --0 -- 514 --21 --1561

...

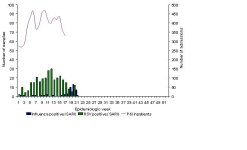
Figure 4. Number of private hospital admissions* with a discharge diagnosis of pneumonia and influenza (P&I) and viral isolates**
*Hospitalisation admission data from weekly reports of consultations to the Netcare hospital group. Discharge diagnosis is according to International Statistical Classification of diseases and Related Health Problems /ICD by clinicians and does not represent laboratory confirmation of aetiology
** Influenza positive specimens from the SARI surveillance programme

figure4.jpg

http://www.nicd.ac.za/?page=seasonal_influenza&id=72
 
Re: South Africa: Influenza surveillance 2011 to Week 24

Re: South Africa: Influenza surveillance 2011 to Week 24

Influenza surveillance report-South Africa
Report Compiled on 30 June 2011

Severe acute respiratory illness (SARI) surveillance

Reporting period: 01/01/2011 to 24/06/2011 Results until end of epidemiologic week 2011: 25

Figure 1. Number of positive samples* by influenza types and subtypes and detection rate by week

figure1.jpg

Table 1. Cumulative number of identified influenza types and subtypes and total number of samples collected by hospital
Hospital -- B -- A unsubtyped -- Seasonal A (H1N1) -- Pandemic A (H1N1) -- A (H3N2) -- Total samples
Chris Hani Baragwanath (GP) -- 6 --0 --0 --65 -- 0--1311
Edendale (KZ) -- 2-- 0-- 0 --9 -- 0 -- 395
Klerksdorp-Tshepong (NW) -- 7 --0 --0-- 25--0 -- 432
Mapulaneng (MP)-- 1 --0-- 0-- 4 --0-- 106
Matikwane (MP) -- 3-- 0-- 0-- 7 -- 0--178
Total: -- 19 --0 -- 0 -- 110 --0-- 2422
*Gauteng (GP), KwaZulu Natal (KZ), North West (NW), Mpumalanga (MP)

Influenza-like illness (ILI) surveillance (Viral Watch)

Figure 2. Number of positive samples* by influenza types and subtypes and detection rate** by week
*Specimens from patients with Influenza-like illnesses at 223 sentinel sites in 9 provinces
**Detection rate calculated on specimens tested at NICD only, not shown before onset of season

figure2.jpg

Table 2. Cumulative number of influenza type and subtype and total number of samples collected by province
Province -- B-- A unsubtyped --Seasonal A (H1N1) -- Pandemic A (H1N1) -- A (H3N2) -- Total samples
Eastern Cape -- 2 --0 --0 --38 --20 --111
Free State -- 1 --4 --0 --1 --41
Gauteng --15-- 0-- 0 --390-- 12 --1006
KwaZulu-Natal --1-- 13 --0 --12 --10 --75
Limpopo -- 6 --0 --0 --114 --2 --297
Mpumalanga -- 0 --0 --29 --0 --73
Northern Cape --2-- 0 --0 --29-- 2 --85
North West --1 --0 --0 --8 --1 --19
Western Cape --2 --5 --0 --41 --2 --205
Total: --30 --22 --0 -- 662 --49 --1912

...

Figure 4. Number of private hospital admissions* with a discharge diagnosis of pneumonia and influenza (P&I) and viral isolates**
*Hospitalisation admission data from weekly reports of consultations to the Netcare hospital group. Discharge diagnosis is according to International Statistical Classification of diseases and Related Health Problems /ICD by clinicians and does not represent laboratory confirmation of aetiology
** Influenza positive specimens from the SARI surveillance programme

figure4.jpg

http://www.nicd.ac.za/?page=seasonal_influenza&id=72
 
Re: South Africa: Influenza surveillance 2011 to Week 25

Re: South Africa: Influenza surveillance 2011 to Week 25

Influenza surveillance report-South Africa (edited)
Report Compiled on 7 July 2011

Severe acute respiratory illness (SARI) surveillance

Reporting period: 01/01/2011 to 01/07/2011 Results until end of epidemiologic week 2011: 26


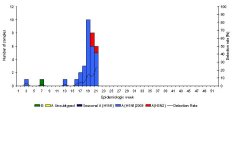
Figure 1. Number of positive samples* by influenza types and subtypes and detection rate by week
*Specimens from patients hospitalised with severe acute respiratory infections at 4 sentinel sites in 3 provinces

figure1.jpg

Table 1. Cumulative number of identified influenza types and subtypes and total number of samples collected by hospital
Hospital -- B -- A unsubtyped -- Seasonal A (H1N1) -- Pandemic A (H1N1) -- A (H3N2) -- Total samples
Chris Hani Baragwanath (GP) -- 12 --3 --0 --71 -- 3--1374
Edendale (KZ) -- 3-- 1-- 0 --10 -- 3 -- 419
Klerksdorp-Tshepong (NW) -- 7 --2 --0-- 26--1 -- 456
Mapulaneng (MP)-- 1 --1-- 0-- 5 --0-- 116
Matikwane (MP) -- 4-- 0-- 0-- 10 -- 0--189
Total: -- 27 --7 -- 0 -- 122 --7-- 2554
*Gauteng (GP), KwaZulu Natal (KZ), North West (NW), Mpumalanga (MP)

(Edit: Most recent week - 132 samples of which 25.8% positive. Of those - 35.3% A/H1N1; 23.5% B; 20.6% A/H3N2; 20.6% A Unsubtyped)

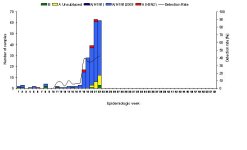
Figure 2. Number of positive samples* by influenza types and subtypes and detection rate** by week
*Specimens from patients with Influenza-like illnesses at 223 sentinel sites in 9 provinces
**Detection rate calculated on specimens tested at NICD only, not shown before onset of season
figure2.jpg

Table 2. Cumulative number of influenza type and subtype and total number of samples collected by province
Province -- B-- A unsubtyped --Seasonal A (H1N1) -- Pandemic A (H1N1) -- A (H3N2) -- Total samples
Eastern Cape -- 2 --0 --0 --39 --27 --121
Free State -- 1 --4 --0 --1 --41
Gauteng --17-- 0-- 0 --430-- 15 --1093
KwaZulu-Natal --1-- 12 --0 --12 --11 --75
Limpopo -- 6 --0 --0 --119 --2 --314
Mpumalanga -- 0 --0 --33 --0 --77
Northern Cape --2-- 0 --0 --37-- 2 --101
North West --1 --0 --0 --8 --1 --21
Western Cape --2 --5 --0 --42 --2 --213
Total: --32 --21 --0 -- 662?(721?) --62 --2056

(Edit: Most recent week - 144 samples of which 50.7% positive. Of those - 80.8% A/H1N1; 2.7% B; 17.8% A/H3N2; 0% A unsubtyped)

...

Figure 4. Number of private hospital admissions* with a discharge diagnosis of pneumonia and influenza (P&I) and viral isolates**
*Hospitalisation admission data from weekly reports of consultations to the Netcare hospital group. Discharge diagnosis is according to International Statistical Classification of diseases and Related Health Problems /ICD by clinicians and does not represent laboratory confirmation of aetiology
** Influenza positive specimens from the SARI surveillance programme

figure4.jpg

http://www.nicd.ac.za/?page=seasonal_influenza&id=72
 
Re: South Africa: Influenza surveillance 2011 to Week 26

Re: South Africa: Influenza surveillance 2011 to Week 26

Influenza surveillance report-South Africa
Report Compiled on 14 July 2011

Severe acute respiratory illness (SARI) surveillance

Reporting period: 01/01/2011 to 08/07/2011 Results until end of epidemiologic week 2011: 27


Figure 1. Number of positive samples* by influenza types and subtypes and detection rate by week
*Specimens from patients hospitalised with severe acute respiratory infections at 4 sentinel sites in 3 provinces

figure1.jpg

Table 1. Cumulative number of identified influenza types and subtypes and total number of samples collected by hospital
Hospital -- B -- A unsubtyped -- Seasonal A (H1N1) -- Pandemic A (H1N1) -- A (H3N2) -- Total samples
Chris Hani Baragwanath (GP) -- 14 --3 --0 --74 -- 3--1416
Edendale (KZ) -- 3-- 1-- 0 --12 -- 4 -- 431
Klerksdorp-Tshepong (NW) -- 7 --2 --0-- 27--2 -- 474
Mapulaneng (MP)-- 1 --1-- 0-- 7 --0-- 121
Matikwane (MP) -- 4-- 0-- 0-- 10 -- 0--196
Total: -- 29 --7 -- 0 -- 130 --9-- 2638
*Gauteng (GP), KwaZulu Natal (KZ), North West (NW), Mpumalanga (MP)

(Edit: Most recent week - 84 samples of which 14.3% positive. Of those - 66.7% A/H1N1; 16.7% B; 16.7% A/H3N2; 0% A Unsubtyped)

Figure 2. Number of positive samples* by influenza types and subtypes and detection rate** by week
*Specimens from patients with Influenza-like illnesses at 223 sentinel sites in 9 provinces
**Detection rate calculated on specimens tested at NICD only, not shown before onset of season

figure2.jpg

Table 2. Cumulative number of influenza type and subtype and total number of samples collected by province
Province -- B-- A unsubtyped --Seasonal A (H1N1) -- Pandemic A (H1N1) -- A (H3N2) -- Total samples
Eastern Cape -- 2 --0 --0 --44 --30 --138
Free State -- 1 --8 --0 --1 --0 --48
Gauteng --19-- 0-- 0 --454-- 16 --1179
KwaZulu-Natal --1-- 30 --0 --12 --11 --112
Limpopo -- 6 --0 --0 --128 --2 --338
Mpumalanga -- 0 --0 --34 --0 --78
Northern Cape --2-- 0 --0 --46-- 3 --117
North West --1 --0 --0 --9 --1 --23
Western Cape --4 --14 --0 --56 --8 --293
Total: --36 --52 --0 -- 662?(784?) --71 --2326

(Edit: Most recent week - 270 samples of which 39.6% positive. Of those - 58.8% A/H1N1; 3.7% B; 8.4% A/H3N2; 29.0% A unsubtyped)

...

Figure 4. Number of private hospital admissions* with a discharge diagnosis of pneumonia and influenza (P&I) and viral isolates**
*Hospitalisation admission data from weekly reports of consultations to the Netcare hospital group. Discharge diagnosis is according to International Statistical Classification of diseases and Related Health Problems /ICD by clinicians and does not represent laboratory confirmation of aetiology
** Influenza positive specimens from the SARI surveillance programme
figure4.jpg

http://www.nicd.ac.za/?page=seasonal_influenza&id=72
 
Re: South Africa: Influenza surveillance 2011 to Week 27

Re: South Africa: Influenza surveillance 2011 to Week 27

Influenza surveillance report-South Africa
Report Compiled on 28 July 2011

Comment:
Data from these programmes show that, even though the influenza season is ongoing, the detection rate for influenza virus is decreasing. The highest detection rate observed during the season was 31% in week 24 (week starting 13 June 2011), and 63% in week 23 (week starting 06 June 2011) for SARI and ILI cases respectively. The 2011 influenza season has been thus far dominated by the A (H1N1)2009 influenza subtype.

Please note that these data are from sentinel sites and reflect trends in the areas with participating sites. Numbers reported reflect numbers of patients enrolled into the surveillance programmes and do not reflect total numbers of patients in the community

...

Severe acute respiratory illness (SARI) surveillance

Reporting period: 01/01/2011 to 22/07/2011 Results until end of epidemiologic week 2011: 29

Figure 1. Number of positive samples* by influenza types and subtypes and detection rate by week
*Specimens from patients hospitalised with severe acute respiratory infections at 4 sentinel sites in 3 provinces
figure1.jpg

Table 1. Cumulative number of identified influenza types and subtypes and total number of samples collected by hospital
Hospital -- B -- A unsubtyped -- Seasonal A (H1N1) -- Pandemic A (H1N1) -- A (H3N2) -- Total samples
Chris Hani Baragwanath (GP) -- 14 --0 --0 --83 -- 3--1489
Edendale (KZ) -- 5-- 0-- 0 --16 -- 5 -- 460
Klerksdorp-Tshepong (NW) -- 7 --0 --0-- 34--2 -- 501
Mapulaneng (MP)-- 1 --0-- 0-- 9 --0-- 131
Matikwane (MP) -- 4-- 0-- 0-- 10 -- 0--202
Total: -- 31 --0 -- 0 -- 152 --10-- 2783
*Gauteng (GP), KwaZulu Natal (KZ), North West (NW), Mpumalanga (MP)

Figure 2. Number of positive samples* by influenza types and subtypes and detection rate** by week
*Specimens from patients with Influenza-like illnesses at 223 sentinel sites in 9 provinces
**Detection rate calculated on specimens tested at NICD only, not shown before onset of season
figure2.jpg


Table 2. Cumulative number of influenza type and subtype and total number of samples collected by province
Province -- B-- A unsubtyped --Seasonal A (H1N1) -- Pandemic A (H1N1) -- A (H3N2) -- Total samples
Eastern Cape -- 2 --0 --0 --46 --34 --157
Free State -- 1 --0 --0 --6 --4 --51
Gauteng --23-- 0-- 0 --485-- 18 --1308
KwaZulu-Natal --1-- 7 --0 --27 --25 --115
Limpopo -- 6 --0 --0 --129 --2 --354
Mpumalanga -- 0 --0 --34 --0 --80
Northern Cape --3-- 0 --0 --51-- 3 --130
North West --2 --0 --0 --9 --1 --25
Western Cape --4 --2 --0 --68 --13 --314
Total: --42 --9 --0 -- 855 --100 --2534

...

Figure 4. Number of private hospital admissions* with a discharge diagnosis of pneumonia and influenza (P&I) and viral isolates**
*Hospitalisation admission data from weekly reports of consultations to the Netcare hospital group. Discharge diagnosis is according to International Statistical Classification of diseases and Related Health Problems /ICD by clinicians and does not represent laboratory confirmation of aetiology
** Influenza positive specimens from the SARI surveillance programme

figure4.jpg

http://www.nicd.ac.za/?page=seasonal_influenza&id=72
 
Re: South Africa: Influenza surveillance 2011 to Week 29

Re: South Africa: Influenza surveillance 2011 to Week 29

Influenza surveillance report-South Africa
Report Compiled on 26 August 2011

...
Comment:
Data from these programmes show that, even though the influenza season is ongoing, the detection rate for influenza virus is decreasing. The highest detection rate observed during the season was 31% in week 24 (week starting 13 June 2011), and 63% in week 23 (week starting 06 June 2011) for SARI and ILI cases respectively. The 2011 influenza season has been thus far dominated by the A (H1N1)2009 influenza subtype.

Please note that these data are from sentinel sites and reflect trends in the areas with participating sites. Numbers reported reflect numbers of patients enrolled into the surveillance programmes and do not reflect total numbers of patients in the community
...

Severe acute respiratory illness (SARI) surveillance

Reporting period: 01/01/2011 to 19/08/2011 Results until end of epidemiologic week 2011: 33

Figure 1. Number of positive samples* by influenza types and subtypes and detection rate by week.
*Specimens from patients hospitalised with severe acute respiratory infections at 4 sentinel sites in 3 provinces
figure1.jpg

Table 1. Cumulative number of identified influenza types and subtypes and total number of samples collected by hospital
Hospital -- B -- A unsubtyped -- Seasonal A (H1N1) -- Pandemic A (H1N1) -- A (H3N2) -- Total samples
Chris Hani Baragwanath (GP) -- 21 --0 --0 --90 -- 4--1652
Edendale (KZ) -- 8-- 0-- 0 --18 -- 7 -- 546
Klerksdorp-Tshepong (NW) -- 10 --0 --0-- 42--5 -- 604
Mapulaneng (MP)-- 1 --0-- 0-- 8 --3-- 152
Matikwane (MP) -- 4-- 0-- 0-- 10 -- 0--213
Total: -- 44 --0 -- 0 -- 168 --19-- 3167
*Gauteng (GP), KwaZulu Natal (KZ), North West (NW), Mpumalanga (MP)

Figure 2. Number of positive samples* by influenza types and subtypes and detection rate** by week
*Specimens from patients with Influenza-like illnesses at 223 sentinel sites in 9 provinces
**Detection rate calculated on specimens tested at NICD only, not shown before onset of season
figure2.jpg

Table 2. Cumulative number of influenza type and subtype and total number of samples collected by province
Province -- B-- A unsubtyped --Seasonal A (H1N1) -- Pandemic A (H1N1) -- A (H3N2) -- Total samples
Eastern Cape -- 3 --0 --0 --46 --34 --174
Free State -- 1 --0 --0 --7 --5 --57
Gauteng --30-- 0-- 0 --494-- 25 --1440
KwaZulu-Natal --1-- 10 --0 --39 --34 --149
Limpopo -- 6 --0 --0 --129 --3 --358
Mpumalanga -- 0 --0 --35 --0 --82
Northern Cape --3-- 0 --0 --52-- 3 --159
North West --2 --0 --0 --9 --1 --27
Western Cape --4 --1 --0 --73 --17 --371
Total: --50 --10 --0 -- 884 --122 --2827

...

Figure 4. Number of private hospital admissions* with a discharge diagnosis of pneumonia and influenza (P&I) and viral isolates**
*Hospitalisation admission data from weekly reports of consultations to the Netcare hospital group. Discharge diagnosis is according to International Statistical Classification of diseases and Related Health Problems /ICD by clinicians and does not represent laboratory confirmation of aetiology
** Influenza positive specimens from the SARI surveillance programme
figure4.jpg

http://www.nicd.ac.za/?page=seasonal_influenza&id=72
 
Last edited:
Re: South Africa: Influenza surveillance 2011 to Week 33

Re: South Africa: Influenza surveillance 2011 to Week 33

Influenza surveillance report-South Africa
Report Compiled on 16 September 2011

...

Severe acute respiratory illness (SARI) surveillance

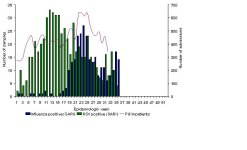
Reporting period: 01/01/2011 to 09/09/2011 Results until end of epidemiologic week 2011: 36

Figure 1. Number of positive samples* by influenza types and subtypes and detection rate by week.
*Specimens from patients hospitalised with severe acute respiratory infections at 4 sentinel sites in 3 provinces
figure1.jpg

Table 1. Cumulative number of identified influenza types and subtypes and total number of samples collected by hospital
Hospital -- B -- A unsubtyped -- Seasonal A (H1N1) -- Pandemic A (H1N1) -- A (H3N2) -- Total samples
Chris Hani Baragwanath (GP) -- 32 --0 --0 --92 -- 20--1851
Edendale (KZ) -- 9-- 0-- 0 --18 -- 7 -- 609
Klerksdorp-Tshepong (NW) -- 13 --0 --0-- 42--12 -- 674
Mapulaneng (MP)-- 1 --0-- 0-- 8 --5-- 175
Matikwane (MP) -- 5-- 0-- 0-- 10 -- 2--229
Total: -- 60 --0 -- 0 -- 170 --46-- 3538
*Gauteng (GP), KwaZulu Natal (KZ), North West (NW), Mpumalanga (MP)

Figure 2. Number of positive samples* by influenza types and subtypes and detection rate** by week
*Specimens from patients with Influenza-like illnesses at 223 sentinel sites in 9 provinces
**Detection rate calculated on specimens tested at NICD only, not shown before onset of season
figure2.jpg

Table 2. Cumulative number of influenza type and subtype and total number of samples collected by province
Province -- B-- A unsubtyped --Seasonal A (H1N1) -- Pandemic A (H1N1) -- A (H3N2) -- Total samples
Eastern Cape -- 3 --0 --0 --46 --35 --188
Free State -- 1 --0 --0 --7 --5 --60
Gauteng --43-- 0-- 0 --495-- 30 --1491
KwaZulu-Natal --1-- 15 --0 --39 --34 --154
Limpopo -- 9 --0 --0 --129 --5 --373
Mpumalanga -- 1 --0 --35 --0 --85
Northern Cape --3-- 0 --0 --52-- 8 --170
North West --2 --0 --0 --9 --1 --27
Western Cape --7 --2 --0 --73 --17 --374
Total: --70 --17 --0 -- 885 --135 --2922

...

Figure 4. Number of private hospital admissions* with a discharge diagnosis of pneumonia and influenza (P&I) and viral isolates**
*Hospitalisation admission data from weekly reports of consultations to the Netcare hospital group. Discharge diagnosis is according to International Statistical Classification of diseases and Related Health Problems /ICD by clinicians and does not represent laboratory confirmation of aetiology
** Influenza positive specimens from the SARI surveillance programme
figure4.jpg

...

http://www.nicd.ac.za/?page=seasonal_influenza&id=72
 
Back
Top